voter identification laws and the suppression of minority...
TRANSCRIPT
0
Voter Identification Laws and the Suppression of Minority Votes1
Zoltan Hajnal, University of California, San Diego
Nazita Lajevardi, University of California San Diego
Lindsay Nielson, Bucknell University
Abstract
The proliferation of increasingly strict voter identification laws around the country has raised
concerns about voter suppression. Although there are many reasons to suspect that these laws could
harm groups like racial minorities and the poor, existing studies have generally failed to
demonstrate a link between voter ID laws and voter turnout among these groups. We question these
null effects. We argue that because most of the studies occurred before states enacted strict
identification requirements, they uncover few effects. By using validated voting data from the
Cooperative Congressional Election Study for several recent elections, we are able to offer a more
definitive test. The analysis shows that strict identification laws have a differentially negative
impact on the turnout of Hispanics, Blacks, Asian Americans, and multi-racial Americans in
primaries and general elections. We also find that voter ID laws skew democracy toward those on
the political right.
1 The authors would like to thank the Russel Sage Foundation for their generous support of this project.

1
Voting is the bedrock of democracy. Through the vote, citizens choose leaders, sway policy, and
generally influence democracy. By contrast, citizens who don’t vote can be ignored. It is, thus, not
surprising to see that the laws that shape turnout and determine who can and who cannot vote
generate enormous attention and controversy. The latest front in this debate concerns voter
identification laws.
Voter identification laws have been a topic of discussion since 1950 when South Carolina
became the first state to request some form of identification at the polls (NCSL 2015). Since then,
more and more states have instituted some form of voter ID law. But it is only within the last
decade that the strictest forms of voter ID have proliferated and voter ID laws have received
widespread attention.
Today these voter ID laws take several distinct forms. Strict voter ID laws require
identification in order to cast a regular ballot. Other more lenient laws, request but do not require
voters to show some kind of identification document at the polls. These laws can also be
distinguished by whether or not they allow or consider non-photo identification.
All told, 34 states currently enforce some form of a voter identification law (NCSL 2015).
Of these, 11 are strict ID laws state that require a person to show identification in order to vote.1
More states appear to be waiting on the wings. New Mexico, Nevada, Iowa, and others are all
considering new stricter voter identification laws (NCSL 2015).
The consequences of all of this could be enormous. Given that more than half of the
nation’s population is currently subject to these laws, that stricter laws are being considered in
1 Current strict ID states: Arizona, Georgia, Indiana, Kansas, Mississippi, North Dakota, Ohio,
Tennessee, Texas, Virginia, and Wisconsin.

2
multiple states, and that the courts are actively evaluating the merits of these laws in a series of
landmark cases, there is a compelling need to know exactly what the true impact of these laws is.
There is no shortage of opinions about these laws. On one side, the proliferation of these
laws raises real concerns for critics who believe that they are unnecessary and ultimately
detrimental to democracy. Activist groups like the Brennan Center for Justice claim that voter ID
laws serve as effective barriers that limit the legitimate participation of racial and ethnic minorities
and other disadvantaged groups (Weiser 2014). The right to vote, according to these detractors,
should not only be afforded to people of a certain means. Using this line of reasoning, former U.S.
Attorney General Eric Holder has equated voter ID laws to poll taxes. Likewise, U.S. Supreme
Court Justice Ruth Bader Ginsburg has called the laws “purposely discriminatory” (Lowry 2014).
Indeed for some, the growth of voter ID laws represents one of the most pressing civil rights issues
of our time. Critics also believe that there is almost no voter fraud and thus little reason to enact
these laws in the first place. 2 The Voting Rights Institute, for example, bemoans these laws as “an
unnecessary, expensive, and intrusive voter restriction” (Voting Rights Institute 2015). Within this
framework, the only winners are Republican leaders who employ these laws to hijack the
democratic process and bias outcomes in their favor. If these critics are correct, voter identification
laws are having widespread consequences not only for who wins and who loses, but also for the
representativeness and fairness of our democracy.
However, this debate is far from one-sided. Proponents, including most prominently Kris
Kobach, Kansas’ Secretary of State, claim that they are warranted and that they do not reduce the
participation of citizens (Kobach 2011). They are warranted, according to supporters of the law,
2 Research has uncovered little documented evidence of significant voter fraud (Ahlquist et al 2014
but see Richman et al 2014).
3
because fraud is a real and potentially widespread phenomenon that could alter electoral outcomes
and erode faith in democracy. Advocates also argue that voter identification laws do not reduce the
participation of citizens because they do not prevent legitimate voters from entering the voting
booth. For the Americans who have identification, the laws raise no new barriers. For the tiny
subset of Americans who do not, the requirement represents a small hurdle that is easily overcome.
Moreover, the American public strongly favors these laws (Coren 2014). From this perspective, the
passage of these laws ensures that only eligible American participate and restores trust in the
democratic process.
Who is right? Are these laws simply minor alterations that serve only to reduce fraud or are
they major barriers that substantially alter who votes and who wins in the American political arena?
The key to answering this question and to determining the benefits or drawbacks of voter
identification is to provide hard empirical evidence of the actual consequences of voter
identification laws.
Evaluating Voter ID Laws
Unfortunately, despite all of the partisan and political debate, we have relatively little
empirical data on the consequences of these laws. Several studies have identified areas of concern
that could ultimately lead to large, negative consequences for American elections. Although the
findings have been disputed, several studies appear to have uncovered a relatively large number of
Americans without proper identification (GAO 2014, Barreto and Sanchez 2014, Pastor et al 2010).
Others have shown that a lack of identification is particularly acute among the minority population,
the poor, and the young (Barreto and Sanchez 2014, Ansolabehere 2014, Pastor et al 2010, Barreto
et al 2009 but see Alvarez et al 2011).3
3 Supporters of these laws counter that most of the citizens without ID are not voting anyway.
4
A different set of researchers has attempted to assess whether the existing laws are applied
evenly and have found that poll workers disproportionately ask minorities for identification (White
et al 2015, Rogowski and Cohen 2014, Atkeson et al 2014, Cobb et al 2012, Ansolabehere 2009).
There is even some evidence that in a small set of cases provisional ballots that should have been
counted have ultimately not been included in vote tallies (Pitts 2013). Finally, there is at least
tangential evidence of the political motivations behind the passage of these laws. These laws are
generally passed by Republicans and tend to emerge in states with larger minority populations and
greater partisan competition (Bentele and O’Brien 2013, Hicks et al 2014 ). All of this evidence
suggests that the consequences of voter identification could be severe.
There are, in short, many reasons to suspect problems with these laws. Yet none of these
studies assesses the actual consequences of these laws. The core question is not who could be
affected but is instead who is affected. At the end of the day, do voter ID laws reduce participation
and skew the electorate in favor of one set of interests and against another set of interests?
On this core question, the published results seem to point to limited effects. The main
published studies find little to no effect on overall turnout (Ansolabehere 2009, Mycoff et al
2009). 4 More importantly, on the question of who votes and who does not, the research is almost
4 There are, however, a series of non-refereed manuscripts that reach more negative conclusions
about voter ID laws. This includes studies by the General Accounting Office (2014), Dropp (2013),
Vercellotti and Anderson (2006), and Alvarez et al (2008). Given that the methodology and
research design employed in these studies has not been vetted, it is often difficult to reach firm
conclusions about the impact of voter ID laws. Dropp (2013), for example, examines an impressive
array of individual voting records but has no controls for context - a critical omission given that
factors like competition, spending, and mobilization both matter a lot for turnout and vary widely

5
unequivocal. The few published studies that have looked for differential effects by race have found
none (Hood and Bullock 2012, Alvarez et al 2008, Mycoff et al 2009, Alvarez et al 2010, Milyo
2007). In the end few scholars have been able to effectively counter the literature’s core conclusion
that “voter ID does not appear to present a significant barrier to voting” (Ansolabehere 2009: 129).
Limitations of the Existing Research
Can it be that voter identification laws actually have minimal effects on American
democracy? We believe that there are three fundamental problems with the tests to date. The first
problem is that scholars have almost exclusively analyzed elections that occurred before the strictest
voter identification laws were put in the place. States that have non-strict laws still allow people to
vote if they do not have ID, so these laws might have little impact. If the major effects of voter ID
laws only occur when states require voters to present identification before voting, then existing
studies generally are not actually assessing the impact of these laws. 5 The rapid and very recent
proliferation of these laws means that any research that examines the vote in anything but the last
election cycle or two will miss most of the effects of these laws. As a result, most existing studies
are likely to understate the significance of these laws. Arguably then, we do not yet know if strict
forms of voter identification matter.
across states and electoral years. Likewise, the GAO study (2014) only analyzes the effect of ID
laws in two states and fails to include controls for electoral environment. Alvarez et al (2008) and
Vercellotti and Anderson (2006) both examine turnout before strict photo ID laws were enforced.
5 All but one of the existing published studies assessing differential turnout look at data from 2006
or earlier, when there were no strict photo ID states. Hood and Bullock (2012) include 2008 data
but only look at one election in one state with strict voter ID laws in place.

6
Another core problem with much of the existing analysis is that it focuses on self-reported
rather than validated turnout. Self-reported turnout is much higher than actual turnout
(Ansolabehere and Hersh 2012, Silver et al 1986). More critically, those who over-report turnout
differ by race and class from those who do not over-report turnout. Racial minorities, in particular,
are particularly prone to over-report their participation in elections (Shaw et al 2000, Abramson and
Clagget 1991). All of this makes it extremely difficult to assess the racial and class effects of voter
ID laws using self-reported turnout.
Finally, despite all of the discussion about how these laws benefit Republicans and hurt
Democrats, there has been little empirical analysis of the political consequences of strict voter ID
laws. Several studies have assessed the political and partisan motivations for adopting these laws
but more work needs to be done on how these laws ultimately affect the mix of partisan and
ideological voters (Hicks et al 2014, Bentele and O’Brien 2013). We do not yet know if those on the
political left – Democrats and liberals – are hurt by these laws. Given that these laws have been
instituted almost entirely by Republican legislatures and given critics’ strong assertions that these
laws are enacted to enhance Republican electoral fortunes, this is a major omission.
A More Definitive Test
Fortunately, we are able to rectify each of the problems that we believe are largely
responsible for the null findings in the literature. First, in order to capture the effects of the recent
arrival and proliferation of strict identification laws, we concentrate our analysis on turnout in the
five most recent election cycles. Specifically we examine data on individual voter turnout from
2006 to 2014 using the Cooperative Congressional Election Study (CCES). Since the study has
large samples from every state in each election cycle, we can compare turnout by different sub-
groups in every state to see if strict voter ID laws alter turnout. In our sample, we have data on
turnout in a large number of elections with strict voter ID laws in place. Specifically, we can

7
incorporate into our analysis turnout patterns in 51 elections (26 general election contests and 25
primary contests) across 10 states with strict voter identification laws in place.6 Further information
about the coding of the all of the states and their voter ID laws in effect in from 2006 to 2014 is
available in the online appendix.
Another benefit of this newer dataset is that we are able to single out states with strict
identification requirements. Unlike previous studies that have tried to assess voter ID laws through a
scale that orders laws from weakest to strongest, we begin by focusing exclusively on states that
require identification to see if these relatively new, strict laws have an impact.
Second, in order to get around issues related to the over-reporting of voting by different
groups, we focus exclusively on the validated vote. In the CCES data that we analyze, each
reported vote is checked against official voting records to determine if each respondent who
claimed to vote actually did.7
Finally, using the CCES we can begin to examine shifts in turnout across party identification
and political ideology. Specifically, we can assess whether or not Democrats and liberals are more
burdened by voter ID laws than Republicans and conservatives.
The analysis itself is fairly straightforward. We compare turnout of individuals in states
with strict identification laws to turnout of individuals in all other states after controlling for other
state-level electoral laws that encourage or discourage participation, the context of each election in
6 Strict voter ID elections in our data set: 2014 (AZ, GA, IN, KS, MS, ND, OH, TN, TX, VA): 2012
(AZ, GA, IN, KS, OH, TN, VA): 2010 (AZ, GA, IN, OH): 2008 (AZ, GA, IN, OH): 2006 (AZ).
The primary vote is not available in 2006.
7 This check uncovered widespread over-reporting and a pattern of over-reporting that differed
significantly across race and ethnicity.

8
each state and congressional district, and the entire array of individual demographic characteristics
that have been shown to be linked to turnout. The key test is not whether turnout is lower in strict
voter ID states but instead whether there is a differential impact of these laws on racial and ethnic
minorities, ceteris paribus. Thus, the key variables in these regression models are the interactions
between race and the presence of strict voter ID laws.
With this new data we believe that we have been able to rectify the core problems of
existing studies and can thus offer a more definitive test of voter identification laws. In doing so,
we find that strict voter identification laws substantially alter the makeup of who votes and
ultimately skew democracy in favor of whites and those on the political right. These laws
significantly impact the representativeness of the vote and the fairness of democracy.
A Theory and Potential Mechanisms
Before proceeding, it is important to think through exactly why and how voter identification
laws might differentially impact voter turnout. There may be two distinct potential mechanisms
which might exacerbate racial, class, age, and/or partisan gaps in turnout. 8 The first is direct.
8 A third potential mechanism is that campaigns, candidates, and parties may behave differently
after voter ID laws are passed. If Democratic leaders believe that the passage of voter identification
laws signals increased Republican dominance in these states, the Democratic Party might reduce its
campaign expenditures and mobilization efforts. In alternate tests we do find that respondents report
significantly less mobilization by campaigns after strict ID laws are passed but minorities, the poor,
and Democrats do not report greater decreases in contact than whites, the well-off, or Republicans.
Moreover, our results below hold after controlling for both campaign contact and campaign
spending. All of this suggests demobilization – or mobilization - by the Democratic Party and its
candidates is not a major part of the voter ID law story.

9
Individual citizens who do not have the required identification will learn about the identification
requirements and will decide not to vote or will try to vote and will be turned away at the polls.9
Eligible voters who lack valid identification could, of course, choose to acquire the necessary
identification but past research clearly demonstrates that any additional hurdle to voting, however
small or large, can have a substantial impact on the likelihood of voting – especially among low-
propensity voters (Leighley and Nagler 2014, Verba et al 1995). The fact that other small state level
institutional barriers like registration deadlines have been shown to impact turnout further implies
that voter ID could matter (Burden et al 2013, Larocca and Kleminski 2011). Since a lack of
identification is particularly pronounced among racial minorities, the socioeconomically
9 The best, most recent data suggest that about half of all voters without proper ID are aware of that
fact. Barreto and Sanchez (2014) report that 50.2 percent of Texans who do not have proper
identification are aware that they do not have a valid ID. If we assume that about 10 percent of
eligible Latinos lack proper photo identification, the Texas data roughly match a 2012 PEW
national survey data which found that 5 percent of Latino registered voters in strict photo ID states
were aware that they do not have the proper identification (PEW 2012). As such, many voters
without ID could simply choose not to go to the polls. But it is also quite possible that many voters
are being turned away at the polls. Data on polling place refusals is still in its infancy. Ansolabhere
(2009) reports exceptionally low rates of refusals at the polls – well under 1 percent of all voters –
but does not directly assess the rate for voters without proper identification or breakdown the refusal
rate by race and the presence of a voter ID law. In our CCES data, a significantly higher share of
minority voters in strict ID states report a problem with voter identification but since that question is
only asked for a small share of our CCES respondents, we are not confident in the results. Clearly,
more work needs to be done to assess each of these two different factors.

10
disadvantaged, younger voters, and those on the political left, the law should disproportionately
reduce the turnout of these groups. This direct mechanism is the one that critics typically focus on.
But there is a second, more diffuse mechanism that could also differentially impact turnout.
Even if they have the proper identification, some citizens might feel targeted or threatened by these
laws and might therefore choose not to participate.10 Where and when these laws are passed,
members of certain groups might feel unwelcome at the polls and even worried about retaliation for
going to the polls. This is especially true for racial minorities who have been the subject of election
related violence at different points in American history but could also impact those on the political
left and potentially even younger, socioeconomically disadvantaged voters (Kousser 1999, Parker
1990).
Unfortunately, while we suspect that each of these mechanisms is likely to contribute to
differential declines in turnout, we cannot directly test each mechanism or distinguish between them
with our data. The CCES, our main survey, does not include ask respondents if they have
identification and includes no questions about feelings of threat or alienation. 11 We can test to see
if voter ID laws differentially lower turnout but we cannot show how they do so.
Data
10 Of course, the opposite is also possible: the threat of voter identification laws could mobilize
voters into action.
11 There is, unfortunately, also limited evidence on these two different mechanisms outside of our
data. We do know that there is widespread knowledge of these laws. Pew reports that 92 percent of
registered voters in states with strict photo ID requirements are aware of these laws (Pew 2012).
But that knowledge could impact the voting behavior both of those without proper identification as
well as those with it.

11
To assess the impact of voter identification laws on turnout, we utilize data from the 2006-
2014 Cooperative Congressional Election Studies (CCES). The CCES is a national stratified
sample survey administered over the internet of over 50,000 respondents by YouGov/Polimetrix.
The CCES is the ideal tool for examining voter identification laws for three reasons. First, it
provides a measure of the validated vote. Because each respondent who claims to have voted is
checked against actual state voter files, the problem of over-reporting by members of different
groups is eliminated. Second, it covers recent years, including the years in which the first strict
photo ID laws were passed. Given the relatively recent proliferation of strict voter identification
laws, it is vital to include data up to the 2014 election. The third advantage of the CCES is its size
and breadth. It includes a large and representative sample of respondents from every state.
Data on the strictness of voter identification laws in place in each state come from the
National Conference of State Legislatures (NCSL). The NCSL maintains a database of all voter
identification laws in effect in each state and in each election year. Scholars have typically
measured the strictness of voter identification laws by distinguishing between states with 1) no
document required to vote, 2) an ID requested, 3) a non-photo ID required, 4) a photo ID requested,
and 5) a photo ID required. We follow this convention for alternate tests. But for our main
analysis, we single out strict identification laws – those that prevent the voter from casting a regular
ballot if they cannot present appropriate identification – because we believe these stricter laws have
the greatest potential to dramatically impact turnout. These stricter laws make it easy for election
administrators to prevent many voters from casting a regular ballot. Given estimates of the large
number of Americans that do not have ready access to proper identification, the possibility of
widespread effects is real. Moreover, it is these stricter laws that have garnered the lion’s share of
attention from voting rights activists and the media. That attention alone could be instrumental in
dissuading large shares of the public from going to the polls. We begin by singling out strict

12
identification laws – those that require an ID (coded as a 1 for all states that have these laws in
place).12 We then assess if there is a significant difference between strict ID laws that require a
photo ID and those that allow some forms of non-photo identification.
The main goal in the analysis is to assess the differential effects of voter identification laws
on the participation of distinct groups. In particular, we examine if these laws have a more
pronounced effect on racial and ethnic minorities and those on the political left.
We focus on turnout in both general and primary elections. The main dependent variables –
general and primary votes - are coded as 1 for a validated vote in that contest and 0 otherwise.13
In terms of race and ethnicity, we single out respondents who self-identified as white, Black,
Latino, Asian American, or indicated that they were multi-racial. To assess the political
consequences of ID laws, respondents are asked their partisanship and liberal-conservative
ideology. We employ a standard 7 point party identification scale and a standard 5 point ideology
scale. In each case, the key test is whether each of these individual characteristics interacts with
voter identification laws and leads to especially large declines in turnout.
We also control for individual demographic characteristics that help to drive voter
participation in previous research (Verba et al 1995). These include age (measured in years),
education level (a 6 point scale), family income (a 16 point scale), nativity (foreign born, first
generation American, or other), gender, marital status (married or not), having children, being a
12 Given the claim that the initial passage of these laws can temporarily fuel anger and voter
mobilization, we add a dummy variable to test for this temporary mobilization (Valentino et al
2015; Citrin et al 2014).
13 Respondents who could not be matched to voter files are dropped from the analysis.

13
union member, owning a home, being unemployed, and religion (Protestant, Catholic, Jewish,
Atheist, or other).14
To isolate the effects of voter identification laws, we also have to incorporate other state-
level electoral laws that encourage or discourage participation. Research assessing the
permissiveness of a state’s election laws typically assess if the state 1) allows early voting (Burden
et al 2013, Giammo and Box 2010), 2) has all-mail elections (Karp and Banducci 2000), and 3)
allows no excuse absentee voting (Larocca and Klemanski 2011). Generally, the most important
institutional factor driving state turnout is, however, the limit on the number of days before the
election that residents can register to vote (coded in days) (Burden et al 2013, Larocca and
Klemanski 2011). All are included here.
Finally, to help identify the independent effect of ID laws, our analysis has to include the
electoral context surrounding each particular election. For our analysis, this includes the political
competitiveness of each state (measured as the margin of victory in the most recent Presidential
contest), the presence of different electoral contests (Presidential election year, the presence of
Senatorial, and Gubernatorial elections), whether the Senatorial and Gubernatorial contests are
open-seats or not, and whether the Senatorial and Gubernatorial contests are uncontested or not.
Given that our main dependent variables are coded 1 for voters and 0 for non-voters we
employ logistic regressions.15 To incorporate the non-independence of respondents within each
state, we cluster errors by state.
14 Since we expect the effects to be most pronounced for registered voters, we drop non-registered
respondents from our main analysis. The pattern of effects is similar either way.
15 We also re-ran our analysis using hierarchical linear models. The basic pattern of results did not
change appreciably across multiple HLM specifications.

14
Analysis
We begin by repeating the core analysis of most existing studies. Specifically, we evaluate
whether identification laws lower overall turnout. The regressions assess whether individual
turnout is lower in states with strict ID laws than in all other states controlling for a host of different
factors that could impact turnout. The first column in Table 1 focuses on turnout in general
elections and the second on turnout in primaries. Both are logistic regressions with the validated
vote as the dependent variable and the presence of a strict identification law as the main
independent variable. [TABLE ONE HERE]
In both cases, there is no apparent relationship between strict ID laws and overall voter
turnout. Net other factors, whether or not a state requires identification to cast a standard ballot has
no significant effect on the likelihood of any individual voting. This holds true regardless of how
we measure voter identification laws or which other factors we include in our regression model.
That conclusion is hardly surprising given that it fits with the bulk of existing studies.
ID Laws and Minority Turnout
The critical question is not whether the average American is affected by voter identification
laws. Rather, it is whether these laws have a negative impact on minorities and other disadvantaged
groups. To begin to assess this possibility, we simply compare turnout by race in strict voter ID
states with turnout by race in non-strict ID states without controlling for any other factors. The
pattern in both primary and general election is clear. There are substantial drops in minority turnout
in strict voter ID states and no real changes in white turnout. Hispanic turnout is 7.1 points lower in
strict voter ID states than it is in other states in general elections and 5.3 points lower in primary
elections. For Blacks, the gap is negligible in general elections but a full 4.6 points in primaries.
For Asian Americans the difference is 5.4 points and 6.2 points. And for multi-racial Americans
turnout is 5.3 points lower in strict voter ID states in general elections and 6.7 points lower in

15
primary contests. White turnout is relatively flat and, if anything, increases slightly in strict
identification states. The increase for white turnout in strict ID states is 0.2 points in general
elections and 0.4 points in primary elections.16
The end result is, in most cases, a substantial increase in the gap between white and non-
turnout in strict voter ID states. Latinos, for example, generally vote less frequently than whites but
in strict voter ID states the gap between Hispanics and whites increases by a full 7.3 points in
general elections and a similarly large 5.7 points in primary contests. The Black-white, Asian
American-white and multi-racial American-white gaps grow almost as much. In strict voter ID
states minorities are lagging further and further behind whites.
Of course, the pattern in Figure 1 is only suggestive. The differential decline in minority
turnout in strict voter ID states could have little to do with voter ID laws themselves and could
instead be a factor of any number of different and unique features of states that pass strict voter ID
16 Our sample includes 32,064 whites, 6429 African Americans, 1897 Latinos, 459 Asian
Americans, and 632 Mixed Race Americans respondents residing in strict voter ID states.
10
20
30
40
50
60
70
80
Hispanic Black Asian American Mixed Race White
Turn
out R
ate
(%)
Figure 1. Strict ID Laws and Voter Turnout by Race
General No Strict ID General Strict ID Primary No Strict ID Primary Strict ID
16
laws or of the minorities who live in them. Strict voter ID states tend, for example, to also have
more rigid registration deadlines and more limited vote-by-mail options.
To see if the sharp drop in minority turnout in strict voter ID states is, in fact, related to voter
ID laws, we assess the effects of voter ID laws after controlling for a range of state level electoral
laws, campaign dynamics, and individual characteristics. To examine if Latino, Black, Asian
American, and multi-racial American turnout is differentially and negatively impacted by the
presence of these laws, we add interactions between strict ID laws and each racial group.
The results, which are presented in the first two columns of Table 2, suggest that minorities
are being disproportionately and negatively impacted. The effects are perhaps most consistent for
Latinos but across the different types of contests, there are strong signs that strict identification laws
decrease turnout for Latinos, Blacks, Asian Americans, and some indications that they also do so
for multi-racial Americans. In general elections, Latinos are significantly more burdened by these
laws than are whites and members of other groups. For Blacks and Asian Americans the interaction
coefficient is negative but just marginally beyond the .05 significance level. In primary elections,
Latinos, Blacks, and Asian Americans are all significantly more impacted and multi-racial
Americans are almost significantly more impacted. [INSERT TABLE TWO HERE]
In all cases, the significant effects are politically meaningful. The models reveal substantial
drops in turnout for minorities under strict voter ID laws. In the general elections, the model
predicts that Latinos are 10 percent less likely to turn out in states with strict ID laws than in states
without strict ID regulations, all else equal. These effects are almost as large in primary elections.
Here, a strict ID law could be expected to depress Latino turnout by 9.3 points, Black turnout by 8.6

17
points, and Asian American turnout by 12.5 points.17 Given the already low turnout of most of
these groups across the country, these declines are all the more noteworthy.
Importantly, as illustrated by Figure 2, these laws serve not only to diminish minority
participation, they also increase the gap in the participation rate between whites and non-whites. For
Latinos in the general election, the predicted gap more than doubles from 4.9 points in states
without strict ID laws to 13.5 points in states with strict photo ID laws. The predicted Latino-white
gap more than triples from 3.4 points to 13.2 in primaries. Likewise, for African Americans the
predicted gap in general contests increases from 2.9 points to 5.1 points and in primaries more than
quintuples from 2.5 points to 11.6 points. For Asian Americans the predicted gap grows from 6.5
percent to 11.5 points in general elections and from 5.8 points to 18.8 points. In the case of multi-
racial Americans, strict ID laws may be creating a racial disadvantage where there typically was
none. Multi-racial Americans voted at almost the exact same predicted rate as whites (a 0.1 point
gap) in primaries in non-strict ID states but were 7.1 percent less likely than whites to participate in
primaries in strict ID states, all else equal.
Note: Race specific effect for white vs Asian and white vs black in general elections and multi-racial effect in primaries are not significant at p<.05.
17 For multi-racial race Americans the drop is 6.6 points but it is not quite statistically significant.
-5
0
5
10
15
20
White vs Latino White vs Asian White vs Black White vs MixedRace
Pred
icte
d Ga
p in
Tur
nout
Figure 2. Photo ID Laws andPredicted Racial Gaps in Turnout
General Not Strict General Strict Primary Not Strict Primary Strict

18
Another, perhaps simpler way to demonstrate the anti-minority nature of these laws is to focus on
whites and include an interaction between strict voter ID laws and white identity. That is exactly
what we do in the last two columns of Table 2. Here we find that in primaries white Americans -
compared to all other racial and ethnic groups – are significantly advantaged by strict voter IDs. In
general elections, we see the same pattern but it is only significant at the p<.10 level. White
Americans already generally participate at higher rates than others, but when states institute strict
voter ID laws that advantage grows measurably. Skeptics might at this point contend that the
patterns we see in Table 1 and Figure 2 are driven less by strict voter identification laws themselves
and more by the political conditions in the states that pass implement these laws. One could
plausibly argue that some of the factors that lead states to enact voter identification laws in the first
place are also impacting the relative turnout of different groups. To begin to address this concern,
in an alternate analysis we incorporated a range of political and demographic factors that have been
shown to be linked to the proposal or passage of voter identification laws (Bentele and O’Brien
2013).18 Few of these variables had a significant impact on the likelihood that any individual
18 Specifically, we added a series of different measures of: a) the partisanship of the state political
leadership (including partisan control of the state House, state Senate, and Governor’s office, shifts
in partisan control, and divided vs united government), b) the partisanship and ideology of the
public (measured as the share of the public identifying as Republican and the share self-identifying
as conservative), c) the level of partisan competition in the state (measured at the elite level with the
size of the partisan gap in each state legislature or at the mass level with the absolute gap between
self-identified Democrats and Republicans or the gap between liberals and conservatives), and d)

19
would vote (after controlling for individual characteristics) and none substantially altered the main
findings relating to the impact of voter ID on minority turnout.
Nevertheless, skeptics might still contend that we cannot control for all of the relevant state-
level and campaign specific factors that affect turnout. We can address this broader concern by
focusing our analysis only on self-identified Democrats. If minority turnout is especially low in
certain states because Republicans are dominant in these states, then we should find that all
Democrats –white and non-white alike – turnout at especially low rates in these states. On the other
hand, if we find that voter ID laws depress the participation of racial and ethnic minority Democrats
more than they impact the turnout of white Democrats, then the effects cannot be due to the
dominance of Republicans in voter ID states. If the racialized pattern persists when we only look at
Democrats, we can conclude that there is a clear racial effect of voter ID laws.
This is exactly what we find. Re-running the analysis with Democrats only, we still find that
Latino, Asian American, and multi-racial American turnout is significantly more likely to be
depressed by voter ID laws than white turnout (analysis in Table 1 of the Online Appendix).
Beyond Race
Racial minorities are not the only groups that could be impacted by voter identification laws.
One might expect these laws to have pronounced effects on other disadvantaged groups as well.
Indeed, a good portion of the debate around these laws has focused on younger and lower class
Americans. To assess the impact on these groups, we looked at a range of interactions between
class, age, and voter identification laws.
the racial demographics of the state (including percent Black, Latino, Asian American,
undocumented, and white).

20
In terms of age, we found little of note. There were, however, some small indications that
lower class Americans are especially impacted by strict ID laws. But the results for class are not
nearly as clear or robust as they are for race. Of all of the different interactions between different
measures of class and different measures of voter identification laws that we examined, only one or
two were significant. In particular, we found that strict photo ID laws were associated with a
significant reduction in the electoral participation of Americans at the very bottom of the
socioeconomic spectrum - those without a high school degree – in general elections. But these
significant results often faded when we altered the model in different ways and were not evident at
all in primary elections. We suspect that the least advantaged Americans may be hurt by these laws
but we are far from certain that this is the case.
There are two reasons why one might expect race effects to be more pronounced than class
effects. First, the best available evidence suggests that a lack of identification is particularly
pronounced among racial and ethnic minorities even after controlling for class. Barreto and
Sanchez (2014) find that even among those with family incomes less than $20,000, there are huge
disparities in access to identification. In their Texas sample, only 16 percent of poor white citizens
lacked proper identification while fully 41 percent of poor Blacks and 40 percent of poor Hispanics
did not have identification. If a lack of identification is the primary barrier, then it is a barrier that
most dramatically impacts racial and ethnic minorities.
As well, if fear of retaliation or a sense of marginalization is what drives individuals away
from the polls, then that fear and marginalization is likely to be especially acute for racial and ethnic
minorities. Poor and younger Americans may feel that they have less of a say than others but they
have not been subject to the same discrimination, electoral intimidation, and violence that has
targeted African Americans, Latinos, and other minorities at different points in American history
(Kousser 1999, Parker 1990, Almaguer 1994). Moreover, when strict voter ID laws are passed, the

21
discussion in the media and among critics tends, we think, to be much more focused on how these
laws target minorities than on how they target the poor or the young. Racial and ethnic minorities
have more reason to fear intimidation and more reason to feel targeted.
The Political Consequences of Voter Identification
Opponents of these strict voter ID laws also regularly claim that one of the main motivations
behind the laws is to limit the participation of democratic leaning groups in order to benefit the
Republican Party. Yet scholars have not directly tested this assertion.
In Table 3 we examine the political consequences of voter ID laws by adding interaction
terms between partisanship, political ideology, and strict photo ID laws. The political effects are
not as consistent across general and primary elections as the racial effects but there are clear ties
between strict voter identification laws and turnout of different political groups. In primaries, the
effects of voter identification laws are more pronounced and more negative for those on the political
left. The positive and significant interactions between voter ID laws and both party identification
and ideology indicate that Republicans and conservatives are significantly less likely than
Democrats and liberals to experience declines in turnout in primary contests when strict voter ID
laws are in place.
These effects turn out to be substantial. Democratic turnout drops by an estimated 8.8
percentage points in general elections when strict photo identification laws are in place. By
comparison, the predicted drop for Republicans is only 3.6 points. The skew for political ideology
is even more severe. For strong liberals the estimated drop in turnout in strict photo identification
states is an alarming 7.9 percentage points. By contrast, strong conservatives actually vote at a
slightly higher rate – 4.8 points - in strict ID states, all else equal.
22
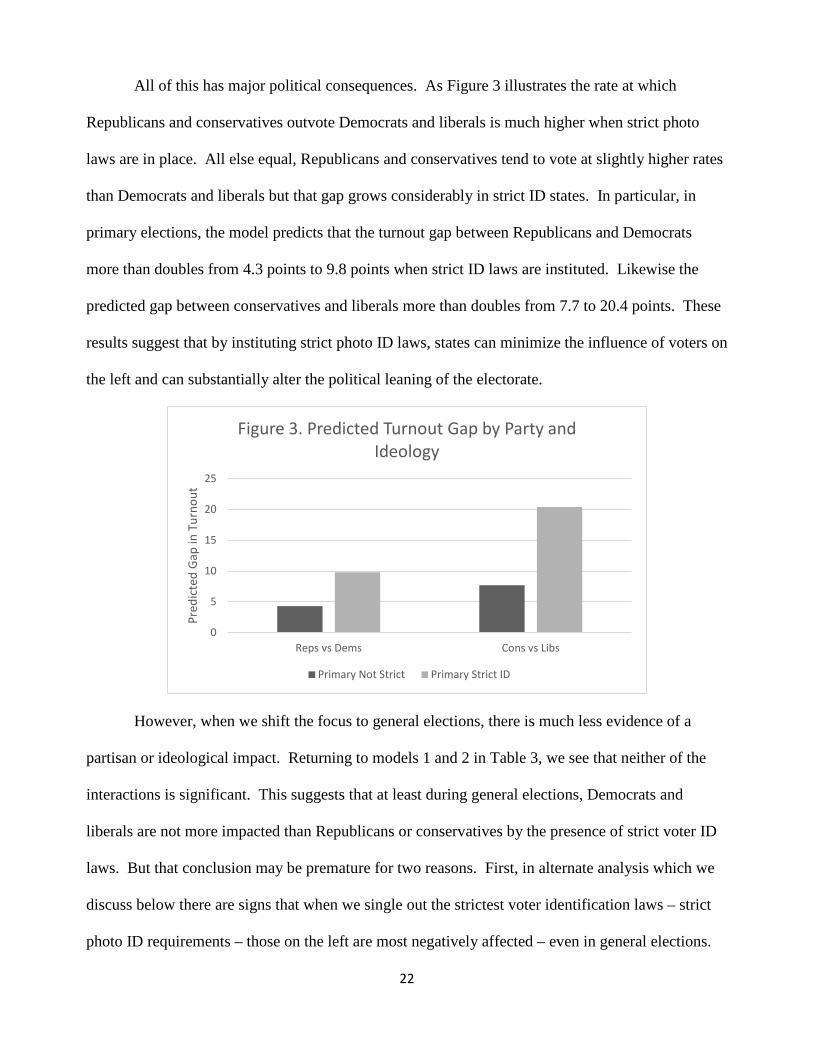
All of this has major political consequences. As Figure 3 illustrates the rate at which
Republicans and conservatives outvote Democrats and liberals is much higher when strict photo
laws are in place. All else equal, Republicans and conservatives tend to vote at slightly higher rates
than Democrats and liberals but that gap grows considerably in strict ID states. In particular, in
primary elections, the model predicts that the turnout gap between Republicans and Democrats
more than doubles from 4.3 points to 9.8 points when strict ID laws are instituted. Likewise the
predicted gap between conservatives and liberals more than doubles from 7.7 to 20.4 points. These
results suggest that by instituting strict photo ID laws, states can minimize the influence of voters on
the left and can substantially alter the political leaning of the electorate.
However, when we shift the focus to general elections, there is much less evidence of a
partisan or ideological impact. Returning to models 1 and 2 in Table 3, we see that neither of the
interactions is significant. This suggests that at least during general elections, Democrats and
liberals are not more impacted than Republicans or conservatives by the presence of strict voter ID
laws. But that conclusion may be premature for two reasons. First, in alternate analysis which we
discuss below there are signs that when we single out the strictest voter identification laws – strict
photo ID requirements – those on the left are most negatively affected – even in general elections.
0
5
10
15
20
25
Reps vs Dems Cons vs Libs
Pred
icte
d Ga
p in
Tur
nout
Figure 3. Predicted Turnout Gap by Party and Ideology
Primary Not Strict Primary Strict ID

23
Second, the two general elections included in our dataset – 2008 and 2012 – are unique in that
Barack Obama was on the ballot in both contests. We know that Barack Obama’s candidacy
mobilized minority turnout – especially black turnout – to historic levels. That mobilization may
have limited the impact of strict voter identification laws in those two contests. [TABLE 3 HERE]
We can examine the political effects of voter identification laws in a slightly different way.
If we are concerned about the well-being of racial and ethnic minority voters, we might want to
look specifically at how these laws affect the mix of views on race and immigration that are present
at the polls. In particular, we might want to know if strict voter identification laws are associated
with an increase in the share of voters with more racially resentful views or an increase in the share
of voters with more anti-immigrant views.
To assess those links in alternate tests we added interactions between racial resentment and
immigration attitudes and strict voter identification laws to the basic regression model in Table 2.19
While the CCES only asked about race and immigration in two years, we nevertheless find
significant interactions for both sets of views. Americans with racially resentful attitudes and those
with more negative views of immigrants were substantially more likely to turnout in primaries in
states with strict voter identification laws than in other states, all else equal. The result is that the
19 Racial resentment was a scale measured with two questions that are the standard for assessing
racial resentment - “Blacks should work their way up without any favors” and” “Generations of
slavery and discrimination have created conditions that make it difficult for Blacks to work their
way out of the lower class” (Kinder and Sanders 1994). Immigration views combined questions on
whether or not the US government should “allow the police to question anyone they think may be in
the country illegally,” “increase the number of border patrols”, and “grant legal status to illegal
immigrants who have held jobs and paid taxes.” Both scales were alpha factor scores.

24
share of voters with anti-immigrant and anti-minority views grows substantially when strict voter
identification laws are in place (see Table 2 of the Online Appendix).
Which Identification Laws Matter
Up to this point, we have been focusing on strict identification laws – those laws that require
identification in order for their vote to count. But there are other ways of distinguishing between
different types of voter identification laws. One possibility is to single out strict voter identification
laws that require photo identification. These strict photo identification laws garner a lot of attention
and have received some of the greatest criticism. When we test to see if these strict photo
identification laws have more pronounced effects than strict non-photo identification laws, we find
that for the most part the effects are statistically indistinguishable. Both negatively impact minority
turnout at roughly the same rate. The one exception as noted above is that strict photo identification
laws may have more of an effect than strict non-photo identification laws on the relative turnout of
those on the political left and those on the political right in general elections. In alternate models,
when we substitute in interactions with strict photo identification laws in Table 3, we find a
significant relationship between ideology and strict photo identification (see online appendix).
Liberals appear to be especially disadvantaged in strict photo ID laws in general election contests.
It is also possible that state laws that request but do not require identification also matter.20
However, we could find no effects for state laws that merely requested that voters provide
identification. Turnout was not noticeably higher or lower in states that requested identification
(whether it was a photo identification or not) and we find no significant interactions between race or
any other demographic variable and the presence of a law that requested voter identification. Put
simply, there was no discernable difference between states that have no voter identification laws
20 In these states, voters typically only need to sign a form in order to vote.

25
and those that request some form of identification (photo or otherwise). While we are not certain
why these kinds of laws had little impact, we surmise it could be one of two things. First, it could be
that residents know that they can ultimately vote without an ID and thus are not deterred. Second, it
could be that minorities and others do not feel as threatened by these more lenient laws.21
Robustness
To help ensure that the relationships we have identified are accurate, we performed a series
of robustness checks. 22 First, we added a range of different independent variables to the model that
might be related to turnout. In particular, to further control for the competitiveness of the election
and different aspects of mobilization, we tested several different measures of state and district
campaign spending, whether or not there was an open seat in the respondent’s house district,
whether or not there was an open seat in the Senate contest in the state, whether or not there was an
open seat in the gubernatorial election, and finally whether or not each respondent indicated they
21 The fact that there was no discernible difference between states that had no voter laws and those
that merely requested IDs helps explain why alternate tests that assessed the strength of voter ID
laws were less conclusive. When we interacted race with a five point scale of voter ID laws, the
interactive effects tended to be smaller in magnitude and were less consistently significant across
different specifications of the model.
22 Given the South’s history of racially discriminatory voter disenfranchisement, we repeated all of
the analysis separately on Southern and non-Southern states. Interesting, the effects of voter ID
laws in the South were generally similar to their effects in the non-South. There were, however,
some signs that the political consequences of voter ID laws were more pronounced in the South
(voter ID laws skewed turnout toward the political right in both general elections and primaries in
the South).

26
had been contacted or mobilized by one of the campaigns. Likewise, to ensure we had not missed
individual characteristics that might impact turnout, in alternate tests, we augmented the basic
regression model with measures for years living in the current residence, church attendance,
religiosity, being born again, and several different variants of education and income. None of these
variables altered the basic conclusions of our analysis.
Next we performed a placebo check. We looked to see if voter ID laws had any effect on
different forms of political participation that do not require identification. Specifically, we assessed
the impact of strict and non-strict photo ID on protesting, attending a meeting, signing a petition,
and donating. We could find no link between state voter ID laws and these non-voting forms of
participation.
In another critical test, we shifted to an analysis that incorporated both state and year fixed
effects. By adding dummy variables for every state and every year, we essentially control away all
of the features that are unique to each state and each election year. If a state was more Republican
or more anti-minority in ways that we did not measure or in ways that are not measurable at all, that
difference was soaked up with the fixed effects. In the end, the fixed effects model should tell us
how turnout differs from the norm in each individual state when voter ID laws are enacted and thus
should get us closer to an estimate of the change due specifically to implementation of voter
identification laws. This “difference-in-differences” design is among the most rigorous ways to
examine panel data.
The fixed effects analysis which is displayed in the online appendix tells essentially the
story as our other analysis. Racial and ethnic minorities and liberals and Democrats are especially
hurt by strict voter identification laws.
Finally, we attempted to drill down into the data even further by looking at changes in
turnout in individual states when they first enact new voter ID laws. Following GAO 2014, Keele

27
and Minozzi 2013, and Hood and Bullock 2012, we undertook a series of simple, bi-variate
difference-in-difference tests where we compared changes in turnout in states with newly enacted
strict voter identification laws to changes in turnout in comparable states that did not enact new
strict voter identification laws over the same time period. In particular, with our data we focused on
changes in turnout Georgia and Indiana between 2006 and 2010 (both states implemented strict
photo ID laws in 2008), and changes in turnout in Tennessee and Kansas between 2008 and 2012
(both states implemented strict photo ID laws in 2012), and changes in turnout in Mississippi, North
Dakota, and Texas between 2010 and 2014 (all of those states implemented strict ID laws in 2014).
The overall pattern generally fits the story we have told here. For example, the Black-white,
the Latino-white, the Asian-white, and the Multiracial-white turnout gaps all tended to grow
substantially more in Mississippi, North Dakota, and Texas and when strict voter ID laws were
introduced in those states than in other states over the same years. Specifically the Black-white gap
increased by 1.4 points more in general elections and 7.7 points more in primary elections in these
states than elsewhere over the same period. The extra gap between Latino and white turnout in
these states was 2.5 points in the general election and 7.3 points in the primary. The figures for the
Asian-white and Multi-racial-white gap growth are 2.4 and 1.5 points respectively in general
elections and 16.9 and 8.7 points respectively in primaries. Likewise the Black-white gap grew
much more in Tennessee and Kansas between 2008 and 2012 than it did in other states and the
Latino-white gap grew more in Indiana and Georgia from 2006 to 2008 than the average across
other states over the same two years.23
23 We also find some of the same patterns for politics. For example between 2010 and 2014 the
Democrat-Republican turnout gap declined by 4.3 points less in states that enacted strict ID laws
than it did in other states.

28
But we view these tests with considerable skepticism for two reasons. First, although we
have a large dataset, when we focus on the turnout of a particular minority group in a particular
state in a particular year, our Ns get quite small, samples are less likely to be representative, and
presumably the errors in our estimates get very large.24 This is less of a problem when looking at
overall aggregate turnout but it becomes severe when focusing on differential changes in turnout for
minority groups like Latinos and African Americans. The problem is even worse for multi-racial
Americans and Asian Americans who make up even smaller shares of the electorate in these state
sub-samples. Second, it is extraordinarily difficult when focusing on one or two states in one
particular year to be confident that other changes in the state were not responsible for changes in
turnout or to be able to generate comparison states that are even roughly identical on the range of
factors that could impact turnout or minority relations.25 Given these concerns, we have chosen to
highlight the time-series cross section analysis that both compares across all states and incorporates
changes within states over time. By incorporating more state-years and thus more variation in state
laws and by controlling for the main factors that we think drive turnout or lead to the passage of
voter identification laws, we should arrive at a more accurate estimate (Alvarez et al 2008).
Despite all of these tests, we readily admit that our analysis cannot definitively show a
causal connection between voter ID laws and turnout (Erikson and Minnite 2009, Keele and
Minozzi 2013). States that pass voter ID laws are likely to be different from states that don’t pass
these laws on a number of different dimensions that we cannot yet identify. Thus our findings are
suggestive rather than conclusive.
24 Thus, although the pattern was often the same, the differences were less likely to be significant.
25 Georgia, for example, instituted expanded early voting hours at the same time it enacted strict
voter ID.
29
Implications
Voter ID laws may represent one of the nation’s most important civil rights issues. Voter ID
laws have the potential to impact who votes and who does not and in doing so these laws could
substantially effect who governs and ultimately who wins and who loses in American democracy.
What’s more, these voter ID laws are becoming stricter and more common. Prior to 2006, no state
required identification to vote. Today, twelve states have a strict ID requirement. In 2013 alone,
legislators in six states moved to strengthen their voter ID laws. The stakes for American
democracy are high and growing higher by the year.
Moreover, the fate of these laws is far from certain. Opponents of these laws have
repeatedly challenged these laws in the courts and are likely to continue to do so in the future. As
such, there is every chance that the courts will determine whether these laws endure or not. The
final decision may well rest with the Supreme Court which has yet to come down firmly on either
side of the debate.
All of this means that there is a desperate need for hard, empirical evidence. Given
upcoming legal challenges and the rapidly changing nature of the laws across the states, there is a
chance that clear, objective, and empirical answers to the core voter identification debates could
actually sway outcomes.
For the courts and for American democracy the core question should be – are these laws
fair? Do they limit the access and participation of the nation’s most disadvantaged? Are these laws
racially discriminatory? The findings presented here strongly suggest that these laws do, in fact,
have real consequences for the makeup of the voting population. Where they are enacted, racial and
ethnic minorities are less apt to vote. The voices of Latinos and to a slightly lesser extent those of
Blacks, Asian Americans, and multi-racial Americans all become more muted and the relatively

30
influence of white America grows. An already significant racial skew in American democracy
becomes all the more pronounced.
All of this also has clear partisan and political consequences. Strict voter ID laws appear to
diminish the participation of Democrats and those on the left, while doing little to deter the vote of
Republicans and those on the right. They produce a clear partisan distortion.
The effects of voter ID laws are concerning in isolation. But they are perhaps even more
alarming when viewed across the longer arc of American history. The effects of voter ID laws that
we see here are eerily similar to the impact of measures like poll taxes, literacy tests, residency
requirements, and at-large elections which were used by the white majority decades and centuries
ago to help deny Blacks many basic rights (Keyssar 2009, Kousser 1999, Parker 1990, Filer, Kenny
and Morton 1991). The nature of older barriers and current voter ID laws today remain eerily
similar: they were both instituted by advocates who claimed they would help to ensure the integrity
and legitimacy of democracy. Both sets of measures – new and old – also serve to distort
democracy and reduce the influence of racial minorities. The racially biased measures of old have
since been condemned and revoked but they were allowed to stand for long periods of American
electoral history. What will happen with voter ID today?
For others, what makes voter ID laws more disturbing is that they are just one of the many
different ways in which the electoral system is being altered today. Shortened early voting periods,
repeal of same-day voter registration, reduced polling hours, a decrease in poll locations, and
increased restrictions on voting by felons are all being regularly implemented at the state or local
level and all have been cited as having the potential to skew the electorate and American democracy
(Brennan Center 2014, Larocca and Klemanski 2011, Giammo and Box 2010, Manza and Uggen
2004). The findings presented here raise further questions about this broad suite of voter access
legislation. All of this coupled with the Supreme Court’s skepticism about the necessity of the
31
Voting Rights Act in its 2013 Shelby v. Holder (557 U.S. 193) ruling could dramatically alter the
nature of American elections moving forward.
At the same time it is important to recognize that this article is far from the last word on
voter identification. These laws are relatively new and have had only a brief period of time to take
effect. As a result, the impact of these laws may change over time. In addition, we remain uncertain
as to exactly how these laws work to skew turnout. We have shown that voter ID laws suppress
minority turnout but not how they do so. It could be that more minorities don’t have the requisite
ID, that the costs of obtaining an ID are too high for minorities to bear, that passing these laws
sends a signal to minorities that they are not wanted at the ballot box, or some combination of the
above. We simply don’t know. And we need to know.
Finally, there is a plethora of follow up questions about all of the other changes that
legislators have made to voter access. There are already a multitude of studies of how factors such
as poll hours and locations affect turnout but seldom do these studies directly test to see if the
impact of these laws is more severe for minorities and the most disadvantaged Americans (Burden
et al 2013, Larocca and Klemanski 2011, Giammo and Box 2010 but see Manza and Uggen 2004).
For example, does the recent reduction in early voting in the states mean that the gap between white
turnout and minority turnout is expanding even more? Are shorter polling hours, as some suspect,
further skewing American democracy? The more we answer these kinds of questions, the more we
will be able to offer accurate assessments of the fairness of American democracy and the more we
will be able to recommend a clear path forward.

32
Bibliography
Abramson, Paul R., and William Claggett. "Racial differences in self-reported and validated turnout in the
1988 presidential election." The Journal of Politics 53.01 (1991): 186-197.
Almaguer, Tomas. "Racial Fault Lines: The History of White Supremacy in California." Berkeley and Los
Angeles: University of California Press. 1994.
Alvarez, Michael, Delia Bailey, and Jonathan Katz. 2008. "The Effect of Voter Identification Laws on
Turnout." SSRN Working Paper.
Alvarez, Michael, Delia Bailey, and Jonathan Katz. 2011. "An Empirical Bayes Approach to Estimating
Ordinal Treatment Effects” Political Analysis 19:20-31
Ansolabehere, Stephen, and Eitan Hersh. "Validation: What big data reveal about survey misreporting and
the real electorate." Political Analysis (2012): mps023.
Ansolabehere, Stephen. 2009. "Effects of Identification Requirements on Voting: Evidence from the
Experiences of Voters on Election Day." PS (1):127-30.
Ansolabehere, Stephen. 2014. "Declaration in Marc Veasey et al v. Rick Perty et al: United States District
Court, TX."
Atkeson, L. R., Bryant, L. A., Hall, T. E., Saunders, K., & Alvarez, M. (2010). A new barrier to
participation: Heterogeneous application of voter id policies. Electoral Studies, 29(1), 66-73.
Atkeson, Lonna Rae, Yann P. Kerevel, R. Michael Alvarez, and Thad E. Hall. 2014. "Who Asks For Voter
Identification? Explaining Poll-Worker Discretion." Journal of Politics 76 (4):944-57.
Barreto, Matt, and Gabriel Sanchez. 2014. “Accepted Photo Identification and Different Subgroups in the
Electorate” Expert Report
Barreto, Matt, Stephen Nuno, and Gabriel Sanchez. 2009. "The disproportionate Impact of Voter ID
Requirements on the Electorate: New Evidence from Indiana." PS 42(1): 111-116

33
Bentele, Keith G., and Erin E. O'Brien. 2013. "Jim Crow 2.0? Why states consider and adopt restrictive voter
access policies." Perspectives on Politics 11(04): 1088-1116.
Burden, B. C., Canon, D. T., Mayer, K. R., & Moynihan, D. P. (2014). Election Laws, Mobilization, and
Turnout: The Unanticipated Consequences of Election Reform. American Journal of Political
Science, 58(1), 95–109. doi:10.1111/ajps.12063
Citrin, Jack, Donald P Green, Levy Morris. 2014. The Effects of Voter ID Notification on Voter Turnout:
Results from a Large-Scale Field Experiment. Election Law Journal 13(2):228-242
Cobb, Rachael, James Greiner, and Kevin Quinn. 2012. "Can Voter ID Laws be Administered in a Race-
Neutral Manner? Evidence from the City of Boston in 2008." Quarterly Journal of Political Science
7 (1):1-33.
Coren, Courtney. 2014. "Rasmussen Poll: 78 Percent of Voters Support Voter ID Laws." Newsmax.
Decisions, Latino. 2014. "Latino Decisions Election Eve 2014 Poll." Latino Decisions.
Erikson, Robert S., and Lorraine Minnite. 2009. "Modeling Problems in the Voter Identification - Voter
Turnout Debate." Election Law Journal 8 (2):85-101.
Filer, John E., Lawrence W. Kenny, and Rebecca B. Morton. 1991. “Voting Laws, Educational Policies, and
Minority Turnout.” Journal of Law and Economics 34 (October): 371–93.
Giammo, Joseph D., and Brian J. Box. 2010. "Reducing the Costs of Participation: Are States Getting a
Return on Early Voting." Political Research Quarterly 63 (2):295-303.
Hicks, William D., Seth C. McKee, Mitchell D. Sellers, and Daniel A. Smith. "A principle or a strategy?
Voter identification laws and partisan competition in the American States." Political Research
Quarterly (2014): 1065912914554039.
Hood, M. V., and Charles Bullock. 2012. "Much Ado About Nothing? An Empirical Assessment of the
Georgia Voter Identification Statute." State Politics and Policy Quarterly 12 (4):394-414.

34
Karp, Jeffrey A., and Susan A. Banducci. "Going postal: How all-mail elections influence turnout." Political
Behavior 22.3 (2000): 223-239.
Keele, Luke, and William Minozzi. 2013. “How Much is Minnesota like Wisconsin? Assumptions and
Counterfactuals in Causal Inference with Observational Data” Political Analysis 13:1-24.
Keyssar, Alexander. 2009. The Right to Vote: The Contested History of Democracy in the United States
Basic Books: New York
Kinder, Donald R., and Lynn M. Sanders. Divided by color: Racial politics and democratic ideals.
University of Chicago Press, 1996.
Kobach, Kris. 2011. "The Case for Voter ID." The Wall Street Journal, May 23.
Kousser, J. Morgan. 1999. Colorblind injustice: minority voting rights and the undoing of the Second
Reconstruction. Chapel Hill: The University of North Carolina Press.
Larocca, Roger, and John S. Klemanski. 2011. "US State Election Reform and Turnout in Presidential
Elections." State Politics and Policy Quarterly 11(1)76 (1):76-.
Leighley, Jan E., and Jonathan Nagler. Who Votes Now?: Demographics, Issues, Inequality, and Turnout in
the United States. Princeton University Press, 2013.
Lott, John. 2006. "Evidence of Voter Fraud and the Impact that Regulations to Reduce Fraud have on Voter
Participation Rates." report.
Lowry, Rich. 2014. "The Poll Tax That Wasn’t." Politico.
Manza, Jeff, and Christopher Uggen. "Punishment and democracy: Disenfranchisement of nonincarcerated
felons in the United States." Perspectives on Politics 2.03 (2004): 491-505.
Milyo, Jeffrey. 2007. "The Effects of Photographic Identification on Voter Turnout in Indiana." Institute of
Public Policy.
35
Mycoff, Jason, Michael Wagner, and David Wilson. 2009. "The Empirical Effects of Voter-ID Laws: Present
or Absent." PS (January).
Parker, Frank R. 1990. Black Votes Count: Political Empowerment in Mississippi after 1965. Chapel Hill:
University of North Carolina Press.
Pitts, Michael J. 2013. "Photo ID, Provisional Balloting, and Indiana's 2012 Primary Election." University of
Richmond Law Review 47 (3):939-57.
Rogowski, Jon C., and Cathy J. Cohen. 2014. "Black and Latino Youth Disproportionately Affected by Voter
Identification Laws in the 2012 Election." In Black Youth Project.
Shaw, Daron, Rodolfo O. de la Garza, and Jongho Lee. 2000. "Examining Latino Turnout in 1996: A Three-
State, Validated Survey Approach." American Journal of Political Science 44 (2 (April)):332-40.
Silver, Brian D., Barbara A. Anderson, and Paul R. Abramson. 1986. "Who Overreports Voting?" The
American Political Science Review 80:613-24.
Verba, Sidney, Kay Lehman Schlozman, and Henry E. Brady. 1995. Voice and Equality: Civic Voluntarism
in American Politics. Cambridge, MA: Harvard University Press.
Vercellotti, Timothy, and David Anderson. 2006. "Protecting the Franchise or Restricting It? The Effects of
Voter Identification Requirements on Turnout." American Political Science Association Conference.
Voting Rights Institute. 2015. "The Real Costs of Voter ID Laws." Voting Rights Institute.
Weiser, Wendy. 2014. "Voter Suppression: How Bad? (Pretty Bad)." New York: Brennan Center for Justice.
White, Ariel R., Noah L. Nathan, and Julie K. Faller. 2015. "What Do I Need to Vote? Bureaucratic
Discretion and Discrimination by Local Election Officials." American Political Science Review
(1):1-14.

36

37

38