voted the world’s best investment advisory · investment manager course, gold as an investment is...
TRANSCRIPT

By David Chapman
The gold standard was oncereferred to as a “barbarousrelic” by John MaynardKeynes, the “guru” of
many economists. In the CanadianInvestment Manager course, goldas an investment is barely men-tioned. Yet according to a study byWainwright Economics, a seven to15 per cent allocation of gold to aportfolio can pay dividends due toits low correlation to other assetclasses. According to the WorldGold Council, gold has a volatilityover the past 10 years of 15.8 percent, versus 41 per cent for oil and18.4 per cent for the S&P 500.
Gold is grossly under-repre-sented in Canadian (and Ameri-can) mutual- and pension-fundportfolios. It is estimated that thetotal value of the world’s stock andbond markets is roughly US$170trillion. Global GDP is estimated atUS$61 trillion. At US$1,250 an
ounce, the value of all the gold inthe world above the ground is esti-mated to be US$6 trillion. All thegold stocks in the world have amarket cap of roughly US$260 bil-lion, which is somewhat smallerthen Exxon Mobil (XOM-NYSE,$61.38), the world’s largest compa-ny by market capitalization.
If just one per cent of theUS$170 trillion of bonds and stocksoutstanding were shifted into gold,the $1.7 trillion could cause an ex-plosion in the price of gold as thereare insufficient gold stocks to han-dle even a small shift.
The rising price of gold reflectscontinuing mismanagement of theworld’s fiscal, monetary and cur-rency systems. For years, centralbanks and government treasuries— particularly in the U.S., Europeand Japan — have assured us thattheir paper currencies and frac-tional reserve banking systems canprotect us and keep the world’seconomies growing. For decades,
global growth has been built on abed of debt. But today, the world’seconomies are sinking into amorass of debt collapse. Years ofspeculation and over-indebted-ness have caught up to us, and onlya prolonged recession or a depres-sion will wipe out the excesses ofthe past 40 years.
There have been calls for a newworld currency, especially from theBRIC nations of Brazil, Russia, In-dia and China. This challenges thesupremacy of the U.S. dollar as the
RioCan Real Estate Invest-ment Trust (REI.UN-TSX,$22.84) is one of the oldestREITs in Canada and with
an enterprise value of approxi-mately $8.5 billion, it is the largest.RioCan has interests in over 250predominantly retail properties inCanada and the U.S., concentratedin the “Big Six markets” of Vancou-ver, Calgary, Edmonton, Toronto,Ottawa and Montreal. The majori-ty of these properties are powercentres, shopping centres and/orregional malls. RioCan is still runby founder, Ed Sonshine. In the in-terests of full disclosure I shouldmention that the Sentry Invest-ments owns quite a bit of RioCan.
The last five years have beenvery eventful for Canadian REITsand even more so for RioCan. OnOct. 31, 2006, the Department ofFinance unleashed the Tax Fair-ness Plan on Canadians, whichstrove to “level the playing field”between corporations and publiclytraded trusts by taxing the latterlike the former, beginning in 2011.REITs, as the globally recognizedstructure for owning publicly trad-ed real estate, were largely sparedthis treatment, provided they ulti-mately met several criteria.
For RioCan, the biggest hurdlewas the “passive income” test. It’sclear that the DOF wished for REITs
to become very passive, flow-through vehicles and not to engagein active business activities. Rio-Can’s business includes three activ-ities that put it offside in qualifyingas a REIT — providing mezzaninefinancing to developers, managingassets it does not own and sellingcompleted assets or interests in as-sets under development.
All three activities constitute“active business income” and thefact that more than five per cent ofRioCan’s revenue has historicallycome from these sources means itdoes not automatically qualify as aREIT. Fortunately, the solution tothis situation is simply to stop — ei-ther do less or none of these things.We feel confident that by 2011 Rio-
Can should qualify as a REIT.Next came RioCan’s long-tele-
graphed entry into the U.S. In 2007RioCan had announced that it wasexploring a transaction with Ramco-Gershenson Properties Trust. Con-sidering the timing, Ramco’s assetquality and locations (horrible, weakand challenged, respectively), thesubsequent decision not to go aheadwith this transaction constitutes oneof the best capital preservation deci-sions in the history of Canadianbusiness. However, RioCan had alsoserved notice that it fully intended toenter the U.S. market.
In September of 2009, RioCanannounced that it was enteringinto a joint venture with CedarShopping Centers Inc. The JV sawCedar initially contribute seven as-sets in which it would retain a 20per cent interest, while RioCancontributed capital to fund an 80per cent interest in the assets andthe JV. RioCan also took an ap-proximate 12 per cent interest inCedar through a private placementand has retained that equity own-ership level on a subsequent capi-tal raise by Cedar.
Now Cedar is not the strongestshopping centre REIT in the U.S., butits assets are generally unchallengedin their markets. The theory is that
RioCan REIT — how thebiggest just gets better
By Carlyle Dunbar
If the stock market risesthrough the coming seasonal-ly favorable months, where isthe leadership going to come
from? On Wall Street, the answerseems clear: utilities and telecom-munications. In Canada, the prob-abilities are not that clear-cut. Yes,utilities and telecoms are strength-ening, but materials (thank you,gold!) and consumer stocks arealso possible leaders.
Strength in utilities is a relief forme, because at the beginning of theyear my forecast included utilitiesas a likely surprise winner in bothmarkets this year. Mind you, theyare smallish sectors in both theU.S. and Canadian market indexes— seven per cent on Wall Street, sixper cent in Canada.
But utilities are not as small asthe health-care sector in Canada —it is a mere half of one per cent ofthe S&P/TSX composite index.Still, health care leads the parade.There are only four stocks in theTSX index, plus three more in theTSX’s subsidiary indexes. Notmuch variety, and a group thatmay run out of steam quickly.
On the negative side, you candelete energy from possible leader-
Why now is a good time to buy one of Canada’s oldest real estate in-vestment trusts and why it must expand into U.S. properties
ANALYTICAL INVESTING
Outperforming, underowned, will gold fly?
Continued on page 343
In our Sept. 10 issue,Sunil Vidyarthi ad-vised investors to puttheir money only in
good dividend-payingstocks. In this issue, heprovides an update to hisconservative, safe strate-gy. What prompts the up-date? Realization that thisstrategy has really caughton with most investorsand the outlook for inter-est rates. Sunil expectsrates will be forced higherby emerging markets tocurb their “out-of-controlgrowth.” He recommendsinvestors prepare to buybig U.S. players that willcater to that growth. Seehis short article on page345 on how best to deploythis strategy.
And while on the sub-ject of strategies, we canhardly wait to see markettimer extraordinaire KeithRichards’s next article,due in our next issue. Ifyou have been followinghim, you know he correct-ly predicted the market’sspring peak and advisedreaders to reduce their ex-posure to equities. After asummer rally, he said themarket would collapse inthe fall, giving investors agreat buying opportunity.So far so good, except themarket has shown littleinclination to stay withthe plan — the falling inthe fall part. Normally adreadful month for stocks,September, 22 days in,has been anything but.The summer rally contin-ues, and so does the sus-pense. Will the market falloff a cliff yet, or will it keepchugging along? Be sure tocatch Keith’s update.
FORECAST
Stocks thatwill lead the
markethigher
EDITOR’SNOTES
DENNISMITCHELL
Bullish sentiment among about 130 in-dependent advisories has jumped to41.4% from 33.3% in late September,while bears are down to 29.3% from32.2%. The percentage looking for acorrection is down to 29.3% from34.5%. The sentiment pie is a contraryindicator, based on the assumptionthat most advisers are followers ratherthan leaders. The more bulls countedthe more likely the market is to decline.Source: Investor’s Intelligence
THE SENTIMENT PIE
V O T E D T H E W O R L D ’ S B E S T I N V E S T M E N T A D V I S O R Y
October 8, 2010 Vol. 42, No. 18. Pages 341-360 $6.00
Continued on next page
Continued on page 343
Bulls41.4%
Unsure29.3%
Bears29.3%

342 / October 8, 2010 I N V E S T O R ’ S D I G E S T Issue 18 / 10
© Copyright 2010 by MPL Communications Inc.All rights reserved.
Customer Service416-869-1177
Editor Michael PopovichAssociate Editor
Phillip FineReporters
Jennifer SchenkelEditorial AssistantHeather Hugginson
ProductionRick Bender
Subscription Services Manager
Sher MohammadCirculation Manager
David BergerAdvertising Sales
(416) [email protected]
MPL Communications Inc.Stephen D. Pepper,
ChairmanBarrie Martland,
President
Investor’s Digest is publishedevery two weeks, 24 times a yearby MPL Communications Inc.,133 Richmond Street West, Toron-to, M5H 3M8. Subscription rate,Canada and U.S., one year $137.Single issue: $6. Tel. 416-869-1177, Fax 416-869-0456.
Investor’s Digest of Canadapresents opinions and recommen-dations deemed to be of interest toCanadian investors. Informationpresented herein, while obtainedfrom sources we believe reliable,is not guaranteed. The opinionsexpressed are strictly those of thewriters and are not necessarily en-dorsed by Investor’s Digest norindependently verified. Corre-spondents writing for Investor’sDigest may have an interest in theinvestments mentioned in theirstories. The directors, employeesand contributing editors of MPLCommunications Inc. may fromtime to time be beneficial ownersof the securities referred to in theInvestor’s Digest of Canada.
Investor’s Digest of Canadawelcomes company studies, indus-try surveys and other reports forpossible publication when submit-ted by analysts, brokers and indi-viduals. All material should besubmitted to the Editor. Investor’sDigest is not responsible for mate-rial sent for editorial consideration.
Investor’s Digest reports on in-vestments — it does not sell them.Neither the Digest nor MPL Com-munications Inc. has any connec-tion with any bank, brokerage orother financial institution.
Reproduction is allowed only onwritten permission. Informationpresented herein, while obtainedfrom sources we believe reliable, isnot guaranteed.
We acknowledge the financialsupport of the Government ofCanada through Canada MagazineFund toward our editorial costs.GST # R121844328.
Investor’s Digest of Canadawas voted the World’s Best Invest-ment Advisory by the Washington-based Newsletter and ElectronicPublishers Foundation in 2006 forthe fifth time.
Return undeliverable Canadianaddresses to MPL Communica-tions Inc., 700-133 Richmond St.W. Toronto ON M5H 3M8
Next issue Oct. 22
while the markets may not benefitfrom rapid population growth orhigh population density, the peoplein those markets still need to eat andfill their prescriptions. The marketstend to be overlooked by the largerU.S. competitors, allowing Cedar todominate in these smaller markets.The trade-off is long-term stabilityand resiliency at the loss of greatercash-flow growth.
Subsequently, RioCan has an-nounced a similar JV with InlandWestern Retail Real Estate TrustInc. and purchased assets fromPennsylvania Real Estate Invest-ment Trust. The JV with Cedar hasalso purchased another five assets.All told, RioCan now has interestsin 29 U.S. retail properties in sevenstates, with initial clusters in Penn-sylvania and Texas.
Pennsylvania is a surprisinglyrural state, with two large city cen-tres. As a result, many of RioCan’sassets in the state are located in ar-eas with low population density.This was our main concern with Ri-oCan’s Pennsylvania assets, how-ever, they were generally goodquality, newer assets with longlease terms. The trade-off for thedensity is little to no competitionfrom other retail assets and own-ers. Tenants are stable and un-spectacular but occupancy is highand very resilient, even during therecent downturn.
Houston is a very entrepreneuri-al city with almost no zoning limits.The result is miles and miles of na-tional, regional, local and mom-and-pop retail sites and stores thatat times seem to go on forever. Pop-ulation density is not an issue, butthe sheer volume of competition isa little scary. RioCan appears tohave done a good job selecting welllocated, well leased assets, but overtime, the question will be what kindof rent growth will be realized, giv-en the low barriers to entry.
Our overall assessment of theU.S. assets is that RioCan pur-chased stable, long-term cashflows with a low cost of capital.Since RioCan has no local marketexperience or leverage with thesetenants, the big risk is leasing. Rio-Can has mitigated this risk by al-lowing its JV partners and vendorsto retain management of the as-sets. We expect RioCan to eventu-ally build out a platform and attractsome capable people to this team.Most of its peers are still regroup-ing from the recession and talent-ed people will be attracted to agrowing, dynamic platform.
Questions
A number of people have ques-tioned RioCan’s ability to sourceproperties and compete in the U.S.Again, most of RioCan’s naturalcompetitors in the U.S. are still re-covering from the recession. Theyare still trying to recover occupan-cy and, in some cases, still need tosource capital to replace maturingdebt or JV-partner equity. One ofRioCan’s stronger competitors inthe U.S. is actually in the process ofdeleveraging from eight timesDebt/EBITDA to six times. Delever-aging on that scale is generally notcompatible with seeking out andpaying for quality assets.
Right now, RioCan has a strong
currency to make accretive acqui-sitions and a balance sheet that al-lows it to bulk up quickly. If oneassumes that the U.S. economy isgoing to experience a long, slow,uneven recovery, then RioCanshould have a few years to buildquality scale in the U.S. Given itsrapid pace of expansion so far, it’sclear that RioCan’s managementrealizes this and is moving quicklyto take advantage of this windowbefore it closes.
Now this discussion leads nice-ly into why RioCan is entering theU.S. RioCan has grown largeenough that to maintain its growthrate, it must buy and/or developlarge quantities of real estate.Canada no longer offers sufficientquality real-estate opportunitiesfor RioCan to do so. The abortedRamco transaction was the rightmove and subsequently the reces-sion created a number of opportu-nities for RioCan to enter the U.S.Many investors point to a Standard& Poor’s credit report as a catalyst,but clearly RioCan was interestedin the U.S. before this report.
Credit rating
On March 10, S&P, which ratesRioCan’s unsecured debentures,issued a ratings report that down-graded their outlook for RioCan,from stable to negative. The reportwas perceived by many investors,as a sign that RioCan would beforced to cut its distribution or S&Pwould cut its credit rating below in-vestment grade. This would imme-diately cause a spike in RioCan’scost of capital and derail the acqui-sition express. But the report actu-ally said that RioCan’s credit ratingwas affirmed, and that as long asdistributions were covered byfunds from operations (FFO) anddebt-service coverage (DSC) ap-proached 2.0 times (RioCan’s long-term average) by Q4 of 2010, Rio-Can’s credit rating would be main-tained. The report itself, is actuallyquite flattering to RioCan:
“Our ratings on Toronto-basedRioCan continue to acknowledgethe real estate investment trust’sleading position in the Canadianretail real estate market, and thestability of its shopping centreportfolio relative to those of its U.S.peers. RioCan’s occupancy re-mains high and the company’score cash flow has been steady.”
The potential downgrade re-volves around the fact that RioCanissued $253 million in equity and$330 million in debentures andhad not yet fully deployed all ofthat capital. The resulting dilutionbrought both FFO coverage andDSC ratios down below historicallevels. But exploring both of thesemetrics yields favorable findingsabout RioCan.
Most U.S. REITs utilize unse-cured debentures in their capitalstructure instead of mortgages.The advantages are fewer and larg-er debt securities and maturities,and generally no principal pay-ments. By utilizing mortgage fi-nancing, RioCan’s debt profile isactually more conservative, as itsmortgages require RioCan to paythe principal down as well. Now RioCan will almost certainly refi-nance the principal on maturityback up to 58 per cent and S&P ac-knowledges this:
“We estimate that the maturingmortgages are leveraged at an av-erage of about 40 per cent loan-to-value (based on a weightedaverage capitalization rate of 8.5per cent), and we expect the com-pany will refinance them with newmortgage debt.”
An 8.5 per cent cap was ex-tremely conservative, as the marketcap rate in March was likely closerto 7.5 per cent and now is probablycloser to 7.0 per cent. That meansthat the loan-to-value on the assetsis likely much less then 40 per centand RioCan can source significantcapital out of its portfolio just by re-financing these assets back to a 58per cent loan-to-value ratio, with4.5 per cent, five-year-mortgagedebt. Deploying that capital intoacquisitions at cap rates of 6.5 percent, or better, generates signifi-cant FFO growth.
Looking at Q4 of 2009, RioCan’sFFO declined by 25 per cent to $65million. Distributions of $82 millionyielded an FFO payout ratio of 125per cent. The decline in FFO was afunction of increased interest ex-pense of $15 million and a decreasein gains on sale of $7 million. S&Pcorrectly stated that the company’score cash flow was stable, as net op-erating income was flat at $118 mil-lion. So with an under-leveredbalance sheet and $156 million incash, all S&P’s report basically didwas point out that RioCan neededto deploy its excess capital to closeits distribution shortfall.
Distribution
The annualized distributionshortfall in Q4 of 2009 was $65 mil-lion. But after factoring in the dis-tribution-reinvestment plan, theactual cash-out-the-door shortfallwas $9 million. While RioCan willhave to borrow to finance theshortfall, which is never ideal, itssheer size, asset quality, balancesheet and strategy should allow itto grow into the distribution sometime in 2012.
If we look at RioCan’s latestquarter, Q2 of 2010, we see that RioCan has largely met S&P’s crite-ria to maintain its credit rating. Q2FFO was $93 million and distribu-tions were $84 million. Even strip-ping out gains on sales, FFO was$86 million. Debt-service coveragewas reported as 1.94 times (annu-alized) versus 1.75 times in Q1 and1.88 times in Q2 of 2009.
The improvement and steadyprogress is a direct result of RioCandeploying its excess capital accre-tively into $325 million of acquisi-tions, with $352 million inacquisitions announced. Not tomention that over the last sixmonths RioCan has leased up827,000 square feet of previouslyvacant space ($13 million of NOI)and renewed 1.9 million square feetat an average 10 per cent increasein net rents ($2.7 million of NOI).
In early August, RioCan dis-closed an acquisition pipeline of$500 million and then promptly ac-quired two Wal-Mart-anchoredcentres in Canada at a 6.7 per centcap rate and five more U.S. centresat a 7.9 per cent cap rate. RioCan’scost of capital is about 5.3 per cent(58 per cent long-term loan-to-val-ue ratio, 6.5 per cent AFFO yield onlast deal and 4.5 per cent cost ofdebt), making these acquisitions
very accretive and causing mostCanadian analysts to raise their tar-get price. If RioCan continues todeploy capital on these terms andcontinues to lease up and renew itsexisting assets at positive spreads,then eventually it will grow into itsdistribution. In the meantime, lookfor S&P to raise its outlook back tostable in early 2011 and for thestock to react favorably.
Dennis Mitchell, CFA, is the leadmanager of the Sentry REIT Fund,which has $550 million in assets
Why RioCan had to expand to the U.S.
❒ From time to time, we make our subscription listavailable to companies and organizations whoseproducts and services we believe may interest you.If you do not want your name to be made available,please check here and return with your mailing label.
IN THIS ISSUEAG Growth Int'l. .........................................350Agrium ........................................................349AlarmForce.................................................349Alliance Grain Traders ..............................350Andean Resources .....................................352Andina Minerals ........................................353Asia Bio-Chem Group ...............................353Athabasca Oil Sands..................................349Aura Minerals.............................................355Barrick Gold ...............................................344BCE.......................................................343,351Biovail .........................................................343BMG BullionFund .....................................343BMO Dow Jones Diamonds Index ETF...345Bombardier ................................................355Brigus Gold.................................................343C&D Technologies.....................................358Canadian Apartment
Properties REIT......................................359Canadian National Railway......................358Canadian Pacific Railway .........................358Canadian Western Bank ...........................352Cathay Forest Products.............................349Central Fund of Canada............................343CGI Group ..................................................349Claim Post Resources................................343CML Healthcare Income Fund ................343Consumers’ Waterheater
Income Fund .........................................358Descartes Systems Group .........................353Edleun Group.............................................351Emera..........................................................352Empire Co...................................................353Essential Energy Services..........................349Explor Resources .......................................343Exxon Mobil ...............................................341Fortis ...........................................................352Goldcorp..............................................349,355Harry Winston............................................356Iamgold.......................................................349IBM..............................................................359Imperial Oil ................................................354Kinross Gold...............................................359Laboratory Corp. .......................................357Lateegra Gold.............................................343Laurentian Bank of Canada......................352Legacy Oil ...................................................355Lockheed Martin .......................................357Market Vectors
Gold Miners ETF ............................358,359Market Vectors Junior
Gold Miners ETF....................................359McDonald's................................................357MDS ............................................................343Melkior Resources .....................................343Metals Creek Resources ............................343Microsoft ....................................................359Miranda Technologies ..............................351Moneta Porcupine Mines .........................343Monsanto ...................................................357NuVista Energy ..........................................353Paramount Gold and Silver ......................345Parkbridge Lifestyle Communities ..........351Pengrowth Energy Trust ...........................353Petrobank Energy ......................................354Phillips-Van Heusen..................................357Quest Capital..............................................350Rare Element Resources ...........................359Red Back Mining........................................359Reitmans (Canada)....................................359Reliable Energy ..........................................349Renegade Petroleum.................................353RioCan Real Estate Investment Trust......341Rogers Communications ..........................343Rolling Rock Resources.............................358Royal Bank..................................................354Second Wave Petroleum...........................356SPDR Dow Jones Industrial
Average ETF ...........................................345St. Andrews Goldfields ..............................343Sun Life Financial ......................................352SunOpta......................................................356Supreme Resources...................................358SXC Health Solutions ................................343The Forzani Group ....................................354Toronto-Dominion Bank..........................344Torstar.........................................................352Tranzeo Wireless .......................................351Trilogy Energy Corp. .................................352Tuscany Int'l. Drilling................................354U.S. Geothermal ........................................356United Natural ...........................................357Valeant Pharmaceuticals ..........................343Vermilion Energy Trust.............................359VG Gold.......................................................343WestJet Airlines..........................................349Wild Stream Exploration...........................356Yamana Gold..............................................344Yellow Pages Income Fund ......................359Yoho Resources..........................................355
Continued from front page

Issue 18 / 10 I N V E S T O R ’ S D I G E S T October 8, 2010 / 343
ship. The sector in both theU.S. and Canada is startingto fall behind the market.
To cut potential leader-ship slices a little finer, inCanada the pharmaceuti-cal/biological group andautos are currently thestrongest “industry groups.”
In the consumer durables sec-tor, relative strength of consumerdurables/apparel and hotels/restaurants/leisure is improving.In the financial sector, real estate isstrong. The final group to note istransport.
On Wall Street, among thelargest industries in Standard andPoor’s 500 composite index, thosewith the greatest improvement inrelative strength are electric utili-ties, multi-utilities and integratedtelecom services.
Releative strength
Other major U.S. industriesshowing strong improvement inrelative performance are restau-rants, cable and satellite services,soft drinks, railways and air freight.
Why my emphasis on improvedrelative strength? Because a stockor group with superior or rising rel-ative strength is likely to continueto provide superior results for in-vestors. Expected time frame forsuperior results from the industriesand sectors named above: aboutsix months.
As for the broad market index-es, the barrier to an extended risein Canada is the 12,000 level on theTSX composite index. This price
range was an obstacle inthe market’s rise in 2005-06 and supported themarket at the 2007-08highs. The index startedthe new business year inSeptember near 11,900.
The U.S. picture is sim-ilar, with the 1200 level ofthe S&P 500 composite in-
dex offering overhead resistancebased partly on its 2006 lows.
These barriers might be piercedquickly if the market still had risingprice momentum. There was greatmomentum in the rise from thelows of early 2009 — the S&P 500gained 50 per cent in the 12 monthsended February, and the TSX com-posite gained 42 per cent in thesame period. Now that momentumis waning, just as the momentum ofearnings is slackening.
Strong showing of Canada’s mi-nuscule health-care sector hides avariety of reasons why:
• Biovail Corp. (BVF-TSX,$27.46) is the biggie in health care,rising because of its forthcomingmerger with Valeant Pharmaceu-ticals (VRX-NYSE, $64.60). Valeantwill be the surviving corporation,retaining Biovail’s corporate struc-ture. In 2009, each firm had about$830 million in revenue.
• MDS Inc. (MDS-TSX, $10.50)is a shell of its original self, and willchange its name to Nordion Inc. toreflect the new focus on medicalimaging. A $450 million share buy-back helped the stock. Sharehold-ers equity has been cut by abouttwo thirds, while long-term debthas been cut 82 per cent.
• CML Healthcare IncomeFund (CLC.UN-TSX $11.20) has
rallied after sliding from above $14this year. The income trust willconvert to a corporation, in ad-vance of the end of the favored taxstatus of income trusts. CML saysits annual dividend as a corpora-tion will be $0.7548 per share, or 30per cent below the current distri-bution rate.
• SXC Health Solutions (SXC-TSX, $39.63) is a U.S. drug-benefitsmanager and health-care informa-tion technology provider, rated oneof the U.S.’s fastest growing compa-nies. It is dual listed in New York andToronto. SXC planning a two-for-one stock split, the shares havingrisen eight times since 2005 (when itwas known as Systems Xcellence).
Given the uncertainties aboutU.S. business prospects as a resultof the Obama administration’s del-uge of taxes (Ben Bernanke, theFed head, says the economic out-look is “unusually uncertain”), in-vestor movement into utilities andtelecom stocks is understandable.Big first-half earnings gains by BCE(BCE-TSX, $33.46) and RogersCommunications (RCI.B-TSX,$38.46) add to the encouragement.
Meantime, there is one solidly
bullish sector — gold.Junior exploration mining and
oil stocks proliferate like fruit flies,and they have a life expectancy notmuch longer. So it is unusual —that’s an understatement — to finda penny stock celebrating its 100thbirthday this fall. Moneta Porcu-pine Mines (ME-TSX, $0.21) is thecompany. In the 1938-42 it was aproducer, located almost in down-town Timmins, Ont. The companypaid $1.5 million in dividends then— or about $20 million in today’smoney. The company’s market cap-italization now is only $27 million.
Active for a century
Unsurprisingly, for a companyactive in the area for a century,Moneta has built up a land positionover 10 per cent of the Porcupine-Destor fault zone between Tim-mins and the Quebec boundary.Moneta’s current focus is about 90kilometres east, down Highway 101on a 10,000-hectare spread it callsGolden Highway. Recent drilling inthe spread’s Windjammer Southarea has indicated a new gold veinzone about 500 metres below the
mineralization originally outlinedby Barrick Gold. This contains anestimated 517,000 ounces of gold,indicated and inferred.
Moneta’s neighbors in that areainclude producers St. AndrewsGoldfields (SAS-TSX. $1.64) andBrigus Gold (BRD-TSX, $1.47), re-cently formed by merger of ApolloGold and Linear Gold.
The Timmins-Porcupine areahas been the country’s largest goldproducing camp. Mining compa-nies have zoomed in on the arealike so many mosquitoes at a sum-mer camp. I have counted 16 ex-ploring in the area. That’s exclud-ing Moneta, Lake Shore Gold (withits West Timmins discovery) andGoldcorp, the big operator in thearea. And I have surely missedsome names.
The extreme west end of the250-kilometre-long Abitibi green-stone belt has attracted the great-est interest. The Porcupine-Destorfault, which runs through theAbitibi greenstone, is the axis onwhich most gold discoveries havebeen made. And it pushes well westof Timmins. Companies of imme-diate interest there includeM e l k i o r R e s o u r c e s ( M K R -TSX,VEN, $0.21), Metals Creek Re-sources (MEK-TSX/VEN, $0.13),Lateegra Gold (LRG-TSX/VEN,$0.41), Explor Resources (EXS-TSX/VEN, $0.58), VG Gold (VG-TSX, $0.42) and Claim Post Re-sources (CPS-TSX/VEN, $0.15).
Lake Shore (a stock I own) isone of the 10 stocks in this col-umn’s model all-Canadian goldportfolio by virtue of its big discov-ery. The nearby table updates dataon the 10 stocks.
Stocks, sectors that will lead the fall rally
world’s reserve currency.The U.S. now has debtnearly equal to its GDPand a budget deficit in ex-cess of 10 per cent of GDP.Central banks holdingU.S. Treasury securities intheir reserves are nervousabout the declining value of thedollar and the resultant erosion ofthe value of their reserves. Many,including China, India and Russia,have increased their holdings ofgold, and a survey by the Swissbanking giant UBS cited gold asbeing the best performing assetthat many central banks can own.
For the year to Aug. 31,gold was up 31 per centversus a gain of 2.8 percent for the S&P 500 and12.8 per cent for 30-yearU.S. Treasurys (plus a sixper cent coupon). Over thepast decade, gold is up 446per cent versus a loss of30.9 per cent for the S&P
500 and a gain of 35.9 per cent for30-year U.S. Treasurys (plus thecoupon). Yet gold remains grosslyunderowned in portfolios.
Gold has a low correlation toother assets. According to a study bythe World Gold Council, the averagecorrelation of gold to governmentand corporate bonds, world equities
and REITs ranged from 10 to 30 percent. The correlation of gold to theS&P Goldman Sachs commodity in-dex (GSCI), a production-weightedbenchmark index, was 31 per cent,although the range was from 10 percent to almost 50. Silver had thestrongest correlation to gold. Thebest correlation is with the U.S. dol-lar at 60 per cent.
Years of speculation andoverindebtedness have
caught up to us, and onlya prolonged recession ordepression will wipe outthe excesses of the past
40 years.
Gold’s lack of correlation withother assets shows up in its funda-mentals of demand and supply.Two-thirds of the demand (68 percent) comes from consumption ofgoods (primarily jewelry from In-dia and other Asian countries),with 20 per cent as investment de-mand and the remaining 12 per-cent coming from industrial use.
On the supply side, only 60 percent comes from mine production,which has been in decline over thepast several years. Of the rest, 28per cent comes from recycling and12 per cent from official-sectorsales. But as with mine production,
the official sector (primarily centralbanks) has been in decline. Morerecently central banks have be-come buyers rather than sellers.
Given gold’s performance overthe past decade, its low correlationto other assets and volatility lowerthan other assets, its absence inmoney-managers’ portfolios is baf-fling. Perhaps the scant attention itis given in courses on portfoliomanagement is a factor?
Products offering gold as an in-vestment have become quite nu-merous as the price of gold hasrisen. Ten years ago, the only avail-able product to investors was Cen-tral Fund of Canada (CEF.A-TSX,$16.67), a closed-end fund invest-ing in gold and silver and a smallportion in quality gold stocks. YetCEF.A can trade at premiums ordiscounts to its net asset value, de-pending on whether it is a rising orfalling market. That is because, as aclosed-end fund trading on thestock market, it is limited by its out-standing shares.
In 2002, Bullion ManagementGroup introduced the BMG Bul-lionFund (formerly the Millenni-um BullionFund), an open-endedmutual fund investing in gold, sil-ver and platinum. There is also theBMG Gold BullionFund. The BMGfunds always trade at NAV andwhen investors buy the fund theyare buying the bullion, as opposedto a closed-end fund where you are
buying a piece of paper (stock) thathappens to own bullion. The BMGfunds deal directly into the bullionmarket, which is one of the largestmarkets in the world. (Note: I am adirector of Bullion ManagementGroup, the manager of the BMGfunds.)
Over the years, we have seenthe arrival of numerous exchange-traded funds and a few otherclosed-end funds that all tradebased on the price of gold or silver.Some hold gold and silver whileothers are derivative-based. All arestocks trading on an exchange andall are limited by their number ofshares outstanding. They can tradeat premiums and discounts to theirNAV. Some ETFs are aimed moreat traders than investors, such asthe Horizon Beta Pro funds whichare leveraged to the marketthrough the use of derivatives. Oth-ers such as the Claymore andSprott funds do hold bullion.(Note: Horizon Beta Pro is a relat-ed company to MGI Securities).
But despite a proliferation ofbullion products in recent years,gold (as well as silver) remainsgrossly underowned, despite itsclear outperformance. To many,gold is still a barbarous relic.
David Chapmnan is an investmentadviser and technical strategist atMGI Securities Ltd. [email protected].
Outperforming, underowned, gold could fly
TSX Market Recent Yearticker cap price to date
(million) change %Detour Gold Corp. DGC $2,554 $30.96 73Kirkland Lake Gold KGI $555 $8.20 -8Lake Shore Gold LSG $1,392 $3.70 -10PC Gold PKL $64 $1.16 81Premier Gold PG $584 $5.70 36Queenston Mining QMI $287 $4.21 -24Rubicon Minerals RMX $882 $4.13 -17San Gold SGR-v $1,066 $3.55 -3Virginia Mines VGQ $219 $7.24 39Wesdome Gold WDO $269 $2.67 16
Continued from front page
Carlyle Dunbar
Continued from front page
11.010.510.09.59.08.58.07.57.0
6.5
6.0
1.7
1.6
1.5
1.4
1.3
1.2
1.1
2005 A J O 2006 A J O 2007 A J O 2008 A J O 2009 A J O 2010 A J
BMG Bullion Fund
Central Fund BMG Bullion Fund Ratio
David Chapmn

344 / October 8, 2010 Issue 18 / 10
INSIDETRACK
WHAT’S HOT, WHAT’S NOT
LEADING EDGE
I N V E S T O R ’ S D I G E S T
MORNING CALL
“The gambling known as businesslooks with austere disfavor upon
the business known as gambling.”
— Ambrose Bierce
“If writers were such goodbusinessmen, they’d have too muchsense to be writers.”
— Irwin S. Cobb
WHAT’S HOT, WHAT’S NOTWHAT’S HOT, WHAT’S NOT
Take heed, you jewellers, scaredy-catinvestors, central bankers and allyou others who now lust for gold.Peter Munk is riding to the rescue.
Mr. Munk is founder, chairman and guid-ing light of Barrick Gold Corp. (ABX-TSX,$48.43), the biggest producer of the lustrousyellow metal in the world.
And his company recently announced itwill produce nine million ounces of goldover the next five years.
Indeed, Barrick is expecting productiongrowth from three mines it’s now develop-ing: Puebelo Viejo in the DominicanRepublic, Cerro Casale in Chile and PascuaLama on the Chilean-Argentinian border.
Other Barrick properties, such asGoldstrike and Cortez Hills, both in Nevada,could also buoy Barrick’s output, notes BrianMacArthur, a Toronto-based analyst withUBS Investment Research.
Mr. MacArthur notes that Barrick’s targetisn’t the biggest in gold mining in terms ofpercentage. But he admits it’s a meaningfulnumber for a company of Barrick’s size.
Not surprisingly, he’s keeping Barrickpegged at “buy,” while boosting his 12-month price target to US$60 from US$57.
He’s also boosting his estimate ofBarrick’s net asset value to US$46.09 from$44.22 a share.
Our market watchers echoed Mr.MacArthur in his admiration for Barrick
this month.Of the 10 other folks we surveyed, seven
rated it a buy; two, a buy/hold; and only onea hold, lofting the company into fourth placein our list of top-10 stocks to own.
Meanwhile, Barrick continues to do well,having dug up second-quarter net earningsof US$783 million, or $0.77 a share — a year-over-year jump of 59.1 per cent.
Sales were also higher, jumping 30 percent to $2.6 billion, while adjusted netincome rose 76.1 per cent to $759 million.
For the six months ended June 30,Barrick’s net income grew to US$1.5 billion,or $1.52 a share, from $863 million, or $0.84a share, for the similar period in 2009.
Sales were up as well, climbing 40.5 percent to $5.2 billion, while adjusted netincome more than doubled to $1.5 billion.
Besides churning out eight millionounces of gold yearly, Barrick is a player
in other metals markets, with six billionpounds of copper deposits to its name.
The company leapt to the top of the gold-mining heap — ahead of Newmont Miningand AngloGold Ashanti — after swallowingPlacer Dome, a Canadian rival, in 2006.
Although a global player with operationsin both Australia and Africa, as well as inSouth and Central America, Barrick sourcesone-third of its total production in Canadaand the United States.
Barrick wasn’t the only precious metalplay this month that caught the attention ofour analysts.
They also stopped to look at YamanaGold Inc. (YRI-TSX, $11.42), a senior pro-ducer based in Toronto.
Of the 13 folks we polled, 10 rated thecompany a buy and only three, a hold, loft-ing Yamana into no. 2 position in our list ofmust-have stocks.
And Yamana is raking in the cash, havingheaped up second-quarter net income
of US$90.8 million, or $0.12 a share — a YOYjump of 845.8 per cent!
Sales were also higher, rising 48.5 per centto $351.4 million, while operating earningsjumped 71.8 per cent to US$100.5 million.
For the six months ended June 30,Yamana’s net income rose to US$170.3 mil-lion, or $0.23 a share, from $95.6 million, or$0.13 a share, for the similar period in 2009.
Revenue, too, presented a brighter pic-ture, jumping to $697.7 million from $450.3million, while operating earnings grew to$195.9 million from $103 million.
But sales costs, as might be expected,increased, deepening to minus $280.8 mil-lion from minus $206.8 million.
Depletion, depreciation and amortiza-tion also grew — to minus $138.2 millionfrom minus $95.8 million.
With roughly 19 million ounces of provedand probable gold reserves, Yamana pro-duces nearly one million ounces of the yel-low metal every year.
The company, whose mines are locatedin Argentina, Brazil and Chile, also producesboth copper and silver.
STRONGEST RECOMMENDATIONS THIS MONTH
BUY, SELL AND HOLD ADVICE, PLUS EARNINGS ESTIMATES, ON MORE THAN 1,000 CANADIAN COMPANIES
Our analysts also coin a ‘buy’ for Toronto-Dominion Bank
Arise Technologies Corp. APV 4 0 0 1 1 2Timminco Ltd. TIM 3 0 0 0 2 1Royal Host REIT RYL.UN 3 0 0 0 2 1Gabriel Resources Ltd. GBU 3 0 0 0 3 0Westport Innovations Inc. WPT 5 0 0 2 2 1Gaz Metro L.P. GZM.UN 5 0 0 2 3 0Kingsway Financial Services KFS 2 0 0 0 2 0Husky Energy Inc. HSE 8 0 0 5 2 1St Andrew Goldfields Ltd. SAS 1 0 0 0 0 1Whitemud Resources Inc. WMK 1 0 0 0 0 1
Based on our buy, sell, hold advice for more than 1,000 Canadian companies, the stocks on the left have gained themost ‘buy’ recommendations. Those on the right are less favored.
Cdn. Natural Resources Ltd. CNQ 12 11 0 1 0 0Yamana Gold Inc.* YRI 13 10 0 3 0 0Talisman Energy Inc. TLM 12 10 0 2 0 0Barrick Gold Corp.* ABX 11 8 2 1 0 0Suncor Energy Inc. SU 11 9 0 2 0 0Toronto-Dominion Bank TD 10 9 0 1 0 0Arc Energy Trust AET.UN 10 9 0 1 0 0Goldcorp Inc.* G 12 7 2 3 0 0Cenovus Energy Inc.* CVE 12 8 0 4 0 0Gran Tierra Energy Inc.* GTE 12 7 2 3 0 0
TIME TO BUY# Buy Hold
Company Sym. Analysts Buy Hold Hold Sell Sell
TIME TO SELL# Buy Hold
Company Sym. Analysts Buy Hold Hold Sell Sell
Mining heavyweight seeksto meet demand for gold
Get Morning Call’s analysisand advice on 1,000
companies in 3 easy steps1. Go to our web site DailyBuySellAdviser.com2. Click on “Special Reports” in the navigation
bar at the top of the page.3.Click on “Morning Call” for the latest advice
from brokers across Canada,
Walk down 13thAve., the maindrag of BoroughPark, a bustling
enclave of Orthodox Jewry inBrooklyn, New York City.
Stop at 46th St. and lookaround you. No, you aren’tdreaming. That is the TD logo.And that is a branch of theToronto-Dominion Bank (TD-TSX, $74.36).
Yes, here in the heart of oneof the most densely populatedChassidic Jewish communitiesin the world, you’ll find an out-post of Canadian finance, theresult of TD’s purchase over thelast few years of two mid-sizedAmerican banks.
Nor is Toronto-Dominionin the U.S. limited to the side-walks of New York.
The Green Machine nowboasts 1,100 retail branchesfrom Maine down through themid-Atlantic states toWashington, D.C. and Florida.
Toronto-Dominion is alsowell represented in the “I-need-money-right-away” col-umn, with 2,700 automatedteller machines in the U.S.
TD, not surprisingly, is a bigplayer on its home turf as well,with more than 1,100 branchesacross Canada.
The company, like other bigbanks, also boasts a broad foot-print in retail brokerage, wealthmanagement, foreign exchangeand investment banking.
Our analysts cashed in onTD this month. Of the 10 wepolled, nine rated it a buy andonly one, a hold, giving TD sixthplace in our list of top-10 buys.
Of course, not every analystout there is sold on TD.
F o r e x a m p l e , P e t e rRozenberg, a Toronto-basedanalyst with UBS InvestmentResearch, is keeping Toronto-Dominion pegged at “neutral.”
He’s also sticking with his12-month price target of $79,while cutting his net earningsestimate by one per cent.
For its third quarter, TDcoined net income of $1.43 ashare — $0.04 below Mr.Rozenberg’s estimate, as well as$0.01 below the consensus call.
The poorer showing reflectslower wholesale revenue, alongwith higher corporate segmentexpenses, says the analyst.
But he does note that TD’spersonal and commercial linesremained strong, rising 24 percent, while at $339 million, itsprovision for credit losses wasdown 31 per cent year over year.
INSIDETRACK
P H I L L I P F I N E

344-a / October 8, 2010 Issue 18 / 10
Continued on next page
BUY, SELL, HOLD ADVICE — PLUS EARNINGS ESTIMATESFOR APPROXIMATELY 1,000 CANADIAN COMPANIES
BUY, SELL, HOLD ADVICE — PLUS EARNINGS ESTIMATESFOR APPROXIMATELY 1,000 CANADIAN COMPANIES
CANADIAN COMPANIES: Earnings per share
I N V E S T O R ’ S D I G E S T
MORNING CALL
Recommendations Consensus EstimatesFiscal # Buy Hold Latest Current Next
Company Sym. Year-end Analysts Buy Hold Hold Sell Sell EPS Year Year
Recommendations Consensus EstimatesFiscal # Buy Hold Latest Current Next
Company Sym. Year-end Analysts Buy Hold Hold Sell Sell EPS Year Year
20-20 Technologies Inc.* TWT Oct.2010 2 1 - 1 - - 0.14 0.18 0.275N Plus Inc. VNP May.2011 8 4 3 1 - - 0.32 0.40 -Aastra Technologies Ltd. AAH Dec.2010 3 2 - 1 - - 3.20 2.63 3.44Absolute Software Corp. ABT Jun.2011 7 2 1 3 1 - -0.18 -0.01 -Acadian Timber Corp. ADN Dec.2010 3 1 - 2 - - 0.30 0.47 0.50Ace Aviation Holdings Inc. ACE.A Dec.2010 2 - - 2 - - -19.56 - -Active Control Tech. Inc. ACT Jul.2010 1 - 1 - - - -0.04 - -ADF Group Inc. DRX Jan.2011 3 2 1 - - - 0.19 0.25 0.35Aecon Group Inc. ARE Dec.2010 3 2 1 - - - 0.80 0.80 1.22Aeroquest Int'l. Ltd. AQL Sep.2010 1 1 - - - - -0.31 -0.22 0.10Aeterna Zentaris Inc.* AEZ Dec.2010 4 2 1 1 - - -0.43 -0.37 -Ag Growth Int'l Inc. AFN Dec.2010 4 3 - 1 - - 3.45 2.45 3.05AGF Management Ltd. AGF.B Nov.2010 4 - - 3 1 - 1.09 1.36 1.57Agnico-Eagle Mines Ltd.* AEM Dec.2010 12 5 3 4 - - 0.55 1.74 2.32Agrium Inc.* AGU Dec.2010 8 6 - 2 - - 2.33 4.31 5.57Ainsworth Lumber Co. Ltd. ANS Dec.2010 1 - - - 1 - -0.22 -0.55 -0.62Air Canada AC.A Dec.2010 8 5 - 3 - - -0.18 -0.62 0.33Akita Drilling Ltd. AKT.A Dec.2010 1 - - 1 - - 0.46 0.28 0.49Alamos Gold Inc.* AGI Dec.2010 11 6 2 3 - - 0.52 0.67 0.88Alaris Royalty Corp. AD Dec.2010 2 1 - 1 - - 1.83 0.78 0.85AlarmForce Industries Inc. AF Oct.2010 1 1 - - - - 0.31 0.39 0.44Alexco Resource Corp. AXR Jun.2010 2 - 2 - - - -0.24 - -Algonquin Power & Utilities Corp. AQN Dec.2010 6 3 - 2 1 - 0.39 0.25 0.35Alimentation Couche-Tard Inc.* ATD.B Apr.2011 7 5 - 2 - - 1.29 1.69 1.90Allana Potash Corp. AAA Jul.2010 2 1 1 - - - -0.02 - -Alliance Grain Traders Inc. AGT Dec.2010 3 3 - - - - 2.74 2.50 3.42Allied Nevada Gold Corp.* ANV Dec.2010 4 2 - 2 - - 0.13 0.39 0.52Allon Therapeutics Inc. NPC Dec.2010 3 1 1 1 - - -0.09 -0.10 -0.10Alter Nrg Corp. NRG Dec.2010 3 1 1 1 - - -0.34 -0.17 0.06Altius Minerals Corp. ALS Apr.2011 1 - - - - - 0.97 -0.03 -Amerigo Resources Ltd.* ARG Dec.2010 1 - - 1 - - 0.00 - -Amica Mature Lifestyles Inc. ACC May.2011 2 1 1 - - - -0.25 - -Anatolia Minerals Development* ANO Dec.2010 5 3 - 2 - - -0.28 -0.22 0.29Andean Resources Ltd.* AND Jun.2010 4 2 - 2 - - -1.58 -0.02 -0.01Andina Minerals Inc.* ADM Dec.2010 3 - - 3 - - -0.02 - -Angiotech Pharmaceuticals* ANP Dec.2010 2 - - 1 - - -0.27 -0.01 -Anooraq Resources Corp. ARQ Dec.2010 2 2 - - 1 - -0.12 -0.07 -Antares Minerals Inc. ANM Jan.2011 3 3 - - - - -0.06 -0.20 -0.14Antioquia Gold Inc. AGD Mar. 2011 1 - 1 - - - -0.02 - -Anvil Mining Ltd.* AVM Dec.2010 3 3 - - - - -0.22 -0.15 0.94Aptilon Corp. APZ Dec.2010 1 - 1 - - - -0.02 -0.03 -Aquila Resources Inc. AQA Dec.2010 1 - 1 - - - -0.01 - -Arise Technologies Corp. APV Dec.2010 4 - - 1 1 2 -0.32 -0.07 -Asia Bio-Chem Group Corp. ABC Dec.2010 3 3 - - - - 0.03 0.22 0.29Astral Media Inc. ACM.A Aug.2010 5 3 - 2 - - -2.82 3.04 3.24Atco Ltd. ACO.X Dec.2010 1 - - 1 - - 4.89 4.75 -Athabasca Potash Inc. API Dec.2010 4 - 1 3 - - -0.30 -0.38 -Atlantic Power Corp.* ATP Dec.2010 4 - - 2 2 - 1.09 0.85 0.96Atrium Innovations Inc.* ATB Dec.2010 4 4 - - - - 1.47 1.65 1.84ATS Automation ATA Mar.2011 5 4 - 1 - - 0.35 0.44 0.61AuEx Ventures Inc.* XAU Jun.2010 1 1 - - - - -0.26 -0.26 -0.24Augusta Resource Corp.* AZC Dec.2010 3 1 2 - - - -0.06 - -Aura Minerals Inc. ORA Dec.2010 5 4 1 - - - -0.23 0.11 0.41Aurizon Mines Ltd. ARZ Dec.2010 7 4 1 2 - - 0.23 0.23 0.37AutoCanada Inc. ACQ Dec.2010 1 1 - - - - 0.63 0.60 -Avanti Mining Inc. AVT Dec.2010 1 1 - - - - - - -Avcorp Industries Inc. AVP Dec. 2010 1 - - - - - -0.09 -0.04 -0.01Avion Gold Corp. AVR Dec.2010 2 1 1 - - - 0.06 0.02 0.17Axia NetMedia Corp. AXX Jun.2010 3 2 - 1 - - 0.09 0.01 0.09Azure Dynamics Corp. AZD Dec.2010 2 2 - - - - -0.07 -0.03 -0.02B2Gold Corp.* BTO Dec.2010 3 2 1 - - - -0.12 - -Baffinland Iron Mines Corp. BIM Dec.2010 3 - 1 2 - - 0.00 - -Baja Mining Corp. BAJ Dec.2010 1 1 - - - - -0.06 - -Ballard Power Systems Inc. BLD Dec.2010 3 1 1 - 1 - -0.47 -0.29 -0.15Bank of Montreal BMO Oct.2010 10 4 - 6 - - 3.08 4.71 5.15Bank of Nova Scotia BNS Oct.2010 7 3 - 3 1 - 3.31 3.85 4.05Bannerman Resources Ltd. BAN Jun.2010 2 - - 2 - - -0.06 - -Barkerville Gold Mines Ltd. BGM Feb.2011 1 - 1 - - - -0.30 - -Barrick Gold Corp.* ABX Dec.2010 11 8 2 1 - - -4.73 2.92 3.28BCE Inc. BCE Dec.2010 9 4 1 3 1 - 2.11 2.73 2.87Bear Creek Mining Corp.* BCM Dec.2010 3 1 - 2 - - -0.15 -0.10 -Bennett Environmental Inc. BEV Dec.2010 2 - 2 - - - 0.55 0.36 0.34BioExx Specialty Proteins Ltd. BXI Dec.2010 3 1 2 - - - -0.06 -0.08 0.04Bioteq Environmental Tech. Inc. BQE Dec.2010 2 - 1 1 - - -0.08 - -Biovail Corp. BVF Dec.2010 6 4 1 1 - - 1.50 1.79 1.70Biox Corp. BX Sep.2010 1 1 - - - - - - -Black Diamond Group Ltd. BDI Dec.2010 4 3 - 1 - - 1.54 1.11 1.41BMTC Group Inc. GBT.A Dec.2010 1 - - 1 - - 2.45 2.79 2.89Bombardier Inc.* BBD.B Jan.2011 10 7 - 2 1 - 0.39 0.37 0.41Boralex Inc. BLX Dec.2010 7 6 - 1 - - 0.65 0.66 0.89Breakwater Resources Ltd. BWR Dec.2010 5 3 1 1 - - 0.00 0.87 0.49Bridgewater Systems Corp. BWC Dec.2010 5 5 - - - - 0.44 0.52 0.58Brookfield Asset Mgt. Inc.* BAM.A Dec.2010 5 5 - - - - 0.71 - -Brookfield Properties Corp. BPO Dec.2010 7 6 - 1 - - 0.72 1.31 1.19
Cabo Drilling Corp. CBE Jun.2010 1 - 1 - - - -0.02 -0.03 0.01Cadillac Ventures Inc. CDC May.2011 1 - 1 - - - -0.06 - -Cae Inc. CAE Mar.2011 7 5 - 1 1 - 0.56 0.67 0.94Calfrac Well Services Ltd. CFW Dec.2010 8 7 - 1 - - -0.14 0.71 1.57Calian Technologies Ltd. CTY Sep.2010 1 1 - - - - 2.11 - -Calmena Energy Services Inc. CEZ Dec.2010 3 2 1 - - - -0.07 0.02 0.06Cameco Corp. CCO Dec.2010 8 2 - 6 - - 2.82 1.08 1.06Canaccord Financial Inc. CF Mar.2011 1 - - 1 - - 0.69 0.66 0.96Canaco Resources Inc. CAN Jun.2010 1 1 - - - - -0.05 - -Canada Bread Co. Ltd. CBY Dec.2010 1 1 - - - - 3.05 3.47 -Canada Fluorspar Inc. CFI Dec.2010 2 1 1 - - - 0.01 - -Canada Lithium Corp. CLQ Dec.2010 1 - 1 - - - - - -Cdn. Energy Services & Tech. CEU Dec.2010 3 2 - 1 - - 0.66 1.44 1.86Cdn. Imp. Bank of Commerce CM Oct.2010 9 3 - 6 - - 2.65 6.33 6.86Cdn. National Railway Co. CNR Dec.2010 10 3 2 5 - - 3.92 3.89 4.51Cdn. Pacific Railway Ltd. CP Dec.2010 10 6 1 2 - 1 3.67 3.52 4.33Cdn. Satellite Radio Holdings* XSR Aug.2010 2 - - 2 - - -0.84 -0.98 -Cdn. Tire Corp. Ltd. CTC.A Dec.2010 9 4 - 4 1 - 4.10 4.60 5.21Cdn. Utilities Ltd. CU Dec.2010 3 2 - 1 - - 3.71 3.32 3.31Cdn. Western Bank CWB Oct.2010 6 3 - 3 - - 1.47 1.84 1.94Canam Group Inc. CAM Dec.2010 5 1 1 3 - - 0.44 0.54 0.56Candente Copper Corp.* DNT Dec.2010 1 1 - - - - -0.02 - -CanElson Drilling Inc. CDI Dec.2010 1 1 - - - - -0.01 0.10 0.19Canfor Corp. CFP Dec.2010 5 3 - 1 1 - -0.50 0.15 0.08Cangene Corp. CNJ Jul.2010 2 2 - - - - 0.86 0.69 -Cantronic Systems Inc. CTS Jan.2011 1 - 1 - - - -0.01 - -CanWel Building Materials Group Ltd. CWX Dec.2010 1 1 - - - - 0.43 - -Canyon Services Group Inc. FRC Dec.2010 5 5 - - - - -0.42 0.28 0.47Capital Gold Corp. CGC Jul.2010 1 1 - - - - 0.05 0.23 0.41Capital Power Corp. CPX Dec.2010 4 1 - 2 1 - 1.59 1.30 -Capstone Mining Corp.* CS Dec.2010 5 2 1 2 - - -0.10 0.60 0.42Cardiome Pharma Corp. COM Dec.2010 6 3 - 3 - - -0.02 0.32 -0.30Caribbean Utilities Co. Ltd.* CUP.U Dec.2010 1 - - 1 - - 0.67 0.68 0.72Carmanah Technologies Corp. CMH Dec.2010 3 2 - 1 - - -0.02 0.00 0.05Carpathian Gold Inc.* CPN Dec.2010 1 - 1 - - - -0.02 - -Cascades Inc. CAS Dec.2010 6 6 - - - - 1.13 0.72 0.95Catalyst Paper Corp. CTL Dec.2010 5 1 - 1 3 - -0.01 -0.25 -0.16Catch the Wind Inc.* CTW Dec.2010 3 2 1 - - - -0.24 -0.25 -0.18Cathay Forest Products Corp. CFZ Dec.2010 3 2 - 1 - - -0.03 0.07 0.09Cathedral Energy Services Ltd. CET Dec.2010 5 4 - 1 - - 0.15 0.56 0.72CCL Industries Inc. CCL.B Dec.2010 1 1 1.74 2.12 2.56Celestica Inc.* CLS Dec.2010 3 - - 3 - - -3.41 0.89 0.96Centamin Egypt Ltd.* CEE Jun.2011 4 3 - 1 - - 0.01 0.13 -Centerra Gold Inc.* CG Dec.2010 6 3 - 2 - - 0.27 1.01 0.83Cervus Equipment Corp. CVL Dec.2010 7 6 - 1 - - 1.19 0.94 1.54CGA Mining Ltd.* CGA Jun.2010 1 1 - - - - -0.05 0.13 0.33CGI Group Inc. GIB.A Sep.2010 9 3 - 6 - - 1.02 1.15 1.30Changfeng Energy Inc. CFY Dec.2010 1 1 - - - - 0.02 - -China Wind Power Int'l Corp. CNW Mar.2011 1 1 - - - - -0.10 - -Churchill Corp. The CUQ Dec.2010 3 2 1 - - - 1.98 1.99 2.15CI Financial Corp. CIX Dec.2010 5 2 - 3 1 - 1.01 1.14 1.36Claude Resources Inc. CRJ Dec.2010 3 2 - 1 - - -0.06 0.02 0.10Clifton Star Resources Inc. CFO Jun.2010 1 1 - - - - - - -Cline Mining Corp. CMK Nov.2010 1 - 1 - - - -0.13 -0.08 0.04Cluff Gold plc* CFG Dec.2010 1 - - 1 - - -0.30 0.14 -Coastal Contacts Inc. COA Oct.2010 1 1 - - - - 0.05 0.09 0.12Coeur d'Alene Mines Corp.* CDM Dec.2010 5 3 - 1 1 - 0.02 0.37 1.27Cogeco Cable Inc. CCA Aug.2010 6 3 - 3 - - -5.29 2.19 2.77Cogeco Inc. CGO Aug.2010 2 - - 1 - - -4.69 2.44 2.46Colabor Group Inc. GCL Dec.2010 4 1 1 2 - - 1.06 0.95 1.10Colossus Minerals Inc. CSI Jul.2010 2 1 1 - - - -0.11 - -COM DEV Int'l. Ltd. CDV Oct.2010 3 1 - 2 - - 0.21 0.27 0.41Commercial Solutions Inc. CSA Sep.2010 1 - - - 1 - -1.19 - -Computer Modelling Group CMG Mar.2011 2 1 - 1 - - 0.79 0.91 0.88ConjuChem Biotechnologies Inc. CJB Oct.2010 1 - - 1 - - -0.06 - -Cons. Thompson Iron Mines Ltd. CLM Dec.2010 7 4 1 2 - - -0.12 0.67 1.22Constellation Software Inc.* CSU Dec.2010 5 1 - 4 - - 2.95 3.56 4.03Continental Gold Ltd. CNL Dec.2010 1 1 - - - - - - -Contrans Group Inc. CSS Dec.2010 5 3 1 1 - - 0.77 0.62 0.71Copper Mountain Mining Corp. CUM Dec.2010 5 4 1 - - - -0.03 -0.03 0.37Coro Mining Inc.* COP Dec.2010 2 2 - - - - 0.00 - -Corus Entertainment Inc. CJR.B Aug.2010 6 2 1 3 - - -0.71 1.66 1.83Cott Corp.* BCB Jan.2011 1 1 - - - - 1.08 - -Creston Moly Corp. CMS Jul.2010 2 1 1 - - - -0.04 - -CRH Medical Corp.* CRM Dec.2010 2 - - 2 - - -0.09 - -Crocodile Gold Corp.* CRK Dec.2010 2 1 1 - - - -0.27 - -CVTech Group Inc. CVT Dec.2010 1 - - 1 - - 0.05 0.11 0.13Cyberplex Inc. CX Dec.2010 1 1 - - - - 0.11 - -D-Box Technologies Inc. DBO.A Mar.2011 4 3 1 - - - -0.06 -0.04 0.03Dalsa Corp. DSA Dec.2010 3 3 - - - - 0.03 0.72 0.98Davie Yards Inc.* DAV Dec.2010 1 1 - - - - - - -Day4 Energy Inc. DFE Dec.2010 1 1 - - - - -0.56 -0.21 0.01DDS Wireless Int'l. Inc. DD Dec.2010 2 2 - - - - -0.16 0.30 0.40Denison Mines Corp.* DML Dec.2010 5 1 - 3 1 - -0.51 -0.06 -0.04

Descartes Systems Group Inc.* DSG Jan.2011 3 2 - 1 - - 0.25 0.15 0.16Destiny Resource Services Corp. DSC Dec.2010 1 1 - - - - 0.20 0.27 0.44Detour Gold Corp. DGC Dec.2010 7 6 1 - - - -0.78 - -DHX Media Inc. DHX Jun.2010 2 1 - 1 - - 0.01 -0.01 0.05DiagnoCure Inc. CUR Oct.2010 2 2 - - - - -0.30 -0.15 -Diamonds North Resources Ltd. DDN Dec.2010 1 - 1 - - - -0.04 - -Discovery Air Inc. DA.A Jan.2011 1 1 - - - - 0.00 0.02 -Distinction Group Inc. DG Dec.2010 1 1 - - - - 0.20 0.23 0.25Dollarama Inc. DOL Jan.2011 6 5 1 - - - 1.37 1.61 1.70Domtar (Canada) Paper Inc.* UFX Dec.2010 1 1 - - - - 1.09 6.20 7.23Domtar Corp.* UFS Dec.2010 6 4 - 2 - - 1.11 7.51 6.13Dorel Industries Inc.* DII.B Dec.2010 4 3 - 1 - - 0.73 3.69 3.97DragonWave Inc. DWI Feb.2011 7 1 - 4 1 - 0.90 0.59 0.49Duluth Metals Ltd. DM Dec.2010 1 - 1 - - - -0.11 - -Dundee Precious Metals Inc. DPM Dec.2010 2 1 1 - - - 0.05 0.37 0.90DundeeWealth Inc. DW Dec.2010 2 2 - - - - 0.35 0.55 0.80Dynasty Metals & Mining Inc. DMM Dec.2010 2 - 2 - - - -0.23 - -East Asia Minerals Corp. EAS Aug.2010 1 - - 1 - - -0.14 -0.06 -Eastern Platinum Ltd.* ELR Dec.2010 6 6 - - - - 0.01 0.03 -easyhome Ltd. EH Dec.2010 2 1 - 1 - - 0.55 1.06 1.19ECU Silver Mining Inc. ECU Dec.2010 1 - 1 - - - -0.03 - -EGI Financial Holdings Inc. EFH Dec.2010 2 1 - 1 - - 0.36 1.20 -Eldorado Gold Corp.* ELD Dec.2010 12 4 3 5 - - 0.26 0.34 0.65Electrovaya Inc.* EFL Sep.2010 1 1 - - - - -0.01 -0.03 -0.07Emera Inc. EMA Dec.2010 7 3 - 4 - - 1.56 1.54 1.56Empire Co. Ltd. EMP.A May.2011 5 4 - 1 - - 4.16 4.58 4.99Enablence Technologies Inc. ENA Apr.2011 1 - - 1 - - -0.11 -0.04 -Enbridge Inc. ENB Dec.2010 8 3 - 5 - - 2.37 2.62 2.84Endeavour Silver Corp.* EDR Dec.2010 1 1 -0.06 0.41 0.48Energold Drilling Corp. EGD Dec.2010 2 2 - - - - -0.06 0.13 0.39Energy Fuels Inc. EFR Sep.2010 1 - 1 - - - -0.13 - -Enseco Energy Services Corp. ENS Mar.2011 1 - 1 - - - -0.21 -0.01 0.06Ensign Energy Services Inc. ESI Dec.2010 8 4 1 3 - - 0.82 0.90 1.23Equinox Minerals Ltd.* EQN Dec.2010 8 3 2 3 - - -0.27 0.38 0.63Equitable Group Inc. ETC Dec.2010 5 2 - 3 - - 3.36 3.28 3.76Espial Group Inc. ESP Dec.2010 1 1 - - - - -0.29 -0.15 -Essential Energy Services Ltd. ESN Dec. 2010 2 2 - - - - -0.16 0.03 0.11Estrella Int'l Energy Services Ltd. EEN Dec. 2010 1 - 1 - - - - - -European Goldfields Ltd.* EGU Dec.2010 3 3 - - - - -0.07 -0.15 0.01Evertz Technologies Ltd. ET Apr.2011 7 3 - 4 - - 0.83 1.02 1.19Excellon Resources Inc. EXN Dec.2010 1 1 - - - - - - -Exchange Income Corp. EIF Dec.2010 1 1 - - - - 1.63 - -Exco Technologies Ltd. XTC Sep.2010 2 2 - - - - -0.43 0.22 0.29Exeter Resource Corp. XRC Dec.2010 2 1 - 1 - - -0.51 - -Exfo Inc. EXF Aug.2010 3 2 - 1 - - -0.27 0.23 0.38Extorre Gold Mines Ltd. XG Dec.2010 1 - 1 - - - - - -Extract Resources Ltd. EXT Jun.2010 1 1 - - - - -0.09 -0.10 -Fairfax Financial Holdings Ltd.* FFH Dec.2010 3 2 - 1 - - 43.75 37.61 41.94Far West Mining Ltd. FWM Dec.2010 1 1 - - - - -0.11 -0.18 -0.14Farallon Mining Ltd.* FAN Dec.2010 3 1 - 1 - - -0.04 0.12 0.15Fibrek Inc. FBK Dec.2010 2 - - 1 1 - - 0.11 0.03Finning Int'l. Inc. FTT Dec.2010 9 5 1 3 - - 0.77 0.90 1.34First Capital Realty Inc. FCR Dec.2010 6 3 1 1 1 - 0.45 - -First Majestic Silver Corp. FR Dec.2010 1 - - 1 - - 0.08 0.56 0.69First Quantum Minerals Ltd. FM Dec.2010 8 5 - 2 1 - 6.14 9.51 11.38First Uranium Corp.* FIU Mar.2011 4 1 - 2 1 - -0.56 -0.18 -FirstService Corp.* FSV Dec.2010 3 1 - 2 - - -1.87 2.00 2.25
Fission Energy Corp. FIS Jun.2010 1 1 - - - - -0.22 - -Flint Energy Services Ltd. FES Dec.2010 3 1 2 - - - 1.01 0.91 1.09Foraco Int'l. SA* FAR Dec.2010 3 3 - - - - 0.24 0.17 0.33Formation Metals Inc. FCO Feb.2011 1 - 1 - - - -0.14 -0.15 -Forsys Metals Corp. FSY Dec.2010 1 - 1 - - - -0.06 - -Fortis Inc. FTS Dec.2010 8 4 4 - - 1.51 1.65 1.76Fortress Paper Ltd. FTP Dec.2010 5 5 - - - - 1.23 1.44 2.13Fortuna Silver Mines Inc.* FVI Dec.2010 4 2 1 1 - - 0.62 0.28 -Forzani Group Ltd. FGL Jan.2011 4 4 - - - - 0.94 1.29 1.50Franco-Nevada Corp.* FNV Dec.2010 6 3 - 3 - - 0.76 0.52 0.53Franconia Minerals Corp.* FRA Sep.2010 2 - 2 - - - -0.02 - -Fronteer Gold Inc. FRG Dec.2010 4 2 1 1 - - 0.13 -0.11 -0.12Gabriel Resources Ltd. GBU Dec.2010 3 - - - 3 - -0.09 -0.04 -Gammon Gold Inc. GAM Dec.2010 9 1 1 7 - - 0.01 0.47 0.59Garda World Security Corp. GW Jan.2011 2 2 - - - - -1.12 0.84 1.00Gemini Corp. GKX Dec.2010 1 - - 1 - - 0.00 - -GeneNews Ltd. GEN Dec.2010 1 - - 1 - - -0.09 - -General Moly, Inc.* GMO Dec.2010 3 - 1 1 1 - -0.12 -0.12 -0.10Genesis Land Development GDC Dec.2010 1 1 - - - - 0.15 - -Genesis Worldwide Inc. GWI Dec.2010 1 - - 1 - - -0.29 - -Gennum Corp.* GND Nov.2010 2 1 - - 1 - -0.07 0.27 0.36Genworth MI Canada Inc. MIC Dec.2010 3 3 - - - - 3.30 2.86 3.12George Weston Ltd. WN Dec.2010 6 - - 6 - - 0.55 3.47 4.09Gildan Activewear Inc.* GIL Sep.2010 9 8 - 1 - - 0.79 1.58 1.94Glacier Media Inc. GVC Dec.2010 4 2 1 1 - - 0.15 0.27 0.31Glentel Inc. GLN Dec.2010 1 1 - - - - 1.45 - -GLG Life Tech Ltd. GLG Dec.2010 2 1 - 1 - - 0.04 0.15 0.56Globestar Mining Corp.* GMI Dec.2010 5 3 2 - - - 0.02 0.22 0.16Gluskin Sheff + Associates Inc. GS Jun.2010 5 4 - 1 - - 0.73 1.44 1.56GLV Inc. GLV.A Mar.2011 6 4 - 2 - - -0.31 0.52 0.54GMP Capital Inc. GMP Dec.2010 2 - - 2 - - 0.59 0.84 1.10Gold Reserve Inc.* GRZ Dec.2010 1 - - - 1 - -2.89 - -Gold Wheaton Gold Corp.* GLW Dec.2010 2 1 - 1 - - 0.02 - -Goldcorp Inc.* G Dec.2010 12 7 2 3 - - 0.33 1.16 1.80Golden Star Resources Ltd.* GSC Dec.2010 6 1 - 5 - - 0.70 0.17 0.26Grande Cache Coal Corp. GCE Mar.2011 4 4 - - - - 0.20 1.06 -Grayd Resource Corp. GYD Aug.2010 1 - 1 - - - -0.03 - -Great Basin Gold Ltd. GBG Dec.2010 3 1 - 2 - - -0.16 - -Great Cdn. Gaming Corp. GC Dec.2010 7 6 - 1 - - 0.28 0.37 0.49Great-West Lifeco Inc. GWO Dec.2010 5 2 1 2 - - 1.72 2.05 2.39Grey Horse Corp. GHC Dec.2010 2 1 1 - - - 0.36 0.41 0.72Greystar Resources Ltd. GSL Dec.2010 5 - 2 3 - - -0.43 -0.20 -0.24Groupe Aeroplan Inc. AER Dec.2010 10 6 1 3 - 1 0.45 0.91 1.09Guardian Capital Group Ltd. GCG.A Dec.2010 1 1 - - - - 0.41 0.45 0.47Guestlogix Inc. GXI Nov.2010 4 4 - - - - 0.00 0.04 0.09Guyana Goldfields Inc. GUY Oct.2010 2 2 - - - - -0.11 - -H2O Innovation Inc. HEO Jun.2010 1 - - 1 - - 0.00 -0.07 -0.05Hammond Power Solutions HPS.A Dec.2010 1 1 - - - - 0.82 1.08 1.31Hana Mining Co. HMG Oct.2010 4 2 2 - - - -0.05 - -Hanfeng Evergreen Inc. HF Jun.2010 7 4 - 3 - - 0.64 0.48 0.67Hanwei Energy Services Corp. HE Mar.2011 2 1 - 1 - - -1.08 -0.02 -Harry Winston Diamond Corp.* HW Jan.2011 5 2 - 3 - - -0.99 0.15 0.53Hathor Exploration Ltd. HAT Mar.2011 4 2 2 - - - -0.09 -0.09 -0.02Hemisphere GPS Inc.* HEM Dec.2010 3 3 - - - - -0.11 -0.09 0.07Héroux-Devtek Inc. HRX Mar.2011 5 3 1 1 - - 0.52 0.51 0.65High Liner Foods Inc. HLF Dec.2010 3 3 - - - - 1.07 1.35 1.46Homburg Invest Inc. HII.B Dec.2010 1 - - 1 - - -12.51 - -
Issue 18 / 10 October 8, 2010 / 344-b
BUY, SELL, HOLD ADVICE — PLUS EARNINGS ESTIMATESFOR APPROXIMATELY 1,000 CANADIAN COMPANIES
BUY, SELL, HOLD ADVICE — PLUS EARNINGS ESTIMATESFOR APPROXIMATELY 1,000 CANADIAN COMPANIES
I N V E S T O R ’ S D I G E S T
MORNING CALL
CANADIAN COMPANIES: Earnings per share
Recommendations Consensus EstimatesFiscal # Buy Hold Latest Current Next
Company Sym. Year-end Analysts Buy Hold Hold Sell Sell EPS Year Year
Recommendations Consensus EstimatesFiscal # Buy Hold Latest Current Next
Company Sym. Year-end Analysts Buy Hold Hold Sell Sell EPS Year Year
CANADIAN COMPANIES: Earnings per share
Cdn. Energy Services & Tech. CEU Dec.2010 3 2 - 1 - - 0.66 1.44 1.86
Cdn. Imp. Bank of Commerce CM Oct.2010 9 3 - 6 - - 2.65 6.33 6.86
Cdn. National Railway Co. CNR Dec.2010 10 3 2 5 - - 3.92 3.89 4.51
Cdn. Pacific Railway Ltd. CP Dec.2010 10 6 1 2 - 1 3.67 3.52 4.33
Our comprehensive tables of analysts recommendations and earnings estimatesfor approximately 1,000 Canadian companies appear in every other edition ofInvestor’s Digest. They allow you to compare current estimates for net earningsper share, cash flow per share for oil and gas stocks and distributions per unit
for income trusts in this fiscal year and the next.The tables include the company name, stock symbol, date of the next fiscal
year-end and the number of analysts covering that stock. Analysts use a wide varietyof terms to define their recommendations. We have simplified these into specific, easy-to-follow categories — buy, buy/hold, hold/sell or sell. (The number of analysts surveyedmay be greater than the number of recommendations because some analysts may pro-vide earnings estimates without a specific recommendation.)
Latest EPS shows what the company actually reported for its last fiscal year-end, with adjustments for splits and consolidations. Current Year and Next Year showthe analysts’ estimated earnings for this fiscal year and the next. These consensus es-timates are the average of all estimates from the analysts surveyed.
Earnings per share, cash flow per share and distribution per unit play vitalroles in fundamental analysis. A high earnings per share prediction means dividendsmay increase or, at least, continue, while a negative or declining one shows manage-ment may be hard pressed to continue paying dividends.
Continued on next page
Number of analysts surveyed.
Recommendations identifiedin five easy-to-follow categories
Earnings pershare at lastfiscal year-end
StockSymbolCurrent fiscal year-end* U.S. dollars
Earnings per shareestimated forcurrent year
Earnings per shareestimated for next year
Buy Buy/Hold Hold Hold/Sell Sell
HOW TO READ THE TABLES

Home Capital Group Inc. HCG Dec.2010 6 5 1 - - - 4.15 5.10 5.62Homeq Corp. HEQ Dec.2010 3 1 1 1 - - -0.13 0.54 0.89Horizon North Logistics Inc. HNL Dec.2010 3 2 1 - - - 0.05 0.10 0.16HSE Integrated Ltd. HSL Dec.2010 1 - 1 - - - -0.18 - -HudBay Minerals Inc. HBM Dec.2010 8 5 2 1 - - 0.73 0.87 1.63Hydrogenics Corp.* HYG Dec.2010 1 - - 1 - - -2.54 -0.23 -IAMGOLD Corp.* IMG Dec.2010 11 6 1 4 - - 0.60 0.80 1.00Iberian Minerals Corp. IZN Dec.2010 5 5 - - - - -0.81 0.06 0.28IC Potash Corp. ICP Dec.2010 2 1 1 - - - -0.09 - -iCo Therapeutics Inc. ICO Dec.2010 1 1 - - - - -0.08 -0.15 -IESI-BFC Ltd.* BIN Dec.2010 4 3 - 1 - - 0.63 0.81 1.16IGM Financial Inc. IGM Dec.2010 4 3 - - 1 - 2.12 2.82 3.23Imax Corp.* IMX Dec.2010 1 1 - - - - 0.09 0.91 1.09ImmunoVaccine Technologies Inc. IMV Dec.2010 1 1 - - - - -0.05 -0.14 -0.18Imris Inc. IM Dec.2010 4 3 1 - - - -0.33 0.06 0.29Imvescor Restaurant Group Inc. IRG Oct.2010 1 - - 1 - - - 0.34 -Inca Pacific Resources Inc. IPR Nov.2010 1 - - 1 - - -0.10 - -Indigo Books & Music Inc. IDG Mar.2011 3 2 1 - - - 1.39 1.35 1.50Industrial Alliance IAG Dec.2010 5 1 - 4 - - 2.55 3.67 4.63Inmet Mining Corp. IMN Dec.2010 10 5 2 4 - - 5.13 5.95 7.03Innergex Renewable Energy Inc. INE Dec.2010 6 2 1 3 - - -0.65 0.23 0.30Intact Financial Corp. IFC Dec.2010 5 3 - 2 - - 1.06 3.67 4.13Inter-Citic Minerals Inc. ICI Nov.2010 1 - 1 - - - 0.05 - -Intermap Technologies Corp.* IMP Dec.2010 1 - 1 - - - -0.51 - -Int'l. Datacasting Corp. IDC Jan.2011 1 - 1 - - - -0.06 -0.03 -Int'l. Forest Products Ltd. IFP.A Dec.2010 6 4 - 2 - - -0.51 -0.11 0.21Int'l. Minerals Corp.* IMZ Jun.2011 2 2 - - - - - 0.29 0.31Int'l. Tower Hill Mines Ltd. ITH May.2011 2 1 1 - - - - -0.09 -Int'l. Water-Guard Industries Inc. IWG Sep.2010 1 1 - - - - 0.01 0.00 0.01Intrinsyc Software Int'l. Inc.* ICS Dec.2010 1 - - 1 - - -0.02 -0.01 -Iroc Energy Services Corp. ISC Dec.2010 1 - - 1 - - -0.24 0.03 0.09ISE Ltd. ISE Dec. 2010 1 1 - - - - -0.79 -0.80 -0.26Iseemedia Inc. IEE Jun.2010 1 - 1 - - - -0.10 -0.04 0.00Ivanhoe Mines Ltd.* IVN Dec.2010 3 1 1 - 1 - -0.72 - -iWeb Group Inc. IWB Sep.2010 1 - 1 - - - 0.00 0.03 0.07Jaguar Mining Inc.* JAG Dec.2010 3 2 - 1 - - -0.10 0.06 0.82JDS Uniphase Canada Ltd.* JDU Jun.2011 1 1 - - - - 0.41 0.80 0.91Jean Coutu Group* PJC.A Feb.2011 4 2 - 2 - - 0.48 0.78 0.85Katanga Mining Ltd.* KAT Dec.2010 3 - - 2 - 1 -0.09 0.09 0.17Keegan Resources Inc. KGN Mar.2011 2 1 1 - - - -0.18 - -Killam Properties Inc. KMP Dec.2010 7 3 1 3 - - -0.05 - -Kimber Resources Inc. KBR Jun.2010 1 - - 1 - - -0.04 -Kingsway Financial Services KFS Dec.2010 2 - - - 2 - -5.38 -0.30 -Kinross Gold Corp.* K Dec.2010 12 7 - 5 - - 0.44 0.69 0.90Kirkland Lake Gold Inc. KGI Apr.2011 3 2 - 1 - - -0.20 0.33 1.08La Mancha Resources Inc. LMA Dec.2010 1 - 1 - - - 0.08 - -Lab Research Inc. LRI Dec.2010 2 - - 2 - - -0.39 -0.11 -Labopharm Inc. DDS Dec.2010 4 3 - 1 - - -0.46 -0.40 -Labrador Iron Mines Holdings Ltd. LIM Mar.2011 2 1 1 - - - 0.03 0.15 1.23Lake Shore Gold Corp. LSG Dec.2010 7 5 - 2 - - 0.01 0.01 0.18Laramide Resources Ltd. LAM Dec.2010 1 1 - - - - -0.23 -0.04 -Laurentian Bank of Canada LB Oct.2010 5 1 - 4 - - 4.23 4.36 4.71Le Château Inc. CTU.A Jan.2011 1 1 - - - - 1.22 1.34 -Leon's Furniture Ltd. LNF Dec.2010 1 1 - - - - 0.78 0.85 0.91Linamar Corp. LNR Dec.2010 4 3 - 1 - - 0.02 1.15 1.65Lithium One Inc. LI Dec.2010 1 - 1 - - - -0.09 - -Loblaw Companies Ltd. L Dec.2010 7 4 - 2 1 - 2.39 2.49 2.72Lucara Diamond Corp. LUC Jul.2010 1 - 1 - - - -0.03 - -lululemon athletica inc.* LLL Jan.2011 3 1 - 2 - - 0.82 1.18 -Lumina Copper Corp. LCC Sep.2010 1 1 - - - - -0.04 - -Lundin Mining Corp. LUN Dec.2010 7 5 1 1 - - 0.13 0.51 0.50Lydian Int'l Ltd. LYD Dec.2010 1 1 - - - - - - -MacDonald, Dettwiler & Assoc. MDA Dec.2010 6 5 - 1 - - 2.67 3.14 3.62Mag Silver Corp. MAG Dec.2010 3 2 1 - - - -0.27 - -Magellan Aerospace Corp. MAL Dec.2010 4 1 - 1 2 - 0.60 0.21 0.27MagIndustries Corp.* MAA Dec.2010 5 - 3 2 - - -0.17 -0.05 -0.07Magma Energy Corp.* MXY Jun.2010 6 5 1 - - - -0.03 -0.03 0.01Magma Metals Ltd. MMW Jun.2010 1 - - - - - - -Magna Int'l. Inc.* MG Dec.2010 5 4 - 1 - - -4.41 5.21 6.70Mainstreet Equity Corp. MEQ Sep.2010 4 2 1 1 - - -0.26 - -Major Drilling Group Int'l. MDI Apr.2011 3 2 - - - 1 -0.02 1.47 3.21Manitoba Telecom Services MBT Dec.2010 7 1 - 4 1 1 1.57 2.15 2.34Mantra Resources Ltd. MRL Jun.2010 1 1 - - - - -0.21 -0.18 -Manulife Financial Corp. MFC Dec.2010 7 4 - 3 - - 0.82 1.75 2.09Maple Leaf Foods Inc. MFI Dec.2010 4 3 - 1 - - 0.40 0.79 0.96Marathon PGM Corp. MAR Dec.2010 1 - 1 - - - -0.08 - -March Networks Corp. MN Apr.2011 2 - - 2 - - -1.88 -0.45 -Marsulex Inc. MLX Dec.2010 2 1 - 1 - - 1.02 0.78 0.92Martinrea Int'l. Inc. MRE Dec.2010 2 2 - - - - -0.05 0.87 1.50Maxim Power Corp. MXG Dec.2010 1 - - 1 - - 0.04 - -MBAC Fertilizer Corp. MBC Jul.2010 2 1 1 - - - 0.01 -0.20 -0.01McCoy Corp. MCB Dec.2010 1 1 - - - - -0.50 0.10 0.26MDC Partners Inc.* MDZ.A Dec.2010 1 1 - - - - -0.67 -0.17 0.86MDS Inc.* MDS Oct.2010 3 - - 3 - - -1.12 -0.26 -
Mediagrif Interactive Tech. Inc. MDF Mar.2011 3 2 - 1 - - 0.18 0.49 0.62Medicago Inc. MDG Dec.2010 2 1 1 - - - -0.13 0.05 0.03Medipattern Corp. MKI Jun.2010 2 2 - - - - -0.10 0.06 0.09Medwell Capital Corp. MS Dec.2010 1 - - 1 - - 0.03 - -Mega Brands Inc.* MB Dec.2010 1 - - - 1 - 0.29 -0.03 -Mercator Minerals Ltd.* ML Dec.2010 4 2 2 - - - -0.13 -0.04 0.22Mercer Int'l. Inc.* MRI.U Dec.2010 3 3 - - - - -2.32 - -MetalCorp Ltd. MTC Dec.2010 1 1 - - - - -0.03 - -Methanex Corp.* MX Dec.2010 5 4 - - 1 - 0.01 1.60 2.80MethylGene Inc. MYG Dec.2010 1 - 1 - - - -0.63 - -Metro Inc. MRU.A Sep.2010 7 4 1 2 - - 3.23 3.42 3.72Microplanet Technology Corp.* MP Dec.2010 1 1 - - - - -0.12 - -Migao Corp. MGO Mar.2011 8 6 2 - - - 0.79 0.78 0.90Minco Silver Corp. MSV Dec.2010 2 2 - - - - -0.13 - -Minefinders Corp. Ltd.* MFL Dec.2010 5 2 3 - - - -0.07 0.83 1.67Minera Andes Inc.* MAI Dec.2010 1 - 1 - - - 0.02 - -Mineral Deposits Ltd.* MDM Jun.2010 2 1 - 1 - - -0.44 - -Mirabela Nickel Ltd.* MNB Jun.2010 5 3 1 1 - - -0.06 -0.16 0.07Miranda Technologies Inc. MT Dec.2010 6 3 - 3 - - 0.24 0.32 0.59MKS Inc.* MKX Apr.2011 2 - - 2 - - 1.23 0.75 -Moly Mines Ltd.* MOL Jun.2010 1 - - 1 - - -0.48 -0.16 -Morguard Corp. MRC Dec.2010 1 1 - - - - 2.16 - -Mosaid Technologies Inc. MSD Apr.2011 4 4 - - - - 2.04 2.53 2.78Mountain Province Diamonds Inc. MPV Dec.2010 1 1 - - - - - - -MTY Food Group Inc. MTY Nov.2010 1 1 - - - - 0.64 0.75 0.83Mullen Group Ltd. MTL Dec.2010 5 3 - 2 - - 1.10 0.81 1.08Multiplied Media Corp. MMC Dec.2010 2 2 - - - - -0.04 - -Mustang Minerals Corp. MUM Dec.2010 2 - 1 1 - - 0.00 - -Naikun Wind Energy Group Inc. NKW Sep.2010 1 - - 1 - - -0.30 - -National Bank of Canada NA Oct.2010 10 4 - 4 1 - 4.94 6.05 6.43Neo Material Technologies Inc.* NEM Dec.2010 4 4 - - - - 0.17 0.40 0.43Nevada Geothermal Power Inc.* NGP Jun.2011 3 1 1 1 - - - - -Nevsun Resources Ltd.* NSU Dec.2010 1 - 1 - - - -0.04 - -New Gold Inc.* NGD Dec.2010 9 4 - 5 - - -0.04 0.18 0.28New Millennium Capital Corp. NML Dec.2010 2 1 1 - - - -0.02 - 0.06Newalta Corp. NAL Dec.2010 4 3 - 1 - - 0.07 0.65 0.86Newfoundland Capital Corp. Ltd. NCC.A Dec.2010 2 - - 1 - 1 0.45 0.38 -Newmont Mining Corp.* NMC Dec.2010 7 3 - 4 - - 2.66 4.22 4.66Norbord Inc.* NBD Dec.2010 6 5 - - 1 - -1.35 0.43 0.74Noront Resources Ltd. NOT Apr.2011 2 - 1 1 - - -0.06 -0.09 -0.09Norsat Int'l. Inc.* NII Dec.2010 1 1 - - - - 0.08 0.06 -Norsemont Mining Inc. NOM Jun.2010 1 1 - - - - - - -North Amer. Energy Partners Inc. NOA Mar.2011 4 2 - 1 1 - 0.77 0.90 0.67North American Palladium Ltd. PDL Dec.2010 1 1 - - - - -0.29 - -Northern Dynasty Minerals Ltd. NDM Dec.2010 2 1 1 - - - -0.14 - -Northgate Minerals Corp.* NGX Dec.2010 5 2 1 2 - - -0.19 0.14 0.13Northland Resources SA NAU Jan.2011 1 - - 1 - - -0.05 - -Northstar Aerospace Inc.* NAS Dec.2010 3 3 - - - - 0.12 0.24 0.34Novadaq Technologies Inc.* NDQ Dec.2010 3 2 - 1 - - -0.61 -0.28 -0.27NovaGold Resources Inc. NG Nov.2010 1 - - - 1 - -0.42 - -Omni-Lite Industries Canada* OML Dec.2010 1 1 - - - - 0.05 0.21 0.31Oncolytics Biotech Inc. ONC Dec.2010 3 3 - - - - -0.33 -0.31 -Onex Corp.* OCX Dec.2010 4 2 1 1 - - 0.92 2.00 2.73Open Text Corp.* OTC Jun.2011 8 5 1 2 - - 1.53 3.41 4.33Orbit Garant Drilling Inc. OGD Jun.2010 2 2 - - - - 0.38 0.34 0.55Orezone Gold Corp.* ORE Dec.2010 3 2 1 - - - -0.03 - -Orko Silver Corp. OK Oct.2010 1 1 - - - - -0.11 - -Orsu Metals Corp.* OSU Dec.2010 1 - 1 - - - 2.17 - -Osisko Mining Corp. OSK Dec.2010 8 5 1 2 - - -0.08 -0.03 0.60Pacific Northern Gas Ltd. PNG Dec.2010 2 - - 2 - - 1.71 1.88 1.86Pacific Rim Mining Corp.* PMU Apr.2011 1 - - - 1 - -0.04 - -Paladin Energy Ltd.* PDN Jun.2011 8 3 2 3 - - -0.08 0.12 -Paladin Labs Inc. PLB Dec.2010 4 3 - 1 - - 2.16 0.66 0.63Pan American Silver Corp.* PAA Dec.2010 7 3 - 3 1 - 0.71 1.12 1.76Pareto Corp. PTO Dec.2010 1 1 - - - - 0.11 0.17 0.18Parkbridge Lifestyle Communities PRK Sep.2010 3 3 - - - - 0.19 0.43 0.50Pason Systems Inc. PSI Dec.2010 2 - 1 1 - - -0.07 0.40 0.54Patheon Inc.* PTI Oct.2010 4 2 1 1 - - -0.18 0.02 0.13Peer 1 Network Enterprises Inc.* PIX Jun.2010 4 4 - - - - 0.05 0.04 0.07Peregrine Diamonds Ltd. PGD Dec.2010 1 1 - - - - -0.05 - -Peregrine Metals Ltd. PGM Dec.2010 1 1 - - - - -0.02 - -Perseus Mining Ltd.* PRU Jun.2010 1 - 1 - - - - - -Pethealth Inc. PTZ Dec.2010 3 2 1 - - - 0.12 0.07 0.12Phoscan Chemical Corp. FOS Jan.2011 2 - 1 - - 1 0.00 - -Platinum Group Metals Ltd. PTM Aug.2010 2 2 - - - - -0.10 -0.07 -Platmin Ltd.* PPN Dec.2010 1 1 - - - - -0.02 0.02 -Plazacorp Retail Properties Ltd. PLZ Dec.2010 1 - - 1 - - 0.08 - -Plutonic Power Corp. PCC Dec.2010 5 2 1 2 - - -0.40 -0.11 -0.03PNI Digital Media Inc. PN Sep.2010 3 3 - - - - -0.05 0.11 0.23Points Int'l. Ltd.* PTS Dec.2010 1 1 - - - - 0.00 - -Polaris Minerals Corp.* PLS Dec.2010 3 1 - 2 - - -0.34 -0.13 -0.08Polymet Mining Corp.* POM Jan.2011 2 2 - - - - -0.06 - -Potash Corp. of Sask.* POT Dec.2010 9 7 - 2 - - 3.25 5.10 7.48Potash One Inc. KCL Apr.2011 3 1 2 - - - -0.08 -0.10 -
344-c / October 8, 2010 Issue 18 / 10
Continued on next page
BUY, SELL, HOLD ADVICE — PLUS EARNINGS ESTIMATESFOR APPROXIMATELY 1,000 CANADIAN COMPANIES
BUY, SELL, HOLD ADVICE — PLUS EARNINGS ESTIMATESFOR APPROXIMATELY 1,000 CANADIAN COMPANIES
CANADIAN COMPANIES: Earnings per share
I N V E S T O R ’ S D I G E S T
MORNING CALL
Recommendations Consensus EstimatesFiscal # Buy Hold Latest Current Next
Company Sym. Year-end Analysts Buy Hold Hold Sell Sell EPS Year Year
Recommendations Consensus EstimatesFiscal # Buy Hold Latest Current Next
Company Sym. Year-end Analysts Buy Hold Hold Sell Sell EPS Year Year

Issue 18 / 10 October 8, 2010 / 344-d
Continued on next page
BUY, SELL, HOLD ADVICE — PLUS EARNINGS ESTIMATESFOR APPROXIMATELY 1,000 CANADIAN COMPANIES
BUY, SELL, HOLD ADVICE — PLUS EARNINGS ESTIMATESFOR APPROXIMATELY 1,000 CANADIAN COMPANIES
I N V E S T O R ’ S D I G E S T
MORNING CALL
CANADIAN COMPANIES: Earnings per share
Recommendations Consensus EstimatesFiscal # Buy Hold Latest Current Next
Company Sym. Year-end Analysts Buy Hold Hold Sell Sell EPS Year Year
Recommendations Consensus EstimatesFiscal # Buy Hold Latest Current Next
Company Sym. Year-end Analysts Buy Hold Hold Sell Sell EPS Year Year
CANADIAN COMPANIES: Earnings per share
Power Corp. of Canada POW Dec.2010 4 2 - 2 - - 1.40 2.47 2.80Power Financial Corp. PWF Dec.2010 5 3 - 2 - - 1.91 2.46 2.92Powertech Uranium Corp.* PWE Dec.2010 1 - 1 - - - - - -Precision Drilling Corp. PD Dec.2010 6 5 - - - - 0.63 0.38 0.58Premier Gold Mines Ltd. PG Dec.2010 3 1 2 - - - -0.04 - -Premium Brands Holding Corp. PBH Dec.2010 3 2 - 1 - - 1.07 1.28 1.48Prestige Telecom Inc. PR Mar.2011 1 1 - - - - -0.01 - -Primero Mining Corp. P Dec.2010 1 1 - - - - -0.02 - -Pristine Power Inc. PPX Dec.2010 3 1 - 2 - - -0.30 -0.21 -0.13ProSep Inc. PRP Dec.2010 1 1 - - - - -0.13 -0.02 0.01Protox Therapeutics Inc. PRX Dec.2010 1 1 - - - - -0.10 -0.10 0.00Pulse Seismic Inc. PSD Dec.2010 1 - - 1 - - -0.05 -0.11 -0.09Pure Energy Services Inc. PSV Dec.2010 4 2 - 2 - - -0.66 -0.13 0.29Pure Technologies Ltd. PUR Dec.2010 3 2 - 1 - - 0.04 0.12 0.21QHR Technologies Inc. QHR Dec.2010 1 - 1 - - - 0.05 - -QLT Inc.* QLT Dec.2010 2 1 1 - - - 1.77 -0.04 0.22Quadra FNX Mining Ltd.* QUX Dec.2010 6 6 - - - - 0.89 2.22 3.94Quebecor Inc. QBR.B Dec.2010 10 6 2 2 - - 4.32 3.56 3.86Queenston Mining Inc. QMI Dec.2010 1 1 - - - - -0.04 -0.10 -0.11Radiant Communications Corp. RCN Dec.2010 1 1 - - - - 0.01 -0.03 0.10Rainy River Resources Ltd. RR Sep.2010 3 2 1 - - - -0.06 - -Ram Power Inc. RPG Dec.2010 4 4 - - - - -0.37 -0.06 -0.14RDM Corp. RC Sep.2010 1 - - 1 - - -0.10 -0.06 0.07Realex Properties Corp. RP Sep.2010 1 2 - - - - - - -Redknee Solutions Inc. RKN Sep.2010 3 3 - - - - 0.06 0.07 0.12Redline Comm. Group Inc.* RDL Dec.2010 1 - - 1 - - - - -Reitmans (Canada) Ltd. RET.A Jan.2011 3 3 - - - - 0.98 1.36 -Research In Motion Ltd.* RIM Feb.2011 12 7 - 4 - 1 4.31 5.48 5.92Richelieu Hardware Ltd. RCH Nov.2010 2 - 1 1 - - 1.38 1.56 1.76Richmont Mines Inc. RIC Dec.2010 2 2 - - - - 0.01 - -Ritchie Bros. Aunctioneers Inc.* RBA Dec.2010 4 1 - 1 2 - 0.88 0.70 0.83Rockgate Capital Corp. RGT Jun.2010 1 - - - - - - - -Rockwell Diamonds Inc. RDI Feb.2011 1 1 - - - - -0.03 - -Rocky Mountain Dealerships Inc. RME Dec.2010 7 6 - - 1 - 1.02 1.20 1.47Rogers Communications Inc. RCI.B Dec.2010 8 5 - 3 - - 2.38 2.75 3.00Romarco Minerals Inc. R Dec.2010 3 1 1 1 - - -0.01 - -Rona Inc. RON Dec.2010 9 4 - 5 - - 1.11 1.31 1.43Route1 Inc. ROI Dec.2010 2 - 1 1 - - -0.01 -0.01 -Royal Bank of Canada RY Oct.2010 8 6 - 2 - - 2.57 4.25 4.71Royal Gold Inc.* RGL Jun.2010 3 1 1 1 - - 1.07 0.81 1.98Rubicon Minerals Corp. RMX Dec.2010 4 2 1 - 1 - 0.00 -0.05 -0.04RuggedCom Inc.* RCM Mar.2011 6 4 - 2 - - 0.33 0.80 1.19Rusoro Mining Ltd.* RML Dec.2010 1 - 1 - - - -0.03 - -Russel Metals Inc. RUS Dec.2010 4 2 - 1 1 - -1.54 1.16 1.59Sabina Gold & Silver Corp.* SBB Dec.2010 3 2 - - 1 - -0.01 -0.03 -0.04San Gold Corp. SGR Dec.2010 6 4 1 1 - - -0.12 0.12 0.44Sandspring Resources Ltd. SSP Dec.2010 1 1 - - - - -0.17 - -Sandvine Corp. SVC Nov.2010 5 2 - 3 - - -0.15 0.05 0.10Sangoma Technologies Corp. STC Jun.2010 2 2 - - - - 0.08 0.08 0.11Saputo Inc. SAP Mar.2011 8 5 3 - - 1.83 2.01 2.19Savanna Energy Services Corp. SVY Dec.2010 9 1 - 5 3 - -0.15 0.13 0.36Sceptre Investment Counsel Ltd. SZ Nov.2010 1 - - - 1 - 0.25 0.33 0.38Scorpio Mining Corp. SPM Dec.2010 1 1 - - - - 0.12 - -Seacliff Construction Corp. SDC Dec.2010 4 1 3 - - - 1.04 1.29 1.64Sears Canada Inc. SCC Jan.2011 1 - - 1 - - 2.18 - -Secure Energy Services Inc. SES Dec.2010 1 1 - - - - -0.07 0.06 0.10Semafo Inc.* SMF Dec.2010 4 1 - 3 - - 0.18 0.34 0.34SemBioSys Genetics Inc. SBS Dec.2010 1 - - 1 - - -0.10 - -Shamaran Petroleum Corp.* SNM Dec.2010 4 - 2 1 1 - 0.01 -0.01 -0.01Shaw Communications Inc. SJR.B Aug.2010 8 2 - 6 - - 1.24 1.35 1.51ShawCor Ltd. SCL.A Dec.2010 3 2 - 1 - - 1.85 2.14 2.54Sherritt Int'l. Corp. S Dec.2010 5 3 1 1 - - 0.29 0.72 -Shoppers Drug Mart Corp. SC Jan.2011 9 4 - 5 - - 2.69 2.75 -Shore Gold Inc. SGF Dec.2010 2 1 - 1 - - -0.04 -0.01 -Sierra Wireless Inc.* SW Dec.2010 6 2 1 3 - - -1.29 0.43 0.38Silver Bear Resources Inc. SBR Dec.2010 1 - - 1 - - -0.35 -0.13 -Silver Standard Resources Inc. SSO Dec.2010 5 2 - 3 - - -0.19 0.18 0.77Silver Wheaton Corp.* SLW Dec.2010 8 8 - - - - 0.38 0.71 1.00Silvercorp Metals Inc.* SVM Mar.2011 4 2 - 2 - - 0.24 0.48 -SilverCrest Mines Inc. SVL Dec.2010 1 - 1 - - - -0.30 0.02 0.15Sino-Forest Corp.* TRE Dec.2010 5 5 - - - - 1.38 1.52 2.19Slam Exploration Inc. SXL Jan. 2011 1 - 1 - - - -0.01 - -SNC-Lavalin Group Inc. SNC Dec.2010 9 7 - 1 - 1 2.36 2.38 2.75Softchoice Corp.* SO Dec.2010 3 2 - 1 - - 1.26 0.92 1.08Solium Capital Corp. SUM Dec.2010 2 2 - - - - 0.06 0.11 0.13SouthGobi Resources Ltd.* SGQ Dec.2010 1 - - 1 - - -0.83 0.11 0.41Sprott Inc. SII Dec.2010 3 - - 2 1 - 0.21 0.33 0.39Sprott Resource Corp. SCP Dec.2010 2 2 - - - - -0.03 - -Sprott Resource Lending Corp. SIL Dec.2010 2 1 1 - - - -0.14 -0.02 0.04SQI Diagnostics Inc. SQD Dec.2010 1 1 - - - - -0.23 -0.27 -St Andrew Goldfields Ltd. SAS Dec.2010 1 - - - - 1 -0.07 - -Stantec Inc. STN Dec.2010 10 6 1 3 - - 1.22 1.94 2.33Stella-Jones Inc. SJ Dec.2010 5 4 - 1 - - 2.37 2.39 2.85Stornoway Diamond Corp. SWY Apr.2011 3 3 - - - - -0.09 - -
Strateco Resources Inc. RSC Dec.2010 1 1 - - - - -0.01 -0.01 -Strathmore Minerals Corp. STM Dec.2010 1 - - 1 - - -0.09 - -Strongco Corp. SQP Dec.2010 1 1 - - - - - - -Student Transportation Inc. STB Jun.2010 5 2 1 2 - - -0.18 0.16 0.19Sulliden Gold Corp. Ltd. SUE Apr.2011 1 1 - - - - -0.04 - -Sun Life Financial Inc. SLF Dec.2010 5 3 - 2 - - 0.94 2.74 3.13Sun-Rype Products Ltd. SRF Dec.2010 1 1 - - - - 0.62 - -SunOpta Inc.* SOY Dec.2010 3 2 - 1 - - -0.10 0.35 0.40Superior Plus Corp. SPB Dec.2010 4 - - 4 - - 0.75 0.64 0.93SXC Health Solutions Corp.* SXC Dec.2010 6 3 - 3 - - - - -Tahoe Resources Inc. THO Dec.2010 1 - 1 - - - - - -Taseko Mines Ltd. TKO Dec.2010 6 4 - 2 - - 0.06 0.32 0.49Technicoil Corp. TEC Dec.2010 1 - - 1 - - -0.09 0.09 0.08Teck Resources Ltd. TCK.B Dec.2010 9 7 1 1 - - 3.42 3.40 3.65Tekmira Pharmaceuticals Corp. TKM Dec.2010 4 2 1 1 - - -0.19 -0.17 -0.14Telus Corp. T Dec.2010 8 1 1 6 - - 3.14 3.11 3.14Tembec Inc. TMB Sep.2010 3 1 - 1 1 - -2.14 0.23 0.12TeraGo Inc. TGO Dec.2010 2 2 - - - - -0.56 -0.50 -0.21Thallion Pharmaceuticals Inc. TLN Nov.2010 1 - - 1 - - -0.43 -0.37 -Theratechnologies Inc. TH Nov.2010 6 5 - 1 - - -0.25 0.08 0.12Thompson Creek Metals Co. Inc.* TCM Dec.2010 9 3 2 4 - - -0.44 0.90 1.57Thomson Reuters Corp. TRI Dec.2010 7 5 - 2 - - 1.01 1.61 2.52Tiger Resources Ltd.* TGS Jun.2010 1 1 - - - - -0.05 - -Tim Hortons Inc. THI Dec.2010 10 5 - 5 - - 1.64 2.01 2.25Timminco Ltd. TIM Dec.2010 3 - - - 2 1 -1.09 -0.15 -Timmins Gold Corp. TMM Mar.2011 2 - 2 - - - -0.08 0.23 -TIO Networks Corp. TNC Jul.2010 2 1 1 - - - -0.46 -0.04 0.01TMX Group Inc. X Dec.2010 5 1 - 2 2 - 1.41 2.61 2.87Torex Gold Resources Inc. TXG Oct.2010 1 1 - - - - -0.04 -0.04 -0.04Toromont Industries Ltd. TIH Dec.2010 6 4 - 2 - - 1.86 1.35 2.13Toronto-Dominion Bank TD Oct.2010 10 9 - 1 - - 5.35 5.54 6.35Torstar Corp. TS.B Dec.2010 5 2 - 3 - - 0.45 1.32 1.36Total Energy Services Inc. TOT Dec.2010 2 2 - - - - 0.40 0.73 0.96Tournigan Energy Ltd. TVC Sep.2010 1 - - 1 - - -0.03 - -TransAlta Corp. TA Dec.2010 7 2 - 4 1 - 0.90 1.15 1.52Transat A.T. Inc. TRZ.B Oct.2010 5 2 3 - - 1.86 0.18 1.56TransCanada Corp. TRP Dec.2010 8 7 - 1 - - 2.11 2.02 2.49Transcontinental Inc. TCL.A Oct.2010 5 2 - 2 1 - -1.02 1.66 1.79TransForce Inc. TFI Dec.2010 4 4 - - - - 0.12 0.56 0.80TransGaming Inc. TNG May.2011 2 2 - - - - -0.05 -0.04 -Transition Therapeutics Inc. TTH Jun.2010 4 1 1 2 - - -0.97 -1.33 -Tranzeo Wireless Technologies Inc. TZT Dec.2010 1 - 1 - - - -0.41 -0.02 0.09Trelawney Mining and Explor. Inc. TRR Dec.2010 1 - 1 - - - -0.02 -0.02 0.12Trevali Resources Corp. TV Dec.2010 1 - 1 - - - -0.08 - -Trican Well Service Ltd. TCW Dec.2010 8 6 1 1 - - -0.07 0.61 0.94Trinidad Drilling Ltd. TDG Dec.2010 10 7 2 1 - - 0.26 0.21 0.49Troy Resources NL TRY Jun.2010 1 - - 1 - - 0.22 -0.10 0.49True North Gems Inc. TGX Dec.2010 1 - 1 - - - -0.03 - -Tso3 Inc. TOS Dec.2010 2 1 1 - - - -0.19 -0.16 -0.10Tucows Inc. TC Dec.2010 2 1 - 1 - - 0.18 0.03 0.04Tuscany Int'l Drilling Inc.* TID Dec.2010 1 1 - - - - - 0.01 0.12TVA Group Inc. TVA.B Dec.2010 3 2 1 - - - 2.05 1.42 1.41U.S. Geothermal Inc.* GTH Mar.2011 3 3 - - - - -0.09 -0.04 0.02U.S. Silver Corp.* USA Dec.2010 1 - - 1 - - 0.02 - -U308 Corp. UWE Dec.2010 1 - 1 - - - -0.29 - -UEX Corp. UEX Dec.2010 2 1 1 - - - -0.04 -0.01 -Underworld Resources Inc. UW Sep.2010 1 - 1 - - - -0.02 - -Uni-Select Inc. UNS Dec.2010 3 1 - 2 - - 2.20 2.56 2.66Ur-Energy Inc. URE Dec.2010 4 2 1 1 - - -0.20 -0.06 -Uranerz Energy Corp. URZ Dec.2010 2 2 - - - - -0.15 -0.19 -Uranium One Inc. UUU Dec.2010 8 7 1 1 - - -0.08 0.09 0.30Uranium Participation Corp. U Feb.2011 4 3 - 1 - - -1.60 - -Valley High Ventures Ltd. VHV Oct.2010 1 1 - - - - -0.02 - -Vecima Networks Inc. VCM Jun.2010 1 - - - 1 - 0.58 0.14 0.22Vector Aerospace Corp. RNO Dec.2010 2 2 - - - - 0.78 0.79 0.89Velan Inc. VLN Feb.2011 1 - - 1 - - 1.59 1.40 -VendTek Systems Inc. VSI Oct.2010 1 - 1 - - - -0.02 - -Ventana Gold Corp. VEN Jun.2010 2 - 2 - - - -0.05 - -Victoria Gold Corp. VIT Feb.2011 2 1 - 1 - - -0.03 - -Viterra Inc. VT Oct.2010 9 6 1 2 - - 0.45 0.43 0.66Vitran Corp. Inc.* VTN Dec.2010 1 - - 1 - - -0.28 0.36 0.78Volta Resources Inc. VTR Dec.2010 3 2 1 - - - -0.46 - -Vulcan Minerals Inc. VUL Dec.2010 1 - 1 - - - -0.01 -0.02 -0.02WaterFurnace Ren. Energy Inc.* WFI Dec.2010 2 2 - - - - 1.28 1.25 1.62Webtech Wireless Inc. WEW Dec.2010 3 2 1 - - - -0.17 0.00 0.05Wescast Industries Inc. WCS.A Dec.2010 2 1 - 1 - - -1.67 -0.96 -0.50Wesdome Gold Mines Ltd. WDO Dec.2010 2 - 1 1 - - 0.32 0.14 0.05West Fraser Timber Co. Ltd. WFT Dec.2010 5 2 - 3 - - -7.96 2.24 1.20Western Areas NL* WSA Jun.2010 2 1 - 1 - - -0.18 0.61 -Western Coal Corp. WTN Mar.2011 4 4 - - - - 0.17 0.89 1.15Western Energy Services Corp. WRG Dec.2010 2 2 - - - - -0.20 0.02 0.01Western Financial Group Inc. WES Dec.2010 3 3 - - - - 0.22 0.25 0.32Western Lithium Canada Corp. WLC Sep.2010 1 - 1 - - - -0.06 - -Western Potash Corp. WPX Sep.2010 2 1 - 1 - - -0.03 - -

WestJet Airlines Ltd. WJA Dec.2010 7 6 - 1 - - 0.74 0.87 1.20Westport Innovations Inc. WPT Mar.2011 5 - - 2 2 1 -1.10 -0.91 -0.44Whitemud Resources Inc. WMK Dec.2010 1 - - - - 1 -0.47 -0.37 -Wi-Lan Inc. WIN Dec.2010 1 1 - - - - -0.02 0.10 0.32Winpak Ltd.* WPK Dec.2010 1 1 - - - - 0.66 0.83 0.88Wireless Matrix Corp.* WRX Apr.2011 2 2 - - - - -0.01 0.05 -World Energy Solutions Inc.* XWE Dec.2010 1 - 1 - - - -0.27 -0.04 0.17Xceed Mortgage Corp. XMC Oct.2010 1 - - - 1 - -0.12 -0.55 -0.20Xtreme Coil Drilling Corp. XDC Dec.2010 4 3 - 1 - - 0.21 0.12 0.17Yamana Gold Inc.* YRI Dec.2010 13 10 - 3 - - 0.26 0.69 0.76Yangaroo Inc. YOO Dec.2010 1 - - 1 - - -0.04 -0.04 -0.02YM BioSciences Inc. YM Jun.2010 1 1 - - - - -0.23 - -Zarlink Semiconductor Inc.* ZL Mar.2011 2 1 - - - - 0.04 0.31 -ZCL Composites Inc. ZCL Dec.2010 5 1 1 1 2 - 0.08 0.30 0.40Zenn Motor Co. Inc. ZNN Sep.2010 1 - 1 - - - -0.29 - -Zongshen PEM Power Systems Inc. ZPP Dec.2010 3 1 - 2 - - -0.02 0.01 -
Advantage Oil & Gas Ltd. AAV Dec.2010 4 3 - 1 - - 1.30 1.22 1.34Alange Energy Corp.* ALE Dec.2010 5 4 - 1 - - 0.01 0.07 0.11Americas Petrogas Inc. BOE Dec.2010 1 - 1 - - - - - -Anderson Energy Ltd. AXL Dec.2010 4 1 - 3 - - 0.25 0.32 0.49Angle Energy Inc. NGL Dec.2010 6 6 - - - - 0.90 1.08 1.70Antrim Energy Inc.* AEN Dec.2010 4 1 1 2 - - -0.01 -0.01 -0.03Arcan Resources Ltd. ARN Dec.2010 2 2 - - - - 0.14 0.36 0.66Argosy Energy Inc. GSY Dec.2010 2 1 1 - - - 0.20 0.40 0.46Arsenal Energy Inc. AEI Dec.2010 2 2 - - - - 0.18 0.17 0.28Artek Exploration Ltd. RTK Dec.2010 1 1 - - - - 0.28 0.86 1.12Athabasca Oil Sands Corp. ATH Dec.2010 2 1 - 1 - - - - -Bankers Petroleum Ltd.* BNK Dec.2010 7 4 2 1 - - 0.12 0.40 0.74Bellamont Exploration Ltd. BMX.A Dec.2010 2 1 - 1 - - 0.04 0.14 0.17Bellatrix Exploration Inc. BXE Dec.2010 4 3 1 - - - 0.39 0.58 0.96Birchcliff Energy Ltd. BIR Dec.2010 6 1 2 2 1 - 0.56 0.89 1.48BlackPearl Resources Inc. PXX Dec.2010 3 3 - - - - 0.12 0.31 0.12Bonterra Energy Corp. BNE Dec.2010 1 1 - - - - 2.69 3.97 5.90Bridge Resources Corp. BUK Mar.2011 1 1 - - - - - - -Bronco Energy Ltd. BCF Dec.2010 1 - - 1 - - - 0.11 -Calvalley Petroleum Inc.* CVI.A Dec.2010 3 1 1 1 - - 0.14 0.32 0.79Canacol Energy Ltd. CNE Jun.2010 5 2 2 1 - - -0.04 0.20 0.11Cdn. Natural Resources Ltd. CNQ Dec.2010 12 11 - 1 - - 11.24 8.93 10.85Cdn. Quantum Energy Corp. CQM Apr.2011 1 1 - - - - - - -Cdn. Spirit Resources Inc. SPI Dec.2010 2 2 - - - - -0.04 -0.03 0.18Canoro Resources Ltd. CNS Mar.2011 3 - 2 1 - - -0.02 0.07 0.01Celtic Exploration Ltd. CLT Dec.2010 7 4 1 2 - - 1.35 1.93 2.62Cenovus Energy Inc.* CVE Dec.2010 12 8 - 4 - - 3.29 3.71 4.26CGX Energy Inc.* OYL Dec.2010 3 - 3 - - - -0.01 -0.01 -0.01Chinook Energy Inc. CKE Dec.2010 1 - - 1 - - - 0.20 0.55Cinch Energy Corp. CNH Dec.2010 7 6 - 1 - - 0.17 0.16 0.33Cirrus Energy Corp. CYR Aug.2010 4 3 1 - - - -0.03 0.38 0.93Coastal Energy Co. CEN Dec.2010 3 2 1 - - - 0.37 2.39 -Compton Petroleum Corp. CMT Dec.2010 4 - 1 2 1 - 0.29 0.15 0.20Connacher Oil and Gas Ltd. CLL Dec.2010 5 1 - 3 1 - 0.27 0.17 0.31Corridor Resources Inc. CDH Dec.2010 3 1 1 1 - - 0.31 0.22 0.37Crescent Point Energy Corp. CPG Dec.2010 10 8 - 2 - - 4.15 3.61 4.20Crew Energy Inc. CR Dec.2010 8 5 - 3 - - 2.31 1.55 2.27Crocotta Energy Inc. CTA Dec.2010 5 5 - - - - 0.89 0.21 0.38Culane Energy Corp. CLN Dec.2010 3 - 1 1 1 - 0.42 0.37 0.72Daylight Energy Ltd. DAY Dec.2010 4 4 - - - - - 1.58 2.01DeeThree Exploration Inc. DTX Dec.2010 1 1 - - - - 0.08 0.16 0.37Delphi Energy Corp. DEE Dec.2010 7 5 - 2 - - 0.59 0.60 0.69Eaglewood Energy Inc. EWD Dec.2010 1 - 1 - - - - - -Ember Resources Inc. EBR Dec.2010 2 - - 1 1 - 0.25 0.21 0.21Emerge Oil & Gas Inc. EME Dec.2010 3 3 - - - - 0.10 0.55 0.93EnCana Corp.* ECA Dec.2010 11 5 - 6 - - 9.03 5.91 6.53Epsilon Energy Ltd. EPS Dec.2010 1 1 - - - - - 0.31 0.70Equal Energy Inc. EQU Dec.2010 2 2 - - - - 1.47 1.96 2.54Fairborne Energy Ltd. FEL Dec.2010 7 6 - 1 - - 1.59 1.32 1.45Galleon Energy Inc. GO Dec.2010 5 2 - 3 - - 1.22 1.26 1.20Gastem Inc. GMR Dec.2010 1 - 1 - - - - - -Gran Tierra Energy Inc.* GTE Dec.2010 12 7 2 3 - - 0.65 0.94 1.14Great Plains Exploration Inc. GPX Dec.2010 1 1 - - - - - - -Heritage Oil Corp.* HOC Dec.2010 3 1 1 1 - - -0.13 -0.23 -0.26Husky Energy Inc. HSE Dec.2010 8 - - 5 2 1 2.95 4.33 4.71Imperial Oil Ltd. IMO Dec.2010 9 2 - 5 2 - 3.11 3.72 4.04Insignia Energy Ltd. ISN Dec.2010 4 3 - 1 - - 0.29 0.52 0.88Ironhorse Oil & Gas Inc. IOG Dec.2010 1 1 - - - - - - -
Ithaca Energy Inc.* IAE Dec.2010 3 1 1 1 - - 0.34 0.68 1.05Ivanhoe Energy Inc. IE Dec.2010 2 1 - 1 - - 0.03 -0.01 0.01Junex Inc. JNX Dec.2010 2 - 2 - - - -0.01 -0.01 -0.02Legacy Oil + Gas Inc. LEG Dec.2010 5 4 - 1 - - 0.91 1.37 1.85Logan International Inc. LII Dec.2010 3 3 - - - - - 0.49 0.78Longford Energy Inc. LFD Dec.2010 1 - - 1 - - -0.03 -0.01 -Madalena Ventures Inc. MVN Dec.2010 1 - 1 - - - -0.01 0.01 -0.01MEG Energy Corp. MEG Dec.2010 1 1 - - - - - 0.58 1.11MGM Energy Inc. MGX Dec.2010 4 - 2 2 - - -0.02 -0.03 -0.02Midway Energy Ltd. MEL Dec.2010 3 3 - - - - -0.01 0.34 0.71Nexen Inc. NXY Dec.2010 11 4 - 6 1 - 4.25 4.89 5.95Niko Resources Ltd.* NKO Mar.2011 7 4 1 2 - - 4.30 7.43 7.82North Peace Energy Corp. NPE Dec.2010 2 - - 2 - - -0.01 -0.01 -0.01Norwood Resources Ltd. NRS Dec.2010 1 - 1 - - - -0.02 -0.02 -Novus Energy Inc. NVS Dec.2010 3 3 - - - - -0.10 0.09 0.24Nuloch Resources Inc. NLR.A Dec.2010 2 2 - - - - 0.03 0.15 0.39NuVista Energy Ltd. NVA Dec.2010 8 5 - 3 - - 2.28 2.57 3.11Open Range Energy Corp. ONR Dec.2010 5 5 - - - - 0.50 0.49 0.60OPTI Canada Inc. OPC Dec.2010 6 2 - 2 2 - -1.13 -0.45 0.29Orca Exploration Group Inc.* ORC.A Dec.2010 1 1 - - - - 0.40 - -Orleans Energy Ltd. OEX Dec.2010 7 6 - 1 - - 0.27 0.40 0.64Pace Oil & Gas Ltd. PCE Dec.2010 1 1 - - - - 1.29 1.07 2.03Pacific Rubiales Energy Corp.* PRE Dec.2010 11 9 1 - - 1 0.93 2.82 4.59Painted Pony Petroleum Ltd. PPY.A Dec.2010 3 3 - - - - 0.44 0.82 1.40Palliser Oil & Gas Corp. PXL Dec.2010 2 2 - - - - -0.06 0.11 0.33Pan Orient Energy Corp. POE Dec.2010 4 3 1 - - - 1.20 1.33 1.72Paramount Resources Ltd. POU Dec.2010 7 3 - 3 1 - 0.88 1.23 1.41Parex Resources Inc. PXT Dec.2010 7 5 1 1 - - -0.08 -0.03 0.39Perpetual Energy Inc. PMT Dec.2010 2 - - 2 - - - 1.20 0.98Petro Vista Energy Corp. PTV Sep.2010 1 - - 1 - - - - -Petroamerica Oil Corp. PTA Dec.2010 1 1 - - - - 0.00 - -PetroBakken Energy Ltd. PBN Dec.2010 7 6 - 1 - - 3.14 4.03 4.85Petrobank Energy & Resources PBG Dec.2010 4 3 - 1 - - 2.78 13.56 15.03Petrodorado Energy Ltd. PDQ Dec.2010 1 - 1 - - - 0.00 0.00 0.03Petrolifera Petroleum Ltd. PDP Dec.2010 6 1 2 2 1 - 0.41 0.19 0.16Petrominerales Ltd.* PMG Dec.2010 10 7 - 1 2 - 2.78 6.56 6.84Pinecrest Energy Inc. PRY Jul.2010 1 1 - - - - - - -Primeline Energy Holdings Inc. PEH Mar.2011 1 - 1 - - - 0.00 -0.01 -0.03Progress Energy Res. Corp. PRQ Dec.2010 9 7 - 2 - - 0.95 1.12 1.46ProspEx Resources Ltd. PSX Dec.2010 3 2 - 1 - - 0.22 0.38 0.48Questerre Energy Corp. QEC Dec.2010 3 1 2 - - - 0.02 0.02 0.04Reliable Energy Ltd. REL Dec.2010 1 - 1 - - - -0.01 0.04 0.13Renegade Petroleum Ltd. RPL Dec.2010 2 2 - - - - 0.03 0.42 1.09Rock Energy Inc. RE Dec.2010 5 5 - - - - 0.72 0.97 1.42Sea Dragon Energy Inc. SDX Dec.2010 2 1 1 - - - -0.03 0.04 0.09Seaview Energy Inc. CVU.A Dec.2010 2 1 - - - - 0.26 0.24 0.33Second Wave Petroleum Ltd. SCS Dec.2010 3 2 1 - - - 0.02 0.19 0.42Serica Energy PLC* SQZ Dec.2010 2 2 - - - - 0.08 0.04 0.10SkyWest Energy Corp. SKW Dec.2010 1 1 - - - - - 0.03 0.16Southern Pacific Resource Corp. STP Jun.2010 3 2 1 - - - 0.02 0.21 0.19Sterling Resources Ltd.* SLG Dec.2010 3 2 1 - - - -0.04 -0.02 -0.02Storm Resources Ltd. SRX Dec.2010 1 1 - - - - - -0.09 -0.03Stratic Energy Corp.* SE Dec.2010 1 - - 1 - - 0.00 0.10 -Suncor Energy Inc. SU Dec.2010 11 9 - 2 - - 2.34 3.99 5.46Sure Energy Inc. SHR Dec.2010 1 1 - - - - - - -Surge Energy Inc. SGY Dec.2010 1 1 - - - - 1.05 0.82 1.13Suroco Energy Inc. SRN Dec.2010 2 2 - - - - 0.00 0.10 0.19Talisman Energy Inc. TLM Dec.2010 12 10 - 2 - - 3.90 3.55 4.39Tamarack Valley Energy Ltd. TVE Dec.2010 1 - 1 - - - 0.01 0.02 0.03Terra Energy Corp. TT Dec.2010 3 2 1 - - - 0.32 0.37 0.46Tethys Petroleum Ltd.* TPL Dec.2010 1 - 1 - - - -0.07 0.04 0.17TG World Energy Corp. TGE Dec.2010 2 - 2 - - - 0.00 0.00 -TransAtlantic Petroleum Corp.* TNP Dec.2010 1 1 - - - - -0.10 - -TransGlobe Energy Corp. TGL Dec.2010 3 2 - 1 - - 0.70 1.18 1.51Triangle Petroleum Corp.* TPE Jan.2011 2 - 2 - - - - - -Trilogy Energy Corp. TET Dec.2010 4 2 - 2 - - 1.18 1.19 1.06TriOil Resources Ltd. TOL Dec.2010 2 2 - - - - - 0.47 1.15Twin Butte Energy Ltd. TBE Dec.2010 7 6 1 - - - 0.28 0.36 0.45UTS Energy Corp. UTS Dec.2010 7 3 - 4 1 - -0.05 -0.02 -0.02Vast Exploration Inc. VST Jan.2011 2 1 1 - - - -0.02 -0.01 -0.01Vermilion Energy Inc. VET Dec.2010 1 1 - - - - - - -Vero Energy Inc. VRO Dec.2010 4 4 - - - - 0.70 1.46 2.16WesternZagros Resources Ltd. WZR Dec.2010 7 - 1 3 3 - -0.01 -0.01 -0.04WestFire Energy Ltd. WFE Dec.2010 3 3 - - - - 0.31 0.71 1.50Wild Stream Exploration Inc. WSX Dec.2010 3 3 - - - - 1.05 0.68 1.21Winstar Resources Ltd. WIX Dec.2010 3 1 2 - - - 0.52 0.82 0.89Xcite Energy Ltd. XEL Dec.2010 1 1 -0.02 -0.02 0.07Yoho Resources Inc. YO Sep.2010 3 3 - - - - 0.53 0.53 0.66Zedi Inc. ZED Dec.2010 1 1 - - - - - - -
344-e / October 8, 2010 Issue 18 / 10
Continued on next page
BUY, SELL, HOLD ADVICE — PLUS EARNINGS ESTIMATESFOR APPROXIMATELY 1,000 CANADIAN COMPANIES
BUY, SELL, HOLD ADVICE — PLUS EARNINGS ESTIMATESFOR APPROXIMATELY 1,000 CANADIAN COMPANIES
CANADIAN COMPANIES: Earnings per share
I N V E S T O R ’ S D I G E S T
MORNING CALL
Recommendations Consensus EstimatesFiscal # Buy Hold Latest Current Next
Company Sym. Year-end Analysts Buy Hold Hold Sell Sell EPS Year Year
Recommendations Consensus EstimatesFiscal # Buy Hold Latest Current Next
Company Sym. Year-end Analysts Buy Hold Hold Sell Sell Cash Flow Year Year
CANADIAN COMPANIES: Earnings per share OIL & GAS: Cash flow estimates
OIL & GAS: Cash flow estimatesRecommendations Consensus Estimates
Fiscal # Buy Hold Latest Current NextCompany Sym. Year-end Analysts Buy Hold Hold Sell Sell Cash Flow Year Year

Allied Properties REIT AP.UN Dec.2010 8 3 1 4 - - 1.32 1.32 1.32Altus Group I.F. AIF.UN Dec.2010 4 4 - - - - 1.20 1.20 1.20Arc Energy Trust AET.UN Dec.2010 10 9 - 1 - - 1.28 1.20 1.20Arctic Glacier I.F.* AG.UN Dec.2010 2 1 - - 1 - 0.54 0.00 0.00Armtec Infrastructure I.F. ARF.UN Dec.2010 5 4 1 - - - 1.98 2.88 2.93Artis REIT AX.UN Dec.2010 5 1 - 4 - - 1.08 1.08 1.08Avenir Diversified I.T. AVF.UN Dec.2010 2 2 - - - - 0.84 - -Badger I.F. BAD.UN Dec.2010 3 3 - - - - 1.26 - -Baytex Energy Trust BTE.UN Dec.2010 11 9 - 1 1 - 1.56 2.16 2.16Bell Aliant Reg. Comm. I.F. BA.UN Dec.2010 8 - 1 6 - 1 3.39 2.90 1.90Bird Construction I.F. BDT.UN Dec.2010 3 2 1 - - - 1.62 - -Boardwalk REIT BEI.UN Dec.2010 7 2 - 5 - - 2.55 1.80 1.80Bonavista Energy Trust BNP.UN Dec.2010 7 6 - 1 - - 2.00 2.73 1.92Boralex Power I.F. BPT.UN Dec.2010 7 1 - 5 - - 0.64 0.53 0.50Boston Pizza Royalties I.F. BPF.UN Dec.2010 2 - - 1 1 - 1.38 - -Brick Group I.F. BRK.UN Dec.2010 2 1 - 1 - - 0.32 0.00 0.00Brookfield Infra. Partners L.P. BIP.UN Dec.2010 3 1 - 2 - - 0.27 - -Brookfield Ren. Power Fund BRC.UN Dec.2010 6 1 - 4 1 - 1.25 1.43 1.47BTB REIT BTB.UN Dec.2010 2 - - 1 1 - 0.09 0.09 0.08Calloway REIT CWT.UN Dec.2010 7 1 1 5 - - 1.41 1.55 1.55Cdn Apt. Properties REIT CAR.UN Dec.2010 7 2 1 3 1 - 0.99 1.08 1.08Cdn. Oil Sands Trust COS.UN Dec.2010 10 6 - 3 - - 0.90 1.83 2.00Cdn. REIT REF.UN Dec.2010 6 4 1 1 - - 1.36 1.36 1.38Canexus I.F. CUS.UN Dec.2010 4 2 - 2 - - 0.50 0.55 0.55Canfor Pulp I.F. CFX.UN Dec.2010 5 3 - 2 - - 0.26 2.08 1.37Capital Power Income L.P. CPA.UN Dec.2010 5 1 - 2 2 - 1.95 1.76 1.76Carfinco I.F. CFN.UN Dec.2010 1 1 - - - - 0.08 0.24 0.26Cargojet I.F. CJT.UN Dec.2010 2 1 - 1 - - 0.79 0.50 0.50Chartwell Seniors Housing REIT CSH.UN Dec.2010 3 1 - 2 - - 0.66 0.54 0.54Chemtrade Logistics I.F. CHE.UN Dec.2010 1 - - 1 - - 1.20 1.20 1.20Cineplex Galaxy I.F. CGX.UN Dec.2010 5 3 - 2 - - 2.14 1.26 1.31Cinram Int'l. I.F. CRW.UN Dec.2010 2 - - 1 1 - 0.00 - -Clearwater Seafoods I.F. CLR.UN Dec.2010 2 - - - 1 - 0.00 - -CML Healthcare I.F. CLC.UN Dec.2010 5 2 - 3 - - 0.98 1.25 -Coast Wholesale Appliances I.F. CWA.UN Dec.2010 1 - - 1 - - 0.58 0.50 0.50Cominar REIT CUF.UN Dec.2010 8 3 1 4 - - 1.44 1.44 1.44Consumers' Waterheater I.F. CWI.UN Dec.2010 2 - - 2 - - 1.02 - -Crombie REIT CRR.UN Dec.2010 4 - 1 3 - - 0.82 0.89 -Davis + Henderson I.F. DHF.UN Dec.2010 2 1 - 1 - - 1.84 1.84 -DirectCash I.F. DCI.UN Dec.2010 2 2 - - - - 2.05 1.38 1.38Dundee REIT D.UN Dec.2010 3 1 1 1 - - 2.20 - -Enbridge I.F. ENF.UN Dec.2010 5 1 - 2 1 1 1.15 1.17 1.22Enerplus Resources Fund ERF.UN Dec.2010 8 3 - 5 - - 2.23 2.16 2.16Extendicare REIT EXE.UN Dec.2010 2 1 - 1 - - 0.84 - -Firm Capital Mortgage I.T. FC.UN Dec.2010 1 - - 1 - - 1.04 1.00 1.03First National Financial I.F. FN.UN Dec.2010 4 2 - 2 - - 1.45 1.82 1.43Foremost I.F. FMO.UN Dec.2010 2 1 - 1 - - 1.07 - -Fort Chicago Energy Partners L.P. FCE.UN Dec.2010 6 - - 5 - 1 1.00 1.00 1.00FP Newspapers I.F. FP.UN Dec.2010 1 - - - 1 - 1.14 0.93 0.93Freehold Royalty Trust FRU.UN Dec.2010 3 - - 3 - - 1.40 1.68 1.62Futuremed Healthcare I.F. FMD.UN Dec.2010 2 1 - 1 - - 0.93 - -Gamehost I.F. GH.UN Dec.2010 2 1 - 1 - - 0.81 0.88 0.88Gaz Metro L.P. GZM.UN Sep.2010 5 - - 2 3 - 1.24 1.24 1.00Genivar I.F. GNV.UN Dec.2010 10 5 3 2 - - 1.95 1.50 1.50
H&R REIT HR.UN Dec.2010 6 4 2 - - - 0.72 0.72 0.72Holloway Lodging REIT HLR.UN Dec.2010 2 - 1 - 1 - 0.10 - -Homberg Cdn. REIT HCR.UN Dec.2010 1 - - - - - - 0.95 0.95Huntingdon REIT HNT.UN Dec.2010 1 1 - - - - 0.00 - -IBI I.F. IBG.UN Dec.2010 5 2 1 1 1 - 1.60 1.58 1.67InnVest REIT INN.UN Dec.2010 3 1 - 2 - - 0.67 0.50 0.50Inter Pipeline Fund IPL.UN Dec.2010 6 5 1 - - - 0.84 0.90 0.90InterRent REIT IIP.UN Dec.2010 2 - - 1 - 1 0.11 0.12 0.12Jazz Air I.F. JAZ.UN Dec.2010 5 1 - 4 - - 0.84 0.68 0.64Just Energy I.F. JE.UN Mar.2011 3 1 1 1 - - 1.24 1.75 -K-Bro Linen I.F. KBL.UN Dec.2010 1 1 - - - - 1.10 - -Keyera Facilities I.F. KEY.UN Dec.2010 5 3 1 1 - - 2.25 1.80 1.80Labrador Iron Ore Royalty Corp. LIF.UN Dec.2010 1 1 - - - - - - -Lakeview Hotel REIT LHR.UN Dec.2010 1 - - - 1 - 0.02 - -Liquor Stores I.F. LIQ.UN Dec.2010 3 1 - 2 - - 1.02 1.62 1.62Macquarie Power I.F. MPT.UN Dec.2010 1 - - 1 - - 0.88 - -Medical Facilities Corp.* DR.UN Dec.2010 3 2 - 1 - - 1.10 - -Morguard REIT MRT.UN Dec.2010 3 1 1 1 - - 1.06 - -Morneau Sobeco I.F. MSI.UN Dec.2010 2 - 1 1 - - 1.00 1.00 1.10NAL Oil & Gas Trust NAE.UN Dec.2010 6 3 - 3 - - 1.12 1.08 1.08New Flyer Industries Inc. NFI.UN Dec.2010 4 2 - 2 - - 1.17 1.17 1.17Newport Partners I.F. NPF.UN Dec.2010 1 - - - 1 - 0.00 - -Noranda I.F. NIF.UN Dec.2010 1 - - - 1 - 0.29 - -North West Co. Fund NWF.UN Jan.2011 2 - - 2 - - 0.98 - -Northern Property REIT NPR.UN Dec.2010 6 5 - 1 - - 1.48 1.48 1.48Northland Power I.F. NPI.UN Dec.2010 6 3 1 2 - - 1.08 1.08 1.08NorthWest Healthcare Properties NWH.UN Dec.2010 1 - - 1 - - - - -Parkland I.F. PKI.UN Dec.2010 4 3 - 1 - - 1.26 - -Pembina Pipeline I.F. PIF.UN Dec.2010 6 1 - 4 1 - 1.56 1.56 1.56Pengrowth Energy Trust PGF.UN Dec.2010 10 8 - 2 - - 1.08 0.84 0.84Penn West Energy Trust PWT.UN Dec.2010 9 4 - 5 - - 2.23 1.56 1.29Peyto Energy Trust PEY.UN Dec.2010 5 4 - 1 - - 1.47 1.26 1.26Phoenix Technology I.F. PHX.UN Dec.2010 5 4 - 1 - - 0.89 0.48 0.48Primaris Retail REIT PMZ.UN Dec.2010 6 2 1 3 - - 1.22 1.22 1.22Provident Energy Trust PVE.UN Dec.2010 2 1 - - 1 - 0.75 - -Pure Industrial Real Estate Trust AAR.UN Dec.2010 3 2 - 1 - - 0.30 - -Retrocom Mid-Market REIT RMM.UN Dec.2010 1 1 - - - - - - -Riocan REIT REI.UN Dec.2010 6 1 - 5 - - 1.38 1.38 1.38Rogers Sugar I.F. RSI.UN Sep.2010 2 - - 1 1 - 0.46 0.68 0.55Royal Host REIT RYL.UN Dec.2010 3 - - - 2 1 0.64 - -Scott's REIT SRQ.UN Dec.2010 3 1 - 2 - - 0.93 - -Second Cup I.F. SCU.UN Dec.2010 1 - - - 1 - 0.95 - -Stoneham Drilling Trust SDG.UN Dec.2010 5 4 - - 1 - 0.10 0.00 0.00Supremex I.F. SXP.UN Dec.2010 1 - - 1 - - 0.65 0.77 0.60Temple REIT TR.UN Dec.2010 1 - - - 1 - 0.58 - -TimberWest Forest Corp. TWF.UN Dec.2010 7 3 - 1 3 - 1.08 0.14 0.39Trimac I.F. TMA.UN Dec.2010 3 1 - 2 - - 0.48 0.48 0.24Vicwest I.F. VIC.UN Dec.2010 2 2 - - - - 2.17 1.56 1.08Wajax I.F. WJX.UN Dec.2010 5 2 - 2 1 - 2.55 1.80 1.00WesternOne Equity I.F. WEQ.UN Dec.2010 1 - - 1 - - 0.60 0.60 0.48Westshore Terminals I.F. WTE.UN Dec.2010 2 2 - - - - 1.37 - -Whiterock REIT WRK.UN Dec.2010 3 1 - 2 - - 1.69 1.69 1.69Yellow Pages I.F. YLO.UN Dec.2010 8 - 2 5 1 - 0.92 0.80 -Zargon Energy Trust ZAR.UN Dec.2010 4 - - 4 - - 2.16 2.16 2.16
Issue 18 / 10 October 8, 2010 / 344-f
BUY, SELL, HOLD ADVICE — PLUS EARNINGS ESTIMATESFOR APPROXIMATELY 1,000 CANADIAN COMPANIES
BUY, SELL, HOLD ADVICE — PLUS EARNINGS ESTIMATESFOR APPROXIMATELY 1,000 CANADIAN COMPANIES
I N V E S T O R ’ S D I G E S T
MORNING CALL
CANADIAN COMPANIES: Earnings per share
Recommendations Consensus EstimatesFiscal # Buy Hold Latest Current Next
Company Sym. Year-end Analysts Buy Hold Hold Sell Sell Dist. Year Year
Recommendations Consensus EstimatesFiscal # Buy Hold Latest Current Next
Company Sym. Year-end Analysts Buy Hold Hold Sell Sell Dist. Year Year
INCOME TRUSTS: Total distribution INCOME TRUSTS: Total distribution
I.F. = Income Fund I.T. = Income Trust

Issue 18 / 10 I N V E S T O R ’ S D I G E S T October 8, 2010 / 345
By Mike Kachanovsky
If i r s t p r e s e n t e dParamount Gold andSilver Corp. (PZG-TSX, $1.52) (in a Mex-
ico Mike article a coupleof years ago, and sincethen the company hasbeen very busy indeed.Paramount has expanded its prop-erty holdings to comprise morethan 440,000 acres around its flag-ship San Miguel project in Chi-huahua. The company now con-trols most of a large district that hasaccounted for significant historicproduction of high grade gold andsilver, yet remains underexplored.
Exploration success has beenreported on several fronts as
Paramount has gone abouttesting some of the manyhigh priority targets thathave been identified. Theintense alteration that isevident through the districtcontributed to the enrich-ment of gold, silver andbase metals producers.Deposits have been dis-
covered in a variety of settings, in-cluding some extremely high gradezones and also larger areas of lowergrade disseminated mineralizationthat may be suitable for lower costopen-pit mining.
Total “compliant,” or reportable,resources for the project nowamount to about 2.65 million gold-equivalent ounces. The drills con-tinue to turn, with additional suc-
cess reported that have not been in-cluded in this resource.
San Miguel is located in themidst of several huge mining pro-jects that have been developed inrecent years, including the Ocam-po Mine (Gammon Gold), ElSauzal (Goldcorp), Pinos Altos (Ag-nico-Eagle), and Palmarejo (CoeurD’alene). The district is rapidlyevolving into one of the most im-portant production areas in Mexi-co. As the magnitude of its definedresource base continues to grow,San Miguel may become the sub-ject of interest for the next majoracquisition deal for development.
It is worth noting that CoeurD'alene paid about US$1.1 billionfor Palmarejo in 2007, a deposit ofroughly 3.1 million gold-equivalent
ounces. San Miguel is rapidly ap-proaching a similar net defined re-source, and yet Paramount tradesat a market capitalization of about$170 million. Suffice to say, thestock looks cheap. Sometime in thefuture, the company may have out-lined a much larger resource andthe premium that will be offeredfor acquisition may be higher in ahot market. There is no need for itto rush into any deal today.
Tip of the iceberg
In an effort to establish a secondcore-operating area outside ofMexico, Paramount recently ac-quired X-Cal Resources to gain 100per cent ownership of the SleeperGold project plus two other explo-ration prospects in Nevada. Theprice tag amounted to roughly $32million, an all-stock deal.
Much like Mexico, Nevada is amining-friendly jurisdiction with along history of significant gold andsilver production. Paramount hasfollowed its strategy to gain largeproperty holdings around provenmining districts with the acquisitionof the Sleeper Mine, a high gradehistoric producer that yielded morethan 1.7 million ounces of gold and2.3 million ounces of silver.
The entire property comprisesabout 30-square miles surroundingthe old mine workings and is high-ly prospective. There is an estab-lished resource in excess of onemillion ounces of gold that remainsfrom prior mining activity, but thisprobably represents the proverbialtip of the iceberg. The companyalso inherited extensive infrastruc-ture and various equipment leftover from the large mine operation.
The acquisition makes greatsense for a number of reasons.Paramount paid roughly $30 perounce of gold resource in theground, an exceptional value. Sec-ondly, there is a very good poten-tial that significant gold can be re-covered from reprocessing of themillions of tons of tailings on sitefrom the prior mining operations.For reference, First Majestic Silveris running a highly profitable tail-ings-recovery operation in a simi-lar project right now. However, thereal upside to this deal comes fromthe discovery potential of the sur-rounding property holdings.
Exploration is what the peopleat Paramount do best. And at
Sleeper, they control a project thatalready has several extremely at-tractive targets outlined. It is amaz-ing to consider that despite thehigh grade resources that weremined for more than a decade,very little exploration work wascompleted beyond the limits of theold mine workings. Some drillholes, punched in the immediatevicinity of the open pit, encoun-tered some good gold intervals, butthey were never followed up on.
I was able to tour the SleeperMine workings in June, and theproject is awesome in terms of itsscale and magnitude. The old pitmeasures more than a mile across,and has now filled with water cre-ating a lake several hundred feetdeep. Huge mounds of mine tail-ings are built up surrounding theold pit. Almost no other human ac-tivity can be detected throughoutthe region, except for the road ex-tending to the mine. It is a dreamdevelopment scenario.
The geologists that are nowpreparing for the first phase of newexploration are almost giddy withexcitement. Several cross-trendingstructures have been identifiedthat may host entirely new re-source zones. Historical explo-ration data and old drill cores arebeing reviewed to shed new insighton the target areas. The companyplans to commence drilling beforethe end of the year.
Taken as a whole, ParamountGold and Silver is an enormouslyattractive junior exploration story.The balance sheet is clean, with nodebt and nearly $20 million onhand. Management has demon-strated effectiveness to completeacquisitions, raise funding andsuccessfully complete explorationto define new resources.
The company now has an estab-lished presence in two high profiledistricts, and controls resources ofmore than 3.5 million gold-equiva-lent ounces. Yet the current marketcap is extremely cheap. I have beenbuying more shares of Paramountrecently, and I think sometime inthe future the company is likely tobecome a high profile takeover can-didate itself — at a much higherprice than it trades at today.
Michael Kachanovsky is a freelancewriter who specializes in juniormining stocks. He can be reachedat [email protected].
Story of Paramount just keeps getting better
By Sunil Vidyarthi
If you took a pollamong investors to-day, dividend payingstocks would top the
list. That worries me a lit-tle even though I just didrecommend the same inmy last missive a monthago. First, everyone is in love withthis strategy, and the second is thefuture of interest rates.
Interest rates are low. Moremoney is floating around, as wellas more confidence, which leads tomore spending, and that meansbetter earnings and higher stockand bond prices. And that oftenleads to higher rates.
But this recession and recoverydo not compare well with anythingin recent memory. It feels more likethe ’30’s depression, at least for themillions who can’t find a job. In the1930s, U.S. rates actually went high-er, peaking in 1932, nearly threeyears after the event. Sure, thebankers made some stupid deci-sions by increasing rates. But afterthey did change course, rates keptfalling for another five years. Manyargue that this time too, ratesshould be stuck in low for at leastanother two years. In other words,dividend payers may be safe for afew more quarters.
There is another problem thistime. Nearly all previous recessions
came to an end by someaction or growth spurt inthe developed world. Thistime, it is quite likely theworld will look substan-tially different (in eco-nomic terms) after the“bad times” are over.
China will likely be inthe driver’s seat, and bar-
ring another destruction sequencewith Pakistan, India too will be wellup there. Have you noticed thenumber of multibillion-dollar dealsflowing out of these supposedlythird-world countries? It is no sur-prise to me to come across a bookentitled Third World America.
Perhaps we shouldn’t play poli-tics although there seems to benothing else going on down south.Let us play with money instead. Ifrates do rise, it won’t be done by thewestern world. It will be due to out-of-control growth in the emergingmarkets. We better hope these nou-veau riche countries get it right.That will be the day, when the cur-rent buy-income-and-dividendsstrategy, will come to an end.
We need to be especially carefulasset allocators and stock pickersto prepare for that day. Fortunate-ly, we have had a lot of experienceliving with inflation and rising ratesduring the last 40 years or so. Whatworks then is common equity withthe possibility of growth.
To do this right, let me take you
to the world as it is likely to be in2020. By then, China, India , Brazil,many parts of Africa and even Rus-sia are all, at least, 100 per cent larg-er in size while the western worldhas grown by, maybe 25 per cent.Japan is probably even smaller. In-cremental demand for consumergoods and services is coming fromthe “rest of the world” as opposedto the so-called first world. Growthis centred in a few large conglomer-ate companies that can supply theentire globe not just domestic mar-kets. This is bad news for our non-resource Canadian companies butgreat news for the outward inclinedU.S. corporations.
I suggest you start with theDow’s 30 industrial stocks. You cango through individual stocks andlook for those with significant non-western connections or you canjust buy the exchange-tradedfunds, which will keep you in thegame when the bottom drops out.My favorite instruments are SPDRDow Jones Industrial Average ETF(DIA-NYSE, $107.32) for U.S.-cur-rency accounts and BMO DowJones Diamonds Index ETF (ZDJ-TSX, $18.79) for hedged Canadian-dollar play. Both track the 30largest U.S. stocks, which are likelyto become the largest global stocksin a decade or so.
Sunil Vidyarthi, M.B.A., PhD, ispresident of Value Sciences Inc.
Get ready to change your strategy
M. Kachanovsky
Sunil Vidyarthi

346 / October 8, 2010 I N V E S T O R ’ S D I G E S T Issue 18 / 10
If you own shares in a blue-chip,dividend-paying company, youmay be able to buy more with-
out paying a transaction fee.A dividend reinvestment plan, or
DRIP, is a program offered by somecompanies and income trusts thatallows shareholders/unitholders toreinvest their dividends/distribu-tions in additional shares/units ofthat company.
Since a company must pay divi-dends to offer a DRIP, our list leanstoward established blue-chip stocks.
To join a DRIP, you must be aregistered shareholder of the issuer.Most issuers allow shareholders toparticipate in the program with onlyone share. But some require more.
Once registered, you’ll thenstart receiving quarterly receipts ortransaction-activity reports. But beprepared. The paperwork associat-ed with a large portfolio of DRIPscan be burdensome.
One criticism is that DRIPs cre-ate an administrative nightmare.After all, every time a company rein-vests your dividends or cash, youradjusted-cost base changes. It’s im-portant to keep track of your adjust-ed-cost base for tax purposes.
A second criticism is that DRIPslead you to pay tax on income youdon’t receive. But if DRIPs suit you,the benefits sure beat the costs. In-vestment guru Peter Lynch saysyou are better off watching yourDRIPs, than in following the mar-ket’s every twist and turn.
DRIPs encourage investors tofollow a simple but effective invest-ment technique — dollar-cost av-eraging. By buying shares on a reg-ular basis, you’ll be spared the nui-sance of buying them when theirprices have gone through the roof.
You’ll also end up getting yourshares at below-average cost. Aswell, you will have profited fromvolatile markets.
No commissions
The biggest advantage of DRIPsis that no other commissions needbe paid. The longer they’re held,the more you benefit.
Moreover, by taking advantageof a dividend reinvestment plan,you’re spared the customaryspread between the “bid” and the“ask” price for a stock.
DRIPs also provide you with thebenefit of compounding. As yourreinvested dividends buy moreshares, your dividends get biggerover time.
Other advantages includeputting your dividends to work im-mediately. This beats letting them sitin your brokerage account until youhave enough cash to invest.
As well, Drips set up ‘forced’savings plans. After all, you cantspend dividends you don’t receive.
Finally, you benefit from thedividend tax credit on Canadianstocks and pay tax on just half ofyour capital gains. Bonds, by con-trast are fully taxed.
The table at right, compiled byeditorial assistant Zoe Ngan, liststhose Canadian companies and in-come trusts offering DRIPs.
Our table shows the frequency
Symbol Company Transfer Agent Internet Address Price Div. Yield DiscountCash
Payment/ Contact (prefix www.) $ $ %
InvestmentFrequencyOption
FAP Aberdeen Asia Pacific CIBC Mellon aberdeen-asset.com 6.99 0.60 8.6 -- Y MonthlyAGF.B AGF Mgmt. Ltd. Computershare agf.com 15.72 1.04 6.6 -- N QuarterlyAEM Agnico-Eagle Mines Ltd. Computershare agnico-eagle.com 70.31 0.18 0.3 5% Y AnnuallyALA AltaGas Ltd. Computershare altagas.ca 19.79 2.16 10.9 5% Y MonthlyBMO Bank of Montreal Computershare bmo.com 60.60 2.80 4.6 5% Y QuarterlyBNS Bank of Nova Scotia Computershare scotiabank.ca 53.46 1.96 3.7 2% Y QuarterlyBCE BCE Inc. Computershare bce.ca 33.67 1.79 5.3 -- Y QuarterlyBAM.A Brookfield Asset Management Inc. CIBC Mellon brookfield.com 28.47 0.53 1.9 -- N QuarterlyBPO Brookfield Properties CIBC Mellon brookfieldproperties.com 16.40 0.59 3.6 -- N QuarterlyCAE CAE Inc. Computershare cae.com 10.69 0.12 1.1 -- N QuarterlyCGI Canadian General Invest. Ltd. Computershare mmainvestments.com 15.96 0.24 1.5 -- Y QuarterlyCTC.A Canadian Tire Corp. Ltd. Computershare canadiantire.com 57.20 0.84 1.5 -- N QuarterlyCWB Canadian Western Bank Valiant Trust cwbankgroup.com 24.03 0.44 1.8 5% N QuarterlyCUP.U Caribbean Utilities Company Ltd.* Valiant Trust cuc-cayman.com 9.09 0.66 7.3 -- Y QuarterlyCVL Cervus Equipment Corp. Computershare cervuscorp.com 11.49 0.72 6.3 5% N QuarterlyCM CIBC CIBC Mellon cibc.com 74.26 3.48 4.7 3% Y QuarterlyCLK ClubLink Enterprises Ltd. CIBC Mellon clublinkenterprises.com 7.00 0.30 4.3 5% N QuarterlyCJR.B Corus Entertainment CIBC Mellon corusent.com 21.13 0.60 2.8 2% N MonthlyCPG Crescent Point Energy Corp. (403)693-0020 crescentpointenergy.com 37.39 2.76 7.4 5% Y MonthlyDAY Daylight Energy Ltd. Valiant Trust daylightenergy.ca 9.48 0.92 9.7 5% Y MonthlyECA EnCana Corp.* CIBC Mellon encana.com 28.45 0.80 2.8 -- N QuarterlyEMA Emera Incorporated Computershare emera.com 27.90 1.12 4.0 5% Y QuarterlyENB Enbridge Inc. CIBC Mellon enbridge.com 51.56 1.70 3.3 2% Y QuarterlyETC Equitable Group Inc. Computershare equitablegroupinc.com 20.50 0.40 2.0 -- N QuarterlyEIF Exchange Income Corp. CIBC Mellon exchangeincomecorp.ca 16.64 1.56 9.4 3% Y MonthlyFTS Fortis Inc. Computershare fortisinc.com 30.87 1.12 3.6 2% Y QuarterlyIMO Imperial Oil Ltd. CIBC Mellon imperialoil.com 38.59 0.43 1.1 -- Y QuarterlyIFC Intact Financial Corp. Computershare intactfc.com 44.26 1.36 3.1 -- N QuarterlyKMP Killam Properties Inc. Computershare killamproperties.com 9.52 0.56 5.9 3% N MonthlyL Loblaw Co. Ltd. Computershare loblaw.ca 41.67 0.78 1.9 3% N QuarterlyMBT Manitoba Telecom Service Computershare mts.ca 27.68 2.15 7.8 3% Y QuarterlyMFC Manulife Financial Corp. CIBC Mellon manulife.com 13.48 0.52 3.9 3% Y QuarterlyMRC Morguard Corp. Computershare morguard.com 41.90 0.60 1.4 -- N QuarterlyNA National Bank of Canada Computershare nbc.ca 66.05 2.48 3.8 -- Y QuarterlyOCX Onex Corp. CIBC Mellon onex.com 28.30 0.11 0.4 -- N QuarterlyPLZ Plazacorp Retail Properties Ltd. CIBC Mellon plaza.ca 3.42 0.19 5.6 3% N QuarterlyNVA Nuvista Energy Valiant Trust nuvistaenergy.com 10.86 0.20 1.8 3% N QuarterlyPOT Potash Corp. of Saskatchewan Inc.* CIBC Mellon potashcorp.com 148.47 0.40 0.3 -- N QuarterlyPRQ Progress Energy Resources Corp. Computershare progressenergy.com 11.57 0.40 3.5 5% N QuarterlyRY Royal Bank of Canada Computershare rbc.com 54.00 2.00 3.7 -- N QuarterlySJR.B Shaw Communications Inc. CIBC Mellon shaw.ca 22.24 0.88 4.0 -- N MonthlySU Suncor Energy Inc. Computershare suncor.com 33.35 0.40 1.2 -- Y QuarterlySLF Sun Life Financial Inc. CIBC Mellon sunlife.com 27.58 1.44 5.2 2% Y QuarterlySPB Superior Plus Corp. Computershare superiorplus.ca 11.99 1.62 13.5 5% Y MonthlySTB Student Transportation of Canada Inc. Computershare rideSTA.com 5.78 0.56 9.7 3% N MonthlyT Telus Corp. Computershare telus.com 43.78 2.00 4.6 3% Y QuarterlyTRI Thomson Reuters Corp.* Computershare thomsonreuters.com 37.80 1.16 3.1 -- N QuarterlyTHI Tim Hortons Inc. Computershare timhortons.com 37.95 0.52 1.4 -- Y QuarterlyTD Toronto-Dominion Bank CIBC Mellon td.com 76.08 2.44 3.2 1% N QuarterlyTS.B Torstar Corp. CIBC Mellon torstar.com 12.33 0.37 3.0 -- N QuarterlyTA TransAlta Corp. CIBC Mellon transalta.com 21.62 1.16 5.4 -- Y QuarterlyTRP TransCanada Corp. Computershare transcanada.com 38.01 1.60 4.2 3% Y Quarterly
CashSymbol Income Trust / Closed-End Fund Transfer Agent Internet Address Price Dist. Yield Discount Investment Payment
/ Contact (prefix www.) $ $ % Option Frequency
AEU.UN Activenergy Income Trust (416)362-0714 middlefield.com 6.99 0.84 12.0 5% Y MonthlyAP.UN Allied Properties REIT CIBC Mellon alliedpropertiesreit.com 21.31 1.32 6.2 5% N MonthlyAET.UN ARC Energy Trust Computershare arcresources.com 20.45 1.20 5.9 5% Y MonthlyAX.UN Artis REIT CIBC Mellon artisreit.com 13.49 1.08 8.0 4% Y MonthlyBTE.UN Baytex Energy Trust Valiant Trust baytex.ab.ca 35.84 2.16 6.0 5% N MonthlyBA.UN Bell Aliant Regional Communications I.F. CIBC Mellon bell.aliant.ca 25.80 2.90 11.2 -- Y MonthlyOGF.UN Brompton Oil & Gas I.F. Computershare bromptongroup.com 4.75 0.42 8.8 5% N MonthlyVIP.UN Brompton VIP Income Fund Computershare bromptongroup.com 8.91 0.84 9.4 5% Y MonthlyCWT.UN Calloway REIT Computershare callowayreit.com 24.01 1.55 6.5 3% N MonthlyCAR.UN Canadian Apartment Properties REIT Computershare capreit.net 16.65 1.08 6.5 5% N MonthlyREF.UN Canadian REIT CIBC Mellon creit.ca 30.79 1.41 4.6 4% Y MonthlyCPA.UN Capital Power Income L.P. Computershare capitalpowerincome.ca 18.41 1.76 9.6 5% Y MonthlyCRH.UN Charter REIT Computershare charterreit.com 1.54 0.16 10.4 3% Y MonthlyCSH.UN Chartwell Seniors Housing REIT Computershare chartwellreit.ca 8.61 0.54 6.3 3% N MonthlyCLC.UN CML Healthcare Income Fund CIBC Mellon cmlhealthcare.com 11.12 1.07 9.6 -- N MonthlyCUF.UN Cominar REIT Computershare cominar.com 20.91 1.44 6.9 5% N MonthlyCMZ.UN Compass Income Fund (416)362-0714 middlefield.com 10.30 0.96 9.3 5% Y MonthlyD.UN Dundee REIT Computershare dundeereit.com 27.61 2.20 8.0 4% Y MonthlyENF.UN Enbridge Income Fund CIBC Mellon enbridgeincomefund.com 15.40 1.15 7.5 -- Y MonthlyEPF.UN Energy Plus Income Trust Computershare citadelfunds.com 7.23 0.51 7.1 -- Y MonthlyERF.UN Enerplus Resources Fund Computershare enerplus.com 24.54 2.16 8.8 5% Y MonthlyEIT.UN Enervest Diversified Income Trust Computershare enervest.com 13.31 1.20 9.0 -- Y MonthlyEOS.UN Enervest Energy & Oil Sands T. R. Trust Computershare enervest.com 8.49 0.50 5.9 -- Y MonthlyEXE.UN Extendicare REIT Computershare extendicare.com 9.71 0.84 8.7 3% N MonthlyFC.UN Firm Capital Mortgage Investment Trust Computershare firmcapital.com 11.77 0.94 8.0 -- Y MonthlyFFI.UN Flaherty & Crumrine Inv. Grade Fixed I.F. Computershare bromptongroup.com 10.25 0.96 9.4 5% N MonthlyFRU.UN Freehold Royalty Trust Computershare freeholdtrust.com 16.80 1.68 10.0 -- N MonthlyHR.UN H&R REIT CIBC Mellon hr-reit.com 19.75 0.78 3.9 3% Y MonthlyIDX.UN Indexplus Income Fund (416)362-0714 middlefield.com 11.11 0.96 8.6 5% Y MonthlyINN.UN InnVest REIT Computershare innvestreit.com 6.83 0.50 7.3 -- N Monthly
To increase your shareholdings, tap into DRIPsA dividend reinvestment plan allows you to buy additional stock more efficiently — and more cheaply
Continued on next pageContinued on next page

Issue 18 / 10 I N V E S T O R ’ S D I G E S T October 8, 2010 / 347
IPL.UN Inter Pipeline Fund Computershare interpipelinefund.com 13.03 0.90 6.9 5% Y MonthlyJE.UN Just Energy Income Fund Computershare je-un.ca 14.15 1.24 8.8 2% Y MonthlyKEY.UN Keyera Facilities Income Fund Computershare keyera.com 29.27 1.80 6.1 3% Y MonthlyMPT.UN Macquarie Power & Infrastructure I.F. Computershare macquarie.com/mpt 7.18 0.66 9.2 -- Y MonthlyDR.UN Medical Facilities Corporation Computershare medicalfacilitiescorp.ca 9.50 1.10 11.6 -- N MonthlyMID.UN MINT Income Fund (416)362-0714 middlefield.com 9.59 0.84 8.8 -- Y MonthlyMRT.UN Morguard REIT Computershare morguardreit.com 13.70 0.90 6.6 -- N MonthlyNAE.UN NAL Oil & Gas Trust Computershare nal.ca 11.35 1.08 9.5 5% Y MonthlyOSF.UN Oil Sands Sector Fund CIBC Mellon marklandstreet.com 5.89 0.50 8.5 5% Y QuarterlyPEY.UN Peyto Energy Trust Valiant Trust peyto.com 14.54 1.44 9.9 5% Y MonthlyRIG.UN Pantera Drilling Income Trust Valiant Trust panteradrilling.com 3.09 0.36 11.7 5% N MonthlyPKI.UN Parkland Income Fund Valiant Trust parkland.ca 11.42 1.26 11.0 -- N MonthlyPGF.UN Pengrowth Energy Trust Computershare pengrowth.com 10.84 0.84 7.7 5% Y MonthlyPWT.UN Penn West Energy Trust CIBC Mellon pennwest.com 19.58 1.80 9.2 5% Y MonthlyPMZ.UN Primaris Retail REIT CIBC Mellon primarisreit.com 19.04 1.22 6.4 3% N MonthlyPVE.UN Provident Energy Trust Computershare providentenergy.com 7.21 0.72 10.0 5% Y MonthlyREI.UN RioCan REIT CIBC Mellon riocan.com 22.71 1.38 6.1 3.1% Y MonthlyRYL.UN Royal Host REIT Computershare royalhost.com 2.49 0.03 1.2 3% N MonthlyTRH.UN Triax Diversified High Yield Trust Computershare firstassetfunds.com 12.20 0.84 6.9 -- N MonthlyWRK.UN Whiterock REIT CIBC Mellon whiterockreit.ca 17.20 1.68 9.8 4% Y MonthlyYP.UN Yieldplus Income Fund (416)362-0714 middlefield.com 6.38 0.84 13.2 -- Y MonthlyZAR.UN Zargon Energy Trust Valiant Trust zargon.ca 18.13 2.16 11.9 -- N Monthly
* Denote dividends paid in U.S. dollars. Transfer Agents: CIBC Mellon: (800)387-0825 Computershare: (800)564-6253 Valiant Trust: (866)313-1872
Symbol Income Trust / Closed-End Fund Transfer Agent Internet Address Price Div. Yield DiscountCash
Payment/ Contact (prefix www.) $ $ %
InvestmentFrequencyOption
that a company/income trust paysdividends/distributions.
Most of the columns on thetable are self-explanatory, but two— discount and cash investmentoption — need some elaboration.
Simply put, a cash investmentoption allows someone to buymore shares by paying cash direct-ly to the company. The investor,therefore, adds to his shares with-out paying a brokerage fee.
We note that a company or trustoffers a cash investment option,however, investors should contactthe transfer agent for the details.
Some DRIPs offer a discount inthat additional shares are boughtat a discount to the average mar-ket price.
The listed prices are the onesfrom which the dividend yield hasbeen calculated.
They were taken from theSept. 20, 2010 close. Our next tableof DRIPs will appear in the Dec. 24,2010, issue of Investor’s Digest.

I N V E S T O R ’ S D I G E S T
INVESTING 101EXPANDING YOUR INVESTMENT KNOWLEDGE
348 / October 8, 2010 Issue 18 / 10
Reprinted with permission
Remember 1980? It was adifficult year around theworld, as evidenced by thesomber public mood.
The U.S. and much of Europewere trying to reverse a decade-long tide of rising interest rates,high inflation and sluggish growth.
In the U.S., the core inflationrate rose above 12.5 per cent, whilethe U.S. government paid 17.5 percent for short-term money fundedwith three-month T-Bills.
Elsewhere, the rate paid for aconventional 30-year mortgagereached 16 per cent and good cor-porate credits saw the prime rateclimb above 20 per cent.
Risk takers were few
It was expensive to take risksand few dared or could afford to.All this happened while the last ofthe baby boom generation was en-tering the workforce.
The rest of the world didn’t faremuch better. Sub-Saharan Africa,for example, suffered from over-whelming poverty, as well as fromgrowing political instability.
The main exceptions wereJapan, which was continuing itspost-war rise, and the oil-richcountries, which remained benefi-ciaries of an endless and vital re-source in great demand — petrol.
For the typical investor, theprospect of better economic timesand surging financial marketsseemed far-fetched.
Virtually no one realized thatthis dismal year actually marked adramatic inflection point.
Indeed, the leadership andstructure of governments theworld over was beginning tochange, real economic growth wasset to accelerate, a wave of techno-logical innovation was about totake hold and financial marketswere ready to take off.
What had happened was thatthe same destructive forces of in-flation and historically high inter-est rates that had wreaked eco-nomic havoc triggered a politicalbacklash against the existing order.
The backlash started in theU.K., where Margaret Thatcherand the Tories came to power in1979 and implemented reformsthat eventually lowered inflation,reduced regulatory barriers and setin motion an economic surge.
The U.S. followed suit in 1980,electing Ronald Reagan. With Rea-gan and with Paul Volcker as thehead of the U.S. Federal Reserve,trends started to reverse.
After years of dealing with dou-ble-digit inflation and interest rateswell over 10 per cent, the stage wasbeing set for the beginning of thegreat equity bull market that lastedin the U.S. until 2000.
Reducing inflation and lower-ing interest rates also meant thatthe cost of capital was lower, whichmade investing more attractive.
The risk-free rate fell as did therisk premium. In other words,growth expectations rose as in-vestors’ confidence grew.
Lowering the cost of capitalmeant that the value of a dollar ofprofit rose. For the equity markets,it meant valuations increased.
Concurrent with these changeswere regulatory and technologicaldevelopments, making investingmore accessible and less costly tothe individual investor.
Investment products proliferat-ed, as did the number of financialmarkets worldwide that were opento investors from other nations.
At about the same time, on theother side of the world, big changeswere also brewing.
In China, late 1978 saw the be-ginning of reforms that wouldeventually catapult that country toits current position as the world’ssecond-largest economy.
Since then, China’s economyhas more than quintupled by sus-taining an annual compoundgrowth rate of over 12 per cent.
The Chinese reforms would beone of five major events creatingthe foundation for a major wave ofglobalization and, with it, the cre-ation of financial wealth.
Other factors were key
The other four events were themove to free markets through theelections of Margaret Thatcher andRonald Reagan, the fall of theBerlin Wall, the start of the WorldWide Web and the free trade initia-tive started under the first Bush ad-ministration and put into effect bythe Clinton administration.
Altogether, these events formedthe foundation for a more openeconomy, triggering a surge of in-novation, a decline in geopoliticaltensions, more open communica-tion and a surge in education.
Over the next 25 years, thatwave of technological and politicalchange would alter many assump-tions, as well as some of the struc-tures of daily life.
Taken for granted now in mostdeveloped countries are the net, e-mail, cell phones, smartphonesand gazillions of other gizmos.
Many of these technologieswere introduced into developingmarkets much faster than previ-ously was the case. As they grew,the economy and financial mar-kets grew with them.
The Great Deleveraging
By Chip Dicksonand Oded Shenkar
Financial Times PressCopyright 2011
$31.99, 317 pages
Between 1980 and 2007, theglobal economy grew more than3.5 times. Global gross domesticproduct reached almost $55 tril-lion. Indeed, on a real basis, it grewmore than 2.5 times.
Per capita, GDP went from$2,771 in 1980 to $8,443 in 2007.The value of the world’s stock mar-kets increased from close to $675per person to just under $9,500 —up more than 14 times.
In the meantime, the value ofall financial assets climbed fromnear $2,700 per person to an esti-mated $28,500.
Strong economic growth, alongwith attractive financial marketperformance, coincided with pop-ulation growth.
It also coincided with otherpositive trends like lower povertylevels, rising life expectancy anddeclining illiteracy.
In 1981, almost 52 per cent of the
world’s population lived on no morethan $1.25 a day; almost 75 per centlived on less than $2.50 a day.
By 2005, the number of peopleliving on $1.25 a day had fallen to25.2 per cent, while the number liv-ing on $2.50 a day had fallen to 56.6per cent — a big improvement.
The global illiteracy rate fellfrom 30.3 per cent in 1980 to 18.3per cent in 2005 according to UN-ESCO. In the U.S., meanwhile, lifeexpectancy rose from 73.7 years in1980 to 77.8 years in 2005.
Improvements in the quality oflife occurred while the world’spopulation expanded from 4.43billion people in 1980 to more than6.7 billion people in 2008.
In 2005, in a global populationof 6.5 billion, 1.2 billion peoplelived in developed countries, 5.3billion in developing nations.
The combination of populationand economic growth broughtwith it a surge in the number ofnew businesses created.
Those new businesses oftencame from new industries andproduct lines, such as personalcomputers, cell phones, semicon-ductors, the Internet, credit cards,mortgage banking and health care,to name just a few.
The post-1980 era alsosaw a major wave of globalization,which was reflected first in the eco-nomic mix and only more recentlyin the investment mix.
In 1992, the developed world’sshare of the global economytopped 75 per cent. As recently as2000, it was close to that level.
But from 2000 to 2007, the de-veloped world’s share declined to68 per cent. Since 2001, the U.S.share of the global economy hasdeclined to 23 per cent from 32 percent, according to the World Bank.
Japan’s 2008 share of eight per
cent global GDP represents a bigreduction in its share since 2001,when it was 12.9 per cent.
The developing world has con-tinued to gain share since 2001. Forexample, China saw its share ofglobal GDP rise from 4.2 per cent to7.1 per cent in 2008.
This was a period when low-and middle-income nations loggedfaster growth, garnering a biggershare of the global economy.
In line with the economic mix,the developed world controlled thelion’s share of financial assets.
As recently as 2001, the U.S.stock market represented over 50per cent of global equity marketcapitalization.
But by the end of 2007, the U.S.equity market accounted for only30 per cent of global equity with amarket cap of over $60 trillion.
Between 2002 and 2007, the sizeof the equity market almost tripled,and it increased more than sixtimes between 1992 and 2007.
Investment zoomed
An investor in the global equitymarket in 1980 saw his investmentincrease more than 20 timesthrough 2007.
With the global economy, thecharacter and structure of the glob-al financial markets also changeddramatically.
The forces stimulating thegrowth of the financial marketsstarted in the late 1970s as inflationand interest rates began to peak inmuch of the developed world.
Also, the technologies drivingthe digitalization of the economybecame more accessible, afford-able, and of greater importance.
This started the initial stage offinancial asset growth relative toGDP in some of the world’s devel-oped countries.
The economic and financialsuccess of 1980-’07 was construct-ed on some very durable founda-tions, but also on some false ones.There were weaknesses and struc-tural decay only a few recognized.
As is often the case, perceptionfailed to match reality. Since theend of 2007, the global equity mar-kets have lost more than 50 percent of their value from peak totrough. And much of the world’seconomy has fallen into recession.
Future economic and financialprospects seem less attractive,even though a modest recovery hasalready begun.
Through it all, the world’s pop-ulation continued to grow. Thatgrowth is expected to continuethrough 2050, albeit at a slowerrate. By 2050, the world’s popula-tion is expected to top nine billion.
In the interim, the U.S. is ex-pected to remain the third mostpopulous country in the world withmore than 400 million people.
Its population growth is expect-ed to exceed global populationgrowth — in large part because ofmore open immigration.
The global economy and finan-cial market should continue to bevolatile and evolve, while theworld’s population continues togrow. There will be many chal-lenges. But there will also be manyopportunities.
The odd thingabout good times?They often resultfrom bad times.
In 1980, the economy was on the ropes. Yet,at the same time, forces were unleashed thatwould spark one of the greatest global booms
ever, say Chip Dickson and Oded Shankar

WestJet Airlines Ltd.WJA-TSX, $11.75 ($11.85)
More folks are flying WestJet,says Chris Murray, citing that air-line’s 8.2 per cent jump in passen-ger traffic for August.
And the increase — in-line withhis estimate — shows that Canadi-ans are continuing to put them-selves aboard planes, he believes.
In the meantime, he suggestsWestJet will not only grab a biggerchunk of the business traveler mar-ket, but see its vacations operationsgrow as well.
Thanks to the latter, as well ashigher ancillary fees, the airline islikely to post an increase in third-quarter unit revenue of 4.7 percent, says the analyst.
For Mr. Murray, who’s with PIFinancial in Toronto, WestJet stillmerits a rating of “buy/above-av-erage risk.” He’s also sticking withhis price target of $17 a share.
Athabasca Oil Sands Corp.ATH-TSX, $10.52 ($10.48)
Jeff Martin is saying little aboutAthabasca’s purchase of ExcelsiorEnergy, other than listing the price($85 million) the closing date(November) and similar details.
That’s because Peters & Co., hisemployer, was an advisor toAthabasca on the recent transaction.
As a result, Mr. Martin can pro-vide neither a rating nor a 12-month price target. In fact, he nowclassifies Athabasca as “restricted.”
But he does note that the acqui-sition boosts the company’s oil as-sets at Hanginstone, Alberta to 584from 412 million barrels.
Back in early July, Mr. Martinhad pegged Athabasca at sectoroutperform with a 12-month pricetarget of $15 a share.
Reliable Energy Ltd.REL-TSX/VEN, $0.34 ($0.30)
In its second quarter, ReliableEnergy was well, reliable, RobertCooper might tell you.
Just look at its performance ac-cording to one standard measure:barrels of oil equivalent.
At a daily rate of 311 BOE, Reli-able was only 10 per cent belowMr. Cooper’s forecast, while at$75.69, its gross sales per BOE werejust three per cent off the mark.
And even though Reliable’scash flow of $700,000 was $500,000below the analyst’s estimate, thegap per share was a mere $0.01.
Mr. Cooper admits Reliablemanaged to drill only three wells inthe second quarter. But he blamesthis on bad weather.
He also notes that the compa-ny, following the lead of other en-ergy plays in the Saskatchewan-Manitoba border area, is preparingto do horizontal drilling.
Indeed, Reliable expects its hor-izontal wells will yield 100 barrels aday — 40 barrels more than it nowgets from its vertical wells.
Meanwhile, the company israising its capital budget 40 per centto $23 million, now that it plans toramp up exploration and develop-ment over the remainder of 2010.
It is also pegging ’10 daily out-put at 450 BOE; 2010 exit produc-tion at 900 BOE.
Not surprisingly, Mr. Cooper,who’s with Acumen Capital Part-ners in Calgary, is keeping the faith.
Not only is he standing by hisprice target of $0.50 a share, buthe’s sticking with his recommen-dation of “speculative buy.”
Cathay Forest Products Corp.CFZ-TSX/VEN, $0.85 ($0.37)
John Duncanson is interimCEO at Cathay Forest Products.
And he seems to have clearedaway some of its operational un-derbrush, Richard Kelertas reports.
For starters, Mr. Duncansonhas updated Cathay’s harvestingplans. But he has also streamlinedoperations at DEL 1, one of its tim-ber concessions in Central Siberia.
Indeed, Mr. Duncanson has re-duced much of DEL 1’s waste, thusraising margins, Mr. Kelertas says.
Meanwhile, Cathay continuesto clear a path in the forest, havinglogged second-quarter sales at DELI of more than 58,000 cubic metres.
In fact, production capacityfrom DEL II’s three harvestingcomplexes could hit 270,000 cubicmetres — even 300,000 cu. m,should a fourth harvesting com-plex be added, says Mr. Kelertas.
And although he admits Cathayis taking its time at its second tim-ber concession — DEL II — hedoes note that it still plans to equipit with a 90,000 cu. m sawmill.
Indeed, he expects that in thesecond half of 2011, Cathay’s har-vest at DEL II will top 100,000 cu.m, rising to 400,000 cu. m in 2012.
The analyst does note that be-cause of weak poplar prices,Cathay will likely delay its harvestsat its China timber plantations.
The company, he notes, willprobably do most of its China har-vesting in the fourth quarter —from its plantations in Shandong.
The amount to be harvestedwill likely total 10,000 cu. m, ac-cording to the company.
For Mr. Kelertas, a Montreal-based analyst with Dundee CapitalMarkets, Cathay Forest Productsstill merits a rating of “buy/highrisk.” He’s also sticking with hisprice target of $0.85 a share.
Goldcorp Inc.G-TSX, $44.87 ($44.25)
Goldcorp has edged out Eldora-do Gold to buy Andean Resourcesfor $3.6 billion. And BrianMacArthur suggests that’s good.
For one thing, he says, Gold-corp can easily fund the deal, giventhe proceeds from its asset sales.
He also believes the companyhas the money to upgrade An-dean’s main asset: the Cerro Negrogold project in southern Argentina.
In fact, Goldcorp can go aheadwith the upgrading without jeopar-dizing its own list of projects, sug-gests Mr. MacArthur, who’s withUBS Investment Research.
Not surprisingly, he’s continu-ing to rate Goldcorp as a “buy,” al-though he’s boosting his 12-monthprice target to US$56 from $51.
He’s also hoisting Goldcorp’snet asset value to $36.54 from$35.18 a share.
Under the purchase agreement,announced in September, Gold-corp will exchange each Andeanshare for 0.14 Goldcorp shares, or acash payment of $6.50.
CGI Group Inc.GIB.A-TSX, $14.80 ($14.76)
Dushan Batrovic is taking await-and-see attitude toward CGI,a Montreal-based provider of in-formation technology services.
He suggests that because itsshares are roughly 12 per cent be-
low their recent highs, CGI is nowan investment bargain.
But he’s pegging the companyat “neutral” — he had pegged it asa buy — while it digests the U.S. in-formation technology outfit itbought in May for $900 million.
That company, Stanley Inc.,may turn out to be a mixed bless-ing, suggests Mr. Batrovic, a Toron-to-based analyst with DundeeCapital Markets.
Although he admits the dealmay offer upside potential, such abenefit is more likely to stem fromrevenue synergies.
And revenue synergies, henotes, take longer to play out thanthose on the cost side.
Mr. Batrovic suggests a “neu-tral” on CGI is also in order, givenwhat he says is the strong possibil-ity that the company will turn in apoor fourth quarter.
But because of the Stanley pur-chase, he is raising CGI’s fourth-sales to $1 billion from $920 mil-lion, while hoisting fiscal 2011 rev-enue 26.3 per cent to $4.8 billion.
He’s also raising CGI’s net earn-ings by a penny to $0.32 a share.Yet, he’s sticking with his 12-month price target of $17.
Iamgold Corp.IMG-TSX, $18.20 ($15.32)
Iamgold’s production of theworld’s most famous preciousmetal declined in the second quar-ter, Dan Rollins reports.
At 190,000 ounces, its outputwas 10 per cent below his forecast,or eight per cent lower quarter overquarter, while at $623 an ounce, itscash costs were 15 per cent higher.
The quarterly drop reflects low-er grades at the company’s mines,says Mr. Rollins, an analyst withUBS Investment Research.
Iamgold also proved a disap-pointment on the earnings side,posting net income of $0.10 a share— $0.05 shy of the analyst’s esti-mate, as well as a nickel below theconsensus call.
The company, nonetheless, isbeing bullish, raising the low end ofits full-year output target to980,000 from 940,000 ounces.
It also now sees cash costs com-ing in between $530 and $550,rather than between $490 and $510an ounce, as it previously forecast.
Mr. Rollins, for his part, is peg-ging Iamgold’s output at 992,000ounces, with cash costs of $532.
Meanwhile, he’s raisingIamgold to “buy” from neutral,while boosting his price target to$23 from US$14 a share.
Agrium Inc.AGU-TSX, $70.07 ($53.34)
John Redstone wants Agrium toshow him the money.
He admits the fertilizer makerhas enough cash to buy AWB, anAustralian agribusiness concern.
And the purchase, he notes cit-ing Agrium, would allow that com-pany to beef up its presence inboth Australia and New Zealand.
Moreover, he points out, it’s notas if Agrium is a stranger totakeovers, having successfullynotched US$3.4 billion of acquisi-tions over the past six years.
But Mr. Redstone, who’s withDesjardins Securities, wants assur-ance the deal will go ahead beforegiving Agrium the thumbs-up.
So, he’s changing the Canadianagribusiness giant to a “hold” froma buy, while cutting his price target$5.80 to $70 a share.
AlarmForce Industries Inc.AF-TSX, $7.16 ($5.05)
AlarmForce rang in lower-than-expected numbers for the thirdquarter, reports Brian Pow.
But he’s hardly sounding thetocsin. Although the companytrailed his estimates, the differ-ence, he admits, wasn’t that big.
At $9.5 million, for example,sales were only $300,000 below hisforecast, while at $1.4 million, or$0.11 a share, net income was justa penny off the mark.
Moreover, at 78 per cent, thecompany’s gross margin was actu-ally 60 basis points higher.
AlarmForce’s weaker numbersreflect smaller-than-expectedgrowth in its subscriber base.
But the company still boastssome good stats, having posted op-erating expenses, relative to sales,that were in-line with historical av-erages, the analyst says.
In fact, the gap between Alarm-Force’s net income and Mr. Pow’sforecast came as close as it did be-cause the tax rate — 29.5 per cent —was 230 basis points lower.
The company also saw its cashbalance grow by $3 million to $9.5million, while posting operatingcash flow of $2.2 million.
Mr. Pow admits the companylogged a decline in AlarmCare sub-scribers, with that number drop-ping to 3,700 from 3,800.
But he says he’s not concerned,given that AlarmCare isn’t a key fo-cus for the company.
For Mr. Pow, who’s with Peters& Co. in Calgary, AlarmForce con-tinues to merit a “buy,” althoughhis price target — $6.90 a share ayear ago — is now $1.20 higher.
He’s also tweaking his fiscal2011 estimates, cutting revenue to$42.3 million from $43.4 million,while shaving $300,000 off his netincome estimate of $5.3 million, or$0.44 a share. His new EBITDAnumber is $11.4 million — $900,000below his previous forecast.
Essential EnergyServices Ltd.ESN-TSX, $1.21 ($0.84)
Greg Colman added EssentialEnergy Services to his coverage listabout a year ago with a “buy.”
And he’s keeping it there now,although he’s upped it to a “strongbuy.” He’s also raised his price tar-get to $2.25 from $2 a share.
His attraction is easy to under-stand, considering what he says arethe company’s many pluses.
For starters, he notes, Essentialis diversified, given its interests inmulti-stage fracturing, as well astool and equipment rentals.
The company is also in good fi-nancial shape, having eliminatedits outstanding debt, despite aslowdown in the oilpatch.
What’s more, Essential Energyboasts an undrawn credit facility of$50 million.
Then, there’s the company’svaluation. Given assets of $177 mil-lion, Essential deserves an enter-prise value higher than the $81 mil-lion it now has, says Mr. Colman.
He also likes Essential’s com-paratively low price. Indeed, it’s thecheapest name among those oil-field services firms he now covers.
Not surprisingly, Mr. Colman,who’s with Wellington West Capi-tal Markets, thinks Essential maysoon become a takeover target. In-deed, he sees the company beingcourted by any number of suitors.
And regardless of whether theacquirer buys all or just part of Es-sential, such a transaction, he sug-gests, would benefit all parties.
The product of a merger inApril, 2008, Essential Energy boaststhe sixth-biggest fleet of service rigsin Canada.
THREE-MONTH FOLLOWUP
How July research has faredPhillip Fine updates recommendations from our July 9, 2010, edition
ANNUAL FOLLOWUP
What was said 12 months agoUpdated recommendations from our October 9, 2009, edition
349 / October 8, 2010 WHAT THE BROKERS SAY ABOUT CANADIAN STOCKS Issue 18 / 10
I N V E S T O R ’ S D I G E S T

˜350 / October 8, 2010 I N V E S T O R ’ S D I G E S T Issue 18 / 10
VIEWS OF LEADINGCANADIAN ANALYSTSVIEWS OF LEADING
CANADIAN ANALYSTS
Quest Capital JENNINGS CAPITAL New strategyDigested from a Sept. 1 report byanalyst Marc Charbin
Mr. Charbin begins coverage ofQuest Capital Corp. (QC-TSX,$1.61) with a “buy” rating and aone-year target price of $2.50. Hewrites:
Quest Capital recently an-nounced that it intends to refocus itsbusiness to address the resourcelending niche. With a top notch ex-ecutive team and board, we believethe company could be embarking ona period of aggressive loan bookgrowth. Currently trading underbook value, the investment is also at-tractive from a valuation perspective.
On June 10, QC announced thatit had entered into a letter of intentwith Sprott Consulting LimitedPartnership to refocus and rebrandQuest as a lender to the natural re-source sector under the nameSprott Resource Lending Corp.(“SRL”). This arrangement offersthe opportunity to leverage the dealflow and investment expertise ofthe Sprott organization (“Sprott”).For Sprott, QC provides a consider-able degree of expertise in resourcelending and a meaningful assetbase to deploy to target borrowers.
SRL intends to provide bridgeand mezzanine debt to mining andenergy companies. The initial tar-get loan size is expected to be be-tween $10 million and $15 million,for terms between 12 and 18months, and with an expected cashinterest yield of 12% per annumplus bonus shares/warrants for atotal yield of ~20%.
The current Quest manage-ment team, led by Murray Sinclairand Brian Bayley, who will be stay-ing with SRL, has considerable ex-perience in the resource lendingsector. Peter Grosskopf, recentlyappointed CEO of Sprott Inc., willbe CEO of SRL and will be appoint-ed to the board along with JohnEmbry of Sprott Asset Manage-ment and Murray John of DundeeResources Ltd. To date, both theRule Family Trust (8.8% owner-ship) and Dundee Corp. (11.1%ownership) have publicly notifiedshareholders that they will retaintheir current interest in QC.
Over the course of the next year,we expect the company will be pri-marily focused on winding-up itsexisting loan book and using theproceeds to invest in resourceloans. As a result, we do not expectloan book growth until later in 2011or 2012. We currently forecast theloan book to reach $500 million af-ter the third full year of operation(2013). Based on the projected eco-nomics of the company’s newbusiness model, we expect double-digit ROE by 2013.
Historically, lenders have tradedbetween 1.5x and 2.1x P/BV, de-pending on the level and consisten-cy of ROE. We apply a 1.2x multipleto FY 2011 ending book value,which calculates to $2.43 per share,to obtain our 12-month target price.We believe a modest discount is
currently appropriate, given the po-tential volatility in earnings due tothe nature of the portfolio and lim-ited history on rates of return.
Quest Capital is currently a resi-dential real estate lender. On June 10,the company announced it had en-tered into a letter of intent to refocusand rebrand as a lender to the natu-ral resource sector in partnershipwith Sprott Consulting Limited Part-nership, called Sprott Resource Lend-ing Corp. The plan received share-holder approval Aug. 17 and shouldbecome effective Sept. 7, 2010.
Alliance GrainTradersCANACCORD GENUITYMore overseas growthDigested from a Sept. 7 report byanalyst Keith Carpenter
Mr. Carpenter maintains his“buy” recommendation for Al-liance Grain Traders (AGT-TSX,$28.32). He also reiterates his 12-month target price of $41 a share.Mr. Carpenter writes:
Alliance Grain Traders hassigned a Letter of Intent to acquirethe assets of Northern Yorke Pro-cessors in Kadina, South Australia.It stated the acquisition will befunded as a part of the C$10 millioninvestment announced last week:the acquisition of Balco Grain (asimilar processing plant, withproperty and equipment, also inSouth Australia). The expectedclosing date for both deals is Sept.30, 2010, and is subject to variousconditions and due diligence.
Combined with Balco, theNorth Yorke facilities will have astorage capacity of 50,000 tonnesand a processing capacity of100,000 tonnes a year. We believethe margins on the business will beabout US$70 a tonne in 2011. How-ever, we expect this to increase toits steady run rate of about $90 atonne following the upgrade of thepackaging facilities to value-addedpulse processing (which excludescolour sorting and splitting). Wehad previously added the estimat-ed increased earnings from thistransaction in a previous note. Theestimated transaction multiple is ata low three times EBITDA follow-ing the planned upgrade. (EBITDAis earnings before interest, taxes,depreciation and amortization.)
Alliance Grain Traders also an-nounced it has begun constructionon two projects in Turkey: a newshort-cut pasta line at its Arbella fa-cility in Mersin, and the construc-tion of a new rice processing millnear Erdine. The pasta processingfacility will add 36,000 tonnes peryear in capacity at similar marginsand operating rates to the existingpasta lines (which have current ca-pacity of 100,000 tonnes). The ricefacility will have capacity of 65,000tonnes per year. The company es-timates the cost of the two projectsto be C$15 million, with comple-tion expected in the first quarter of2011. We estimate an additional$2.7 million in EBITDA in 2011,and $5 million in 2012 under a full-
year processing scenario. There-fore, as noted above, this means weestimate the $15 million cost of thetransaction to be three times esti-mated full run rate EBITDA.
The transactions are in-linewith our expectations of the firmmaking acquisitions that will boostprofit, at low earnings multiples, inthe following jurisdictions: Turkey,Australia, North America and In-dia. We continue to expect furtherannouncements of similar scale inthe near future. Management con-tinues to position the firm towardsa stronger and less volatile earn-ings base. We believe this strategywill continue to unfold.
We are increasing our fiscal2011 EBITDA estimate to $100.5million from $97.8 million previ-ously and raising our EPS forecastto $3.33 from $3.22.
Alliance Grain Traders process-es specialty crops (including lentils,peas, chick peas and beans) from its20 facilities in Canada, the U.S.,Australia and Turkey. Its Turkishsubsidiary also produces pasta, riceand milled wheat products.
Ag Growth Int’lWELLINGTON WESTFocused on int’l growthDigested from an Aug. 12 reportby analyst Robert Winslow
Mr. Winslow maintains his“buy” recommendation for AgGrowth International (AFN-TSX,$36.30). He also reiterates his 12-month target price of $40 a share.The stock pays a monthly dividendof $0.17, or $2.04 a year, giving it ayield of 5.6%. Mr. Winslow notesthat this implies a total one-yearreturn of 16%. He writes:
Second quarter sales of $72.4million beat estimates on strongU.S. agricultural demand and in-ternational growth. Sales wereabove our $70.2 million estimateand $69 million Thomson ONEconsensus, as strong U.S. and in-ternational demand offset chal-lenged Canadian markets.
Adjusted EPS of $0.88 beat our$0.80 estimate on solid gross mar-gin and a robust top-line. AgGrowth’s gross margin of 39.7%largely met our 40.4% forecast,though the company was chal-lenged by a higher cost sales mixand foreign currency exchangerates. Adjusted EBITDA came in at$18.8 million versus our estimate of$17.2 million. (EBITDA is earningsbefore interest, taxes, depreciationand amortization.)
Reflecting the strong secondquarter results, we have raised ourfiscal 2010 EPS estimate slightly,given strong second quarter re-sults; however, our fiscal 2011 EPSestimate is unchanged. Our fiscal2010 EPS forecast is now $2.40, up$0.05 from our previous estimate.We believe continued internation-al market strength (second quartersales were up 48% compared to ayear earlier) will support our opti-mistic fiscal 2011 estimates.
Second quarter 2010 resultswere above our expectations owingto strong U.S. demand for handling
Every issue of Investor’s Digest contains upwardsof 50 digested research reports from Canada’stop analysts. The reports listed below can be
found on pages 349 to 357.
COMPANIES IN THIS ISSUE
AG Growth Int'l.Wellington West . . . . . . . . . . . . . .Buy
AgriumDesjardins Securities . . . . . . . . .Hold
AlarmForcePeters & Co. . . . . . . . . . . . . . . . . . .Buy
Alliance Grain TradersCanaccord Genuity . . . . . . . . . . .Buy
Andean ResourcesUBS Investment Research .Neutral
Andina MineralsCanaccord Genuity . . . . . . . . . . .Buy
Asia Bio-Chem GroupDundee Capital Markets . . . . . . .Buy
Athabasca Oil SandsPeters & Co. . . . . . . . . . . . . .Restricted
Aura MineralsWellington West . . . . . . . . . . . . . .Buy
BCEDesjardins Securities . . . . . . . . .Hold
BombardierUBS Investment Research . . . . .Buy
Canadian Western BankJennings Capital . . . . . . . . . . . . .Hold
Cathay Forest ProductsDundee Capital Markets . . . . . . .Buy
CGI GroupDundee Capital Markets . . .Neutral
Descartes Systems GroupPI Financial . . . . . . . . . . . . . . . . . .Buy
Edleun GroupVision Capital . . . . . . . . . . . . . . . .Buy
EmeraBeacon Securities . . . . . . . . . . . .Hold
Empire Co.Beacon Securities . . . . . . . . . . . . .Buy
Essential Energy ServicesWellington West . . . . . . . . . . . . . .Buy
FortisBeacon Securities . . . . . . . . . . . . .Buy
GoldcorpUBS Investment Research . . . . .Buy
GoldcorpDundee Capital Markets . . . . . . .Buy
Harry WinstonUBS Investment Research . . . . .Buy
IamgoldUBS Investment Research . . . . .Buy
Imperial OilEdward Jones . . . . . . . . . . . . . . . .Hold
Laboratory Corp.UBS Investment Research .Neutral
Laurentian Bank of CanadaDesjardins Securities . . . . . . . . .Hold
Legacy Oil
Peters & Co. . . . . . . . .Sector perform
Lockheed MartinDeutsche Bank . . . . . . . . . . . . . .Hold
McDonald'sEdward Jones . . . . . . . . . . . . . . . .Hold
Miranda TechnologiesDundee Capital Markets . . . . . . .Buy
MonsantoCanaccord Genuity . . . . . . . . . .Hold
NuVista EnergyUBS Investment Research . . . . .Buy
Parkbridge Lifestyle CommunitiesVision Capital . . . . . . . . . . . . . . . .Buy
Pengrowth Energy TrustCitigroup Global Markets . . . . .Hold
Petrobank EnergyUBS Investment Research . . . . .Buy
Phillips-Van HeusenCredit Suisse . . . . . . . . . . . . . .Neutral
Quest CapitalJennings Capital . . . . . . . . . . . . . .Buy
Reliable EnergyAcumen Capital . . . . . . . . . . . . . .Buy
Renegade PetroleumCanaccord Genuity . . . . . . . . . . .Buy
Royal BankCanaccord Genuity . . . . . . . . . .Hold
Second Wave PetroleumAcumen Capital . . . . . . . . . . . . . .Buy
Sun Life FinancialRBC Capital Markets . .Outperform
SunOptaPI Financial . . . . . . . . . . . . . . . . . .Buy
The Forzani GroupPI Financial . . . . . . . . . . . . . . . . . .Buy
TorstarCredit Suisse . . . . . . . . . . . . . .Neutral
Tranzeo WirelessCanaccord Genuity . . . . . . . . . . .Buy
Trilogy EnergyBMO Capital Markets . . .Market perform
Tuscany Int'l. DrillingJennings Capital . . . . . . . . . . . . . .Buy
U.S. GeothermalWellington West . . . . . . . . . . . . . .Buy
United NaturalCitigroup Global Markets . . . . . .Buy
WestJet AirlinesPI Financial . . . . . . . . . . . . . . . . . .Buy
Wild Stream ExplorationJennings Capital . . . . . . . . . . . . . .Buy
Yoho ResourcesAcumen Capital . . . . . . . . . . . . . .Buy
Digests of the top investment advisoriesEvery day, Daily Buy-Sell Adviser monitors the top
investment advisories from Canada and around the world.Our group of investment professionals sift throughhundreds of the newsletters to bring you the bestopportunities for profit.
You can get this valuable investment advice FREE. Wewill e-mail you the latest stories every day, Mondaythrough Friday, as soon as they are published on the site.
Sign up today at www.DailyBuySellAdviser.com
YOURS FREE!

Issue 18 / 10 WHAT THE BROKERS SAY ABOUT CANADIAN STOCKS October 8, 2010 / 351
I N V E S T O R ’ S D I G E S T
equipment and only modest nega-tive short-line equipment demandpressure owing to adverse WesternCanadian weather. We expect EPSto decline in fiscal 2010 fromrecord levels in 2009. This will re-flect a combination of modest or-ganic growth coupled with highertaxes. (Ag Growth was an incometrust for part of fiscal 2009) beforerecovering again in fiscal 2011.
That said, we contend that acontinuation of the current grainprice recovery (driving higher grainvolumes and farmer demand forequipment), stronger than expect-ed international sales growth,and/or merger and acquisition ac-tivity could provide the positivecatalysts for upward revisions toour earnings estimates and a posi-tive re-rating of the shares.
We remain optimistic on AgGrowth’s medium-term earningsprospects given our expectations ofrobust global demand for short-line Ag Growth equipment in thecoming years. We also expectmergers and acquisitions to pro-vide additional legs of growth.
Specifically, we submit that ro-bust international growth couldstimulate EBITDA of over $80 mil-lion by fiscal 2012, supporting a $45to $52 two-year trading range, at8.5 times to 9.5 times EnterpriseValue/EBITDA. For now we main-tain a “buy” rating and $40 dis-counted cash flow-based target,implying 8.6 times fiscal 2011 esti-mated EV/EBITDA.
Ag Growth International is aleading manufacturer of grain han-dling equipment, including grainaugers, belt conveyors and othergrain handling accessories.
TranzeoWirelessCANACCORD GENUITYWins contract in IndiaDigested from an Aug. 24 reportby analyst Eyal Ofir
Mr. Ofir maintains his “specu-lative buy” recommendation forTranzeo Wireless Technologies(TZT-TSX, $0.72). He also reiterateshis 12-month target price of $1.50a share. Mr. Ofir writes:
Tranzeo Wireless designs andmanufactures end-to-end wirelessnetworking gear, includingWiMAX- and WiFi-based solutions,for the delivery of voice, data andvideo services. It targets wirelessInternet service providers, govern-ments, the military, campuses andother organizations in need ofwireless communication solutions,both directly and through a broadpartner network. Founded in 2000,the company is headquartered inPitt Meadows, B.C.
We reiterate our “speculativebuy” recommendation followingTranzeo’s announcement that itssubsidiary, Aperto Networks, hasreceived a purchase order from aTier 1 telecommunications serviceprovider in India. Shipments areexpected to begin immediately,with the deal providing a multi-year relationship for the company.
Subsequent to the recent quar-terly results and conference call,we were a little sceptical that thecompany would be able to achieveits full-year guidance of $40 millionto $45 million and we lowered ourestimates to $35 million. With thisannouncement, however, we are
feeling significantly more comfort-able with our estimates and under-stand management’s intention ofreiterating its prior guidance. Withorders now set to accelerate fromboth Indonesia and India, thecoming quarters should reveal sig-nificant growth.
We note that this order furtherconfirms our original thesis thatTranzeo Wireless will successfullycompete in emerging markets (i.e.,India and Indonesia).
The purchase order is for fixedWiMax equipment and manage-ment has noted further opportuni-ties for WiFi gear as well. We be-lieve this is a multi-million dollarorder and is in addition to the pri-or order backlog of $33.9 million.
Our target price of $1.50 isbased on our discounted cash flowmodel and industry comparativesanalysis. Our target price implies aP/E multiple of 17 times, based onfiscal 2011 estimates.
Tranzeo Wireless designs andmanufactures wireless networkinggear, including WiMAX- and WiFi-based solutions, for the delivery ofvoice, data and video services.
BCE Inc.DESJARDINS SECURITIES BCE gives media convergence another try
Digested from a Sept. 13 reportby analyst Maher Yaghi
Mr. Yaghi maintains his “hold”rating and raises his target price to$34.50 from $33.40 after BCE Inc.(BCE-TSX, $32.99) decided to buythe rest of CTV. He writes:
• BCE will not be left behind ascontent and distribution continueto converge, while TELUS may facea strategic disadvantage in the longterm;
• Economically sensitive mediaproperties could see upside; deal isaccretive to EPS and free cash flow.
On Friday (Sept. 10), BCE an-nounced the acquisition of the re-maining 85% of equity in CTV it didnot previously own from Wood-bridge, OTPP and Torstar for $1.3billion and assumed debt of $1.7billion. In a separate transaction,Woodbridge will acquire owner-ship of The Globe and Mail news-paper, with BCE retaining a 15%equity interest. Closing of thetransaction, which is subject toCRTC and Competition Bureau ap-proval, is expected by March 2011.
BCE’s move follows a continu-ing trend of cable companies andtelecommunication servicesproviders acquiring media contentassets. We believe this is a positivestrategic move for Bell as the tele-com and media landscapes contin-ue to converge, and as mobile TVadoption is on the verge of signifi-cant acceleration.
We have increased our targetprice on BCE slightly due to the ac-cretive nature of the transaction. Amore pressing issue facing BCE’sstock, in our view, is the recent en-try in the Quebec and Ontario mar-kets of new wireless players, espe-cially Videotron in Quebec. We be-lieve Videotron’s offering will ap-peal to many Quebec residents,which could put pressure on pricingand subscriber growth in the shortto medium term. Hence, given wesee only a 10% potential total returnfor the stock in the next year, we rec-ommend investors look for a better
entry point before adding to theirpositions in BCE’s shares.
BCE Inc. is the largest telecom-munications company in Canada,offering a complete array of com-munications products includingwireline, wireless, Internet, dataand video services. Its Bell sub-sidiary currently services 7.0m NASlines and 6.8m wireless subscribersnationwide. BCE also controls andowns a 44% equity interest in BellAliant Regional CommunicationsIncome Fund, with a 15% interestin CTVglobemedia and an 18% in-terest in the Montreal Canadiens.
Miranda TechnologiesDUNDEE CAPITAL MARKETSAcquires Omnibus — itsstrategic but what of thevaluation? Digested from a Sept. 9 report byanalysts Puneet Malhotra andTom Astle
Messrs. Malhotra and Astlecontinue to maintain their “buy”rating and $7 target price after Mi-randa Technologies (MT-TSX,$4.98) expands with a U.K. pur-chase. They write:
Omnibus provides IT basedmedia management and deliverysolutions that help broadcasters inchannel playout and automation.They have an established base ofbroadcast customers and did $24million in sales in the trailing 12-months and $4 million in EBITDA.We can see IT based solutions be-coming more relevant in thebroadcast space as the technologyallows broadcasters to move awayfrom multi-vendor hardware solu-tions to software that can be run onstandard IT hardware.
Miranda will be paying a totalpurchase price of $48.7 million forOmnibus. Omnibus has $6.7 mil-lion in cash which translates into anet price of $42 million. The allcash purchase is expected to be fi-nanced equally between cash onhand (at the end of its last quarterMiranda had $51 million in cash)and an existing credit facility (un-drawn up until the last quarter).Management expects the transac-tion to be accretive in the first yearof full operations.
Omnibus did $24 million insales and $4 million in EBITDA ona TTM (trailing 12-month) basiswhich implies takeout multiples inthe order of 1.8 times sales and 10.5times EBITDA.
We think this could be a goodstrategic acquisition for Mirandafor the following reasons:
• We believe the acquisition al-lows Miranda to target the nextgeneration playout systems mar-ket. Management estimates pegthis growth at a CAGR of 24% overthe next two years. We expect thesesystems to become increasinglyrelevant as broadcasters consoli-date facilities and look for cost cut-ting measures. Omnibus has beenone the pioneers in this area andprovides a good entry point for Mi-randa to expand its products herewith minimal product overlap.
• Omnibus is a U.K.-based com-pany providing Miranda an ex-panded presence in the Europeanregion. We think this will allow
Continued on page nex page
Analysts follow as many as 20 stocks, most of which are rated“buys.” Of those buys, an analyst has one or two special favorites seenas most suitable for new buying. This column is devoted to those oneor two favorite “best buys.”
If you’ve never heard of Edleun Group Inc. (EDU-TSX/VEN,$0.73), you’re likely in good company. The Calgary-based out-fit, which operates day-care centres, trades at less than a buck,has a market cap of just $67 million and only went public in May.
So, does this mean it should be ignored? Not at all.“Just because a company is small and obscure doesn’t mean it
can’t become a force to be reckoned with,” says Frank Mayer, chair-man an co-portfolio manager of Toronto’s Vision Capital.
In fact, he cites two Canadian real estate outfits — Killam Prop-erties and Boardwalk REIT — that, having started small, have sincebecome major players.
And Boardwalk has grown. Starting with only 2,400 rental unitsin 1995, it added 17,600 more by mid-1998, another 18,000 by 2010.From 1995 to 1998, meanwhile, its shares appreciated 15 times.
Share price more than quintupled
Killam has also followed an upward arc — from roughly 200rental units in 2002 to 18,000 today. Then, too, in just its first 18months, its shares jumped to $2.70 from $0.50.
But back to Edleun. With Canada’s top five day-care firms ac-counting for just one per cent of the national market, the companyhas room to grow, says Mr. Mayer, who notes that demand for child-care across the country remains strong.
“There’s a profound shortage of day-care space in Canada,” hepoints out, adding that the 8,500 day-care centres now in existenceare still at least 1,500 fewer than what the country actually needs.
Moreover, the necessity of building new centres actually worksin Edleun’s favor. That’s because new facilities, by virtue of beingbigger, benefit from economies of scale. In addition, when a com-pany is starting afresh, it can always cherry-pick locations.
Then, too, as an outfit that buys, as well as builds, Edleun can takeadvantage of a fragmented market. Not only are most of Canada’schildcare centres mom-and-pop outfits, but the children of the own-ers often have no interest in running the business, says Mr. Mayer.
Meanwhile, in Leslie Wulf, Edleun can lay claim to an experi-enced CEO, one who spent several years building childcare centresin the U.S. before starting Edleun two years ago.
Marni Testa, the company’s vice-president of operations, is alsoan experienced player, having logged more than 15 years in thechildcare industry in Australia.
Mr. Mayer admits Edleun’s second quarter was hardly stellar,given its loss of $1.7 million, or nil cents a share. But the company,he notes, is just still finding its feet. Moreover, given its growth po-tential, it could yet become a major enterprise.
Company more than a regional player
Indeed, Mr. Mayer notes, although Boardwalk and Killam Prop-erties have been successful, they both remain regional players:Boardwalk in western Canada, Killam in the east. But Edleun, he be-lieves, has the potential to go nationwide.
For Mr. Mayer, Edleun Group is a best buy.Mr. Mayer may have a soft spot for a company like Edleun that
specializes in caring for individual children. But he also likes an out-fit such as Parkbridge Lifestyle Communities Inc. (PRK-TSX, $5.50)which specializes in housing entire families.
For starters, the company, an owner-operator of residentialland-lease developments, is cheap. Given its estimated net asset val-ue of $7 a share, it trades at a 20 per cent discount.
And its NAV could go even higher — to $8, Mr. Mayer believes —should Canada Mortgage and Housing Corp. decide to approveParkbridge’s communities for insured financing.
In the interim, it’s a good bet the company wants to light a fireunder its shares. To that end, Parkbridge is likely thinking of con-verting to a REIT or even putting itself up for sale. It may also be con-sidering privatization, says Mr. Mayer.
Then, too, with its managers and directors owning 39 per cent ofits stock, Parkbridge is obviously aligned with the interests of its mi-nority shareholders.
Meanwhile, the company continues to post solid profit margins,given that tenants pay their own heating costs. Parkbridge has alsowon annual rent increases of five per cent over the past three years.
Moreover, its communities have few vacancies, as well as verylittle turnover. And with 4,000 additional sites the company can de-velop, Parkbridge can likely look forward to 10 more years of growth.For Mr. Mayer, Parkbridge is also a best buy.
[Vision Capital has positions in both Parkbridge and Edleun. Aswell, Jeffrey Olin, Vision’s president, is an Edleun director]
‘Best Buys’ fromleading analysts

352 / October 8, 2010 WHAT THE BROKERS SAY ABOUT CANADIAN STOCKS Issue 18 / 10
I N V E S T O R ’ S D I G E S T
them to target the high growthEastern European market better.
• Omnibus has a large installedcustomer base including Ascent,AT&T, BBC, Corus, DirecTV, Dis-cover, Starz, Turner etc. This pro-vides opportunities to cross sellMiranda’s products into this largecustomer base.
• Management believes the rev-enue model will continue as a typ-ical software model with mainte-nance contracts and an increasingrecurring revenue base.
• Distribution and product syn-ergies are available. We still have towrap our heads around how muchthey can gain from these especial-ly on the product side.
While we think strategically theacquisition could make sense thereare a few lingering questions:
• Omnibus has EBITDA mar-gins below 20% — for a softwareand IT solutions company thisseems low. Management highlight-ed they expect to improve thesemetrics as they avail some of theselling and distribution synergies.
• Ten times EBITDA appears tobe a hefty take out multiple givenMiranda is trading at 6 times itsLTM EV/EBITDA. We’ll have towait and see how these make sensegoing forward. According to man-agement, the multiple is inline withmarket comps from the videobroadcasting, TV broadcasting andIT systems space.
• Omnibus have been the cheer-leaders for IT based broadcast solu-tions and it will be important to as-sess what sort of progress they’vemade over the last few years.
• According to management,performance of a software based so-lution is similar to that of a hard-ware solution with the added bene-fit of easy upgrades. We believe thiscould be the case but are still unsurehow seriously broadcasters arelooking at these types of solutions.
Miranda Technologies designs,develops, manufactures and mar-kets hardware and software prod-ucts across multiple segments of thetelevision industry. The company’ssuite of digital infrastructure, mon-itoring and control equipment en-ables broadcasters to migrate to amulti-channel digital and HighDefinition broadcast environment.
Andean ResourcesUBS INVESTMENT RESEARCH Goldcorp agree to acquire Andean
Digested from a Sep. 3 report byanalysts Jo Battershill, Glyn Law-cock and Brett McKay
Messrs Battershill, Lawcock andMcKay downgrade Andean Re-sources Ltd. (AND-TSX, US$4.44)to a “neutral” from “buy” andmove their target price to $US$6.17from US$3.64 after the companyagrees to merge with Goldcorp.They write:
Andean has announced that ishas agreed to be acquired by Gold-corp through a Scheme of Arrange-ment. Under the scheme, eachAND share will be exchanged for0.14 Goldcorp shares or a cash pay-ment of C$6.50 a share (subject toan aggregate maximum cash con-
sideration of C$1billion). This pro-posal comes hot on the heels of theEldorado merger proposal also an-nounced today.
In our view, this corporate ac-tion is simply recognition of theworld class potential of the CerroNegro project. Despite only havinga resource of 3.1 million ouncesand reserves of 2.1 million ounces,we believe the project has the po-tential to be +10Moz. Subsequent-ly, resource and reserve multiplesof US$1,100/oz and US$1,625/ozlook high but have little meaning.
We have downgraded our rec-ommendation to “neutral” due tothe corporate action induced re-rating. Andean has agreed thatGoldcorp has the right to matchany competing bid, should one beforthcoming, so we believe theprobability of Eldorado comingback with a higher bid is very low.
Our valuation has been in-creased by 51% to $4. Our price tar-get has been increased by 70% to$6.79a share and is based on theC$6.50/sh offer price converted attoday’s exchange rate. Our NPV as-suming a flat gold price ofUS$1250/oz is $4.92/sh, thus im-plying a P/NPV of 1.38x comparedto 1.25x for Goldcorp and 1.48x forEldorado.
Emera Inc.and Fortis Inc.BEACON SECURITIESInitiating coverageDigested from an Aug. 23 reportby analyst Philip Bassel
Mr. Bassel initiates coverage ofHalifax-based Emera Inc. (EMA-TSX, $26.10) with a “hold” ratingand a 12-month target price of $25a share. At the same time, he initi-ates coverage of St. John’s head-quartered Fortis Inc. (FTS, $29.06)with a “buy” rating and a 12-monthtarget price of $32 a share. Mr. Bas-sel writes:
The electric utilities industry inAtlantic Canada is undergoing un-precedented changes that we be-lieve could have potential impactsbeyond the borders of its fourprovinces. This is consistent withthe North American utilities sector,in which we see a significant pushto move away from electricity gen-erated by high-carbon fossil fuelsand towards energy derived fromrenewable sources. As a result, wecaution investors that not all utilitystocks are nearly as risk-free as inthe past.
Atlantic Canada is home to twopublicly-listed utilities, Emera Inc.and Fortis Inc. This report focuseson these two organizations and theability of each to leverage its exper-tise to help North Americans meetenvironmentally friendly, yet po-tentially costly, renewable electric-ity ambitions.
We believe Emera is strategical-ly well positioned, albeit throughsignificant transmission invest-ments, to make the link betweenAtlantic Canada’s abundant re-newable sources, and the North-east U.S. However, investorsshould note that, at this point, webelieve most of the upside for theseinitiatives is priced into the stock,while the risks remain unattrac-tively high in these early days.
Our 12-month target price of$25 a share is based on P/E and En-terprise Value/EBITDA multiples.
(EBITDA is earnings before inter-est, taxes, depreciation and amor-tization.) Our target is derived fromthe average of 15.4 times our 2011estimated EPS and 8.9 times 2011forecast Enterprise Value/EBITDA.
We believe Fortis’ strategy is toleverage its expertise, track recordin running regulated utilities acrossCanada, and its strong balancesheet to acquire and operate regu-lated electric utilities in the U.S. atan opportune time in the industry.
Our 12-month target price of$32 a share is based on P/E and En-terprise Value/EBITDA multiples.Our target is derived from the aver-age of 17.7 times our 2011 earningsestimate and 10.0 times forecast2011 Enterprise Value/EBITDA.
Both Emera Inc. and Fortis Inc.are diversified utilities headquar-tered in Atlantic Canada.
Canadian Western BankJENNINGS CAPITAL Q3/10 results Digested from a Sept. 2 by analyst Marc Charbin
Mr. Charbin maintains his“hold” rating but raises his one-year target price to $25 from $24 af-ter Canadian Western Bank(CWB-TSX, $24.50) posts its third-quarter numbers. He writes:
Adjusting for one-time items(taxes of $0.11 per share and othernon-recurring income of $0.03 pershare), diluted EPS was $0.45, ver-sus our estimate of $0.42. The beatwas generated by stronger than ex-pected margins, as well as solidgrowth in credit related and insur-ance income. The National Leasingacquisition has certainly made ameaningful contribution, adding~20-23 bps to NIMs (net interestmargin) and $0.05 in EPS this quar-ter alone.
Loan book growth remainsrather modest, increasing 2% quar-ter over quarter. The OptimumMortgage segment continues tomake a proportionally larger con-tribution to growth, adding$70MM or 0.7% to the loan book($745MM total). The growth in thissegment has been especiallymeaningful this year as the compa-ny contends with prepayments onloans in its traditional heavy equip-ment and construction lending.
Management’s outlook wascertainly more tepid in its publicfilings than over the conferencecall. While formal guidance has yetto be released for FY 2011, the com-pany expects double-digit loangrowth to continue, organically.Yet, this should not be too much ofa surprise, as consensus is alreadyforecasting ~15% loan growth in FY2011 as prepayments decline andconstruction spending in the oil-sands increases. By the time Q4/10results are released, CWB shouldalso have more visibility on divi-dend increases as internationalcapital requirements are clarified.
We have made no material revi-sions to our forecast for FY 2010 orFY 2011.
CWB continues to demonstratethe quality of its lending quarter-over-quarter, as demonstrated byfalling arrears and write-offs wellbelow peers’ levels. Management’soutlook toward FY 2011 is seem-ingly becoming more confident,but its outlook has already been re-
CREDIT SUISSE
Newspaper giant Torstar Inc. (TS.b-TSX, $12) is getting out ofnetwork television, selling its 20 per cent stake in CTVglobemedia toBCE Inc. and the Woodbridge Co.
And Colin Moore is giving the move front-page treatment.Not only, he says, will the $345-million sale allow Torstar to put
more money into its digital properties and even consolidate its news-papers, it should also allow it to strengthen its balance sheet. In fact,Torstar itself says it hopes to use the proceeds to pay down debt, adebt that now totals $480 million.
Not surprisingly, Mr. Moore is raising his price target to $13 from$11 a share, although he’s still pegging Torstar at “neutral.” Indeed,because of what he fears could be a drop in its newspaper revenue in2011, he worries that Torstar stock may have to be re-rated.
For the three months ended June 30, Torstar swung to net earn-ings of $22.7 million, or $0.28 a share, from a net loss of $4.4 million,or $0.06 a share, for the similar period in 2009.
Sales were also higher, inching up less than half of one per cent to$376.5 million, with newspaper and digital revenue rising 3.6 per centto $258.7 million.
DESJARDINS SECURITIES
Michael Goldberg is keeping Laurentian Bank of Canada (LB-TSX, $47.56) on deposit as a “hold,” citing its sagging loan book. He’salso continuing to rate it at “above-average” risk, with a 12-monthprice target of $45.50.
For the third quarter of fiscal 2010, the bank coined net earningsof $1.13 a share — $0.07 higher quarter over quarter, as well as a nick-el higher year over year. And although EPS was $0.08 below Mr. Gold-berg’s forecast, it was only a penny shy of the consensus call.
Elsewhere, the bank posted tier one capital ratio of 10.7 per cent— 20 basis points lower QOQ — while logging loan provisions of $20million, $4 million more than the analyst had forecast. Non-per-forming loan formations, meanwhile, finished the quarter at $35 mil-lion, twice those for the second quarter.
Overall, says Mr. Goldberg, Laurentian “continues to build trac-tion in all of its operations.” The company also boasts better margins,having seen its operating profit climb nine per cent to $5.7 million.
RBC CAPITAL MARKETS
Sun Life Financial Inc. (SLF-TSX, $30.27) is one of Canada’s bigthree life insurers. It’s also the cheapest, says Andre-Philippe Hardy,who’s handing it a rating of “outperform/above-average risk,” witha 12-month price target of $37 a share.
Mr. Hardy suggests Sun Life had a tough time in the credit crunch,taking a bigger hit than its rivals. But he believes the insurer will nowhave an easier time of it, given the improving economy. As a result,its return on equity should rise.
And thanks in part to its potential operating leverage, he also seesSun Life bringing in better numbers at MFS Management, its U.S.mutual fund firm. Indeed, he thinks MFS’s 2011 earnings could climbto $320 million, a jump of 152 per cent from 2009.
The analyst also sees Sun Life being well-positioned to grow mar-ket share, not the least because of changes it made in its upper ech-elons in late 2008.
Through MFS, Sun Life boasts US$198 billion in assets undermanagement. The company also owns a 56 per cent stake in McLeanBudden, a Toronto-based institutional money manager.
BMO CAPITAL MARKETS
Gordon Tait will tell you at least three things about Trilogy En-ergy Corp. (TET-TSX, $9.36), a Canadian oil and gas play formed inApril 2005 from an asset spinout at Paramount Resources.
Mr. Tait’s first point? Trilogy continues to merit a “market per-form” with a 12-month price target of $11 a share.
Mr. Tait’s second point? Trilogy deserves higher estimates. Notonly is he boosting its 2010 cash flow to $1.43 from $1.19 a share, buthe’s raising its 2011 EPS by $0.34 to $1.40.
But Mr. Tait’s third point is cautionary. He admits Trilogy hasgood growth prospects in Alberta’s Deep Basin. But he suggests thecompany could still be chancy, given its heavy exposure to naturalgas, a commodity whose near-term outlook he considers to be poor.
For the three months ended June 30, Trilogy’s net earnings tum-bled to $1.6 million, or a penny a share, from $15.4 million, or $0.14a share, for the three months ended March 31.
Briefly NotedContinued from preceding page

Issue 18 / 10 WHAT THE BROKERS SAY ABOUT CANADIAN STOCKS October 8, 2010 / 353
I N V E S T O R ’ S D I G E S T
flected in the company’s shareprice through its premium valua-tion. We believe share-price appre-ciation above the industry averagein the next year might have to bederived from another acquisition(National Leasing is proving to be agem) or expansionary-like growthin Alberta’s economy. Until then,earnings are likely to be modest rel-ative to the share price.
We view the chances of a divi-dend increase as probable (with acurrent payout ratio of ~21% rela-tive to CWB target in the 20% to30% range); however, dividend in-creases could likely come acrossthe board in the financial spaceand, perhaps to a greater extent,elsewhere.
We continue to value CWB ap-plying a 12.0x multiple to FY 2011diluted EPS.
Canadian Western Bank is aSchedule 1 chartered bank operat-ing primarily in Alberta, BritishColumbia, Saskatchewan andManitoba. Through the bank andits subsidiaries, CWB offers lending,credit, deposit products, trust ser-vices and wealth management, aswell as personal home and automo-bile insurance. CWB’s niche is realestate and commercial loans, but itis also expanding its personal loanand other income revenue streams.
Empire Co.BEACON SECURITIESRecord results despite increased deflationarypressures in Q1Digested from a Sept. 13 reportby analyst Philip S. Bassil,
Mr. Bassil maintains his “buy”rating and $61 target price afterEmpire Co. Ltd. (EMP.A-TSX,$52.27) reported its best-ever quar-ter. He writes:
Empire’s earnings and rev-enues grew to record levels inQ1/F2011. Empire reported 13%year-over-year growth in its overallearnings, before capital gains, toreach a record $81.6 million, or$1.19 per share, compared to $72.2million, or $1.05 per share, in thesame period last year. The compa-ny’s consolidated revenues alsogrew 1.8% y/y to reach a record$4.04 billion compared to $3.97 bil-lion in Q1/F2010.
Although the deflationary envi-ronment intensified in the quarter,largely due to competitive promo-tional activity primarily in the high-ly contested Ontario market, Em-pire’s food retailing sales and oper-ating income grew 1.8% and 3.8%y/y, respectively. The food retail-ing segment also drove results byaccounting for 98.4% and 91.5% ofEmpires overall revenues and netearnings in Q1/F2011, respective-ly, compared to 98.4% and 77.1% inthe same period last year.
Same-store-sales grew further.Deflationary pressures were wide-ly expected to remain a drag on Q1results, but the 2.5% deflation inthe quarter, compared to last quar-ter’s 2.0% deflation, was more in-tense than anticipated. Despite thestronger than expected deflation inthe quarter, Sobeys delivered an-other quarter of same-store salesgrowth. SSS in Q1 increased 0.3%y/y. We expect the deflationarypressures to gradually ease in thecoming quarters.
We believe Empire is well posi-
tioned to see sustainable marginimprovements from its productiv-ity and efficiency initiatives, as wellas its efforts to grow its volumesacross its network. Our valuation isbased on our NAVPS and a 6.0xF2011 EV/EBITDA multiple.
Empire Co. Ltd.’s core businessesinclude food retailing and relatedreal estate operations. Headquar-tered in Stellarton, N.S., Empireowns Sobeys, Canada’s secondlargest food retailer with over 1,300stores across the country. With morethan $15 billion in annual revenuesand nearly $6.1 billion in assets, Em-pire employs over 90,000 people, in-cluding its franchisees and affiliates.
Descartes Systems Group PI FINANCIAL Delivering ahead of plan Digested from a Sept. 9 by ana-lyst Pardeep S. Sangha
Mr. Sangha reiterates his “buy”rating and increases his target priceto US$7.65 from US$7 afterDescartes Systems Group (DSGX-NASDAQ, $6.14; TSX-DSG) report-ed a strong second quarter. Hewrites:
Descartes reported recordquarterly revenue of $25.2 millionfor Q2FY11 which was 35% higherthan the $18.6 million recorded inthe same quarter last year. Adjust-ed net income for the quarter was$6.5 million, or $0.10 per share ful-ly-diluted, compared to $5.2 mil-lion in the previous year. Descartesresults for Q2FY11 were in line withour revenue estimate of $25.4 mil-lion, but beat our earnings esti-mates of $0.08 adjusted EPS.
According to management, re-cent acquisitions are well ahead ofoperating plans. In Q1FY11,Descartes completed the acquisi-tion of Porthus and announced theacquisition of Imanet. In Q2FY11,Descartes acquired Routing Inter-national for approximately EUR3.4million (net of cash received).
Strong balance sheet. Descartesreported having cash and equiva-lents of $58.5 million and no debtat the end of July 2010, comparedto $94.6 million at the end of Jan-uary 2010. The company’s cashbalance has decreased during theyear due to the cost of acquisitions.The company generated $6.0 mil-lion in positive cash flows from op-erations during the quarter.
Today’s results have had a pos-itive effect on margins and earn-ings in our model. Managementprovided baseline revenue guid-ance of $24 million for Q3FY11,with baseline operating expensesof $18.6 million. We are anticipat-ing one more small acquisition be-fore the end of the fiscal year. Theglobal trade and shipping environ-ment has stabilized compared tolast year.
We are forecasting 37% revenuegrowth in FY11 with a return to his-toric growth rates of 15% in FY12.Acquisitions are the main driversfor growth in FY11. We are fore-casting $101.0M revenues and$27.5M adjusted Net Income forFY11, with $115.9M revenues and$31.8M adj. Net Income for FY12.
We rate this investment with an“above average” risk rating. OurUS$7.65 price target represents a3.9x EV/Sales multiple, 15.1x EV/EBITDA multiple and 15.2x PE (ad-
justed) multiple of FY12 estimates. Descartes Systems Group pro-
vides logistics solutions for trans-portation companies, logisticsproviders, manufacturers, distribu-tors and retailers. DSGX uses a host-ed software as a service model to de-liver solutions that are used to re-duce shipping costs, meet regulato-ry compliance, and exchange data.
RenegadePetroleum CANACCORD GENUITYWet weather delays production but exit intact
Digested from an Aug. 26 reportby analysts Brian Kristjansen andGreg Foofat
Messrs. Kristjansen and Foofatreiterate their “buy” recommenda-tion and adjust their target price to$6.25 from $6.75 after RenegadePetroleum Ltd. (RPL-TSX/VEN,C$2.89) reported its second-quar-ter results. They write:
Unusually wet weather inSaskatchewan during the quarterdelayed production additions andreduced cash flow, though man-agement still expects to exit theyear between 2,600 and 2,700BOE/d, which will leave our 2011production forecast unchanged.
Renegade continues to enjoytop netbacks (the second-bestQ2/10 operating netback in ourcoverage universe, at $46.01 perBOE) and considerable forecastgrowth (also the second-best in ourcoverage universe, at 107% pershare in 2011) through our forecasthorizon, making its relative valua-tion increasingly compelling.
Investment highlights • The company reported average
production of 936 BOE/d (97% lightoil and liquids), which was belowour 1,219 BOE/d estimate. CFPS,f.d., of $0.05 was below consensus of$0.10 and our estimate of $0.11.
• Renegade participated in 11gross (5.7 net) wells with a 93% suc-cess rate, though these were com-pleted late in the quarter and hadlittle impact on the reported pro-duction.
• Renegade currently trades at a3.1x EV/DACF multiple and$56,368 per BOEPD based on our2011 estimates.
• The differences from our cashflow estimate related to the lowerproduction ($0.02), lower realizedoil prices ($0.01), higher royalties,G&A ($0.01), interest ($0.01), andcash taxes. Operating costs weresharply lower than our estimate,though we expect the lower real-ized pricing to offset this impactwhen carried through our 2011forecasts.
The company still managed a ro-bust Q2/10 drilling program, whichincluded 2.0 gross (1.1 net) wells inHastings/Alameda, 2.0 gross (1.6net) wells in Stoughton/Huntoon,1.0 gross (0.4 net) well in Florence,and 6.0 gross (2.6 net) wells in theViking at Dodsland.
Of the wells drilled, theHuntoon well is likely the standoutsuccess, as subsequent to the quar-ter the company had aggressivelylicensed additional wells in the im-mediate area. A Frobisher comple-tion in the area was also successfulwith results exceeding manage-
UBS INVESTMENT RESEARCH
Matt Donohue likes NuVista Energy Ltd. (NVA-TSX, $11.06), somuch so that he’s adding it to his coverage list. And he’s doing sowith fanfare, rating it a “buy” with a price target of $13 a share.
His reasons for singling out NuVista are many. For one thing, hesays, it boasts a top-tier management team, one with the technicalsmarts to exploit the company’s wide range of assets.
Another plus? NuVista’s solid inventory of near-term prospects— prospects, Mr. Donohue suggests, that could eventually lift thecompany’s valuation.
The analyst also likes NuVista’s rising exposure to oil-weightedassets. Moreover, he views the company as a good takeover target.
In the meantime, he’s heartened by the good results from Nu-Vista’s first horizontal well in Western Canada’s Montney play, view-ing it as a harbinger of things to come.
The well, which initially tested at a daily rate of 10 million cubicfeet with 250 barrels of free condensate, is now producing at five mil-lion cubic feet with 140 barrels of condensate.
CANACCORD GENUITY
Andina Minerals Inc. (ADM-TSX/VEN, $1.52) received an im-proved resource estimate about Volcan, its Chilean gold project, inlate September.
And Steven Butler is pleased. Not only is he upping his 12-monthprice target to $2.40 from $2 a share, he’s raising Andina to a “spec-ulative buy” from a hold.
He says the better estimate highlights the progress Andina hasmade in advance of a pre-feasibility study — a study, he says, thatshould make Volcan less risky.
The new estimate grades Volcan at 0.71 grams a ton on the mea-sured-and-indicated line. Previously, it graded at 0.62 grams.
Mr. Butler admits that although the improved grades have a goodimpact on his estimate of Andina’s net asset value, the impact is off-set by higher assumed capital costs.
DUNDEE CAPITAL MARKETS
Richard Kelertas is stalking China’s corn processing industry. Andhe’s doing so by initiating coverage on Asia Bio-Chem Group Corp.(ABC-TSX, $1.19), a producer of corn starch in that country.
He admits Asia Bio-Chem is small. But he believes that in terms ofcapacity, it will become one of China’s top five corn starch producers.
For one thing, he notes, Asia Bio-Chem has a cost advantage, giv-en its nearness to China’s main corn-growing regions.
Moreover, the company is not only efficient, but has managerswho are experienced. Perhaps more important, China is logging agrowing demand for starch.
For Mr. Kelertas, Asia Bio-Chem merits a “buy” with a 12-monthprice target of $2.
For the three months ended June 30, Asia Bio-Chem’s net earn-ings climbed to $4.5 million, or $0.06 a share, from $430,000, or a pen-ny a share, for the similar period in 2009.
Sales were also higher, more than doubling to $56.9 million, whilegross profit grew 166.7 per cent to $9.6 million.
Operating expenses, meanwhile, climbed 43.3 per cent to $4.3million, while EBITDA (earnings before interest, tax, depreciationand amortization) zoomed 543 per cent to $7 million.
CITIGROUP GLOBAL MARKETS
Pengrowth Energy Trust (PGF.UN-TSX, $10.97) is bulking up,having inked a deal to buy the 82 per cent of Monterey Exploration itdoesn’t already own.
And Richard Roy thinks the deal makes sense. For starters, hesays, it gives Pengrowth a new core area, one with growth potential,low costs and strong returns.
Mr. Roy also sees the deal giving Pengrowth exposure to Ground-birch, an exploration area in northeastern British Columbia thatholds promise as a low cost source of natural gas.
Other good aspects of the deal for the analyst include an expand-ed drilling inventory, as well as access to key pieces of infrastructure,such as two natural gas plants.
In the interim, Mr. Roy continues to view 2010 as a transition yearfor Pengrowth, as it converts from a trust to an oil and gas play fo-cused on maximizing production growth.
For Mr. Roy, Pengrowth remains one of his top picks, althoughhe’s keeping it pegged at “hold/high risk” with a price target of $12.
Briefly Noted
Continued on page nex page

354 / October 8, 2010 WHAT THE BROKERS SAY ABOUT CANADIAN STOCKS Issue 18 / 10
I N V E S T O R ’ S D I G E S T
ment’s expectations. Continuedsuccess on the repeatable Vikingresource at Dodsland has spawnedan increase in H2/10 drilling thatwill see an incremental 7 to 9 grosswells (3.5 to 4.25 net wells) drilledprior to year-end. On the negativeside, the company’s Q2/10 Flo-rence well was gassier than expect-ed and results there may precludefurther activity should the well(and an offsetting recompletion)fail to improve over time.
Our target price remains basedon a 6.0x 2011E EV/DACF multiple.Higher forecast net debt and widercorporate oil price differentials in2011 are the key factors impactingour target price. Our newly forecastnet debt to trailing 12-month cashflow ratio in 2011 remains verycomfortable at 0.6x, though thiswas previously forecast at 0.3x. Ab-solute cash flow levels in 2011 re-main fairly consistent.
Renegade continues to be a fo-cused light oil producer, with someof the best netbacks in our cover-age universe. We are still expectingsome of the best growth in produc-tion per share in 2011, and see thevaluation as increasingly com-pelling.
The lower Q2/10 productionhas reduced our 2010 outlook,though intact exit rates keep our2011 production estimates whole.With 29 gross (21.9 net) wells to bedrilled in H2/10, the company willhave plenty to talk about. Of partic-ular interest will be the drilling of aseismically identified Kisbey looka-like on the Prairie Hunter acquiredlands and the North Dakota farm-in well to be drilled in late October.
Renegade Petroleum is a light oilfocused exploration and productioncompany with its core assets locat-ed in Saskatchewan. The companywas created in late 2009 as a recap-italization of Colonia Energy Corp.
Royal BankCANACCORD GENUITYTarget price loweredDigested from an Aug. 26 reportby analyst Mario Mendonca
Mr. Mendonca maintains his“hold” recommendation for RoyalBank of Canada (RY-TSX, $49.18).However, he lowers his 12-monthtarget price to $55 a share from $60.Mr. Mendonca writes:
For the fiscal third quarter, end-ed July 31, 2010, Royal Bank ofCanada reported cash EPS of $0.87,down 22% from a year earlier andlower than our estimate and theconsensus forecast of $1.03 and$1.02, respectively. Relative to ourestimates, trading revenue wasmuch lower than expected, howev-er, provisions for credit losses (or“PCLs”) were slightly better thanwe had forecast.
We are lowering our 2010 and2011 EPS estimates to $3.92 (from$4.14) and $4.51 (from $4.94), re-spectively. The key change to ourestimates relates to much lowertrading revenue: $700 million perquarter, down from $1 billion to$1.1 billion.
RBC’s Canadian banking profitwas up 14% compared to a yearearlier, reflecting revenue growthof 6% and a 16% decline in PCLs.Expenses were also up 6%, leadingto slightly negative operating lever-age in the quarter. This was the
weakest operating leverage in do-mestic retail since mid-2007. Weexpect operating leverage to hoveraround nil for the next two quartersand improve in the middle of 2011as the higher technology spendinginitiative slows and longer branchhours drive better revenue.
RBC’s Canadian banking earn-ings remain relatively strong. How-ever, the abrupt decline in trading(particularly given management’scomments in 2009 about thegrowth in the franchise) and Roy-al’s much greater reliance on capi-tal markets-related revenue (par-ticularly trading) suggest RoyalBank should trade at a discount tothe group’s forward P/E, or at leastto TD Bank and Scotiabank.
Our new target price of $55(down significantly from $60) isbased on the stock trading at 12times our reduced 2011 earningsestimate. (This multiple is in-linewith the group’s, but lower thanScotiabank and TD Bank’s.) Ourtarget price implies a total return of16% and supports a “hold” rating.
Although this was Royal Bank ofCanada’s second consecutive verydisappointing quarter, we do notexpect the stock to significantly un-derperform its peers from here.The stock’s performance relative toits peers is currently two-standarddeviations below the six-monthmoving average.
Royal Bank of Canada isCanada's largest bank as measuredby assets and market capitalization.
PetrobankEnergyUBS INVESTMENTRESEARCHOffers diversified growthDigested from an Aug. 18 reportby analyst George Toriola
At UBS, coverage of PetrobankEnergy and Resources (PBG-TSX,$39.76) has been transferred toGeorge Toriola. He maintains UBS’“buy” rating for the stock. Howev-er, he has set a 12-month targetprice of $54 a share, down fromUBS’ previous target of $64. Mr.Toriola writes:
Through its 67% and 58% own-ership interests in Petromineralesand PetroBakken, respectively,Petrobank offers investors expo-sure to light oil growth in Colombiaand Peru, and in the Bakken andCardium plays in Western Canada.We forecast a compound annualgrowth rate (or “CAGR”) in pro-duction from 2010 through 2012 of12% and 5.8% for Petromineralesand PetroBakken, respectively.
As well, Petrobank’s ownershipof the THAI technology, through its100% owned Archon Technologiessubsidiary, provides investors withoptionality: a potential gamechanger in the monetization ofheavy oil and oil sands. We believethe company’s Conklin and Ker-robert projects are showing signs ofprogress, and look forward to fur-ther results in the near-term. Weestimate the current stock price re-flects $2.02 a share for the compa-ny’s heavy oil business unit.
For the near-term, we forecast2010 average production at 85.2thousand barrels of oil equivalentper day and cash flow of $9.88 perfully diluted share.
Our revised $54 target price isbased on our sum of the parts tar-
get prices (with a discount rate of10%; long-term WTI oil price ofUS$80 per barrel; and NYMEX nat-ural gas price of US$6.50 per thou-sand cubic feet), incorporatingspecific risk factors for each sub-sidiary within the company’s port-folio. Our price target is equivalentto a four times EnterpriseValue/EBITDA multiple on our2011 estimates.
Petrobank Energy has control-ling stakes PetroBakken and Petro-minerales. It is also developingheavy oil (including oil sands) re-sources and technology.
Imperial OilEDWARD JONESFairly pricedDigested from a July 30 report byanalyst Lanny Pendill
Mr. Pendill maintains his“hold” rating for Imperial Oil(IMO-TSX, $40.18). He writes:
We rate Imperial Oil a “hold” aswe believe its future prospects arealready priced into the stock. Fun-damentally, we believe the compa-ny has attractive operations, is fi-nancially strong, and has an ad-vantage over peers due to its rela-tionship with ExxonMobil.
In fact, the relationship withExxonMobil is key. ExxonMobilowns 70% of the outstandingshares of Imperial Oil. As a result ofthis relationship, Imperial Oil hasaccess to the resources and techni-cal expertise of the leading energycompany in the world, which wefeel is a tremendous advantage.
Imperial Oil’s operations arevery attractive in our view andshould support healthy growthover the long term. Imperial Oil isthe largest refiner of petroleumproducts in Canada, producingabout 70 million litres per day, andgiven its focus on operational ex-cellence, we believe it will continueto post better results than its peers.The company also has large hold-ings in the oil sands, the Horn Riv-er basin, and in the Canadian Arc-tic that should generate healthygrowth in production.
Imperial Oil is concentrating itsoil operations on the Canadian oilsands, one of the largest reserves ofoil in the world. We believe this is akey competitive advantage sincethese operations are large in size,can produce over very long periodsof time, have little political riskcompared to other areas of theworld, and are in close proximity tothe United States. Future produc-tion growth should be robust uponcompletion of its development ofthe Kearl project, along with futureexpansions at Syncrude.
We believe Imperial Oil has oneof the strongest financial positionsin the industry, which is clearly ev-idenced by its “AAA” credit rating.With virtually no debt and strongcash flow generated by its underly-ing businesses, Imperial Oil is well-positioned to excel during the cur-rent industry downturn relative toits peers as it continues to advanceits long-term projects.
Imperial Oil reported secondquarter EPS of $0.60 compared to$0.25 for the same period last year.The improvement was primarilydriven by increased Syncrude pro-duction, higher oil prices, and im-proved refining margins. Total pro-duction rose 11% as Imperial’sshare of Syncrude production grew
to 81,000 barrels a day (b/d) from51,000 b/d. As a result, total pro-duction was 300,000 b/d, up from271,000 b/d in the prior year. High-er oil prices were partially offset bythe stronger Canadian dollar andhigher royalty payments. Earningsfrom refining and marketing were$68 million compared to a loss of$38 million last year.
Progress with its Kearl Oil Sandsproject continues, and the compa-ny currently has 2,500 peopleworking at the site. Startup re-mains on track for late 2012. Impe-rial stated that it will be drilling ahorizontal multi-well pad pilot de-velopment in the Horn River in thefall, and we look forward to a moredetailed assessment of the compa-ny’s future potential in Horn Riverlater in the year. Overall, it was aquarter in-line with expectations.
In May, Imperial Oil an-nounced a 10% increase in itsquarterly dividend to $0.11 from$0.10. This brings the annualizeddividend to $0.44 from $0.40.
Imperial Oil is trading at ap-proximately 12 times our 2011 EPSestimate, which we believe appro-priately reflects its opportunitiesand risk. As a result, we believe cur-rent levels already reflect our futureexpectations for the company.
Imperial Oil is Canada’s biggestintegrated oil company and largestrefiner. It was incorporated in 1880and is 69.6% owned by ExxonMobil.
Tuscany Int’l.DrillingJENNINGS CAPITAL Breaking the mouldDigested from an Aug. 24 reportby analyst David Ricciardi
Mr. Ricciardi begins coverage ofTuscany International Drilling(TID-TSX, $1.05) with a “buy” rec-ommendation and a one-year tar-get price of $1.90. He writes:
Tuscany is focused on providingan array of new drilling rigs to theSouth American market. The strat-egy is to expand its presence by of-fering a unique combination of newrigs, replacing outdated/idle rigsand participating in current/up-coming drilling campaigns.
The company has deployed ninerigs in various countries, with eightmore under preparation and nego-tiation for bidding. The 17 rigs rangefrom 550 HP drilling/workover rigsto 2,000 HP heli-portable rigs, whichwe expect to be operational by De-cember 2010.
Tuscany’s customers includepublic and private E&P companiesranging in size, the larger of whichincludes Ecopetrol, Gran Tierraand Petrobras; the smaller includesCanacol, Winchester Oil & Gas andHRT Oil & Gas.
The diverse customer baselessens the impact of customer-specific downturns hamperingTuscany’s cash flow.
The investment rationale isbased on five key assumptions,which we feel warrant a premiumEBITDA multiple versus its peergroup, not a discount the market iscurrently pricing.
• The rig fleet has a high utiliza-tion rate of 86% versus the currentpeer average of 43%. WesternCanadian utilization for the pastfour quarters is 32%.
• The rig fleet is less than twoyears old and is dependable and ef-
ficient, shaving days off totaldrilling time compared to older rigsin operation.
• Tuscany has an average EBIT-DA margin of ~35%, significantlyhigher than the peer average of28%.
• The rig fleet will be opera-tional year-round, versus the sea-sonal nature of the WCSB drilling.
• Our 2011F EBITDA estimate ofUS$57.5 million is based on a mod-est capital program of four rigs, aconservative figure growth as-sumption relative to the 11-rig pro-gram for 2010.
• We feel the market will not in-corporate these variables until threeor four consecutive quarters of fi-nancials have been disseminated —to prove these claims are valid.
Our target price is based on anEV/EBITDA multiple of 6.0X ap-plied to our 2011 EBITDA estimate.
Tuscany International DrillingInc. is a Canadian-based companyproviding contract drilling andworkover services, along withdrilling tool rentals, to the oil andgas industry in South America.
The ForzaniGroupPI FINANCIAL Cautious H211 outlook onpositive sales trends
Digested from a Sept. 8 report byanalysts Sheila Broughton andVictoria Chan
Mses. Broughton and Chanmaintain their “buy” rating and$19 target price after The ForzaniGroup Ltd. (FGL-TSX, $15.75)posted its latest numbers. Theywrite:
The Forzani Group reportedQ211 results for the period endedAug. 1st, 2010. While Q211 saleswere ahead of our expectations,EBITDA margins and the quarterloss were weaker than our forecast.
In continuing weak economicconditions, The Forzani Group re-ported Q211 retail system sales in-creased 3.6% to $361 million from$348 million in Q210, including a4.4% increase in same store sales.Positive same-store sales have con-tinued for the first five weeks of theimportant back-to-school seasonwith the strongest sales increase inthe last week in the period.
The company’s execution of its“Unify and Simplify” strategic plan,a stronger economy relative to lastyear and a broader product offer-ing appeared to support salesgrowth. Revenue increased 6.5% to$316 million led by a 5.6% increasein retail revenue and a 9.0% in-crease in wholesale revenue. Im-proved margin rates in both the re-tail and wholesale businesses led toa 120 basis point increase in grossmargin to 34.6%.
Q211 EBITDA increased 69% to$11.7 million resulting in a 3.7%EBITDA margin, up 140 basispoints from Q210. The improvedEBITDA margin reflects the highergross margin and lower store oper-ating expenses as a percent of salespartly offset by higher general andadministrative expenses. This ledto a Q211 net loss of $1.8 million or$0.06/share compared to a net lossof $4.4 million or $0.14/share inQ210.
While Q211 results were lessprofitable than expected, we be-
Continued from preceding page

Issue 18 / 10 WHAT THE BROKERS SAY ABOUT CANADIAN STOCKS October 8, 2010 / 355
I N V E S T O R ’ S D I G E S T
lieve management is effectively re-vitalizing the Forzani story with theexecution of their “Unify and Sim-plify” plan. We anticipate materialprofitability growth in the key sec-ond half period of the year.
We have updated our forecastfor Q211 results, slightly reducingour EBITDA and EPS forecast. OurFY11 forecast includes revenue of$1,417 million, EBITDA of $109million, a 7.7% EBITDA marginand net earnings of $36.2 million or$1.22/share.
Our target reflects a 4.8xEV/EBITDA and 14x PE multiplebased on our FY12 forecast. Wemaintain our “average” risk rating.
The Forzani Group Ltd. is Cana-da’s largest, national sporting goodsretailer operating 547 retail storesincluding 334 corporate and 213franchise stores.
Yoho Resources ACUMEN CAPITALQ3 2010 ResultsDigested from an Aug. 26 reportby analyst Robert Cooper
Mr. Cooper maintains his “buy”recommendation and one-yeartarget price of $3.50 after Yoho Re-sources Inc. (YO:TSX-VEN, $2.60)files its third-quarter report. Hewrites:
Production for Q3 (recall YOhas a September year-end) wasslightly lower than expectationsdue to unplanned facility outagesat third-party plants (Devon andPGF). We understand the cumula-tive impact was largely equal to thevariance between actual and esti-mated production (~130 b/d).
While production was impact-ed, cash flow was in-line due toslightly better product price real-izations and markedly lower thanexpected royalty rates for thequarter. We have made some mi-nor changes to our estimates as aresult of the new information. AsQ4 will be the first quarter of theCanoils acquisition (deal closedin Q3, production will be felt inQ4), we expect royalties to in-crease somewhat, coincidentwith additional liquids produc-tion. YO stated 2010 exit guidanceof ~2,950 b/d which is in-linewith our estimate.
Five (2.9 net) wells were drilledfrom break-up to date, as follows:
• Kaybob-four wells (two hz andtwo vt). First vertical (94% WI) wascompleted in the Gething and isbeing tied in with 125 boe/d grossof gas and liquids expected;
• Second vertical (37.5% WI) atKaybob completed in Notikewinand Viking with an initial rate of250 b/d gas and liquids;
• Horizontal well (60% WI)completed in the Notikewin. Initialproduction of 500 b/d gross is ex-pected once tied-in during Q4;
• Horizontal well (45% WI) tar-geted the Cardium and was noteconomic although further techni-cal work is being completed; and,
• 50% WI vertical well atMcLeod targeting the Ostracod iscurrently being completed and logindications are positive.
While all of the above is posi-tive, the market has a keen focuson the outcome of the company’sDuvernay Shale horizontal well.We estimate the cost of the 5,100m well is ~$7-$7.5 MM of whichYO has a 33% WI. The well has thepotential to be a game changer for
YO and we expect results at theend of September. Success on thewell has material implications forcapex in F11 (we would expect theoperator to accelerate develop-ment for the play). YO holds 33%WI in 28 sections of Duvernayrights at Kaybob.
We await the potentially materi-al drilling catalyst at Kaybob (Du-vernay shale) in late September andnote that the business plan contin-ues to be executed in an efficientmanner. Commodity prices remainthe key risk to the YO story. Our tar-get (6.6x 2011F EV/DACF), seen an-other way, represents ~45k/boe/dor 4.2x 2011e cash flow.
Yoho is a junior E&P with coreareas in northwest Alberta andnortheast British Columbia.
Legacy OilPETERS & CO. LTD.Acquiring Bronco EnergyDigested from a Sept. 8 report byanalyst Jeff Martin
Mr. Martin maintains his “sec-tor perform” rating for Legacy Oil +Gas (LEG-TSX, $11.05) and his 12-month target price of $11.50 ashare. He writes:
Legacy announced it is acquir-ing Bronco Energy for $36.5 mil-lion, comprised of $27.8 million incash plus assumed debt, and $8.7million in equity. Bronco has cur-rent production of 700 barrels of oilequivalent per day (boe/d), andgenerated a cash flow operatingloss of $1 million in the secondquarter. Bronco’s Wabiskaw devel-opment was a complete failure andwe have not attributed any value tothe oil sands acreage.
Bronco’s current production istwo-thirds heavy oil. Relative toLegacy’s current assets, this hashigher operating costs, higher pric-ing differentials and lower royal-ties. With the incorporation ofthese changes, our 2011 estimatedcash flow per share rises from $1.59to $1.60, and our forecast debt tocash flow ratio increases from 0.8times to 0.9 times. Our 2011 pro-duction estimate increases from13.2 thousand boe/d to 13.8 thou-sand boe/d.
While Bronco had a cash flowloss from operations of $1 millionin the most recent quarter, we be-lieve that once the assets are ac-quired, this loss can likely be re-versed to positive cash flow of ap-proximately $3 million a year withthe elimination of general and ad-ministrative expenses and thechange in capital structure. Bron-co’s operating costs were $47.60per boe in the second quarter.
The deal includes 61,000 netacres of land, which may includesome Grand Rapids potential tothe east that could be traded orswapped with another operator.
Legacy will issue 0.0182 sharesfor each Bronco share, whichequates to a purchase price of$0.20 per Bronco share. Legacy willassume $24 million in convertibledebentures, which will be acquiredat a premium of 110%, in additionto a forecast net working capitaldeficit of $1.5 million.
From Legacy’s perspective, thetransaction was largely tax moti-vated as Bronco has $190 million oftax pools, of which $122 million arenon-capital. This will allow Legacyto defer cash taxability until 2013,compared to our previous estimate
of early 2012.While the Bronco transaction is
obviously tax motivated, the assetswill still need to be integrated intoLegacy’s operations, which will notcome without its challenges givenall of the other assets that are cur-rently being integrated.
We are maintaining our recom-mendation of “sector perform,”with a 12-month target price of$11.50 per share. This equates to anapproximate 20% premium to ourestimate of the company’s poten-tial asset value and a 2011 Enter-prise Value/Debt-Adjusted CashFlow multiple of 7.5 times.
Legacy Oil is an oil and gas ex-ploration and production firm.
Aura MineralsWELLINGTON WESTImprovement expectedDigested from an Aug. 13 reportby analyst Steve Parsons
Mr. Parsons maintains his“buy” recommendation for AuraMinerals (ORA-TSX, $3.46). How-ever, he lowers his 12-month targetprice to $5 a share from $5.25. Mr.Parsons writes:
Aura Minerals has completedits transition from development-stage gold firm to gold producer.Operational improvements remainAura’s focus for 2010, while a re-turn to normalized productionrates are expected in 2011.
Aura has closed the acquisi-tion of three producing minesfrom Yamana Gold, namely theSan Andres Mine in Honduras(the deal closed at the end of thethird quarter of 2009), and the SãoFrancisco and São Vicente minesin Brazil (the transaction closedApril 30, 2010).
In Mexico, Aura continues tomake progress on re-starting theAranzazu copper-gold-silver pro-ject, with a planned start-up in thethird quarter of 2010. Aura is cur-rently in the midst of an extensivedrill program there to test for ex-tension of the mineralization atdepth, with results from four holesreleased to date and more resultspending. Success on this frontcould be transformational from aproduction perspective, as the de-lineation of mineralization atdepth could justify the move to alarger bulk mining scenario.
We view Aura’s second quarter2010 production results as likelyrepresenting a low-water mark. Weexpect improvement, but this hasbeen delayed. Production for thequarter was down from the previ-ous quarter due to rain, lowergrades and higher strip ratios. Sec-ond quarter production of 35.3thousand ounces came in belowour 39.4 thousand ounce estimate;total cash costs of US$851 anounce came in above our estimateof $757 an ounce.
Aura lowered its productionguidance by approximately 15% tobetween 157 thousand and 167thousand ounces of gold (from185 thousand to 195 thousandounces). Management has alsostarted implementing its cost ini-tiatives and should see effects takehold in the first quarter of 2011.Aura is planning over US$100 mil-lion in capital expenditure/explo-ration programs to spur produc-tion growth. Nearly half of Aura’scapital spending budget is for theAranzazu mine in Mexico, with
start-up planned for the thirdquarter of this year. The balance ofthe capital spending budget is ear-marked to remedy productionconstraints in Brazil and expandAura’s resource base.
Owing to a challenging secondquarter that came in below ex-pectations, we are lowering ourtarget price to $5 and maintainingour “buy” rating. We see potentialfor the stock to re-rate: modestlyat first – in the second half of 2010– with the bulk of the re-ratinglikely in 2011 as the capital im-provement initiatives take holdand as development projectsmove forward.
Aura Minerals operates goldmines and a copper-gold-silvermine in Central and South Ameri-ca. It also has a large copper-iron-silver development project in Brazil.
GoldcorpDUNDEE CAPITAL MARKETSBids for Andean ResourcesDigested from a Sept. 7 report byanalyst Paul Burchell
Mr. Burchell maintains his“buy” recommendation and“medium” risk rating for GoldcorpInc. (G-TSX, $44.49) and increaseshis 12-month target price to $53 ashare from $52. He writes:
On September 2, Goldcorp an-nounced it has entered into anagreement to acquire all of the out-standing shares of Andean Re-sources for approximately C$3.6billion (based on recent closingprices). We believe this is a gooddeal for Goldcorp shareholders.Andean’s high quality Cerro Negrogold project will likely add mean-ingful gold production to an al-ready impressive growth profile,while the expected low cost of pro-duction should compliment Gold-corp’s position as one of the lowestcost gold producers.
We find the transaction addsslightly to our Goldcorp net asset
value (or “NAV”) per share esti-mate. As is our practice, we will in-corporate Cerro Negro into ourvaluation after the deal closes,which is expected to take place inlate 2010 or early 2011. In themeantime, we have made somerevisions to our operating and costforecasts for Goldcorp that do notinclude the proposed Andeantransaction. These result in aslight increase in our valuation ofGoldcorp. Our NAV estimate in-creases to C$28.89 a share from$28.32 a share.
Under the proposed agree-ment, Andean common share-holders will have an option to electto receive cash or shares or anycombination of cash and shares,subject to the aggregate cash limi-tation. Holders of Andean com-mon shares will receive 0.14 com-mon shares of Goldcorp or a cashpayment of C$6.50 per share foreach Andean share they hold. Thisis subject to a maximum cash con-sideration of $1 billion.
Andean’s key asset is its 100%-owned Cerro Negro gold project inSanta Cruz, Argentina. Cerro Negrois a high-grade low-sulphidationepithermal deposit with reportedindicated resources containing anestimated 2.5 million ounces ofgold and 23.6 million ounces of sil-ver, with additional inferred re-sources containing an estimated523,000 ounces of gold and 3.1 mil-lion ounces of silver.
Based on the current feasibilitystudy, the project is expected toproduce 250,000 ounces of gold ayear at a total cash cost of aboutUS$60 an ounce (net of silver by-product credits) in the first fiveyears. In its conference call, Gold-corp suggested it plans to examinethe viability of doubling through-put and gold production at CerroNegro. Goldcorp also expects tosignificantly increase the resourcethrough extensive exploration, in-cluding the area hosting the newlydiscovered Mariana Central Zone
BombardierUBS INVESTMENT RESEARCH
Solid execution in challenging environment Digested from a Sept. 2 report by analyst Tasneem Azim
Mr. Azim reiterates his “buy” rating and $6.50 target price afterBombardier (BBD.B-TSX, $4.60) posted its latest quarterly report. Hewrites:
Prepared for weakness; positioned for recovery — Despite lowerthan expected revenues in Q2/F11, we believe BBD posted a healthyperformance on better than expected execution. Should demand re-main weak near-term, BBD has already demonstrated it can preserveprofitability against a challenging backdrop. And in the context of agradual economic recovery, we believe the company has laid a solidfoundation for a healthy recovery in earnings.
Our F2011 aero-delivery forecasts incorporate a 34% and 22% de-cline in commercial and bizjet deliveries versus guidance of -20% and-15% respectively. This variance is mainly a reflection of poor orderintake and soft backlogs for the Learjet, CRJ and Q-Series. Weak aerodemand is also the driver behind the divergence of our free cash flowestimate of -$220m from BBD’s guidance of neutral-to-positive freecash flow in F2011. Should aero orders accelerate in H2/F11, we be-lieve there is upside potential to our forecasts.
With book-to-bill of 2x in transportation, BBD is trending nicelytowards F2011 book-to-bill of 1x or better. We project weak demandand unfavorable FX to result in an 8% decline in sales in F2011, butexpect margins to remain steady year over year at ~6.3%. Long-term,we project stable single-digit revenue growth and healthy margin ex-pansion to the 7-8% range by F2013-14 (in line with guidance).
Of Special Interest
Continued on page nex page
356 / October 8, 2010 WHAT THE BROKERS SAY ABOUT CANADIAN STOCKS Issue 18 / 10
I N V E S T O R ’ S D I G E S T
(which we believe could host up-wards of an additional two millionounces of gold or more).
Eldorado Gold has also made abid for Andean Resources. Eldo-rado proposed an all share dealconsisting of 0.31 of Eldoradoshare for each Andean share(valuing Andean at slightly lessthan C$6.50 a share). Andeanmanagement is backing the Gold-corp bid at this time; however, wewould not rule out a counter offerfrom Eldorado.
Goldcorp is one of the world’slargest gold producers.
Second WavePetroleumACUMEN CAPITALQ2 resultsDigested from an Aug. 30 reportby analyst Robert Cooper
Mr. Cooper maintains his“speculative buy” rating and one-year target of $3.85 a share afterSecond Wave Petroleum (SCS-TSX, $2.78) reports its second quar-ter. He writes:
SCS Q2 results were broadly in-line with our estimates on produc-tion, opex and cash flow. Of note, asfacilities continue to expand acrossJudy Creek (expected to be thecompany’s lowest opex area at $10-$12/boe at full capacity versus lega-cy properties in the $17-$20/boerange), and as Judy Creek compris-es a greater proportion of corporateproduction, we anticipate that opexwill continue to fall through 2011 tothe $15.50/boe level.
SG&A was substantially higherthan estimated as a result of incen-tive compensation paid during thequarter. Finally, the company an-nounced the forced redemption ofa $4.0 million convertible deben-ture during the quarter which weaccounted for in Q2. Conversionwill occur in late August ($4.0 mil-lion redeemed through 3.3 millionshares at $1.20).
An aggressive H2 capex pro-gram is designed to build out pro-duction and facilities at JudyCreek. Design work has been un-dertaken for the next 17 multi-well horizontal pads (designed forsix wells each) and an additional23 km’s of pipeline to tie-in thewells. Licences have been re-ceived for all drilling and infras-tructure related items on the next23 horizontal wells. While thegroundwork has been laid, we dosee some risk to the plan.
Since SCS has moved fromacid wash completions to multi-stage acid fracture treatment, wellresults have been encouraging(the first three wells have shownIP ranging between 140-160boe/d (~63% oil)). However, oper-ations have shown that the reser-voir does have areas where ran-dom fracturing neutralizes the ef-fectiveness of portions of thecompletion.
To remedy this situation, SCShas moved to staged fracturestimulations (at slightly highercost than the acid wash) whichutilizes down hole ESP’s to maxi-mize well performance. SCS al-luded to “modifications to itsdown hole pumping design”which we understand to mean en-gineering techniques designed to
optimize ESP efficiency. Ulti-mately, we believe this is an engi-neering issue that is resolvable.The question in our mind is totiming of the remedy as opposedto if a remedy exists.
New guidance should result inmaterial increase in production.SCS released new guidance, as fol-lows:
• $55 MM capex between H2/10and Q1/11 with ~$41 MM in Q3and Q4;
• Capex to be focus on drillingand completions ($32 MM of ~$41MM in 2010) resulting in 14 (100%WI) Judy Creek wells in H2 and an-other four in Q1;
• Facility upgrades include ex-pansion of the oil battery to 24,000bbl/d emulsion and 8mmcf/d so-lution gas capacity which shouldresult in ~4,000 bbl/d of oil han-dling capacity, enough to accom-modate the 2010 and 2011 drillingprograms; and,
• Exit 2010 production volumeof 2,800 boe/d (~65% liquids) and~3,200 boe/d at the end of Q1/11.
We have made minor changesto our estimates to account for newinformation. We believe the guid-ance is reasonable and achievable.But we also caution that if successis delayed, we believe that SCS willrestrain spending so as to ensurebalance sheet integrity.
Drilling success through thebalance of 2010 and early 2011 willbe the tale of the tape for SCS. Suc-cessful development of Judy Creekwill need an order of magnitudelarger investment than SCS will beable to accommodate. We believethat SCS will look to monetize ifdrilling is successful. Our target isbased on a hybrid NAV value of$3.85/share.
SunOptaPI FINANCIAL SunOpta BioProcess soldDigested from a Sept. 1 report byanalysts Sheila Broughton andVictoria Chan
Mses. Broughton and Chanmaintain their “buy” rating andtarget price of US$7 a share afterSunOpta Inc. (STKL-NASDAQ,$5.24; SOY-TSX) sold a businessunit. They write:
SunOpta announced it has soldSunOpta BioProcess Inc. to Masco-ma Corp. in a deal valued at ap-proximately $51 million. Posttransaction, Mascoma is valued atapproximately $206 million.
The all stock transaction resultsin existing Mascoma share-holdersowning approximately 73% of thecombined company, SOY will ownabout 18% and other existing SBIshareholders will hold 19% of thecombined company.
SBI $51M deal summary:• SOY received approximately
$37.2 million in preferred andcommon shares of Mascoma andbecomes Mascoma’s largest share-holder at 18%.
• SBI ‘s existing preferred share-holders received approximately$18.5 million of equity in Mascomaand hold 9% of Mascoma’s equity.
• Mascoma’s existing share-holders retain 73% (~ $151M) ofMascoma’s equity.
• SBI’s cash balance of approxi-mately $14 million transferred toMascoma from SunOpta’s balancesheet. We estimate Mascoma nowhas approximately $22 million in
cash and essentially no debt. Through this transaction we
believe SOY has effectively divest-ed its exposure to this non-core,non-food business. We believeMascoma is a good fit with SBI asSBI’s technology focuses on thefront-end engineering related topre-treatment of fibres for cellu-losic ethanol productions andMascoma’s technology focuseson the conversion of non-foodbiomass feedstocks into cellulosicethanol.
We also believe this transactioneffectively reduces SOY’s risk relat-ed to the ongoing development ofSBI’s technology. SOY will nolonger be responsible for financingSBI’s future development whichcould have required additional fi-nancing in the near-term.
Mascoma has a committed in-vestor base including a number ofventure firms as well as both Gen-eral Motors and Marathon Oil.
Our target valuation is drivenoff an 8.0x EV/EBITDA multipleand a 0.5x sales multiple based onour 2011 forecast.
SunOpta Inc. based in Bramp-ton, Ont., is primarily a global natu-ral, organic and specialty foods andnatural health products company.
Wild Stream ExplorationJENNINGS CAPITALResults in line; increaseddrilling increases our forecastsDigested from an Aug. 24 reportby analyst Tim Murray
Mr. Murray maintains his “buy”rating and raises his one0year tar-get price to $7.25 from $6.75 afterWild Stream Exploration Inc.(WSX-TSX/VEN, $6.55) posts itsquarterly results. He writes:
Q2/10 results in line. WildStream reported production of1,744 boe/d and CFPS of $0.13 ver-sus our estimates of 1,750 and$0.13, respectively.
Successful Q2/10 drilling pro-gram. The company drilled 5 gross(4.7 net) wells targeting the Shau-navon, 1 gross (1 net) at Dodslandand 2 gross (2 net) in Coutts, withan 86% success rate.
Due to the success of its H1/10drilling program, Wild Stream hasincreased its 2010 capital programfrom $60-$65 million to $80 mil-lion. We have adjusted our modelto reflect the increase in capital ex-penditures over the remainder of2010. We have not adjusted ourFY2011 capital program of $50 mil-lion, which is close to our cash flowforecast of ~$45 million.
Increases to management’sproduction guidance no surprise.Management has increased itsFY2010 production from 1,750boe/d to 1,950 and exit productionto 2,900 boe/d from 2,200 to 2,300boe/d. As mentioned in previousnotes, our production forecastshad been running ahead of man-agement’s. Our new productionforecasts are pretty well in line withmanagement’s, and the bulk of theproduction additions from the in-creased capital program will affectour FY2011 numbers.
The majority of the increasedcapital spending will be completedthrough the use of the bank facility.We see net debt increasing to ~$32
million by YE2010, against a bankfacility of $50 million. We currentlydo not see this as a problem as cashflow should play catch up in H1/11,and we also see an expansion in thebank facility. We do not anticipateWild Stream having any difficultycompleting its 2010 capital pro-gram at lower commodity levels.
Wild Stream Exploration is a ju-nior exploration and productioncompany with assets in Alberta andSaskatchewan. The company is cur-rently focused on oil resources playstargeting the Shaunavon, Vikingand Cardium formations.
U.S. GeothermalWELLINGTON WESTNo longer “speculative”Digested from a Sept. 9 report byanalyst Sean Peasgood
Mr. Peasgood upgrades his rat-ing for U.S. Geothermal (GTH-TSX, $0.92) to “buy” from “specu-lative buy.” He reiterates his 12-month target price of $1.60 a share.Mr. Peasgood writes:
Enbridge Inc. has acquired a20% direct equity stake in the Nealgeothermal project, committingup to $23.8 million. With this eq-uity investment, the project is nowfully financed and on track to pro-duce 22 megawatts (net to U.S.geothermal) by mid-2012. Assum-ing U.S. Geothermal spends $4million more in capital ($9 millionalready in), and the drilling pro-gram remains on track, we esti-mate that this project is worth$0.66 a share.
U.S. Geothermal is scheduled toprovide another $4 million of equi-ty in 2010, with the remainder fi-nanced from Enbridge and the U.S.Department of Energy loan. So farthe company has spent about $9million on the Neal project. The to-tal capital required is estimated at$124 million.
By the end of this year, U.S.Geothermal plans on drilling twoto four new wells at Neal. Withthese, management believes it willbe able to obtain the requiredGeothermEX report confirmingthe resource to have the Depart-ment of Energy loan released forplant construction. We estimatethat this will require another $9million of equity in 2010 ($4 mil-lion from U.S. Geothermal and $5million from Enbridge). The re-maining $106 million is expectedto be deployed over 2011 ($76 mil-lion) and the first half of 2012 ($30million). Enbridge has agreed to fi-nance the rest of the equity por-tion, or $18.8 million on a 75%debt to equity ratio.
Once Neal is operating weforecast the project will generateapproximately $7.5 million inearnings and about $11 million incash flow annually. Given 15megawatts of the 22 megawattsare already behind pipe and theproject is now fully financed, wehave increased confidence inthese project economics comingto fruition.
This was Enbridge’s first in-vestment in the geothermal space,but the company already has in-terests in 810 megawatts of re-newable energy. We believe En-bridge may be interested in otherU.S. Geothermal projects. We be-lieve that as the latter is successfulin bringing projects online, otherstrategic investors may look to
gain exposure to the renewablemarket through geothermal devel-opment. We see this announce-ment as very positive not only forU.S. Geothermal but the entiregeothermal industry.
Taking into consideration theoperating Raft River project, theNeal Hot Springs project and theSan Emidio Repower, we believethe base value for the stock shouldbe $1.08 a share. Given that none ofthese projects require additional fi-nancing, we are using the currentshare count to come up with thisbase case value. While our targetprice supports $1.60, this valuationtakes into consideration some val-ue for the remaining portfolio ofprojects and incorporates addi-tional equity requirements in 2011and beyond.
Given that U.S. Geothermal istrading below our base case valueof $1.08 and has the near-term pro-jects fully financed, we are movingto a “buy” rating from a “specula-tive buy” rating. Our price targetremains unchanged at $1.60 andreflects some additional value forthe project pipeline.
U.S. Geothermal is a renewableenergy development firm that iscurrently focused on three geother-mal energy production projects.
Harry WinstonUBS INVESTMENT RESEARCH Q2 beats; Retail and Mining perform well
Digested from a Sept. 2 report byanalyst Brian MacArthur
Mr. MacArthur upgrades hisrating to “buy” from “neutral” afterHarry Winston (HW-TSX, $10.50)filed its second-quarterly report.His $15.50 price target remains un-changed. He writes:
HW reported fiscal Q2 2011 EPSof $0.21; however, after excludingforeign exchange gains we calcu-late adjusted EPS as $0.17; signifi-cantly above UBS and consensusestimates of $0.04. In Mining, re-sults benefited from three roughdiamond sales in the quarter aswell as sustained higher prices incertain categories of rough dia-monds. In Retail, the segment hadpositive quarterly earnings for thesecond quarter in a row.
HW reiterated guidance forcalendar 2010 Diavik productionof 7.8M carats. This is in line withprevious estimates, but we notethat the mix of ore has changedslightly. Mining cost of sales guid-ance is down from $260M to$240M. Retail sales growth is stillexpected to be 20-25% for theyear, and HW is optimistic aboutopportunities for expansion of thebrand in developing countriesand core markets.
As previously announced, sub-sequent to Q2-end HW reac-quired a 9% indirect interest inthe Diavik Joint Venture fromKinross for ~$220M, consisting of$50M cash, 7.1M HW shares and a$70M 5% promissory note dueAug. 25, 2011.
We have revised our fiscal 2011EPS estimates from $0.23 to $0.42to reflect updated pricing, costsand depreciation. Applying aP/NAV multiple of 1.0x our NAV es-timate of US$14.40 results in aprice target of C$15.50.
Continued from preceding page

Issue 18 / 10 WHAT THE BROKERS SAY ABOUT U.S. STOCKS October 8, 2010 / 357
I N V E S T O R ’ S D I G E S T
With any company,there comes a timewhen rapid growthmust give way to more
efficient operation. McDonald’s isone outfit that has recognized this.For the past while, the burger behe-moth has substituted revitalizationfor breakneck expansion. Not onlyhas it freshened its marketing cam-paign, it has also concentrated onboosting sales per individual restau-rant. And the effort, says Jack Russo,has paid off in higher revenue andearnings. Couple that with McDon-ald’s share buybacks, overpoweringpresence and steadily rising divi-dends and you have a good invest-ment. And although Mr. Russo, anEdward Jones analyst, isn’t ratingMcDonald’s a buy, he is recom-mending it as a hold. Elsewhere,Steven Valiquette, an analyst withUBS Investment Research, is con-cocting a neutral for LaboratoryCorp. of America Holdings, whileMyles Walton, an analyst withDeutsche Bank Securities, is keepingaircraft maker Lockheed Martin in aholding pattern. — P.F.
UNITED NATURALUNFI-NASDAQ; $34.44
Citigroup Global MarketsAnalyst: Gregory Badishkanian
United Natural Foods Inc.served up a strong fourth
quarter, Mr. Badishkanian reports.At $0.40, he notes, its net earn-
ings per share were not only bang-on with the consensus call, but justwhat the company ordered.
Indeed, EPS came in three pen-nies below the low end — $0.37 —of United Natural’s own estimate.
And net income would havebeen $0.06 higher, had the cost ofthe company’s new distributionwarehouse, not been factored in.
The company’s operational im-provements and cost controls fu-elled the better performance, saysMr. Badishkanian, who also creditshigher-than-expected sales.
And sales were strong, hittingthe checkout line at $988.5 million— $41.5 million above expecta-tions and at least $31.5 millionabove United Natural’s forecast.
Sales were also $135 millionhigher year over year — a jump of15.8 per cent.
The company, meanwhile, is be-ing bullish, fixing 2011 sales growthbetween 15.8 and 18.4 per cent, atleast 480 basis points higher thanwhat the pundits are forecasting.
It’s also pegging EPS growth be-tween $1.74 and $1.83; the pundits,by contrast, have settled on $1.80.
For Mr. Badishkanian, UnitedNatural continues to merit a“buy/high risk,” although he’sboosting his price target $2 to $42.
A leading wholesale distributorof natural and organic foods in theU.S., United Natural supplies morethan 60,000 items to 17,000 cus-tomers, including independently
owned retail stores, supermarketchains and buying clubs.
Besides natural groceries, UNFIstocks personal care products, sup-plements and frozen foods.
For the three months endedJuly 31, United Natural’s net in-come rose 13.5 per cent to $17.6million, while its gross margin fell44 basis points to 18.5 per cent.
The poorer performance re-flects moderated inflation, as wellas a continued shift in growth incustomer mix, the company says.
MONSANTOMON-NYSE; $52.80
Canaccord GenuityAnalyst: Keith Carpenter
Mr. Carpenter continues toseed a “hold” for Monsanto
Co., citing its revised earningsguidance for fiscal 2010.
He’s also cutting his 12-monthprice target to $56 from $57.
In late August, Monsanto saidits net income for fiscal ’10 wouldrange from $2.40 to $2.45 a share.
It had previously pegged EPSbetween $2.40 and $2.60. The con-sensus crew had been hoping for$2.50; Mr. Carpenter, for $2.49.
Monsanto’s lower expectationsreflect higher-than-anticipated re-search and development costs,along with steeper sales, genera-tion and administrative expenses.
The company is also taking a$180 million restructuring chargefrom its herbicide business, al-though it continues to predict cashflow of $400-$500 million.
Mr. Carpenter, not surprisingly,is tweaking his estimates, cuttingMonsanto’s EPS for fiscal ’10 to$2.43 from $2.49. He’s also shaving$0.08 off his 2011 forecast of $2.86.
In addition, he now thinks thecompany will incur higher SG&Acosts in fiscal 2011, roughly around$2.1 billion — the high end ofMonsanto’s own estimate range.
Originally a company focusedon agro-chemicals, Monsanto nowearns its keep by turning out ge-netically modified seeds.
Indeed, the company estimatesthat its stamp appears on morethan 70 per cent of herbicide-re-sistant crops worldwide.
For its third quarter, Monsan-to’s net earnings tumbled to $384million, or $0.70 a share, from $694million, or $1.25 a share, for thesimilar period in 2009.
Net sales were also lower, slid-ing 6.3 per cent to $3 billion, whilegross profit tumbled 22.2 per centto $1.4 billion.
For the nine months endedMay 31, net income skidded to $1.3billion, or $2.30 a share, from $2.3billion, or $4.28 a share, for thesimilar period in 2009.
LABORATORY CORP.LH-NYSE; $75.01
UBS Investment ResearchAnalyst: Steven Valiquette
Laboratory Corp. of AmericaHoldings is buying Genzyme’s
genetics unit for $925 million.And Mr. Valiquette is putting
his forecast under the microscope.He had assumed Laboratory
Corp. could boost the EBITDAmargin on the genetics unit by 13per cent in the first year, resultingin a break-even in net earnings.
But he now thinks the marginwill finish up at just six per cent,while net income falls $0.23 a share.
Yet, Mr. Valiquette isn’t chuck-ing out the experiment just yet.Laboratory’s 2011 share dilution,he says, will only be $0.08, while itsbottom line will actually grow by$0.29 a share in 2012.
Still, to reflect the $0.23-a-sharedilution he’s now forecasting, he’strimming Laboratory’s 2011 EPS by$0.22 to $5.87, while lowering his2012 number to $6.70 from $6.84.
He’s also cutting his 12-monthprice target to $76 from $79, al-though he’s continuing to rate thecompany as a “neutral.”
Based in Burlington, N.C., Lab-oratory Corp. offers a range of ser-vices used by the medical profes-sion in routine testing, patient di-agnosis, as well as in the monitor-ing and treatment of disease.
It announced its bid for Gen-zyme Corp., a Massachusetts-based biotech, in mid-September.
For the three months ended June30, Laboratory’s net income rose to$157.2 million, or $1.46 a share, from$136.4 million, or $1.30 a share, forthe similar period in 2009.
Net sales were also higher, in-creasing 4.2 per cent to $1.2 billion,while operating income rose 10.5per cent to $270.5 million.
LOCKHEED MARTINLMT-NYSE; $70.38
Deutsche Bank SecuritiesAnalyst: Myles Walton
Mr. Walton is keeping Lock-heed Martin Corp. grounded
at “hold,” citing production prob-lems with the aircraft manufactur-er’s new F-35 jet fighter.
He’s also cutting his price targetto $82 from $86, while shaving $0.21from his 2011 net income estimateof $7.21 a share — an estimate al-ready below the consensus call.
Besides delays with the F-35,Mr. Walton’s revisions reflect whathe predicts will be Lockheed Mar-tin’s heftier pension obligations.
The analyst admits Lockheed isrunning the F-35 program more ef-
ficiently. But he worries that it’slikely to face further delays after thePentagon issues a technical reviewsometime over the next few weeks.
Until then, its shares, he sug-gests, will likely stay within theircurrent trading range.
Mr. Walton also suggests theshares will only begin to rise whenthe consensus estimates go up.
A pillar of America’s military-in-dustrial complex, Lockheed gener-ates almost 85 per cent of its salesfrom defence spending.
Indeed, both the U.S. Army andU.S. Navy are among the compa-ny’s many customers.
For its second quarter, Lock-heed’s net income fell to $825 mil-lion, or $2.22 a share, from $734million, or $1.88 a share, for thesimilar period in 2009.
Net sales, however, were high-er, inching up 2.7 per cent to $11.4billion, while operating profit grew5.3 per cent to $1.1 billion.
On a year-to-date basis, netearnings slipped two per cent to$1.3 billion, or $3.66 a share, from$1.4 billion, or $3.55 a share, for thesimilar period in 2009.
Net sales, though, were slightlybrighter, rising 2.8 per cent to $21.9billion, while the operating profitslid 1.1 per cent to $2.1 billion.
MCDONALD’SMCD-NYSE; $75.09
Edward JonesAnalyst: Jack Russo
McDonald’s Corp. gets nogrilling from Mr. Russo.
He spends the first four para-graphs of his report rhyming off theburger giant’s many superlatives.
For starters, he says, there’s thecompany’s omnipotence. Withmore than 20 per cent of the U.S.fast-food business, McDonald’shas three times the market share ofits nearest competitor.
And given its strong brandname, not to mention its nearly14,000 restaurants in the U.S.
alone, the company, says Mr. Rus-so, is likely to remain in top spot.
Then, there’s the success of Mc-Donald’s revitalization plan.Thanks to its new emphasis onmarketing and brand imaging, thelast few years have seen an increasein both sales and earnings.
Revenue and net income havebeen buoyed as well by a reductionin new store openings and a con-comitant focus on boosting indi-vidual restaurant sales.
McDonald’s revitalization planhas also seen the company re-model its restaurants, launch pre-mium products and offer healthierfood choices to boot.
Mr. Russo admits the chain’sdays of rapid growth are likely over.
But the company, he pointsout, not only continues to generatebuckets of cash, but has increas-ingly shown itself ready to returnits largesse to the shareholders.
Indeed, the burger giant hassubstantially raised both its divi-dends and share buybacks over thepast three years.
A year ago, McDonald’s raisedits dividend 10 per cent to a newannual rate of $2.20 a share — fourtimes the amount it paid out in2003. The increase marked the 24thconsecutive year that the companyboosted its payout.
In the meantime, McDonald’scan continue to lay claim to a solidfinancial position.
For one thing, it enjoys an “A”credit rating from Standard &Poor’s. Moreover, because it fi-nances much of its overseas oper-ations locally, it benefits from anatural currency hedge — a hedgethat reduces risk, says Mr. Russo.
Then, too, with McDonald’ssharper focus on boosting restau-rant sales, it has been able to limitits capital spending, thus freeingup more cash for reducing debt.
For Mr. Russo, McDonald’scontinues to merit a “hold” recom-mendation, along with an estimateof annual net earnings growth ofnine per cent.
When it comes to sales,Phillips-Van HeusenCorp. is anything butbuttoned-down.
Not only has the shirt makerbeen selling its wares though thewholesale channel, it has also beendoing so through factory outlets.
So successful has Phillips been in using the out-let route that it continues to grab market share fromshopping malls, says Mr. Saad.
Indeed, same-store sales at outlets now rangefrom the high-single to the low-double digits.
Meanwhile, Phillips’ wholesale channel contin-ues to be buoyed by leaner inventories, suggests theanalyst, who also sees PVH benefiting from its lackof exposure to mall-based specialty stores.
Not surprisingly, the company appears less like-ly than its peers to see a slowdown in the secondhalf of the year, says the analyst.
Elsewhere, he sees Phillips boosting its 2011 netearnings by $1 a share should its Tommy Hilfiger di-vision reach its growth and margin targets.
Phillips, which already owns the Calvin Kleinbrand, bought Hilfiger, a purveyor of preppy cloth-ing, for $3 billion in May.
Together, both labels make a good lineup. In-deed, for Phillips, the long-term opportunity tobuild both brands represents a “unique combina-tion of growth and scale,” says Mr. Saad.
In the interim, he’s pleased the company in-tends to pay down $400 million of its debt.
In fact, he sees the movesaving Phillips $15-$18 millionin interest charges in 2011.
In the meantime, he’stweaking his earnings esti-mates, raising 2010 EPS by$0.15 to $3.75, while hoisting
his 2011 number to $4.80 from $4.65 a share. He’salso raising his 2012 estimate — $5.25 — to $5.50.
But he’s continuing to peg the company at “neu-tral,” with a price target of $58 a share.
And although he admits that investors willing towait out a drop in Phillips stock may eventually berewarded, he thinks they’d now do better by buyingRalph Lauren.
In addition to Calvin Klein and Tommy Hilfiger,Phillips-Van Heusen does business under such stel-lar brands as IZOD, Arrow, Geoffrey Beene, Chaps,DKNY and Nautica.
For the three months ended August 1, Phillips-Van Heusen swung to a net loss of $54.6 million, or$0.83 a share, from net earnings of $26.6 million, or$0.51 a share, for the similar period in 2009.
Total revenue, however, was higher, nearly dou-bling to $1.1 billion, while net sales zoomed 121.1per cent to $1.1 billion.
For the six months ended Aug. 1, the companyswung to a net loss of $82.2 million, or $1.39 a share,from net earnings of $51.3 million, or $0.99 a share,for the similar period in 2009.
But total revenue presented a brighter picture,climbing 54.5 per cent to $1.7 billion.
Shirt maker a ‘neutral’ fitPHILLIPS-VAN HEUSEN
PVH-NYSE; $54.07CREDIT SUISSE
ANALYST: OMAR SAAD
NOTA BENEMPL’s Investment Planning
Committee recommendsthat around 25 per cent of aCanadian investor’s stockportfolio be in U.S. equities.This allows greater diversifica-tion. But when investing in theU.S., the focus should be oncompanies that Canada lacksor has in short supply.

358 / October 8, 2010 I N V E S T O R ’ S D I G E S T Issue 18 / 10
WHAT THE MARKET LETTERS SAY
As a number of advisoriespoint out in this issue,we’re still in the “sorting-it-out period” for stocks.
Positive Patterns says patience is inorder — after all the market suf-fered a massive heart attack and weare facing dismal economic num-bers for the foreseeable future.Louis Rukeyser’s Wall Street says aconfluence of factors has made fora “lumpy” recovery — not a hugesurprise in a credit-driven reces-sion. But there’s reason for hope:“Business conditions won’t have toimprove much for the recovery topick up steam and a double-diprecession remains unlikely.” In themeantime, investors have littlechoice but to grin and bear it andseek out the best stocks in the bestmarket sectors. One place to findattractive growth at bargain pricesis the tech sector. Our Letter of theWeek, Dow Theory Forecasts, saysmany tech stocks are showing con-siderable strength. In fact, nine ofits 33 recommended stocks aretechnology companies — the mostof any sector. Read the advisory’sfull report to learn which stocksyou should buy now. — J.S.
Positive Patterns, Box 310, Turn-ers, MO 65765; 417-887-4486;$500 a year.
We are still in the “sorting-it-out” period, says editor BobHoward. This market suffered amassive heart-attack and it willtake time to heal. We are looking atdismal economic numbers for theforeseeable future. There won’t beany quick fixes on the horizon.That’s why it will be paramount toinvest in groups that will be strongand then, within the group. “Norocket science required, just com-mon sense and some researchwork.” One group that will do wellis railroads. “The greatest moatever built might just be the RRbusiness.” As transportation costsgrow the railroads benefit fromhigher energy costs. Trucks costmore to fuel. Railroads are cheap-er and more efficient. Highwaysare also becoming increasinglycrowded. Trucking costs are esca-
lating much faster than for the rail-roads. Coal is the major driver forthe railroad business. In fact closeto 35 per cent of the railroad’s prof-its (in sum and total) are from theblack rock. Coal is still the mostimportant energy source in theworld. It is more widely used thanboth natural gas and oil and thiswill be the case for a long, long timeto come. For shipping large goodsin large quantity, nothing will evermatch the railroads, says Mr.Howard. Canadian Pacific Rail-way (CP-TSX, $63.55) is one play toconsider adding to your portfolio.Mr. Howard is increasing his buyrecommendation up to $64 a sharebut says it will be the last time hewill raise his suggested entry point.CP should deliver earnings aheadthat beat expectations. The com-pany is still cheap and has a supe-rior asset base. Canadian NationalRailway (CNR-TSX, $66.38) is thesame story. Buy up to $66 a share— but don’t chase it any further.CNR is doing a great job of runningan efficient railroad, and to expandthat franchise, Mr. Howardbelieves it will eventually buy CP.Between the two, CP is a better buyand it might be a good way to buyCNR — at a discount.
Casey Report, : PO Box 84900,Phoenix, AZ 85071; 602-445-2736;$279 a year.
This advisory is sticking with itsbullish long-term outlook for goldand wouldn’t be surprised to see atest of the $1,266 high soon. TheMarket Vectors Gold Miners ETF(GDX-NYSE, $56.42) took a diprecently with the gold correction,but it, too, came back screaming.Unfortunately, the dip didn’t trig-ger the advisory’s ideal buy pricebefore rebounding. “This timearound, we don’t want to miss theaction. Go ahead and buy GDX atthe market price on dips.” In recentmonths there has been a statisti-cally relevant shift in the correla-tion between gold stocks and thebroader market. In short, for aslong as it lasts, gold stocks will riseon bad economic news. “That per-formance will only attract moreinvestors to the sector, creatingsomething of a self-fulfillingprophecy that will very much workto the favor of those of us who havebeen in early.” In time, the actionin gold stocks will move down thefood chain, spreading more widelyto the high-quality, well positionedCanadian juniors. That action hasalready begun with some seriousreturns being earned in portfolioholdings such as AuEx Ventures, along-term holding of sister publi-cation International Speculator.AuEx has just agreed to be acquiredfor better than a 50 pe cent premi-um over current market. Suchmerger and acquisition activity willonly pick up, as the gold stock mar-kets heat up and the majors look toboost reserves by acquiring com-panies with known deposits.Investing in the juniors requirespaying close attention to individu-al issues and accepting a higherrisk profile. “For more cautious
investors, GDX — an exchange-raded fund comprised of largerproducers, will suit just fine, andwith the correlation away from thebroader markets, now’s as good atime as any to take a position, if youhaven’t already done so.”
Short takes, pro, con, maybe:Review & Outlook: “Whileavoiding many parts of thefinancial and consumer
side of the global economy, we dobelieve we will again see greatopportunities in some of ourfavorite groups in the monthsahead coincident with sharp mar-ket declines.”
Contra the Heard, 42 RivercrestRd., Toronto ON M6S 4H3; 416-410-4431; $500 a year.
In an interim update, this advi-sory announces the sale of its posi-tion in C&D Technologies (CHP-NYSE, $0.25). The deterioratingcondition of C&D Technologieswas outlined in a recent issue. Theadvisory had noted that the termsof the company’s credit line werean ominous sign. The interest rateworked out to 14.25 percent, withtight covenants on loan coverage.Such onerous borrowing is a clearred flag and provided a limitedamount of time to turn the tide ofcash flow in a positive direction.C&D has now hit the wall, but thishappened much faster thanexpected. Despite management’sassertion that the turnaround wason track, they seem to have electedto make a pre-emptive strike andrestructure their debt now, ratherthan wait for a potential default.Just how much this improved theirnegotiating position is hard to say,but the deal that emerged was notgood for shareholders. The restruc-turing agreement calls for the twonoteholders of the 5.25 percent
convertible senior notes due 2025and the 5.50 per cent convertiblesenior notes due 2026 to exchangethe debt for approximately 95 percent of the company’s equity. If theagreement does not proceed, C&Dis prepared to pursue a similarrestructuring under bankruptcyprotection. The reasons for thisrush to restructure debt thatdoesn’t come due for 15 years areunclear. When C&D’s stock priceslipped below $1, they received theusual letter from the NYSE aboutthe company falling short of listingcriteria and a business plan wasrequested. Instead of proceedingwith its “so-called business plan”,management instead entered intonegotiations that assumed that thecompany would be delisted.Apparently in the fine print, thetwo noteholders on the long-termdebt can ask for their money backif there is a fundamental changewith the company, and losing itsNYSE listing is considered such afundamental change. Shareholdersresponded by selling the shares enmasse, but then they rallied. Thisrally may well continue in the near-term and offer shareholders anopportunity to exit while there isdemand for the stock.
Money Reporter, 133 RichmondSt. West, Toronto ON M5H 3M8;416-869-1177; $227 a year.
In a followup to earlier advice,this advisory says Consumers’Waterheater Income Fund(CWI.UN-TSX, $5.09) is still a hold.CWI has struggled on the stockcharts, but the company is stillbusy making deals. One thing thathurt CWI this year is that it appar-ently ran afoul of some permissiondocumentation that its smart-metering division, Stratacon, failedto obtain. Evidently Stratacon gotpermission from the apartment
building owners to convert theirbuildings to smart metering, butthe regulators decided that indi-vidual renters had to sign off onconverting their units. CWI willwork this out with regulatorseventually. In the meantime, it haspurchased Enbridge Electric Con-nections Inc. for $23.7 million incash. Enbridge Electric offers con-tracts with customers to allowsmart sub-metering and remotemeasurement of electricity andwater in multi-unit dwellings inOntario. The acquisition is expect-ed to be accretive to the bottomline in 2011.
Emerging Growth Stocks, 102-2020 Comox St., Vancouver, B.C.V6G 1R9; 604-687 5772; $159 a year.
Given all the negative under-currents, “buying stocks in generalnow is apparently the equivalent ofwading into a pond full of hungryalligators.” It appears to be just theopposite, however for the gold sec-tor, says editor Louis Paquette. Infact, new nominal highs for goldmay not be far off. Gold stocksshould do well this fall so buy qual-ity when most investors are lookingthe other way. Mr. Paquette hasadded two new junior explorers toh i s b u y l i s t : R o l l i n g R o c kResources (RLL-TSX/VEN, $0.11)and Supreme Resources (SPR-TSX/VEN, $0.09). Rolling Rock hastwo gold exploration projects innorthern Manitoba. The stockplummeted in June when it wasremoved from the Russell 2000after the annual rebalancing tookplace in May. The stock wasremoved for falling below a certainmarket cap level as opposed to anyqualitative reasons. “It became toogood of a bargain.” Mr. Paquettesays he likes Rolling Rock becauseit has about one million ounces ofgold in the ground — an importantthreshold for buying juniors. It’salso in a safe jurisdiction. Drilling isplanned for this winter to expandthe size of the Monumentresource. Meanwhile, SupremeResources has two interestingprospects in B.C. It has the Ample-Goldmax Property, which is a high-grade-gold prospect southwest ofLillooet and the Tas Project, a cop-per prospect located near Prince-ton. Supreme’s Tas Project is adja-cent to Copper Mountain MiningCorp., which is preparing for pro-duction in 2011. Supreme is drilling800 metres from the CopperMountain property and hopes toconfirm a continuation of the orebody — news that could add con-siderably to its valuation.
Louis Rukeyser’s Wall Street, 1750Old Meadow Rd., McLean, VA22102; 800-892-9702; $99 a year.
Still waiting . . . waiting for therecovery to pick up steam, that is.Editor Benjamin Shepherd notesthat a confluence of factors hasmade for a “lumpy” recovery —not a huge surprise in a credit-driven recession. Right now the
Stocks still caught in ‘sorting out’ phase
HOTLINEThe hotline number for
Investor’s Digest is 416-869-2777 ext. 800. The hot-
line is intended to keepreaders abreast of informa-tion in Investor’s Digest. It
will be updated regularly onFridays by 6 p.m. eastern
time. The hotline will informreaders about the forth-coming issue and, when
necessary, provide updateson information in the Digest
that might have beensuperseded by events.
BUYING STOCKS RISKY BUSINESS HERE
Retirement Watch, 3700 Annandale Rd., Annandale VA 22003;800-552-1152; $82 a year.
Editor Bob Carlson is steering clear of stocks until the currentdeleveraging/deflation cycle is over. Who needs the risk ofstocks right now? Mr. Carlson says the economy is weak,despite government's best efforts to prop up the economy.
The 2009 stimulus spurred the economy enough to return growthto an average rate for a while. The stimulus was supposed to lead tosustainable private sector-generated growth. But as the stimulusended or its influence waned, economic growth slowed like a planethat’s had its throttle reduced.
When a plane is losing altitude it needs an injection of fuel. Theeconomy is in the same predicament. Corporate earnings growth isone of the few positives for the market. Strength in technology stocksmay be encouraging to some observers, but Mr. Carlson says busi-nesses are likely buying technology to replace obsolete equipmentand make purchases that were delayed in 2008 and early 2009.
The high cash balances held by corporations also aren’t a sign of astrong economy. There’s no indication of plans to use cash to hiremore staff or expand capacity. And consumer confidence is fallingfrom already low levels.
Income growth is sluggish and household debt is high. Mr.Carslon says business tax cuts, reductions in the cost of regulationsand hiring incentives are needed to fuel meaningful advances in thestock market.
The upcoming mid-term elections could be a turning point forstocks. Until the gloom lifts, however, this advisory is sticking withmortgages and corporate bonds.

Issue 18 / 10 I N V E S T O R ’ S D I G E S T October 8, 2010 / 359
WHAT THE MARKET LETTERS SAY
weak job market is continuing toweigh on investor sentiment. TheU.S. unemployment rate is hover-ing around 9.5 per cent and theoutlook for consumer spendingand corporate profits remainsweak. Employment plays a criticalrole in the economic recovery. Atfirst glance the July jobs report washorrid; the consensus estimatecalled for 90,000 new jobs, but theheadline number showed that thelabor market shed 131,000 posi-tions. Few observers pointed outthat the 143,000 temporary U.S.Census workers had artificiallyinflated jobs growth a year earlier.Private businesses hired 71,000workers in July, the seventhstraight month of net hiring.Employers are concerned aboutthe business environment, butthey’re still putting Americansback to work — albeit at a slowerpace than many had hoped. Manybusinesses continue to investheavily in productivity enhance-ment.Production increased 3.7 percent last year. This is a sign thathiring should pick up soon — pro-ductivity boosts can only go so faruntil new employees must beadded. It’s difficult to say what willspark the engine of economicgrowth, but something is bound to“light a match soon.” And, addsMr. Shepherd, “business condi-tions won’t have to improve muchfor the recovery to pick up steamand a double-dip recessionremains unlikely.”
McClellan Market Report, Box39779 Lakewood, WA 98439-0779;800-872-3737; $600 a year.
September is normally a weakmonth for the market, but not thisyear. Stocks have advancedstrongly in September, which isboth good news and bad news. “Adelayed corrective agenda stilldeserves its due, but strength at atime of normal weakness is a pos-itive sign for the market.” The nextseven months should see somereal strength, once we get pastmid-October. Look for higher oilprices into year-end. Bonds arestill in a downtrend and have fur-
ther to fall. Meanwhile, gold isoverbought and has lost itsupward momentum, so it shouldstumble toward a bottom soon.
Kaiser Bottom-Fish Online, Box6456, Moraga, CA 94570; 925-631-9748; $800 a year.
Editor John Kaiser notes thatRare Element Resources Ltd.(RES-TSX/VEN, $6.29) has attract-ed considerable market attentionsince obtaining its AMEX listing inAugust, a development thatprompted economist/newsletterwriter Mark Skousen to pick up therare-earth story and recommendRare Element as the preferred wayto participate in the sector. Thedual TSX/VEN-AMEX listing hasalso attracted traders who perceiveRare Element as a more volatileclone of Molycorp. The two com-panies bear some similarity in thatboth own high-grade light rare-earth-dominated deposits in theUnited States. Molycorp’s Moun-tain Pass deposit in southern Cali-fornia is larger and higher grade,but Rare Element’s Bear Lodgedeposit in Wyoming may eventual-ly rival Mountain Pass as an Amer-ican-based source of rare-earthoxides. For now, Molycorp’sMountain Pass deposit is carryingan implied value of $2 billion com-pared to only $235 million for RareElement’s Bear Lodge. Rare Ele-ment is in the midst of a 30,000-foot drilling program in the BullHill NW and Whitetail Ridge areas.On Sept. 15, 2010, Rare Elementreleased assays for the first 10 holeswhich included the highest gradesreported so far for the Bear Lodgeproject. In fact, Rare Element hashad to send core to Australia forover-limit assays, that is, materialgrading in excess of 12 per cent forwhich North American labs are notset up. Rare Element expects topublish a preliminary economicassessment (PEA) shortly, whichwill quantify the capital and oper-ating costs associated with deliver-ing a mixed rare-earth-oxide con-centrate. The PEA will be based onan open-pit mine with an opera-tional scale similar to that of
Mountain Pass. The similaritybetween the Mountain Pass andBear Lodge projects in terms ofrare-earth output potential isimportant in so far that the Ameri-can government is serious aboutproviding support for the “restart”of the rare-earth supply chain inthe U.S. “It is my expectation thatonce Rare Element has publishedits PEA in a form that passesmuster, this junior priced at a tenthof the valuation commanded byMolycorp, will attract the attentionof the capital markets, with theresult being a potential doubling ofthe stock price into the $10-$12range.” Although Rare Element hasachieved the short-term targetprice of $6 a share set in the spring,Mr. Kaiser thinks the stock still hasgood upside during the comingmonths after the PEA has beenreleased.
Short takes, pro, con, maybe:Risk Factor: “Our OverallMarket Risk indicator is at a0.294, or ‘very low risk.’ Of
course, I worry anyway. Conserva-tive accounts should have a mini-mum cash position of seven percent. Speculative accounts — mar-gin is OK.”
Deliberations, Box 182, AdelaideSt. Station, Toronto, ON M5C 2J1;416-964-1359; $225 a year.
With the gold price challengingits highs, the mergers and acquisi-tions game among the gold minershas quickly accelerated, says editorIan McAvity, in a report on theworld of gold. In August, KinrossGold Corp. (K-TSX, $19.55) bid a 21per cent premium over the 20-daymoving average for Red Back Min-ing (RBI-TSX, $34.80). If it winsshareholder approvals, RBI holderswill own 37 per cent of the expand-ed Kinross Gold. To put this in per-spective — that’s a $7 billion dealby a $13 billion company. The vol-ume of newly issued shares willtake time to be digested, andexplains the poor performance ofKinross this year. The company hasmade multiple acquisitions, withshares outstanding tripling from
363 million as of Jan. 1, 2007, to 1.1billion with this latest deal. That’s amassive amount of stock issued atdilutive premiums. “I’m notattracted to that kind of transactedgrowth in pursuit of empire sizeand institutional respectability,”says Mr. McAvity. Goldcorp alsomade a rich offer for AndeanResources valued at a 50 per centpremium over the 20-day movingaverage. “Deal Junkie” majors aredriven to gobble up smaller com-panies because they have a grow-ing need to acquire new reserves toreplace those mined and preservea “growth profile.” Mr. McAvitywarns that the constant shareissues for cash and M&A activity atpremium prices has not been kindto shareholders. This trend hasbeen dilutive to predeal sharehold-ers over time. Market VectorsJunior Gold Miners ETF (GDXJ-NYSE, $34.74), an index of morethan 50 second- and third-tierglobal gold miners should outper-form the large-cap weighted Mar-ket Vectors Gold Miners ETF(GDX-NYSE, $56.42) over time —assuming gold prices continue totrend higher. Over the last decade,the senior gold producers havefailed to produce the promisedprofit leverage based on highergold prices. The share prices of themajors have simply not kept pacewith the rise in gold. Juniors arehigher risk and are more volatile,but the reward for shareholders isalso much greater.
Investment Reporter, 133 Rich-mond St. W., Toronto, ON M5H3M8; 416-869-1177; $327 a year.
Continue to buy Reitmans(Canada) (RET.A-TSX, $18.68) forfurther gains and high and risingdividends. Reitmans did well in thefirst half of fiscal 2011. In the sixmonths to July 31, Reitmansearned $56.3 million, or $0.83 ashare. This was up by 69 per centfrom $34.2 million, or $0.49 a share,a year earlier. Sales increased whilecosts fell. Sales for this period roseby 3.3 per cent to $535 million.Same-store sales jumped by 1.6 percent, and the company had 977stores on July 31 — up by six froma year earlier. Cost of goods sold,plus selling, general and adminis-trative costs fell by three per cent.This meant an increase in grossprofit margin by 5.8 per cent. Theretailer’s financial income rose by28.3 per cent due to higher bal-ances of cash and securities. Inter-est costs fell with its debt. Higherearnings are confirmed by a one-third increase in the first-half cashflow to $85 million. This exceededcapital spending of $23.9 millionand dividend payments of $23.4million. Reitmans used extra cashflow to buy back its own shares. Itspent $30.1 million to repurchase1,583,000 shares in the first half.The outlook for Reitmans is mixed.In the second half, it plans to open13 new stores and close only six. Italso plans to remodel 12 stores.Sales in the four weeks to Aug. 28slipped, however, by 2.1 per cent.And same-store sales declined by3.2 per cent. Management expectsweak consumer demand in fiscal2011. Still, employment and retailsales are recovering in Canada,which should help.
Dow Theory Forecasts, 7412Calumet Ave., Hammond, IN46324-2692; 219-931-6480$233 a year.
Now is the time tobuy tech stocks,says this advisoryin a special report
on the sector. Nine of its 33recommended stocks aretechnology companies —the most of any sector.“Our fondness for tech isno accident.”
Compared to other sec-tors, technology companiesoffer a particularly com-pelling combination ofimproved fundamentals,including strong profit-growth prospects andattractive valuations. Manystocks are reasonablypriced, too. At 23 times trail-ing earnings, the averagetech stock trades at a dis-count to its five-year averageprice/earnings ratio of 25.
Based on estimated cur-rent-year earnings, techstocks have rarely beencheaper. The P/E ratiobased on estimated year-ahead earnings is 16, wellbelow the five-year averageof 22. Earnings momentumis another reason to owntech. The average tech com-pany in the S&P 1500 isexpected to deliver 30 percent profit growth on a per-share basis this year, and 22per cent next year.
Nearly 80 per cent oftechnology firms are expect-ed to record higher earningsthis year, while 93 per centare forecast to grow in 2011.For new buying, two espe-cially attractive technologynames include Microsoft(MSFT-NASDAQ, $23) andIBM (IBM-NYSE, $123).
“IBM seems undulycheap given its growth out-look and substantial freecash flow.” The consensusprojects per-share profitgrowth of 13 per cent thisyear and 10 per cent in 2011,and estimates are rising. Theadvisory says the sharesseem capable of reaching$145 over the next year.
Microsoft also has abright outlook despite itsdetractors. The company iseking out a presence in newmarkets including cloudcomputing, or software pro-vided over the Internet ondemand and a new operatingsystem for mobile devices. Italso has an impressive cashposition with $36.79 billionin cash versus $4.94 billion inlong-term debt. Plus, “theshares look cheap from justabout every angle.”
LETTER OF THEWEEKO
n Halloween night 2006, the federal gov-ernment abruptly announced majorchanges for income trusts. Trusts wouldbe subject to new taxes in 2011. Investors
responded by selling swiftly fearing an even greaterdecline when the taxes took effect.
Ironically, as the doomsday of the trust struc-ture approaches, companies are proving theirstaying power and setting the stage for robustinvestment returns. “Dividends are key.”
With the exception of real estate investmenttrusts, virtually all Canadian income trusts haveconverted or declared their intention to do so byJan. 1, 2011.
Roughly half have elected to maintain theirpayouts when they become corporations. Andtrusts that plan to reduce dividends will still offercompetitive distributions.
This advisory’s Income Portfolio includesthree income trusts: Canadian Apartment Prop-erties REIT (CAR.UN-TSX, $15.53), VermilionEnergy Trust (VET.UN-TSX, $31.31) and YellowPages Income Fund (YLO.UN-TSX, $4.79).
Canadian Apartment REIT is exempt from the2011 tax. It is performing well versus cash-strapped U.S. REITs. It yields just less than sevenper cent and is a buy up to US$15.
Vermilion Energy Trust is a buy up to US$35 aunit. It is conservatively run and has held net debtto barely half of annual cash flow.
The trust generates more than two-thirds of itsincome from oil and gas drilling operations inAustralia and Europe, which are exempt from the2011 tax.
Vermilion converted to a corporation in 2009without cutting its monthly dividend. Higher out-put should allow the firm to grow revenue, espe-cially if energy prices increase.
Yellow Pages is a buy up to US$8 for those whodon’t already own it. It will reduce its distributionfrom the current annual rate of $0.80 to $0.65when it converts to a corporation in 2011.
Even with the reduction, the stock will stillhave a yield in the low teens and management’scash-flow estimates suggest that the company willmore than cover these payouts.
A LIFE BEYOND 2010 FOR CANADIAN TRUSTS
Personal Finance, 1750 Old Meadow Rd., McLean, VA 22102; 800-832-2330; $121 a year.
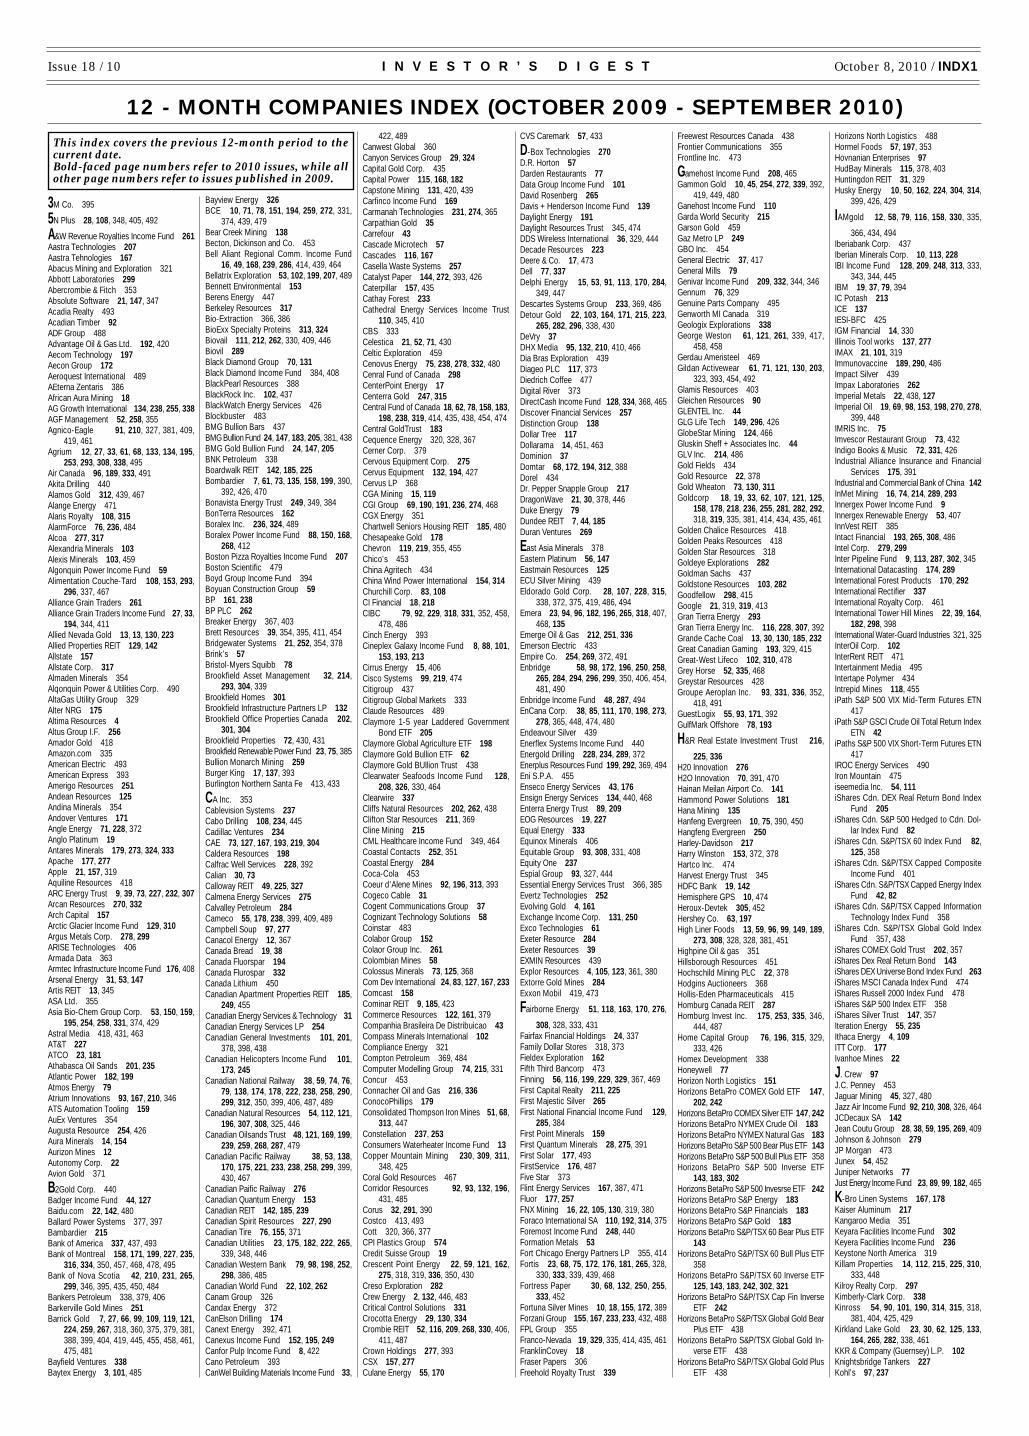
Issue 18 / 10 I N V E S T O R ’ S D I G E S T October 8, 2010 / INDX1
3M Co. 395
5N Plus 28, 108, 348, 405, 492
A&W Revenue Royalties Income Fund 261Aastra Technologies 207Aastra Tehnologies 167Abacus Mining and Exploration 321Abbott Laboratories 299Abercrombie & Fitch 353Absolute Software 21, 147, 347Acadia Realty 493Acadian Timber 92ADF Group 488Advantage Oil & Gas Ltd. 192, 420Aecom Technology 197Aecon Group 172Aeroquest International 489AEterna Zentaris 386African Aura Mining 18AG Growth International 134, 238, 255, 338AGF Management 52, 258, 355Agnico-Eagle 91, 210, 327, 381, 409,
419, 461Agrium 12, 27, 33, 61, 68, 133, 134, 195,
253, 293, 308, 338, 495Air Canada 96, 189, 333, 491Akita Drilling 440Alamos Gold 312, 439, 467Alange Energy 471Alaris Royalty 108, 315AlarmForce 76, 236, 484Alcoa 277, 317Alexandria Minerals 103Alexis Minerals 103, 459Algonquin Power Income Fund 59Alimentation Couche-Tard 108, 153, 293,
296, 337, 467Alliance Grain Traders 261Alliance Grain Traders Income Fund 27, 33,
194, 344, 411Allied Nevada Gold 13, 13, 130, 223Allied Properties REIT 129, 142Allstate 157Allstate Corp. 317Almaden Minerals 354Alqonquin Power & Utilities Corp. 490AltaGas Utility Group 329Alter NRG 175Altima Resources 4Altus Group I.F. 256Amador Gold 418Amazon.com 335American Electric 493American Express 393Amerigo Resources 251Andean Resources 125Andina Minerals 354Andover Ventures 171Angle Energy 71, 228, 372Anglo Platinum 19Antares Minerals 179, 273, 324, 333Apache 177, 277Apple 21, 157, 319Aquiline Resources 418ARC Energy Trust 9, 39, 73, 227, 232, 307Arcan Resources 270, 332Arch Capital 157Arctic Glacier Income Fund 129, 310Argus Metals Corp. 278, 299ARISE Technologies 406Armada Data 363Armtec Infrastructure Income Fund 176, 408Arsenal Energy 31, 53, 147Artis REIT 13, 345ASA Ltd. 355Asia Bio-Chem Group Corp. 53, 150, 159,
195, 254, 258, 331, 374, 429Astral Media 418, 431, 463AT&T 227ATCO 23, 181Athabasca Oil Sands 201, 235Atlantic Power 182, 199Atmos Energy 79Atrium Innovations 93, 167, 210, 346ATS Automation Tooling 159AuEx Ventures 354Augusta Resource 254, 426Aura Minerals 14, 154Aurizon Mines 12Autonomy Corp. 22Avion Gold 371
B2Gold Corp. 440Badger Income Fund 44, 127Baidu.com 22, 142, 480Ballard Power Systems 377, 397Bambardier 215Bank of America 337, 437, 493Bank of Montreal 158, 171, 199, 227, 235,
316, 334, 350, 457, 468, 478, 495Bank of Nova Scotia 42, 210, 231, 265,
299, 346, 395, 435, 450, 484Bankers Petroleum 338, 379, 406Barkerville Gold Mines 251Barrick Gold 7, 27, 66, 99, 109, 119, 121,
224, 259, 267, 318, 360, 375, 379, 381,388, 399, 404, 419, 445, 455, 458, 461,475, 481
Bayfield Ventures 338Baytex Energy 3, 101, 485
Bayview Energy 326BCE 10, 71, 78, 151, 194, 259, 272, 331,
374, 439, 479Bear Creek Mining 138Becton, Dickinson and Co. 453Bell Aliant Regional Comm. Income Fund
16, 49, 168, 239, 286, 414, 439, 464Bellatrix Exploration 53, 102, 199, 207, 489Bennett Environmental 153Berens Energy 447Berkeley Resources 317Bio-Extraction 366, 386BioExx Specialty Proteins 313, 324Biovail 111, 212, 262, 330, 409, 446Biovil 289Black Diamond Group 70, 131Black Diamond Income Fund 384, 408BlackPearl Resources 388BlackRock Inc. 102, 437BlackWatch Energy Services 426Blockbuster 483BMG Bullion Bars 437BMG Bullion Fund 24, 147, 183, 205, 381, 438BMG Gold Bullion Fund 24, 147, 205BNK Petroleum 338Boardwalk REIT 142, 185, 225Bombardier 7, 61, 73, 135, 158, 199, 390,
392, 426, 470Bonavista Energy Trust 249, 349, 384BonTerra Resources 162Boralex Inc. 236, 324, 489Boralex Power Income Fund 88, 150, 168,
268, 412Boston Pizza Royalties Income Fund 207Boston Scientific 479Boyd Group Income Fund 394Boyuan Construction Group 59BP 161, 238BP PLC 262Breaker Energy 367, 403Brett Resources 39, 354, 395, 411, 454Bridgewater Systems 21, 252, 354, 378Brink’s 57Bristol-Myers Squibb 78Brookfield Asset Management 32, 214,
293, 304, 339Brookfield Homes 301Brookfield Infrastructure Partners LP 132Brookfield Office Properties Canada 202,
301, 304Brookfield Properties 72, 430, 431Brookfield Renewable Power Fund 23, 75, 385Bullion Monarch Mining 259Burger King 17, 137, 393Burlington Northern Santa Fe 413, 433
CA Inc. 353Cablevision Systems 237Cabo Drilling 108, 234, 445Cadillac Ventures 234CAE 73, 127, 167, 193, 219, 304Caldera Resources 198Calfrac Well Services 228, 392Calian 30, 73Calloway REIT 49, 225, 327Calmena Energy Services 275Calvalley Petroleum 284Cameco 55, 178, 238, 399, 409, 489Campbell Soup 97, 277Canacol Energy 12, 367Canada Bread 19, 38Canada Fluorspar 194Canada Flurospar 332Canada Lithium 450Canadian Apartment Properties REIT 185,
249, 455Canadian Energy Services & Technology 31Canadian Energy Services LP 254Canadian General Investments 101, 201,
378, 398, 438Canadian Helicopters Income Fund 101,
173, 245Canadian National Railway 38, 59, 74, 76,
79, 138, 174, 178, 222, 238, 258, 290,299, 312, 350, 399, 406, 487, 489
Canadian Natural Resources 54, 112, 121,196, 307, 308, 325, 446
Canadian Oilsands Trust 48, 121, 169, 199,239, 259, 268, 287, 479
Canadian Pacific Railway 38, 53, 138,170, 175, 221, 233, 238, 258, 299, 399,430, 467
Canadian Paific Railway 276Canadian Quantum Energy 153Canadian REIT 142, 185, 239Canadian Spirit Resources 227, 290Canadian Tire 76, 155, 371Canadian Utilities 23, 175, 182, 222, 265,
339, 348, 446Canadian Western Bank 79, 98, 198, 252,
298, 386, 485Canadian World Fund 22, 102, 262Canam Group 326Candax Energy 372CanElson Drilling 174Canext Energy 392, 471Canexus Income Fund 152, 195, 249Canfor Pulp Income Fund 8, 422Cano Petroleum 393CanWel Building Materials Income Fund 33,
422, 489Canwest Global 360Canyon Services Group 29, 324Capital Gold Corp. 435Capital Power 115, 168, 182Capstone Mining 131, 420, 439Carfinco Income Fund 169Carmanah Technologies 231, 274, 365Carpathian Gold 35Carrefour 43Cascade Microtech 57Cascades 116, 167Casella Waste Systems 257Catalyst Paper 144, 272, 393, 426Caterpillar 157, 435Cathay Forest 233Cathedral Energy Services Income Trust
110, 345, 410CBS 333Celestica 21, 52, 71, 430Celtic Exploration 459Cenovus Energy 75, 238, 278, 332, 480Cenral Fund of Canada 298CenterPoint Energy 17Centerra Gold 247, 315Central Fund of Canada 18, 62, 78, 158, 183,
198, 238, 319, 414, 435, 438, 454, 474Central GoldTrust 183Cequence Energy 320, 328, 367Cerner Corp. 379Cervous Equipment Corp. 275Cervus Equipment 132, 194, 427Cervus LP 368CGA Mining 15, 119CGI Group 69, 190, 191, 236, 274, 468CGX Energy 351Chartwell Seniors Housing REIT 185, 480Chesapeake Gold 178Chevron 119, 219, 355, 455Chico’s 453China Agritech 434China Wind Power International 154, 314Churchill Corp. 83, 108CI Financial 18, 218CIBC 79, 92, 229, 318, 331, 352, 458,
478, 486Cinch Energy 393Cineplex Galaxy Income Fund 8, 88, 101,
153, 193, 213Cirrus Energy 15, 406Cisco Systems 99, 219, 474Citigroup 437Citigroup Global Markets 333Claude Resources 489Claymore 1-5 year Laddered Government
Bond ETF 205Claymore Global Agriculture ETF 198Claymore Gold Bullion ETF 62Claymore Gold BUllion Trust 438Clearwater Seafoods Income Fund 128,
208, 326, 330, 464Clearwire 337Cliffs Natural Resources 202, 262, 438Clifton Star Resources 211, 369Cline Mining 215CML Healthcare Income Fund 349, 464Coastal Contacts 252, 351Coastal Energy 284Coca-Cola 453Coeur d’Alene Mines 92, 196, 313, 393Cogeco Cable 31Cogent Communications Group 37Cognizant Technology Solutions 58Coinstar 483Colabor Group 152Colaor Group Inc. 261Colombian Mines 58Colossus Minerals 73, 125, 368Com Dev International 24, 83, 127, 167, 233Comcast 158Cominar REIT 9, 185, 423Commerce Resources 122, 161, 379Companhia Brasileira De Distribuicao 43Compass Minerals International 102Compliance Energy 321Compton Petroleum 369, 484Computer Modelling Group 74, 215, 331Concur 453Connacher Oil and Gas 216, 336ConocoPhillips 179Consolidated Thompson Iron Mines 51, 68,
313, 447Constellation 237, 253Consumers Waterheater Income Fund 13Copper Mountain Mining 230, 309, 311,
348, 425Coral Gold Resources 467Corridor Resources 92, 93, 132, 196,
431, 485Corus 32, 291, 390Costco 413, 493Cott 320, 366, 377CPI Plastics Group 574Credit Suisse Group 19Crescent Point Energy 22, 59, 121, 162,
275, 318, 319, 336, 350, 430Creso Exploration 282Crew Energy 2, 132, 446, 483Critical Control Solutions 331Crocotta Energy 29, 130, 334Crombie REIT 52, 116, 209, 268, 330, 406,
411, 487Crown Holdings 277, 393CSX 157, 277Culane Energy 55, 170
CVS Caremark 57, 433
D-Box Technologies 270D.R. Horton 57Darden Restaurants 77Data Group Income Fund 101David Rosenberg 265Davis + Henderson Income Fund 139Daylight Energy 191Daylight Resources Trust 345, 474DDS Wireless International 36, 329, 444Decade Resources 223Deere & Co. 17, 473Dell 77, 337Delphi Energy 15, 53, 91, 113, 170, 284,
349, 447Descartes Systems Group 233, 369, 486Detour Gold 22, 103, 164, 171, 215, 223,
265, 282, 296, 338, 430DeVry 37DHX Media 95, 132, 210, 410, 466Dia Bras Exploration 439Diageo PLC 117, 373Diedrich Coffee 477Digital River 373DirectCash Income Fund 128, 334, 368, 465Discover Financial Services 257Distinction Group 138Dollar Tree 117Dollarama 14, 451, 463Dominion 37Domtar 68, 172, 194, 312, 388Dorel 434Dr. Pepper Snapple Group 217DragonWave 21, 30, 378, 446Duke Energy 79Dundee REIT 7, 44, 185Duran Ventures 269
East Asia Minerals 378Eastern Platinum 56, 147Eastmain Resources 125ECU Silver Mining 439Eldorado Gold Corp. 28, 107, 228, 315,
338, 372, 375, 419, 486, 494Emera 23, 94, 96, 182, 196, 265, 318, 407,
468, 135Emerge Oil & Gas 212, 251, 336Emerson Electric 433Empire Co. 254, 269, 372, 491Enbridge 58, 98, 172, 196, 250, 258,
265, 284, 294, 296, 299, 350, 406, 454,481, 490
Enbridge Income Fund 48, 287, 494EnCana Corp. 38, 85, 111, 170, 198, 273,
278, 365, 448, 474, 480Endeavour Silver 439Enerflex Systems Income Fund 440Energold Drilling 228, 234, 289, 372Enerplus Resources Fund 199, 292, 369, 494Eni S.P.A. 455Enseco Energy Services 43, 176Ensign Energy Services 134, 440, 468Enterra Energy Trust 89, 209EOG Resources 19, 227Equal Energy 333Equinox Minerals 406Equitable Group 93, 308, 331, 408Equity One 237Espial Group 93, 327, 444Essential Energy Services Trust 366, 385Evertz Technologies 252Evolving Gold 4, 161Exchange Income Corp. 131, 250Exco Technologies 61Exeter Resource 284Exeter Resources 39EXMIN Resources 439Explor Resources 4, 105, 123, 361, 380Extorre Gold Mines 284Exxon Mobil 419, 473
Fairborne Energy 51, 118, 163, 170, 276,
308, 328, 333, 431Fairfax Financial Holdings 24, 337Family Dollar Stores 318, 373Fieldex Exploration 162Fifth Third Bancorp 473Finning 56, 116, 199, 229, 329, 367, 469First Capital Realty 211, 225First Majestic Silver 265First National Financial Income Fund 129,
285, 384First Point Minerals 159First Quantum Minerals 28, 275, 391First Solar 177, 493FirstService 176, 487Five Star 373Flint Energy Services 167, 387, 471Fluor 177, 257FNX Mining 16, 22, 105, 130, 319, 380Foraco International SA 110, 192, 314, 375Foremost Income Fund 248, 440Formation Metals 53Fort Chicago Energy Partners LP 355, 414Fortis 23, 68, 75, 172, 176, 181, 265, 328,
330, 333, 339, 439, 468Fortress Paper 30, 68, 132, 250, 255,
333, 452Fortuna Silver Mines 10, 18, 155, 172, 389Forzani Group 155, 167, 233, 233, 432, 488FPL Group 355Franco-Nevada 19, 329, 335, 414, 435, 461FranklinCovey 18Fraser Papers 306Freehold Royalty Trust 339
Freewest Resources Canada 438Frontier Communications 355Frontline Inc. 473
Gamehost Income Fund 208, 465Gammon Gold 10, 45, 254, 272, 339, 392,
419, 449, 480Ganehost Income Fund 110Garda World Security 215Garson Gold 459Gaz Metro LP 249GBO Inc. 454General Electric 37, 417General Mills 79Genivar Income Fund 209, 332, 344, 346Gennum 76, 329Genuine Parts Company 495Genworth MI Canada 319Geologix Explorations 338George Weston 61, 121, 261, 339, 417,
458, 458Gerdau Ameristeel 469Gildan Activewear 61, 71, 121, 130, 203,
323, 393, 454, 492Glamis Resources 403Gleichen Resources 90GLENTEL Inc. 44GLG Life Tech 149, 296, 426GlobeStar Mining 124, 466Gluskin Sheff + Associates Inc. 44GLV Inc. 214, 486Gold Fields 434Gold Resource 22, 378Gold Wheaton 73, 130, 311Goldcorp 18, 19, 33, 62, 107, 121, 125,
158, 178, 218, 236, 255, 281, 282, 292,318, 319, 335, 381, 414, 434, 435, 461
Golden Chalice Resources 418Golden Peaks Resources 418Golden Star Resources 318Goldeye Explorations 282Goldman Sachs 437Goldstone Resources 103, 282Goodfellow 298, 415Google 21, 319, 319, 413Gran Tierra Energy 293Gran Tierra Energy Inc. 116, 228, 307, 392Grande Cache Coal 13, 30, 130, 185, 232Great Canadian Gaming 193, 329, 415Great-West Lifeco 102, 310, 478Grey Horse 52, 335, 468Greystar Resources 428Groupe Aeroplan Inc. 93, 331, 336, 352,
418, 491GuestLogix 55, 93, 171, 392GulfMark Offshore 78, 193
H&R Real Estate Investment Trust 216,
225, 336H20 Innovation 276H2O Innovation 70, 391, 470Hainan Meilan Airport Co. 141Hammond Power Solutions 181Hana Mining 135Hanfeng Evergreen 10, 75, 390, 450Hangfeng Evergreen 250Harley-Davidson 217Harry Winston 153, 372, 378Hartco Inc. 474Harvest Energy Trust 345HDFC Bank 19, 142Hemisphere GPS 10, 474Heroux-Devtek 305, 452Hershey Co. 63, 197High Liner Foods 13, 59, 96, 99, 149, 189,
273, 308, 328, 328, 381, 451Highpine Oil & gas 351Hillsborough Resources 451Hochschild Mining PLC 22, 378Hodgins Auctioneers 368Hollis-Eden Pharmaceuticals 415Homburg Canada REIT 287Homburg Invest Inc. 175, 253, 335, 346,
444, 487Home Capital Group 76, 196, 315, 329,
333, 426Homex Development 338Honeywell 77Horizon North Logistics 151Horizons BetaPro COMEX Gold ETF 147,
202, 242Horizons BetaPro COMEX Silver ETF 147, 242Horizons BetaPro NYMEX Crude Oil 183Horizons BetaPro NYMEX Natural Gas 183Horizons BetaPro S&P 500 Bear Plus ETF 143Horizons BetaPro S&P 500 Bull Plus ETF 358Horizons BetaPro S&P 500 Inverse ETF
143, 183, 302Horizons BetaPro S&P 500 Invesrse ETF 242Horizons BetaPro S&P Energy 183Horizons BetaPro S&P Financials 183Horizons BetaPro S&P Gold 183Horizons BetaPro S&P/TSX 60 Bear Plus ETF
143Horizons BetaPro S&P/TSX 60 Bull Plus ETF
358Horizons BetaPro S&P/TSX 60 Inverse ETF
125, 143, 183, 242, 302, 321Horizons BetaPro S&P/TSX Cap Fin Inverse
ETF 242Horizons BetaPro S&P/TSX Global Gold Bear
Plus ETF 438Horizons BetaPro S&P/TSX Global Gold In-
verse ETF 438Horizons BetaPro S&P/TSX Global Gold Plus
ETF 438
Horizons North Logistics 488Hormel Foods 57, 197, 353Hovnanian Enterprises 97HudBay Minerals 115, 378, 403Huntingdon REIT 31, 329Husky Energy 10, 50, 162, 224, 304, 314,
399, 426, 429
IAMgold 12, 58, 79, 116, 158, 330, 335,
366, 434, 494Iberiabank Corp. 437Iberian Minerals Corp. 10, 113, 228IBI Income Fund 128, 209, 248, 313, 333,
343, 344, 445IBM 19, 37, 79, 394IC Potash 213ICE 137IESI-BFC 425IGM Financial 14, 330Illinois Tool works 137, 277IMAX 21, 101, 319Immunovaccine 189, 290, 486Impact Silver 439Impax Laboratories 262Imperial Metals 22, 438, 127Imperial Oil 19, 69, 98, 153, 198, 270, 278,
399, 448IMRIS Inc. 75Imvescor Restaurant Group 73, 432Indigo Books & Music 72, 331, 426Industrial Alliance Insurance and Financial
Services 175, 391Industrial and Commercial Bank of China 142InMet Mining 16, 74, 214, 289, 293Innergex Power Income Fund 9Innergex Renewable Energy 53, 407InnVest REIT 385Intact Financial 193, 265, 308, 486Intel Corp. 279, 299Inter Pipeline Fund 9, 113, 287, 302, 345International Datacasting 174, 289International Forest Products 170, 292International Rectifier 337International Royalty Corp. 461International Tower Hill Mines 22, 39, 164,
182, 298, 398International Water-Guard Industries 321, 325InterOil Corp. 102InterRent REIT 471Intertainment Media 495Intertape Polymer 434Intrepid Mines 118, 455iPath S&P 500 VIX Mid-Term Futures ETN
417iPath S&P GSCI Crude Oil Total Return Index
ETN 42iPaths S&P 500 VIX Short-Term Futures ETN
417IROC Energy Services 490Iron Mountain 475iseemedia Inc. 54, 111iShares Cdn. DEX Real Return Bond Index
Fund 205iShares Cdn. S&P 500 Hedged to Cdn. Dol-
lar Index Fund 82iShares Cdn. S&P/TSX 60 Index Fund 82,
125, 358iShares Cdn. S&P/TSX Capped Composite
Income Fund 401iShares Cdn. S&P/TSX Capped Energy Index
Fund 42, 82iShares Cdn. S&P/TSX Capped Information
Technology Index Fund 358iShares Cdn. S&P/TSX Global Gold Index
Fund 357, 438iShares COMEX Gold Trust 202, 357iShares Dex Real Return Bond 143iShares DEX Universe Bond Index Fund 263iShares MSCI Canada Index Fund 474iShares Russell 2000 Index Fund 478iShares S&P 500 Index ETF 358iShares Silver Trust 147, 357Iteration Energy 55, 235Ithaca Energy 4, 109ITT Corp. 177Ivanhoe Mines 22
J. Crew 97J.C. Penney 453Jaguar Mining 45, 327, 480Jazz Air Income Fund 92, 210, 308, 326, 464JCDecaux SA 142Jean Coutu Group 28, 38, 59, 195, 269, 409Johnson & Johnson 279JP Morgan 473Junex 54, 452Juniper Networks 77Just Energy Income Fund 23, 89, 99, 182, 465
K-Bro Linen Systems 167, 178Kaiser Aluminum 217Kangaroo Media 351Keyara Facilities Income Fund 302Keyera Facilities Income Fund 236Keystone North America 319Killam Properties 14, 112, 215, 225, 310,
333, 448Kilroy Realty Corp. 297Kimberly-Clark Corp. 338Kinross 54, 90, 101, 190, 314, 315, 318,
381, 404, 425, 429Kirkland Lake Gold 23, 30, 62, 125, 133,
164, 265, 282, 338, 461KKR & Company (Guernsey) L.P. 102Knightsbridge Tankers 227Kohl’s 97, 237
12 - MONTH COMPANIES INDEX (OCTOBER 2009 - SEPTEMBER 2010)
This index covers the previous 12-month period to thecurrent date.Bold-faced page numbers refer to 2010 issues, while all other page numbers refer to issues published in 2009.

INDX2 / October 8, 2010 I N V E S T O R ’ S D I G E S T Issue 18 / 10
Kraft Foods 63, 119, 197, 317KWG Resources 202, 262
La Mancha Resources 328Labrador Iron Mines Holdings 56, 294Labrador Iron Ore Royalty Income Fund 83,
151, 451Lake Shore Gold 4, 22, 62, 105, 123, 164, 265,
281, 282, 319, 338, 350, 361, 378, 418Lam Research 137Laurentian Bank 391Le Chateau Inc. 261Legacy Oil Plus Gas 22, 152, 233Lennar 137Leon’s Furniture 119, 247, 265Lexam Exploration 282Lihir Gold 434Limited Brands 413Linamar Corp. 203Linear Technology 413Liquidation World 278Liquor Stores Income Fund 326, 410Loblaw Co. 19, 75, 95, 121, 193, 238, 261,
293, 298, 377, 417, 427, 457Logan International 135Logibec Groupe Informatique 22, 93, 196,
207, 412, 463, 484LoJack 353Lowe’s 197, 333Lululemon Athletica 121, 203, 262, 371Lundin Mining 57, 271
Macy’s 317Madalena Ventures 334Magellan Aerospace 351, 466Magindustries Corp. 72, 294Magma Energy 30Magna International 22, 36, 71, 203, 369,
418, 475, 494Mainstreet Equity 191Major Drilling Group 228, 272, 370, 432, 484Manitoba Telecom Services 68, 127Mantra Resources 108, 487Manulife Financial 24, 25, 33, 167, 189,
218, 291, 319, 323, 355Maple Leaf Foods 176, 258, 304, 390,
399, 449Market Vector Gold Miners ETF 139Market Vector Junior Gold Miners ETF 139Market Vectors Agribusiness ETF 198Market Vectors Gold Miners ETF 279Market Vectors Gold Mining ETF 198Marsulex 114, 175, 313, 388, 449Martin Murenbeeld 265Martinrea International 203Marvell Technology Group 217Matrikon Inc. 15, 33, 254, 326, 449MBAC Fertilizer 14, 130McAfee 19McDonald Mines Exploration 202McKesson Corp. 475McVicar Industries 98MDC Partners 150MedAssets 379Mediagrif Interactive Technologies 313, 352Medicago 11, 114, 156Medical Facilities Corp. 49, 155, 344Medusa Mining 99, 102Melkior Resources 361, 418Mentor Graphics 97Mercator Minerals 33, 147, 233, 343,
349, 466Metalex Ventures 198Metals Creek Resources 223, 418Metanor Resources 407Methanex 12Metro 191, 232, 261, 318, 332, 350, 417, 451Micron Technology 262Microsoft 318, 334, 381, 433Midnight Oil Exploration 133, 214, 250Midway Energy Ltd. 102, 316, 429Migao 98, 113, 144, 187, 210Minefinders 430Mirabela Nickel 363Miranda Technologies 449Mirant Corp. 198Moneta Porcupine 123, 361Monsanto 217
Monterey Exploration 69, 130, 196, 256, 412Morningstar 101Mosaic Co. 297, 338Mosaid Technologies 32, 147, 250, 272,
336, 349, 466Motorola 373Mountain Boy Minerals 223MPH Ventures 440MTY Food Group 370, 432Mullen Group 35, 176Multiplied Media 173
NAL Oil & Gas Trust 134, 423National Bank 18, 42, 216, 303, 312, 332,
346, 348, 391, 439, 492National Oilwell Varco 119NCR 483Nebu Resources 361, 440Neo Material Technologies 72, 134, 258,
336, 352Nestle 63, 318Nevada Geothermal Power 10, 387New Flyer Industries 88, 135, 168, 248, 326New Gold 29, 112, 223, 318, 339, 432New Millennium Capital 167Newalta Inc. 259, 292, 333, 440Newcastle Minerals 105Newcrest Mining 19, 399, 414Newfoundland Capital Corp. 114, 471Newmont Mining 58, 79, 109, 118, 119,
158, 198, 214, 218, 259, 299, 316, 318,335, 425, 455, 475, 494
Nexen 92, 121, 192, 296, 491Nike 77, 493Niko Resources 32, 245, 274, 285, 386Niogold Mining 103Norbord 290Noront Resources 202, 230, 438, 450Norsat International 278, 374North American Energy Partners 256North West Co. 122Northern Dynasty Minerals 22Northern Property REIT 142, 263Northgate Minerals 389Northland Power Income Fund 245, 414Northrop Grumman 352Northstar Aerospace 55, 152NovaGold Resources 78Novartis 279Novo Nordisk 358Novus Energy 15, 95, 333Nuloch Resources 174NuVista Energy 136
O’Leary Advantaged Tactical Global Corpo-
rate Bond Fund 205O’Leary Global Income Opportunities Fund
205Occidental Petroleum 318OceanaGold 58Oceaneering International 119Olivut Resources 239ON Semiconductor 333Onex Corp. 173, 386, 484Onyx Pharmaceuticals 320Open Table 117Open Text Corp. 83, 335, 488Openwave Systems 319Oracle 257, 358, 435Orbit Garant Drilling 73, 94, 369, 391,
470, 484Orezone Gold 276Orleans Energy 56, 459Orvana Minerals 118, 455Osisko Mining 11, 22, 219, 250, 273, 282,
318, 320, 330, 338, 357, 386, 391Otis Gold 415
Pacific Rubiales Energy 7Painted Pony Petroleum 336, 347, 466Paladin Energy 341Paladin Labs 253, 333Palliser Oil & Gas 123, 255Palm 359Pan Orient Energy 207, 350Pan-American Silver 329, 418, 419Pantera Drilling Income Trust 348Paramount Energy Trust 48, 115, 169, 199
Parex Resources 114, 230, 438Parkland Income Fund 8, 112, 208, 248,
326, 330Pason Systems 327, 440Patheon 14Patterson-UTI Energy 297Paychex 337PC Gold 23, 103, 164, 203, 223, 265, 414PDM Royalties Income Fund 390Pediment Gold 39Peer 1 Network 93, 388Peer 1 Networks 210Pembina Pipeline Income Fund 423Pengrowth Energy Trust 287, 444Penn West Energy Trust 101, 162, 312,
327, 327, 444Peregrine Diamonds Ltd. 59, 318, 375Pethealth 113, 368PetroBakken Energy 16, 22, 102, 162,
319, 412Petrobank Energy Resources 162, 319, 320Petrodorado Energy 156Petroflow Energy 406Petrolifera Petroleum 236Petrominerales 34, 147, 319PetSmart 57Peyto Energy Trust 327PFB Corp. 119, 415Phoenix Technology Income Fund 249, 422Pierre Lassonde 265Plazacorp Retail Properties 147, 213, 329,
352, 466PNI Digital Media 15, 93, 192Polo Ralph Lauren 413Potash Corp. 39, 54, 79, 113, 130, 138,
170, 192, 214, 295, 298, 330, 338, 358,394, 399, 409, 426, 480
Potash Corp. of Saskatchewan 238, 312Power Corp. of Canada 15, 167, 218, 279,
328, 381Power Financial 167, 291PowerShares Double Short Oil ETF 401PowerShares S&P 500 BuyWrite Portfolio
357Powertech Uranium 411Precision Drilling 89, 172, 290, 384, 430,
431, 440Premier Gold Mines 23, 103, 105, 125, 164,
203, 223, 265, 282, 285, 440Premium Brands Holdings 35, 154, 329Prism Medical 334Procter & Gamble Co. 297, 353Progress Energy Resources 52, 403, 428ProShares Short U.S. Financials ETF 242Pulse Seismic 469Pure Industrial REIT 346, 432Pure Technologies 28, 156, 268, 295, 409
Quadra FNX Mining 253Quadra Mining 105, 110, 136Quantum Rare Earth Developments 162Quebecor Inc. 70, 135, 187Quebecor World 331Queenston Mining 126, 164, 265, 282, 318,
338, 461Quest Uranium 138Questerre Energy 95
Radian Communications 335Radiant Communications 53, 152, 230,
410, 472Rainy River Resources 23, 53, 338Ram Power 74, 156, 268, 472Randgold Resources 319, 434Rare Earth Metals 19Rare Element Resources 79, 198RBC Financial Group 113, 313, 472Realex Properties 253Realm Energy International Corp. 435Red Back Mining 45, 174, 223, 234, 272,
292, 419, 431, 480Redknee Solutions 21, 96, 292, 333, 472Reitmans 261, 375, 381Reliable Energy 229RELM Wireless 494Renegade Petroleum 134, 243Research In Motion 7, 14, 21, 34, 83, 111,
121, 139, 149, 154, 158, 218, 228, 262,
274, 310, 319, 323, 358, 360, 389, 393,404, 449
Richelieu Hardware 121, 278, 415Richmont Mines 53, 170, 418, 454Rio Tinto 117RioCan REIT 59, 169, 185, 279, 299, 355Ritchie Bros. Auctioneers 18, 51, 190, 308,
354, 454Rite Aid 17, 137, 257, 393Rock Energy 388, 407Rocky Mountain Dealerships 92, 192Rogers Comm. 7, 52, 91, 170, 174, 199,
265, 279, 311, 328, 428, 488RONA 52, 207, 216, 346, 429Roxmark Mines 440Roya Coal 325Royal Bank 142, 204, 210, 212, 221, 227,
303, 351, 469, 478Royal Gold 435Royale Energy 474Rubicon Minerals 22, 62, 103, 125, 164, 182,
212, 265, 318, 338, 359, 440, 452, 461RuggedCom Inc. 21, 35, 346, 378
Sabina Gold & Silver 110, 234Salary.com 77Salesforce.com 335San Gold 4, 23, 62, 65, 223, 265, 338, 359,
398, 438, 461Sandvine 35, 147, 372Saputo 261, 271, 334, 417, 448Savanna Energy Services 16, 326, 440, 444Scana 257Schlumberger 474Scotiabank 134, 221, 255Scott’s REIT 89Sea Dragon Energy 135, 407Seacliff Construction 127Sealed Air 37Sears Canada 262Seaview Energy 10, 323, 389Second Wave Petroleum 10, 190, 255, 387Selwyn Resources 186Semafo 12, 130, 223, 250, 272Semtech 337, 453Serge Energy 276SFK Pulp Income Fund 187, 491Shaw Comm. 51, 75, 147, 174, 265, 270,
418, 428, 431ShawCor 21, 204, 232, 381, 440Sherritt International 427Shoppers Drug Mart 74, 96, 152, 163, 196,
268, 274, 318, 335, 410, 417, 469Sierra Wireless 21, 72, 193, 309Silver Shield Resources 418Silver Standard Resources 193, 235, 333,
354, 395, 405Silver Wheaton 19, 108, 298, 395Silvercorp 354, 415Silvercrest Mines 371Sina Corp. 23, 142Sino-Forest 7, 298, 386, 470Skyline Gold 105Slam Exploration 255Smithfield Foods 117SNC-Lavalin 32, 83, 147, 153, 213, 291, 332Sonde Resources 284SPDR Consumer Discretionary Select Sector
ETF 358, 478SPDR Gold Trust ETF 147, 202, 218SPDR Gold Trust Gold Shares 438SPDR Technology Select Sector ETF 358SPDR Utilities Select Sector ETF 202Spectra Energy’s 227Spider Resources 262Sprott Gold Bullion Fund 183, 438Spyder Resources 202St. Andrew Goldfields 223, 318Stanley Black & Decker 217Stans Energy Corp. 247Stantec Inc. 96, 112, 325, 444, 470Star Hedge Managers Corp. 319Starbucks 37, 297, 453Starwood Hotels 177STEC 320Stella Jones 11, 94, 139, 216, 221, 350Stifel Financial 437
Storm Exploration 114, 227, 228, 333Stornoway Diamond 483Strateco Resources Inc. 483StrikePoint Gold 65Student Transportation of America 390Sun Life Financial 167, 326, 355Sun-Rype Products 196Suncor 7, 12, 56, 151, 173, 259, 335Suncor Energy 296SunOpta 330Swift Energy 237SXC Health Solutions 21, 321, 378Synaptics 23
Taiwan Semiconductor 335Talisman Energy 28, 92, 102, 194, 210, 224,
227, 267, 399, 406Tamarack Valley Energy 232Tantec Inc. 292Target 197, 333Taseko Mines 28, 213, 293, 343, 405,
425, 471Tasman Metals 118TD Ameritrade Holding 437TD Bank 115, 192, 212, 214, 227, 238, 258,
395, 409, 430, 435Teck Resources 22, 32, 111, 154, 155, 156,
295, 319, 335, 386, 399Tekmira Pharmaceuticals Corp. 35Telus Corp. 36, 90, 133, 153, 167, 210,
268, 411Tembec 155Temex Resources 281, 361, 418Temple-Inland 353TeraGo Networks 451Terra Energy 151Tethys Petroleum 484Teva Pharmaceuticals 479Texas Roadhouse 297Theragenics Corp. 218Theratechnologies 211Third Canadian General Investment Trust
102, 378Thompson Creek Metals 109, 370, 451Thomson Reuters 7, 91, 114, 193, 265, 271,
309, 443, 470Thor Industries 97, 433Tiffany & Co. 237, 393Tim Hortons 285, 331, 335, 386, 418,
448, 450TimberWest Foreest Corp. 286TimberWest Forest Corp. 9, 128, 422, 450Time Warner 197Timminco 397Timmins Gold 216TIO Networks 52, 268, 471TMX Group 271Toll Brothers 77Tootsie Roll Industries 63Toromont Industries 204, 428, 440, 450Torstar 254, 495Toshiba 335TransAlta 23, 28, 115, 232, 408Transat A.T. 61, 94, 285TransCanada Corp. 7, 24, 42, 91, 134, 199,
265, 270, 296, 304, 323, 339, 412, 443Transcontinental 14, 167, 395TransForce Inc. 195, 231TransGaming 68, 447TransGlobe Energy 155Transition Therapeutics 368Transocean 119Tranzeo Wireless Technologies 215Trelawney Mining and Exploration 190Triangle Petroleum 369Trican Well Services 34, 211, 440Trilogy Energy Trust 9, 214, 333Trinidad Drilling 28, 66, 107, 115, 408,
440, 466TriOil Resources Ltd. 203Triple-S Management 317TriStar Oil & Gas 319, 320Trivello Energy 162TSO3 13, 130, 411Twin Butte Energy Ltd. 1, 31, 391
U.S. Gold Corp. 282Ucore Uranium Corp. 475
UEX Corp. 96, 469Ultra Lithium 162Unbridled Energy 4Underworld Resources 101, 103Unigold 124United Corporations 398United Parcel Service 57, 433United Technologies Corp. 178, 373Ur-Energy 444Uranium Energy 257Uranium One 262, 271
Valeant Pharmaceuticals International 262Valley High Ventures 91, 210ValueClick 359Vault Minerals 125Ventana Gold 284, 398, 418, 461Verizon Communications 183, 227Vermilion Energy Trust 39, 59, 385, 455Vero Energy 56, 135, 170VG Gold 62, 223, 282, 398Victoria Gold 252, 351, 399, 425Vicwest Income Fund 31Virginia Mines 62, 164, 219, 265, 282, 461Visa 334Visible Gold Mines 203Viterra 52, 68, 115, 173, 179, 256, 275, 276,
386, 389, 452Volta Resources 108, 492Vulcan Minerals Inc. 347
Wabash National 118Wajax Income Fund 88, 101, 285, 302Wal-Mart 43, 65, 119, 157, 473Wallbridge Mining 294Walt Disney 374WaterFurnace International 98WaterFurnace Renewable Energy 118, 136,
178, 265, 317Weatherford International 19WebTech Wireless 150, 310, 426Wesdome Gold Mines 164, 191, 265, 282,
338, 461West 49 175, 256, 372, 491West Energy 370West Fraser Timber 231West Timmins Mining 319, 338, 361Westar Energy 79Western Coal 32, 167, 390Western Energy Services 136Western Financial 18, 330, 368, 484WesternOne Equity Income Fund 208WestFire Energy 52, 81, 136, 250WestJet Airlines 234, 333, 406Westport Innovations 90, 230, 273, 372Westshore Terminals Income Fund 83Weststar Resources 161Wet Seal 17Weyerhaeuser 333WGI Heavy Minerals 218White Tiger Mining 18Whiterock REIT 465Wi-LAN Inc. 316, 367Wild Stream Exploration 133, 150, 470Willis Group 177Winpak Ltd. 94, 231, 251, 273Winstar Resources 471Wireless Matrix 488World Fuel Services 59
Xcel Energy 79Xcite Energy 273Xtreme Coil Drilling Corp. 70
Yamana Gold 96, 144, 173, 311, 381, 404,
443, 481, 491Yellow Pages Income Fund 39, 68, 167,
207, 355, 408, 448, 455Yoho Resources 108, 228, 235, 346, 492Yorbeau Resources 103YUM! Brands 373
Zapata Energy 149Zargon Energy Trust 59Zarlink Semiconductor 59, 63ZCL Composites 34Zimtu Capital 161Zungui Haixi Corp. 119, 463
Issue Date PagesOct. 9, 2009 357-376Oct. 23, 2009 377-396Nov. 6, 2009 397-416Nov. 27, 2009 417-436Dec. 11, 2009 437-456Dec. 24, 2009 457-476Dec. 31, 2009 477-496Jan. 29, 2010 1-20Feb. 12, 2010 21-40Feb. 24, 2010 41-60March 12, 2010 61-80March 26, 2010 81-100
Use the Investor’s Digest index and adviceforinvestors.comto discover Canada’s best investment advice in 3 easy steps
The Investor’s Digest index is a vital resourcefor readers who want to track advice on
companies from past issues.For serious investors, nothing could be
better than a vast research library filled with backissues of Investor’s Digest. Especially when it takesup no storage space at all.
That’s exactly what subscribers to Investor’sDigest of Canada and adviceforinvestors.com get.Back issues of the Digest are on our website,adviceforinvestors.com.
Using the Investor’s Digest index, you canquickly put your finger on advice andinformation on a company you’re following,whether it appeared in a brokerage report, article,column or in “What the Market Letters Say.”
Here’s what you do:1. Select the company you want from the
index. Beside each company name arethe page numbers of the articles inwhich the company has beendiscussed in Investor’s Digest.
2. Match the page numbers with specificissues using the guide (right). Forexample, a key article on Caterpillarran on page 450 – the guide lets youknow this is the August 3 issue.
3. Go to adviceforinvestors.com, click onthe section titled “Publications” anddownload all the issues you need. It’sthat easy.
If you don’t currently subscribe toadviceforinvestors.com, simply go towww.adviceforinvestors.com to learn more aboutthe website. Once there, you can easily select asubscription plan that’s right for you.
YOUR GUIDE TO PAGE NUMBERS
Use the chart above to match a page number with a specific issue of Investor’sDigest. Then go to adviceforinvestors.com and download the issue. It’s that simple.
Issue Date PagesApril 9, 2010 101-120April 23, 2010 121-140May 14, 2010 141-160May 28, 2010 161-180June 11, 2010 181-200June 25, 2010 201-220July 9, 2010 221-240July 23, 2010 241-260Aug. 13, 2010 261-280Aug. 27, 2010 281-300Sept. 10, 2010 301-320Sept. 24, 2010 321-340