volunteer scotland volunteering-in-scotland-a-changing-landscape-november-2014
TRANSCRIPT
Volunteering trends in Scotland: a changing landscape? High level summary of survey evidence
November 2014
Kathleen Doyle and Gemma Jackson
Volunteer Scotland, Policy and Research
[email protected] [email protected]
www.volunteerscotland.org.uk @VolScot
• Volunteering is a critical part of realising Scotland’s economic and social prosperity; transforming people and places, and contributing to healthy and vibrant communities that are good to live in.
• Volunteering needs to be adequately resourced and supported to increase participation; enabling more people and communities to reap the many benefits of volunteering
• The context in which volunteering operates is changing rapidly:
Economic – low or negative growth and public sector cuts – means organisations (public and third sector) and citizens are being asked to do more with less
Policy – reform of public services and increasing demand for volunteers to be involved in the delivery of public services
Legislative – proposed Community Empowerment Bill to encourage local people to do things for themselves, in part by transferring ownership of public-sector assets to volunteer –led groups.
• The economic, policy and legislative changes assume that citizens can do more by volunteering their time; but is this a sound assumption?
WHY IS THIS REPORT IMPORTANT?
KEY FINDINGS...
Since 2010, overall levels of volunteering have been declining, but the numbers of regular volunteers are promising...
How can we reverse this trend
so that many more enjoy the benefits of volunteering?
Where can growth come
from?
KEY FINDINGS...
The majority of people (72%) are not volunteering, but some do have past experience to build on...
Are there opportunities of
interest to potential
volunteers?
Is the current
volunteering approach working?
What would a new way for
volunteer involvement
look like?
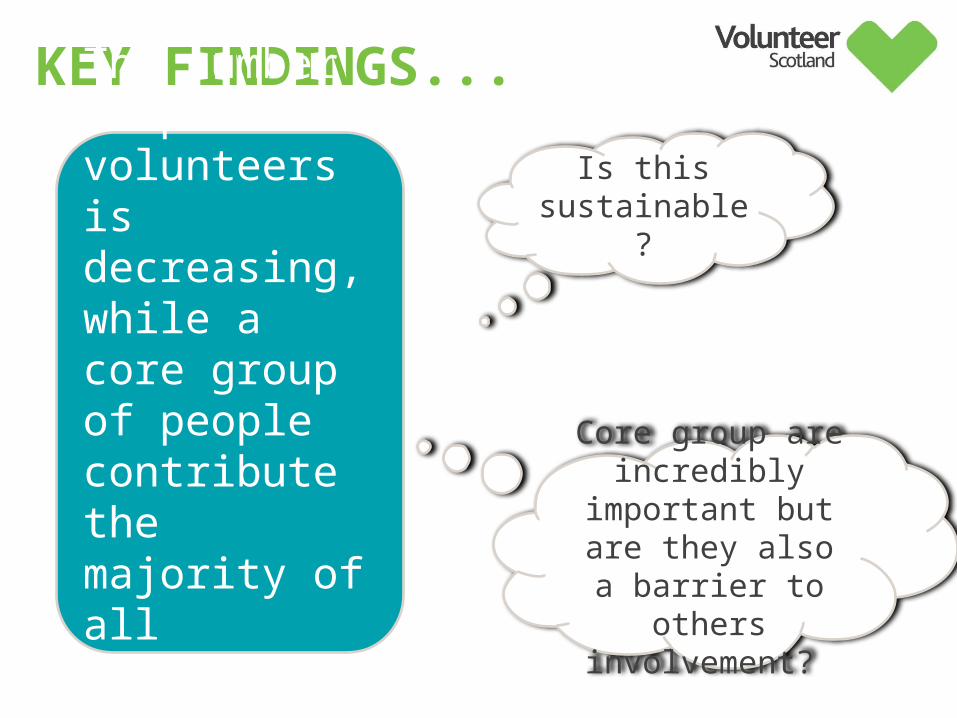
KEY FINDINGS...
The number of past volunteers is decreasing, while a core group of people contribute the majority of all volunteer hours
Core group are incredibly important but are they also a
barrier to others involvement?
Is this sustainable?
PARTICIPATION IN FORMAL VOLUNTEERING IS DECLINING
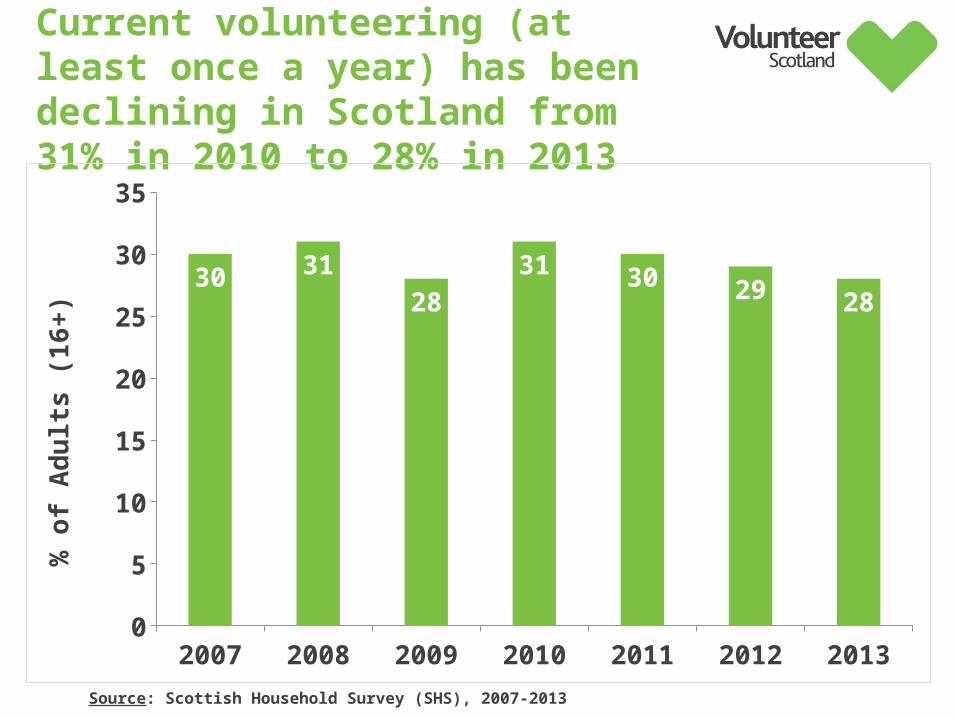
Current volunteering (at least once a year) has been declining in Scotland from 31% in 2010 to 28% in 2013
Source: Scottish Household Survey (SHS), 2007-2013
2007 2008 2009 2010 2011 2012 20130
5
10
15
20
25
30
35
30 31
28
31 30 29 28
% o
f A
du
lts
(1
6+
)
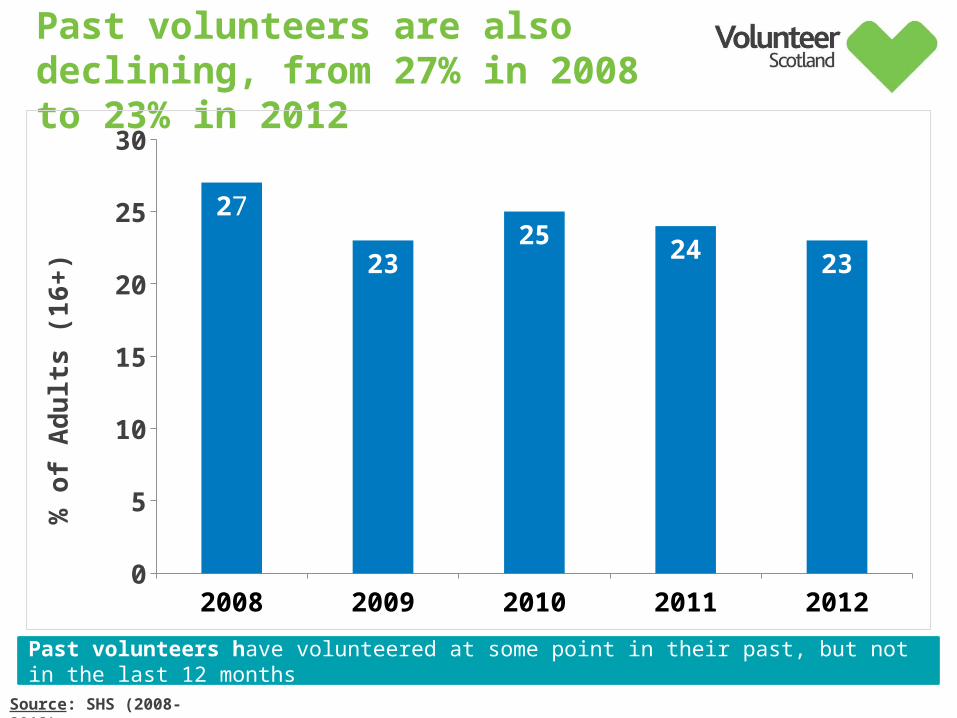
Past volunteers are also declining, from 27% in 2008 to 23% in 2012
Source: SHS (2008-2012)
2008 2009 2010 2011 20120
5
10
15
20
25
30
27
2325 24
23
% o
f A
du
lts
(1
6+
)
Past volunteers have volunteered at some point in their past, but not in the last 12 months
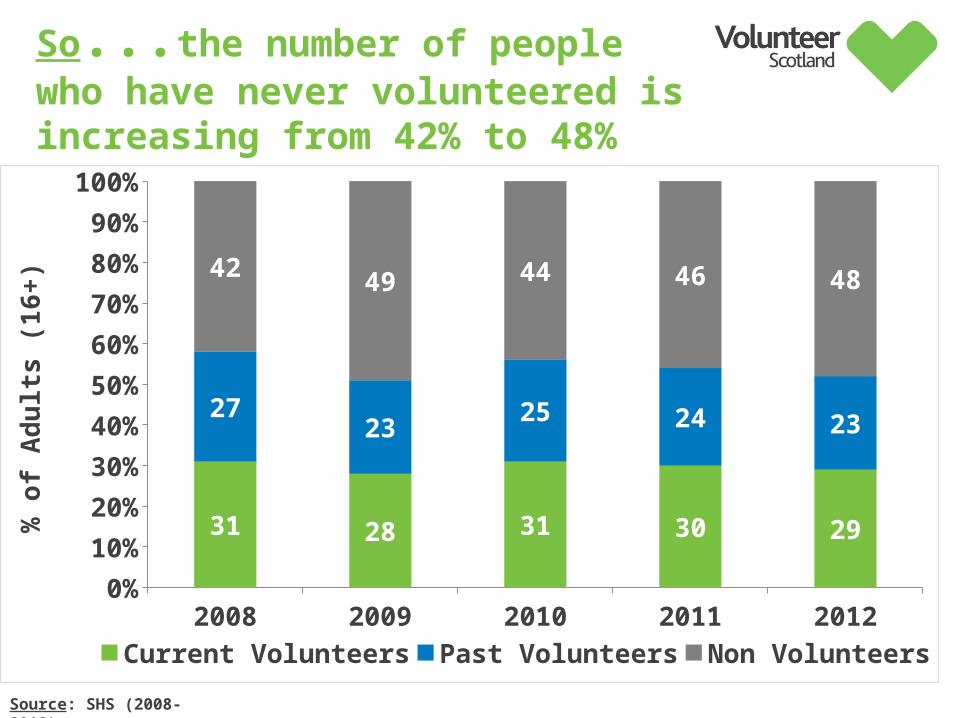
So...the number of people who have never volunteered is increasing from 42% to 48%
Source: SHS (2008-2012)
2008 2009 2010 2011 20120%
10%
20%
30%
40%
50%
60%
70%
80%
90%
100%
31 28 31 30 29
2723
25 24 23
42 49 44 46 48
Current Volunteers Past Volunteers Non Volunteers
% o
f A
du
lts
(1
6+
)
Volunteer participation is in decline...despite 19% of the population in 2011 expressing an interest in starting or re-starting volunteering in the future...why didn’t this intention turn into action?
Source: SHS (2008-2012); Volunteering in Scotland Survey (2013)
BUT THAT’S NOT WHERE THE STORY ENDS...LET’S DIG A BIT
DEEPER
Source: SHS (2007-2012) – Volunteer Scotland (VS) Secondary Analysis
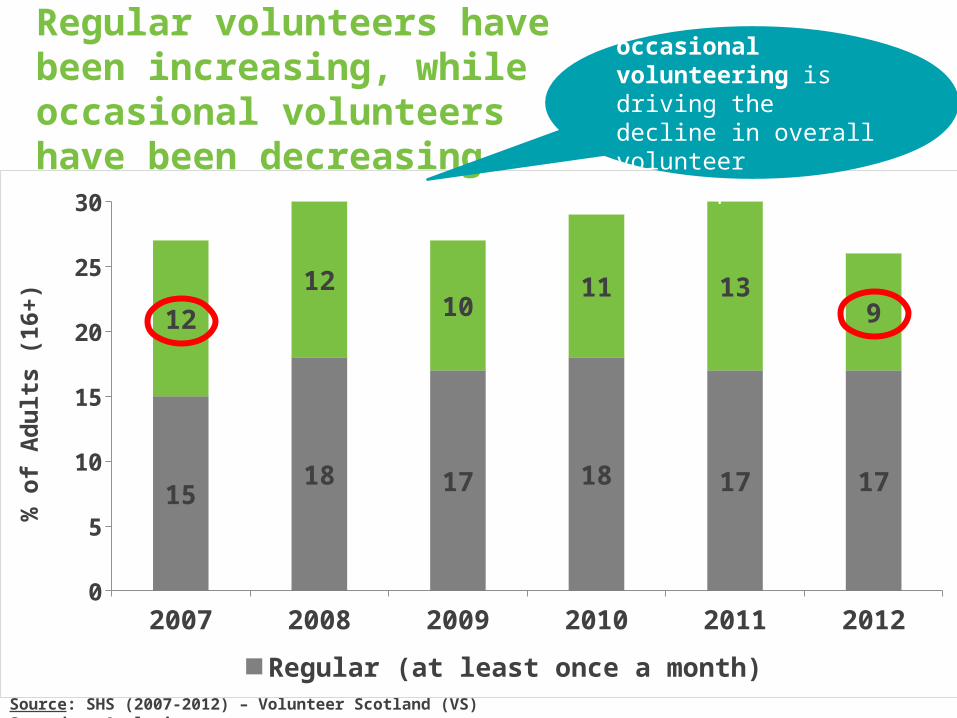
Regular volunteers have been increasing, while occasional volunteers have been decreasing
2007 2008 2009 2010 2011 20120
5
10
15
20
25
30
1518 17 18 17 17
12
1210
11 139
Regular (at least once a month) Occasional (few times a year)
% o
f A
du
lts
(16+
)
Reduction in occasional volunteering is driving the decline in overall volunteer participation
HOW REGULAR IS REGULAR.....?
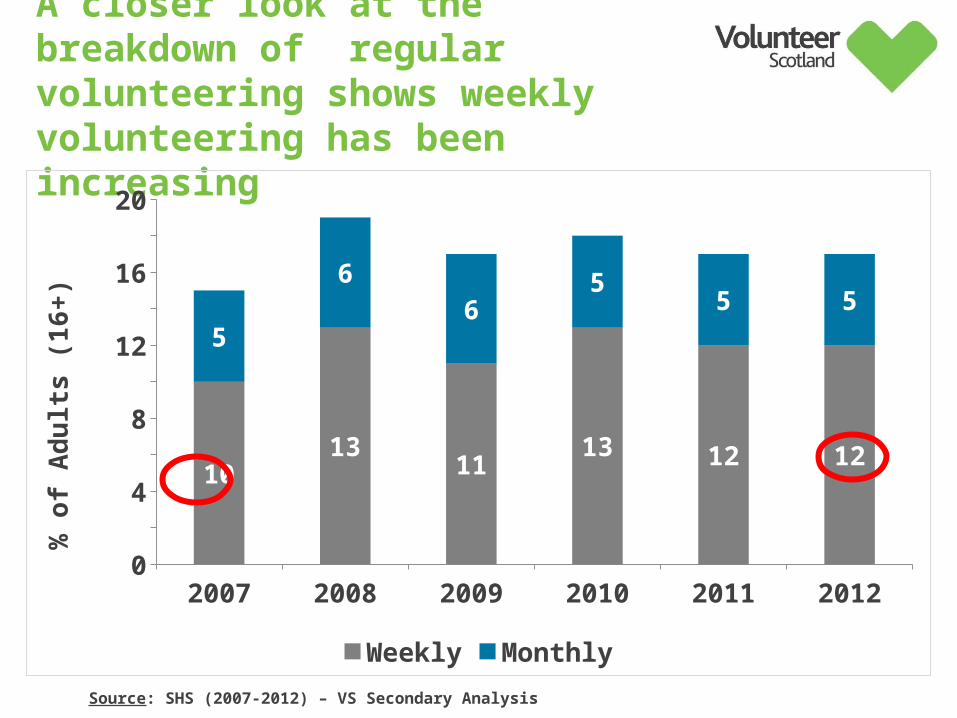
Source: SHS (2007-2012) – VS Secondary Analysis
A closer look at the breakdown of regular volunteering shows weekly volunteering has been increasing
2007 2008 2009 2010 2011 20120
2
4
6
8
10
12
14
16
18
20
1013
1113 12 12
5
6
65
5 5
Weekly Monthly
% o
f A
du
lts
(1
6+
)
TIME (HOURS) SPENT VOLUNTEERING HAS REMAINED
RELATIVELY STABLE
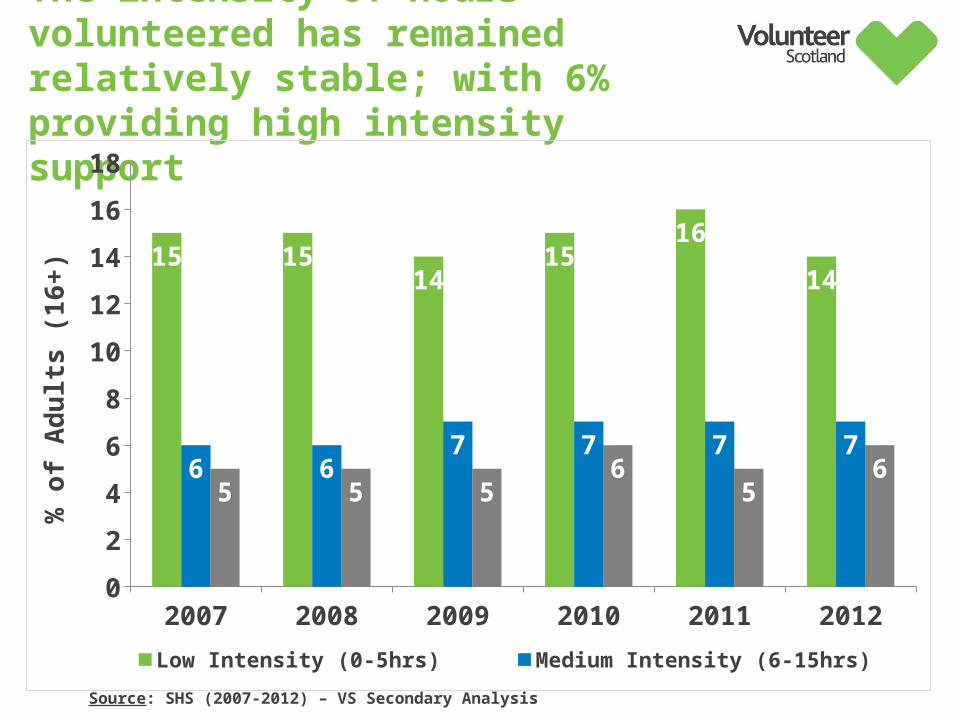
Source: SHS (2007-2012) – VS Secondary Analysis
The intensity of hours volunteered has remained relatively stable; with 6% providing high intensity support
2007 2008 2009 2010 2011 20120
2
4
6
8
10
12
14
16
18
15 1514
1516
14
6 67 7 7 7
5 5 56
56
Low Intensity (0-5hrs) Medium Intensity (6-15hrs) High Intensity (16+hrs)
% o
f A
du
lts
(1
6+
)
LET’S LOOK A BIT CLOSER AT THIS 6%...
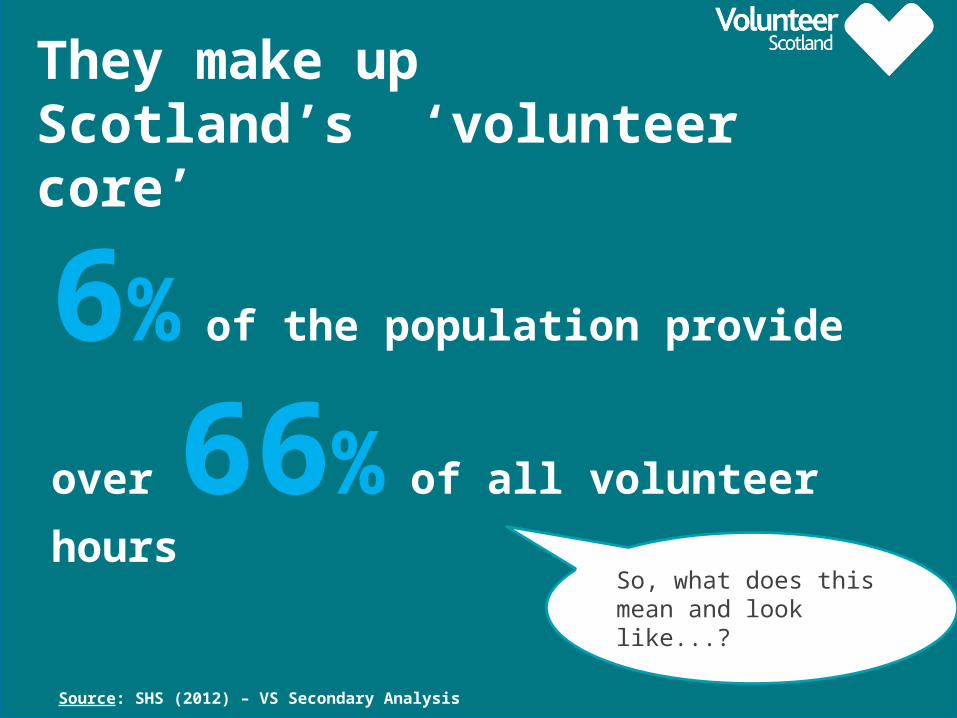
They make up Scotland’s ‘volunteer core’
6% of the population provide over
66% of all volunteer hours
Source: SHS (2012) – VS Secondary Analysis
So, what does this mean and look like...?
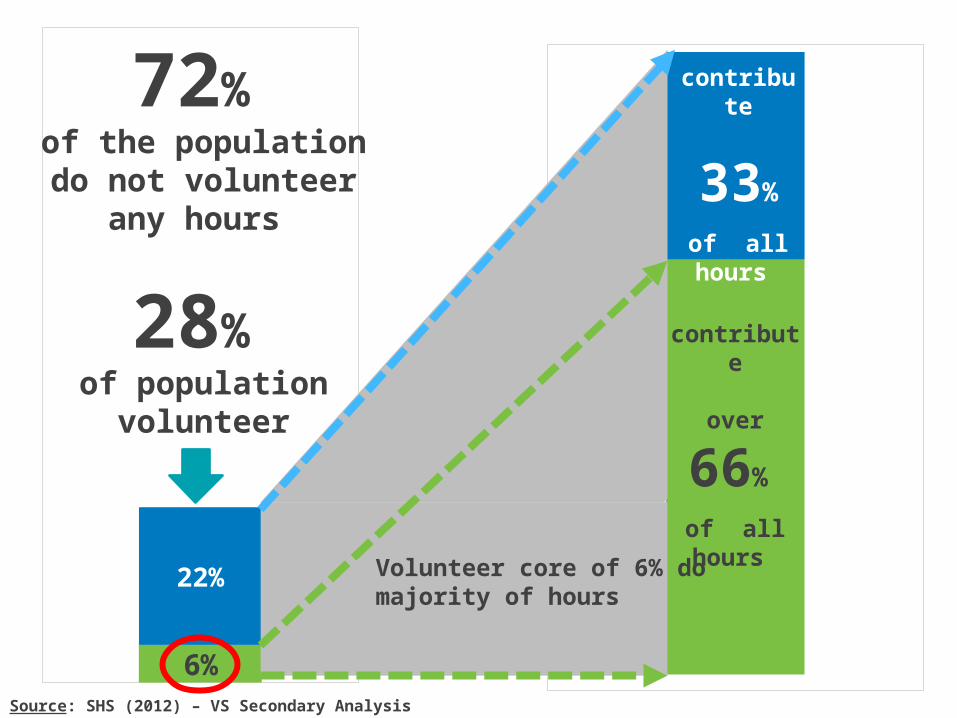
6%
22%
72%
contribute
over
66%
of allhours
contribute
33%
of all hours
Volunteer core of 6% do majority of hours
72% of the population do
not volunteer any hours
Source: SHS (2012) – VS Secondary Analysis
28% of population
volunteer
What Next?• Engage users in a conversation about what these
findings mean and what’s needed to increase and improve volunteering in Scotland.
• Further analysis to explore these findings in more detail (e.g. volunteer core).
• Bring together and summarise other key research to understand the volunteering landscape.
• A report will be published before spring 2015.
TECHNICAL NOTESThese slides present top-line results.
Technical notes for the this report can be found here. Explanations of the secondary analysis undertaken (including the volunteer core) and definitions used in this report are outlined in this note.
Data tables for all charts can be found on our web-page.
Technical notes for they survey’s used in this report can be accessed via:
Scottish Household Survey website
Volunteering in Scotland Survey web-page
Where results do not sum to 100%, this may be due to computer rounding, multiple response, or the exclusion of ‘don’t know’ or other categories
REFERENCES
Scottish Household Survey, 2007-2013
Volunteering in Scottish Charities, 2013
Volunteering in Scotland Survey, 2013
Rutherford, A., Doyle, K. & McConnell, D. (2014) Volunteering Participation in Scotland: An Analysis of Linked Social Survey and Administrative Data. Available here