voluntary adoption of international financial reporting
TRANSCRIPT
Voluntary Adoption of International
Financial Reporting Standards (IFRS) by
unlisted companies Evidence from Norway
VIVIAN TIROL EIDE
SUPERVISOR
Victoria Carol Edgar
University of Agder, 2020
Faculty of Handelshøyskolen
Department of Economics

2

3
Preface
This Master Thesis is the final part of the master’s degree in Accounting and Auditing at the
University of Agder. The thesis counted for 30 credits and was completed in Spring 2020.
Completing and writing this thesis has been educational, interesting, and challenging. Despite
some challenges along the way, I have gained a lot of knowledge regarding the chosen topic,
determinants of voluntary IFRS adoption by unlisted companies in Norway.
I want to express my most profound appreciation to my supervisor, Associate Professor Victoria
Carol Edgar, who helped and gave me the opportunity to make this thesis possible. Moreover,
I am very grateful for her continuous feedback, guidance, and encouragement throughout the
writing process.
Furthermore, a special thanks to my husband, Øyvind Eide, for taking care of our two sons and
always being there for me when I lost motivation. I am very thankful for his unconditional love,
constant support, and understanding throughout the research process. I dedicate this thesis to
him.
I would like to thank my family in the Philippines, my family in Norway, and friends who
supported me with love, understanding, and patient advice. Especially, I am very grateful for
the help from my father in law, Svein Eide, and his partner, Solveig Bjelland, for always
stepping in whenever we need help to take care of our youngest son (1-year-old). A special
thanks also to Marilex Rea Llave for helping me with the printing, for her informative advice
and for reading through my thesis. Last but not least, thanks to Maria Theresa Westervoll for
proofreading my research and for her motivational feedback. Thank you all very much for the
unwavering support.
I hope you enjoy your reading.
Vivian Tirol Eide
Kristiansand, June 2020

4
5
Abstract
This thesis explores the voluntary IFRS adoption among unlisted companies by testing the main
hypothesis: Certain company characteristics influence the voluntary adoption of IFRS
Standards in Norway. This research tackles the issue of which company characteristics
influence the voluntary adoption of IFRS by unlisted companies in the Norwegian context. In
the empirical analysis, this study focuses on 1395 unlisted companies preparing unconsolidated
financial statements in 2018.
A descriptive research study using a quantitative research strategy are conducted to answer the
main research hypothesis. Chi-square statistical tests of independence are used to examine the
determinants of voluntary IFRS adoption. Findings from the chi-square test of independence
reveal that firm size by employees, firm size by turnover, industry type, and auditor type are
statistically significantly related to the voluntary adoption of IFRS by Norwegian unlisted
companies. Specifically, larger companies that operate in oil & gas, telecommunication &
information, financial & insurance industries, and are audited “Big Five” auditing firms
(especially EY and Deloitte) significantly related to unlisted company’s decisions to adopt
IFRS voluntarily.
This research contributes to prior literature on the voluntary adoption of IFRS by unlisted
companies by focusing on the Norwegian context. Specifically, by examining the role of certain
company characteristics in explaining the adoption of IFRS. The findings of this study have
implications for regulators, preparers, and standard setters that evaluates financial reporting,
which is related to policies for unlisted companies. In addition, the findings will provide a better
understanding on how unlisted company’s characteristics influence the voluntary adoption of
IFRS. In that way, regulators, preparers, and standard setters can promote the usage of IFRS
Standards more efficiently and adjust or improve IFRS standards, especially for unlisted
companies.
Additionally, this study offers insights regarding the determinants of unlisted company’s
preferences for voluntary adoption of IFRS Standards. The study also suggests which type of
unlisted companies prefer to choose and benefit from IFRS. Furthermore, the findings in this
study may enhance the decision of unlisted companies to adopt IFRS voluntarily.

6
7
Table of contents
Preface ....................................................................................................................................... 3
Abstract ..................................................................................................................................... 5
Abbreviations ............................................................................................................................ 9
List of figures .......................................................................................................................... 10
List of tables ............................................................................................................................ 10
1 Introduction .................................................................................................................... 11
1.1 Research context and motivations ............................................................................ 11
1.2 Problem Statement ................................................................................................... 13
1.3 Research contribution .............................................................................................. 13
2 Background ..................................................................................................................... 15
2.1 Accounting regulation in Norway ............................................................................ 15
2.2 Prevalence of IFRS in Norway ................................................................................. 18
2.3 Differences between NGAAP and IFRS ................................................................... 21
3 Literature review ............................................................................................................ 23
3.1 IFRS adoption........................................................................................................... 23
3.1.1 Research on the benefits of IFRS adoption .......................................................... 23
3.1.2 Research on the costs of IFRS adoption ............................................................... 26
3.1.3 Summary .............................................................................................................. 28
3.2 Voluntary IFRS adoption.......................................................................................... 28
3.2.1 Early voluntary adoption of IFRS (before 2005) ................................................. 29
3.2.2 Post-voluntary adoption of IFRS (after 2005) ...................................................... 31
3.2.3 Summary .............................................................................................................. 33
3.3 Hypotheses development .......................................................................................... 34
3.3.1 Firm size ............................................................................................................... 35
3.3.2 Industry sector ...................................................................................................... 36
8
3.3.3 Audit firm ............................................................................................................. 37
4 Methodology.................................................................................................................... 39
4.1 Research philosophy................................................................................................. 39
4.2 Research strategies and methods ............................................................................. 40
4.3 Sample selection and data collection ....................................................................... 41
4.3.1 Research sample selection .................................................................................... 42
4.3.2 Data collection ...................................................................................................... 43
4.4 Research design ........................................................................................................ 43
4.4.1 Chi-square test of independence........................................................................... 45
4.5 Methodological limitations....................................................................................... 49
5 Findings and Discussions ............................................................................................... 51
5.1 Firm size by employees............................................................................................. 51
5.2 Firm size by turnover ............................................................................................... 55
5.3 Industry sector .......................................................................................................... 58
5.4 Auditor type .............................................................................................................. 63
5.5 Summary ................................................................................................................... 66
6 Conclusions and recommendations for future research ............................................. 69
References ............................................................................................................................... 73
Appendix: Reflection notes .................................................................................................... 81
9
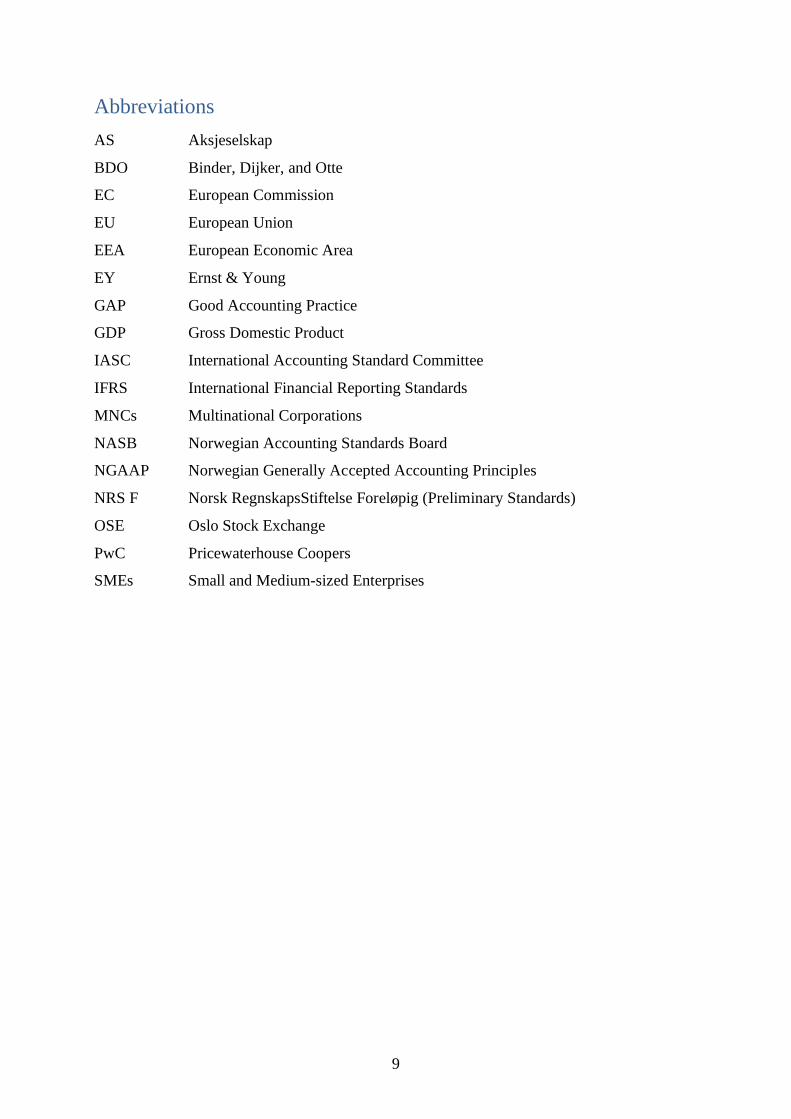
Abbreviations
AS Aksjeselskap
BDO Binder, Dijker, and Otte
EC European Commission
EU European Union
EEA European Economic Area
EY Ernst & Young
GAP Good Accounting Practice
GDP Gross Domestic Product
IASC International Accounting Standard Committee
IFRS International Financial Reporting Standards
MNCs Multinational Corporations
NASB Norwegian Accounting Standards Board
NGAAP Norwegian Generally Accepted Accounting Principles
NRS F Norsk RegnskapsStiftelse Foreløpig (Preliminary Standards)
OSE Oslo Stock Exchange
PwC Pricewaterhouse Coopers
SMEs Small and Medium-sized Enterprises
10
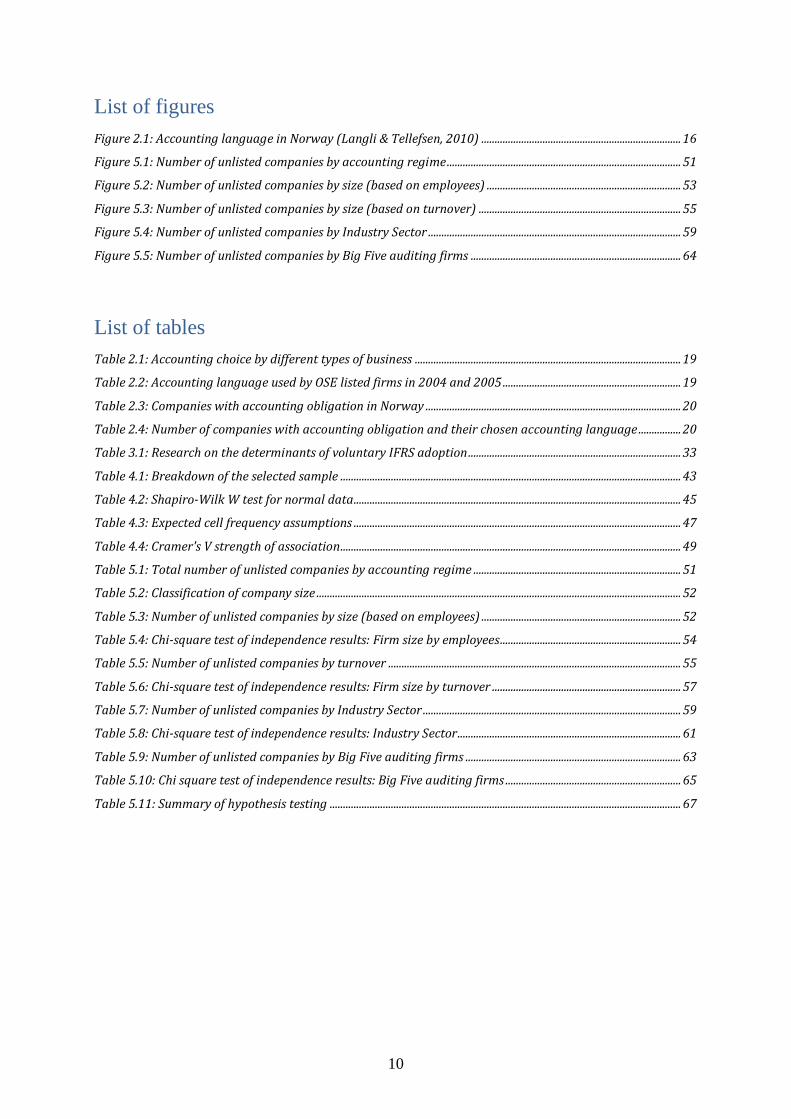
List of figures
Figure 2.1: Accounting language in Norway (Langli & Tellefsen, 2010) ........................................................................... 16
Figure 5.1: Number of unlisted companies by accounting regime ........................................................................................ 51
Figure 5.2: Number of unlisted companies by size (based on employees) ......................................................................... 53
Figure 5.3: Number of unlisted companies by size (based on turnover) ............................................................................ 55
Figure 5.4: Number of unlisted companies by Industry Sector ............................................................................................... 59
Figure 5.5: Number of unlisted companies by Big Five auditing firms ............................................................................... 64
List of tables
Table 2.1: Accounting choice by different types of business .................................................................................................... 19
Table 2.2: Accounting language used by OSE listed firms in 2004 and 2005 ................................................................... 19
Table 2.3: Companies with accounting obligation in Norway ................................................................................................ 20
Table 2.4: Number of companies with accounting obligation and their chosen accounting language ................ 20
Table 3.1: Research on the determinants of voluntary IFRS adoption ................................................................................ 33
Table 4.1: Breakdown of the selected sample ................................................................................................................................ 43
Table 4.2: Shapiro-Wilk W test for normal data ........................................................................................................................... 45
Table 4.3: Expected cell frequency assumptions ........................................................................................................................... 47
Table 4.4: Cramer's V strength of association................................................................................................................................ 49
Table 5.1: Total number of unlisted companies by accounting regime .............................................................................. 51
Table 5.2: Classification of company size ......................................................................................................................................... 52
Table 5.3: Number of unlisted companies by size (based on employees) ........................................................................... 52
Table 5.4: Chi-square test of independence results: Firm size by employees .................................................................... 54
Table 5.5: Number of unlisted companies by turnover .............................................................................................................. 55
Table 5.6: Chi-square test of independence results: Firm size by turnover ....................................................................... 57
Table 5.7: Number of unlisted companies by Industry Sector ................................................................................................. 59
Table 5.8: Chi-square test of independence results: Industry Sector.................................................................................... 61
Table 5.9: Number of unlisted companies by Big Five auditing firms ................................................................................. 63
Table 5.10: Chi square test of independence results: Big Five auditing firms .................................................................. 65
Table 5.11: Summary of hypothesis testing .................................................................................................................................... 67
11
1 Introduction
This research explores the determinants of the voluntary adoption of International Financial
Reporting Standards (IFRS) in Norway. This chapter outlines the research context and
motivations of this study. Consequently, the problem statement and research hypotheses are
discussed. Finally, the research contributions and the structure of the thesis are presented.
1.1 Research context and motivations
Despite not being a European Union (EU) member, Norway is required to implement the EU
Accounting Directive (including IAS/IFRS regulation) through its obligations under the
European Economic Area (EEA) agreement (Kvaal, 2017). In 2005, the EU mandated
Norwegian listed companies to prepare their consolidated financial statements in compliance
with IFRS. In 2011, Norwegian listed companies that did not prepare consolidated accounts
were mandated to prepare their separate company financial statements in accordance with IFRS.
This context will be explored in more detail in Chapter 2.
Unlisted companies are not obliged but are permitted to adopt IFRS in Norway. In Norway,
unlisted companies represent 99.97 % of all companies in 2020 (out of the total 590 810
companies, only 198 are listed in Oslo Stock Exchange) (OSE, 2020; SSB, 2020b). Berner and
Olving (2013) find that companies mandatorily reporting under IFRS tripled from 2005 to 2011,
while unlisted companies that voluntarily adopted IFRS increased six-fold during the same
period. Recently, Schwencke, Haugen, Baksaas, Stenheim, and Avlesen-Østli (2019)
commented that the percentage of unlisted companies that adopt IFRS voluntarily continues to
increase. Prior literature has focused on the impact and consequences of IFRS adoption (Barth,
Landsman, Lang, & Williams, 2018; Daske, Hail, Leuz, & Verdi, 2013; Kim & Shi, 2012).
Specifically, in Norway, research has focused on the value relevance of earnings and book
values (Beisland & Knivsflå, 2015; Gjerde, Knivsflå, & Sættem, 2008), and accounting quality
under the IFRS accounting regime (Galaen & Stenheim, 2010; Stenheim & Madsen, 2017).
Recent studies have considered the characteristics of companies adopting IFRS voluntarily,
including André, Walton, and Yang (2012); Di Fabio (2018); Haapamäki (2018); and Matonti
and Iuliano (2012). Most of these recent studies were conducted in European setting, such as
UK, Ireland, Poland, and Italy.
12
Despite the increased number of companies adopting IFRS voluntarily (Schwencke et al.,
2019), in Norway, only one study considers the determinants of IFRS voluntary adoption.
Berner and Olving (2013), through a descriptive analysis, find that the industry sector where
the company operates in influences the voluntary adoption of IFRS in Norway. This study
extends the research of Berner and Olving (2013) by analyzing the firm-factors empirically.
Disparate from the study by Berner and Olving (2013), which is based on the fiscal year 2005
– 2011, this thesis is based on the 2018 financial year indicating that more chances for
companies to adopt IFRS voluntarily having seen any potential benefits/costs in action for a
longer time. For that reason, it would be interesting to see if this empirical research validates
what has been found in the descriptive analysis of Berner and Olving (2013). Therefore, this
research is conducted to see if the characteristics are still the same after more experience in
Norway with IFRS.
This study is motivated by a desire to examine whether a company’s specific characteristics are
likely to influence the voluntary adoption of IFRS. It has been argued that empirical evidence
on the drivers of voluntary IFRS adoption is still limited (André et al., 2012). This is because
information on unlisted companies is not easy to collect compared to information on listed
companies. Fortunately, in Norway, information on unlisted companies can be obtained from
the Norwegian company register, Brønnøysund Register Center. For this reason, Norway
provides a suitable setting to study as it also has unlisted companies that represent more than
99 % of all companies. Berner and Olving (2013) call for further research concerning the
determinants of voluntary IFRS adoption in the Norwegian context. It is important to
understand this area because it will guide unlisted companies for a better decision-making of
what accounting regime that is beneficial for them, especially to those unlisted companies that
seek to go global and plans to be listed in the regulated market.
Moreover, this thesis is also motivated by the recommendations of the recent study by Di Fabio
(2018), concerning firm factors that may influence the voluntary adoption of IFRS. As both of
the latter studies focus on unlisted companies, it is relevant for this thesis to evaluate whether
their findings support the results of this research.
13
1.2 Problem Statement
This section outlines the research objectives and hypotheses of this thesis. This study focuses
on the voluntary adoption of IFRS Standards in Norway. The overall aim of this research is to
understand the characteristics of unlisted companies that adopt IFRS Standards voluntarily in
Norway. Even though IFRS is a complex theme to study, it is an influential accounting regime
not only in Norway but also around the world as it currently been used by a total of 166
jurisdictions (IFRS.org, 2020). Therefore, this study will test the overarching research
hypothesis:
“Certain company characteristics relate the voluntary adoption of IFRS Standards in
Norway.”
In order to answer the central research hypothesis of this study, four research hypotheses are
examined:
H1. Voluntary adoption of IFRS by unlisted companies is related to the firm size by employees.
H2. Voluntary adoption of IFRS by unlisted companies is related to the firm size by turnover.
H3. Voluntary adoption of IFRS by unlisted companies is related to the industry sector.
H4. Voluntary adoption of IFRS by unlisted companies is related to the audit firm.
1.3 Research contribution
This section outlines some of the main contributions of this study. First, this study adds to the
IFRS literature in terms of the voluntary adoption of IFRS by focusing on the Norwegian
jurisdiction. Second, this study offers a deeper our understanding of whether specific company
characteristics are more likely to influence the voluntary adoption of IFRS. This research is
potentially relevant to producers of financial statements as well as standard setters and
regulators and to those unlisted companies that are planning to adopt IFRS accounting regime.
Standard setters may have a better understanding of the motivations for the voluntary adoption
of IFRS. This will enable them to promote IFRS more effectively to countries that currently do
not employ IFRS. Regulators, Norwegian accounting standard regulators, in particular, may
enhance their awareness for evaluating to what extent IFRS adoption may be beneficial to
voluntary adopters. Since IFRS is a complex and dynamic accounting regime, regulators need
to know whether any improvements or adjustments of IFRS Standard is relevant. Therefore,
the findings of this study may help the regulators to know the type of unlisted companies, their
14
characteristics, which needs to be adjusted or improved. This research can also be of interest to
a wide range of practitioners, and especially for managers of companies currently evaluating
the opportunity to convert to international accounting standards. The findings of this thesis may
also help unlisted companies to understand voluntary IFRS adoption decision-making better. It
will be beneficial for the unlisted companies that do not adopt IFRS yet to know if other unlisted
companies with similar characteristics that chose IFRS have benefited from the use of IFRS
Standards. Thus, it is crucial to determine which firms’ characteristics are more likely to adopt
IFRS voluntarily and whether all the firms benefit from voluntary IFRS adoption.
The remainder of this paper is structured as follows: Chapter 2 provides the background of
IFRS adoption generally, the prevalence of IFRS in Norway, and discusses the major
differences of NGAAP and IFRS policy. Chapter 3 presents the main literature review and the
hypotheses development. Followed by the methodology, which is presented in Chapter 4. While
Chapter 5 draws the findings and discussions of the results. Concluding remarks, limitations,
and recommendations for future studies are presented in Chapter 6.

15
2 Background
This chapter outlines the general background of IFRS to provide context for the study. Section
2.1 outlines the accounting regulation in Norway, Section 2.2 outlines the prevalence of IFRS
in Norway, and Section 2.3 outlines the differences between IFRS and Norwegian Generally
Accepted Accounting Principles (NGAAP).
The European Union (EU) adopted an IAS Regulation (Regulation 1606/2002) in June 2002
requiring all European companies listed in any regulated market within the EU to prepare their
consolidated financial statements in accordance with International Financial Reporting
Standards (IFRS), as adopted by the EU, effective from the financial year 2005. The EU
Accounting Directives and Regulations, which includes IFRS adoption in 2005, also applies to
members of the European Economic Area (EEA). Since Norway is an EEA member (Kvaal,
2017), IFRS Standards were adopted as law in Norway through the Norwegian Accounting Act
of 1998 (hereafter called Accounting Act) (NRS, 2017). As stated in the preparatory document
under the implementation of IFRS, IAS/IFRS Standards should continue to be the basis for the
development of Norwegian accounting standards (IFRS Foundation, 2017).
As a result, all Norwegian companies that are listed in an EU/EEA securities market are
obligated to prepare their consolidated financial statements in compliance with IFRS as adopted
by the EU starting in 2005 (Larson & Street, 2004). As of 2011, Norwegian listed companies
that do not prepare consolidated accounts because they do not have any subsidiaries must
prepare their separate company financial accounts under IFRS (Schwencke et al., 2019).
Unlisted Norwegian companies have the right but are not obliged to report their financial
accounts in compliance with IFRS; instead, they are required to report their financial accounts
using NGAAP.
2.1 Accounting regulation in Norway
This section outlines the accounting regulation in Norway to provide context for the study. In
particular, this section presents the structure and implementation of IFRS in Norway.
Financial accounting in Norway is regulated by legislation, the Accounting Act (Johnsen,
1993). Norway has five types of accounting language namely IFRS as adopted by the EU (called
full IFRS in Norway), simplified IFRS, traditional Norwegian Good Accounting Practice
16
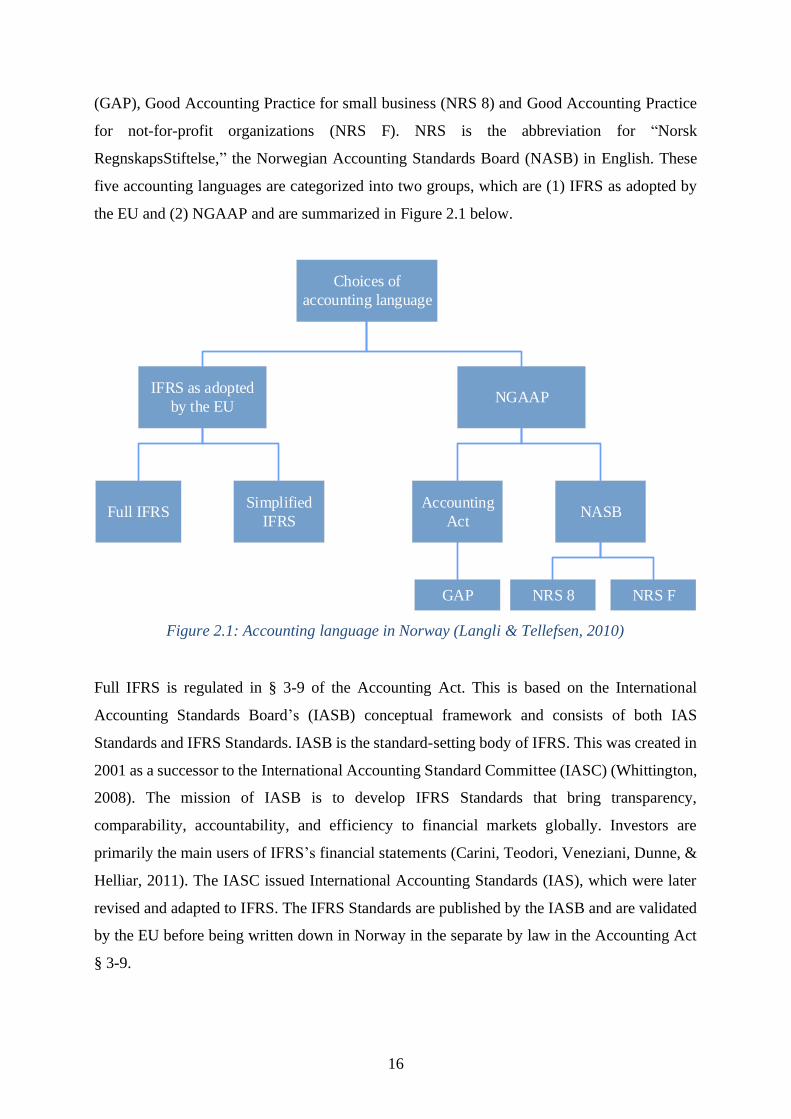
(GAP), Good Accounting Practice for small business (NRS 8) and Good Accounting Practice
for not-for-profit organizations (NRS F). NRS is the abbreviation for “Norsk
RegnskapsStiftelse,” the Norwegian Accounting Standards Board (NASB) in English. These
five accounting languages are categorized into two groups, which are (1) IFRS as adopted by
the EU and (2) NGAAP and are summarized in Figure 2.1 below.
Figure 2.1: Accounting language in Norway (Langli & Tellefsen, 2010)
Full IFRS is regulated in § 3-9 of the Accounting Act. This is based on the International
Accounting Standards Board’s (IASB) conceptual framework and consists of both IAS
Standards and IFRS Standards. IASB is the standard-setting body of IFRS. This was created in
2001 as a successor to the International Accounting Standard Committee (IASC) (Whittington,
2008). The mission of IASB is to develop IFRS Standards that bring transparency,
comparability, accountability, and efficiency to financial markets globally. Investors are
primarily the main users of IFRS’s financial statements (Carini, Teodori, Veneziani, Dunne, &
Helliar, 2011). The IASC issued International Accounting Standards (IAS), which were later
revised and adapted to IFRS. The IFRS Standards are published by the IASB and are validated
by the EU before being written down in Norway in the separate by law in the Accounting Act
§ 3-9.
Choices of
accounting language
IFRS as adopted
by the EUNGAAP
Accounting
ActNASBFull IFRS
Simplified
IFRS
GAP NRS 8 NRS F
17
Simplified IFRS is also regulated in § 3-9 of the Accounting Act. Companies that comply with
this standard mainly use the same rules for recognition and measurement as used in Full IFRS.
However, cash flow presentations and note information are based on the Accounting Act
(Baksaas & Stenheim, 2019). Simplified IFRS can be used by all entities obliged to keep
accounts unless the law requires them to use other solutions. This is also used by entities that
plan to be listed on the Oslo Stock Exchange (OSE) and entities that want to show fair values
in the balance sheet (Gotland consulting, 2017).
The traditional ‘Good Accounting Practice’ is regulated in § 4-6 of the Accounting Act and has
been a legal standard in Norway since 1976/77. It serves an integral part in Norwegian
accounting laws (Alexander & Schwencke, 2003). Johnsen (1993) stated that Good Accounting
Practice is a dynamic concept since it is continually developed in response to economic change
and when entities undertake new transactions and face new accountable events. Good
Accounting Practice is meant to supplement the law in areas that are not directly regulated by
law or regulation. Good Accounting Practice for small businesses (NRS 8) is intended to
supplement and interpret the fundamental accounting principles and regulations in the
Accounting Act for small businesses. In this way, NRS 8 helps ensure that information provided
to users of financial statements remains relevant and reliable. This standard should be easy to
follow and less costly to the small businesses that are obliged to report annual accounts. Good
Accounting Practice for not-for-profit organizations (NRS F) has the purpose of describing and
interpreting Good Accounting Practice for not-for-profit organizations that must to report
annual accounts (Rettsdata, 2020).
Both NRS 8 and NRS F are published by the Norwegian Accounting Standards Board (NASB).
NASB is the official standard-setting body in Norway. The major work of this private body is
to publish discussion papers, exposure drafts, preliminary accounting standards, and final
accounting standards. Final accounting standards must be in compliance with the Accounting
Act and are mandatory to all Norwegian companies, except listed companies, small businesses
(can choose to apply NRS 8), and not-for-profit organizations where they have a separate
standard to comply with. If preliminary accounting standards are available before the final
standards, it is then recommended to be applied (NRS, 2017).
The Accounting Act and the accounting standards published by NASB are the essential
regulations of NGAAP (Beisland & Knivsflå, 2015). The Accounting Act includes all aspects
18
of financial accounting, along with the measurement rules and fundamental accounting
principles (Alexander & Schwencke, 2003). These fundamental accounting principles are
explained in the Accounting Act §§ 4-1 – 4-4. The Accounting Act defines what is considered
to be large and small companies. Large companies have stricter requirements than small
companies. Small companies are, for example, not required to prepare cash flow analysis and
are only subject to simplified notes requirements. Small companies are required to use the GAP
for small businesses (NRS 8). The Accounting Act § 1-5 defines large companies as public
limited companies (ASA), companies whose shares, units, primary capital certificates or bonds
are listed on the stock exchange, authorized market place or similarly regulated market abroad
or enterprises as entities required by law to prepare accounts if so provided by the Ministry in
general regulation. On the other hand, small companies are also obliged to prepare accounts if
at least two of three criteria are satisfied over two consecutive years, see Accounting Act § 1-
6:
• Sales revenues less than NOK 70 million
• Balance sheet total (+ sum of balance sheet assets) less than NOK 35 million
• Fewer than 50 employees determined as average full-time equivalents during the
financial year
The value at the end of the financial year, which is normally 31 December, is the basis of
whether or not the criteria are met. A parent group can be considered a small business if the
above criteria are fulfilled. Other companies are not covered by the definition of large or small
companies, which are medium-sized companies.
2.2 Prevalence of IFRS in Norway
This section outlines the prevalence of IFRS in Norway. The accounting choice of the reporting
companies in Norway is regulated in the Accounting Act. As mentioned earlier in this chapter,
large companies have stricter requirements relative to financial reporting. Listed companies are
required to use IFRS Standards in their consolidated accounts and separate company accounts.
The three other business categories (other companies, small companies, and not-for-profit
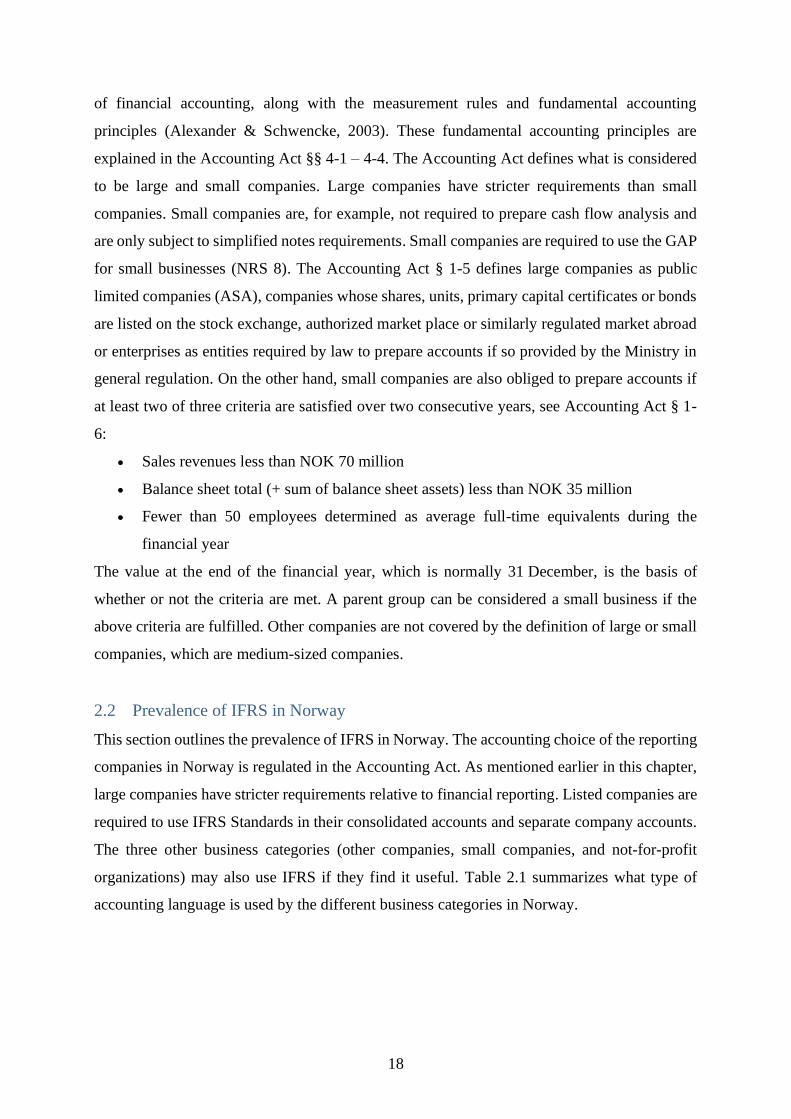
organizations) may also use IFRS if they find it useful. Table 2.1 summarizes what type of
accounting language is used by the different business categories in Norway.
19
Table 2.1: Accounting choice by different types of business
Listed companies Other companies Small companies Not-for-profit
organizations
Separate
company
financial
statements
IFRS
Simplified IFRS
IFRS
Simplified IFRS
GAP
IFRS
Simplified IFRS
GAP for
small businesses
IFRS
Simplified IFRS
GAP for
not-for-profit
organization
Consolidated
financial
statements
IFRS IFRS
Simplified IFRS
GAP
IFRS
Simplified IFRS
GAP for
small businesses
IFRS
Simplified IFRS
GAP for
not-for-profit
organization
(DIBKunnskap, 2019)
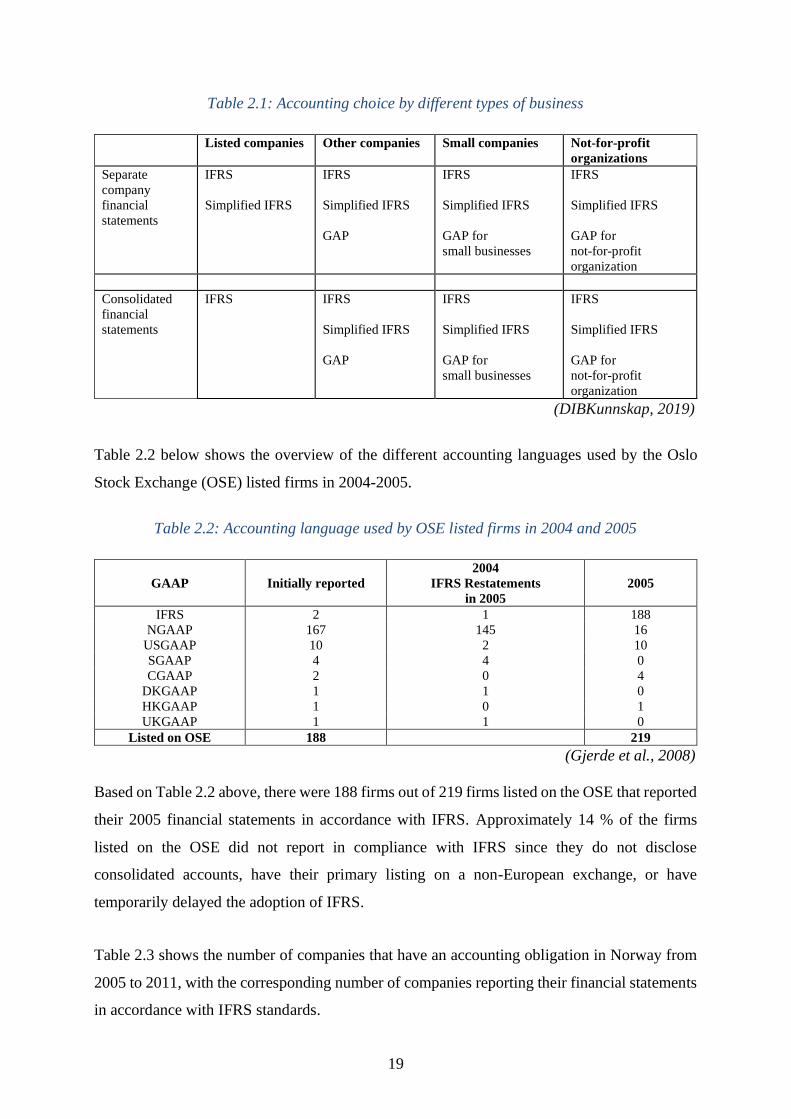
Table 2.2 below shows the overview of the different accounting languages used by the Oslo
Stock Exchange (OSE) listed firms in 2004-2005.
Table 2.2: Accounting language used by OSE listed firms in 2004 and 2005
GAAP
Initially reported
2004
IFRS Restatements
in 2005
2005
IFRS 2 1 188
NGAAP 167 145 16
USGAAP 10 2 10
SGAAP 4 4 0
CGAAP 2 0 4
DKGAAP 1 1 0
HKGAAP 1 0 1
UKGAAP 1 1 0
Listed on OSE 188 219
(Gjerde et al., 2008)
Based on Table 2.2 above, there were 188 firms out of 219 firms listed on the OSE that reported
their 2005 financial statements in accordance with IFRS. Approximately 14 % of the firms
listed on the OSE did not report in compliance with IFRS since they do not disclose
consolidated accounts, have their primary listing on a non-European exchange, or have
temporarily delayed the adoption of IFRS.
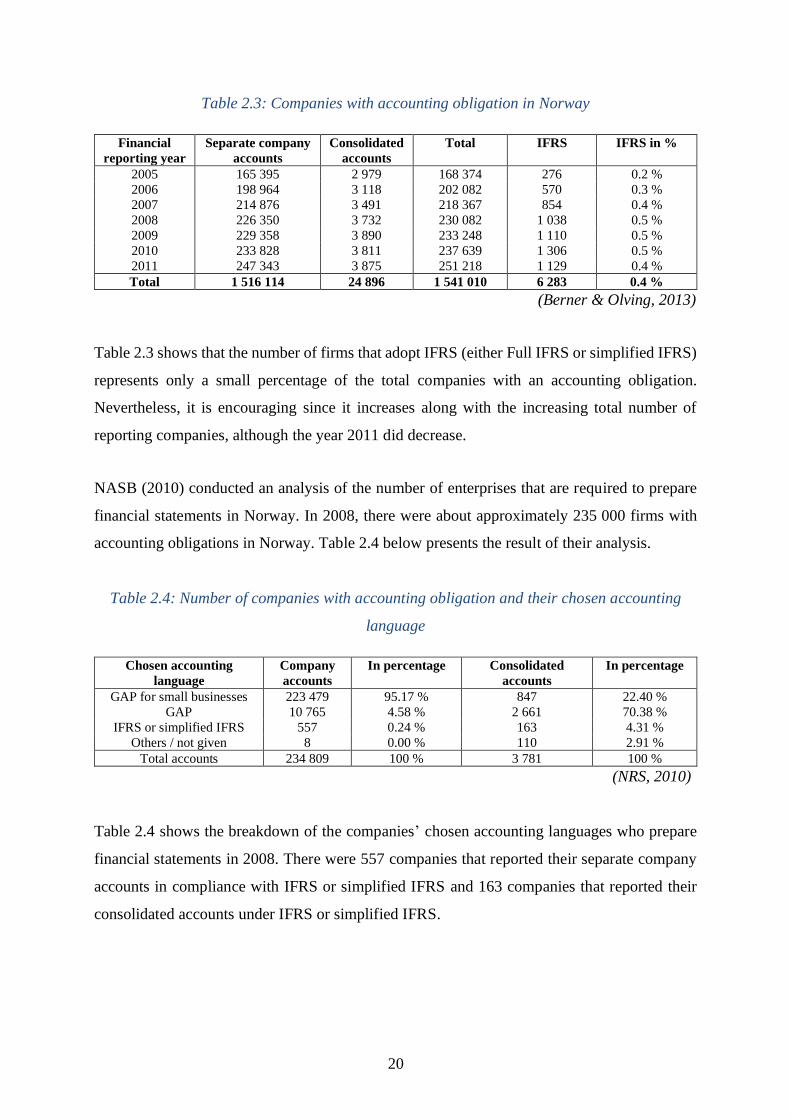
Table 2.3 shows the number of companies that have an accounting obligation in Norway from
2005 to 2011, with the corresponding number of companies reporting their financial statements
in accordance with IFRS standards.
20
Table 2.3: Companies with accounting obligation in Norway
Financial
reporting year
Separate company
accounts
Consolidated
accounts
Total IFRS IFRS in %
2005 165 395 2 979 168 374 276 0.2 %
2006 198 964 3 118 202 082 570 0.3 %
2007 214 876 3 491 218 367 854 0.4 %
2008 226 350 3 732 230 082 1 038 0.5 %
2009 229 358 3 890 233 248 1 110 0.5 %
2010 233 828 3 811 237 639 1 306 0.5 %
2011 247 343 3 875 251 218 1 129 0.4 %
Total 1 516 114 24 896 1 541 010 6 283 0.4 %
(Berner & Olving, 2013)
Table 2.3 shows that the number of firms that adopt IFRS (either Full IFRS or simplified IFRS)
represents only a small percentage of the total companies with an accounting obligation.
Nevertheless, it is encouraging since it increases along with the increasing total number of
reporting companies, although the year 2011 did decrease.
NASB (2010) conducted an analysis of the number of enterprises that are required to prepare
financial statements in Norway. In 2008, there were about approximately 235 000 firms with
accounting obligations in Norway. Table 2.4 below presents the result of their analysis.
Table 2.4: Number of companies with accounting obligation and their chosen accounting
language
Chosen accounting
language
Company
accounts
In percentage Consolidated
accounts
In percentage
GAP for small businesses 223 479 95.17 % 847 22.40 %
GAP 10 765 4.58 % 2 661 70.38 %
IFRS or simplified IFRS 557 0.24 % 163 4.31 %
Others / not given 8 0.00 % 110 2.91 %
Total accounts 234 809 100 % 3 781 100 %
(NRS, 2010)
Table 2.4 shows the breakdown of the companies’ chosen accounting languages who prepare
financial statements in 2008. There were 557 companies that reported their separate company
accounts in compliance with IFRS or simplified IFRS and 163 companies that reported their
consolidated accounts under IFRS or simplified IFRS.
21
2.3 Differences between NGAAP and IFRS
This study examines the voluntary adoption of IFRS in Norway; therefore, it is relevant to
consider the differences between NGAAP and IFRS. NGAAP is based on an earnings-oriented
conceptual framework and focuses on historical cost (Gjerde et al., 2008). Johnsen (1993)
describes historical cost accounting as transaction-based accounting. He stated that transactions
are the basis for recognition and measurement. It is crucial to determine when a transaction
occurs or whether it has occurred at all for revenue recognition purposes. He also proposed that
substance over form should be used when recognizing revenues.
On the other hand, IFRS is based on a balance sheet-oriented conceptual framework and
emphasizes fair value as the principle of measurement (Dichev, 2008). It also allows the use of
historical cost accounting if there is no reliable alternative (Gjerde et al., 2008). Definitions of
assets and liabilities are the starting point for accounting recognition under IFRS (Beisland &
Knivsflå, 2015; Elling, 1995; Gjerde et al., 2008; Kvifte, 2003).
The significant difference between NGAAP and IFRS is characterized by what principle of
measurement they use. According to Gjerde et al. (2008), the most critical differences between
NGAAP and IFRS are the following:
• Goodwill and other intangible assets with indefinite economic lives. NGAAP requires
investment expenditures to be capitalized as assets, which is to be matched with future
economic benefits. Intangible assets are amortized over the best estimate of the useful
life and tested annually for impairment. IFRS requires assets to be capitalized if the
asset definition and criteria for recognition are satisfied. Intangible assets are tested
annually for impairment but not amortized.
• Research and development expenditures. NGAAP allows both research and
development expenditures to be capitalized as an asset with an option to expense both
when incurred. IFRS requires research expenditures to be expensed when incurred,
while development expenditures are to be capitalized as an asset if the criteria for asset
recognition are satisfied.
• Provisions for future expenditures. NGAAP allows provisions for future expenditures
to be capitalized as debt and matched with corresponding revenues. While IFRS treats
periodic maintenance as an investment which is depreciated over time.
• Biological assets and investment property. NGAAP requires both biological assets and
investment property to be capitalized at cost and should be depreciated if it has a long

22
useful life and is subject to an impairment test. Under IFRS, it should be capitalized as
an asset and measured according to fair value when this can be measured reliably.
• Financial instruments. NGAAP measures financial instruments at cost/nominal value,
except for short-term financial instruments traded in a liquid market, which is measured
at fair value. IFRS measures financial instruments at fair value and amortized cost.
Some other differences that are mentioned are related to pensions, deferred taxes, and share-
based payments (Gjerde et al., 2008, cited in Beisland & Knivsflå, 2015).

23
3 Literature review
The first section of this chapter (Section 3.1) generally examines the costs and benefits of IFRS
adoption around the world. It demonstrates some of the findings of diverse researchers and
academics who have influenced an understanding of the impact of IFRS adoption globally and
provides context for why companies may be motivated or not to adopt IFRS voluntarily. The
second section (Section 3.2), continues specifically with an analysis of the early and post
voluntary adoption of IFRS, which is the focus of this study. The third section (Section 3.3)
presents the development of the research hypotheses of this study.
3.1 IFRS adoption
Research relating to IFRS adoption emerged as early as in the 1990s, where several European
countries, including Germany, Switzerland, and Italy, permitted firms to adopt IAS Standards
voluntarily. Since then, researchers have provided initial insights into the potential benefits
(e.g., enhance transparency, comparability of financial statements, and lower costs of capital)
and expected costs (e.g., implementation costs, direct and indirect costs) of voluntary IFRS
adoption (Bassemir, 2018; De George, Li, & Shivakumar, 2016). This section considers the
proposed benefits of IFRS and the expected costs of IFRS adoption.
3.1.1 Research on the benefits of IFRS adoption
The expected benefits of IFRS adoption vary from firm to firm and from country to country.
NASB represents Norway as one of the participants in the public consultation held by European
Commission (EC) in 2014, suggests that some benefits from IFRS implementation include
higher transparency and comparability, enhanced quality of disclosure and improved value
relevance, reliability, and accountability (Brown, 2011; European Commission, 2017).
The other expected benefits of IFRS adoption are increased market participant’s confidence,
improved ability to trade or expand internationally (Brown, 2011), improved group reporting
in terms of process, the robust accounting framework for preparing financial statements,
administrative savings, and group audit savings (European Commission, 2017). Additional
expected benefits of IFRS adoption have increased the mobility of expertise and resources
across different jurisdictions, bring credibility to EU financial reporting, and allows the EU to
participate actively and effectively in the international standard-setting process (European
Commission, 2017). Jermakowicz and Gornik-Tomaszewski (2006) and Brown (2013) also
24
suggest that IFRS adoption may enhance cross-border listings and provide better investment
opportunities.
Research methods and design that have been used to examine IFRS adoption are diversified.
The following are the expected benefits found in the literature:
Lower costs of capital
Jermakowicz and Gornik-Tomaszewski (2006) conducted a questionnaire survey sent to EU-
listed firms in 2004. Findings provide no evidence of the lower cost of capital in their study. In
contrast, several other studies reported that the said cost of equity capital has decreased. For
instance, a sample of more than 20,000 firm-years and 34 countries between 1998 and 2004
used in the study of Kim, Shi, and Zhou (2014) provided evidence that the cost of equity capital
has significantly decreased under IFRS adoption. Another study conducted by Li (2010), using
a sample of approximately 6,500 firm-year observations of more than 1,000 EU firms between
1995 and 2006, found significant evidence of the decreased cost of equity capital for mandatory
adopters of IFRS in countries with vigorous legal enforcement. The reduced cost of equity
capital is primarily gained from the increased financial disclosure and enhanced information
comparability of financial accounts.
Improved comparability and transparency
Brown (2011) explained comparability as the ability to use accounting data to draw valid
assumptions about similarities and differences between entities and for the same entity over
time. Cole, Branson, and Breesch (2011) found in their online questionnaire survey of 426
auditors, analysts, and other users in 27 European countries that only 41 percent of the
respondents believe that the comparability in the European IFRS financial statements is
improved. Additionally, Callao, Jarne, and Laínez (2007) showed that local comparability is
significantly negatively affected when both IFRS and local GAAP are applied in the same
country at the same time.
In contrast, according to the questionnaire survey sent by Jermakowicz and Gornik-
Tomaszewski (2006) to EU-listed companies in 2004, most respondents believe that the
comparability and transparency of reported financial information have been improved under
IFRS accounting policy. A similar study conducted by Jermakowicz, Prather‐Kinsey, and Wulf
(2007), using a survey of German DAX-30 company executives, found that most companies
25
believe that IFRS would improve the comparability of financial statements. Furthermore, in the
light of the questionnaire survey conducted by Carini et al. (2011), it resulted that most of the
interviewees believed that IFRS had improved transparency through an increase in quantity and
quality of the financial statement information. A recent study by Barth et al. (2018) also
provided evidence that voluntary IFRS adopters gained more comparable accounting amounts
than those that mandatorily adopted IFRS standards.
Increased value relevance
One of the presumed benefits of IFRS adoption is increased value relevance. Callao et al. (2007)
revealed that the value relevance of financial reporting to local stock market operators did not
improve because of the gap between book and market values is wider under IFRS. Consistent
with the latter study, Paananen (2008) also found some indications of a decrease in financial
reporting quality in Sweden measured as earnings smoothing, timely loss recognition, and value
relevance. Further, Gjerde et al. (2008) performed two types of test evaluating the value
relevance differences and their significance between IFRS and NGAAP: (1) two-sample
unconditional comparison tests, and (2) marginal dependency tests, utilizing value-relevance
measures derived from price, return and abnormal return regression. They found little evidence
of improved value relevance after adopting IFRS when comparing and evaluating the two
accounting regimes unconditionally. Nevertheless, when evaluating the change in the
accounting figures from NGAAP to IFRS, they (Gjerde et al., 2008)found evidence that the
restatement adjustments are marginally value relevant. This is because of the more
capitalization of intangible assets under the IFRS regime.
Beisland and Knivsflå (2015) extended the literature of value relevance and found that IFRS
enhances the value relevance of book values and reduces earnings value relevance. The study
of Stenheim and Madsen (2017), also an extension of the work of Gjerde et al. (2008),
investigated the change in accounting quality where they use a panel design with 640 firm-year
observations from 2001 to 2008 that includes four years of pre-IFRS observations and four
years of IFRS observations. One of the tests Stenheim and Madsen (2017) conducted was the
test of value relevance of net earnings and book values, which also provided evidence consistent
with the result of the work of Gjerde et al. (2008) and Beisland and Knivsflå (2015) that the
adoption of IFRS increases the value relevance significantly. Their study proposed that IFRS
provides financial information that are more useful for valuation purposes. While NGAAP, on
the other hand, provides information more relevant for stewardship purposes. Stenheim and
26
Madsen (2017) also found evidence that the accrual quality has improved upon the adoption of
IFRS.
Enhanced disclosure quality
Another presumed benefit of IFRS adoption is the enhanced quality of disclosure of company’s
annual reports. Daske and Gebhardt (2006) explored the quality of the financial statements of
Austrian, German, and Swiss firms. They concluded that the quality of disclosure had
significantly improved under IFRS in these three countries. Some other prior research has also
proposed that the adoption of IFRS enhances the quality of corporate disclosure, such that IFRS
adoption leads to a lower cost of equity capital, increased market liquidity, increased earnings
quality and higher value relevance of earnings and book values (Barth, Landsman, & Lang,
2008; Daske, 2006; Daske et al., 2013; Leuz & Verrecchia, 2000).
Analysts forecast following and accuracy
Other studies also investigated the effects of IFRS adoption on both analysts’ forecast following
and analyst forecast accuracy. Ashbaugh and Pincus (2001) suggested that the analyst forecast
accuracy improves after firms adopt IFRS Standards. Hope (2003), using a sample from 22
countries, provided evidence that firm-level disclosures are positively related to analyst forecast
accuracy. Further, Tan, Wang, and Welker (2011) found that the mandatory adoption of IFRS
harmonizes financial reporting standards across countries, which leads to improvements in
foreign analysts’ forecast accuracy. Byard, Li, and Yu (2011) also showed that mandatory IFRS
adoption improves earnings forecasts accuracy, forecast dispersion, and information precision.
Kim and Shi (2012) extended the study of analysts’ forecast accuracy and following via
voluntary adoption of IFRS and find evidence of enhanced overall information environment
faced by financial analysts. Semi-structured interviews were conducted by Fox, Hannah,
Helliar, and Veneziani (2013) in the UK (including Ireland) and Italy context, and found that
there were some differences in the experiences of IFRS adoption between stakeholders across
countries and that costs exceeded benefits of financial reporting under IFRS.
3.1.2 Research on the costs of IFRS adoption
In contrast to studies on the benefits of IFRS adoption, studies examining the costs of IFRS
adoption are limited (Christensen, 2012). Bassemir (2018) suggested that the cost of IFRS
implementation can be divided into two types: direct and indirect costs. Direct costs deal with
setting up an IFRS project team, costs derived from adjusting software and accounting system,
27
costs on educating personnel with IFRS and costs with regard to increased communication
between parent companies and their subsidiaries. On the contrary, indirect costs refer to
proprietary costs. Since IFRS requires more extensive disclosure than NGAAP, private firms
would potentially reveal the proprietary information that can be used by competitors against
them.
The NASB (on their answer to the public consultation held by EC) suggests that complexity in
financial reporting is one of the costs associated with the IFRS implementation (European
Commission, 2017). This is consistent with the work of Jermakowicz and Gornik-Tomaszewski
(2006), in which the process of implementing IFRS is costly, complicated, and burdensome.
Implementation costs that can be gained when adopting IFRS are such cost obtained when
setting up an IFRS project team, hiring IFRS trained staff and training other staff such as IT
staff, internal audit and management, other costs like software and system change, tax advising
course, third party communication and additional external audit costs (PWC, 2006 and Institute
of Chartered Accountants in England and Wales (ICAEW, 2007) cited in Fox et al. (2013).
The study by Jermakowicz and Gornik-Tomaszewski (2006) conducted a survey questionnaire,
which is sent to the EU-listed companies in 2004. The results of this survey revealed the most
common challenges in IFRS adoption. These common challenges includes (1) complexity of
the nature of IFRS, (2) lack of implementation guidance, (3) lack of uniform interpretation,
unready final rules for the deadline date (2005), (4) impact on profit and loss account, (5) the
continuous debate about IAS 39, (6) dynamic change of IFRS, (7) the transformation of IASB
decisions in EU Regulations, (8) running of parallel accounting systems, (9) preparation of
comparative financial statements for the past years, (10) lack of IFRS knowledge of both
employees and auditors, (11) training of accounting staff and management, (12) difficulties on
change mindset of finance personnel, and (13) change of the IT systems. Consistent with the
latter study, Jermakowicz et al. (2007) also found that the complex nature, cost of adopting
IFRS, lack of guidance, and the increased volatility of earnings were among the most important
challenges faced by the German DAX-30 companies after applying IFRS. Besides, Fox et al.
(2013) explored the costs and benefits of IFRS implementation in the UK (including Ireland)
and Italy. Their study found that the interviewees considered the IFRS implementation process
as costly in both settings, despite the diversity of cost perceived across companies. Their
research also revealed that transition costs of IFRS imply a change in many systems (IT and
28
management systems) and processes depending on the nationality of the company, its size, and
its sector.
3.1.3 Summary
In Section 3.1.1 and 3.1.2, the proposed benefits and the expected costs of IFRS adoption have
been discussed. While some researchers have found that the specific benefits were improved,
other researchers disagreed. Observed evidence on benefits of adopting include reduction of
cost of capital (Kim et al., 2014; Li, 2010), improvement of comparability and transparency
(Barth et al., 2018; Carini et al., 2011; Jermakowicz & Gornik-Tomaszewski, 2006;
Jermakowicz et al., 2007), value relevance (Beisland & Knivsflå, 2015; Gjerde et al., 2008;
Stenheim & Madsen, 2017), quality of disclosure (Barth et al., 2008; Daske & Gebhardt, 2006;
Daske et al., 2013), analyst forecast following, and analyst forecast accuracy (Ashbaugh &
Pincus, 2001; Byard et al., 2011; Hope, 2003; Kim & Shi, 2012; Tan et al., 2011). Contrasting
research concerning cost of capital (Jermakowicz & Gornik-Tomaszewski, 2006),
comparability (Callao et al., 2007; Cole et al., 2011), value relevance (Callao et al., 2007;
Paananen, 2008), have also been examined.
Findings on the costs of implementing IFRS have been analyzed. Expected costs are typically
distinguished between direct and indirect costs (Bassemir, 2018). Several costs, such as
implementation, transition, and complexity of financial reporting, have been examined
(European Commission, 2017; Fox et al., 2013; Jermakowicz & Gornik-Tomaszewski, 2006;
Jermakowicz et al., 2007).
Having reviewed the literature concerning the benefits and costs of IFRS adoption, generally
to provide context for why companies may be motivated or not to adopt IFRS voluntarily, prior
studies concerning voluntary IFRS adoption around the world are now considered.
3.2 Voluntary IFRS adoption
In June 2000, the European Commission (EC) decided to mandate IFRS adoption in all EU
member states and the three other members of EEA: Norway, Liechtenstein, and Iceland. The
adoption of new accounting standards was formally proposed in February 2001, legally adopted
in June 2002, and mandated in 2005 (Christensen, 2012). According to Christensen (2012), the
adoption of IFRS Standards in the EU is distinguished as voluntary adoption when firms
29
adopted prior to 2000 and early adoption of mandatory regulation after 2000 but before 2005.
Then voluntary adoption after 2005 relates to unlisted firms not required to adopt IFRS at all.
This section will focus specifically on prior studies that have considered the voluntary adoption
of the IFRS accounting regime. Since this present study will focus on the Norwegian context,
this research further divided voluntary adoption as follows: early voluntary adoption of IFRS
(before it was mandated in 2005) and post-voluntary adoption of IFRS (after 2005).
3.2.1 Early voluntary adoption of IFRS (before 2005)
Academics internationally increasingly investigate the voluntary adoption of IFRS Standards.
These studies rely specifically on previous literature and not on theories. Prior literature on
early voluntary IFRS adoption reveals both economic consequences and the factors influencing
voluntary IFRS adoption. In a Japanese context, Cooke (1992) found that firm size, listing
status, and manufacturing industry sector significantly influences the voluntary adoption of
Japanese listed companies. Moreover, focusing on Multinational Corporations (MNCs) from
the US, UK, and Continental Europe, Meek, Roberts, and Gray (1995) revealed that firm size,
country/region, listing status, and industry are the most important factors influencing voluntary
adoption of IFRS. Moving to Switzerland’s context, conducting univariate analyses, Dumontier
and Raffournier (1998) showed evidence that size, listing status, auditor type, and ownership
diffusion have a positive influence on voluntary compliance with IFRS. Besides, no significant
influence found for leverage, profitability and capital intensity among Swiss listed companies.
Additionally, Cuijpers and Buijink (2005) analyzed the 1999 annual reports of companies listed
and domiciled in the EU. The evidence revealed that manufacturing industry sectors are more
likely to adopt IFRS voluntarily, whereas agriculture, forestry, fishing, mining, construction,
retail and wholesale industries are less likely to adopt IFRS voluntarily.
Gassen and Sellhorn (2006) explored the drivers of voluntary IFRS adoption by publicly traded
firms in Germany between 1998 and 2004. They concluded that size, international exposure,
dispersion of ownership, and recent IPOs are among the essential drivers of voluntary IFRS
adoption. A similar study conducted by Bora Senyiit (2014) analyzed the factors influencing
voluntary IFRS adoption by Turkish listed companies. The Turkish study, using the sample of
206 non-financial Turkish listed firms during the transition period (2003 – 2005), found that
size of the firm, international exposure, and the type of auditor is among the important drivers
of voluntary IFRS adoption in Turkey. In contrast, industry and leverage do not have any
statistical significance on voluntary IFRS adoption.
30
Barth et al. (2008) explored the effects of voluntary adoption using an international sample
from 21 countries consisting of 1,896 firm-year observations for 327 firms that adopted IFRS
between 1994 and 2003. They found that IFRS firms have higher accounting quality than firms
that do not comply with IFRS. In particular, their study revealed that early IFRS adopters
exhibit lower levels of earnings management, more timely loss recognition, and more enhanced
value relevance of accounting amounts. Germany, as one of the early voluntary adopters of
IFRS, serves as an excellent setting to study. Christensen, Lee, Walker, and Zeng (2015)
considered this opportunity and find evidence that voluntary adoption of IFRS is associated
with reduced earnings management, increased timely loss recognition and increased value
relevance, which is in line with the findings derived by Barth et al. (2008).
Furthermore, Hellman (2011) studied the impact of IFRS on financial statements in Sweden
using a sample of 132 largest Swedish listed companies during 1991-2004. He argued that the
Swedish pre-2005 adoption was “soft,” which involves national deviations from IFRS and weak
enforcement institutions. He concluded that voluntary adoption of IFRS indicates that firms, on
average, used the flexibility offered by the soft adoption regime to manage earnings and
shareholders’ equity.
In addition, Kim and Shi (2012) investigated the economic consequences of voluntary adoption
of the IFRS accounting regime based on firm-level data from 34 countries over the period of
1998 to 2004. Using stock price synchronicity as a measure of firm-specific information in
stock prices, Kim and Shi (2012) found that stock prices incorporate more firm-specific
information for voluntary IFRS adopters than local GAAP entities. Daske (2006) investigated
the IFRS adoption in German companies between 1993 and 2004. The findings of his study
found no reliable evidence that the cost of equity capital has lowered under the voluntary
adoption of IFRS. Another study conducted by Daske et al. (2013) examined the liquidity and
cost of capital effects around voluntary IFRS adoption. They focused on the firm-level
heterogeneity in the economic consequences of IFRS adoption, which recognizes that firms
have substantial discretion in how they implement the new accounting standards. The findings
of their study showed little evidence that voluntary IFRS adoption is associated with an
improvement in market liquidity or a drop in the cost of capital. However, serious adopters
experience more potent effects on their cost of capital and market liquidity than label adopters.
Their study also suggested that the quality of financial reporting has improved under the IFRS
regime for some firms.
31
3.2.2 Post-voluntary adoption of IFRS (after 2005)
Researchers on post- voluntary adoption, similar to the early voluntary adoption of IFRS, report
several findings of the economic consequences and drivers of voluntary adoption. Francis,
Khurana, Martin, and Pereira (2008) investigated the factors influencing voluntary IFRS
adoption through a survey-based research design using a sample of 3,722 private small and
medium-sized enterprises (SMEs) from 56 countries worldwide. The findings revealed that
both firm-specific factors such as contracting incentives (measured by firms’ characteristics
that proxy for expected future growth opportunities, current external financing, foreign owners,
export sales, firm size, and corporate ownership structure) and country-level institutional
factors matter in the voluntary IFRS adoption decision. Further, André et al. (2012) analyzed a
sample of 8,417 medium-to-large UK unlisted firms in 2009 in order to examine the
determinants of voluntary adoption. Their evidence showed that internationality, leverage, firm
size, and auditor reputation have a positive impact on the firm’s decision to adopt IFRS
voluntarily. In contradiction, other firm characteristics such as profitability, capital intensity,
manufacturing industry, financial industry, growth, ownership structure, and employee
productivity do not influence the decision of unlisted UK firms to adopt IFRS voluntarily.
Moreover, Matonti and Iuliano (2012) also investigated the determinants of voluntary IFRS
adoption but focus on Italian private firms. The results revealed that Italian private firms are
more likely to adopt IFRS voluntarily when they are more leveraged and when their parent
company complies with IFRS. However, Matonti and Iuliano (2012) argued that firm size,
auditor type, and industry type are factors that do not influence the voluntary adoption of IFRS,
which contradicts the results of the study of André et al. (2012). Another study in the Italian
context was conducted by Di Fabio (2018). She focused her study on which firm-level factors
are associated with unlisted company’s choice to apply IFRS, instead of private firms. From
analyzing a sample of 2,915 firms between 2007 to 2015, this study suggested the significance
of firm size (not in line with the study of Matonti and Iuliano (2012)), foreign ownership, and
capital intensity on the voluntary IFRS adoption decision of the unlisted Italian firms. The
differences in the result concerning firm size from the same settings occurred, presumably
because the samples are from different groups. Matonti and Iuliano (2012) examined
unconsolidated accounts of private firms in Italy. Private firms can only comply with IFRS
voluntarily if they are large enough to prepare a separate company accounts, so their sample is
more likely to be large private firms. On the other hand, Di Fabio (2018) focused on unlisted
companies that prepare consolidated and separate financial statements at the same time. She
32
also found that in Italy, leveraged firms are more likely to adopt IFRS, which is consistent with
the findings of Matonti and Iuliano (2012). In addition, she found that firms in a financial and
economic distress situation are likely to adopt IFRS voluntarily.
Berner and Olving (2013) conducted a descriptive analysis of the prevalence of IFRS in the
Norwegian context. The results of their descriptive analysis showed that industry type
positively relates to the voluntary adoption of IFRS. Mainly, industries like financial &
insurance, oil & gas, shipping, manufacturing, and retails are more likely to adopt IFRS
voluntarily. Additionally, Bassemir (2018) extended the literature on the determinants of IFRS
adoption, focusing on nearly 3,000 German private firms preparing consolidated financial
statements between 1998 and 2010. The findings revealed that firms are more likely to comply
with IFRS when they are larger, have higher growth opportunities, have more leverage, are
externally rated, are more international, are audited by a ‘Big Five’ auditor, are seeking to raise
capital by issuing public bonds or equity and have the legal form of a stock corporation.
Moreover, Haapamäki (2018) examined the firm-specific incentives in three European
countries (Ireland, Poland, and the UK). The findings revealed that large unlisted firms that are
profitable and have foreign owners are more likely to adopt IFRS voluntarily.
Some researchers and academics have also explored the economic consequences of the
voluntary adoption of IFRS. In the South Korean setting (Chung & Park, 2017), mandatory
adoption of IFRS took place in 2011 for South Korean listed companies. Their findings showed
that the financial statements of listed companies are less comparable with unlisted companies.
Chung and Park (2017) conducted an empirical study using a probit model to test whether
unlisted companies in industries with higher ratios of listed companies are more likely to adopt
IFRS voluntarily and find evidence of a positive result. This study also provided empirical
evidence that the unlisted firms who voluntarily adopt IFRS tend to attract greater investment
in the public debt market.
Barth et al. (2018), utilized matched sample research design (samples of non-US companies
that adopt IFRS voluntarily matched with firms of similar size in their country of origin and
industry that either adopted IFRS before them or not adopting IFRS at all), found that after
firms voluntarily adopt IFRS, their financial accounting numbers become more comparable to
those of companies that adopted IFRS before them and less comparable to those of companies
that do not comply IFRS. Moreover, Barth et al. (2018) also presented evidence that voluntary
33
adopters generally gained capital market benefits such as liquidity, share turnover, and firm-
specific information parallel to both adopted and non-adopting companies.
3.2.3 Summary
Different research studies of voluntary IFRS adoption from different settings have been
conducted by several researchers and academics. Section 3.2.1 and 3.2.2 examined the
voluntary IFRS adoption, especially early and post-voluntary adoption. Several academics and
researchers have focused their study on the economic consequences of voluntary IFRS
adoption, while some have focused on its determinants. Among the economic consequences of
voluntary IFRS adoption were lower earnings management, increased timely loss recognition
and value relevance (Barth et al., 2008; Christensen et al., 2015), costs of equity (Daske, 2006;
Daske et al., 2013), enhanced comparability (Barth et al., 2018; Chung & Park, 2017).
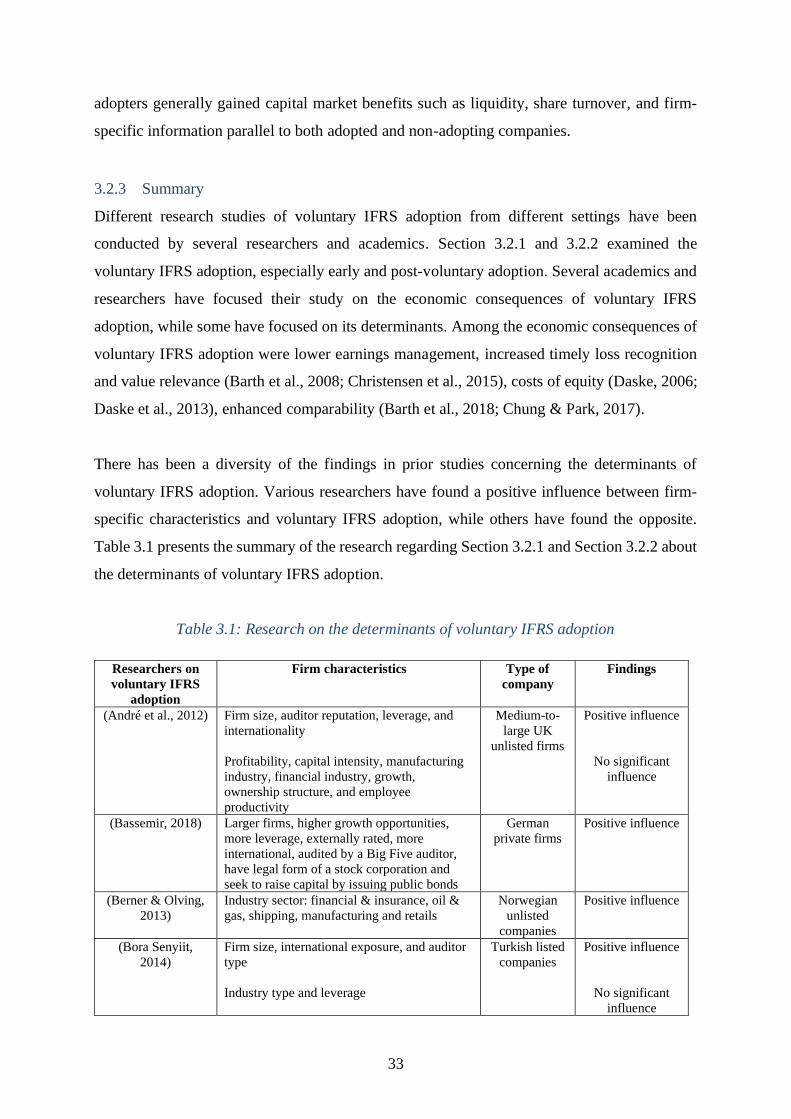
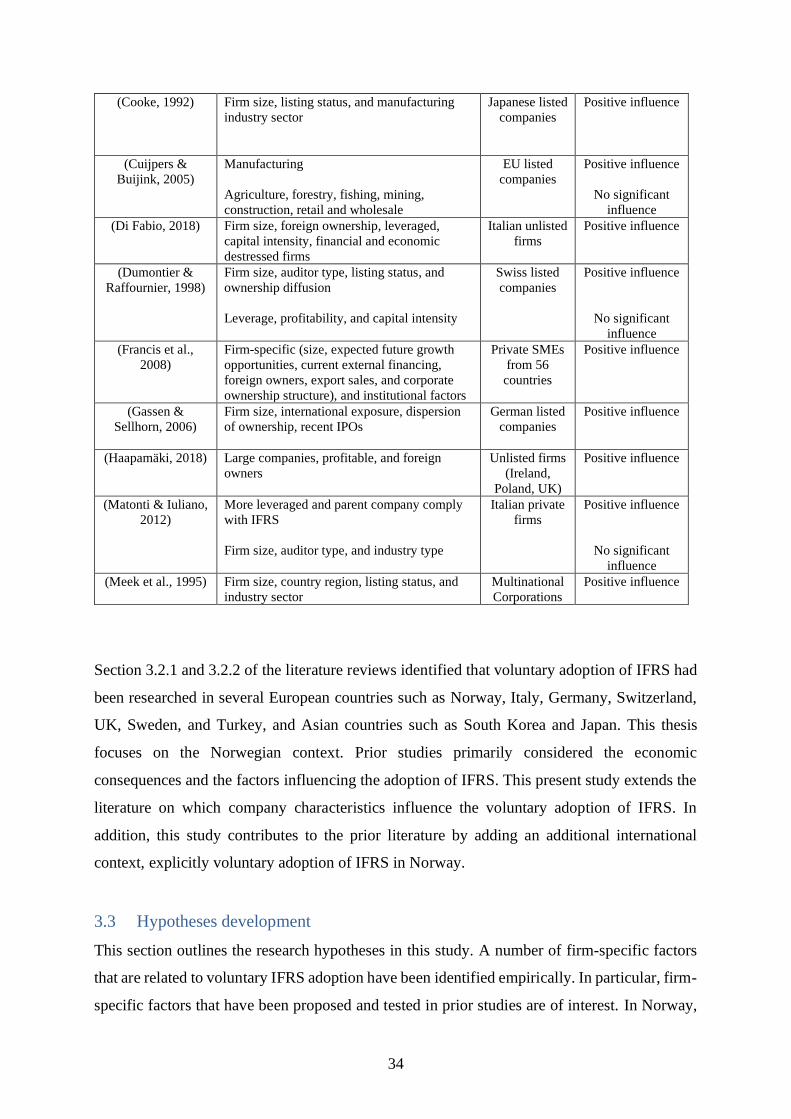
There has been a diversity of the findings in prior studies concerning the determinants of
voluntary IFRS adoption. Various researchers have found a positive influence between firm-
specific characteristics and voluntary IFRS adoption, while others have found the opposite.
Table 3.1 presents the summary of the research regarding Section 3.2.1 and Section 3.2.2 about
the determinants of voluntary IFRS adoption.
Table 3.1: Research on the determinants of voluntary IFRS adoption
Researchers on
voluntary IFRS
adoption
Firm characteristics Type of
company
Findings
(André et al., 2012) Firm size, auditor reputation, leverage, and
internationality
Profitability, capital intensity, manufacturing
industry, financial industry, growth,
ownership structure, and employee
productivity
Medium-to-
large UK
unlisted firms
Positive influence
No significant
influence
(Bassemir, 2018)
Larger firms, higher growth opportunities,
more leverage, externally rated, more
international, audited by a Big Five auditor,
have legal form of a stock corporation and
seek to raise capital by issuing public bonds
German
private firms
Positive influence
(Berner & Olving,
2013)
Industry sector: financial & insurance, oil &
gas, shipping, manufacturing and retails
Norwegian
unlisted
companies
Positive influence
(Bora Senyiit,
2014)
Firm size, international exposure, and auditor
type
Industry type and leverage
Turkish listed
companies
Positive influence
No significant
influence
34
(Cooke, 1992)
Firm size, listing status, and manufacturing
industry sector
Japanese listed
companies
Positive influence
(Cuijpers &
Buijink, 2005)
Manufacturing
Agriculture, forestry, fishing, mining,
construction, retail and wholesale
EU listed
companies
Positive influence
No significant
influence
(Di Fabio, 2018)
Firm size, foreign ownership, leveraged,
capital intensity, financial and economic
destressed firms
Italian unlisted
firms
Positive influence
(Dumontier &
Raffournier, 1998)
Firm size, auditor type, listing status, and
ownership diffusion
Leverage, profitability, and capital intensity
Swiss listed
companies
Positive influence
No significant
influence
(Francis et al.,
2008)
Firm-specific (size, expected future growth
opportunities, current external financing,
foreign owners, export sales, and corporate
ownership structure), and institutional factors
Private SMEs
from 56
countries
Positive influence
(Gassen &
Sellhorn, 2006)
Firm size, international exposure, dispersion
of ownership, recent IPOs
German listed
companies
Positive influence
(Haapamäki, 2018)
Large companies, profitable, and foreign
owners
Unlisted firms
(Ireland,
Poland, UK)
Positive influence
(Matonti & Iuliano,
2012)
More leveraged and parent company comply
with IFRS
Firm size, auditor type, and industry type
Italian private
firms
Positive influence
No significant
influence
(Meek et al., 1995)
Firm size, country region, listing status, and
industry sector
Multinational
Corporations
Positive influence
Section 3.2.1 and 3.2.2 of the literature reviews identified that voluntary adoption of IFRS had
been researched in several European countries such as Norway, Italy, Germany, Switzerland,
UK, Sweden, and Turkey, and Asian countries such as South Korea and Japan. This thesis
focuses on the Norwegian context. Prior studies primarily considered the economic
consequences and the factors influencing the adoption of IFRS. This present study extends the
literature on which company characteristics influence the voluntary adoption of IFRS. In
addition, this study contributes to the prior literature by adding an additional international
context, explicitly voluntary adoption of IFRS in Norway.
3.3 Hypotheses development
This section outlines the research hypotheses in this study. A number of firm-specific factors
that are related to voluntary IFRS adoption have been identified empirically. In particular, firm-
specific factors that have been proposed and tested in prior studies are of interest. In Norway,
35
almost 67 % of the companies have no employees, while only 17 % of the companies have
greater than five employees (SSB, 2020a). It would be interesting to examine if firm size
matters, even if 99 % of the Norwegian companies are classified as SMEs when selecting IFRS
as the basis for reporting financial accounts. “Big Five” auditing firms in Norway are typically
used by Norwegian companies (Berner & Olving, 2013). It is relevant to examine if the unlisted
companies are audited by the “Big Five” report under IFRS because every companies would
seek to have credible financial information. That credibility can be enhanced if Big Five
auditing firms, with good reputation, audit their financial accounts. The industry factor is also
of interest to examine because industries like oil & gas (Norway as one of the distributors of
Oil internationally), telecommunication & information, and finance & insurance generally deal
with international market. Thus, reporting under IFRS would give investors and other users of
financial statements more comparable and transparent accounting information. Therefore, this
study used firm size, industry, and auditor type as firm-specific independent variables to capture
the factors influencing the voluntary IFRS adoption in the Norwegian setting. The overarching
research hypothesis is stated as:
“Certain company characteristics relate the voluntary adoption of IFRS standards in
Norway.”
Unlisted companies make up most of all firms in Norway (99.7%). As previously mentioned in
Section 1.1, the IFRS accounting policy is not only mandated on consolidated financial
accounts of Norwegian listed companies but also permits Norwegian unlisted companies to
adopt it. As a result, voluntary IFRS adoption for unlisted companies has been rising and has
been popularly debated among standard setters and regulators in recent years (Jermakowicz &
Gornik-Tomaszewski, 2006). Nevertheless, the number of unlisted companies reporting their
financial statements in accordance with NGAAP is expected to be significantly higher than
IFRS. Yet, the number of unlisted companies adopting IFRS is increasing. In the proceeding
sub-sections, the characteristics of firms that adopt IFRS voluntarily are now considered. This
study tests the determinants of voluntary IFRS adoption empirically. The following presents
the development of the research hypotheses for each company characteristic.
3.3.1 Firm size
Prior studies showed that firm size matters in the change of accounting standards from national
GAAP to IFRS. Firm size is commonly used as the independent variable in studies investigating
36
factors influencing the voluntary IFRS adoption of unlisted companies. Most of the prior studies
found significant evidence that firm size positively influences the voluntary IFRS adoption of
listed and unlisted companies (André et al., 2012; Bassemir, 2018; Bora Senyiit, 2014; Di
Fabio, 2018; Meek et al., 1995). In general, large companies may have lower information
production costs, and lower costs of competitive disadvantage associated with their disclosure
(Meek et al., 1995). Larger companies are also more open to international market, especially
when they are planning to expand their business abroad. Moreover, large companies may have
the financial resources that allows them to voluntarily adopt new accounting regime (André et
al., 2012).
Consequently, it is expected that larger unlisted companies gain net benefits by switching from
local GAAP to IFRS since it will be less costly for them to make more disclosure because they
also produce accounting information for internal purposes (André et al., 2012; Dumontier &
Raffournier, 1998; Haapamäki, 2018; Kvaal & Nobes, 2010). This study tested this empirically
to see if the size of Norwegian unlisted companies matters on voluntarily choosing IFRS as the
basis of their financial reporting. It would be interesting to know if how firm size relates to
voluntary IFRS adoption. This research measures the firm size using two different
measurements: employees and turnover. Thus, this thesis hypothesizes that:
H1: Voluntary adoption of IFRS by unlisted companies is related to the firm size by
employees.
H2: Voluntary adoption of IFRS by unlisted companies is related to the firm size by
turnover
3.3.2 Industry sector
Prior research argues that the level of voluntary adoption of IFRS differs between industries
because of the industry-specific accounting regulation, the nature of their products, their
research & development, as well as competitive pressures (Cooke, 1992; Meek et al., 1995).
These factors may also cause industry differences in the costs and benefits of adopting IFRS
(André et al., 2012; Matonti & Iuliano, 2012). Several studies find evidence that industry type
influences the voluntary adoption of IFRS (Berner & Olving, 2013; Cooke, 1992; Cuijpers &
Buijink, 2005; Meek et al., 1995). In particular, manufacturing (Cooke, 1992), transportations,
communications (Cuijpers & Buijink, 2005), oil & gas (Cuijpers & Buijink, 2005) industries
are more likely to adopt IFRS voluntarily. On the other hand, André et al. (2012) have not found
37
significant evidence that the manufacturing and financial industry influence the voluntary
adoption of IFRS by unlisted firms. Likewise, Matonti and Iuliano (2012) have found no
evidence that the industry sector is a driver of IFRS voluntary adoption. In this thesis, it is
expected that voluntary IFRS adoption by unlisted firms may vary across industries. With that,
it is likely that:
H3: Voluntary adoption of IFRS by unlisted companies is related to the industry sector.
3.3.3 Audit firm
In Norway, audit firms can be classified as the “Big Five” and “non-big five.” The big five
refers to BDO, Deloitte, Ernst & Young (EY), KPMG, and Pricewaterhouse Coopers (PwC). It
has been argued that large and well-known audit firms influence the accounting choice of
reporting companies (Berner & Olving, 2013; Bora Senyiit, 2014; Dumontier & Raffournier,
1998; Matonti & Iuliano, 2012). In particular, Big Five auditing firms have significant expertise
and strong specialization in IFRS adoption, and their personnel is better trained in terms of
auditing IFRS standards (Bassemir, 2018; Bora Senyiit, 2014). Hence, it is likely that:
H4: Voluntary adoption of IFRS by unlisted companies is related to the audit firm.

38
39
4 Methodology
The purpose of this chapter is to explain the methods applied in analyzing the research
hypotheses. The methods and principles used are critically discussed and evaluated to answer
the research hypotheses in the best possible way. At the same time, the readers could evaluate
the strengths and weaknesses of the analysis.
4.1 Research philosophy
This section outlines the four types of research philosophy. According to Dudovskiy (2018),
there are four types of research philosophy: pragmatism, positivism, interpretivism and realism.
Saunders, Lewis, and Thornhill (2019) point out that being pragmatics is to recognize that there
are enormous ways of interpreting the world and undertaking research. Moreover, there is no
single point of view that can ever give the entire picture and realities may be multiple. Sekaran
and Bougie (2016) also describe pragmatism as research that can be based on both objectives,
observable phenomena, and subjective meanings, which can create meaningful and useful
knowledge.
The main idea of positivism is that there is only one truth: only factual knowledge gained
through observation is trustworthy (Dudovskiy, 2018; Sekaran & Bougie, 2016). The research
findings in positivism philosophy are usually observable and quantifiable. It assumes that the
only way people can be positive that the knowledge is true is if it was discovered using the
scientific method by generating hypotheses to explain a phenomenon (Sue, 2018). Interpretivist
(constructivism), on the contrary, believes that there is no single truth, such that they have
different explanation for everything. Constructivism emphasizes qualitative analysis rather than
quantitative analysis (Sekaran & Bougie, 2016).
Lastly, realism research philosophy depends on the idea of independence of reality from
people’s minds. It is based on the assumption of a scientific approach to the development of
knowledge. There are two types of realism research philosophy, direct and critical. Direct
realism is defined as “what you see is what you get” and sees the world through personal human
senses. On the other hand, critical realism contends that humans do experience the sensations
and images of the real world, which can be deceptive. Opposite to direct realism, critical realism
does not portray the real world.
40
According to Sekaran and Bougie (2016), there are two ways of doing research, the inductive
approach and deductive approach. Inductive reasoning is defined by (Sekaran & Bougie, 2016)
as a process of observing a specific phenomenon to provide generalizations about that
phenomenon. It is often called as ‘bottom-up’ reasoning (Horn, 2012). Conversely, the
deductive approach works the other way around, from the more general to the more specific.
Deductive reasoning is often known as ‘top-down’ reasoning (Horn, 2012). Deductive
approaches are typically used in causal and quantitative research, while inductive approaches
are frequently used in exploratory and qualitative research (Sekaran & Bougie, 2016).
This study applied a deductive approach where prior literature about the chosen subject is being
described first and then analyzed how it is used in practice. This study did not rely on the
theories but instead on previous literature of the chosen topic, which is the voluntary adoption
of unlisted companies, specifically, the determinants of voluntary IFRS adoption. As this
research applied a deductive approach, the philosophy of positivism is appropriate research
philosophy for this study as it employs deductive laws and quantitative methods to get at the
truth.
4.2 Research strategies and methods
This section outlines the research strategy and research method used in collecting data.
Research strategy can be divided into three types: qualitative, quantitative, and mixed methods
(Creswell & Creswell, 2018).
A qualitative research strategy is about meanings and understandings and is more concerned
about how people express their feelings, beliefs, assumptions, desires, and understandings
(Horn, 2012). The primary qualitative research data will be words, but it could also be a video
or audio material (Johannessen, Christoffersen, & Tufte, 2011). Qualitative data are not
immediately quantifiable unless coded and categorized in some way (Sekaran & Bougie, 2016).
According to Johannessen et al. (2011), quantitative research is appropriate for data that comes
in number. Quantitative research assesses research problems via statistical, mathematical, or
computational techniques (Horn, 2012). It has a more systematic and scientific design which
able to test the causal relationship between the variables. Quantitative studies mainly examine
the relationship between numerically measured variables and the application of statistical
techniques (Dudovskiy, 2018). This approach is suitable, mainly if the research problem is
41
aimed to analyze factors that influence an outcome (dependent variable) or in testing hypotheses
(Creswell & Creswell, 2018).
A mixed-methods strategy is the combination or integration of qualitative and quantitative
research and data in a research study. It is also called “multiple methods” and is based on the
idea that all methods had biases and weaknesses. The combination of qualitative and
quantitative data helps to neutralize these biases and weaknesses (Creswell & Creswell, 2018).
Based on the purpose of the study, which is to gain understanding in a complex topic (IFRS),
as well as test and verify events based on facts and hypotheses (empirical), it is appropriate to
use a quantitative research strategy. The reason is that this study aims to analyze and to gain a
deeper understanding of the factors influencing the voluntary adoption of IFRS in Norway.
The theory about empirical methods is usually classified between two forms of information,
primary data and secondary data. Primary data involves data collection from original sources
for the specific purpose of the study. On the other hand, researchers that use secondary data do
not need to collect them because they are already available (Sekaran & Bougie, 2016). Some
examples of secondary data are books, research papers, statistics, and financial statements. This
study is based on a review of secondary data. Financial statements of the unlisted companies
used in the empirical analysis are carefully examined to gain information about the accounting
regime used by each unlisted company. Secondary data is suitable for the study because the
data is already available. Since this research aims to analyze which factors influence the
voluntary adoption of IFRS, secondary data such as financial statements, prior research studies,
company information were collected.
4.3 Sample selection and data collection
This section outlines how the data is being collected and describes the sample selection. Various
researchers have examined the appropriate methods in choosing the right sample size (Horn,
2012; Sekaran & Bougie, 2016). The sampling method can be distinguished between
probability sampling and non-probability sampling. While probability sampling uses random
selection and is a commonly used method when inductive reasoning drives the methodology,
non-probability sampling do not involve any random selection and is commonly used method
when deductive reasoning drives the methodology (Horn, 2012). Non-probability sampling is
being used in this research because it fits the research approach (deductive) and available data.
42
4.3.1 Research sample selection
This study is based on the largest companies in Norway in terms of turnover in fiscal year 2018,
which is already available at the company information registry named Largest Companies
(Largestcompanies, 2020b). Largest Companies is a website that delivers a high-quality market
information. This website connect Nordic companies though e-mail marketing display and
keyword advertising (Largestcompanies, 2020a). In addition, it was possible to get a list of all
the companies for this thesis in Brønnøysund Register Center, which you have to pay for it.
However, due to limited financial resources of this study, this research is entirely based on the
top largest companies as their data was already available with no expense.
The sample covers Norwegian unlisted companies for the year of 2018. All data refer to
unconsolidated financial statements of the same year. The information concerning each
company’s accounting regime is taken from their separate company account (unconsolidated
financial statements) because not all unlisted companies have subsidiaries that reports
consolidated accounts. As previous studies focus on consolidated accounts of listed firms,
research on unconsolidated financial statements of unlisted companies is scarce because IFRS
adoption is not yet permitted to unconsolidated accounts by several countries. This research
took the top 1,429 companies across the 11 main sectors in Norway: retail, oil & gas,
telecommunication & information, health services, financial & insurance, construction,
manufacturing, accommodation & food services activities, education, and real estate (Chaffey,
2017), which is equal to 1,429 companies. These main sectors are classified in terms of the
number of employees, value-added to Gross Domestic Product (GDP), and sales figures
(Chaffey, 2017). Among 1,429 companies, the listed companies were eliminated because they
are required to adopt IFRS. The number of listed companies in that 1,429 companies is 34
companies, which leave 1,395 companies that are unlisted that can if they want to voluntarily
adopt IFRS that are not obliged to adopt IFRS. Despite these 1,429 companies being the “largest
companies” in Norway, the distribution of the companies’ size between small, medium, and
large is quite even by employee size in terms of voluntary IFRS adoption, with a percentage of
38.04 %, 28.26 %, and 33.70 %, respectively. In contrast, the distribution of companies that
voluntarily adopt IFRS is not even by turnover, which has a percentage of 13.04 %, 27.17 %,
and 59.78 % for small, medium, and large companies. Table 4.1 shows the breakdown of the
selected sample from these main sectors in Norway.
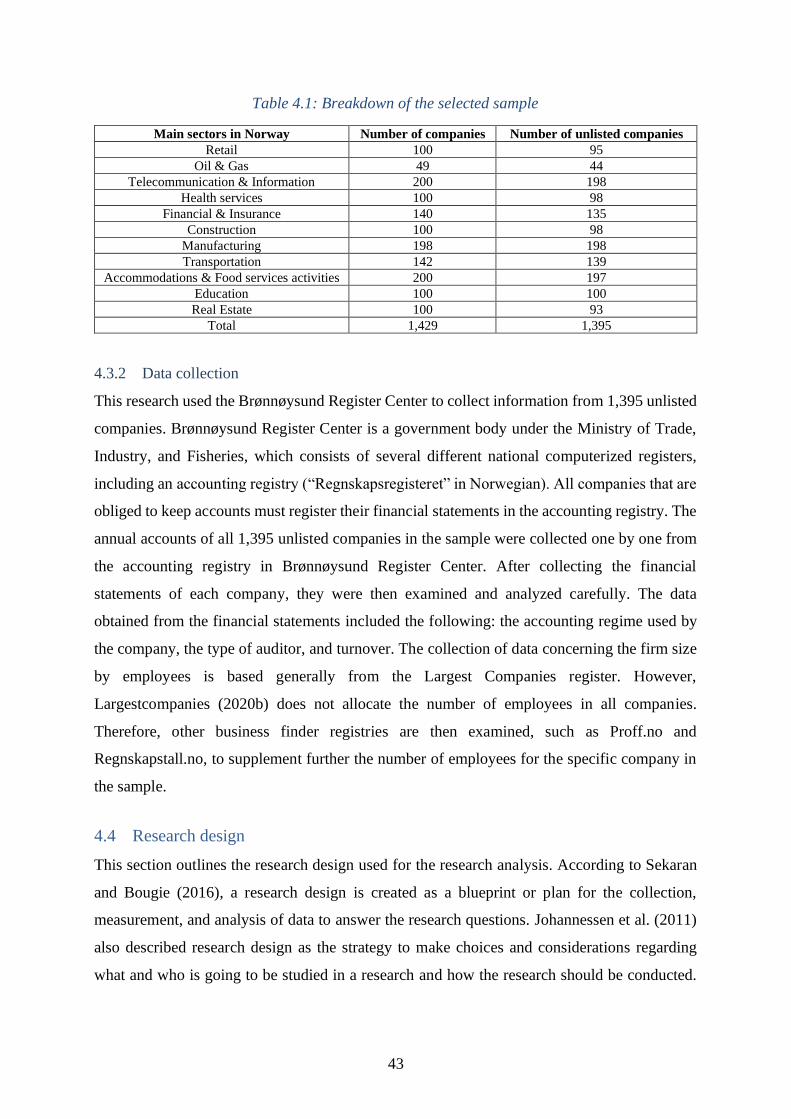
43
Table 4.1: Breakdown of the selected sample
Main sectors in Norway Number of companies Number of unlisted companies
Retail 100 95
Oil & Gas 49 44
Telecommunication & Information 200 198
Health services 100 98
Financial & Insurance 140 135
Construction 100 98
Manufacturing 198 198
Transportation 142 139
Accommodations & Food services activities 200 197
Education 100 100
Real Estate 100 93
Total 1,429 1,395
4.3.2 Data collection
This research used the Brønnøysund Register Center to collect information from 1,395 unlisted
companies. Brønnøysund Register Center is a government body under the Ministry of Trade,
Industry, and Fisheries, which consists of several different national computerized registers,
including an accounting registry (“Regnskapsregisteret” in Norwegian). All companies that are
obliged to keep accounts must register their financial statements in the accounting registry. The
annual accounts of all 1,395 unlisted companies in the sample were collected one by one from
the accounting registry in Brønnøysund Register Center. After collecting the financial
statements of each company, they were then examined and analyzed carefully. The data
obtained from the financial statements included the following: the accounting regime used by
the company, the type of auditor, and turnover. The collection of data concerning the firm size
by employees is based generally from the Largest Companies register. However,
Largestcompanies (2020b) does not allocate the number of employees in all companies.
Therefore, other business finder registries are then examined, such as Proff.no and
Regnskapstall.no, to supplement further the number of employees for the specific company in
the sample.
4.4 Research design
This section outlines the research design used for the research analysis. According to Sekaran
and Bougie (2016), a research design is created as a blueprint or plan for the collection,
measurement, and analysis of data to answer the research questions. Johannessen et al. (2011)
also described research design as the strategy to make choices and considerations regarding
what and who is going to be studied in a research and how the research should be conducted.
44
Ghauri and Grønhaug (2010) defined three types of research design: exploratory, causal, and
descriptive.
Exploratory research design is used when there is limited prior knowledge about a particular
phenomenon, and the topic is highly complex. It is also typically used when existing research
results are uncertain or suffer from significant limitations. Exploratory research is flexible in
nature and often depends on secondary data and qualitative approaches to data gathering like
an informal discussion with consumers, employees or managers, and more formal data
gatherings like interviews, focus groups ,or case studies (Sekaran & Bougie, 2016).
Causal research design tests whether or not one variable causes another variable to change.
According to Sekaran and Bougie (2016), all four conditions should be met to establish a causal
relationship:
• Covariation of the independent and the dependent variable
• The independent variable should precede the dependent variable
• No other factor that can cause a change in the dependent variable,
• A logical explanation must be in place and explain why the independent variable affects
the dependent variable.
A descriptive research design is used when the study aims to obtain data that describes the topic
of interest. In particular, descriptive research is usually designed to collect data that describe
characteristics of objects, events, or situations. Descriptive design is either quantitative or
qualitative in nature. Examples of quantitative descriptive research design involve the
collection of data such as satisfaction ratings, production figures, sales figures, or demographic
data. While qualitative descriptive research design may describe how consumers go through a
decision-making process or examine how managers resolve conflicts in organizations,
descriptive studies may help the researcher better understand the characteristics of a group in a
given situation (Sekaran & Bougie, 2016).
Since this study aims to understand the company characteristics that influence the voluntary
adoption of IFRS in Norway, a descriptive research design is adopted. This thesis follows a
quantitative research strategy; as a result, it is beneficial to use a descriptive research design
because it works in both quantitative and qualitative research strategies.
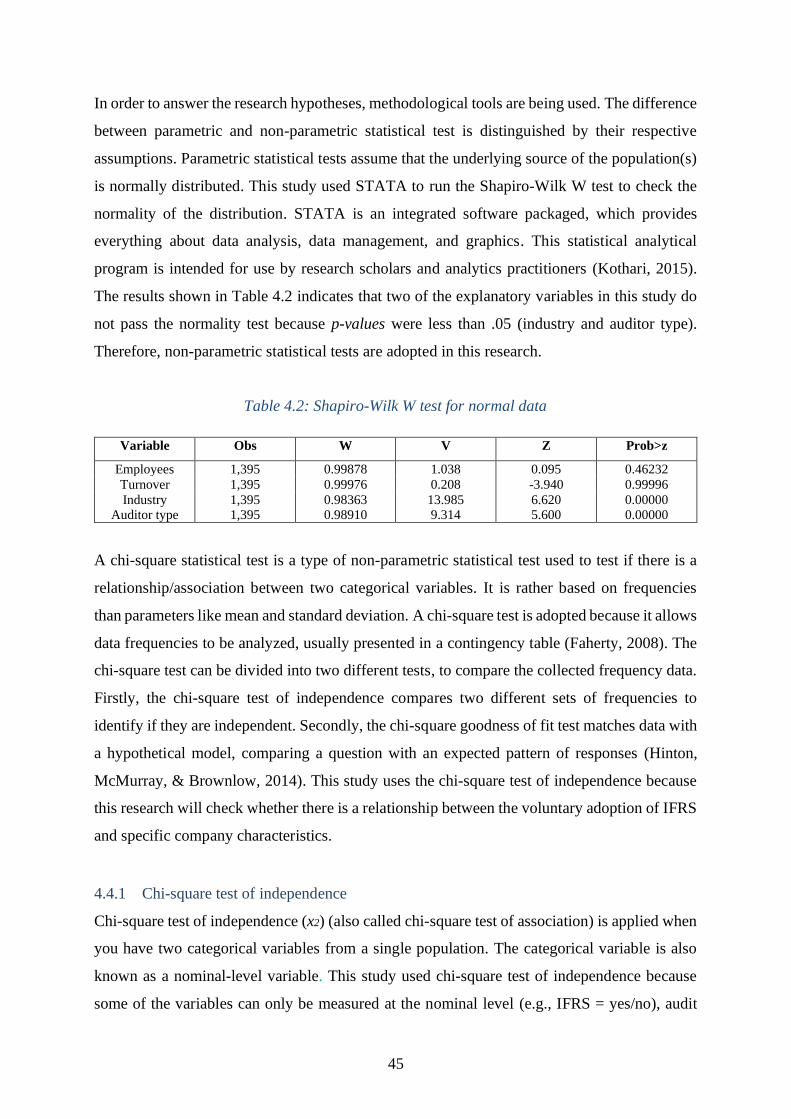
45
In order to answer the research hypotheses, methodological tools are being used. The difference
between parametric and non-parametric statistical test is distinguished by their respective
assumptions. Parametric statistical tests assume that the underlying source of the population(s)
is normally distributed. This study used STATA to run the Shapiro-Wilk W test to check the
normality of the distribution. STATA is an integrated software packaged, which provides
everything about data analysis, data management, and graphics. This statistical analytical
program is intended for use by research scholars and analytics practitioners (Kothari, 2015).
The results shown in Table 4.2 indicates that two of the explanatory variables in this study do
not pass the normality test because p-values were less than .05 (industry and auditor type).
Therefore, non-parametric statistical tests are adopted in this research.
Table 4.2: Shapiro-Wilk W test for normal data
Variable Obs W V Z Prob>z
Employees 1,395 0.99878 1.038 0.095 0.46232
Turnover 1,395 0.99976 0.208 -3.940 0.99996
Industry 1,395 0.98363 13.985 6.620 0.00000 Auditor type 1,395 0.98910 9.314 5.600 0.00000
A chi-square statistical test is a type of non-parametric statistical test used to test if there is a
relationship/association between two categorical variables. It is rather based on frequencies
than parameters like mean and standard deviation. A chi-square test is adopted because it allows
data frequencies to be analyzed, usually presented in a contingency table (Faherty, 2008). The
chi-square test can be divided into two different tests, to compare the collected frequency data.
Firstly, the chi-square test of independence compares two different sets of frequencies to
identify if they are independent. Secondly, the chi-square goodness of fit test matches data with
a hypothetical model, comparing a question with an expected pattern of responses (Hinton,
McMurray, & Brownlow, 2014). This study uses the chi-square test of independence because
this research will check whether there is a relationship between the voluntary adoption of IFRS
and specific company characteristics.
4.4.1 Chi-square test of independence
Chi-square test of independence (x2) (also called chi-square test of association) is applied when
you have two categorical variables from a single population. The categorical variable is also
known as a nominal-level variable. This study used chi-square test of independence because
some of the variables can only be measured at the nominal level (e.g., IFRS = yes/no), audit
46
firm and industry). Unlike any other statistical tests, the chi-square test of independence
provides information not just on the significance of any observed differences, but also provides
detailed information on precisely which categories account for any differences found. Certain
assumptions of the chi-square test are to be passed to perform the test adequately (McHugh,
2013):
• The expected value of all cells should be five or higher when testing for a 2x2
contingency table; otherwise, it is more appropriate to use the fisher’s exact test. While
in any larger contingency table (e.g., 2x3, 3x3), 80% or more of the expected values
should be five or more. It indicates that if either independent or dependent variable has
a large number of categories (i.e., three or more), then you should have a reasonably
large enough number of observations in the sample (Faherty, 2008).
• There should be two categorical variables, usually at a nominal level, and variables
should be independent.
• The data in the cells should be frequencies rather than percentages.
• All observations in the sample must be independent, meaning there should be no
relationship exists between the variables.
Assumption check on the sample:
Firm size by employees
The assumption concerning expected frequencies is not violated; all cells are greater than 5;
therefore, the chi-square test of independence is conducted (see Table 5.4).
Firm size by turnover
Table 5.6 shows that all expected frequencies are higher than 5. As a result, the chi-square test
of independence can be use in further analysis.
Industry
To meet the assumption that 80 % of the expected frequency should have values equal to five
or more, Table 5.8 should have (22 x .80 = 17.6 rounded to 18) 18 cells with expected values
equal to five or more. Table 5.8 shows that there are 21 expected frequencies greater than five;
therefore, it does not violate the 80% expected frequency assumption. The chi-square test of
independence can be used.
47
Auditor type
To meet the assumption that 80 % of the expected frequency have values equal to five or more,
Table 5.10 should have (12 x .80 = 9.6 rounded to 10) 10 cells with expected values equal to
five or more. Table 5.10 reveals that all expected frequencies are greater than five; therefore, it
does not violate the 80 % expected frequency assumption. Accordingly, the chi-square test of
independence is conducted.
Table 4.3 summarizes if the assumptions concerning expected frequency are violated or not
violated in this study.
Table 4.3: Expected cell frequency assumptions
Variables Contingency table Expected value
Firm size by employees 3x2 Not violated
Firm sized by turnover 3x2 Not violated
Industry sector 11x2 Not violated
Audit firm 6x2 Not violated
Chi-square test of independence set up the following hypothesis:
H0: The two categorical variables are independent.
HA: The two categorical variables are related.
Below are the null hypothesis and alternative hypothesis for the independent variable – firm
size by employees and firm size by turnover:
H0: The two categorical variables are independent (that is, firm size has no influence on
the voluntary adoption of IFRS).
HA: The two categorical variables are related (that is, firm size has an influence on the
voluntary adoption of IFRS).
The null hypothesis and alternative hypothesis for the independent variable – industry sector
are as follows:
H0: The two categorical variables are independent (that is, the industry sector has no
influence on the voluntary adoption of IFRS).
HA: The two categorical variables are related (that is, the industry sector has an influence
on the voluntary adoption of IFRS).
The null hypothesis and alternative hypothesis for the independent variable – audit firm are
given as:
48
H0: The two categorical variables are independent (that is, the audit firm does not influence
the voluntary adoption of IFRS).
HA: The two categorical variables are related (that is, the audit firm has an influence on
the voluntary adoption of IFRS).
The chi-square test of independence is computed using the following formula:
𝑥2 = (𝑂 − 𝐸)2
𝐸 ,
where,
𝑥2 = Chi square test of independence
O = observed value
E = expected value
The observed value is the actual number of observations, while the expected value is a
hypothetical number derived from computing the chi-square formula. The more significant the
gap between the observed and the expected value, the higher the possibility that the independent
variable significantly influences the dependent variable, which means that they are related
(Faherty, 2008).
The results are interpreted by comparing the probability factor, P-value, to the significance
level (𝛼), and rejecting the null hypothesis when the P-value is less than the significance level.
This study used an 𝛼 = .05, indicating that with p < .05, there is only 5 % out of a possible 100
% probability that the results are due purely to sampling error or occurrence by chance (Faherty,
2008). A type I error occurs when the researcher rejects a null hypothesis when it is true. The
probability of committing a Type I error is called the significance level. Type II is an error that
occurs when a false null hypothesis is not rejected (Hayes, 2019).
The chi-square test of independence is a statistical significance test that should be coupled with
a suitable statistical test of strength. Cramer’s V test is the commonly used strength test of the
chi-square test, which measures the strength of the association between two variables (McHugh,
2013). Table 4.4 shows the classification of the Cramer’s V strength of association.
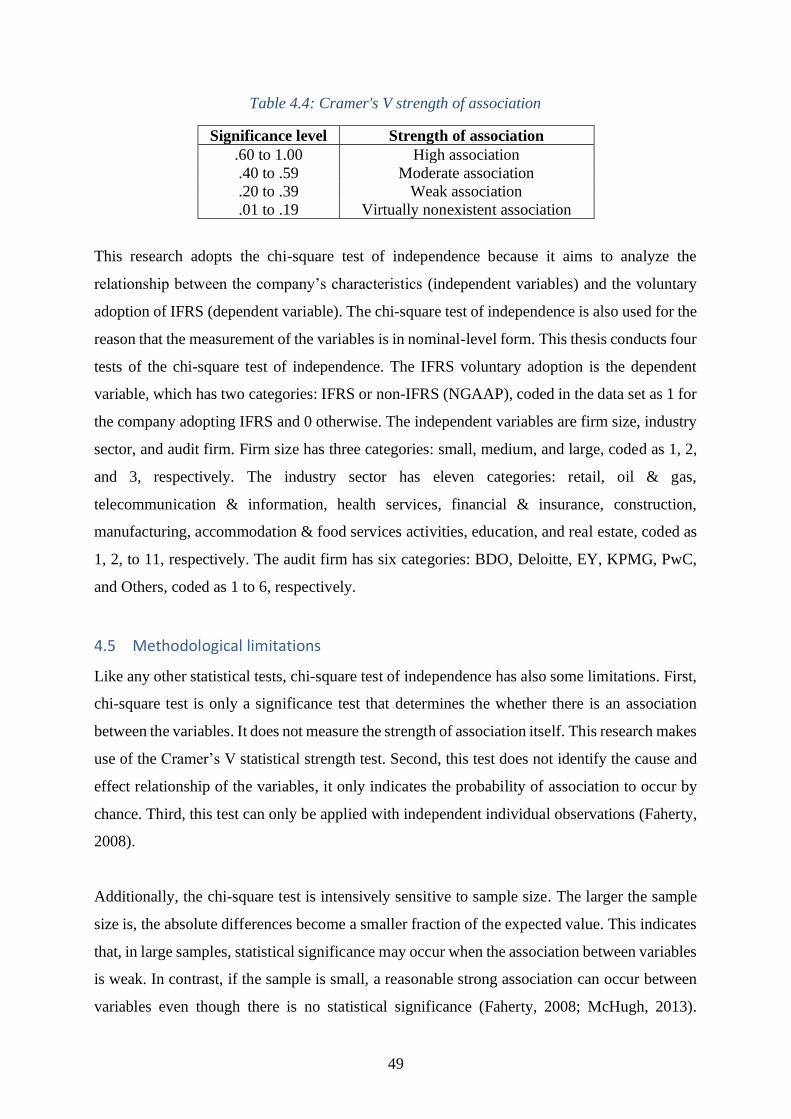
49
Table 4.4: Cramer's V strength of association
Significance level Strength of association
.60 to 1.00 High association
.40 to .59 Moderate association
.20 to .39 Weak association
.01 to .19 Virtually nonexistent association
This research adopts the chi-square test of independence because it aims to analyze the
relationship between the company’s characteristics (independent variables) and the voluntary
adoption of IFRS (dependent variable). The chi-square test of independence is also used for the
reason that the measurement of the variables is in nominal-level form. This thesis conducts four
tests of the chi-square test of independence. The IFRS voluntary adoption is the dependent
variable, which has two categories: IFRS or non-IFRS (NGAAP), coded in the data set as 1 for
the company adopting IFRS and 0 otherwise. The independent variables are firm size, industry
sector, and audit firm. Firm size has three categories: small, medium, and large, coded as 1, 2,
and 3, respectively. The industry sector has eleven categories: retail, oil & gas,
telecommunication & information, health services, financial & insurance, construction,
manufacturing, accommodation & food services activities, education, and real estate, coded as
1, 2, to 11, respectively. The audit firm has six categories: BDO, Deloitte, EY, KPMG, PwC,
and Others, coded as 1 to 6, respectively.
4.5 Methodological limitations
Like any other statistical tests, chi-square test of independence has also some limitations. First,
chi-square test is only a significance test that determines the whether there is an association
between the variables. It does not measure the strength of association itself. This research makes
use of the Cramer’s V statistical strength test. Second, this test does not identify the cause and
effect relationship of the variables, it only indicates the probability of association to occur by
chance. Third, this test can only be applied with independent individual observations (Faherty,
2008).
Additionally, the chi-square test is intensively sensitive to sample size. The larger the sample
size is, the absolute differences become a smaller fraction of the expected value. This indicates
that, in large samples, statistical significance may occur when the association between variables
is weak. In contrast, if the sample is small, a reasonable strong association can occur between
variables even though there is no statistical significance (Faherty, 2008; McHugh, 2013).

50
Despite these limitations, this study chose the chi-square test of independence based on its
suitability with the sample based on the data available.
Finally, this research has limitation regarding sample size as this study had to use the largest
companies so the results concerning turnover should be interpreted with caution.
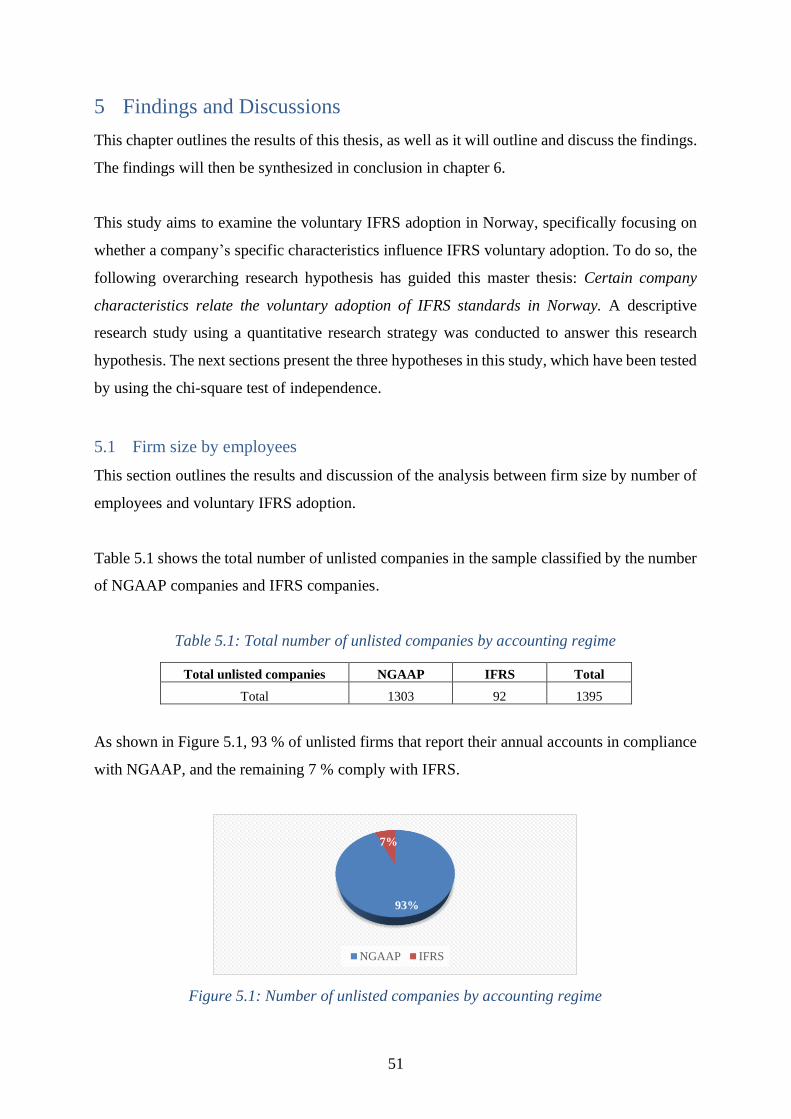
51
5 Findings and Discussions
This chapter outlines the results of this thesis, as well as it will outline and discuss the findings.
The findings will then be synthesized in conclusion in chapter 6.
This study aims to examine the voluntary IFRS adoption in Norway, specifically focusing on
whether a company’s specific characteristics influence IFRS voluntary adoption. To do so, the
following overarching research hypothesis has guided this master thesis: Certain company
characteristics relate the voluntary adoption of IFRS standards in Norway. A descriptive
research study using a quantitative research strategy was conducted to answer this research
hypothesis. The next sections present the three hypotheses in this study, which have been tested
by using the chi-square test of independence.
5.1 Firm size by employees
This section outlines the results and discussion of the analysis between firm size by number of
employees and voluntary IFRS adoption.
Table 5.1 shows the total number of unlisted companies in the sample classified by the number
of NGAAP companies and IFRS companies.
Table 5.1: Total number of unlisted companies by accounting regime
Total unlisted companies NGAAP IFRS Total
Total 1303 92 1395
As shown in Figure 5.1, 93 % of unlisted firms that report their annual accounts in compliance
with NGAAP, and the remaining 7 % comply with IFRS.
Figure 5.1: Number of unlisted companies by accounting regime
93%
7%
NGAAP IFRS
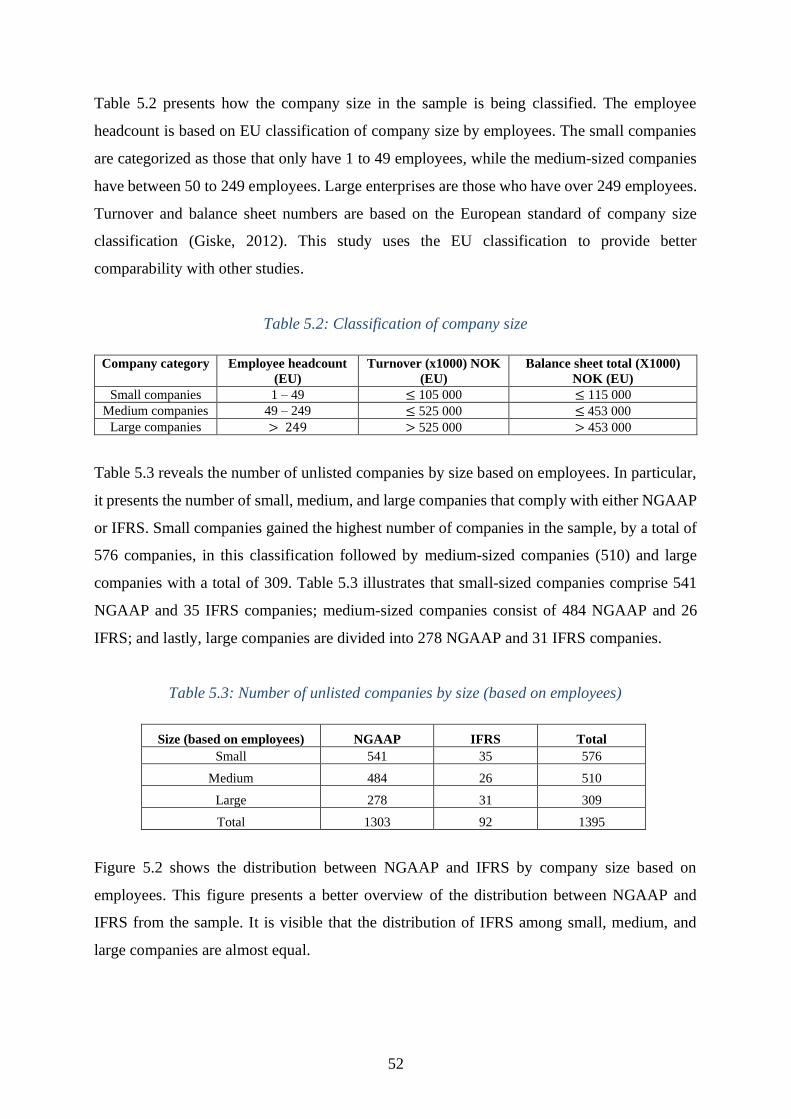
52
Table 5.2 presents how the company size in the sample is being classified. The employee
headcount is based on EU classification of company size by employees. The small companies
are categorized as those that only have 1 to 49 employees, while the medium-sized companies
have between 50 to 249 employees. Large enterprises are those who have over 249 employees.
Turnover and balance sheet numbers are based on the European standard of company size
classification (Giske, 2012). This study uses the EU classification to provide better
comparability with other studies.
Table 5.2: Classification of company size
Company category Employee headcount
(EU)
Turnover (x1000) NOK
(EU)
Balance sheet total (X1000)
NOK (EU)
Small companies 1 – 49 ≤ 105 000 ≤ 115 000
Medium companies 49 – 249 ≤ 525 000 ≤ 453 000
Large companies > 249 > 525 000 > 453 000
Table 5.3 reveals the number of unlisted companies by size based on employees. In particular,
it presents the number of small, medium, and large companies that comply with either NGAAP
or IFRS. Small companies gained the highest number of companies in the sample, by a total of
576 companies, in this classification followed by medium-sized companies (510) and large
companies with a total of 309. Table 5.3 illustrates that small-sized companies comprise 541
NGAAP and 35 IFRS companies; medium-sized companies consist of 484 NGAAP and 26
IFRS; and lastly, large companies are divided into 278 NGAAP and 31 IFRS companies.
Table 5.3: Number of unlisted companies by size (based on employees)
Size (based on employees) NGAAP IFRS Total
Small 541 35 576
Medium 484 26 510
Large 278 31 309
Total 1303 92 1395
Figure 5.2 shows the distribution between NGAAP and IFRS by company size based on
employees. This figure presents a better overview of the distribution between NGAAP and
IFRS from the sample. It is visible that the distribution of IFRS among small, medium, and
large companies are almost equal.
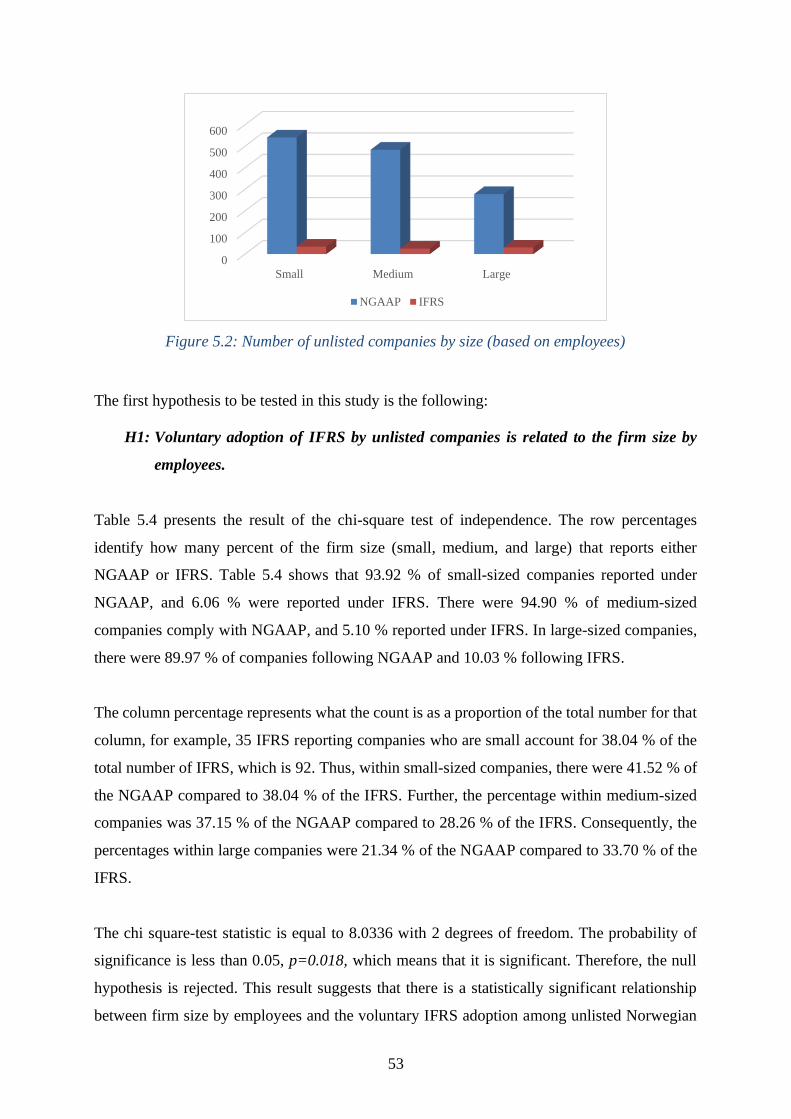
53
Figure 5.2: Number of unlisted companies by size (based on employees)
The first hypothesis to be tested in this study is the following:
H1: Voluntary adoption of IFRS by unlisted companies is related to the firm size by
employees.
Table 5.4 presents the result of the chi-square test of independence. The row percentages
identify how many percent of the firm size (small, medium, and large) that reports either
NGAAP or IFRS. Table 5.4 shows that 93.92 % of small-sized companies reported under
NGAAP, and 6.06 % were reported under IFRS. There were 94.90 % of medium-sized
companies comply with NGAAP, and 5.10 % reported under IFRS. In large-sized companies,
there were 89.97 % of companies following NGAAP and 10.03 % following IFRS.
The column percentage represents what the count is as a proportion of the total number for that
column, for example, 35 IFRS reporting companies who are small account for 38.04 % of the
total number of IFRS, which is 92. Thus, within small-sized companies, there were 41.52 % of
the NGAAP compared to 38.04 % of the IFRS. Further, the percentage within medium-sized
companies was 37.15 % of the NGAAP compared to 28.26 % of the IFRS. Consequently, the
percentages within large companies were 21.34 % of the NGAAP compared to 33.70 % of the
IFRS.
The chi square-test statistic is equal to 8.0336 with 2 degrees of freedom. The probability of
significance is less than 0.05, p=0.018, which means that it is significant. Therefore, the null
hypothesis is rejected. This result suggests that there is a statistically significant relationship
between firm size by employees and the voluntary IFRS adoption among unlisted Norwegian
0
100
200
300
400
500
600
Small Medium Large
NGAAP IFRS
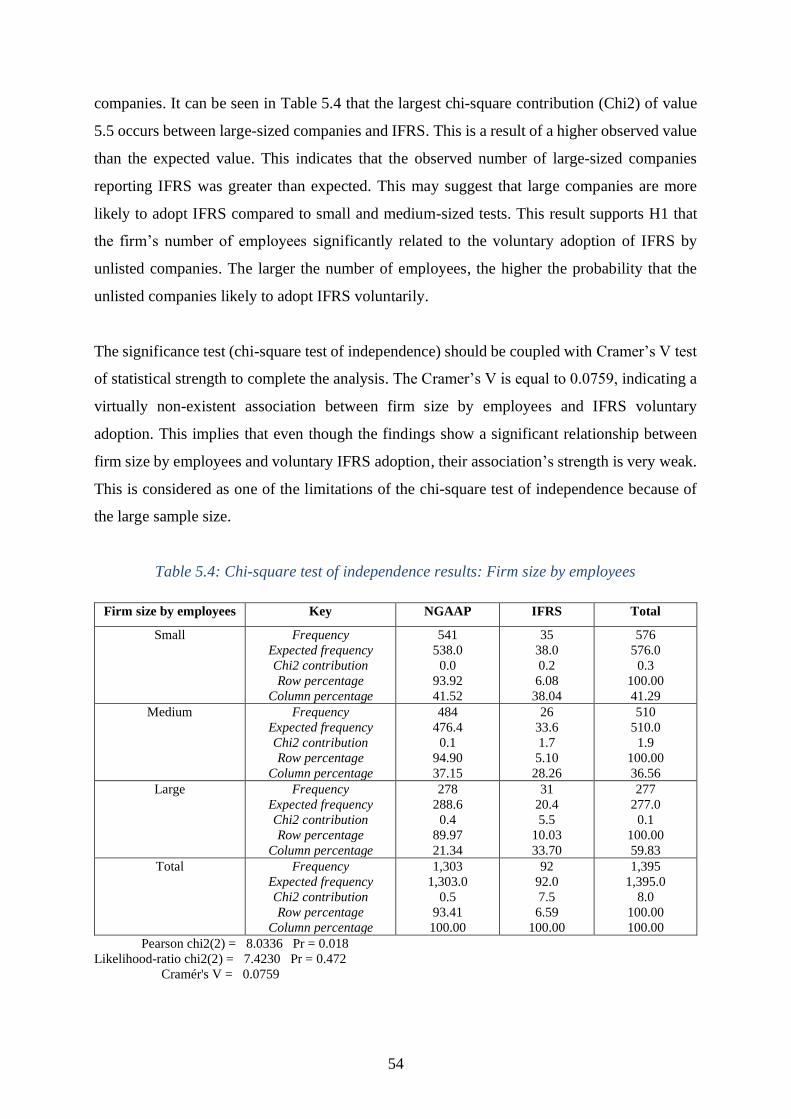
54
companies. It can be seen in Table 5.4 that the largest chi-square contribution (Chi2) of value
5.5 occurs between large-sized companies and IFRS. This is a result of a higher observed value
than the expected value. This indicates that the observed number of large-sized companies
reporting IFRS was greater than expected. This may suggest that large companies are more
likely to adopt IFRS compared to small and medium-sized tests. This result supports H1 that
the firm’s number of employees significantly related to the voluntary adoption of IFRS by
unlisted companies. The larger the number of employees, the higher the probability that the
unlisted companies likely to adopt IFRS voluntarily.
The significance test (chi-square test of independence) should be coupled with Cramer’s V test
of statistical strength to complete the analysis. The Cramer’s V is equal to 0.0759, indicating a
virtually non-existent association between firm size by employees and IFRS voluntary
adoption. This implies that even though the findings show a significant relationship between
firm size by employees and voluntary IFRS adoption, their association’s strength is very weak.
This is considered as one of the limitations of the chi-square test of independence because of
the large sample size.
Table 5.4: Chi-square test of independence results: Firm size by employees
Firm size by employees Key NGAAP IFRS Total
Small
Frequency
Expected frequency
Chi2 contribution
Row percentage
Column percentage
541
538.0
0.0
93.92
41.52
35
38.0
0.2
6.08
38.04
576
576.0
0.3
100.00
41.29
Medium
Frequency
Expected frequency
Chi2 contribution
Row percentage
Column percentage
484
476.4
0.1
94.90
37.15
26
33.6
1.7
5.10
28.26
510
510.0
1.9
100.00
36.56
Large
Frequency
Expected frequency
Chi2 contribution
Row percentage
Column percentage
278
288.6
0.4
89.97
21.34
31
20.4
5.5
10.03
33.70
277
277.0
0.1
100.00
59.83
Total
Frequency
Expected frequency
Chi2 contribution
Row percentage
Column percentage
1,303
1,303.0
0.5
93.41
100.00
92
92.0
7.5
6.59
100.00
1,395
1,395.0
8.0
100.00
100.00
Pearson chi2(2) = 8.0336 Pr = 0.018
Likelihood-ratio chi2(2) = 7.4230 Pr = 0.472
Cramér's V = 0.0759
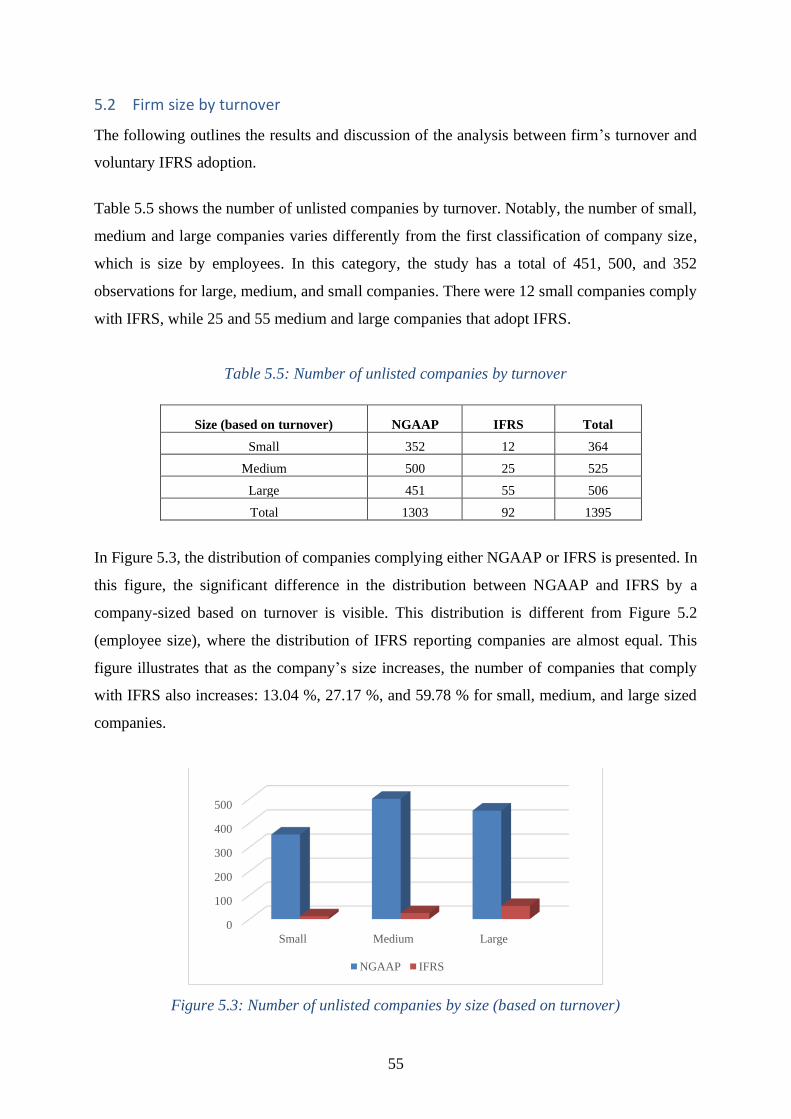
55
5.2 Firm size by turnover
The following outlines the results and discussion of the analysis between firm’s turnover and
voluntary IFRS adoption.
Table 5.5 shows the number of unlisted companies by turnover. Notably, the number of small,
medium and large companies varies differently from the first classification of company size,
which is size by employees. In this category, the study has a total of 451, 500, and 352
observations for large, medium, and small companies. There were 12 small companies comply
with IFRS, while 25 and 55 medium and large companies that adopt IFRS.
Table 5.5: Number of unlisted companies by turnover
Size (based on turnover) NGAAP IFRS Total
Small 352 12 364
Medium 500 25 525
Large 451 55 506
Total 1303 92 1395
In Figure 5.3, the distribution of companies complying either NGAAP or IFRS is presented. In
this figure, the significant difference in the distribution between NGAAP and IFRS by a
company-sized based on turnover is visible. This distribution is different from Figure 5.2
(employee size), where the distribution of IFRS reporting companies are almost equal. This
figure illustrates that as the company’s size increases, the number of companies that comply
with IFRS also increases: 13.04 %, 27.17 %, and 59.78 % for small, medium, and large sized
companies.
Figure 5.3: Number of unlisted companies by size (based on turnover)
0
100
200
300
400
500
Small Medium Large
NGAAP IFRS
56
It is interesting to see the differences in firm size by employees and firm size by turnover. The
result on firm’s number of employees shows that IFRS contribution among small, medium, and
large companies was equal (35, 26 and 31). In contrast, the result in the firm’s turnover varied
across firm size (small (12), medium (25), and large (55)). It is because companies with high
turnover do not necessarily have a high number of employees, and it varies across industries.
For instance, most of the sample companies from real estate and finance & insurance industries
are classified as a small company in terms of employees. However, these companies are
classified as large in terms of turnover. There are also holding companies (parent companies)
categorized as small in terms of firm size by employees because they have zero or few
employees. In contrast, these companies are categorized as large in terms of firm size by
turnover.
The second hypothesis to be tested is stated as:
H2: Voluntary adoption of IFRS by unlisted companies is related to the firm size by
turnover.
Table 5.6 reveals the result of the conducted chi-square test of independence. The row
percentages identify how many percent of the firm size (small, medium, and large) reports
either NGAAP or IFRS. Table 5.6 shows that there were 96.70 of small companies that reported
under NGAAP and 3.30 % reported under IFRS. There were 95.24 % of medium-sized
companies keeping accounts under NGAAP, and 4.76 % reported under IFRS. In large
companies, there were 89.13 % of companies following NGAAP and 10.87 % following IFRS.
The column percentage represents what the count is as a proportion of the total number for that
column, for example, 46 IFRS reporting companies who are large account for 82.14 % of the
total number of IFRS, which is 56. Thus, within small-sized companies, there were 2.46 % of
the NGAAP compared to 0 % of the IFRS. Further, the percentage within medium-sized
companies was 27.03 % of the NGAAP compared to 17.86 % of the IFRS. Moreover, the
percentages within large companies were 70.52 % of the NGAAP compared to 82.14 % of the
IFRS.
The chi-square test statistic is equal to 24.3011 with 2 degrees of freedom. The probability of
significance is less than 0.05, p=0.000, which means that it is highly significant. Therefore, the
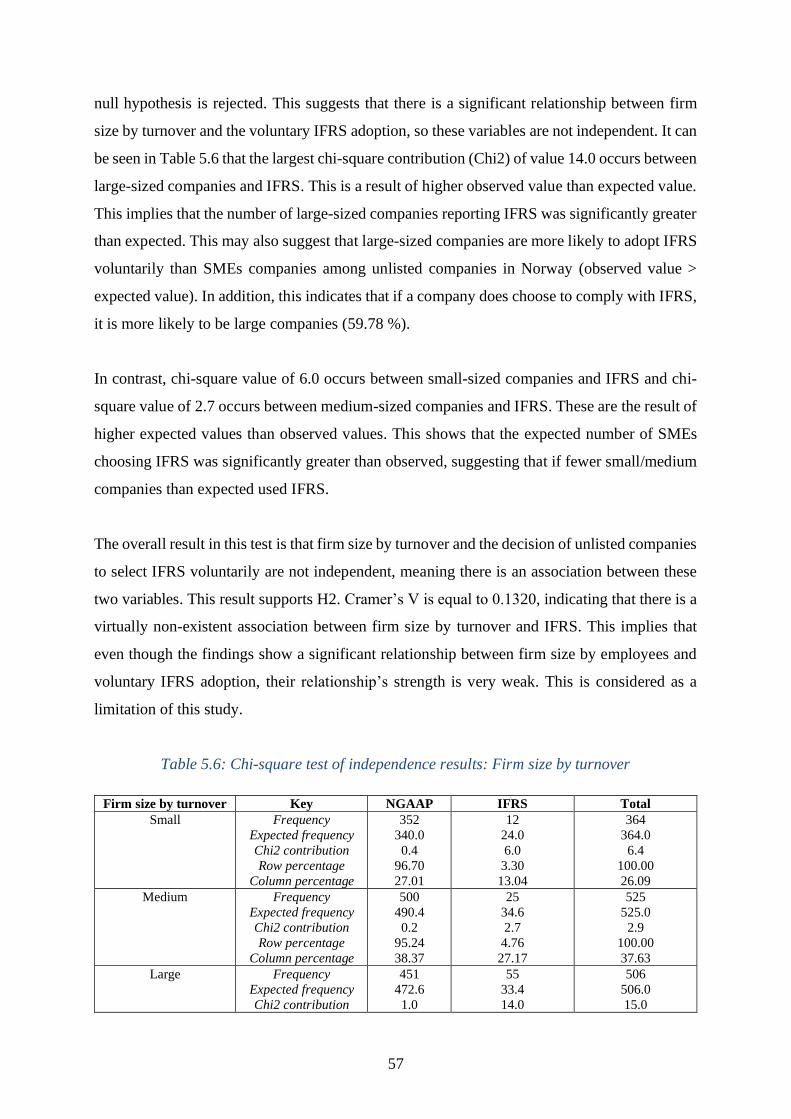
57
null hypothesis is rejected. This suggests that there is a significant relationship between firm
size by turnover and the voluntary IFRS adoption, so these variables are not independent. It can
be seen in Table 5.6 that the largest chi-square contribution (Chi2) of value 14.0 occurs between
large-sized companies and IFRS. This is a result of higher observed value than expected value.
This implies that the number of large-sized companies reporting IFRS was significantly greater
than expected. This may also suggest that large-sized companies are more likely to adopt IFRS
voluntarily than SMEs companies among unlisted companies in Norway (observed value >
expected value). In addition, this indicates that if a company does choose to comply with IFRS,
it is more likely to be large companies (59.78 %).
In contrast, chi-square value of 6.0 occurs between small-sized companies and IFRS and chi-
square value of 2.7 occurs between medium-sized companies and IFRS. These are the result of
higher expected values than observed values. This shows that the expected number of SMEs
choosing IFRS was significantly greater than observed, suggesting that if fewer small/medium
companies than expected used IFRS.
The overall result in this test is that firm size by turnover and the decision of unlisted companies
to select IFRS voluntarily are not independent, meaning there is an association between these
two variables. This result supports H2. Cramer’s V is equal to 0.1320, indicating that there is a
virtually non-existent association between firm size by turnover and IFRS. This implies that
even though the findings show a significant relationship between firm size by employees and
voluntary IFRS adoption, their relationship’s strength is very weak. This is considered as a
limitation of this study.
Table 5.6: Chi-square test of independence results: Firm size by turnover
Firm size by turnover Key NGAAP IFRS Total
Small
Frequency
Expected frequency
Chi2 contribution
Row percentage
Column percentage
352
340.0
0.4
96.70
27.01
12
24.0
6.0
3.30
13.04
364
364.0
6.4
100.00
26.09
Medium
Frequency
Expected frequency
Chi2 contribution
Row percentage
Column percentage
500
490.4
0.2
95.24
38.37
25
34.6
2.7
4.76
27.17
525
525.0
2.9
100.00
37.63
Large
Frequency
Expected frequency
Chi2 contribution
451
472.6
1.0
55
33.4
14.0
506
506.0
15.0
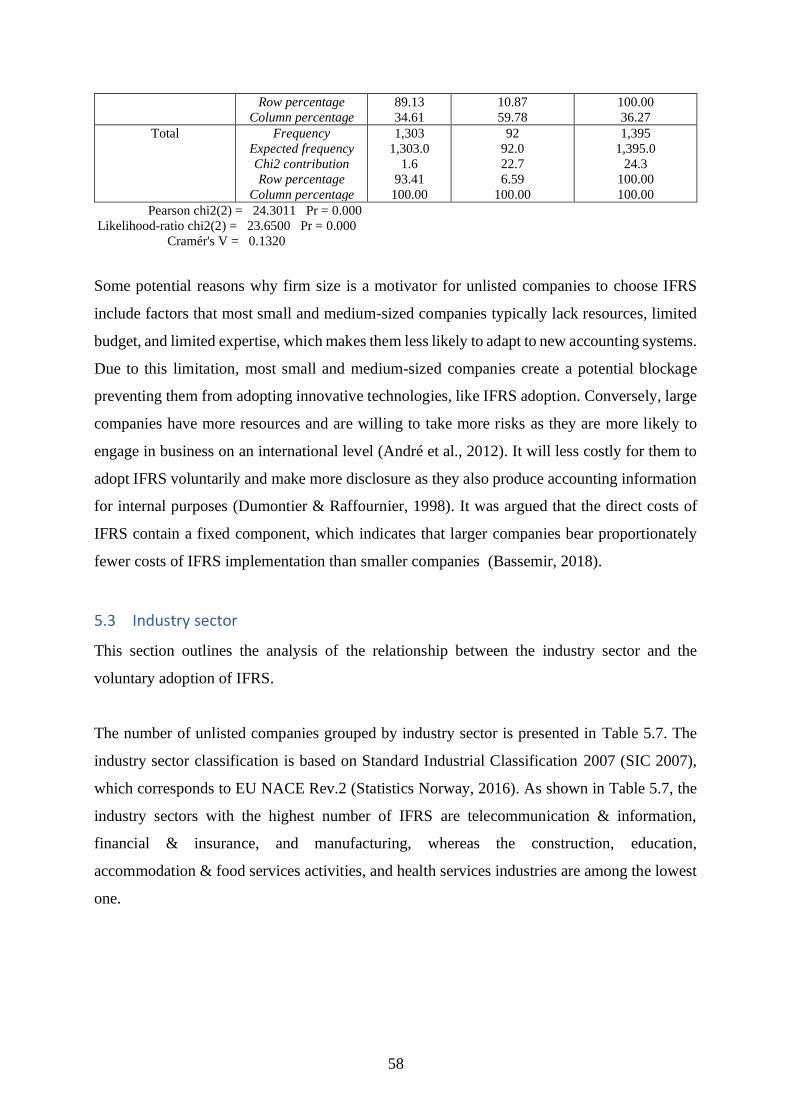
58
Row percentage
Column percentage
89.13
34.61
10.87
59.78
100.00
36.27
Total
Frequency
Expected frequency
Chi2 contribution
Row percentage
Column percentage
1,303
1,303.0
1.6
93.41
100.00
92
92.0
22.7
6.59
100.00
1,395
1,395.0
24.3
100.00
100.00
Pearson chi2(2) = 24.3011 Pr = 0.000
Likelihood-ratio chi2(2) = 23.6500 Pr = 0.000
Cramér's V = 0.1320
Some potential reasons why firm size is a motivator for unlisted companies to choose IFRS
include factors that most small and medium-sized companies typically lack resources, limited
budget, and limited expertise, which makes them less likely to adapt to new accounting systems.
Due to this limitation, most small and medium-sized companies create a potential blockage
preventing them from adopting innovative technologies, like IFRS adoption. Conversely, large
companies have more resources and are willing to take more risks as they are more likely to
engage in business on an international level (André et al., 2012). It will less costly for them to
adopt IFRS voluntarily and make more disclosure as they also produce accounting information
for internal purposes (Dumontier & Raffournier, 1998). It was argued that the direct costs of
IFRS contain a fixed component, which indicates that larger companies bear proportionately
fewer costs of IFRS implementation than smaller companies (Bassemir, 2018).
5.3 Industry sector
This section outlines the analysis of the relationship between the industry sector and the
voluntary adoption of IFRS.
The number of unlisted companies grouped by industry sector is presented in Table 5.7. The
industry sector classification is based on Standard Industrial Classification 2007 (SIC 2007),
which corresponds to EU NACE Rev.2 (Statistics Norway, 2016). As shown in Table 5.7, the
industry sectors with the highest number of IFRS are telecommunication & information,
financial & insurance, and manufacturing, whereas the construction, education,
accommodation & food services activities, and health services industries are among the lowest
one.
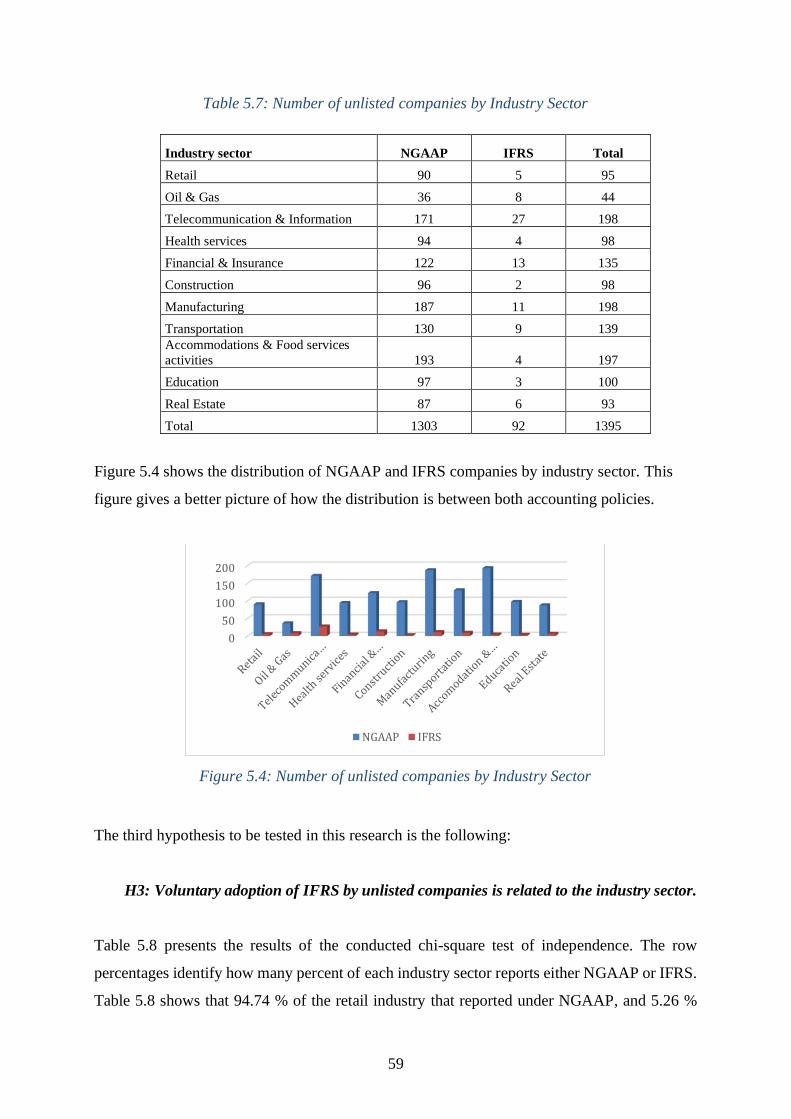
59
Table 5.7: Number of unlisted companies by Industry Sector
Industry sector NGAAP IFRS Total
Retail 90 5 95
Oil & Gas 36 8 44
Telecommunication & Information 171 27 198
Health services 94 4 98
Financial & Insurance 122 13 135
Construction 96 2 98
Manufacturing 187 11 198
Transportation 130 9 139
Accommodations & Food services
activities 193 4 197
Education 97 3 100
Real Estate 87 6 93
Total 1303 92 1395
Figure 5.4 shows the distribution of NGAAP and IFRS companies by industry sector. This
figure gives a better picture of how the distribution is between both accounting policies.
Figure 5.4: Number of unlisted companies by Industry Sector
The third hypothesis to be tested in this research is the following:
H3: Voluntary adoption of IFRS by unlisted companies is related to the industry sector.
Table 5.8 presents the results of the conducted chi-square test of independence. The row
percentages identify how many percent of each industry sector reports either NGAAP or IFRS.
Table 5.8 shows that 94.74 % of the retail industry that reported under NGAAP, and 5.26 %
0
50
100
150
200
NGAAP IFRS
60
were reported under IFRS. There were 81.82 % of the oil & gas industry that comply with
NGAAP, and 18.18 % reported under IFRS. In the telecommunication & information industry,
there were 86.36 % companies reported under NGAAP AND 13.64 % reported under IFRS.
The rest of the industry sectors have more than 90 % of companies that chose to report their
financial statements under NGAAP.
The column percentage represents what the count is as a proportion of the total number for that
column. For instance, 5.43 IFRS reporting companies in the retail industry account for 5.43 %
of the total number of IFRS, which is 92. Thus, within retail industry sectors, there were 6.91
% of the NGAAP compared to 5.43 % of the IFRS. The percentage within the oil & gas industry
was 2.76 % of the NGAAP compared to 8.70 % of the IFRS. Moreover, within the
telecommunication & information industry, there were 13.12 % of the NGAAP, whereas 29.35
% of the IFRS. The telecommunication and information industry have the highest number of
companies reporting under IFRS (29.35 %), followed by financial & insurance (14.13 %),
manufacturing (11.96 %), and oil & gas (8.70 %).
The chi-square test statistic with 10 degrees of freedom is equal to 41.2372. The probability of
significance, p=0.000, is less than 0.05, which means that it is highly significant. Thus, the null
hypothesis is rejected. Consequently, this study suggests that there is a statistically significant
relationship between the industry sector and the voluntary adoption of IFRS in Norway.
Cramer’s V is equal to 0.1719, indicating a virtually non-existent association between industry
type and IFRS. This signifies that although there is a known relationship between industry
sector and voluntary adoption of IFRS, their association’s strength implies a weak correlation,
which is considered as a limitation of this study.
Table 5.8 shows that the chi-square contributions less than 1 indicate that the number of
observed values is approximately equal to expected values, which means there was no
difference in terms of the association between that specific industry and voluntary IFRS
adoption. As seen in Table 5.8, the accommodation & food service activities and education
have a chi-square contribution of 6.2 and 2.0, respectively. This is a result of having an expected
value higher than the observed values. This means that the expected number of companies from
these industries that choose IFRS was greater than observed. In contrast, the telecommunication
& information (14.9), oil & gas (9.0), and financial & insurance (1.9) industries have the highest
chi-square contribution in the analysis. This is a result of higher observed values than expected
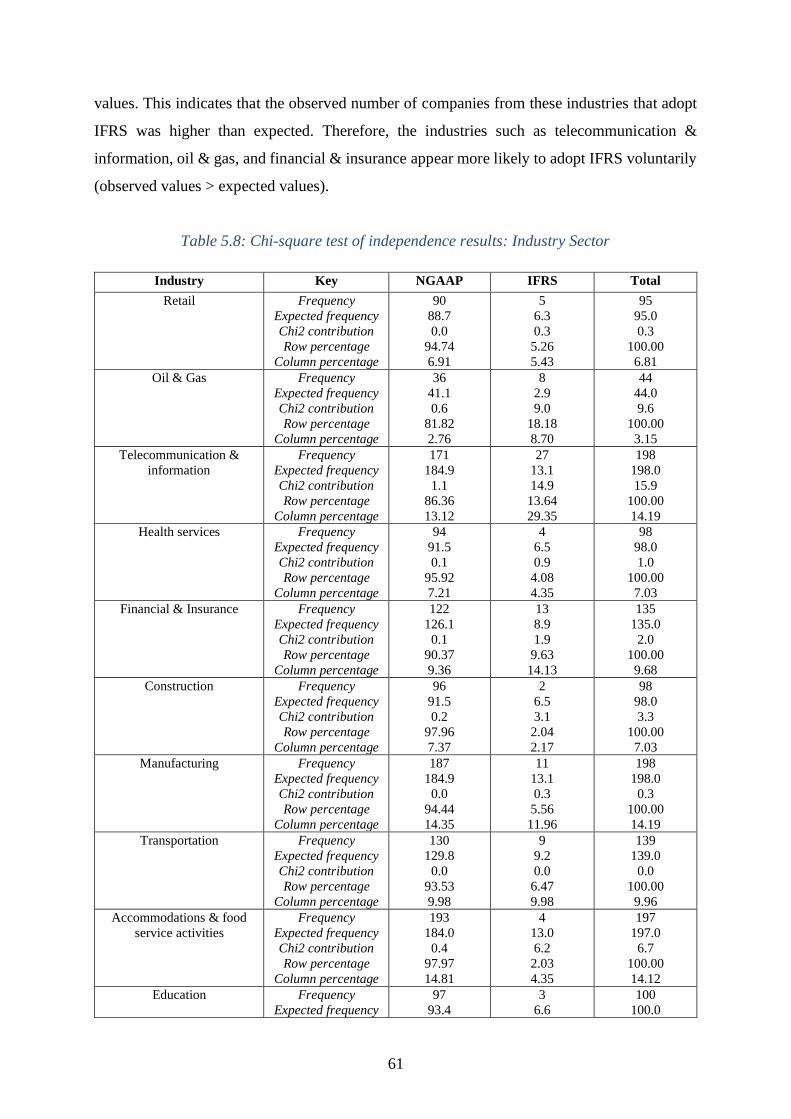
61
values. This indicates that the observed number of companies from these industries that adopt
IFRS was higher than expected. Therefore, the industries such as telecommunication &
information, oil & gas, and financial & insurance appear more likely to adopt IFRS voluntarily
(observed values > expected values).
Table 5.8: Chi-square test of independence results: Industry Sector
Industry Key NGAAP IFRS Total
Retail
Frequency
Expected frequency
Chi2 contribution
Row percentage
Column percentage
90
88.7
0.0
94.74
6.91
5
6.3
0.3
5.26
5.43
95
95.0
0.3
100.00
6.81
Oil & Gas
Frequency
Expected frequency
Chi2 contribution
Row percentage
Column percentage
36
41.1
0.6
81.82
2.76
8
2.9
9.0
18.18
8.70
44
44.0
9.6
100.00
3.15
Telecommunication &
information
Frequency
Expected frequency
Chi2 contribution
Row percentage
Column percentage
171
184.9
1.1
86.36
13.12
27
13.1
14.9
13.64
29.35
198
198.0
15.9
100.00
14.19
Health services
Frequency
Expected frequency
Chi2 contribution
Row percentage
Column percentage
94
91.5
0.1
95.92
7.21
4
6.5
0.9
4.08
4.35
98
98.0
1.0
100.00
7.03
Financial & Insurance
Frequency
Expected frequency
Chi2 contribution
Row percentage
Column percentage
122
126.1
0.1
90.37
9.36
13
8.9
1.9
9.63
14.13
135
135.0
2.0
100.00
9.68
Construction
Frequency
Expected frequency
Chi2 contribution
Row percentage
Column percentage
96
91.5
0.2
97.96
7.37
2
6.5
3.1
2.04
2.17
98
98.0
3.3
100.00
7.03
Manufacturing
Frequency
Expected frequency
Chi2 contribution
Row percentage
Column percentage
187
184.9
0.0
94.44
14.35
11
13.1
0.3
5.56
11.96
198
198.0
0.3
100.00
14.19
Transportation
Frequency
Expected frequency
Chi2 contribution
Row percentage
Column percentage
130
129.8
0.0
93.53
9.98
9
9.2
0.0
6.47
9.98
139
139.0
0.0
100.00
9.96
Accommodations & food
service activities
Frequency
Expected frequency
Chi2 contribution
Row percentage
Column percentage
193
184.0
0.4
97.97
14.81
4
13.0
6.2
2.03
4.35
197
197.0
6.7
100.00
14.12
Education
Frequency
Expected frequency
97
93.4
3
6.6
100
100.0
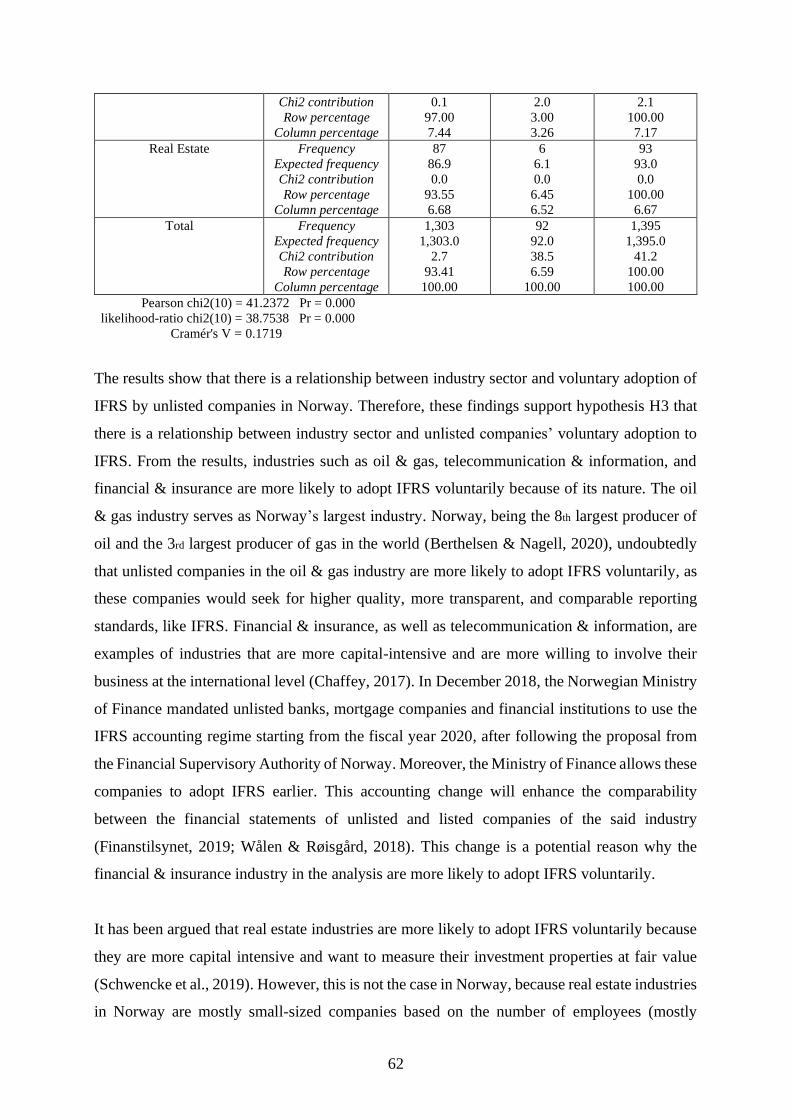
62
Chi2 contribution
Row percentage
Column percentage
0.1
97.00
7.44
2.0
3.00
3.26
2.1
100.00
7.17
Real Estate Frequency
Expected frequency
Chi2 contribution
Row percentage
Column percentage
87
86.9
0.0
93.55
6.68
6
6.1
0.0
6.45
6.52
93
93.0
0.0
100.00
6.67
Total
Frequency
Expected frequency
Chi2 contribution
Row percentage
Column percentage
1,303
1,303.0
2.7
93.41
100.00
92
92.0
38.5
6.59
100.00
1,395
1,395.0
41.2
100.00
100.00
Pearson chi2(10) = 41.2372 Pr = 0.000
likelihood-ratio chi2(10) = 38.7538 Pr = 0.000
Cramér's V = 0.1719
The results show that there is a relationship between industry sector and voluntary adoption of
IFRS by unlisted companies in Norway. Therefore, these findings support hypothesis H3 that
there is a relationship between industry sector and unlisted companies’ voluntary adoption to
IFRS. From the results, industries such as oil & gas, telecommunication & information, and
financial & insurance are more likely to adopt IFRS voluntarily because of its nature. The oil
& gas industry serves as Norway’s largest industry. Norway, being the 8th largest producer of
oil and the 3rd largest producer of gas in the world (Berthelsen & Nagell, 2020), undoubtedly
that unlisted companies in the oil & gas industry are more likely to adopt IFRS voluntarily, as
these companies would seek for higher quality, more transparent, and comparable reporting
standards, like IFRS. Financial & insurance, as well as telecommunication & information, are
examples of industries that are more capital-intensive and are more willing to involve their
business at the international level (Chaffey, 2017). In December 2018, the Norwegian Ministry
of Finance mandated unlisted banks, mortgage companies and financial institutions to use the
IFRS accounting regime starting from the fiscal year 2020, after following the proposal from
the Financial Supervisory Authority of Norway. Moreover, the Ministry of Finance allows these
companies to adopt IFRS earlier. This accounting change will enhance the comparability
between the financial statements of unlisted and listed companies of the said industry
(Finanstilsynet, 2019; Wålen & Røisgård, 2018). This change is a potential reason why the
financial & insurance industry in the analysis are more likely to adopt IFRS voluntarily.
It has been argued that real estate industries are more likely to adopt IFRS voluntarily because
they are more capital intensive and want to measure their investment properties at fair value
(Schwencke et al., 2019). However, this is not the case in Norway, because real estate industries
in Norway are mostly small-sized companies based on the number of employees (mostly
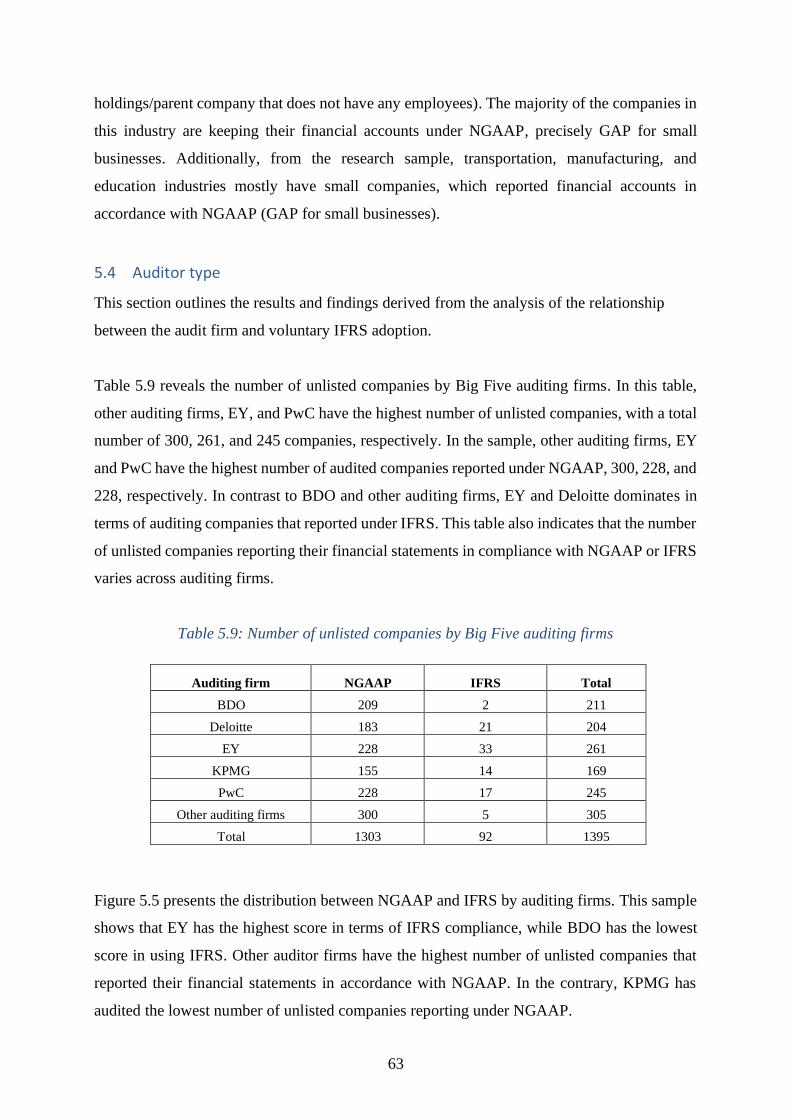
63
holdings/parent company that does not have any employees). The majority of the companies in
this industry are keeping their financial accounts under NGAAP, precisely GAP for small
businesses. Additionally, from the research sample, transportation, manufacturing, and
education industries mostly have small companies, which reported financial accounts in
accordance with NGAAP (GAP for small businesses).
5.4 Auditor type
This section outlines the results and findings derived from the analysis of the relationship
between the audit firm and voluntary IFRS adoption.
Table 5.9 reveals the number of unlisted companies by Big Five auditing firms. In this table,
other auditing firms, EY, and PwC have the highest number of unlisted companies, with a total
number of 300, 261, and 245 companies, respectively. In the sample, other auditing firms, EY
and PwC have the highest number of audited companies reported under NGAAP, 300, 228, and
228, respectively. In contrast to BDO and other auditing firms, EY and Deloitte dominates in
terms of auditing companies that reported under IFRS. This table also indicates that the number
of unlisted companies reporting their financial statements in compliance with NGAAP or IFRS
varies across auditing firms.
Table 5.9: Number of unlisted companies by Big Five auditing firms
Auditing firm NGAAP IFRS Total
BDO 209 2 211
Deloitte 183 21 204
EY 228 33 261
KPMG 155 14 169
PwC 228 17 245
Other auditing firms 300 5 305
Total 1303 92 1395
Figure 5.5 presents the distribution between NGAAP and IFRS by auditing firms. This sample
shows that EY has the highest score in terms of IFRS compliance, while BDO has the lowest
score in using IFRS. Other auditor firms have the highest number of unlisted companies that
reported their financial statements in accordance with NGAAP. In the contrary, KPMG has
audited the lowest number of unlisted companies reporting under NGAAP.
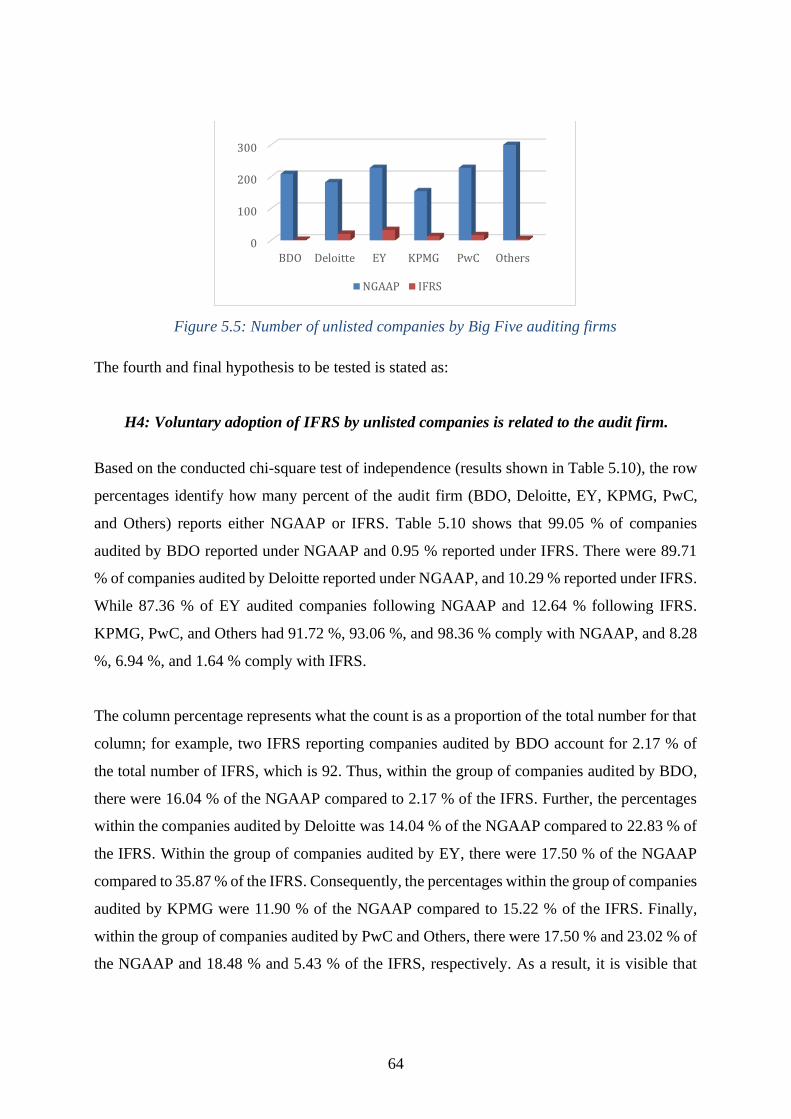
64
Figure 5.5: Number of unlisted companies by Big Five auditing firms
The fourth and final hypothesis to be tested is stated as:
H4: Voluntary adoption of IFRS by unlisted companies is related to the audit firm.
Based on the conducted chi-square test of independence (results shown in Table 5.10), the row
percentages identify how many percent of the audit firm (BDO, Deloitte, EY, KPMG, PwC,
and Others) reports either NGAAP or IFRS. Table 5.10 shows that 99.05 % of companies
audited by BDO reported under NGAAP and 0.95 % reported under IFRS. There were 89.71
% of companies audited by Deloitte reported under NGAAP, and 10.29 % reported under IFRS.
While 87.36 % of EY audited companies following NGAAP and 12.64 % following IFRS.
KPMG, PwC, and Others had 91.72 %, 93.06 %, and 98.36 % comply with NGAAP, and 8.28
%, 6.94 %, and 1.64 % comply with IFRS.
The column percentage represents what the count is as a proportion of the total number for that
column; for example, two IFRS reporting companies audited by BDO account for 2.17 % of
the total number of IFRS, which is 92. Thus, within the group of companies audited by BDO,
there were 16.04 % of the NGAAP compared to 2.17 % of the IFRS. Further, the percentages
within the companies audited by Deloitte was 14.04 % of the NGAAP compared to 22.83 % of
the IFRS. Within the group of companies audited by EY, there were 17.50 % of the NGAAP
compared to 35.87 % of the IFRS. Consequently, the percentages within the group of companies
audited by KPMG were 11.90 % of the NGAAP compared to 15.22 % of the IFRS. Finally,
within the group of companies audited by PwC and Others, there were 17.50 % and 23.02 % of
the NGAAP and 18.48 % and 5.43 % of the IFRS, respectively. As a result, it is visible that
0
100
200
300
BDO Deloitte EY KPMG PwC Others
NGAAP IFRS
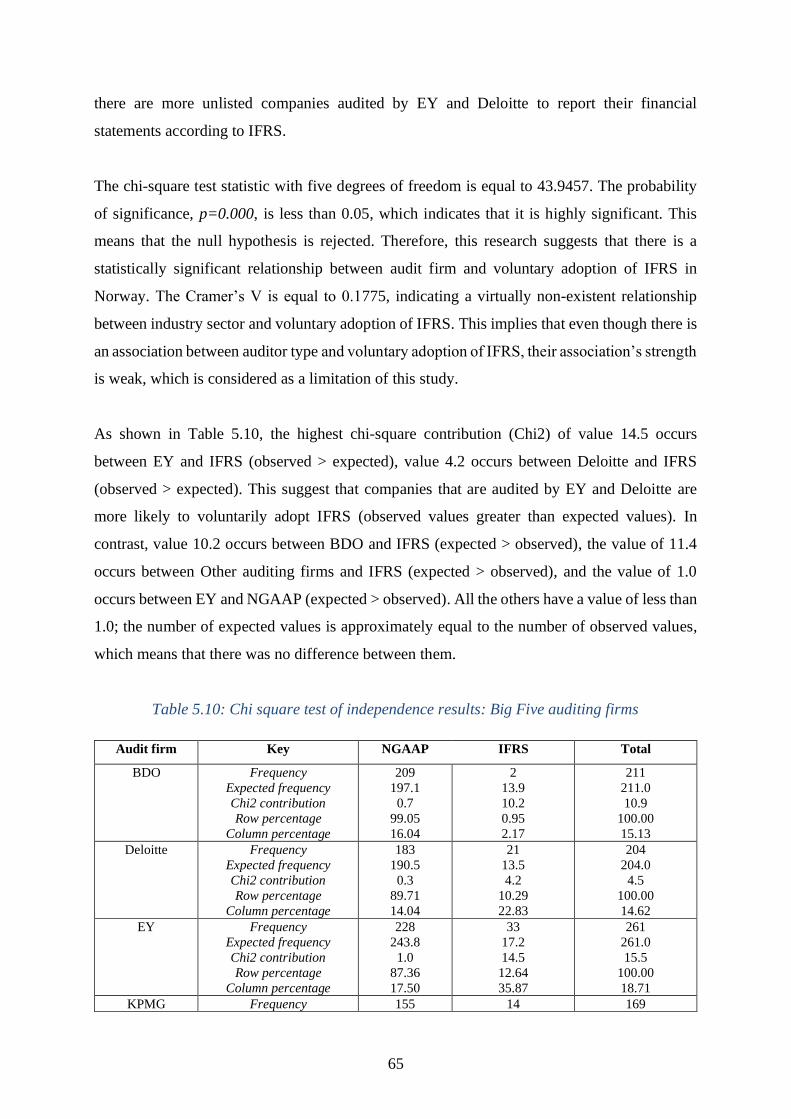
65
there are more unlisted companies audited by EY and Deloitte to report their financial
statements according to IFRS.
The chi-square test statistic with five degrees of freedom is equal to 43.9457. The probability
of significance, p=0.000, is less than 0.05, which indicates that it is highly significant. This
means that the null hypothesis is rejected. Therefore, this research suggests that there is a
statistically significant relationship between audit firm and voluntary adoption of IFRS in
Norway. The Cramer’s V is equal to 0.1775, indicating a virtually non-existent relationship
between industry sector and voluntary adoption of IFRS. This implies that even though there is
an association between auditor type and voluntary adoption of IFRS, their association’s strength
is weak, which is considered as a limitation of this study.
As shown in Table 5.10, the highest chi-square contribution (Chi2) of value 14.5 occurs
between EY and IFRS (observed > expected), value 4.2 occurs between Deloitte and IFRS
(observed > expected). This suggest that companies that are audited by EY and Deloitte are
more likely to voluntarily adopt IFRS (observed values greater than expected values). In
contrast, value 10.2 occurs between BDO and IFRS (expected > observed), the value of 11.4
occurs between Other auditing firms and IFRS (expected > observed), and the value of 1.0
occurs between EY and NGAAP (expected > observed). All the others have a value of less than
1.0; the number of expected values is approximately equal to the number of observed values,
which means that there was no difference between them.
Table 5.10: Chi square test of independence results: Big Five auditing firms
Audit firm Key NGAAP IFRS Total
BDO
Frequency
Expected frequency
Chi2 contribution
Row percentage
Column percentage
209
197.1
0.7
99.05
16.04
2
13.9
10.2
0.95
2.17
211
211.0
10.9
100.00
15.13
Deloitte
Frequency
Expected frequency
Chi2 contribution
Row percentage
Column percentage
183
190.5
0.3
89.71
14.04
21
13.5
4.2
10.29
22.83
204
204.0
4.5
100.00
14.62
EY
Frequency
Expected frequency
Chi2 contribution
Row percentage
Column percentage
228
243.8
1.0
87.36
17.50
33
17.2
14.5
12.64
35.87
261
261.0
15.5
100.00
18.71
KPMG Frequency 155 14 169
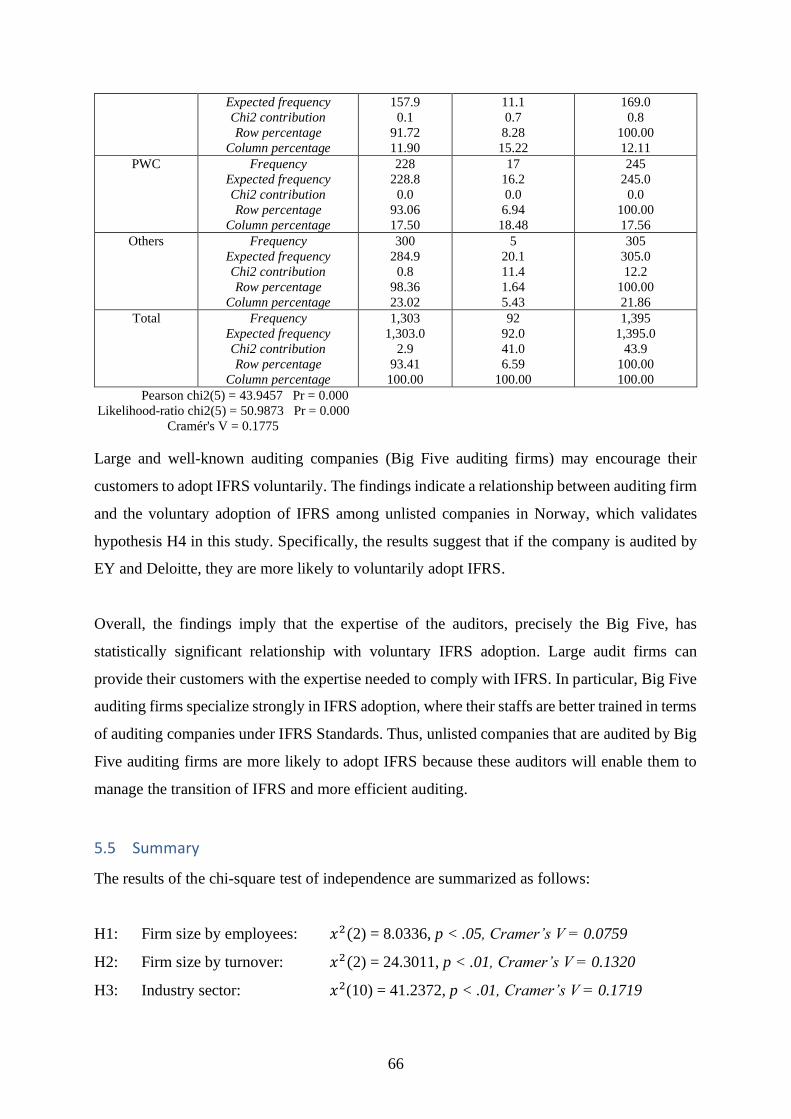
66
Expected frequency
Chi2 contribution
Row percentage
Column percentage
157.9
0.1
91.72
11.90
11.1
0.7
8.28
15.22
169.0
0.8
100.00
12.11
PWC
Frequency
Expected frequency
Chi2 contribution
Row percentage
Column percentage
228
228.8
0.0
93.06
17.50
17
16.2
0.0
6.94
18.48
245
245.0
0.0
100.00
17.56
Others
Frequency
Expected frequency
Chi2 contribution
Row percentage
Column percentage
300
284.9
0.8
98.36
23.02
5
20.1
11.4
1.64
5.43
305
305.0
12.2
100.00
21.86
Total Frequency
Expected frequency
Chi2 contribution
Row percentage
Column percentage
1,303
1,303.0
2.9
93.41
100.00
92
92.0
41.0
6.59
100.00
1,395
1,395.0
43.9
100.00
100.00
Pearson chi2(5) = 43.9457 Pr = 0.000
Likelihood-ratio chi2(5) = 50.9873 Pr = 0.000
Cramér's V = 0.1775
Large and well-known auditing companies (Big Five auditing firms) may encourage their
customers to adopt IFRS voluntarily. The findings indicate a relationship between auditing firm
and the voluntary adoption of IFRS among unlisted companies in Norway, which validates
hypothesis H4 in this study. Specifically, the results suggest that if the company is audited by
EY and Deloitte, they are more likely to voluntarily adopt IFRS.
Overall, the findings imply that the expertise of the auditors, precisely the Big Five, has
statistically significant relationship with voluntary IFRS adoption. Large audit firms can
provide their customers with the expertise needed to comply with IFRS. In particular, Big Five
auditing firms specialize strongly in IFRS adoption, where their staffs are better trained in terms
of auditing companies under IFRS Standards. Thus, unlisted companies that are audited by Big
Five auditing firms are more likely to adopt IFRS because these auditors will enable them to
manage the transition of IFRS and more efficient auditing.
5.5 Summary
The results of the chi-square test of independence are summarized as follows:
H1: Firm size by employees: 𝑥2(2) = 8.0336, p < .05, Cramer’s V = 0.0759
H2: Firm size by turnover: 𝑥2(2) = 24.3011, p < .01, Cramer’s V = 0.1320
H3: Industry sector: 𝑥2(10) = 41.2372, p < .01, Cramer’s V = 0.1719
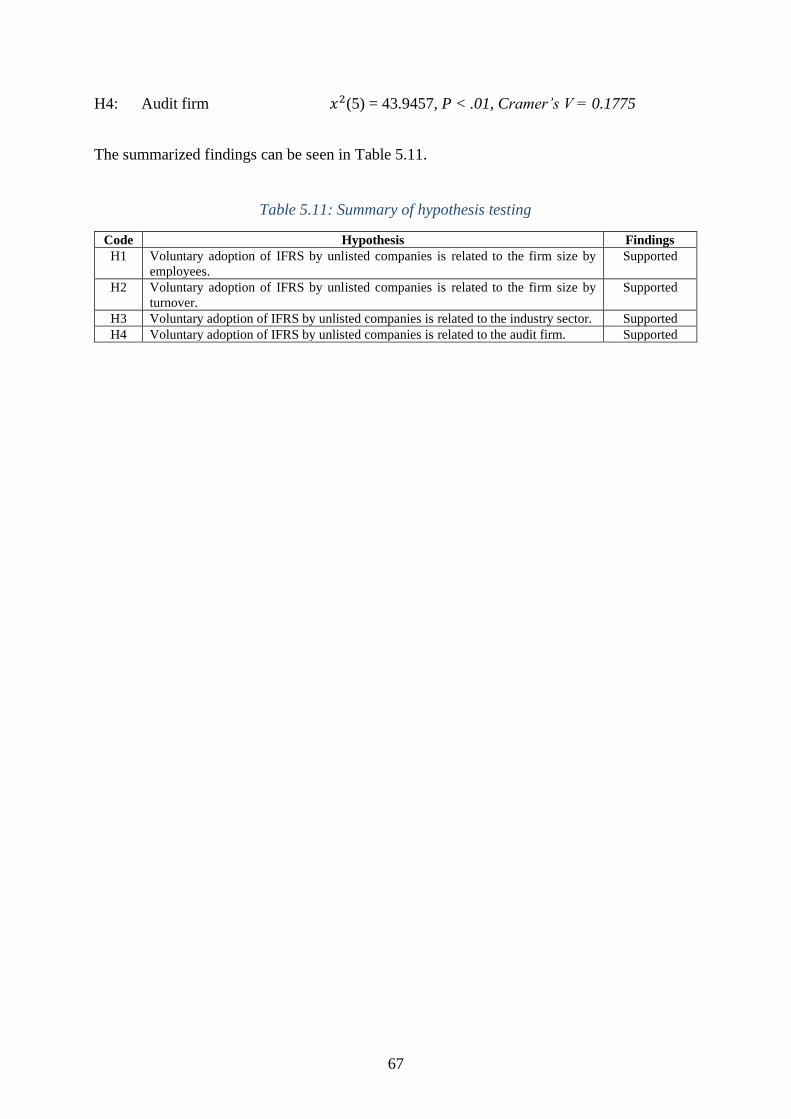
67
H4: Audit firm 𝑥2(5) = 43.9457, P < .01, Cramer’s V = 0.1775
The summarized findings can be seen in Table 5.11.
Table 5.11: Summary of hypothesis testing
Code Hypothesis Findings
H1 Voluntary adoption of IFRS by unlisted companies is related to the firm size by
employees.
Supported
H2 Voluntary adoption of IFRS by unlisted companies is related to the firm size by
turnover.
Supported
H3 Voluntary adoption of IFRS by unlisted companies is related to the industry sector. Supported
H4 Voluntary adoption of IFRS by unlisted companies is related to the audit firm. Supported

68
69
6 Conclusions and recommendations for future research
This master thesis aims to understand the voluntary adoption of IFRS among unlisted
companies in Norway. To do so, this study investigates which company characteristics
influence the voluntary adoption of IFRS by focusing on Norwegian unlisted companies.
Unlisted companies in Norway have substantial discretion to choose either NGAAP or IFRS in
preparing their financial statements. This research examined unlisted companies and their
choice of accounting practices, NGAAP or IFRS, in the fiscal year 2018. Previous studies focus
on consolidated financial accounts, while this current research focuses on unconsolidated
financial accounts of unlisted companies. The full sample of 1,395 companies comprises 1,303
(93.41 %) NGAAP companies and 92 (6.59 %) IFRS companies.
Chi-square statistical test of independence showed that voluntary adoption of IFRS among
Norwegian unlisted companies is significantly related to the size of the company (both by the
number of employees and turnover), industry type, and auditor type.
The result concerning firm size is supported with the findings from the broader literature (André
et al., 2012; Bassemir, 2018; Bora Senyiit, 2014; Cooke, 1992; Di Fabio, 2018; Dumontier &
Raffournier, 1998; Gassen & Sellhorn, 2006; Haapamäki, 2018; Meek et al., 1995), but
inconsistent with the results in the study of Matonti and Iuliano (2012). The result of the study
confirms the first and second hypothesis predicting that there is a relationship between firm size
and the application of IFRS as the basis of the reporting financial statements by unlisted
companies in Norway. The biggest chi-square contribution is from large companies, which
indicates that larger companies are more likely to voluntarily adopt IFRS than SMEs. The
findings concerning industry sector is in line with prior literature (Berner & Olving, 2013;
Cooke, 1992; Cuijpers & Buijink, 2005; Meek et al., 1995), but is not supported with other
studies (André et al., 2012; Bora Senyiit, 2014; Matonti & Iuliano, 2012). This finding validates
the third hypothesis that the voluntary adoption of IFRS by Norwegian unlisted companies is
statistically significantly related to the type of industry. Finally, the result concerning auditor
type is consistent with the findings from the broader research studies (André et al., 2012;
Bassemir, 2018; Berner & Olving, 2013; Bora Senyiit, 2014; Dumontier & Raffournier, 1998),
but inconsistent with the results found in the study of Matonti and Iuliano (2012). The result
regarding auditor type confirms the fourth hypothesis that there is a statistically significant
relationship between Big Five and voluntary adoption of IFRS.
70
In Norway, IFRS’s expected benefits are more likely to accrue to industry types such as oil &
gas, telecommunication & information, financial & insurance and companies audited by Big
Five auditors (precisely EY and Deloite). Consistent with the study of Berner and Olving
(2013), this thesis find that the industry sector is positively related to unlisted companies’
decision to adopt IFRS voluntarily. Especially, Berner and Olving (2013) find that in finance
& insurance, oil & gas, shipping, and certain parts in retail and manufacturing industries that
IFRS stands firmly as the accounting policy. This study obtained similar results regarding
voluntary IFRS adoption by unlisted companies that operate in the finance & insurance and oil
& gas industry. But not consistent in terms of telecommunication, retail, and manufacturing. In
line with the findings in the study of Berner and Olving (2013), EY obtained the highest
contribution of IFRS companies, but completely the opposite in terms of Deloitte audit firm.
Overall, this study suggests that certain company characteristics have a relationship with the
voluntary adoption of IFRS Standards in Norway, specifically firm size by employees, firm size
by turnover, industry type and auditor type.
This paper contributes to existing literature on the voluntary adoption of IFRS by unlisted
companies, specifically by examining the role of certain company characteristics in explaining
the adoption of IFRS in the Norwegian setting. Findings derived from this study can help
regulators increase their awareness for evaluating whether unlisted firms benefited voluntarily
adopting IFRS. This research also provides empirical evidence to standard setters by indicating
the type of unlisted companies which may prefer to use and benefit from IFRS. Standard setters
may also find this thesis an indispensable guide to a better understanding of what company’s
characteristics that are likely to motivate the voluntary adoption of IFRS, enabling them to
promote the adoption of IFRS effectively to countries that currently do not employ IFRS.
Additionally, this research can also be beneficial to a wide variety of practitioners, such as
auditors and managers.
In line with prior research, this study gained several limitations. Firstly, given constraints on
time and data availability, the sample size is minimal relative to the whole population (590 810
companies) (SSB, 2020a). Secondly, the results may not be generalizable to several other
industry sectors such as the primary industry sector (e.g., agriculture, forestry, and fishing),
professional, scientific & technical activities, administrative and support service activities and
more due to such industry sectors were not included from my sample. Finally, this study does
not consider all relevant variables that might influence the voluntary IFRS adoption decision
71
by unlisted companies. For example, ownership structure was not included because the
available data contain mainly limited companies (Aksjeselskap (AS) in the Norwegian term).
More variables could potentially be included in the study, but it was very time consuming
gathering all data one by one from the 1,395 unlisted companies in the sample.
As this study focuses on the company’s characteristics influencing voluntary adoption of IFRS,
this study acknowledges that there is still scope for future research to expand this research. For
instance, further analysis can explore the influence of institutional factors on voluntary adoption
in unlisted companies in Norway. Additionally, it can be an exciting avenue for future research
to extend this research to analyze other firm-specific factors influencing voluntary adoption in
Norway. Such company characteristics that could be of interest for future research are
international exposure, ownership structure, leverage, profitability, and capital intensity. These
areas also need to be addressed to determine whether the findings of this future research,
specifically in the Norwegian setting, are consistent with prior literature. Moreover, it is an
essential area for further work to conduct similar research with an increased sample size and
include more variables to investigates. Finally, since the chi-square test of independence shows
the presence or absence of a relationship between the company’s characteristics and voluntary
IFRS adoption, further analysis could examine the new cause and effect of why unlisted
companies are willing to adopt IFRS by conducting a qualitative study.

72
73
References
Alexander, D., & Schwencke, H. R. (2003). Accounting change in Norway. European
Accounting Review, 12(3), 549-566. doi:10.1080/0963818031000087934
André, P., Walton, P., & Yang, D. (2012). Voluntary adoption of IFRS: A study of determinants
for UK unlisted firms.
Ashbaugh, H., & Pincus, M. (2001). Domestic Accounting Standards, International Accounting
Standards, and the Predictability of Earnings. In (pp. 417-434). [Chicago, Ill. :.
Baksaas, K. M., & Stenheim, T. (2019). Regnskap i endring. Retrieved from
https://www.magma.no/regnskap-i-endring
Barth, M. E., Landsman, W. R., & Lang, M. H. (2008). International Accounting Standards and
Accounting Quality. In (pp. 467-498). [Chicago, Ill. :.
Barth, M. E., Landsman, W. R., Lang, M. H., & Williams, C. D. (2018). Effects on
Comparability and Capital Market Benefits of Voluntary IFRS Adoption. Journal of Financial
Reporting, 3(1), 1-22. doi:10.2308/jfir-52279
Bassemir, M. (2018). Why do private firms adopt IFRS? Accounting and Business Research,
48(3), 237-263. doi:10.1080/00014788.2017.1357459
Beisland, L. A., & Knivsflå, K. H. (2015). Have IFRS changed how stock prices are associated
with earnings and book values? Review of Accounting and Finance, 14(1), 41-63.
doi:10.1108/RAF-06-2013-0079
Berner, E., & Olving, M. (2013). Utbredelse og virkninger av IFRS i Norge : en empirisk studie
om utbredelsen av IFRS i Norge, og konsekvensen standarden har på rapporterte nøkkeltall. In.
Berthelsen, O., & Nagell, T. C. (2020). Oil and Gas. Retrieved from
https://www.regjeringen.no/en/topics/energy/oil-and-gas/id1003/
Bora Senyiit, Y. (2014). Determinants of voluntary IFRS adoption. Accounting and
Management Information Systems, 13(3), 449-465.
Brown, P. (2011). International Financial Reporting Standards: what are the benefits?
Accounting and Business Research, 41(3), 269-285. doi:10.1080/00014788.2011.569054
74
Brown, P. (2013). Some observations on research on the benefits to nations of adopting IFRS.
The Japanese Accounting Review, 3(2013), 1-19.
Byard, D., Li, Y., & Yu, Y. (2011). The effect of mandatory IFRS adoption on financial
analysts’ information environment. Journal of accounting research, 49(1), 69-96.
Callao, S., Jarne, J. I., & Laínez, J. A. (2007). Adoption of IFRS in Spain: Effect on the
comparability and relevance of financial reporting. Journal of International Accounting,
Auditing and Taxation, 16(2), 148-178. doi:10.1016/j.intaccaudtax.2007.06.002
Carini, C., Teodori, C., Veneziani, M., Dunne, T., & Helliar, C. (2011). Perceived Costs and
Benefits of IFRS adoption in italian medium size entities. Piccola Impresa/Small Business(3).
Chaffey, P. (2017). Hva er Norges største næringer? (Blog post) [Chaffeys blogg]. Retrieved
from https://paulchaffey.blogspot.com/2017/10/hva-er-norges-strste-nringer.html
Christensen, H. (2012). Why do firms rarely adopt IFRS voluntarily? Academics find
significant benefits and the costs appear to be low. Review of Accounting Studies, 17(3), 518-
525. doi:10.1007/s11142-012-9190-y
Christensen, H. B., Lee, E., Walker, M., & Zeng, C. (2015). Incentives or Standards: What
Determines Accounting Quality Changes around IFRS Adoption? European Accounting
Review, 24(1), 31-61. doi:10.1080/09638180.2015.1009144
Chung, H., & Park, S. O. (2017). Voluntary Adoption of the IFRS and Industry-Level
Comparability: Evidence from Korean Unlisted Firms. Emerging Markets Finance and Trade,
53(7), 1654-1666. doi:10.1080/1540496X.2016.1247688
Cole, V., Branson, J., & Breesch, D. (2011). THE ILLUSION OF COMPARABLE
EUROPEAN IFRS FINANCIAL STATEMENTS.BELIEFS OF AUDITORS, ANALYSTS
AND OTHER USERS. Accounting and Management Information Systems, 10(2), 106-134.
Cooke, T. E. (1992). The impact of size, stock market listing and industry type on disclosure in
the annual reports of Japanese listed corporations. Accounting and Business Research, 22(87),
229-237.
Creswell, J. W., & Creswell, J. D. (2018). Research design : qualitative, quantitative & mixed
methods approaches (5th edition. ed.). Los Angeles, California: Sage.
Cuijpers, R., & Buijink, W. (2005). Voluntary adoption of non-local GAAP in the European
Union: A study of determinants and consequences. European Accounting Review, 14(3), 487-
524.

75
Daske, H. (2006). Economic benefits of adopting IFRS or US‐GAAP–have the expected cost
of equity capital really decreased? Journal of Business Finance & Accounting, 33(3‐4), 329-
373.
Daske, H., & Gebhardt, G. (2006). International financial reporting standards and experts’
perceptions of disclosure quality. Abacus, 42(3‐4), 461-498. doi:10.1111/j.1467-
6281.2006.00211.x
Daske, H., Hail, L., Leuz, C., & Verdi, R. (2013). Adopting a Label: Heterogeneity in the
Economic Consequences Around IAS/IFRS Adoptions. In (pp. 495-547). [Chicago, Ill. :.
De George, E. T., Li, X., & Shivakumar, L. (2016). A review of the IFRS adoption literature.
Review of Accounting Studies, 21(3), 898-1004. doi:10.1007/s11142-016-9363-1
Di Fabio, C. (2018). Voluntary application of IFRS by unlisted companies: evidence from the
Italian context. International Journal of Disclosure and Governance, 15(2), 73-86.
doi:10.1057/s41310-018-0037-z
DIBKunnskap. (2019). IFRS - International Financial Reporting Standards - Internasjonale
regnskapsstandarder. Retrieved from https://dib.no/ifrs/ifrs/
Dichev, I. D. (2008). On the balance sheet-based model of financial reporting.(Report).
Accounting Horizons, 22(4), 453. doi:10.2308/acch.2008.22.4.453
Dudovskiy, J. (2018). The Ultimate Guide to Writing a Dissertation in Business Studies: A Step-
by-Step Assistance. Retrieved from http://research-methodology.net/research-
methods/quantitative-research/
Dumontier, P., & Raffournier, B. (1998). Why Firms Comply Voluntarily with IAS: an
Empirical Analysis with Swiss Data. Journal of International Financial Management &
Accounting, 9(3), 216-245. doi:10.1111/1467-646X.00038
Elling, J. O. (1995). Årsregnskabsteori : i analytisk perspektiv (2. udg. ed.). København: FSRs
Forlag.
EuropeanCommission. (2017). Effects of using International Financial Reporting Standards
(IFRS) in the EU: public consultation. Retrieved from
https://ec.europa.eu/finance/consultations/2014/ifrs/docs/contributions/registered-
organisations/norway-accounting-standards-board_en.pdf
Faherty, V. (2008). Chi-Square Test of Independence. Thousand Oaks: Thousand Oaks: SAGE
Publications, Inc.
76
Finanstilsynet. (2019). IFRS-tilpassede regnskapsregler for unoterte banker, kredittforetak og
finansieringsforetak. Retrieved from
https://www.finanstilsynet.no/nyhetsarkiv/nyheter/2019/ifrs-tilpassede-regnskapsregler-for-
unoterte-banker-kredittforetak-og-finansieringsforetak/
Fox, A., Hannah, G., Helliar, C., & Veneziani, M. (2013). The costs and benefits of IFRS
implementation in the UK and Italy. Journal of Applied Accounting Research, 14.
doi:10.1108/09675421311282568
Francis, J. R., Khurana, I. K., Martin, X., & Pereira, R. (2008). The Role of Firm-Specific
Incentives and Country Factors in Explaining Voluntary IAS Adoptions: Evidence from Private
Firms. European Accounting Review, 17(2), 331-360. doi:10.1080/09638180701819899
Galaen, A., & Stenheim, T. (2010). Differences in accounting quality between Norwegian
GAAP and IFRS. Buskerud University College, Norway.
Gassen, J., & Sellhorn, T. (2006). Applying IFRS in Germany: Determinants and consequences.
Germany: Determinants and Consequences (July 2006).
Ghauri, P. N., & Grønhaug, K. (2010). Research methods in business studies (4th ed. ed.).
Harlow: Financial Times Prentice Hall.
Giske, T. (2012). Små bedrifter - store verdier. Regjeringens strategi for små og mellomstore
bedrifter. Retrieved from
https://www.regjeringen.no/globalassets/upload/nhd/vedlegg/rapporter_2012/102377_nhd_sm
b_web.pdf
Gjerde, Ø., Knivsflå, K., & Sættem, F. (2008). The value-relevance of adopting IFRS: Evidence
from 145 NGAAP restatements. Journal of International Accounting, Auditing and Taxation,
17(2), 92-112. doi:10.1016/j.intaccaudtax.2008.07.001
Gotlandconsulting. (2017). REGNSKAPSTEORI DEL 2: REGNSKAPSREGULERING OG
KONSEPTUELLE RAMMEVERK. Retrieved from
http://godtlandconsulting.no/2017/07/12/regnskapsteori-del-2-konseptuelle-rammeverk-for-
regnskap/
Hayes, A. (2019). Type II Error. Retrieved from https://www.investopedia.com/terms/t/type-ii-
error.asp
Hellman, N. (2011). Soft adoption and reporting incentives: A study of the impact of ifrs on
financial statements in sweden. Journal of International Accounting Research, 10(1), 61-83.
doi:10.2308/jiar.2011.10.1.61
77
Hinton, P., McMurray, I., & Brownlow, C. (2014). SPSS Explained: Routledge.
Hope, O.-K. (2003). Disclosure Practices, Enforcement of Accounting Standards, and Analysts'
Forecast Accuracy: An International Study. In (pp. 235-272). [Chicago, Ill. :.
Horn, R. (2012). Researching and writing dissertations : a complete guide for business and
management students (2nd ed. ed.). London: Chartered Institute of Personnel and Development.
Haapamäki, E. (2018). How has IFRS impacted financial reporting for unlisted entities?
Accounting and Management Information Systems, 17(1), 5-30.
doi:10.24818/jamis.2018.01001
IFRS.org. (2020). Who uses IFRS Standards: USE OF IFRS STANDARDS BY
JURISDICTION. Retrieved from https://www.ifrs.org/use-around-the-world/use-of-ifrs-
standards-by-jurisdiction/#profiles
IFRSFoundation. (2017). Norway. Retrieved from https://www.ifrs.org/use-around-the-
world/use-of-ifrs-standards-by-jurisdiction/norway/#commitment
Jermakowicz, E. K., & Gornik-Tomaszewski, S. (2006). Implementing IFRS from the
perspective of EU publicly traded companies. In (pp. 170-196). [New York, NY] :.
Jermakowicz, E. K., Prather‐Kinsey, J., & Wulf, I. (2007). The Value Relevance of Accounting
Income Reported by DAX‐30 German Companies. Journal of International Financial
Management & Accounting, 18(3), 151-191. doi:10.1111/j.1467-646X.2007.01011.x
Johannessen, A., Christoffersen, L., & Tufte, P. A. (2011). Forskningsmetode for økonomisk-
administrative fag (3. utg. ed.). Oslo: Abstrakt forl.
Johnsen, A. (1993). Accounting regulation in Norway. European Accounting Review, 2(3),
617-626. doi:10.1080/09638189300000057
Kim, J.-B., & Shi, H. (2012). IFRS reporting, firm-specific information flows, and institutional
environments: international evidence. Review of Accounting Studies, 17(3), 474-517.
doi:10.1007/s11142-012-9190-y
Kim, J.-B., Shi, H., & Zhou, J. (2014). International Financial Reporting Standards, institutional
infrastructures, and implied cost of equity capital around the world. Review of Quantitative
Finance and Accounting, 42(3), 469-507. doi:10.1007/s11156-013-0350-3
78
Kothari, P. (2015). Data analysis with Stata: explore the big data field and learn how to perform
data analytics and predictive modeling in Stata(1st ed. ed.).
Kvifte, S. S. (2003). The usefulness of the asset-liability view : an analysis of conceptual
frameworks and the implications for Norwegian accounting regulation. Norwegian School of
Economics and Business Administration, Department of Accounting, Auditing and Law,
Bergen.
Kvaal, E. (2017). The Role and Current Status of IFRS in the Completion of National
Accounting Rules – Evidence from Norway. In (pp. 150-157). Abingdon, Oxfordshire :.
Kvaal, E., & Nobes, C. (2010). International differences in IFRS policy choice: a research note.
Accounting and Business Research, 40(2), 173. doi:10.1080/00014788.2010.9663390
Largestcompanies. (2020a). About Us. Retrieved from
http://www.largestcompanies.com/about-us
Largestcompanies. (2020b). Bransjetopplister i Norge. Retrieved from
http://www.largestcompanies.no/register-topplister-bransje/norge
Larson, R. K., & Street, D. L. (2004). Convergence with IFRS in an expanding Europe: progress
and obstacles identified by large accounting firms’ survey. In (pp. 89-119). [New York, NY] :.
Leuz, C., & Verrecchia, R. E. (2000). The economic consequences of increased disclosure.
Journal of accounting research, 91-124.
Li, S. (2010). Does mandatory adoption of international financial reporting standards in the
European Union reduce the cost of equity capital? The Accounting Review, 85(2).
doi:10.2308/accr.2010.85.2.607
Matonti, G., & Iuliano, G. (2012). Voluntary Adoption of Ifrs by Italian Private Firms: A Study
Of The Determinants. Eurasian Business Review, 2(2), 43-70. doi:10.14208/BF03353812
McHugh, M. L. (2013). The chi-square test of independence. Biochemia medica, 23(2), 143-
149.
Meek, G., Roberts, C., & Gray, S. (1995). Factors influencing voluntary annual report
disclosures by U.S., U.K. and continental European multinational corporations. Journal of
International Business Studies, 26(3), 555. doi:10.1057/palgrave.jibs.8490186
79
NRS. (2010). IFRS for SMEs, Arbeidsgruppens notat del II. Norsk RegnskapsStiftelse.
Retrieved from https://www.regnskapsstiftelsen.no/wp-content/uploads/2015/06/IFRS-SME-
rapport-del-2.pdf
NRS. (2017). The Norwegian Accounting Standards Board (NASB) Retrieved from
https://www.regnskapsstiftelsen.no/globalmeny/english/
OSE. (2020). Statistics - List changes Oslo Børs 1996-2020. Retrieved from
https://www.oslobors.no/ob_eng/Oslo-Boers/Statistics
Paananen, M. (2008). The IFRS adoption's effect on accounting quality in Sweden. Available
at SSRN 1097659.
Rettsdata. (2020). NRS 8 God regnskapsskikk for små foretak (Februar 2018). Retrieved from
https://min.rettsdata.no/Dokument/gNRS8FEB18
Saunders, M. N. K., Lewis, P., & Thornhill, A. (2019). Research methods for business students
(Eighth Edition. ed.). New York: Pearson.
Schwencke, H. R., Haugen, D. O., Baksaas, K. M., Stenheim, T., & Avlesen-Østli, E. (2019).
Årsregnskapet i teori og praksis : 2018 (20. utg. ed. Vol. 2018). Oslo: Gyldendal akademisk.
Sekaran, U., & Bougie, R. (2016). Research methods for business : a skill-building approach
(7th ed. ed.). Chichester: Wiley.
SSB. (2020a). 590810 virsomheter i Norge. Retrieved from https://www.ssb.no/virksomheter-
foretak-og-regnskap/artikler-og-publikasjoner/590-810-virksomheter-i-norge
SSB. (2020b). Establishments. Retrieved from https://www.ssb.no/en/virksomheter-foretak-
og-regnskap/statistikker/bedrifter
StatisticsNorway. (2016). Classification of Standard Industrial Classification. Retrieved from
https://www.ssb.no/en/klass/klassifikasjoner/6
Stenheim, T., & Madsen, D. Ø. (2017). The shift of accounting models and accounting quality:
The case of Norwegian GAAP.
Sue, L. T. M. (2018). Understanding and Evaluating Research: A Critical Guide. Thousand
Oaks: California, Thousand Oaks: SAGE Publications, Inc.

80
Tan, H., Wang, S., & Welker, M. (2011). Analyst Following and Forecast Accuracy After
Mandated IFRS Adoptions. In (pp. 1307-1357). [Chicago, Ill. :.
Whittington, G. (2008). Harmonisation or discord? The critical role of the IASB conceptual
framework review. Journal of Accounting and Public Policy, 27(6), 495-502.
doi:10.1016/j.jaccpubpol.2008.09.006
Wålen, T. R., & Røisgård, K.-A. (2018). Endringer i regnskapsregler. Unoterte banker,
kredittforetak og finansieringsforetak. Retrieved from
https://www.regjeringen.no/no/aktuelt/endringer-i-regnskapsregler.-unoterte-banker-
kredittforetak-og-finansieringsforetak/id2623634/
81
Appendix: Reflection notes
To be able to submit a master’s thesis at the University of Agder, some criteria are to be met.
One of the requirements is to write a reflection note. This reflective note will shortly introduce
the summary of the main topic and findings of this thesis. The topic, which is the voluntary
adoption of IFRS by unlisted companies in Norway, will then be discussed in relation to
internationalization, innovation, and responsibility.
Brief summary and findings
This master thesis aims to understand the characteristics of unlisted companies that influence
the voluntary adoption of IFRS Standards in Norway. Norway is a suitable setting to study
because it permits all unlisted firms to comply with IFRS. This study investigates 1,395 unlisted
companies comprises of 1.303 NGAAP (93 %) and 92 IFRS (7 %) companies.
A descriptive research study using a quantitative research strategy is conducted to answer the
main research hypothesis: Certain company characteristics influence the voluntary adoption of
IFRS Standards in Norway. Chi-square statistical tests of independence are used to examine
the determinants of voluntary IFRS adoption. Findings from the chi-square test of independence
indicate a statistically significant relationship between firm size by employees, firm size by
turnover, industry type, and auditor type and the voluntary adoption of IFRS by Norwegian
unlisted companies. Precisely, large companies that operate in oil & gas, telecommunication &
information, financial & insurance industries, and are audited Big Five auditing firms
(especially EY and Deloitte) are significantly not independent of unlisted companies’ decisions
to adopt IFRS voluntarily, meaning they are related to each other.
International trends
International Financial Reporting Standards (IFRS) is developed and approved by the
International Accounting Standards Board (IASB), an independent, private body under the
IFRS Foundation’s oversight. IFRS Standards is a very influential accounting regime not only
in Norway but also internationally. It is a comprehensive accounting policy, which is now
adopted by 166 jurisdictions. This implies that IFRS dominates as an accounting language,
which serves as an international accounting trend. IFRS enhances the comparability,
transparency, accountability, and efficiency of financial markets around the world. This
indicates that this accounting language is the top choice for reporting financial statements by
82
companies, especially larger companies, whose business is involved at an international level.
This topic has been focused master’s degree level subjects, such as BE-420 and BE-507, where
thorough introduction and application of this accounting standard were being discussed and
explained. This topic is necessary to be a part of UIAs syllabus, so we are aware of what is
happening around the world and can adapt to what changes may occur in this dynamic world.
The importance of internationalization is increasing, and the use of international accounting
language, like IFRS, is essential. It improves the ability to trade or expand the business
internationally and increase the market participant's confidence because this accounting
language is known internationally.
Innovation
The widespread adoption of IFRS Standards 15 years ago represents an indeed real innovation
in financial reporting. IFRS Standards are generally viewed as high-quality standards as it
enhances the comparability and transparency of financial statements globally. Unfortunately,
IFRS adoption is also associated with several challenges. First, this policy is very complex,
costly, and burdensome. Second, the need for training accounting staff and educating personnel
to manage IFRS adoption is a necessity. Third, the need for software and accounting system
adjustment. Finally, IFRS is a dynamic accounting standard that implies constant modifications
and improvements of the rules to present the users of financial statements with more
comparable and transparent financial reports.
This research focused on the determinants of voluntary adoption of IFRS by unlisted companies
in Norway. Unlisted companies in Norway are permitted to comply with IFRS as long as they
find it useful, especially when these companies are planning to expand their business at an
international level and when these companies want to show their balance sheet at fair value.
Empirical results of this study revealed that larger unlisted companies, which operate in oil &
gas, telecommunication & information, and financial & insurance industry are more likely to
adopt the IFRS accounting regime. This indicates that Norway increasingly adapted innovative
financial reporting. Recently, the Ministry of Finance mandated unlisted banks, mortgage
companies, and financial institutions to comply fully with IFRS. This is an innovative way to
improve the comparability of accounts between unlisted and listed banks, mortgage companies,
and financial institutions.
83
Responsibility
Through this master’s degree journey, I have learned about the important responsibility the
auditor has in obtaining reasonable assurance that the financial statements are free from material
misstatement and that accounting regulation is prepared with little room for manipulation as
possible. Since IFRS is a complex and dynamic accounting regime, standard setters, regulators,
and preparers need to understand how IFRS standards affect each unlisted companies' financial
accounts and whether they are beneficial for them to use. Moreover, it is crucial to take
responsibility by considering and taking into consideration which type of companies that may
adopt IFRS for the regulators and standard setter to be aware of what improvements and
adjustments that matters.
This thesis focused on unlisted companies’ characteristics that may influence the voluntary
adoption of IFRS. Whenever unlisted companies adopt IFRS or any other accounting regime,
it is their responsibility to follow a code of ethics and professional conduct necessary for
efficient implementation of the standard. Furthermore, accountants and auditors are responsible
for delivering honesty, integrity, and professionalism when preparing financial statements for
the companies, investors, and other users of the report.
Kristiansand, June 2020
Vivian Tirol Eide