volumetric, viscometric, and refractive index behaviour of α-amino acids and their groups’...
TRANSCRIPT
www.elsevier.com/locate/jct
J. Chem. Thermodynamics 38 (2006) 136–143
Volumetric, viscometric, and refractive index behaviourof a-amino acids and their groups� contribution in aqueous
D-glucose solution at different temperatures
Anwar Ali *, Soghra Hyder, Saba Sabir, Dinesh Chand, Anil Kumar Nain
Department of Chemistry, Jamia Millia Islamia (Central University), New Delhi 110 025, India
Received 13 January 2005; received in revised from 7 April 2005; accepted 8 April 2005
Available online 6 June 2005
Abstract
Density, q, viscosity, g, and refractive index, nD measurements have been carried out on a-amino acids, glycine, DL-alanine,
L-serine, and DL-valine (0.1 to 0.5) M in 0.2 M aqueous D-glucose solution at T = (298.15, 303.15, 308.15, and 313.15) K. These mea-
surements have been performed to evaluate some important parameters, viz, apparent molar volume, /v, limiting apparent molar
volume, /�v transfer volume, /�
vðtrÞ, viscosity A and B-coefficients of Jones–Dole equation, variation of B with temperature, dB/dT,
free energy of activation per mole of solvent, Dl�#1 , and solute, Dl�#
2 , respectively, and molar refractive index, RD. These parameters
have been interpreted in terms of solute–solute and solute–solvent interactions and structure making/breaking ability of solutes in
the given solution. In addition to this, /�v, B-coefficient and Dl�#
2 , have been split into group contributions NHþ3 ; COO�; and CH2
of the amino acids using their linear correlation with number of carbon atoms in the alkyl chain of the amino acids.
� 2005 Elsevier Ltd. All rights reserved.
Keywords: Amino acids; Glucose; Partial molar volume; B-coefficient; Transfer volume; Groups� contribution
1. Introduction
The present work is a continuation of our research
program [1–3], on the physicochemical studies of aminoacids (AAs) in mixed aqueous solution and the effect of
these compounds on water structure. Such study helps
in a better understanding of the interactions occurring
between amino acid molecules and entities present in
mixed aqueous medium in the living cells. Although a
lot of attention has been given to the behaviour of
AAs in different salt-water mixed solvents [4–8], very
few studies have been carried out on AAs in (carbohy-drate + water) mixtures [9–11], probably due to the
0021-9614/$ - see front matter � 2005 Elsevier Ltd. All rights reserved.
doi:10.1016/j.jct.2005.04.011
* Corresponding author. Tel.: +91 11 26981717x3257; fax: +91 11
26980229.
E-mail addresses: [email protected], [email protected]
(A. Ali).
complex nature of their interactions. Information has
been obtained about the interactions between carbohy-
drates and proteins from X-ray crystallography
[12,13], n.m.r. spectra, computer calculations [14], chro-matography data [15], and kinetic studies [16,17]. How-
ever, thermodynamic studies of these compounds in
solutions are rare.
Carbohydrates located at cell surfaces, are important
as receptors for the bioactive structures of harmones,
enzymes, viruses, antibodies, etc. [18]. Therefore, the
study of carbohydrate-protein interactions is very
important for immunology, biosynthesis, pharmacol-ogy, and medicine [9]. It is widely recognised that sugars
(as cosolutes) help in stabilizing biological macromole-
cules [19]. This action is performed either due to direct
interactions between them and/or through alteration of
the water structure [20–22]. These considerations led
us to undertake the study of amino acids (glycine

A. Ali et al. / J. Chem. Thermodynamics 38 (2006) 136–143 137
(Gly), DL-alanine (Ala), L-serine (Ser), and DL-valine
(Val)) in concentration range (0.1 to 0.5) M in 0.2 M
aqueous D-glucose solution at different temperatures.
Interactions of AAs in aqueous D-glucose solution and
the temperature dependence of these interactions play
a key role in understanding the biochemical processesin living cells.
In this paper, we report the densities, q, viscosities, g,and refractive indices, nD of (0.1, 0.2, 0.3, 0.4, and 0.5)
M Gly, Ala, Ser, and Val in 0.2 M aqueous D-glucose
solution at T = (298.15, 303.15, 308.15, and 313.15) K.
Various physical parameters like apparent molar vol-
ume, /v, limiting apparent molar volume, /�v transfer
volume, /�vðtrÞ, the viscosity A and B-coefficients derived
from Jones–Dole [23] equation, free energies of activa-
tion of viscous flow, Dl�#1 and Dl�#
2 per mole of solvent
and solutes, respectively, were calculated from the den-
sity and viscosity data. nD values were used to compute
molar refractivity, RD of the ternary mixtures under
study. All these parameters are discussed in terms of sol-
ute–solvent and solute–solute interactions occurring in
the (AA + glucose + water) systems and the structuremaking/breaking tendency of the solutes in the given
solvent.
In addition to this, the contributions of the charged
end groups ðNHþ3 ;COO�Þ and CH2 groups of the AAs
to, /�v, B-coefficient and Dl�#
2 have also been deter-
mined. The various contributory factors to the magni-
tude of polar /�v, B-coefficient and Dl�#
2 are discussed.
2. Experimental
Glycine (mass fraction >0.997, Merck), DL-alanine
(mass fraction >0.990, Loba-Chemie), L-serine (mass
fraction >0.985, Thomas Baker), and DL-valine (mass
fraction >0.990, Loba-Chemie) were used after recrys-
tallization from (ethanol + water) mixture and driedover P2O5 in a desiccator for 72 h. before use. D-Glucose
(mass fraction >0.990, Merck) was used as such without
any pretreatment. Aqueous glucose solution of 0.2 M
concentration was prepared using double distilled deion-
ized water and was used as solvent to prepare (0.1, 0.2,
0.3, 0.4, and 0.5) M amino acid solutions, which were
stored in special air tight bottles.Exposure of the solu-
tions to air was kept to a minimum to avoid contamina-tion and evaporation. The weighings were done on a
Precisa XB 220 A (Swiss make) electronic balance with
a precision of ±0.1 mg. The densities and viscosities of
the solutions were measured using a pycnometer and
Ubbelohde-type suspended level viscometer, respec-
tively, the method of which is given in our earlier work
[1–3]. The accuracies in q and g measurements were
found to be ±0.01 kg Æ m�3 and 3 Æ 10�6 N Æ m�2 Æ s,respectively. Refractive indices were measured with the
help of a thermostated Abbe-refractometer after cali-
brating it with distilled water and toluene at known tem-
peratures. g and nD measurements were carried out in
triplicate. The error in nD measurements was less than
±0.001 units. The temperature of the solutions was
maintained in an electronically controlled water bath
(JULABO, Germany) having a precision of ±0.02 K.
3. Results and discussion
The experimental values of q, g, and nD of 0.2 M
aqueous D-glucose solution and of (0.1, 0.2, 0.3, 0.4,
and 0.5) M amino acids in aqueous D-glucose solution
at T = (298.15, 303.15, 308.15, and 313.15) K are listedin table 1. The apparent molar volumes, /v were calcu-
lated from q data using the following relation:
/v ¼ ðq0 � qÞ=Cq0 þMq0; ð1Þwhere q and q0 are the densities of solution and solvent
(0.2 M aqueous D-glucose), respectively, C is the molar
concentration of amino acid and M is its molar mass.The calculated values of /v are included in table 2.
From the /v data, /v vs. C1/2 curves have been drawn
and the plots were found to be linear in the concentra-
tion range studied in all cases with positive slopes, as
represented by the following equation [24]:
/v ¼ /�v þ S�
vC1=2. ð2Þ
The intercept /�v which is the limiting apparent molar
volume of the solute (equal to the partial molar volume
at infinite dilution, �V �2) is obtained by the least-squares
fitting of /v values to the above equation. These values
along with the experimental slope, S�v are reported in
table 3. The volume behaviour of a solute at infinite
dilution is satisfactorily represented by /�v which is inde-
pendent of the solute–solute interactions and provides
information concerning solute–solvent interactions.
Table 3 reveals that the values of /�v are large positive
for all the ternary mixtures at all the temperatures inves-
tigated, suggesting the presence of strong solute–solvent
interactions in these mediums. Further, /�v values
increase as the size of alkyl group in the amino acids in-
creases from Gly to Val. The hydration behaviour ofamino acids can be examined by considering the follow-
ing interactions [25–30]: (a) the terminal groups of
zwitterions of AAs, NHþ3 and COO� are hydrated in
an electrostatic manner whereas, hydration of interven-
ing backbone depends on its nature which may be
hydrophobic, hydrophilic or amphiphilic; (b) electro-
striction of NHþ3 group is greater than COO� group
by a factor of �10; and (c) the overlap of hydration co-spheres of terminal (NHþ
3 and COO� groups) and of
adjacent groups results in volume change. /�v increases
due to the reduction in the electrostriction at the termi-
nals whereas it decreases due to disruption of side group
hydration by that of the charged end. A pronounced

TABLE 1
Values of density, q, viscosity, g, and refractive index, nD, of amino
acids, glycine, DL-alanine, L-serine, and DL-valine in aqueous D-glucose
at T = (298.15, 303.15, 308.15, and 313.15) K
C/(mol Æ l�1) 298.15 K 303.15 K 308.15 K 313.15 K
Glycine + aq. D-glucose
q/(kg Æ m�3)
0.0 1010.3 1008.7 1007.1 1005.3
0.1 1013.6 1011.9 1010.3 1008.4
0.2 1016.7 1015.0 1013.3 1011.4
0.3 1019.8 1018.1 1016.3 1014.4
0.4 1022.8 1021.1 1019.3 1017.4
0.5 1025.8 1024.1 1022.3 1020.4
10�3 Æ g/(N Æ m�2 Æ s)0.0 1.01 0.89 0.80 0.70
0.1 1.00 0.88 0.79 0.71
0.2 1.01 0.90 0.81 0.72
0.3 1.03 0.92 0.83 0.73
0.4 1.04 0.93 0.84 0.75
0.5 1.07 0.95 0.86 0.76
nD0.0 1.3360 1.3350 1.3349 1.3340
0.1 1.3372 1.3368 1.3361 1.3357
0.2 1.3381 1.3378 1.3372 1.3365
0.3 1.3398 1.3390 1.3387 1.3382
0.4 1.3410 1.3402 1.3398 1.3390
0.5 1.3420 1.3418 1.3413 1.3410
DL-Alanine + aq. D-glucose
q/(kg Æ m�3)
0.0 1010.3 1008.7 1007.1 1005.3
0.1 1013.8 1012.1 1010.4 1008.5
0.2 1016.6 1014.8 1013.0 1011.1
0.3 1018.9 1017.1 1015.3 1013.3
0.4 1021.0 1019.2 1017.3 1015.3
0.5 1022.9 1021.1 1019.2 1017.1
10�3 Æ g/(N Æ m�2 Æ s)0.0 1.01 0.89 0.80 0.70
0.1 1.02 0.90 0.81 0.71
0.2 1.04 0.93 0.83 0.74
0.3 1.07 0.95 0.85 0.75
0.4 1.10 0.97 0.87 0.77
0.5 1.12 0.99 0.89 0.79
nD0.0 1.3360 1.3350 1.3349 1.3340
0.1 1.3389 1.3379 1.3369 1.3360
0.2 1.3395 1.3387 1.3380 1.3372
0.3 1.3410 1.3400 1.3392 1.3385
0.4 1.3421 1.3413 1.3408 1.3399
0.5 1.3445 1.3425 1.3416 1.3411
L-Serine + aq. D-glucose
q/(kg Æ m�3)
0.0 1010.3 1008.7 1007.1 1005.3
0.1 1015.1 1013.4 1011.7 1009.8
0.2 1019.6 1017.8 1016.0 1014.0
0.3 1023.9 1022.1 1020.2 1018.1
0.4 1028.1 1026.3 1024.3 1022.2
0.5 1032.3 1030.4 1028.4 1026.2
TABLE 1 (continued)
C/(mol Æ l�1) 298.15 K 303.15 K 308.15
K
313.15 K
10�3 Æ g/(N Æ m�2 Æ s)0.0 1.01 0.89 0.80 0.70
0.1 1.05 0.92 0.81 0.71
0.2 1.08 0.94 0.84 0.73
0.3 1.12 0.97 0.86 0.75
0.4 1.15 1.00 0.88 0.77
0.5 1.17 1.02 0.90 0.78
nD0.0 1.3360 1.3350 1.3349 1.3340
0.1 1.3391 1.3383 1.3379 1.3372
0.2 1.3412 1.3406 1.3400 1.3397
0.3 1.3426 1.3420 1.3419 1.3413
0.4 1.3443 1.3440 1.3435 1.3431
0.5 1.3465 1.3459 1.3459 1.3454
DL-Valine + aq. D-glucose
q/(kg Æ m�3)
0.0 1010.3 1008.7 1007.1 1005.3
0.1 1013.0 1011.3 1009.6 1007.8
0.2 1015.5 1013.8 1012.0 1010.1
0.3 1018.0 1016.2 1014.3 1012.4
0.4 1020.4 1018.6 1016.6 1014.7
0.5 1022.8 1021.0 1018.9 1017.0
10�3 Æ g/(N Æ m�2 Æ s)0.0 1.01 0.89 0.80 0.70
0.1 1.04 0.92 0.83 0.74
0.2 1.08 0.97 0.88 0.78
0.3 1.14 1.01 0.92 0.82
0.4 1.18 1.06 0.96 0.86
0.5 1.22 1.09 1.00 0.89
nD0.0 1.3360 1.3350 1.3349 1.3340
0.1 1.3397 1.3381 1.3375 1.3369
0.2 1.3410 1.3401 1.3391 1.3385
0.3 1.3430 1.3428 1.3411 1.3402
0.4 1.3450 1.3442 1.3431 1.3428
0.5 1.3480 1.3460 1.3453 1.3445
138 A. Ali et al. / J. Chem. Thermodynamics 38 (2006) 136–143
increase in /�v from Gly to Val (table 3) may be attrib-
uted to the increased hydrophobicity/non-polar charac-
ter of the side chain as the H atom of Gly is replaced
by a hydrophobic group –CH3 in Ala and by a more
hydrophobic group –CH(CH3)2 in Val. As a conse-
quence of (b), relatively freer N-terminal in Gly would
cause the largest volume contraction followed by Ala
and least by Val in which the N-terminal is highlyshielded for electrostriction. Similar increase in /�
v with
increasing side chain length from Gly to Val have been
reported by Banipal and Kapoor [31], in aqueous solu-
tion. It may also be noted that for all the amino acids
in aqueous glucose solution, /�v increases with rise in
temperature. The increase in /�v with temperature may
be due to release of some solvent molecules from the
loose solvation layers of the solutes in solution [32].

TABLE 2
Values of apparent molar volume, /v, for amino acids, glycine, DL-
alanine, L-serine, and DL-valine in aqueous D-glucose at T = (298.15,
303.15, 308.15, and 313.15) K
C/(mol Æ l�1) 10�5 Æ /v/(m3 Æ mol�1)
298.15 K 303.15 K 308.15 K 313.15 K
Glycine + aq. D-glucose
0.1 4.16 4.27 4.33 4.38
0.2 4.26 4.32 4.38 4.43
0.3 4.30 4.34 4.41 4.45
0.4 4.34 4.37 4.43 4.46
0.5 4.36 4.39 4.44 4.46
DL-Alanine + aq. D-glucose
0.1 5.35 5.46 5.57 5.68
0.2 5.70 5.80 5.92 5.98
0.3 5.98 6.06 6.13 6.21
0.4 6.17 6.23 6.31 6.38
0.5 6.32 6.37 6.44 6.52
L-Serine + aq. D-glucose
0.1 5.65 5.76 5.87 5.98
0.2 5.80 5.91 6.02 6.13
0.3 5.92 5.99 6.10 6.21
0.4 6.00 6.06 6.17 6.25
0.5 6.05 6.12 6.20 6.30
DL-Valine + aq. D-glucose
0.1 8.92 9.04 9.15 9.22
0.2 9.02 9.09 9.20 9.267
0.3 9.06 9.14 9.25 9.30
0.4 9.10 9.16 9.27 9.32
0.5 9.12 9.18 9.29 9.33
A. Ali et al. / J. Chem. Thermodynamics 38 (2006) 136–143 139
The experimental S�v values (table 3) for all the amino
acids are found to be positive but smaller than /�v values,
suggesting that solute–solute interactions are weaker
than solute–solvent interactions in the systems under
study. For all the amino acids studied, S�v decreases with
temperature. This indicates the decreased solute–solute
interaction with rise in temperature. Generally speaking,
the types of interactions occurring between the AA mol-ecules and D-glucose molecules can be classified as
follows:
(i) Hydrophilic-ionic interactions between the OH
group of the carbohydrate and the zwitterionic
centres of the AAs.
(ii) Hydrophobic–hydrophobic interactions between
the non-polar side groups of the carbohydratemolecules and the AAs.
(iii) Hydrophilic–hydrophilic interactions between the
OH group of the carbohydrate molecules and the
OH group of the AAs.
(iv) Hydrophilic–hydrophobic interactions between
the OH group of the carbohydrate molecules and
the non-polar side group of the AAs.
Similar types of interactions were also suggested by
Huaji et al. [10], in their study of enthalpic behaviour
of Gly, Ala, and Ser in aqueous saccharides at
T = 298.15 K.
The transfer volumes, /�vðtrÞ of the AAs from aque-
ous glucose to aqueous solution were calculated using
the following equation:
/�vðtrÞ ¼ /�
vðaq: glucoseÞ � /�vðaqÞ; ð3Þ
and are included in table 3. The /�vðaqÞ at T = (298.15,
308.15, and 313.15) K were taken from the literature
[26,31,33,34]. The /�vðtrÞ are found to be negative for
all the AAs� solutions at all studied temperatures. As po-
sitive /�vðtrÞ values are reported for Gly in higher con-
centrations of glucose in water by other workers
[11,35], we may conclude that /�vðtrÞ decreases with de-
crease in concentration of glucose and ultimately gives
negative values in our case. The increased concentra-
tions of glucose lead to the greater hydrophilic-ionic
and hydrophilic–hydrophilic interactions that are not
compounded by hydrophilic–hydrophobic interactions.
Increase in /�vðtrÞ with increase in glucose concentration
has also been reported by Changwei et al. [36] in argi-
nine + aqueous glucose solutions.It is of interest to examine the contribution of
side-chain residues (R = CH3, CH2OH, and CH(CH3)2)
on the a-C of AAs to the partial molar volumes [37],
and transfer volumes [38], using the following
equations:
/�vðRÞ ¼ /�
v ðsubstituted AAÞ � /�vðGlyÞ; ð4Þ
/�vðtrÞðRÞ ¼ /�
vðtrÞ ðsubstituted AAÞ � /�vðtrÞðGlyÞ; ð5Þ
where /�vðRÞ is the contribution of the R group to the
partial molar volume, /�v and /�
vðtrÞðRÞ is the contribu-tion of the R group to the transfer volume /�
vðtrÞ and are
given in table 3. In this calculation it is assumed that vol-ume contribution of the H atom in Gly can be neglected.
The results of /�vðRÞ reveal that the contribution of R
group is significant and positive for all the AAs and they
increase with increase in side-chain from CH3 to
CH(CH3)2. The /�vðtrÞðRÞ are all negative and increase
as we move from Ala to Val. The introduction of a
CH3 group in Ala and CH(CH3)2 group in Val provides
additional tendency of hydrophilic–hydrophobic (type(iv)) as well as hydrophobic–hydrophobic (type (ii))
interactions, while the replacement of one H atom of
Ala by OH group in Ser adds to hydrophilic–hydro-
philic interactions (type (iii)). This may be supported
by the work of Quingwang et al. [38], on the ternary sys-
tems glycine, L-alanine, and L-serine in (ethylene gly-
col + water) mixtures, in which similar results have
been reported.The viscosity A and B coefficients for the AAs in
aqueous D-glucose solutions were calculated from the
Jones–Dole equation [23,24]
gr ¼ g=go ¼ 1þ AC1=2 þ BC; ð6Þ

TABLE 3
Values of limiting apparent molar volume, /�v, experimental slope, S�
v, /�vðwaterÞ, volume transfer, /�
vðtrÞ, and side chain contribution to /�v, and /�
vðtrÞ,for amino acids, glycine, DL-alanine, L-serine, and DL-valine in aqueous D-glucose solution at T = (298.15, 303.15, 308.15, and 313.15) K
298.15 K 303.15 K 308.15 K 313.15 K
Glycine + aq. D-glucose
10�5 � /�v=ðm3 �mol�1Þ 4.02 4.18 4.24 4.33
10�6 � S�v=ðm3 �mol�3=2 � l1=2Þ 4.95 2.98 2.83 1.98
10�5 � /�vðwaterÞ=ðm3 �mol�1Þ 4.32a 4.38 4.40b
10�5 � /�vðtrÞ=ðm3 �mol�1Þ �0.30 �0.14 �0.07
DL-Alanine + aq. D-glucose
10�5 � /�v=ðm3 �mol�1Þ 4.57 4.74 4.89 5.01
10�6 � S�v=ðm3 �mol�3=2 � l1=2Þ 25.07 23.40 22.37 21.50
10�5 � /�vðwaterÞ=ðm3 �mol�1Þ 6.05a 6.10a 6.12c
10�5 � /�vðtrÞ=ðm3 �mol�1Þ �1.47 �1.21 �1.11
10�5 � /�vðCH3Þ=ðm3 �mol�1Þ 0.55 0.56 0.64 0.68
10�5 � /�vðtrÞðCH3Þ=ðm3 �mol�1Þ �1.17 �1.07 �3.28
L-Serine + aq. D-glucose
10�5 � /�v=ðm3 �mol�1Þ 5.33 5.48 5.61 5.75
10�6 � S�v=ðm3 �mol�3=2 � l1=2Þ 10.33 9.01 8.65 8.03
10�5 � /�vðwaterÞ=ðm3 �mol�1Þ 6.06a 6.12a 6.17c
10�5 � /�vðtrÞ=ðm3 �mol�1Þ �0.73 �0.50 �0.42
10�5 � /�vðCH2OHÞ=ðm3 �mol�1Þ 1.31 1.31 1.37 1.41
10�5 � /�vðtrÞðCH2OHÞ=ðm3 �mol�1Þ �0.42 �0.30 �3.96
DL-Valine + aq. D-glucose
10�5 � /�v=ðm3 �mol�1Þ 8.78 8.92 9.04 9.13
10�6 � S�v=ðm3 �mol�3=2 � l1=2Þ 4.95 3.68 3.68 2.84
10�5 � /�vðwaterÞ=ðm3 �mol�1Þ 9.09a 9.15a 9.17d
10�5 � /�vðtrÞ=ðm3 �mol�1Þ �0.32 �0.12 �0.03
10�5 � /�vCHðCH3Þ2=ðm3 �mol�1Þ 4.76 4.74 4.79 4.80
10�5 � /�vðtrÞCHðCH3Þ2=ðm3 �mol�1Þ �0.02 �0.06 �0.03
a Data taken from reference [31].b Data taken from reference [33].c Data taken from reference [26].d Data taken from reference [34].
140 A. Ali et al. / J. Chem. Thermodynamics 38 (2006) 136–143
where gr is the relative viscosity, g and go are the viscos-ities of the solution and the solvent (aqueous D-glucose),
respectively. A is determined by the ionic attraction the-
ory of Falkenhagen–Vernon and therefore also called
Falkenhagen coefficient [24], B or Jones–Dole coefficient
is an empirical constant determined by solute–solvent
and solvent–solvent interactions. A and B were obtained
from the intercepts and slopes of the plots of (gr � 1)/C1/2
vs. C1/2.
Eyring and co-workers [39], proposed that the free
energy of activation of viscous flow per mole of solvent,
Dl�#1 could be calculated from the following equation:
g0 ¼ ðhNA=�V�1Þ expðDl
�#1 =RT Þ; ð7Þ
where h; NA; and �V �1 are the Planck�s constant, Avoga-
dro�s number and partial molar volume of the solvent,
respectively. On rearranging we get
Dl�#1 ¼ RT lnðgo �V
�1=hNAÞ. ð8Þ
Feakins et al. [40], showed that if equations (6) and (8)
are obeyed, then
B ¼ ð�V �1 � �V �
2Þ þ �V �1 ðDl�#
2 � Dl�#1 Þ=RT
� �; ð9Þ
where �V �2 is the partial molar volume ð/�
vÞ of the solute
(AAs). It can be rearranged as follows:
Dl�#2 ¼ Dl�#
1 þ ðRT =V �1Þ B� ð�V �
1 � �V �2Þ
� �. ð10Þ
The values of A; B; Dl�#1 and Dl�#
2 are included in table
4. It is observed from table 4 that the larger and positive
values of B-coefficient compared to A-coefficient sup-
port the behaviour of /�v and S�
v, respectively, both sug-
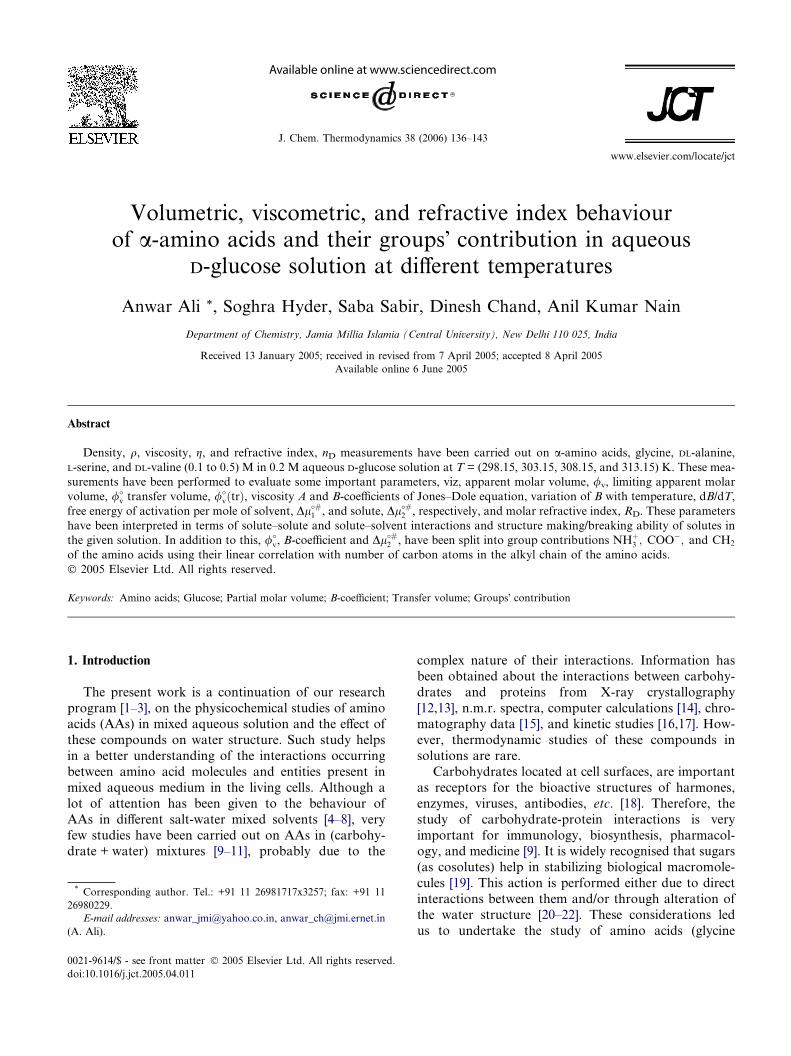
gesting stronger solute–solvent interactions as comparedto solute–solute interactions. The variation of B with
temperature, dB/dT provides direct evidence regarding
structure-making or breaking ability of the solute in
the solution. Figure 1 depicts that B for Gly decreases
with rise in temperature whereas for Ser and Val it in-
creases with increase in temperature. Since dB/dT is
negative for structure-maker and positive for structure-
breaker [41], we can classify Gly as structure-makerand Ser and Val as structure-breaker in aqueous D-
glucose solutions. Ser having a polar OH group is in-
volved in hydrogen bonding with water, resulting in a
more pronounced breaking up of solvent structure.
The B value for Ala increases up to T = 303.15 K and
then decreases at higher temperatures. This might be

TABLE 4
Values of A and B coefficients of Jones–Dole equation, free energy of activation for the solvent, Dl�#1 and solute, Dl�#
2 for amino acids, glycine, DL-
alanine, L-serine, and DL-valine in aqueous D-glucose at T = (298.15, 303.15, 308.15, and 313.15) K
298.15 K 303.15 K 308.15 K 313.15 K
Glycine + aq. D-glucose
10�2 Æ A/(dm3/2 Æmol�1/2) �12.65 �9.51 �7.01 �4.92
10�1 Æ B/(dm3 Æ mol�1) 3.01 2.76 2.65 2.57
Dl�#1 =ðkJ �mol�1Þ 9.51 9.36 9.23 9.05
Dl�#2 =ðkJ �mol�1Þ 52.95 50.28 49.33 48.73
DL-Alanine + aq. D-glucose
10�2 Æ A/(dm3/2 Æmol�1/2) �6.14 �5.20 �3.20 �1.83
10�1 Æ B/(dm3 Æ mol�1) 3.26 3.27 3.07 3.05
Dl�#1 =ðkJ �mol�1Þ 9.51 9.36 9.23 9.05
Dl�#2 =ðkJ �mol�1Þ 57.04 58.09 56.01 56.39
L-Serine + aq. D-glucose
10�2 Æ A/(dm3/2 Æmol�1/2) 4.53 1.25 �2.17 �5.87
10�1 Æ B/(dm3 Æ mol�1) 2.77 2.90 3.13 3.33
Dl�#1 =ðkJ �mol�1Þ 9.51 9.36 9.23 9.05
Dl�#2 =ðkJ �mol�1Þ 51.44 53.97 57.81 61.43
DL-Valine + aq. D-glucose
10�2 Æ A/(dm3/2 Æmol�1/2) �4.57 �3.07 �1.21 �1.26
10�1 Æ B/(dm3 Æ mol�1) 5.04 5.18 5.46 5.46
Dl�#1 =ðkJ �mol�1Þ 9.51 9.36 9.23 9.05
Dl�#2 =ðkJ �mol�1Þ 86.62 89.85 94.83 96.04
2.0
2.5
3.0
3.5
4.0
4.5
5.0
5.5
6.0
293 298 303 308 313 318
T/ K
10-1
. B/(
dm ·3
mol
-1)
FIGURE 1. Variation of B against temperatures T/K for the amino
acids {(r) glycine, (j) DL-alanine, (m) L-serine, and (——) DL-valine}
in aqueous glucose.
A. Ali et al. / J. Chem. Thermodynamics 38 (2006) 136–143 141
due to decrease in solvation at higher temperatures. This
behaviour suggests enhancing of water structure by Ala
at lower temperature and disruption of liquid structure
at higher temperatures.
It is evident from table 4 that Dl�#2 values are positive
and much larger than Dl�#1 , suggesting that the interac-
tions between solute (amino acids) and solvent
(water + D-glucose) molecules in the ground state are
stronger than in the transition state. Thus, the solvation
of the solute in the transition state is unfavourable in
free energy terms. Further, Dl�#2 increases from Gly to
Val at a given temperature, indicating that the solvation
of amino acid molecules becomes increasingly unfavour-
able as the hydrophobicity or the number of carbon
atoms of the side chain increases from Gly to Val. Thus,
the results inferred from Dl�#2 are consistent with those
inferred from /�v.
3.1. Amino acids group contributions
A more useful discussion of the volumetric and
viscometric data can be achieved by separating the
contribution of ðNHþ3 ;COO�Þ and ðCH2Þ groups to
/�v, B-coefficient, and Dl�#
2 values of amino acids. It
is observed that /�v values of amino acids vary linearly
with the number of C atoms in their alkyl chains at
given temperatures. This linear relation can be repre-
sented by
/�v ¼ /�
vðNHþ3 ;COO�Þ þ nc/
�vðCH2Þ; ð11Þ
where nc is the number of C atoms in the alkyl chain of
the AAs. The alkyl chain of the homologous series ofa-amino acids investigated in this work are: CH2–
(Gly), CH3CH– (Ala), and CH3CH3CHCH– (Val). As
proposed by Hakin et al. [42,43]
/�vðCH3Þ ¼ 1.5/�
vðCH2Þ; ð12Þ
/�vðCHÞ ¼ 0.5/�
vðCH2Þ. ð13Þ
A linear regression analysis of /�v values at any given
temperature using equation (11) gives /�v of zwitterionic
end group ðNHþ3 ;COO�Þ and /�
v of methylene group
(CH2) contributions. The OH group contribution of
Ser was obtained by
3.80
3.85
3.90
3.95
4.00
4.05
4.10
0 0.1 0.2 0.3 0.4 0.5
C / (mol . l-1)
10-6
.R
D/(
m3 ·m
ol-1
)
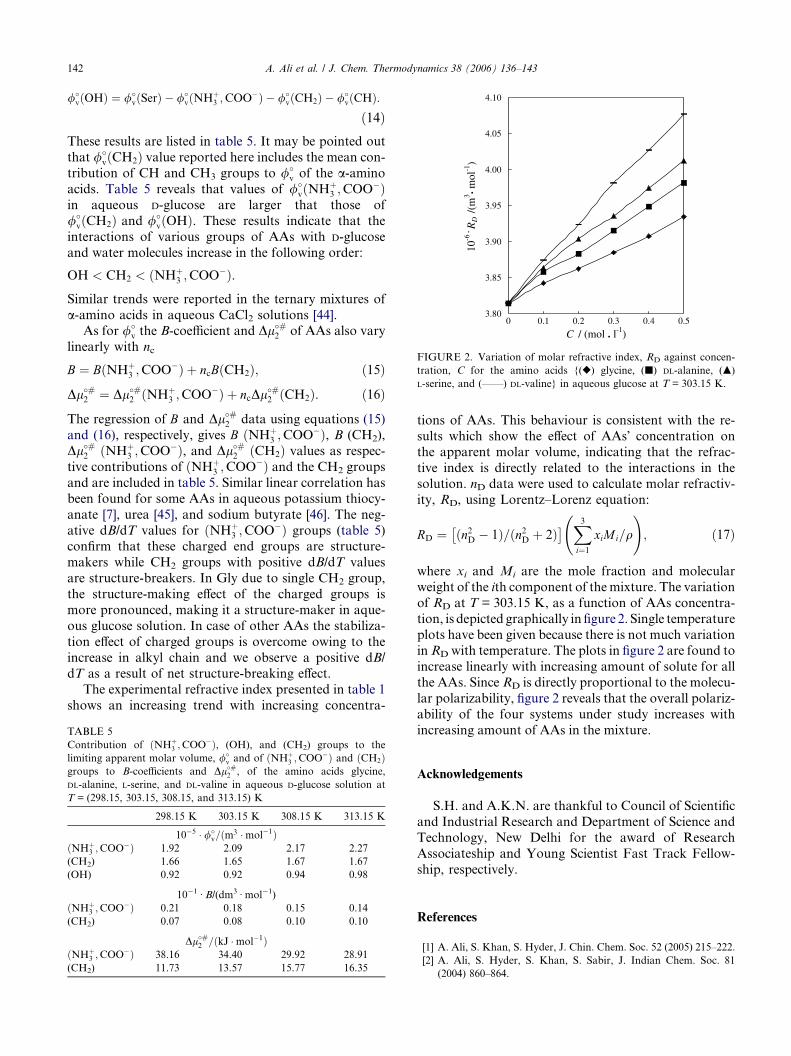
FIGURE 2. Variation of molar refractive index, RD against concen-
tration, C for the amino acids {(r) glycine, (j) DL-alanine, (m)
L-serine, and (——) DL-valine} in aqueous glucose at T = 303.15 K.
142 A. Ali et al. / J. Chem. Thermodynamics 38 (2006) 136–143
/�vðOHÞ ¼ /�
vðSerÞ � /�vðNHþ
3 ;COO�Þ � /�vðCH2Þ � /�
vðCHÞ.ð14Þ
These results are listed in table 5. It may be pointed out
that /�vðCH2Þ value reported here includes the mean con-
tribution of CH and CH3 groups to /�v of the a-amino
acids. Table 5 reveals that values of /�vðNHþ
3 ;COO�Þin aqueous D-glucose are larger that those of
/�vðCH2Þ and /�
vðOHÞ. These results indicate that the
interactions of various groups of AAs with D-glucose
and water molecules increase in the following order:
OH < CH2 < ðNHþ3 ;COO�Þ.
Similar trends were reported in the ternary mixtures of
a-amino acids in aqueous CaCl2 solutions [44].As for /�
v the B-coefficient and Dl�#2 of AAs also vary
linearly with nc
B ¼ BðNHþ3 ;COO�Þ þ ncBðCH2Þ; ð15Þ
Dl�#2 ¼ Dl�#
2 ðNHþ3 ;COO�Þ þ ncDl
�#2 ðCH2Þ. ð16Þ
The regression of B and Dl�#2 data using equations (15)
and (16), respectively, gives B ðNHþ3 ;COO�Þ, B (CH2),
Dl�#2 ðNHþ
3 ;COO�Þ, and Dl�#2 ðCH2Þ values as respec-
tive contributions of ðNHþ3 ;COO�Þ and the CH2 groups
and are included in table 5. Similar linear correlation has
been found for some AAs in aqueous potassium thiocy-
anate [7], urea [45], and sodium butyrate [46]. The neg-
ative dB/dT values for ðNHþ3 ;COO�Þ groups (table 5)
confirm that these charged end groups are structure-
makers while CH2 groups with positive dB/dT values
are structure-breakers. In Gly due to single CH2 group,
the structure-making effect of the charged groups is
more pronounced, making it a structure-maker in aque-
ous glucose solution. In case of other AAs the stabiliza-
tion effect of charged groups is overcome owing to the
increase in alkyl chain and we observe a positive dB/dT as a result of net structure-breaking effect.
The experimental refractive index presented in table 1
shows an increasing trend with increasing concentra-
TABLE 5
Contribution of ðNHþ3 ;COO�Þ, (OH), and (CH2) groups to the
limiting apparent molar volume, /�v and of ðNHþ
3 ;COO�Þ and ðCH2Þgroups to B-coefficients and Dl�#
2 , of the amino acids glycine,
DL-alanine, L-serine, and DL-valine in aqueous D-glucose solution at
T = (298.15, 303.15, 308.15, and 313.15) K
298.15 K 303.15 K 308.15 K 313.15 K
10�5 � /�v=ðm3 �mol�1Þ
ðNHþ3 ;COO�Þ 1.92 2.09 2.17 2.27
(CH2) 1.66 1.65 1.67 1.67
(OH) 0.92 0.92 0.94 0.98
10�1 Æ B/(dm3 Æ mol�1)
ðNHþ3 ;COO�Þ 0.21 0.18 0.15 0.14
(CH2) 0.07 0.08 0.10 0.10
Dl�#2 =ðkJ �mol�1ÞðNHþ
3 ;COO�Þ 38.16 34.40 29.92 28.91
(CH2) 11.73 13.57 15.77 16.35
tions of AAs. This behaviour is consistent with the re-
sults which show the effect of AAs� concentration onthe apparent molar volume, indicating that the refrac-
tive index is directly related to the interactions in the
solution. nD data were used to calculate molar refractiv-
ity, RD, using Lorentz–Lorenz equation:
RD ¼ ðn2D � 1Þ=ðn2D þ 2Þ� � X3
i¼1
xiMi=q
!; ð17Þ
where xi and Mi are the mole fraction and molecular
weight of the ith component of the mixture. The variation
of RD at T = 303.15 K, as a function of AAs concentra-
tion, is depicted graphically in figure 2. Single temperature
plots have been given because there is not much variationinRD with temperature. The plots in figure 2 are found to
increase linearly with increasing amount of solute for all
the AAs. Since RD is directly proportional to the molecu-
lar polarizability, figure 2 reveals that the overall polariz-
ability of the four systems under study increases with
increasing amount of AAs in the mixture.
Acknowledgements
S.H. and A.K.N. are thankful to Council of Scientific
and Industrial Research and Department of Science and
Technology, New Delhi for the award of Research
Associateship and Young Scientist Fast Track Fellow-
ship, respectively.
References
[1] A. Ali, S. Khan, S. Hyder, J. Chin. Chem. Soc. 52 (2005) 215–222.
[2] A. Ali, S. Hyder, S. Khan, S. Sabir, J. Indian Chem. Soc. 81
(2004) 860–864.

A. Ali et al. / J. Chem. Thermodynamics 38 (2006) 136–143 143
[3] A. Ali, S. Hyder, Y. Akhtar, Indian J. Phys. 79 (2) (2005) 157–160.
[4] A. Soto, A. Arce, M. Khoshkbarchi, J.H. Vera, Biophys. Chem.
73 (1998) 77–83.
[5] R. Bhat, J.C. Ahluwalia, J. Phys. Chem. 89 (1985) 1099–1105.
[6] R. Bhat, J.C. Ahluwalia, Int. J. Peptide Protein Res. 30 (1987)
145–152.
[7] R.K. Wadi, R.K. Goyal, J. Solution Chem. 21 (1992) 163–170.
[8] T. Ogawa, K. Mitzutani, M. Yasuda, Bull. Chem. Soc. Jpn. 57
(1984) 2064–2068.
[9] E.V. Parfenyuk, O.I. Davydova, N.S. Lebedeva, J. Solution
Chem. 33 (2004) 1–10.
[10] H. Liu, R. Lin, H. Zhang, J. Chem. Eng. Data 49 (2004) 416–420.
[11] A. Pal, S. Kumar, J. Indian Chem. Soc. 79 (2002) 866–870.
[12] M.E. Newcomer, B.A. Lewis, F.A. Quiocho, J. Biol. Chem. 254
(1981) 13218–13222.
[13] F.A. Quiocho, N.K. Vyas, Nature (London) 310 (1984) 381–386.
[14] K. Bock,M.E. Breimer, A. Brignole, G.C. Hunson, K.A.Karlsson,
G. Larson, H.H. Leffler, B.E. Samuelsson, N. Stromberg, C.
Svanborg, Eden, J. Thurin, J. Biol. Chem. 260 (1985) 8545–8551.
[15] T. Osawa, T. Tsuji, Annu. Rev. Biochem. 56 (1987) 21–40.
[16] D.M. Miller, III, J.S. Olson, J.V. Pflugrath, F.A. Quiocho, J.
Biol. Chem. 258 (1983) 13665–13672.
[17] D.M. Miller III, J.S. Olson, F.A. Quiocho, J. Biol. Chem. 255
(1980) 2465–2471.
[18] D.E. MetzlerThe Chemical Reactions of Living Cells, vol. 1,
Academic Press, New Yok, 1977.
[19] T.C. Bai, G.B. Yan, Carbohydr. Res. 338 (2003) 2921–2927.
[20] S. Antipova, M.G. Semenova, L.E. Belyakova, Colloid Surface B
12 (1999) 261–270.
[21] S.N. Timasheff, T. Arakawa, in: Protein Structure: A Practical
Approach, in: T.E.E. Creighton (Ed.), Stability of Protein
Structure by Solvents, Oxford University Press, Oxford, 1989.
[22] A.S. Antipova, M.G. Semenova, Carbohydr. Polym. 28 (1995)
359–365.
[23] G. Jones, M. Dole, J. Am. Chem. Soc. 51 (1929) 2950–2964.
[24] J.D. Pandey, K. Mishra, A. Shukla, V. Mishran, R.D. Rai,
Thermochim. Acta 117 (1987) 245–259.
[25] D.P. Kharakoz, J. Phys. Chem. 95 (1991) 5634–5642.
[26] D.P. Kharakoz, Biophys. Chem. 34 (1989) 115–125.
[27] G.R. Hedwig, H. Hioland, J. Chem. Thermodyn. 25 (1993) 349–
354.
[28] F.J. Millero, A.L. Surdo, C. Shin, J. Phys. Chem. 82 (1978) 784–
792.
[29] A.K. Mishra, J.C. Ahluwalia, J. Phys. Chem. 88 (1984) 86–92.
[30] E.J. Cohn, T.J. Edsall, Proteins, Amino Acids and Peptides,
Hafner, New York, 1965.
[31] T.S. Banipal, P. Kapoor, J. Indian Chem. Soc. 76 (1999)
431–437.
[32] R.K. Wadi, P. Ramasami, J. Chem. Soc., Faraday Trans. 93
(1997) 243–247.
[33] T.V. Chalikan, A.P. Sarvazyan, K.J. Breslauser, J. Phys. Chem.
97 (1993) 13017–13026.
[34] M.M. Duke, A.W. Hakin, R.M. Mickay, K.E. Preuss, Can. J.
Chem. 72 (1994) 1489–1494.
[35] R. Bhat, N. Kishore, J.C. Ahluwalia, J. Chem. Soc., Faraday
Trans. 1 84 (1988) 2651–2665.
[36] C. Zhao, P. Ma, J. Li, J. Chem. Thermodyn. 37 (2005) 37–42.
[37] G.R. Hedwig, Biopolymers 32 (1992) 537–540.
[38] Q. Liu, X. Hu, R. Lin, W. Sang, S. Li, J. Chem. Eng. Data 46
(2001) 522–525.
[39] S. Glasstone, K.J. Laidle, H. Eyring, The Theory of Rate
Processes, McGraw-Hill, New York, 1941.
[40] D. Feakins, F.M. Canning, W.E. Waghorne, K.G. Lawrence, J.
Chem. Soc., Faraday Trans. 89 (1993) 3381–3388.
[41] N. Dey, B.K. Saikia, Can. J. Chem. 58 (1980) 1512–1515.
[42] W. Hakin, M.M. Duke, J.L. Marty, K.E. Preuss, J. Chem. Soc.,
Faraday Trans. 90 (1994) 2027–2035.
[43] W. Hakin, M.M. Duke, L.L. Groft, J.L. Marty, M.L. Rashfeldt,
Can. J. Chem. 73 (1995) 725–734.
[44] Z. Yan, J. Wang, W. Kong, J. Lu, Fluid Phase Equilibr. 215
(2004) 143–150.
[45] J. Wang, Z. Yan, H. Zhang, J. Lu, Biophys. Chem. 86 (2000) 71–
78.
[46] Z. Yan, J. Wang, J. Lu, J. Chem. Eng. Data 46 (2001) 217–222.
JCT 05-13