volume no 4 issue no 06 (june issn 2231-5756
TRANSCRIPT

VOLUME NO. 4 (2014), ISSUE NO. 06 (JUNE) ISSN 2231-5756
A Monthly Double-Blind Peer Reviewed (Refereed/Juried) Open Access International e-Journal - Included in the International Serial Directories Indexed & Listed at:
Ulrich's Periodicals Directory ©, ProQuest, U.S.A., EBSCO Publishing, U.S.A., Cabell’s Directories of Publishing Opportunities, U.S.A.,
Open J-Gage, India [link of the same is duly available at Inflibnet of University Grants Commission (U.G.C.)],
Index Copernicus Publishers Panel, Poland with IC Value of 5.09 & number of libraries all around the world.
Circulated all over the world & Google has verified that scholars of more than 3412 Cities in 173 countries/territories are visiting our journal on regular basis.
Ground Floor, Building No. 1041-C-1, Devi Bhawan Bazar, JAGADHRI – 135 003, Yamunanagar, Haryana, INDIA
http://ijrcm.org.in/

VOLUME NO. 4 (2014), ISSUE NO. 06 (JUNE) ISSN 2231-5756
INTERNATIONAL JOURNAL OF RESEARCH IN COMMERCE, IT & MANAGEMENT A Monthly Double-Blind Peer Reviewed (Refereed/Juried) Open Access International e-Journal - Included in the International Serial Directories
http://ijrcm.org.in/
ii
CONTENTS
Sr. No.
TITLE & NAME OF THE AUTHOR (S) Page No.
1. MARKET REACTIONS TOWARDS CAPITAL EXPENDITURE ANNOUNCEMENTS DR. SHANTANU MEHTA & RAJALAKSHMI VEL
1
2. IMPACT OF INFORMATION TECHNOLOGY ON MSMEs IN INDORE REGION PARUL SHARDA & DR. M. D. PANGA
5
3. COMPLIANCE OF CORPORATE GOVERNANCE AND ITS IMPACT ON FIRM PERFORMANCE: AN EMPIRICAL ANALYSIS WITH DUMMY VARIABLES DR. PALLAVI KAPOORIA, DR. R. C. SHARMA & DR. DEEPAK KAUL
9
4. CAUSE RELATED MARKETING AND ITS IMPACT ON BRAND PREFERENCES & BRAND ATTACHMENT AMONG CUSTOMERS AT BHAVNAGAR CITY WITH SPECIAL REFERENCE TO P&G FMCG PRODUCTS BHAVIK P PARMAR
13
5. (SACCOS) AFFAIRS IN ETHIOPIA: A CASE STUDY IN MEKELLE CITY, TIGRAY KIDANU NERIE AREGAWI, DR. TESFATSIONSAHLUDESTA & HIWET KEBEDE AREGAWI
15
6. AN APPROACH TOWARDS EFFICIENT PREFERNCED DATA RETRIVAL BY PRESORTING SUNITA DWIVEDI & DR. ANIL RAJPUT
25
7. PERCEIVED USEFULNESS, USER ACCEPTANCE OF E-BANKING AND SUCCESSFUL TRANSITION TO CASHLESS POLICY IN NIGERIA CLEMENT IKENNA OKEKE
30
8. SENSITIVITY OF INTERNAL AND EXTERNAL CHANGE JUSTICE AS A PREDICTOR IN PRIVATE SECTOR UROOS FATIMA RIZVI & FASAHAT HUSAIN QAZI
39
9. PRODUCTIVITY IMPROVEMENT THROUGH PREVENTIVE MAINTENANCE: THE CASE OF ATSC TEXTILE MANUFACTURING FIRM AMARE MATEBU KASSA
46
10. A STUDY OF FACTORS RELATED TO SUCCESS & FAILURE OF ENTREPRENEURS IN SMALL SCALE INDUSTRIES WITH IMPORTANCE ON THEIR LEVEL OF EDUCATION AND TRAINING DEEPAK KUMAR
51
11. MAJOR USES AND PREFERRED PAYMENT SYSTEMS IN NIGERIA: APPLICATION OF WORD OF MOUTH COMMUNICATION IN PROMOTING CASHLESS POLICY OF CBN CLEMENT IKENNA OKEKE
53
12. CHALLENGES FACED BY BANKING INDUSTRY IN UAE: REENGINEERING THE OPERATIONAL EFFICIENCIES DR. BEENISH SHAMEEM
60
13. FACE DETECTION IN NIGHT VISION IMAGES: AN APPLICATION OF BPDFHE METHODOLOGY ANURAG RAY & ASHIS PRADHAN
62
14. UNITED ARAB EMIRATES: THE INTEGRATION OF BUSINESS TECHNOLOGY AND CORPORATE COMPETIVENESS DR. BEENISH SHAMEEM
66
15. A STUDY OF RECRUITMENT PRACTICES FROM TRADITIONAL TO e-RECRUITMENT: A PARADIGM SHIFT ABDUL GHANI FAIYYAZ
68
REQUEST FOR FEEDBACK & DISCLAIMER 72
VOLUME NO. 4 (2014), ISSUE NO. 06 (JUNE) ISSN 2231-5756
INTERNATIONAL JOURNAL OF RESEARCH IN COMMERCE, IT & MANAGEMENT A Monthly Double-Blind Peer Reviewed (Refereed/Juried) Open Access International e-Journal - Included in the International Serial Directories
http://ijrcm.org.in/
iii
CHIEF PATRON PROF. K. K. AGGARWAL
Chairman, Malaviya National Institute of Technology, Jaipur (An institute of National Importance & fully funded by Ministry of Human Resource Development, Government of India)
Chancellor, K. R. Mangalam University, Gurgaon Chancellor, Lingaya’s University, Faridabad
Founder Vice-Chancellor (1998-2008), Guru Gobind Singh Indraprastha University, Delhi Ex. Pro Vice-Chancellor, Guru Jambheshwar University, Hisar
FOUNDER PATRON LATE SH. RAM BHAJAN AGGARWAL
Former State Minister for Home & Tourism, Government of Haryana Former Vice-President, Dadri Education Society, Charkhi Dadri Former President, Chinar Syntex Ltd. (Textile Mills), Bhiwani
CO-ORDINATOR AMITA
Faculty, Government M. S., Mohali
ADVISORS DR. PRIYA RANJAN TRIVEDI
Chancellor, The Global Open University, Nagaland
PROF. M. S. SENAM RAJU Director A. C. D., School of Management Studies, I.G.N.O.U., New Delhi
PROF. M. N. SHARMA Chairman, M.B.A., Haryana College of Technology & Management, Kaithal
PROF. S. L. MAHANDRU Principal (Retd.), Maharaja Agrasen College, Jagadhri
EDITOR PROF. R. K. SHARMA
Professor, Bharti Vidyapeeth University Institute of Management & Research, New Delhi
CO-EDITOR DR. BHAVET
Faculty, Shree Ram Institute of Business & Management, Urjani
EDITORIAL ADVISORY BOARD DR. RAJESH MODI
Faculty, Yanbu Industrial College, Kingdom of Saudi Arabia
PROF. SANJIV MITTAL University School of Management Studies, Guru Gobind Singh I. P. University, Delhi
PROF. ANIL K. SAINI Chairperson (CRC), Guru Gobind Singh I. P. University, Delhi

VOLUME NO. 4 (2014), ISSUE NO. 06 (JUNE) ISSN 2231-5756
INTERNATIONAL JOURNAL OF RESEARCH IN COMMERCE, IT & MANAGEMENT A Monthly Double-Blind Peer Reviewed (Refereed/Juried) Open Access International e-Journal - Included in the International Serial Directories
http://ijrcm.org.in/
iv
DR. SAMBHAVNA Faculty, I.I.T.M., Delhi
DR. MOHENDER KUMAR GUPTA Associate Professor, P. J. L. N. Government College, Faridabad
DR. SHIVAKUMAR DEENE Asst. Professor, Dept. of Commerce, School of Business Studies, Central University of Karnataka, Gulbarga
ASSOCIATE EDITORS PROF. NAWAB ALI KHAN
Department of Commerce, Aligarh Muslim University, Aligarh, U.P.
PROF. ABHAY BANSAL Head, Department of Information Technology, Amity School of Engineering & Technology, Amity
University, Noida
PROF. A. SURYANARAYANA Department of Business Management, Osmania University, Hyderabad
DR. SAMBHAV GARG Faculty, Shree Ram Institute of Business & Management, Urjani
PROF. V. SELVAM SSL, VIT University, Vellore
DR. PARDEEP AHLAWAT Associate Professor, Institute of Management Studies & Research, Maharshi Dayanand University, Rohtak
DR. S. TABASSUM SULTANA Associate Professor, Department of Business Management, Matrusri Institute of P.G. Studies, Hyderabad
SURJEET SINGH Asst. Professor, Department of Computer Science, G. M. N. (P.G.) College, Ambala Cantt.
TECHNICAL ADVISOR AMITA
Faculty, Government M. S., Mohali
FINANCIAL ADVISORS DICKIN GOYAL
Advocate & Tax Adviser, Panchkula
NEENA Investment Consultant, Chambaghat, Solan, Himachal Pradesh
LEGAL ADVISORS JITENDER S. CHAHAL
Advocate, Punjab & Haryana High Court, Chandigarh U.T.
CHANDER BHUSHAN SHARMA Advocate & Consultant, District Courts, Yamunanagar at Jagadhri
SUPERINTENDENT SURENDER KUMAR POONIA

VOLUME NO. 4 (2014), ISSUE NO. 06 (JUNE) ISSN 2231-5756
INTERNATIONAL JOURNAL OF RESEARCH IN COMMERCE, IT & MANAGEMENT A Monthly Double-Blind Peer Reviewed (Refereed/Juried) Open Access International e-Journal - Included in the International Serial Directories
http://ijrcm.org.in/
v
CALL FOR MANUSCRIPTS We invite unpublished novel, original, empirical and high quality research work pertaining to recent developments & practices in the areas of Computer Science & Applications; Commerce; Business; Finance; Marketing; Human Resource Management; General Management; Banking; Economics; Tourism Administration & Management; Education; Law; Library & Information Science; Defence & Strategic Studies; Electronic Science; Corporate Governance; Industrial Relations; and emerging paradigms in allied subjects like Accounting; Accounting Information Systems; Accounting Theory & Practice; Auditing; Behavioral Accounting; Behavioral Economics; Corporate Finance; Cost Accounting; Econometrics; Economic Development; Economic History; Financial Institutions & Markets; Financial Services; Fiscal Policy; Government & Non Profit Accounting; Industrial Organization; International Economics & Trade; International Finance; Macro Economics; Micro Economics; Rural Economics; Co-operation; Demography: Development Planning; Development Studies; Applied Economics; Development Economics; Business Economics; Monetary Policy; Public Policy Economics; Real Estate; Regional Economics; Political Science; Continuing Education; Labour Welfare; Philosophy; Psychology; Sociology; Tax Accounting; Advertising & Promotion Management; Management Information Systems (MIS); Business Law; Public Responsibility & Ethics; Communication; Direct Marketing; E-Commerce; Global Business; Health Care Administration; Labour Relations & Human Resource Management; Marketing Research; Marketing Theory & Applications; Non-Profit Organizations; Office Administration/Management; Operations Research/Statistics; Organizational Behavior & Theory; Organizational Development; Production/Operations; International Relations; Human Rights & Duties; Public Administration; Population Studies; Purchasing/Materials Management; Retailing; Sales/Selling; Services; Small Business Entrepreneurship; Strategic Management Policy; Technology/Innovation; Tourism & Hospitality; Transportation Distribution; Algorithms; Artificial Intelligence; Compilers & Translation; Computer Aided Design (CAD); Computer Aided Manufacturing; Computer Graphics; Computer Organization & Architecture; Database Structures & Systems; Discrete Structures; Internet; Management Information Systems; Modeling & Simulation; Neural Systems/Neural Networks; Numerical Analysis/Scientific Computing; Object Oriented Programming; Operating Systems; Programming Languages; Robotics; Symbolic & Formal Logic; Web Design and emerging paradigms in allied subjects.
Anybody can submit the soft copy of unpublished novel; original; empirical and high quality research work/manuscript anytime in M.S. Word format after preparing the same as per our GUIDELINES FOR SUBMISSION; at our email address i.e. [email protected] or online by clicking the link online submission as given on our website (FOR ONLINE SUBMISSION, CLICK HERE).
GUIDELINES FOR SUBMISSION OF MANUSCRIPT 1. COVERING LETTER FOR SUBMISSION:
DATED: _____________ THE EDITOR IJRCM
Subject: SUBMISSION OF MANUSCRIPT IN THE AREA OF.
(e.g. Finance/Marketing/HRM/General Management/Economics/Psychology/Law/Computer/IT/Engineering/Mathematics/other, please specify)
DEAR SIR/MADAM
Please find my submission of manuscript entitled ‘___________________________________________’ for possible publication in your journals.
I hereby affirm that the contents of this manuscript are original. Furthermore, it has neither been published elsewhere in any language fully or partly, nor is it under review for publication elsewhere.
I affirm that all the author (s) have seen and agreed to the submitted version of the manuscript and their inclusion of name (s) as co-author (s).
Also, if my/our manuscript is accepted, I/We agree to comply with the formalities as given on the website of the journal & you are free to publish our contribution in any of your journals.
NAME OF CORRESPONDING AUTHOR: Designation: Affiliation with full address, contact numbers & Pin Code: Residential address with Pin Code: Mobile Number (s): Landline Number (s): E-mail Address: Alternate E-mail Address:
NOTES: a) The whole manuscript is required to be in ONE MS WORD FILE only (pdf. version is liable to be rejected without any consideration), which will start from
the covering letter, inside the manuscript. b) The sender is required to mentionthe following in the SUBJECT COLUMN of the mail:
New Manuscript for Review in the area of (Finance/Marketing/HRM/General Management/Economics/Psychology/Law/Computer/IT/ Engineering/Mathematics/other, please specify)
c) There is no need to give any text in the body of mail, except the cases where the author wishes to give any specific message w.r.t. to the manuscript. d) The total size of the file containing the manuscript is required to be below 500 KB. e) Abstract alone will not be considered for review, and the author is required to submit the complete manuscript in the first instance. f) The journal gives acknowledgement w.r.t. the receipt of every email and in case of non-receipt of acknowledgment from the journal, w.r.t. the submission
of manuscript, within two days of submission, the corresponding author is required to demand for the same by sending separate mail to the journal.
2. MANUSCRIPT TITLE: The title of the paper should be in a 12 point Calibri Font. It should be bold typed, centered and fully capitalised.
3. AUTHOR NAME (S) & AFFILIATIONS: The author (s) full name, designation, affiliation (s), address, mobile/landline numbers, and email/alternate email address should be in italic & 11-point Calibri Font. It must be centered underneath the title.
4. ABSTRACT: Abstract should be in fully italicized text, not exceeding 250 words. The abstract must be informative and explain the background, aims, methods, results & conclusion in a single para. Abbreviations must be mentioned in full.

VOLUME NO. 4 (2014), ISSUE NO. 06 (JUNE) ISSN 2231-5756
INTERNATIONAL JOURNAL OF RESEARCH IN COMMERCE, IT & MANAGEMENT A Monthly Double-Blind Peer Reviewed (Refereed/Juried) Open Access International e-Journal - Included in the International Serial Directories
http://ijrcm.org.in/
vi
5. KEYWORDS: Abstract must be followed by a list of keywords, subject to the maximum of five. These should be arranged in alphabetic order separated by commas and full stops at the end.
6. MANUSCRIPT: Manuscript must be in BRITISH ENGLISH prepared on a standard A4 size PORTRAIT SETTING PAPER. It must be prepared on a single space and single column with 1” margin set for top, bottom, left and right. It should be typed in 8 point Calibri Font with page numbers at the bottom and centre of every page. It should be free from grammatical, spelling and punctuation errors and must be thoroughly edited.
7. HEADINGS: All the headings should be in a 10 point Calibri Font. These must be bold-faced, aligned left and fully capitalised. Leave a blank line before each heading.
8. SUB-HEADINGS: All the sub-headings should be in a 8 point Calibri Font. These must be bold-faced, aligned left and fully capitalised.
9. MAIN TEXT: The main text should follow the following sequence:
INTRODUCTION
REVIEW OF LITERATURE
NEED/IMPORTANCE OF THE STUDY
STATEMENT OF THE PROBLEM
OBJECTIVES
HYPOTHESES
RESEARCH METHODOLOGY
RESULTS & DISCUSSION
FINDINGS
RECOMMENDATIONS/SUGGESTIONS
CONCLUSIONS
SCOPE FOR FURTHER RESEARCH
ACKNOWLEDGMENTS
REFERENCES
APPENDIX/ANNEXURE
It should be in a 8 point Calibri Font, single spaced and justified. The manuscript should preferably not exceed 5000 WORDS.
10. FIGURES &TABLES: These should be simple, crystal clear, centered, separately numbered & self explained, and titles must be above the table/figure. Sources of data should be mentioned below the table/figure. It should be ensured that the tables/figures are referred to from the main text.
11. EQUATIONS:These should be consecutively numbered in parentheses, horizontally centered with equation number placed at the right.
12. REFERENCES: The list of all references should be alphabetically arranged. The author (s) should mention only the actually utilised references in the preparation of manuscript and they are supposed to follow Harvard Style of Referencing. The author (s) are supposed to follow the references as per the following:
All works cited in the text (including sources for tables and figures) should be listed alphabetically.
Use (ed.) for one editor, and (ed.s) for multiple editors.
When listing two or more works by one author, use --- (20xx), such as after Kohl (1997), use --- (2001), etc, in chronologically ascending order.
Indicate (opening and closing) page numbers for articles in journals and for chapters in books.
The title of books and journals should be in italics. Double quotation marks are used for titles of journal articles, book chapters, dissertations, reports, working papers, unpublished material, etc.
For titles in a language other than English, provide an English translation in parentheses.
The location of endnotes within the text should be indicated by superscript numbers.
PLEASE USE THE FOLLOWING FOR STYLE AND PUNCTUATION IN REFERENCES: BOOKS
Bowersox, Donald J., Closs, David J., (1996), "Logistical Management." Tata McGraw, Hill, New Delhi.
Hunker, H.L. and A.J. Wright (1963), "Factors of Industrial Location in Ohio" Ohio State University, Nigeria. CONTRIBUTIONS TO BOOKS
Sharma T., Kwatra, G. (2008) Effectiveness of Social Advertising: A Study of Selected Campaigns, Corporate Social Responsibility, Edited by David Crowther & Nicholas Capaldi, Ashgate Research Companion to Corporate Social Responsibility, Chapter 15, pp 287-303.
JOURNAL AND OTHER ARTICLES
Schemenner, R.W., Huber, J.C. and Cook, R.L. (1987), "Geographic Differences and the Location of New Manufacturing Facilities," Journal of Urban Economics, Vol. 21, No. 1, pp. 83-104.
CONFERENCE PAPERS
Garg, Sambhav (2011): "Business Ethics" Paper presented at the Annual International Conference for the All India Management Association, New Delhi, India, 19–22 June.
UNPUBLISHED DISSERTATIONS AND THESES
Kumar S. (2011): "Customer Value: A Comparative Study of Rural and Urban Customers," Thesis, Kurukshetra University, Kurukshetra. ONLINE RESOURCES
Always indicate the date that the source was accessed, as online resources are frequently updated or removed. WEBSITES
Garg, Bhavet (2011): Towards a New Natural Gas Policy, Political Weekly, Viewed on January 01, 2012 http://epw.in/user/viewabstract.jsp

VOLUME NO. 4 (2014), ISSUE NO. 06 (JUNE) ISSN 2231-5756
INTERNATIONAL JOURNAL OF RESEARCH IN COMMERCE, IT & MANAGEMENT A Monthly Double-Blind Peer Reviewed (Refereed/Juried) Open Access International e-Journal - Included in the International Serial Directories
http://ijrcm.org.in/
1
MARKET REACTIONS TOWARDS CAPITAL EXPENDITURE ANNOUNCEMENTS
DR. SHANTANU MEHTA DIRECTOR
ST. KABIR INSTITUTE OF PROFESSIONAL STUDIES AHMEDABAD
RAJALAKSHMI VEL ASST. PROFESSOR
ST. KABIR INSTITUTE OF PROFESSIONAL STUDIES AHMEDABAD
ABSTRACT
This study attempts to examine share price reactions to a firm’s capital expenditure announcements in the Indian stock market. While previous studies make important contributions to furthering our understanding of the valuation effects of corporate investment decisions, they do not suggest why capital allocation decisions of some companies are favorably received by the market, whereas similar decisions of other companies are discouraged by the market. Therefore the pertinent research question is to examine the key determinants of positive/negative abnormal returns. In this study we postulate investment opportunities by focused firms are assessed positively (increase) by market and those by diversified firms are assessed negatively by the market (decrease) irrespective of their industry background. Our empirical results are consistent with these predictions. The results of our study support our conjecture that focused firms tend to have better investment opportunities than highly diversified firms.
KEYWORDS Investment opportunities, Event study, Capital Expenditure, Abnormal returns.
JEL CLASSIFICATION G14
INTRODUCTION orporate managers are regularly faced with three major policy decisions: Investment decisions, dividend (payout) decisions, and financing decisions. A number of studies have rigorously examined the impact of announcements of corporate financing and dividend decisions on the market value of firms (Masulis, 1980, 1983; Eades et al., 1985; Kalay and Lowenstein, 1985; Ofer and Siegel, 1987; Barclay and Litzenberger, 1988; Lang and Litzenberger, 1989;
Loderer and Mauer, 1992; Denis, 1994; Jung et al., 1996). However, empirical evidence on the valuation effects of announcements of corporate capital expenditure decisions is relatively sparse. This study aims to provide evidence on the impact of capital expenditure decisions on share prices in the Indian stock market.
LITERATURE REVIEW
McConnell and Muscarella (1985) examine the market reaction to capital expenditure decisions by industrial and public utility firms. They find that announcements of increases (decreases) in capital expenditures lead to significant positive (negative) stock returns for industrial firms. For public utility firms, however, they find that announcements of capital expenditure decisions do not have any material effect on stock returns. Chan et al. (1990) examine the market response to announcements of R&D spending by firms in both high and low-technology industries. They find that those firms in high-technology industries which announce increases in R&D spending, on average, experience positive abnormal returns, but those in low-technology industries experience negative returns. Chan et al. (1994) find that the stock market reacts positively to business relocation decisions that are motivated by business expansion or cost savings, but negatively to decisions that are motivated by capacity reduction or facilities consolidation.
IMPORTANCE OF THE STUDY In a competitive market, funds for capital expenditure will be allocated to projects that enhance the firm’s long-term prospects. Based on the premise, markets should react positively to corporate announcements of capital expenditure decisions to the extent it maximizes firm value. While previous studies make important contributions to furthering our understanding of the valuation effects of corporate investment decisions, they do not suggest why capital allocation decisions of some companies are favorably received by the market, whereas similar decisions of other companies are discouraged by the market. Therefore the pertinent research question is to examine the key determinants of positive/negative abnormal returns. For this, it is important to understand investment opportunities by both focused and diversified firms.
STATEMENT OF THE PROBEM
As suggested by Wernfelt and Montgomery (1988) and Lang and Stulz (1994), focused firms tend to have better investment opportunities than highly diversified firms. Therefore investment opportunities by focused firms are assessed positively (increase) by market and those by diversified firms are assessed negatively by the market (decrease) irrespective of their industry background. This rests on the premise that since firms with better investment opportunities are more likely to invest in positive net present value projects, capital investments by focused firms will be more worthwhile than those by diversified companies.
OBJECTIVES OF THE STUDY The objectives of the study are stated as follows: 1. To conduct an event study of capital expenditure announcements. 2. To examine if market reactions vary with the characteristics of the company making the announcement.
HYPOTHESIS Hypothesis1: Announcements of increase in capital expenditures by focused are viewed favourably by the market Hypothesis2: Announcements of increase in capital expenditures by diversified firms are received negatively by market.
FRAMEWORK FOR RESEARCH The standard event study methodology and regression analysis are employed to empirically test the hypothesis.
C

VOLUME NO. 4 (2014), ISSUE NO. 06 (JUNE) ISSN 2231-5756
INTERNATIONAL JOURNAL OF RESEARCH IN COMMERCE, IT & MANAGEMENT A Monthly Double-Blind Peer Reviewed (Refereed/Juried) Open Access International e-Journal - Included in the International Serial Directories
http://ijrcm.org.in/
2
CHARACTERISTICS OF INVESTMENT DECISIONS Kester provided classification for capital expenditure decisions for project appraisal. The following investment categories emerge out of the classification provided. - Cost reduction projects - Asset expenditure projects - Product/market diversification projects - Research and development projects All the above classifications of investment decisions are covered for the study. SAMPLE SELECTION PROCEDURE Data on capital expenditure announcements are collected from NSE India and Capitaline database for the period starting 1st April 2013 to 31st December 2013. For each capital expenditure news, an announcement date is identified. Initially 12 companies were identified with capital expenditure announcements. However, only companies meeting the following criteria were finalized as samples. i. Announcements pertinent to capital spending decisions are selected in the sample. Thus announcements of acquisitions, tender offers, strategic
alliances are excluded from the sample. ii. Announcements must contain information about the approximate size and the general use of funds. iii. Announcements must be made in isolation of other announcements (i.e. earnings, dividend, split, bonus etc). This reduces the effect of extraneous
information on stock prices. iv. Finally companies whose daily return data for the period of the study must be available from nseindia.com. These restrictions eliminate 7 samples from the initial database.
METHODOLOGY MEASURING ABNORMAL RETURNS The study employs the standard event study methodology to measure abnormal returns around capital expenditure announcements. The estimation period is from -7 to +7 days prior to announcement. Daily stock return data during the study period of 30 days are obtained from nesindia.com. Let Rit designate the stock return of firm i on day t. Then the abnormal return of firm i (ARit) during the event period is measured using the following formula: ARit = Rit – (ά + βiRm) CAPITAL EXPENDITURE ANNOUNCEMENTS MAHINDRA AND MAHINDRA Announcement Date: 4/9/2013 Announcement Details: M&M announced 10000 Crore in next three year with the purpose of launching new products. A new plant would be set up Maharashtra for this purpose. Of the 10,000 crore capex, Rs 7,500 crore are for automotive and farm equipment and another Rs 2,500 crore investment will be on group companies. CAIRN INDIA Announcement Date: 13/7/2013 Announcement Details: Cairn India has announced a capex of Rs 16,000 crore or $3 billion for finding and producing more oil over the next three years through the end of FY 2016. In Rajasthan alone, the company will be investing over Rs 13,000 crore and drilling over 450 wells comprising 100 exploration wells and over 350 development wells. RELIANCE INDUSTRIES Announcement Date: 6/06/2013 Announcement Details: Reliance industries announced a planned capital outlay of Rs1,50,000 crore over the next three years, spread over its core business of petrochemicals and oil as well as the retail and telecom sectors. The investments span oil and gas exploration and production, refining and marketing, petrochemicals, retail and broadband and digital services. NTPC Announcement Date: 17/09/2013 Announcement Details: NTPC has planned capital expenditure of over Rs.20,000 crore during the current fiscal till March 31, 2014. This would take its installed power generation capacity to over 41,000 MW. POWER GRID CORPORATION Announcement Date: 19/09/2013 Announcement Details: State-run Power Grid Corp has announced its capital expenditure for 2012-17 by Rs 10,000 crore in view of additional projects and adding transmission capacity undertaken by the firm. A company is also taking additional projects are being taken up including the smart grid projects, joint ventures with other firms.
ANALYSIS TABLE 1
Days Cairn MM Power Grid NTPC Reliance
Exp Return Abnormal Return
Exp Return Abnormal Return
Exp Return Abnormal Return
Exp Return Abnormal Return
Exp Return Abnormal Return
7 1.67 2.33 0.66 6.34 -0.48 -2.37 0.94 -2.49 0.17 1.45
6 1.25 -0.85 -0.39 6.39 0.64 -1.15 1.08 1.59 0.31 0.57
5 0.57 -2.12 -0.80 5.80 -0.44 1.71 1.64 1.03 0.55 -1.52
4 2.06 0.63 0.10 3.90 0.74 2.07 0.85 -2.21 -0.48 -2.86
3 -0.24 0.71 0.13 2.87 -0.48 -0.01 0.24 1.40 -0.59 -1.37
2 1.17 -1.59 -0.63 2.63 -0.49 0.39 0.83 1.12 0.85 -2.17
1 0.92 -0.39 -0.23 1.23 -0.94 -1.40 0.19 -0.08 0.08 2.68
D-Day -0.63 3.46 1.03 0.61 0.74 0.10 0.85 1.19 0.24 -1.24
1 -1.25 0.25 -0.02 1.02 0.39 -1.23 0.86 2.35 -0.03 -1.30
2 -0.94 0.10 -0.07 2.07 -0.60 1.21 1.10 -1.78 -0.26 0.30
3 -0.56 -1.69 -0.66 3.66 0.09 1.42 0.19 0.70 -0.45 0.72
4 -1.81 -0.31 -0.21 4.21 -0.30 -0.40 0.38 -2.57 0.11 0.88
5 0.65 1.12 0.26 4.74 0.56 -0.91 0.92 2.20 -0.46 1.33
6 -0.90 -4.05 -1.44 7.44 0.50 -0.66 0.54 1.90 1.21 1.10
7 -1.59 2.37 0.67 6.33 -0.46 1.22 0.76 0.05 -0.21 1.44

VOLUME NO. 4 (2014), ISSUE NO. 06 (JUNE) ISSN 2231-5756
INTERNATIONAL JOURNAL OF RESEARCH IN COMMERCE, IT & MANAGEMENT A Monthly Double-Blind Peer Reviewed (Refereed/Juried) Open Access International e-Journal - Included in the International Serial Directories
http://ijrcm.org.in/
3
EMPIRICAL RESULTS The above table reports abnormal returns surrounding the capital expenditure announcements made by Indian firms during the six month period. The sample is a mix of firms to enable market reaction of focused and diversified companies to be analysed. The investigation period is one week before and one week after the announcement date. For four samples of focused firms the market reaction is positive and significant for the day of the announcement. There is post announcement drift in one sample. For diversified company positive returns are observed in the pre-announcement period (-1,-3,-4 & -5 days). This is consistent with the previous literature given by Wernfelt and Montgomery (1988) and Lang and Stulz (1994) that focused firms tend to have better investment opportunities than highly diversified firms
CONCLUSION Abnormal returns around announcement date of capital expenditures
TABLE 2
Days Both Focused Companies Diversified Companies
AR (%) t-Value AR (%) t-Value AR (%) t-Value
-5 4.90 0.74 6.42 1.12 -1.52 0.61
-4 1.53 1.7 4.39 2.13 -2.86 1.07
-3 3.60 3.13 4.97 3.59 -1.37 2.35
-2 0.38 2.4 2.55 3.07 -2.17 1.72
-1 2.04 1.79 -0.64 2.98 2.68 1.43
0 -0.26 1.51 0.96 1.98 -1.24 1.48
1 1.09 1.69 0.21 1.94 -1.30 1.64
13.28 2.46** 18.86 3.53*** -7.78 1.94*
* Significant at the 10% level ** Significant at the 5% level *** Significant at the 1% level The mean difference test of focused companies and diversified companies portfolios is statistically significant at the 5% level (t-statistic of 1.72) Table 2 shows that the CAR value for focused company is 18.86 and is statistically significant at the 1% level. The corresponding CAR value for diversified companies is -7.78 and is statistically significant at the 10% level. The mean difference test of CAR between the two portfolios is statistically significant at the 5% level (with a t-statistic of 1.72). We observe that the wealth effects of capital expenditure decisions by focused companies are more favourably rated than those by diversified companies. The finding of this study also supports hypotheses which assert that focused companies are perceived to be more likely to emphasize the maximization of shareholder wealth than diversified companies. The findings of this investigation are also consistent with a recent study by Ferris, Kim and Kitsabunnarat (2003) who found that diversified companies experience loss of shareholder wealth because of the tendency of managers to over-invest and deviate from the wealth maximization principle.
SCOPE FOR FURTHER RESEARCH Further research can be extended to consider other characteristics that may reveal the quality of the firms’ investment opportunities which determines positive/negative reactions.
ANNEXURE TABLE 3
Cairn India Ltd Y variable X variable
Days Dates Closing Price Stock Return Index Closing Index Return Expected Return Abnormal Returns
7 15-Jul-13 302.65 4.0034 6030.8 0.6609 1.67 2.33
6 16-Jul-13 303.2 0.3973 5955.25 0.4122 1.25 -0.85
5 17-Jul-13 295.7 -1.5481 5973.3 0.0175 0.57 -2.12
4 18-Jul-13 303.65 2.6885 6038.05 0.8914 2.06 0.63
3 19-Jul-13 308.05 0.4729 6029.2 -0.4622 -0.24 0.71
2 22-Jul-13 306.7 -0.422 6031.8 0.3669 1.17 -1.59
1 23-Jul-13 310 0.5351 6077.8 0.2226 0.92 -0.39
D-Day 24-Jul-13 308.6 2.8323 5990.5 -0.6912 -0.63 3.46
1 25-Jul-13 304.25 -0.9925 5907.5 -1.0535 -1.25 0.25
2 26-Jul-13 303.45 -0.8333 5886.2 -0.8715 -0.94 0.10
3 29-Jul-13 297.55 -2.2503 5831.65 -0.6524 -0.56 -1.69
4 30-Jul-13 292.15 -2.1273 5755.05 -1.3879 -1.81 -0.31
5 31-Jul-13 295.15 1.7758 5742 0.0636 0.65 1.12
6 1-Aug-13 289.9 -4.9508 5727.85 -0.849 -0.90 -4.05
7 2-Aug-13 296.3 0.7823 5677.9 -1.2547 -1.59 2.37
TABLE 4 Mahindra & Mahindra Y variable X variable
Days Dates Closing Price Stock Return Index Closing Index Return Expected Return Abnormal Returns
7 30-Apr-13 924.1 2.4104 5930.2 -0.0405 -0.1194 2.5298
6 2-May-13 953.6 4.3440 5999.35 1.4878 0.3832 3.9608
5 3-May-13 961 0.8924 5944 -0.8259 -0.3777 1.2701
4 6-May-13 966.45 1.1884 5971.05 0.4399 0.0386 1.1498
3 7-May-13 959.1 -0.2133 6043.55 1.0044 0.2243 -0.4375
2 8-May-13 946.4 -1.7493 6069.3 0.0849 -0.0782 -1.6711
1 9-May-13 947.9 0.3547 6050.15 -0.4639 -0.2587 0.6134
D-Day 10-May-13 970.2 2.5310 6094.75 0.8022 0.1577 2.3733
1 11-May-13 967.6 0.2435 6107.25 0.3129 -0.0032 0.2466
2 13-May-13 956.35 -0.7936 5980.45 -1.9309 -0.7412 -0.0524
3 14-May-13 950.8 -0.4658 5995.4 0.0952 -0.0748 -0.3910
4 15-May-13 983.75 3.1996 6146.75 2.1250 0.5928 2.6068
5 16-May-13 985.4 0.5510 6169.9 0.6796 0.1174 0.4336
6 17-May-13 987.3 0.7346 6187.3 0.2325 -0.0296 0.7643
7 20-May-13 1,002.00 1.7672 6156.9 -0.6631 -0.3242 2.0914

VOLUME NO. 4 (2014), ISSUE NO. 06 (JUNE) ISSN 2231-5756
INTERNATIONAL JOURNAL OF RESEARCH IN COMMERCE, IT & MANAGEMENT A Monthly Double-Blind Peer Reviewed (Refereed/Juried) Open Access International e-Journal - Included in the International Serial Directories
http://ijrcm.org.in/
4
TABLE 5
Power Grid Y variable X variable
Days Dates Closing Price Stock Return Index Closing Index Return Expected Return Abnormal Returns
7 11-Sep-13 99 -2.85 5913.15 0.44 -0.4764 -2.37
6 12-Sep-13 99 -0.50 5850.7 -1.36 0.6437 -1.15
5 13-Sep-13 99.75 1.27 5850.6 0.39 -0.4439 1.71
4 16-Sep-13 102.55 2.81 5840.55 -1.51 0.7417 2.07
3 17-Sep-13 101.55 -0.49 5850.2 0.45 -0.4805 -0.01
2 18-Sep-13 100.4 -0.10 5899.45 0.45 -0.4856 0.39
1 19-Sep-13 100.4 -2.33 6115.55 1.18 -0.9388 -1.40
D-Day 20-Sep-13 101.6 0.84 6012.1 -1.51 0.7423 0.10
1 23-Sep-13 99.25 -0.85 5889.75 -0.94 0.3858 -1.23
2 24-Sep-13 99.15 0.61 5892.45 0.64 -0.6010 1.21
3 25-Sep-13 100.5 1.52 5873.85 -0.47 0.0906 1.42
4 26-Sep-13 99.3 -0.70 5882.25 0.16 -0.3024 -0.40
5 27-Sep-13 98.95 -0.35 5833.2 -1.23 0.5619 -0.91
6 30-Sep-13 98.05 -0.15 5735.3 -1.13 0.5047 -0.66
7 1-Oct-13 99 0.76 5780.05 0.42 -0.4616 1.22
TABLE 6
NTPC Y variable X variable
Days Dates Closing Price Stock Return Index Closing Index Return Expected Return Abnormal Returns
7 5-Sep-13 130.45 -1.55 5592.95 0.71 0.9418 -2.49
6 6-Sep-13 134.3 2.68 5680.4 1.12 1.0825 1.59
5 10-Sep-13 138.6 2.67 5896.75 2.76 1.6376 1.03
4 11-Sep-13 137.6 -1.36 5913.15 0.44 0.8517 -2.21
3 12-Sep-13 139.45 1.64 5850.7 -1.36 0.2425 1.40
2 13-Sep-13 141.1 1.95 5850.6 0.39 0.8340 1.12
1 16-Sep-13 142.95 0.11 5840.55 -1.51 0.1893 -0.08
D-Day 17-Sep-13 143.15 0.13 5850.2 0.00 0.8539 -0.72
1 18-Sep-13 144.9 3.21 5899.45 0.45 0.8567 2.35
2 19-Sep-13 147.1 -0.68 6115.55 1.18 1.1031 -1.78
3 20-Sep-13 148.3 0.88 6012.1 -1.51 0.1890 0.70
4 23-Sep-13 142.8 -2.19 5889.75 -0.94 0.3828 -2.57
5 24-Sep-13 145.45 3.12 5892.45 0.64 0.9194 2.20
6 25-Sep-13 149 2.44 5873.85 -0.47 0.5433 1.90
7 26-Sep-13 149.7 0.81 5882.25 0.16 0.7571 0.05
TABLE 7
Reliance Y variable X variable
Days Dates Closing Price Stock Return Index Closing Index Return Expected Return Abnormal Returns
7 28-May-13 843.4 1.61 112.5 0.13 0.1679 1.45
6 29-May-13 847.9 0.88 113.5 0.49 0.3128 0.57
5 30-May-13 836.8 -0.97 114.4 1.06 0.5477 -1.52
4 31-May-13 806.3 -3.33 113.3 -1.44 -0.4752 -2.86
3 3-Jun-13 787.9 -1.97 111.4 -1.72 -0.5920 -1.37
2 4-Jun-13 780.2 -1.32 113.2 1.80 0.8504 -2.17
1 5-Jun-13 802 2.75 112.45 -0.09 0.0768 2.68
D-Day 6-Jun-13 792 -1.00 112.05 0.31 0.2416 -1.24
1 7-Jun-13 783.6 -1.33 110.65 -0.36 -0.0344 -1.30
2 10-Jun-13 789.35 0.04 110 -0.90 -0.2561 0.30
3 11-Jun-13 785.6 0.27 107.85 -1.37 -0.4491 0.72
4 12-Jun-13 790.8 0.99 108 0.00 0.1132 0.88
5 13-Jun-13 789.8 0.87 105.75 -1.40 -0.4601 1.33
6 14-Jun-13 814.65 2.32 109.1 2.68 1.2127 1.10
7 17-Jun-13 825.55 1.23 108.2 -0.78 -0.2063 1.44
REFERENCES 1. Chung IL, Koford KJ and Lee I. (1993), “Stock market views of corporate multinationalism: Some evidence from announcements of international joint
ventures,” The Quarterly Review of Economics and Finance, Vol. 33(1), pp. 275-293. 2. Fama EF and French KR. (1996), “Multifactor explanation of asset pricing,” Journal of Finance, Vol. 51(1), pp.55-84. 3. Kee H. Chung a, Peter Wright A, Charlie Charoenwong. (1997), “Investment opportunities and market reaction to capital expenditure decisions,” Journal of
Banking & Finance, Vol.22, pp. 41-60 4. Lynn, Ling Yew Hua and Junaid M. Shaikh. (2011), “Stock Market Reaction towards Capital Expenditure Announcements: Malaysia Case for Servicing and
Manufacturing Industry,” Global review of Accounting and Finance, Vol. 2(1), pp. 29-41 5. McConnell JJ and Nantell T. (1985), “Corporate combinations and common stock returns,” Journal of Finance, Vol.40 (2), pp. 519-536. 6. Strong N. (1992), “Modelling abnormal returns: A review article,’ Journal of Business Finance & Accounting, Vol.19 (4), pp.533-553 7. Woolridge JR and Snow C. (1990), “Stock market reaction to strategic investment decisions,” Strategic Management Journal, Vol.11(5), pp.353-363.

VOLUME NO. 4 (2014), ISSUE NO. 06 (JUNE) ISSN 2231-5756
INTERNATIONAL JOURNAL OF RESEARCH IN COMMERCE, IT & MANAGEMENT A Monthly Double-Blind Peer Reviewed (Refereed/Juried) Open Access International e-Journal - Included in the International Serial Directories
http://ijrcm.org.in/
5
IMPACT OF INFORMATION TECHNOLOGY ON MSMEs IN INDORE REGION
PARUL SHARDA RESEARCH SCHOLAR
MEDI-CAPS INSTITUTE OF TECHNO-MANAGEMENT INDORE
DR. M. D. PANGA
DIRECTOR MEDI-CAPS INSTITUTE OF TECHNO-MANAGEMENT
INDORE
ABSTRACT The Micro, Small and Medium scale enterprises (MSMEs) today playing a pivotal role in the economic and social development of Indian economy, contributing through industrial outputs, employment, exports, investment, innovations etc. Though MSME sector in India is highly heterogeneous in terms of the size of the enterprises, variety of products, and services, and levels of technology with a total of 30 million MSME units. MSMEs contribution towards GDP was 17% in year 2011, and raised to 22% in year 2012. in today’s era of Indian globalization MSMEs are facing new challenges and some are struggling hard to survive due to lack of modernization, non-availability of suitable technology, inability to identify new markets etc, these shortcomings can be workout through technology improvement and skill enhancement with the help of Information technology (IT) infrastructure. Through this paper I have attempted to investigate the relationship between MSMEs competitiveness and Information Technology in Indore region.
KEYWORDS ICT (Information and communication technology), Micro, Small and medium enterprises.
INTRODUCTION SMEs have been globally considered as an engine of economic growth and as key instruments for promoting equitable development. The major advantage of the sector is its employment potential at low capital cost. The labor intensity of the MSME sector is much higher than that of large enterprises. In recent years, the MSME sector has consistently registered higher growth rate compared with the overall industrial sector. With its agility
and dynamism, the sector has shown admirable innovativeness and adaptability to survive the recent economic downturn and recession. MSME- Development Institute, Indore is a field level agency of Ministry of Micro, Small & Medium Enterprises (MSME) to take care of the needs of the MSME Sector in the state of M.P. in the area of Techno-economic and managerial consultancy service. MSME , headed by the Development Commissioner , under the ministry of Micro, Small & Medium Enterprises (MSME). Government of India, is an apex body as well as the nodal agency for formulating, co-coordinating and monitoring the policies and programmes meant for promoting and development of Micro, Small & Medium Enterprises (MSME) throughout the country. MSME DI , started in 1958 (Formerly known as SISI) , is one of the field level agencies of MSME and is the only one of its kind in M.P Apart from offering various consultancy service, this institute also offers various technical and management training programmes for the benefit of prospective/ existing entrepreneurs. To assist the sector, having Field Testing Station at Bhopal and Branch MSME DIs at Gwalior & Rewa under the administrative control of MSME DI, Indore.
SERVICES OFFER BY MSME DI MSME-DI offers a wide variety of consultancy services as well as training programmes for the promotion and development of Micro, Small & Medium industries. The major services in brief are listed below: PROJECT ASSISTANCE Identification of product Preparation of project Report and pre-feasibility report Appraisal and evaluation of projects for banks and other agencies. Selection of plant and machinery and raw materials Technology and process Know-how Quality improvement and standards Drawings and plant lay-out Common facility, workshop facility-job work undertaken Capacity assessment Assistance for hire purchase of machinery from NSIC. MODERNIZATION AND TECHNOLOGY UP GRADATION Technology Up gradation studies/In plant studies. Production-cum-process development Diversification of project
SENET (SMALL SCALE INDUSTRIES AND RESOURCE CENTER NETWORK) SENET is an intranet project launched by the Office of the Development Commissioner (MSME) in April 1997 and is a small enterprise information resource center network. (Small enterprise mans small-scale industries and small-scale services and business activities) SENET Objectives are: To Create - an electronic intranet for small enterprises - databases for small enterprise To Provide - technical know-how and package assistance to small information servers - Training inputs - Limited financial assistance to information providers To Promote - a network alliance among the information services provides (to small enterprise ), including both the public and private sector.
TRC (TECHNOLOGY RESOURCE CENTER) TRC is a ‘TECHNOLOGY RECOURSE CENTER’ which is made functional from October, 2001. It is major drive to create a friendly and conducive environment for entrepreneurs. Entrepreneurs can asses the latest available technology and industry related information on the spot. Though it is stared in a humble way, it is expected to hit in a big way in future by equipping itself to provide technology-related using the latest IT tools.
UPTECH (INTEGRATED TECHNOLOGY) UP GRADATION AND MANAGEMENT PROGRAMME UPTECH is launched by Development Commissioner (MSME-DI), Government of India. The objective of the project is to implement an integrated Technology Up gradation and Management programme addressed to the smaller skills based enterprises The programme is organized around clusters of enterprises and is designed to provide for the promotion cost that are inherent in transfer of technology from its producer to the end user . MSME DI –SDTI (MICRO, SMALL & MEDIUM ENTERPRISES (MSME -DI) – SELECTIVE DISSEMINATION OF TECHNOLOGY INFORMATION) Micro, Small & Medium Enterprises (MSME- DI)–has been launched by the office of DC in collaboration With Technology bureau of small Enterprises (TBSE), is a joint venture of small industries Development bank of India(SIDBI)and Asia pacific Center for transfer of technology (APCTT) The objective of the project is to build up a database On the technologies that are available indigenously With technology institution and with industry , and also to build up a parallel database of
M

VOLUME NO. 4 (2014), ISSUE NO. 06 (JUNE) ISSN 2231-5756
INTERNATIONAL JOURNAL OF RESEARCH IN COMMERCE, IT & MANAGEMENT A Monthly Double-Blind Peer Reviewed (Refereed/Juried) Open Access International e-Journal - Included in the International Serial Directories
http://ijrcm.org.in/
6
the technology requirements of Micro, Small & Medium Enterprises (MSME -DI). The project provides an excellent opportunity to both the small enterprises As well as those institutions and units that have technologies for offer /sale. The sector not only plays a critical role in providing employment opportunities at comparatively lower capital cost than large industries but also helps in industrialization of rural and backward areas, reducing regional imbalances and assuring more equitable distribution of national income and wealth. MSMEs complement large industries as a ancillary units and contribute enormously to the socioeconomic development of the country.
DEFINITION OF MSME Enterprises are broadly classified in two categories: i) Manufacturing and, ii) Those engaged in providing/ rendering of services Both categories of enterprises are then classified into Micro, Small and Medium scale enterprises based on their investments on plants and machineries ( for manufacturing enterprises ) or on equipments ( in case of enterprises providing or rendering services).The present ceiling on investments to be classified as micro, small or medium enterprises is as under:
TABLE-1: CLASSIFICATION OF MSMES BASED ON THE MSMED ACT 2006
Classification
INVESTMENT CEILING FOR PLANT, MACHINERY OR EQUIPMENTS
Manufacturing enterprises Service Enterprises
Micro Up to USD 62500 Up to USD 25000
Small Between USD 60000 to USD 1.25 million Between USD 25000 and USD 0.5 million
Medium Between USD 1.25 million & USD 2.5 million Between USD 0.5 million and USD 1.25 million
Information technology initiatives that do not capture business requirements may not achieve the estimated benefits and may face unexpected problems. Managers in MSMEs must understand and evaluate IT’s potential impact to obtain numerous benefits. Thus by aligning IT with their business environments, they can avoid failure. IT infrastructure provides opportunities to increase revenue, reduce costs, and improve customer responses through e-businesses. IT infrastructure can develop new products and services that have a high degree of knowledge component therein with addition of skill enhancement may lead to significant improvement in productivity and competitiveness. Basic IT infrastructure such as Internet, websites, free to use application software (Open Office) can make them more competitive. Internet provided numerous and inexpensive opportunities for MSMEs to compete with large companies.Internet enable them to communicate with their customers and suppliers both at national & international level, they also can perform timely update or renew their brochures for products and services via websites and communicating through e-mails. Numerous MSMEs have adopted IT infrastructure for conducting business.
LITERATURE REVIEW Annual reports of Ministry of MSME, Government of India have been reviewed for growth statistics, support system and incentives for MSMEs in India. The body of knowledge related to the research area has been explored through research papers, books and relevant web sites. The domains covered during the review of literature include information technology adoption, Productivity Analysis, and micro, small and medium scale enterprises. Mali Paul, Morrison and McKee, (1978). has described 12 causes responsible for decline of productivity of organizations in general. He includes Rapid Technological changes and High Costs of manufacturing in the list of12 causes. Technology Factor has been seen as predominant determinant with maximum contribution in Productivity Enhancement. The contribution of Capital, Labor and Technology is found to be 14%, 27% and 59% respectively in productivity enhancements. Kelmer and Wanghman D. W.(1995) has concluded Regarding the technological needs of MSMEs, technology process is important, but the ability to utilize and capitalize on the advantage of technology through invention and innovation subsequently achieving through synergy is considered more important in running and survival of unit. It has been observed that the synergy plays very vital role in mobilizing the useful resources. Also the need of developing technical entrepreneurship has been strongly realized. Patricia R. Todd, Rajshekhar (Raj) G. Javalgi, (2007) "Internationalization of SMEs in India: Fostering entrepreneurship by leveraging information technology" in International Journal of Emerging Markets,, concluded that "Advancements in information technology and improvements in communication infrastructure have resulted in opportunities for SMEs to participate in global markets in both developing and developed countries. Since, governmental reforms in 1991, SMEs in India have been faced with new competitive intensity. Improvements in resource utilization make it possible to sell a variety of products and services from anywhere in the world, around the clock. This paper calls attention to ways in which Indian can become competitive. Vimlesh kumar soni, Vijay.p.Wani, (2010), "Productivity Growth in MSEs through Technology Incubation" in a journal concluded that "Having technical background of education and exposure to entrepreneurship programmes both support in productivity growth of the enterprise. Those who do not posses technical qualification may keep them updated with latest technology related knowledge through regular interaction with incubator organization. The technological and entrepreneurial competence such developed will facilitate in better performance of enterprise. Prof. (Dr.) S. K. Baral, (2013), "An empirical study on changing face of MSME towards emerging economies in India”. With its agility and dynamism, the sector has shown admirable innovativeness and adaptability to survive the recent economic downturn and recession.A growing recognition has been felt throughout the world such that SMEs have a vital role to play in the present context given their greater resource-use efficiency, capacity for employment generation, technological innovations for economic growth of any country across the globe.
OBJECTIVE OF THE STUDY To find the impact of Information and communication Technology (ICT) on MSME in Indore region, also to find out the factors responsible for it. With the help of reviewed literature we can come up with the Internal factors (enterprises sector, size and age) and three External factors (information requirements, competition intensity & Government incentive schemes) that can affect the adoption of information technology by MSMEs as follows:-
EXTERNAL FACTORS INFORMATION REQUIREMENT Information Requirements is concerned with requirements derive from promoting products and services to customers and communicating with business partners and hence facilitating the information to them. Internet can immediately and simultaneously provide information to employees, customers, and suppliers. To summarize, information exchange requirements (with customers & suppliers ) motivate enterprises to provide IT based services, setting up in-house Automated Query center to provide answers to queries and requirements of the customers, developing dynamic web sites to provide product and service information, updating product brouchers, information regarding design changes, feedback from customers etc. COMPETITION INTENSITY The stepping up of competitors to adopt new technology and the intense industry competition will influence the attitudes of managers towards accepting the new technology. In this highly competitive market, competitors or business partners may place pressure on firms to adopt new technologies. In order to compete more effectively, MSMEs managers require advanced information exchange methods for acquiring and sustaining competitive advantage. Thus it can be concluded that Information Technology Adoption allows MSMEs to improve their competitiveness.

VOLUME NO. 4 (2014), ISSUE NO. 06 (JUNE) ISSN 2231-5756
INTERNATIONAL JOURNAL OF RESEARCH IN COMMERCE, IT & MANAGEMENT A Monthly Double-Blind Peer Reviewed (Refereed/Juried) Open Access International e-Journal - Included in the International Serial Directories
http://ijrcm.org.in/
7
GOVERNMENT INCENTIVES SCHEMES Pressure may come from Government business partners and associates for adopting the Information Technology .During the earlier days of IT ,it was recognized that MSMEs rarely realize the importance and requirements of advanced IT technology, therefore, some of their needs to use the innovated IT technology are not effectively translated into demand. A decade after, it was found that creating user friendly environment and awareness of adopting advanced IT could be enhanced by government support such as provision for incentives and rebates in taxes along with aggressive support from business partners and associates.
INTERNAL FACTORS: ENTERPRISE SECTOR, SIZE AND AGE Researchers have demonstrated that a positive relationship exists between IT adoption and firm size. Some researchers have demonstrated that firm size positively influences firm commitment IT infrastructure & E- commerce. Furthermore, other researchers identified significant links between business size and level of IT adoption. Few asserted that size represents ability to assume risk, with bigger size facilitating the adoption and diffusion of new technology. Finally specific sector or to cluster in which enterprise is operating is also under some influential factor and it was found that negative relationship exists between enterprise sector and Information Technology Adoption. Besides, the age of an enterprise may lead to conservative ideas and thinking owing to the existence of mature and accepted work types in the longer established organizations.
BASED ON THE ABOVE INFERENCES STUDY PROPOSES THE FOLLOWING SIX HYPOTHESES: H-1 A positive relationship exists between information requirements and IT Adoption. H-2 A positive relationship exists between intense competition and I T Adoption. H-3 A positive relationship exists between Government incentives scheme and I T Adoption. H-4 A positive relationship exists between enterprise size and Information Technology Adoption. H-5 A negative relationship exists between enterprise age and Information Technology Adoption. Also from above inferences the conceptual model is developed, shown in Table below:
TABLE 2
Enterprise Sector Information Requirement
Enterprise Size Information Technology Adoption Competition Intensity
Enterprise Age Government Incentives Schemes
RESEARCH METHODOLOGY AND DATA COLLECTION Since IT infrastructure may require a considerable part of the budget of MSMEs, it is reasonable to expect that MSMEs that do not perform well may decide not to put too many resources into their IT development. This study focuses on the MSMEs which do have the financial ability to cover the cost of a IT infrastructure. This study selects outstanding Indore MSME companies with after- tax surpluses and continuing sale revenue growth for the past three years as samples. We attempt to explore the determinants of Information Technology Adoption for the MSMEs financial performance and used regression coefficient test as a tool for testing hypothesis. DATA COLLECTION Apart from the information collected from MSME-DI Indore, This study collects data from two sources: personal inquiry and a mail questionnaire survey. Firm sector, age and size were obtained from personal inquiry. The adoption of Information Technology, information requirements, intensity of competition, and incentives and supports, are obtained from the self-report questionnaire. We examined Internet sources and personal meeting to identify the names of MSMEs firms which shown considerable growth in financial performance. 50 MSMEs were identified and Questionnaires were mailed to them.
HYPOTHESIS TESTING TESTING OF HYPOTHESIS HI (INFORMATION REQUIREMENT) Hypothesis H-1 was stated as "A positive relationship exists between information requirements and Information Technology Adoption”. The regression coefficient (re) was positive and significant (rc=1.08, p<0.01).Therefore, we can conclude that there is a statistically significant relationship between the dependent variable "Information Technology Adoption" and the independent variable "information requirement”. That is, firms with information requirements are more likely to have Information Technology. Additionally, the independent variable of "information requirement" was comprised of three items, information with customers, partners (suppliers). This study placed three items of the information requirement into the regression to identify the influence of these three items on Information Technology Adoption. The regression model calculation revealed that only the information requirement with customers exhibits a positive relationship with Information Technology Adoption (rc=1.44, p<0.01). The information requirements with partners (suppliers) did not exhibit any statistically significant relationship with Information Technology Adoption. TESTING OF HYPOTHESIS H2 (INTENSITY OF COMPETITION) All of the regression coefficients of the four regression models are positive and significant (p<0.05) for Hypothesis H2,"A positive relationship exists between competitive intensity and Information Technology Adoption,". Therefore, we can conclude that there is a statistically significant relationship between the dependent variable "Information Technology Adoption" and the independent variable "of competition". That is, in a higher competitive environment, firms were more likely to develop comprehensive websites. TESTING OF HYPOTHESIS H3 (SUPPORT AND INCENTIVES) The regression coefficient is positive and significant (rc=0.68, p<0.01) for Hypothesis H3, "A positive relationship exists between 'support and incentives' and Information Technology Adoption,therefore,we can conclude that there is a statistically significant relationship between the dependent variable "Information Technology Adoption" and the independent variable "support and incentives”. That is, firms with "government incentives schemes " are more likely to conduct Information Technology calculation also reveal that government support and incentives were significantly and positively related to Information Technology Adoption (rc=1.07, p<0.01), while support and incentives from business partners were not. TESTING OF HYPOTHESIS H4 (FIRM SIZE) All of the regression coefficients of the four regression model are positive and significant (p<0.05)for Hypothesis H4,"A positive relationship exists between enterprise size and Information Technology Adoption," Therefore, we can conclude that there is a statistically significant relationship between the dependent variable "Information Technology Adoption “and the independent variable "firm size”. That is, the larger sized firms are more likely to have comprehensive websites than the smaller ones. TESTING OF HYPOTHESIS H5 (FIRM AGE) All of the regression coefficients of the four regression models are negative and significant ( p<0.01) for Hypothesis H5, "A negative relationship exists between enterprise age and Information Technology Adoption,". Therefore, we can conclude that there is a statistically significant relationship between the dependent variable “Information Technology Adoption" and the independent variable “firm age”. That is, the longer established firms are more likely to have comprehensive websites than younger ones.

VOLUME NO. 4 (2014), ISSUE NO. 06 (JUNE) ISSN 2231-5756
INTERNATIONAL JOURNAL OF RESEARCH IN COMMERCE, IT & MANAGEMENT A Monthly Double-Blind Peer Reviewed (Refereed/Juried) Open Access International e-Journal - Included in the International Serial Directories
http://ijrcm.org.in/
8
CONCLUSION AND DISCUSSION This study used a sample of Indore MSMEs to investigate the factors influencing the Adoption of their Information Technology Adoption. According to empirical surveys, information requirement, intensity of competition, and support and incentives, size and age influence the Information Technology Adoption. This study proves that there is a relationship between environmental factors and the adoption of ICT. Information Technology Adoption increases with increasing information requirements. Highly competitive environments drive enterprises to adopt the IT to acquire first mover advantages, or to avoid being driven out of markets. MSMEs in highly competitive industries have no choice but to follow their competitors in adopting information technology. Government Support and incentives from the external environment also lead enterprises to pursue Information Technology Adoption. Since the1990s,to improve national competitiveness, countries like Singapore, Korea, Japan, Germany, and Canada have endeavored to develop their digital economies. Government of India can opt for development of e- MSMEs project. The e-MSMEs project encompasses several sub-projects: Knowledge Management Plan, e-Learning Project, e-Business Operation Plan, Broadband to MSMEs, and e-Market. All of these projects are important in helping MSMEs develop their IT strategy. The effectiveness of partnerships between government and MSMEs is empirically demonstrated in this study.
SCOPE FOR FURTHER RESEARCH As far as scope of ICT on MSMEs in Indore is concerned, it cannot be wrapped in words or figures as the growth of IT sector w.r.t MSMEs will be going to make a mile stone in INDORE .New hopes came with IT park, also the big companies like TCS,INFOSYS have shown a great interest in Indore market which will surely going to help MSMEs to grow with more faster rate. Research can then be done as to what percentage the skilled labor with skilled management had contributed to the growth of MSMEs .
REFERENCES 1. Annual Reports 2010-2011, Ministry of Small Scale Industries, Government of India. “Final Results: Third All India Census of Small Scale Industries 2001-
2002”, August 2004 Edition, Ministry of Small Scale Industries, Government of India. 2. Dr.Subrata das (2012), International Journal of Engineering and research, Impact of technological factors on small business. 3. Entrepreneurship by leveraging information technology", International Journal of Emerging Markets, Vol. 2 Iss: 2, pp.166 - 180. 4. “Guidelines for Rehabilitation of Sick Small Scale Industrial Units”, Reserve Bank of India Document, January 2002. 5. Gupta Anita (2006), “Indian Experience on Promoting Business And Technology Incubation For Improved Competitiveness Of Small And Medium-Sized
Industries Through Technological Developments”, 6. Jessica Wade (2013) Small Enterprise Finance Centre, IFMR. Journal of Radix International Educational and Research Consortium. 7. Patricia R. Todd, Rajshekhar (Raj) G. Javalgi, (2007) "Internationalization of SMEs in India: Fostering 8. Raymond, L. (2010).Determinants of web site implementation in small businesses. Internet Research: Electronic Networking Applications and Policy, 11{(5),
411-422}. WEBSITE 9. www.msmeindore.nic.in

VOLUME NO. 4 (2014), ISSUE NO. 06 (JUNE) ISSN 2231-5756
INTERNATIONAL JOURNAL OF RESEARCH IN COMMERCE, IT & MANAGEMENT A Monthly Double-Blind Peer Reviewed (Refereed/Juried) Open Access International e-Journal - Included in the International Serial Directories
http://ijrcm.org.in/
9
COMPLIANCE OF CORPORATE GOVERNANCE AND ITS IMPACT ON FIRM PERFORMANCE: AN EMPIRICAL ANALYSIS WITH DUMMY VARIABLES
DR. PALLAVI KAPOORIA ASST. PROFESSOR & HEAD
DEPARTMENT OF MANAGEMENT GRADUATE SCHOOL OF BUSINESS SOFTVISION EDUCATION SOCIETY
DAVV INDORE
DR. R. C. SHARMA
PROFESSOR & HEAD DEPARTMENT OF MANAGEMENT
CENTRAL UNIVERSITY OF RAJASTHAN KISHANGARH
DR. DEEPAK KAUL
DIRECTOR CORE BUSINESS SCHOOL
INDORE
ABSTRACT Good corporate governance is fundamental to the economies with extensive business background and also facilitates the success for economic growth. Corporate governance secures an effective and efficient operation of company in the interest of all stakeholder. It provides assurance that management is acting in the best interest of the corporation, thereby contributing to business prosperity through openness in disclosures and accountability. An analysis of these practices and the association of their adoption and effects on firm performances can form a basis for economic reforms in the context of the changing corporate environment. Studying the impact of the best practices on the companies across diverse sectors of the Indian Economy would enable us to analyze the efficacy of the said practices. This paper aims at exploring the impact of adoption of the Clause 49 of Listing Agreement pertaining to corporate governance clause recommended by SEBI, by the selected Indian corporate. The results reveal that among the selected corporate governance norms, presence of a key executive director in audit committee is of vital significance in affecting overall performance of organizations.
KEYWORDS Audit Committee, Clause 49, Corporate Governance, Executive Director, Listing Agreement.
INTRODUCTION orporate governance has attained significance all over the world. Two important factors have lead to rapid developments in the field, namely the integration and globalization of financial markets and a surge of corporate scandals such as Enron, World Com and others. Corporate governance is a broad term which describes the processes, customs, policies, laws and institutions that directs the organizations and corporations in the way they act,
administer and control their operations. It works to achieve the goal of the organization and manages the relationship among the stakeholders including the board of directors and the shareholders. It also deals with the accountability of the individuals through a mechanism which reduces the principal-agent problem in the organization. Fine corporate governance is an essential standard for establishing the striking investment environment which is needed by competitive companies to gain strong position in efficient financial markets.
REVIEW OF LITERATURE The term corporate governance became a prominent research theme after the publication of Cadbury committee report in the UK in the early 1990s. This is evident from the fact that the number of research papers published in the peer-reviewed scholarly journals in the area of corporate governance has gone up from 641 in 1985-96 to 9717 in 1996-2006. The relationship between corporate governance and firm performance has initiated many researchers to look into this area, thereby leading to a vast literary contribution Annie and Kaczmarek (2012) conducted a research recently which points to the importance of a careful selection process of directors by nomination committees. It underlines the role for active leadership on boards. A study by Renders and Gaeremynck (2012) examines the impact of principal-principal agency problems on the quality and effectiveness of corporate governance structures. Using a simultaneous equations model, they found that the conflict index affects the quality and effectiveness of corporate governance. An empirical analysis of Indian companies revealed that among the various corporate governance norms under the scope of the study, a key executive director in audit committee has a major role in effective corporate performance. (Kapooria P, Sharma R C and Kaul D 2013). In a review by Khan H (2011), which is a collection of volume of research on corporate governance the significance of effective corporate governance is being evident. The findings of the most studies show that effective corporate governance reduces the ownership and control problems and draws a clear line between the shareholder and the manager. Lishenga L (2011) found that outside dominated boards are significantly more likely to respond to poor performance by dismissing the CEO. He also finds evidence suggesting that outside directors’ act in the shareholders’ interest in their decision in the adoption of poison pill provision.
OBJECTIVE This paper aims at exploring the impact of adoption of the Clause 49 of Listing Agreement pertaining to corporate governance clause recommended by SEBI, by the selected Indian corporate. Selected norms as stated in the following hypotheses have been considered for the purpose of analysis.
HYPOTHESES H11 : An optimum representation of non-executive directors on the board will lead to better performance of the firms. (BOD)
C

VOLUME NO. 4 (2014), ISSUE NO. 06 (JUNE) ISSN 2231-5756
INTERNATIONAL JOURNAL OF RESEARCH IN COMMERCE, IT & MANAGEMENT A Monthly Double-Blind Peer Reviewed (Refereed/Juried) Open Access International e-Journal - Included in the International Serial Directories
http://ijrcm.org.in/
10
H12 : Firms having established an Audit Committee should reflect higher performance than those who do not have such committees. (AC) H13 : Representation of a key executive director in an audit committee will be associated with lower corporate performance. (KED) H14 : Firms having established a Remuneration Committee should reflect higher performance than those who do not have such committees. (RC)
SAMPLE SELECTION For the purpose of the present analysis, 15 companies, listed on the NSE, were selected, from across the various sectors, on a random basis. A Panel study was aimed by obtaining the data of the 15 companies selected over a period of two financial years (2 FY) ie 2007-2008 and 2008-2009, providing a total of 30 observations. INDEPENDENT VARIABLES The independent variables (X) were captured from Clause 49 of Listing Agreement of SEBI pertaining to corporate governance. Since these variables as mentioned above are not quantifiable i.e, only their absence or presence can be observed, Dummy Variable Approach has been applied for further analysis. For the purpose of the study, the presence of each these variables is denoted by 1 & their absence by 0. DEPENDENT VARIABLES (PERF) As the objective of the study is to establish a linkage between the selected corporate governance attributes and corporate performance, we observed two financial ratios, namely P/E Ratio & Asset Turnover Ratio of these selected companies over a period of two financial years as a measure of corporate performance. The average value of these ratios was used as the dependent variable (Y).
EMPIRICAL MODEL Yit = α it + α1 Dit + Uit………………………………………………………………………………………..Eq (1) Where, Yit = Performance of ith firm in the ith year i = no. of firms 1 to 15 t = no. of year 1 and 2 α1 = Intercept α2 to α5 = Coefficients of Dummy variables D2it to D5it = Dummy Variables Uit = Stochastic Error Dummy variables are defined as follows:
D2it = 1 if there is an Optimum representation of Non-Executive Directors & =0, if otherwise (BOD)
D3it =1 if Audit Committee is present & =0, if otherwise (ACOM)
D4it =1 if there is a Key Executive Director in Audit Committee & =0 , if otherwise (KED)
D5it =1 if Remuneration Committee is present & =0, if otherwise (RCOM)
Equation (1) has four sets that includes individually four dummy variables as defined above and the comparison of the mean performance is analyzed as follows: Mean Performance with the Optimum Representation of Non-Executive Directors (BOD) is E (Yit | D2it = 1) = α1 + α2
Mean Performance without Optimum Representation of Non-Executive Directors is E (Yit | D2it = 1) = α1
The difference is of α2. There is a hypothesis such that α2 ≠ 0 and positive. H11 : α2 ≠ 0 and +ve If α2 is +ve and significant (determined through applying t-test), the hypothesis is accepted and there will be difference between mean performance of the presence of optimum representation of non-executive directors and its absence. If α2 is positive but not significant, the hypothesis is rejected and it may be considered that there will be no difference between mean performance of the two types. Similarly, estimation of mean performance of each attribute can be analyzed and conclusions can be derived accordingly. E (Yit | D3it = 1) = α1 + α3
= α1
H12 : α3 ≠ 0 and positive E (Yit | D4it = 1) = α1 + α4
= α1
H13 : α4 ≠ 0 and positive E (Yit | D5it = 1) = α1 + α5 = α1
H14 : α5 ≠ 0 and positive
EMPIRICAL ANALYSIS OPTIMUM COMPOSITION OF BOARD OF DIRECTORS (BOD) D2it = 1 , if there is an optimum composition and = 0, if otherwise.
Unstandardized Coefficients t Significance level
α Std. Error α
(Constant) 24.937 17.316 1.44 0.153
BOD 18.395 17.86 1.03 0.306
SPSS Calculations Dependent Variable: PERF Substituting the values in Eq(1), Yit = 24.937 + 18.395 D2it SE (17.860) t (1.030) sig (0.306) Mean performance with the presence of BOD E (Yit|D2it =1) = 24.937 + 18.395 = 43.332 Mean performance with the absence of BOD E (Yit|D2it =0) = 24.937

VOLUME NO. 4 (2014), ISSUE NO. 06 (JUNE) ISSN 2231-5756
INTERNATIONAL JOURNAL OF RESEARCH IN COMMERCE, IT & MANAGEMENT A Monthly Double-Blind Peer Reviewed (Refereed/Juried) Open Access International e-Journal - Included in the International Serial Directories
http://ijrcm.org.in/
11
The hypothesis that ‘the optimum representation of board will lead to better performance’ is rejected. The value of α2 is +ve. It implies that mean performance with the optimum board composition is higher than the mean performance with its absence. However, the value of α2 is not statistically significant, therefore, it may be concluded at 5% level of significance, that the difference between the mean performance due to absence/ presence of optimum representation is not statistically significant. PRESENCE OF AN AUDIT COMMITTEE (ACOM)
Unstandardized Coefficients t Significance Level
α Std. Error α
(Constant) 68.915 30.031 2.295 .024
ACOM -27.232 30.336 -.898 .372
Dependent Variable: PERF Yit = 68.915 + (- 27.232)D3it SE (30.336) t (-0.898) sig (0.372) Mean performance with the presence of ACOM E (Yit|D3it =1) = 68.915 + (- 27.232) = 41.683 Mean performance with the absence of ACOM E (Yit|D3it =0) = 68.915 The hypothesis that ‘the presence of an audit committee will lead to better performance’ is rejected. The value of α2 is –ve. It implies that mean performance with the absence of audit committee is higher than the mean performance with presence of audit committee. However, the value of α2 is not statistically significant, therefore, it may be concluded at 5% level of significance, that the difference between the mean performance due to absence/ presence of audit committee is not statistically significant. PRESENCE OF KEY EXECUTIVE DIRECTOR IN AUDIT COMMITTEE (KED)
Unstandardized Coefficients T Significance Level
α Std. Error Α
(Constant) 38.098 4.249 8.967 .000
KED 45.885 14.162 3.240 .002
Dependent Variable: PERF Yit =38.098 + 45.885 D4it SE (14.162) t (3.240) sig (0.002) Mean performance with the presence of KED E (Yit|D4it =1) = 38.098 + 45.885 = 83.983 Mean performance with the absence of KED E (Yit|D4it =0) = 38.098 The hypothesis that ‘the presence of a key executive director in audit committee will lead to lower performance’ is accepted. The value of α2 is +ve. It implies that mean performance with the presence of key executive director is higher than the mean performance with its absence. Moreover, the value of α2 is statistically significant, therefore, it may be concluded at 5% level of significance, that the difference between the mean performance due to absence/ presence of optimum representation is statistically significant. PRESENCE OF REMUNERATION COMMITTEE (RCOM)
Unstandardized Coefficients t Significance Level
α Std. Error α Std. Error
(Constant) 48.373 7.623 6.346 .000
RCOM -8.906 9.177 -.970 .334
Dependent Variable: PERF Yit = 48.373 + (-8.906) D5it SE (9.177) t (-0.907) sig (0.334) Mean performance with the presence of RCOM E (Yit|D5it =1) = 48.373 + (-8.906) = 39.467 Mean performance with the absence of RCOM E (Yit|D5it =0) = 48.373 The hypothesis that ‘the presence of a remuneration committee will lead to better performance’ is rejected. The value of α2 is -ve. It implies that mean performance with absence of a remuneration committee is higher than the mean performance with its presence. However, the value of α2 is not statistically significant, therefore, it may be concluded at 5% level of significance, that the difference between the mean performance due to absence/ presence of remuneration committee is not statistically significant.
CONCLUSION The analysis may conclude that an out of the corporate governance norms selected for the purpose of thuis study, an Executive Director has plays a crucial role in functioning of an organization. An Executive Director has a strong hold on the functioning of any organization and have a greater concern for the image/ goodwill of the organization and hence will be in a better position to initiate financial decisions in the interest of an organization. Hence, it may be conclude that the Presence of a Key Executive Director in an audit committee (KED) plays a vital role in influencing the performance of an organization. His presence is instrumental in shaping firms’ performance and will strengthen the functioning and decision-making of an organization.
REFERENCES 1. Annie P and Kaczmarek S (2012), “Board Task-related Faultlines and Firm Performance: A Decade of Evidence” , Corporate Governance : An International
Review, 20(4), pp.337-351. 2. Cadbury A (1992), The Financial Aspects of Corporate Governance - A Report of the Committee on Corporate Governance, Gee and Co., London.

VOLUME NO. 4 (2014), ISSUE NO. 06 (JUNE) ISSN 2231-5756
INTERNATIONAL JOURNAL OF RESEARCH IN COMMERCE, IT & MANAGEMENT A Monthly Double-Blind Peer Reviewed (Refereed/Juried) Open Access International e-Journal - Included in the International Serial Directories
http://ijrcm.org.in/
12
3. Jeffrey C (2011), “Corporate Governance and Audit : An Empirical Study”, International Journal of Governance, 1(2). 4. Kapooria P, Sharma R C and Kaul D (2011), “Corporate Governance and Firm Performance : An Empirical Analysis with Dummy Variables ” ,Management
Research Journal “Prabandhan & Taqniki” ,Vol 5, pp.27- 31. (ISSN No: 0974-8563). 5. Kapooria P, Sharma R C and Kaul D (2013) , “Impact of Corporate Governance on Firm Performance : An Empirical Analysis of IT and Manufacturing
Sectors”, Global Research Analysis, An International Indexed Journal, Vol. 2(6), pp.123-124. (ISSN: 2277-8160, IMPACT FACTOR (2012) : 0.2714) 6. Kapooria P, Sharma R C, Kaul D, Sharma N (2013), “Some Challenges of Corporate Governance on Performance: An Innovative Econometric Analysis for
Sustainability of Firms” , Ch. 13, pp. 176 – 185 in Ed. R.K. Mishra, Shital Jhunjhunwala & J. Kiranmai, “Corporate Governance in Emerging Markets”, Bloomsbury Publishers, New Delhi. (ISBN No. 978-93-82563-50-1)
7. Khan H (2011),” A Literature Review of Corporate Governance”, International Conference on E-business, Management and Economics IPEDR , 25, IACSIT Press, Singapore.
8. Lishenga L (2011), “Corporate Governance reaction to declining firm performance: Evidence from NSE”, IJG, 1(1). 9. Mishra A and Bhattacharya S (2011), “The Linkage Between Financial Crisis and Corporate Governance: A Literature Review”, Journal of Governance, 1(3). 10. OECD (2004), Principles of Corporate Governance, www.oecd.org www.oecd.org/dataoecd/32/18/31557724.pdf. 11. Phillip J, Nilolaos T Milonas, Nickolaos G Travlos (2009), “The Cadbury Code Reforms and Corporate Performance”, Journal of Corporate Governance, 8 (1),
22–40. 12. Renders A and Gaeremynck A (2012), “Corporate Governance, Principal-Principal Agency , and Firm Value in European Listed Companies”, Corporate
Governance : An International Review, 20(2), pp.125-143.

VOLUME NO. 4 (2014), ISSUE NO. 06 (JUNE) ISSN 2231-5756
INTERNATIONAL JOURNAL OF RESEARCH IN COMMERCE, IT & MANAGEMENT A Monthly Double-Blind Peer Reviewed (Refereed/Juried) Open Access International e-Journal - Included in the International Serial Directories
http://ijrcm.org.in/
13
CAUSE RELATED MARKETING AND ITS IMPACT ON BRAND PREFERENCES & BRAND ATTACHMENT AMONG CUSTOMERS AT BHAVNAGAR CITY WITH SPECIAL REFERENCE TO P&G FMCG PRODUCTS
BHAVIK P PARMAR CO-ORDINATOR (B.B.A.)
M. J. COLLEGE OF COMMERCE M. K. BHAVNAGAR UNIVERSITY
BHAVNAGAR
ABSTRACT Cause Related Marketing (CRM) has emerged as a top management priority in the last decade due to the growing realization that it one of the most valuable intangible tool that firms have to gain better corporate image from Internal as well as External Customers. This paper identifies some of the influential work in the area of Cause related marketing practices carried out by P&G and its impact on corporate brand image of the company. The main aim of the paper is to find out causality between cause related marketing practices and Brand preferences as well as brand attachment with special reference to P&G FMCG products. This paper also explore some practices used by P&G for Cause related marketing such as “Shiksha Abhiyan-Padhega India, Badhega India by Anupam Kher” etc. Relationship between cause related marketing and its impact on customer’s brand preferences & brand attachment is find out by selecting 100 samples using convenience random sampling from Bhavnagar city and data has been analyzed using co-relation co-efficient. The main findings of the research includes that customer do prefer brand of the company as cause related marketing has created positive impact. The paper also outlines some gaps that exist in the research of variables and formulates a series of related research questions.
KEYWORDS
Cause Related Marketing, Brand Preference and Brand Attachment, P&G.
CONCEPTUAL FRAMEWORK CAUSE-RELATED MARKETING
ause marketing or cause-related marketing refers to a type of marketing involving the cooperative efforts of a for profit business and a non-profit organization for mutual benefit. The term is sometimes used more broadly and generally to refer to any type of marketing effort for social and other charitable causes, including in-house marketing efforts by non-profit organizations. Cause marketing differs from corporate giving (philanthropy), as the
latter generally involves a specific donation that is tax deductible, while cause marketing is a marketing relationship not necessarily based on a donation. Although originally a marketing strategy that occurred offline, cause marketing has been conducted more and more through online channels in the last decade. This is due in part to the increasing percentage of households with internet connections. As with other types of marketing campaigns, companies can leverage online marketing channels along with other offline channels such as print and media. (Sometimes referred to as integrated marketing). The advent of online cause marketing has allowed consumers, for example, those who are loyalty program members, to take a far more active role in cause marketing. This is democratized transactional giving. It means consumers, rather than companies, decide which causes to support and advocate for. An example of how this works could be a company allowing its loyalty program members to convert unredeemed rewards, such as points or miles, into cash donations to causes of the customers' own choosing, rather than have the company select the charities. An online platform is necessary to connect the customers to a large-enough selection of charities.
BRAND PREFERENCE The stage of brand loyalty at which a buyer will select a particular brand but will choose a competitor's brand if the preferred brand is unavailable. Consumers usually has some sort of brand preference with companies as they may have had a good history with a particular brand or their friends may have had a reliable history with one. Measure of brand loyalty in which a consumer will choose a particular brand in presence of competing brands, but will accept substitutes if that brand is not available. Brand preferences selective demand for a company's brand rather than a product; the degree to which consumers prefer one brand over another. In an attempt to build brand preference advertising, the advertising must persuade a target audience to consider the advantages of a brand, often by building its reputation as a long-established and trusted name in the industry. If the advertising is successful, the target customer will choose the brand over other brands in any category
BRAND ATTACHMENT The construct of Brand Attachment is conceptualized as the extent to which the self is implicated with the Brand. That is, does one consider the brand to be part of who they are. We demonstrate three primary results. First, Brand Attachment better predicts commitment and separation distress than traditional attitude approaches. Second. Brand Attachment is better able to predict behaviors that are more difficult to execute, whereas attitudes better predict behaviors that are easy to execute. Third, Brand Attachment mediates the influence of Satisfaction on Commitment. Based upon this set of findings, we argue for the importance of Brand Attachment, especially relative to traditional attitude and satisfaction perspectives.
P&G PRACTICES FOR CAUSE RELATED MARKETING When you see veteran actor Anupam Kher in P&G Shiksha advertisement appealing you to buy a P&G product so that poor village girl Vidya can go to a school, you might made up your mind to buy P&G products next time you visit the shelf. Shiksha, P&G India’s cause marketing initiative is running successfully for the last 8 years already helped 280,000 underprivileged children access their right to education. The program has built & supported over 140 schools across India and donated Rs. 22 Crores in the last 8 years. Under the scheme, every time a consumer buys P&G products Tide, Ariel, Pampers, Whisper, Olay, Vicks, Gillette Oral-B, Head & Shoulders, Pantene or Duracell ,P&G donates a part of the sale to NGO partners who works for better education to the underprivileged children in India. When launched in 2003,Shiksha got fabulous response from consumer and sales of Shiksha labelled products reached to 20 Lakhs. Cause marketing or Cause Related Marketing(CRM) is a common marketing strategy involving corporate houses and Non-Profit organisation for mutual benefits. For corporate, it is a good way to attract consumers and creating a good brand image whilst addressing social issues. Cause Related Marketing (CRM) can be an integral part of the corporate social responsibility strategy of an organization.“Cause Related Marketing adds another dimension to the brand strength of a brand. It provides the emotional as well as the rational engagement of the consumer with the brand. It provides a tangible demonstration of the company’s corporate social responsibility, its values and its ethics.” ( Sue Adkins, International expert on CRM, Business in the Community).The term Cause related marketing was first used by American Express in its 1981 campaign on Statue of Liberty restoration Project. For every transaction in American Express card, they denoted 1 cent and $1 for every new card. The result was phenomenon: In just three months, the Restoration Fund raised over $1.7 million. American Express Card usage rose 27% and new card applications rose by 45% compared to the previous year.
C

VOLUME NO. 4 (2014), ISSUE NO. 06 (JUNE) ISSN 2231-5756
INTERNATIONAL JOURNAL OF RESEARCH IN COMMERCE, IT & MANAGEMENT A Monthly Double-Blind Peer Reviewed (Refereed/Juried) Open Access International e-Journal - Included in the International Serial Directories
http://ijrcm.org.in/
14
PIC. 1 & 2
RESEARCH OBJECTIVES To find out impact of cause related marketing practices on Brand preferences and Brand Attachment among customers of Bhavnagar city (Gujarat) with
special reference to P&G
To study cause related marketing practices by P&G and its awareness among customers.
RESEARCH METHODOLOGY
This research is a descriptive in nature which analyze two variable i.e. Cause related marketing (Independent variable) and Brand preferences & Brand Attachment (dependent variables) by selecting 100 samples from Bhavnagar city located in Saurashtra region of Gujarat using convenience random sampling. Data have been collected through structured questionnaire using 5 point likert scale. Collected data have been analyzed by co-relation co-efficient.
DATA COLLECTION AND ANALYSIS TABLE 1
Sr.No Item Statistical Co-related value
Consistency Accepted/ rejected
1 I Do purchase brand as it is related to cause related marketing 0.897 Consistent Accepted
2 I recall the product easily as it is related to social cause 0.743 Consistent Accepted
3 I am loyal towards a particular brand as it impart to social cause 0.512 Consistent Accepted
4 I believe that such type of promotion tool affect more to buying decision 0.681 Consistent Accepted
5 I attach to the brand personally 0.790 Consistent Accepted
6 I purchase brand because of my favorite brand ambassador 0.758 Consistent Accepted
7 I associated with the brand as it raise social issues 0.631 Consistent Accepted
8 In my knowledge everyone is keen towards such product 0.552 Consistent Accepted
9 I believe that consumer purchases are impacted by cause related marketing campaign. 0.752 Consistent Accepted
10 I feel happy when I buy a cause related product 0.897 Consistent Accepted
11 It give me immense pleasure when I buy such product, even when it’s out of my budget 0.637 Consistent Accepted
12 I am very loyal to the brand through good or bad times 0.721 Consistent Accepted
13 The brand reminds me the things that one has done for society. 0.758 Consistent Accepted
14 I feel as if I were contributing to society by purchasing P&G brand 0.897 Consistent Accepted
15 The brand reflects my personality that I purchases. 0.631 Consistent Accepted
16 The brand reminds me, brand’s image and my self-image are similar. 0.758 Consistent Accepted
17 I feel proud to be associated with brand. 0.721 Consistent Accepted
18 The brand plays an important role in my life. 0.631 Consistent Accepted
19 I will not switch to another brand if it is unavailable 0.897 Consistent Accepted
20 I engage in physical action and behaviors when I use brands. 0.552 Consistent Accepted
MAIN FINDINGS & INTERPRETATIONS 1. Overall impact of all variables considered for exploring brand preferences and brand attachment due to cause related marketing shown positive values. 2. Customer recall Cause related marketing campaign when they go for buying P&G Brands. 3. Customer of Bhavnagar city is strongly associated with brands of P&G due to its cause related marketing campaign. 4. Brand preferences for P& G products are strongly associated due to its cause related marketing. 5. Customers are more loyal towards brands of P&G.
CONCLUSION
It is observed that there is strong impact of cause related marketing on Brand preferences and Brand Attachment as all items involved in questionnaire result in to positive co-relation co-efficient. Cause related marketing also helps customer to recall brand easily and it builds up corporate brand image positioned as a socially responsible company.
REFERENCES 1. http://CAUSE%20RELATED%20MARKETING%20%20%20NEW%20TOOL%20FOR%20MARKETERS%20%20%20MIG.html 2. http://en.wikipedia.org/wiki/Cause_marketing 3. https://marketing.wharton.upenn.edu/mktg/assets/File/brand_attachments_priester.pdf

VOLUME NO. 4 (2014), ISSUE NO. 06 (JUNE) ISSN 2231-5756
INTERNATIONAL JOURNAL OF RESEARCH IN COMMERCE, IT & MANAGEMENT A Monthly Double-Blind Peer Reviewed (Refereed/Juried) Open Access International e-Journal - Included in the International Serial Directories
http://ijrcm.org.in/
15
FACTORS THAT AFFECT MEMBERS’ LEVEL OF PARTICIPATION IN SAVING AND CREDIT COOPERATIVES (SACCOS) AFFAIRS IN ETHIOPIA: A CASE STUDY IN MEKELLE CITY, TIGRAY
KIDANU NERIE AREGAWI PROCUREMENT EXPERT
MEKELLE HOSPITAL MEKELLE
DR. TESFATSIONSAHLUDESTA
ASSOCIATE PROFESSOR MEKELLE UNIVERSITY
MEKELLE
HIWET KEBEDE AREGAWI LECTURER
MEKELLE UNIVERSITY MEKELLE
ABSTRACT
The objective of this study was to identify and analyze the factors that determine members’ level of participation in saving and credit cooperatives (SACCOs) in Mekelle city, Tigray. Primary data was collected from 265 randomly selected members by using structured questionnaire. The data was analyzed through Tobit model regression. The Tobit model test indicated that from the total 15 explanatory variables only age has statistically significant negative influence and sex (being a male), member’s saving per month, duration of membership, education, membership situation and training had statistically significant positive influence on members’ active participation in SACCOs’ affairs. To tackle the problem of passive participation of members, the intervention strategies of the marketing and cooperative promotion office of Mekelle city and other stake holders should focus on the members’ awareness that they are owners, users and have responsibility to control SACCO’s activities. The limitation of this study was that it did not compare the level of participation among the associations (Mahibers). Moreover, due to more female dominated associations (Mahibers), there was a limitation to compare the level of participation between male and female members. Thus, further researchers may focus these limitations and include on their study.
KEYWORDS Affairs, Cooperatives, Factors, Participation, SACCOs.
1. INTRODUCTION he people of Ethiopia have got a very long social history of working together to fulfill their socio-economic needs. Many social events are still taking place in rural Ethiopia through collective effort. In Ethiopia there are three well known traditional cooperatives or self-help group viz., Edir, Equb and Debo or Wenfal; of which Equb is a financial form of traditional cooperative formed voluntarily (Jember, 2009). The traditional money saving mechanisms such as
Edir and Equb schemes are common in large parts of Ethiopia and are not unusual practices in the country. In Edir money is saved for funerals, and some people may be members of many Edirs. Equb is a communal savings scheme in which the participants take turns in getting the money contributed by members (Jember, 2009). In Ethiopia, among other things, lack of finance is one of the fundamental problems impeding production, productivity and income of rural and urban households. Since access to institutional finance is very limited, the majority of the poor obtain financial services through informal channels, such as money lenders, 'Ekub', relatives and others. Microfinance, by offering a range of tailored financial and non-financial services to the poor can reduce poverty and contribute to economic growth (Wolday, 2004). A service provided from organized systematic cooperatives is a very recent enterprise in Ethiopia. Savings and credit institutions are something new, they introduced a new form of dependence on others, a dependence based on a commercial way of thinking that gives a third party profit. For example, savers who repay their loans, but keeping their savings in the institution as a form of security and also instead of borrowing more money from the institutions, they take out the money they have saved to invest it in their different activities (Jember, 2009). Members’ behaviors of participation in the governance of their cooperative may be displayed in various ways. A member may become an administrator of his/her cooperative. He or she will thus participate directly in the cooperative’s governance; because an administrator guides and controls the cooperative’s strategy. He or she is the guarantor of its purpose and its long-term survival (Siebert & Park, 2010). A member may also participate more indirectly in this governance during Annual General Meetings (AGM). The AGM is one of the members’ means of expression, ensuring that the cooperative is running democratically according to the principle of “one man one vote”. During the AGM, members participate in choosing for example, how the cooperative’s outcomes will be spent or again in the election of administrators. Democracy within the cooperative takes the form of delegated democracy and is based on the results of this election (Siebert & Park, 2010). Members can increase their role in decision-making and in the cooperative’s political life by taking part in non-statutory instances (section meetings, diverse commissions, etc.). The above types of participation are left to the discretion of each individual. If there is no control, no sanction, and no reward or prize linked to farmers’ participation to the governance of their cooperative. Consequently, a member’s participation in the governance of the cooperative is conceptually similar to an organizational citizen-ship behavior of civic virtue (Siebert & Park, 2010).Thus, this study intended to study the factors that affect the level of members’ participation in the affairs of saving and credit cooperative (SACCOS) in Mekelle city, Tigray.
2. RELATED LITERATURE REVIEW A saving and credit cooperatives (SACCOS) is a cooperative financial intermediary institution, owned and controlled by members who use its services. They exist to provide a safe, convenient place for members to save money and to get loans and other financial services at reasonable rates. They play an important role in resource allocation where savings are transferred to economic units that have opportunity for profitable investment (Dougherty, 1987). As Dougherty (1987) noted, the principal functions of SACCOs are to encourage savings and thrift, and to provide consumers credit at favorable interest rates. Njiru (2003) also agreed with Dougherty when he observed that SACCOs were established in order to promote thrift and provide source of credit at a fair rate of interest and pay members a dividend in return for their invested funds.
T

VOLUME NO. 4 (2014), ISSUE NO. 06 (JUNE) ISSN 2231-5756
INTERNATIONAL JOURNAL OF RESEARCH IN COMMERCE, IT & MANAGEMENT A Monthly Double-Blind Peer Reviewed (Refereed/Juried) Open Access International e-Journal - Included in the International Serial Directories
http://ijrcm.org.in/
16
As explained by Hoyt (1996), members’ economic participation is one of the basic principles of cooperatives that govern cooperatives. According to UNDP (1993), participation refers to the involvement of people in the economic, social cultural and political process that affect their lives. People may, in some cases, have complete and direct control over these presses- in other; the control may be partial or indirect. The important thing is that people have constant access to decision making and power. According to Vishwanathan (1994), participation is making the members participate in the economic activity and decision making. Participation in decision making is the only means to make them realize that they are the owners of the organization. Member’s participation is the act of taking part in any activity of the society by all members of the society. According to Selvaraj (2008), in his book Cooperative in the New Millennium, for effective function of the cooperative movement, enlightened members are the pole cooperative. These members will make themselves aware of the problems and have the willingness to contribute to the progress of the cooperatives and their ideals and philosophy. Such membership ensures member participation in the business and managerial affairs of the cooperatives (Selvaraj, 2008). Vigilant members prevent financial irregularities and the emergence of vested interest in cooperatives. Thus, the health of cooperative improves. As against enlightened members, ignorant, sleepy, inactive non-participative and indifferent members become a problem in themselves. They are prone to exploitation by the convert elements in the society (Vishwanathan, 1994). According to Marcus (1992), as cited in Vishwanathan (1994), ICA initiated debate on basic values of cooperatives; members’ participation has been the first. In more practical terms, members’ participation is viewed in terms of participation in management, decision making and control; in business activities and in capital. But with the growing size of the base level cooperative units, and emergence of vertical structures, decision making is gradually shifting away from the base level units. Consequently, ensuring members’ direct participation in planning, decision making and control has becomes difficult, but non-the less, it is a challenge, that needs and has to be met.Members’ participation in business and capital, in some way is related to the performance of a cooperative, but also to the kind of service that a cooperative offers and the degree of integration that that is achieved between the cooperative and the members (Vishwanathan, 2000). Clark (1991) has identified the elements essential for securing active participation of farmer’s groups as small homogenous group; supplementary income generation activities (institutional credit); group promoters; training to group members; group saving; ready access to extension service; participatory monitoring and evolution; and group self-reliance. Clark (1991) also observed the indicators of self-reliance of farmer’s group as regulatory of group meeting and level of attendance; shared leadership and members’ participation in group decision making; continuous growth in group savings; high rates of loans repayment; group problem solving; and effective link with extension and other development services. Mukherjee (1997) observed that the level of participation tends to falcate with passage of time. Sometimes it remains at a low key and then takes off and/or dissipates. While on other occasions, there emerges a high level community participation which a lowly moderates itself and becomes steady. Rahma and Rehman (1998) have found out the factors which determine the nature of participation of the people in development programs as the willingness to participate; the desirability to participate; the representative nature of participants in the local bodies in terms of society a whole or classes and castes; the asset distribution pattern among the participant and the resultant dynamics in interrelationship; and the conflict of interests between the stake holders and direct beneficiaries of the development programs. 2.1. WORLD -WIDE EMPIRICAL STUDIES Rawal (1996) has described in his investigation that illiteracy and the lack of democracy in the functioning of a cooperative are important barriers to the wider and more active participation of the poor in the cooperatives. He also revealed in his conclusion that providing mass education would help the rural poor a great deal in participating actively in these cooperatives. Cooperatives can be required to hold elections to managing committees in general body meetings that have to have a minimum stipulated attendance. Mandatory representation for people from the scheduled castes and scheduled tribes and for women in managing committees should also be considered. This finding was confirmed by Arayesh (2011). He has revealed that the correlation coefficient results showed that there is a significant relationship between the two variables of educational-extension factors and the level of participation of agricultural cooperatives’ members. And this finding was also consistent with findings of the studies conducted by Aghajani (2008), Flick (2009), and Shali (2010). The study undertaken by Vahidzadeh (2004) has also showed that the members’ economical features have direct impact on their participation in agricultural cooperatives. Henry (2005) in his study revealed that the attitude towards satisfaction with credit unions in regression and scale analysis, demographic characteristics like age, gender and education did not have impact on respondents’ intend to patronize credit unions. However, respondents’ income was significant in explaining credit union patronization intensions. Member training, education, and the provision of a form for the discussion on their problems with management and lack of opportunity to influence the way things are done in their credit unions were identified as important variables. Ramezani (2006) in his study about cooperatives in province of Isfahan Iran reported that the level of members’ participation in co-operative affairs, and managers’ expertise were assessed as being average. Managers in comparison with the members’ participation, the level of members’ participation in co-operative affairs were much higher than the managers. The empirical analysis showed that satisfaction with the democratic structure has a positive influence on member participation in the meetings. This can be interpreted as following: members who are satisfied with the democratic structure tend to participate more in the democratic process. Members who are satisfied with the economic relations that they have with their cooperative also seem to participate more in the democratic process, since the analysis showed a strong positive correlation between members’ satisfaction with the economic relation and their participation in the meetings. Thirdly members who are satisfied with the diversification of activities of their cooperative are likely to participate more in the democratic process. On the other hand there is no strong evidence that members who are satisfied with the means of communication with their cooperative are likely to participate more in the democratic process (Christina, Kostas, & Sanjib, 2008). Studies undertaken by Aghajani (2008) and Maghsoudi (2009) showed that the cooperatives’ members’ psychological features have an impact on their participation in agricultural cooperatives’ activities; this finding has been confirmed by Arayesh (2011). The correlation coefficient results showed that there is a significant relationship between the two variables of political-governmental factors and the level of participation of agricultural cooperatives’ members. This finding is consistent with findings of the studies conducted by Saharkhiz (2009). Research conducted by Shikhi (2009) showed that the members’ age has an impact on their participation in agricultural cooperatives; this finding has been confirmed by Arayesh (2011).The correlation coefficient results of the study showed that there is a significant relationship between the two variables of membership history and participation level. And these results were consistent with the research findings of Khodashahri (2009). The correlation coefficient results showed that there is a significant relationship between the two variables of income and level of participation of agricultural cooperatives’ members (Khodashahri (2009). This finding is consistent with findings of the research conducted by Scrimgeour (2006). The correlation coefficient results showed that there is a significant relationship between the two variables of socio-cultural factors and level of participation of agricultural cooperatives’ members. This finding is consistent with findings of the studies conducted by some researchers as Aghajani (2008) and Scrimgeour (2006). Studies undertaken by Flick (2009) and Shali (2010) showed that the managerial factors have direct impact on the level of participation of the agricultural cooperatives’ members .This finding was confirmed by the findings of Arayesh (2011). Arayesh (2011) concluded thatthe correlation coefficient results showed there is significant relationship between the variables like age, background history of membership in cooperatives, the members’ agricultural land areas, annual income of the members, socio-cultural features, economical features, educational-extensional features, managerial factors, psychological features, political factors and communicational-informational factors from the one hand and the dependent variable of agricultural cooperatives’ members’ level of participation from the other. On the whole, the multiple regression analysis results showed that variables like political, economic, managerial and social factors have positive effect on the dependent variable of agricultural cooperatives’ members’ participation, describing 65% of the changes of the mentioned dependent variable (Arayesh, 2011).

VOLUME NO. 4 (2014), ISSUE NO. 06 (JUNE) ISSN 2231-5756
INTERNATIONAL JOURNAL OF RESEARCH IN COMMERCE, IT & MANAGEMENT A Monthly Double-Blind Peer Reviewed (Refereed/Juried) Open Access International e-Journal - Included in the International Serial Directories
http://ijrcm.org.in/
17
2.2. AFRICAN EMPIRICAL STUDIES The major threat to SACCOs is the competition from Banks and MFIs as they make efforts to increase outreach among low and middle income clients in both rural and urban areas and SACCOs own complacency to make the necessary changes to compete in a liberalized economy Grahm (2007). Nguyen (2007) has applied probit model to estimate credit program participation and Tobit model to estimate loan amount received. By separating the source of loan, he expected that the determinants of credit participation would be different as the eligible requirements for borrowing were different between sources. He has specified credit program participation or the loan size as a function of household characteristics including gender of household head, age of household head, number of household members, education level of household head, agricultural work, value of house and land holding size; and of commune characteristics including distance from commune to the nearest Government banks and distance from commune to the nearest. Nguyen (2007) findings were: Number of members in a household was found to have a large and significant effect on credit participation, especially from formal source. Farm work was also significant. Household was more likely to borrow if head of household was working in agriculture or self-business. Individuals’ participation in recently formed National Agricultural Advisory Services farmers’ cooperatives was quite low (16 percent) compared to involvement in other forms of associational life in rural Uganda. The determinants of participation in these groups were examined. Individual characteristics such as age, education, gender and size of land ownership were found to be important in determining an individual’s choice to participate in these groups, as was the level of trust an individual had in other members of their community (Ruth, Tanguy, & Reno, 2008). 2.3. ETHIOPIAN EMPIRICAL STUDIES Tesfaye (1995) revealed that producers’ cooperatives failed in the past not because of failure inherent in the collective management but because of forced membership without the interest of the farmers and formation of the cooperatives in hurry without any sufficient preparation and feasibility study. The problem of intervention of the Derg regime in the affairs of cooperatives i.e. using them for its political ends and the largeness and complexity of the organizations for the managerial capacity of the farmers were also a reason for the failures of the cooperatives. Haileselasie (2003), reported that 78.7 percent of the members became member in cooperatives through mobilization and persuasion by the civil societies such as Farmers, Youth and Women’s Associations. As a result, the members’ were not aware of the duties and rights they have in the cooperative societies. Gebru (2006) found that the participation of women accounts 20-25 percent in various cooperative types in Tigray region. And he concluded that though women are underrepresented in membership and leadership, the condition is improving from year to year in the region. Jemal (2008) revealed that the probability of participation and intensity of participation appear to be significantly and positively influenced by education status, sex, number of paid up share capital, off-farm income, total livestock owned, access to input credit, membership status, access to alternative marketing opportunities and members’ satisfaction by Perceived role performance of cooperatives; while the influence of members’ age, off-farm income and access to alternative market had inverse relationship and significant to determine participation. Perceived role performance of management committee, perception of members’ on transparency and accountability of management committee, total expenditure, on-farm income, total annual income, input purchased, perception on input/output prices, fertility status and farm size of the farm household, membership duration and family size were not significantly related to the dependent variable. Alema (2008) reported that farmers who are relatively nearer to the cooperative office have the chance to participate more in the marketing activities of the cooperatives than farmers who live far away from the cooperative office and have been increased their probability to participate in the agricultural input and output marketing cooperatives. He has also concluded that farmer members at relatively distant location have less alternative marketing agents as compared to those who live near the cooperative which are influenced by other private marketing agents. Teka(2008) explained that access to training was positively and significantly at one percent probability level related to the members’ savings magnitude in RUSACCOs (Rural Saving and Credit Cooperatives). This implies that members who have participated in RUSACCOs training programs have increased the amount of saving in SACCOs. He also revealed that the educational level of the Ofla and AlamataWoreda RUSACCOs members is found statistically insignificant to determined saving behavior of members. The most important reason that educational level of respondents is not significant was due to educated and uneducated respondent’s savings was similar. Teka (2008) also explained that the results of OLS linear regression described that age of the member is significant at less than one percent and negatively relate with savings magnitude of members of RUSACCOs. As age of respondent increase by one year, the savings magnitude of members of RUSACCOs declined by 2.441 birr, by considering that other variables are constant. In addition, Teka (2008) explained that distance of the respondent’s residence from RUSACCOs office was associated with savings magnitude of members negatively and significantly at one percent probability level. Distance to rural savings and credit cooperative societies’ office negatively influences the savings magnitude of members of the societies. As the distance of RUSACCOs increase or decrease by a unit of kilometer from the residence of members, the saving amount of the member’s decreases or increases by 17.657 birr, other variables were constant. Jemal (2008) described that the group statistics showed that there was a significant difference in total annual income of house hold between members who are participating and passive in participation in the cooperatives affairs at less than one percent probability level. Jemal (2008) has also concluded that there was a positive relationship between total annual income and active participation in the cooperatives affairs as less than 1 percent probability level. Kirub (2008) found that there was no a significant relationship between participation and age of cooperative members, and there is positive relationship between educational level and active participating of members. Ahmed (2011) revealed that family size of members influences members’ participation of Rural Saving and Credit Cooperatives (RUSACCO), negatively and significantly at one percent level of significance. This implies that a unit increase in terms of family size of member of RUSSACCOs leads to a decrease of participation of member in RUSACCOs. Moreover, Ahmed (2011), in his study about the characteristics of RUSACCOs respondents by their participation groups reported that those members who have large family size have not actively participated in the affairs of their cooperatives. He revealed that these respondents were founded to be passive members in general assembly meetings; business plan development, election process, exercising leadership and decision making of RUSACCOs. Ahmed (2011) also concluded that age and alternative credit access had negative influence while ,sex ,being a male ,educational level access to loan from SACCOs ,and member ship situation(by self-interest of members) had positive influence on participation of members in saving and credit cooperatives If family size is much large, households cannot save much amount of money than having small family size (Kifle, 2012). Family size is also a major cause of fewer saving. This result is consistent with Burney and Khan (1992) who suggested that the larger the household size, the higher the expenditure and the smaller the amount of saving by the household (Kifle, 2012). The age of the member was negatively associated with savings. As age of the household increases by 1 year it will result in a decline in household savings by 533.17 Birr. It is expected that, savings by the young member would be diminishing with age as they grow towards and beyond retirement age. This shows that the members lessen their savings, as they grow old (Kifle, 2012). This confirms with the life cycle hypothesis of savings, which claims that a person would be expected to save up to a point and then start stop saving as he grows old. Consistent with several empirical studies Rehman (2010) and Robinson (2001), this finding suggested that age of the household is negatively related to household savings (Kifle, 2012). Cooperative member demographic features such as educational status do have positive effect in the household savings but the results of the study show that this variable is negatively correlated with the dependent variable. The rationale behind such type of relationship may be their preference towards education of their children. Elite household heads would like to spend more on their children's education and wish to provide higher studies. In this way, they spend more and save less. One more year of education is attained by head of household, will reduce savings by 300.47 Birr per year (Kifle, 2012). The interpretation is in line with the literature (Burney & Khan, 1992). In contrast, the interest rate was found negative and insignificant in explaining household saving. This means the variable was negatively correlated with the household savings (Kifle, 2012). In summary, the above empirical evidences have identified 16 factors that affect SACCOs members’ participation as age of the member; sex of the members; education level of the members;family size;total monthly income in birr; total monthly consumption expenditure;access of members to loan from SACCOs;access

VOLUME NO. 4 (2014), ISSUE NO. 06 (JUNE) ISSN 2231-5756
INTERNATIONAL JOURNAL OF RESEARCH IN COMMERCE, IT & MANAGEMENT A Monthly Double-Blind Peer Reviewed (Refereed/Juried) Open Access International e-Journal - Included in the International Serial Directories
http://ijrcm.org.in/
18
of alternative saving and credit service providers;membership situation;perception of members’ on transparency and accountability of the management of SACCOs;occupation of members;training undergone to members in relation to saving and credit cooperatives;duration of membership;member’s saving per month in birr; distance from the extension service to members’ house; and members’ satisfaction by the performance of management committee of SACCOs
3. STATEMENT OF THE PROBLEM As shown in Peter and Nilsson study (2009), carried out with over 2000 Swedish farmers, the success of a cooperative depends on the degree of participation of its members. As voluntary organizations, cooperatives are based on a democratic decision-making process that rests upon collective participation, balance of countervailing powers, and cohesion among members (Bijman & Hen-driske, 2002). Moreover, members’ participation in the governance of a cooperative is the distinctive characteristic of this form of organization (Gray, Charles, & Kraenzle, 1998). However, very few studies in management and organizational behavior have investigated the behaviors of farmers and the antecedents of these behaviors in the specific context of cooperatives (Morrow & Hansen, 2004). Birchall and Simmons (2004) tested a model of the members’ motivation to participate to the governance of their cooperative, and found that trust has a central role into farmers’ participative processes. Arayesh (2010) considering the factors influencing the participation of members of agricultural cooperatives in decisions concerning the management of agricultural cooperatives concluded that there is a significant and positive relationship between the member's age, educational level, number of shares in cooperative and the resulting profits from the one hand and the level of their participation in decision-making of the cooperative company from the other. Participation by natives in local program enabled communities to have control over resources. Thus, have been increased their engagement and decision making and, have been improved their general wellbeing, when individuals are empowered as a consequence of active participation (Lyndon, Moorthy, & Selvaduri, 2011). Vahidzadeh (2004) argued that the dominant cause of the failure of cooperatives can be found in three categories: poor management, lack of organizational discipline and weakness in financial vigor. The most significant weak point of the production cooperatives lies in their organizational structure and managerial issues. Khodashahri (2009) in his study entitled” Participation effects of members of cooperatives in economic performance of the cooperatives” concluded that there is a significant relationship between the literacy, membership history, amount of shares, knowledge of cooperative principles and regulations, satisfaction from the cooperative, attending the training-extension courses and ultimately economic performance from the one hand and participation level from the other. Flick (2009) considered the following factors as the main challenges and risks among the cooperative members, affecting the performance of the cooperatives. They are: Lack of motivation among the staff, lack of top-down planning, lack of funds and delayed allocation time, lack of educational facilities in the extension centers, low-literacy and illiteracy of majority of the farmers, lack of skilled manpower, the farmers' distrust of some experts, non-institutionalization of people's participation, extension staff involvement in administrative works, lack of proper planning in the network use of the popular forces, the lack of updated information of extension staff, lack of refresher courses (lack of trainings) and, lack of extension law in the extension system. Concerned with the factors that affect the level of members’ participation in SACCOs, most of the previous studies have concentrated on cooperatives in general, not specifically on SACCOs affairs. Due to the financial investment nature of SACCOs, they are a little bit different from other type cooperatives. Thus, even though many studies have been conducted about members’ participation in cooperatives in general, there is no specific study about the factors that affect members’ level of participation on the specific type of cooperatives, i.e., SACCOs’ affairs. The previous studies were mainly related to cooperatives engaged in rural agricultural activities but not in cities that the source of money for members to save in the SACCOs is not mainly from agricultural activities. Therefore, there was a need to make an in-depth examination and analysis of the factors influencing the level of participation of members’ in their SACCOs affairs in Mekelle city, Tigray.
4. OBJECTIVES OF THE STUDY The objective of the study was to identify and analyze the factors that affect members’ level of participation in their SACCO’s affairs. Its specific objectives were: 1. To identify factors that determines the level of participation of members in SACCO’s affairs. 2. To examine the extent of the factors to affect the level of members’ participation in the SACCOs affairs.
5. RESEARCH METHODOLOGY The study was conducted based on some variables that could affect the level of members’ participation in their SACCOs affairs based on literature reviews and previous empirical findings. The study was also confined to the factors that affect members’ level of participation in SACCO’s affairs in relation to Mekelle City only due to the financial budget and time constraints. Hence, generalization of the findings of this study is subjected to this area only, not to all SACCOs in Tigray. 5.1. STUDY DESIGN The research approach employed for this study was hybrid, i.e., qualitative as well as quantitative approaches. 5.2. SAMPLE DESIGN Because of the population of the study was heterogeneous, to give equal chance for all the study population of saving and credit cooperative societies and members, the study population was identified based on the source of income, i.e., employees dominated associations, traders dominated associations members ,and women dominated association . Firstly, the population was divided in to three strata based on the above criteria so as to geta reasonable sample size .Secondly, proportional stratified sampling was used to select 10 sample of saving and credit cooperatives from each stratum and gender(from the women dominated association only). Finally, for selecting the samples of members from each stratum simple randomly sampling (lottery method) was used by taking list of respondents from the office of Cooperative and Marketing Promotion of Mekelle city. Thus, the sampling design of the study was proportional stratified sampling followed by simple random sampling (lottery) technique.
TABLE 1: STRATIFIED PROPORTIONAL SAMPLE OF SACCOS
S/N Type of specific SACCOs Number of SACCOs in the city StratifiedProportional Sample of SACCOs taken Remark
1 Women members dominated association 28 4 28*10 ≈4 71
2 Employees members dominated association 20 3 20*10 ≈3 71
3 Traders members dominated association 19 3 19*10 ≈ 3 71
4 Others(mixed) 4 - -
Total and sample of saving and credit cooperatives 71 10 10
Source: Cooperative Marketing and Promotion (2013). NB: The four mixed types SACCOs were assumed to be dominated by the result of the 67 SACCOs and they were not considered in the sample design. 5.3. SAMPLE SIZE The whole population of total members and total saving and credit cooperatives were taken as 6000 and 71, respectively. From this total population, the study has considered only 10 saving and credit cooperative societies and from these 10 SACCOs, 265 members have been taken as a sample study. These 265 members have been selected by proportional random (lottery) sampling method. The reason why this study has considered 10 SACCOs is that it has been

VOLUME NO. 4 (2014), ISSUE NO. 06 (JUNE) ISSN 2231-5756
INTERNATIONAL JOURNAL OF RESEARCH IN COMMERCE, IT & MANAGEMENT A Monthly Double-Blind Peer Reviewed (Refereed/Juried) Open Access International e-Journal - Included in the International Serial Directories
http://ijrcm.org.in/
19
assumed these 10 SACCOs can represent well to the study population better than less of this number of SACCOs. The sample size (i.e., 265) was determined by using the scientific formula given by Yemane (1967) at 6% error.
TABLE 2: SAMPLE OF SACCOs TAKEN
Source: Cooperative and Marketing Promotion (2013). Proportional numbers of sample respondents weredetermined as follows: Example: 256*58 = 10 (respondents from Netsanet-1) 1507 5.4. DATA COLLECTION PROCEDURES AND SOURCES As stated earlier, in order to achieve the aforementioned objectives, the study used both quantitative and qualitative approach and the source of data was only primary. To collect the data, three data enumerators were trained and oriented by the researcher how to collect the data. After training and orientation have been given to the data enumerators, the data was collected by them through 200 close ended questionnaires and 65 semi-structured interviews with the members of the saving and credit cooperatives of the study area under the supervision of the researcher. 5.5. METHOD OF DATA ANALYSIS The Tobit model was used to analyze the primary data collected.The Tobit model was specified as follows:
Yi = + β1X1 + β2X2 + β3X3+ β4X4+ β5X5+ β6X6+ β7X7+ β8X8 +β9X9 + β10X10+ β11X11+ β12X12+ β13X13+ β14X14+ β15X15 +e
Where;Yi = Members’ Participation and intensity of their participation in saving and credit cooperatives; = Constant; Βi=Vector of unknown parameters; X1= Age; X2= Sex; X3= EDUC; X4= FMZE; X5= TMIM; X6= TMCN; X7= DIS; X 8= ACTR; X9= ACALT; X10= M STN; X11= PMTAMGT; X12= PMSMGT; X13= TRNG; X14= M SAPM; X
15= DUTN; X 16= OCUP; and e = error term
TABLE 3: SUMMARY OF DEFINITION, TYPE, AND EXPECTED SIGNS OF MODEL VARIABLES
S/N Variable Definition Type of variable Expected result on participation of members
1 Age Age of respondent Continuous Negative
2 Sex Sex of respondent Dummy(2= female,1= male) Being “1”= Negative
3 EDUC Education of respondent Discrete Negative
4 FMZE Family size of respondent Continuous Positive
5 TMIM Total monthly income in birr Continuous Negative
6 TMCN Total monthly consumption expenditure Continuous Positive
7 DIS Distance from the extension Service to members’ house Dummy(2= no; 1= yes) Being “1”= Positive
8 ACTR Access of members’ to credit from SACCOs. Dummy(2= no; 1= yes) Being “1”= Negative
9 ACALT Access to alternative service providers Dummy(2= no; 1= yes) Being “1”=Negative
10 M STN Membership Situation Discrete Being “1”=Negative
11 PMTAMGT Perception of Members’ on Transparency and Accountability the management of SACCO Dummy(2= no; 1= yes) Being “1”= Negative
12 PMSMGT Perception of members’ Satisfaction by the management of SACCO Discrete Being “1”= Negative
13 TRNG Training undergone to members in relation to saving and credit cooperatives Dummy(2= no; 1= yes) Being “1”= Negative
14 M SAPM Member’s saving Per month Continuous Negative
15 DUTN Duration of membership Continuous Negative
Prior to running the Tobit model, the hypothesized explanatory variables were checked for the existence of multicollinearity and heterosedasticity problems. Accordingly, the continuous and discrete explanatory variables were tested for multicollinearity and except occupation of members that has been omitted due to this problem; there was no multicollinearity problem among others (i.e., VIF < 10); Similarly, coefficients of contingency was computed to check if the contingency coefficient (CC) is greater than 0.75, which shows that there is very high degree of association between the qualitative variables (Gujarati, 1995). Except for occupation of members which had problem of multicollinearity with others and this variable was not included in the Tobit model analysis, all the dummy independent variables CC is less than 0.75 and have no multicollinearity problem. Besides, it was tested for its heterosedasticity by using Hettest Breusch-Pagan/Cook-Weisberg test for heterosedasticity and found free from heterosedasticity, i.e., the result showed that Prob> chi2 was 0.1542 (15.42%)(i.e., chi2(1) =2.03; Prob > chi2 = 0.1542), which is greater than that of the significance level of 5%. Therefore, this result indicated that there is no heteroskedasticity problem and there is equal variance among the error terms. Therefore, the model is properly specified and well fitted for further analysis. The following three analyses were made by using the Tobit model: 1. The change in the probability of participating in SACCOs as independent variable Xi changes:
Y = + β 1X1 + β 2X2 + β 3X3…β 15X15 + ei …………. (1) Where, Y= Members’ participation and intensity of their participation in saving and credit cooperatives; β=vector of unknown parameters;ei = residuals that are independently and normally distributed with mean zero and a common variance σ2; X1-X15= Explanatory variables that affect members’ participation and index of participation. RESEARCH HYPOTHESES H1: Age positively influences members’ participation and members’ intensity of participation in SACCOs. H2: Male members have less experience and access in participating in SACCOs than female members. H3: Educated members have passive effect on participation. H4: High family size positively influences members’ participation and members’ intensity of participation. H5: High monthly income negatively influences members’ participation and members’ intensity of participation. H6: The probability of participation and intensity of participation in cooperatives is significantly related to total expenditure of members.
S/N Name of SACCOs Type of SACCOs Number of Members Proportional Number of Sample Respondents Selected
Male Female Total Male Female Total
1 Netsanet-1 Women - 58 58 - 10 10
2 Netsanet-2 Women - 76 76 - 13 13
3 Silassie Women - 40 40 - 7 7
4 Mihzinet Women - 150 150 - 26 26
5 Mayhiwet Employees 30 29 59 5 5 10
6 Walta Employees 60 35 95 11 6 17
7 Tiena Employees 54 29 83 9 5 14
8 Embeba Traders 213 81 294 37 14 51
9 Daero Traders 388 199 587 70 35 105
10 Felamit Traders 35 30 65 7 5 12
Total 775 732 1507 139 126 265
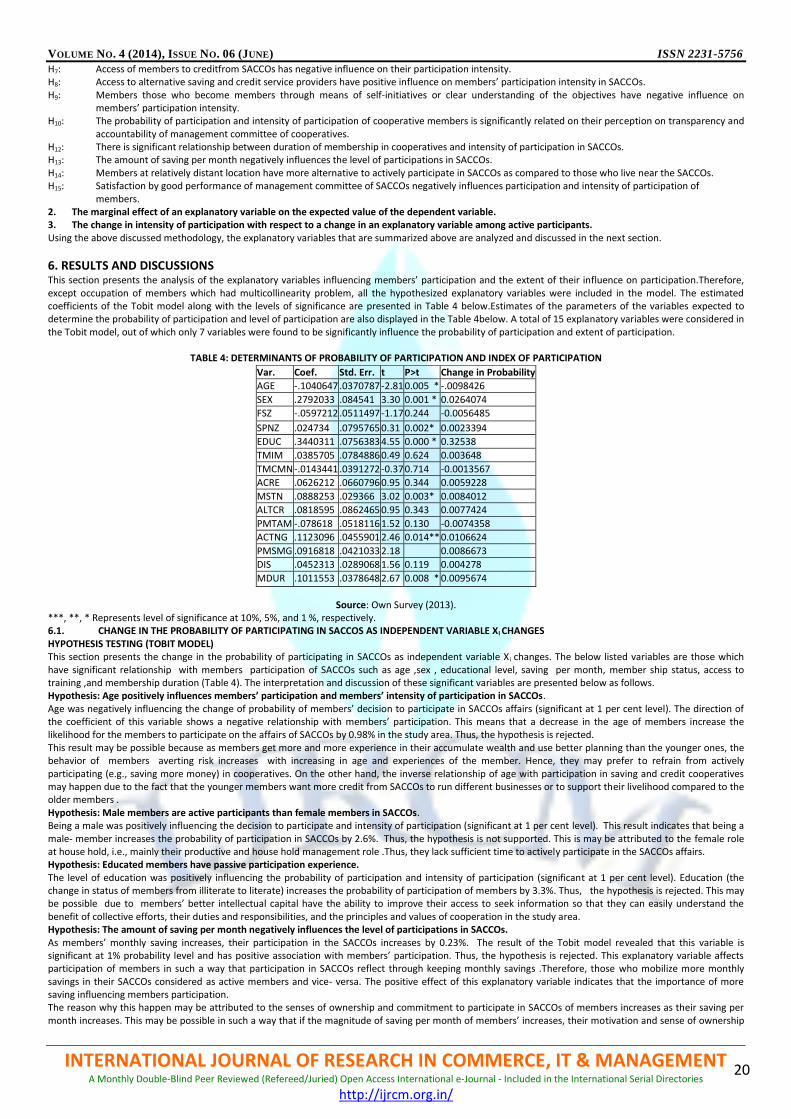
VOLUME NO. 4 (2014), ISSUE NO. 06 (JUNE) ISSN 2231-5756
INTERNATIONAL JOURNAL OF RESEARCH IN COMMERCE, IT & MANAGEMENT A Monthly Double-Blind Peer Reviewed (Refereed/Juried) Open Access International e-Journal - Included in the International Serial Directories
http://ijrcm.org.in/
20
H7: Access of members to creditfrom SACCOs has negative influence on their participation intensity. H8: Access to alternative saving and credit service providers have positive influence on members’ participation intensity in SACCOs. H9: Members those who become members through means of self-initiatives or clear understanding of the objectives have negative influence on
members’ participation intensity. H10: The probability of participation and intensity of participation of cooperative members is significantly related on their perception on transparency and
accountability of management committee of cooperatives. H12: There is significant relationship between duration of membership in cooperatives and intensity of participation in SACCOs. H13: The amount of saving per month negatively influences the level of participations in SACCOs. H14: Members at relatively distant location have more alternative to actively participate in SACCOs as compared to those who live near the SACCOs. H15: Satisfaction by good performance of management committee of SACCOs negatively influences participation and intensity of participation of members. 2. The marginal effect of an explanatory variable on the expected value of the dependent variable. 3. The change in intensity of participation with respect to a change in an explanatory variable among active participants. Using the above discussed methodology, the explanatory variables that are summarized above are analyzed and discussed in the next section.
6. RESULTS AND DISCUSSIONS This section presents the analysis of the explanatory variables influencing members’ participation and the extent of their influence on participation.Therefore, except occupation of members which had multicollinearity problem, all the hypothesized explanatory variables were included in the model. The estimated coefficients of the Tobit model along with the levels of significance are presented in Table 4 below.Estimates of the parameters of the variables expected to determine the probability of participation and level of participation are also displayed in the Table 4below. A total of 15 explanatory variables were considered in the Tobit model, out of which only 7 variables were found to be significantly influence the probability of participation and extent of participation.
TABLE 4: DETERMINANTS OF PROBABILITY OF PARTICIPATION AND INDEX OF PARTICIPATION
Source: Own Survey (2013).
***, **, * Represents level of significance at 10%, 5%, and 1 %, respectively. 6.1. CHANGE IN THE PROBABILITY OF PARTICIPATING IN SACCOS AS INDEPENDENT VARIABLE XI CHANGES HYPOTHESIS TESTING (TOBIT MODEL) This section presents the change in the probability of participating in SACCOs as independent variable X i changes. The below listed variables are those which have significant relationship with members participation of SACCOs such as age ,sex , educational level, saving per month, member ship status, access to training ,and membership duration (Table 4). The interpretation and discussion of these significant variables are presented below as follows. Hypothesis: Age positively influences members’ participation and members’ intensity of participation in SACCOs. Age was negatively influencing the change of probability of members’ decision to participate in SACCOs affairs (significant at 1 per cent level). The direction of the coefficient of this variable shows a negative relationship with members’ participation. This means that a decrease in the age of members increase the likelihood for the members to participate on the affairs of SACCOs by 0.98% in the study area. Thus, the hypothesis is rejected. This result may be possible because as members get more and more experience in their accumulate wealth and use better planning than the younger ones, the behavior of members averting risk increases with increasing in age and experiences of the member. Hence, they may prefer to refrain from actively participating (e.g., saving more money) in cooperatives. On the other hand, the inverse relationship of age with participation in saving and credit cooperatives may happen due to the fact that the younger members want more credit from SACCOs to run different businesses or to support their livelihood compared to the older members . Hypothesis: Male members are active participants than female members in SACCOs. Being a male was positively influencing the decision to participate and intensity of participation (significant at 1 per cent level). This result indicates that being a male- member increases the probability of participation in SACCOs by 2.6%. Thus, the hypothesis is not supported. This is may be attributed to the female role at house hold, i.e., mainly their productive and house hold management role .Thus, they lack sufficient time to actively participate in the SACCOs affairs. Hypothesis: Educated members have passive participation experience. The level of education was positively influencing the probability of participation and intensity of participation (significant at 1 per cent level). Education (the change in status of members from illiterate to literate) increases the probability of participation of members by 3.3%. Thus, the hypothesis is rejected. This may be possible due to members’ better intellectual capital have the ability to improve their access to seek information so that they can easily understand the benefit of collective efforts, their duties and responsibilities, and the principles and values of cooperation in the study area. Hypothesis: The amount of saving per month negatively influences the level of participations in SACCOs. As members’ monthly saving increases, their participation in the SACCOs increases by 0.23%. The result of the Tobit model revealed that this variable is significant at 1% probability level and has positive association with members’ participation. Thus, the hypothesis is rejected. This explanatory variable affects participation of members in such a way that participation in SACCOs reflect through keeping monthly savings .Therefore, those who mobilize more monthly savings in their SACCOs considered as active members and vice- versa. The positive effect of this explanatory variable indicates that the importance of more saving influencing members participation. The reason why this happen may be attributed to the senses of ownership and commitment to participate in SACCOs of members increases as their saving per month increases. This may be possible in such a way that if the magnitude of saving per month of members’ increases, their motivation and sense of ownership
Var. Coef. Std. Err. t P>t Change in Probability
AGE -.1040647 .0370787 -2.81 0.005 * -.0098426
SEX .2792033 .084541 3.30 0.001 * 0.0264074
FSZ -.0597212 .0511497 -1.17 0.244 -0.0056485
SPNZ .024734 .0795765 0.31 0.002* 0.0023394
EDUC .3440311 .0756383 4.55 0.000 * 0.32538
TMIM .0385705 .0784886 0.49 0.624 0.003648
TMCMN -.0143441 .0391272 -0.37 0.714 -0.0013567
ACRE .0626212 .0660796 0.95 0.344 0.0059228
MSTN .0888253 .029366 3.02 0.003* 0.0084012
ALTCR .0818595 .0862465 0.95 0.343 0.0077424
PMTAM -.078618 .0518116 1.52 0.130 -0.0074358
ACTNG .1123096 .0455901 2.46 0.014** 0.0106624
PMSMG .0916818 .0421033 2.18 0.0086673
DIS .0452313 .0289068 1.56 0.119 0.004278
MDUR .1011553 .0378648 2.67 0.008 * 0.0095674

VOLUME NO. 4 (2014), ISSUE NO. 06 (JUNE) ISSN 2231-5756
INTERNATIONAL JOURNAL OF RESEARCH IN COMMERCE, IT & MANAGEMENT A Monthly Double-Blind Peer Reviewed (Refereed/Juried) Open Access International e-Journal - Included in the International Serial Directories
http://ijrcm.org.in/
21
also increases and this helps members to accumulate saving and to get loan with fair interest rate, at reasonable time, and to encourage thrift through savings and channel them in to small loans for productive purpose at the member level. Hypothesis: Members who become members through means of self-initiatives or clear understanding of the objectives have negative influence on members’ participation intensity. The Tobit model result revealed that the participation of members is influenced by the condition which allows them to become members (Significant at1% level). The sample respondents who became member through self-initiation and convinced by the promotional works were participating actively better than the other groups. This means that being a member through self-initiation and convincing manners (that is through the efforts of awareness raising activities) more likely encourage them decide to participate in various activities of SACCOs actively by 0.84% .The implication is that convinced members are keen to be aware of what is going on in the SACCOs and encouraged to have active role in patronizing the business. Thus, the hypothesis is rejected. Hypothesis: Trained members are passive participants than non-trained members. Access to training was positively influencing the probability to participate and intensity of participation (significant at 5% level). The study result revealed that this variable is significant at 5% probability level and has positive association with members’ participation in SACCOs. As Access to training increases, participation increases by 1%. Thus, the hypothesis is not supported. The positive effect of this variable indicates that the importance of training influencing members participation. This variable may affect participation of members in such a way that participation in SACCOs reflects knowledge and awareness about SACCOs through training of members’. Therefore, those trained members were considered as active members and vice- versa. Duration of membership Hypothesis: There is significant relationship between duration of membership and intensity of participation in SACCOs. Duration of membership was also positively influencing the probability of participation and intensity of participation (significant at 1% level). In this study, as duration of membership increases, participation of members increases by 1%. Thus, the hypothesis is accepted. This result may be possible due to the benefit of active participation of members in the previous cooperatives they had gained from their experience. In summary, the Tobit model test indicated that total monthly consumption expenditure, family size, perception of members’ satisfaction by the management of SACCO, access of members’ to credit from SACCOs, access to alternative credit providers, perception of members’ on transparency and accountability of the management committee of SACCO, total monthly income in Birr and distance from the extension service to members’ home had no significant influence. On the other hand, sex, age, member’s saving per month, duration of membership, education, membership situation and training had statically significant positive and negative influence on members’ active participation on SACCOs’ affairs. The next section has presented the effect of changes of significant variables on the only active as well as to the whole sample members. 6.2. EFFECTS OF CHANGES OF SIGNIFICANT VARIABLESON THE INDEX OF PARTICIPATION INTENSITY The Tobit model was also used to identify the effects of marginal changes of the significant explanatory variables on the level of participation of members in SACCOs. Table 5 below presents the effect of marginal changes of explanatory variables only on the intensity of participation among actively participating members (APMs) as well as the entire sample respondents.
TABLE 5: THE EFFECT OF CHANGE IN SIGNIFICANT EXPLANATORY VARIABLES ON INTENSITY OF PARTICIPATION
Source: Own Survey (2013). Among the significant variables, members’ age was the only explanatory variable which had inverse relation with the intensity of participation. The increase in one year in age reduces the probability of participation by 0.052(5.2%) for APMs and by 0.0098 (0.98%) for the whole sample respondents. This may be because as the age of member’s increases their decision on resource allocation including time to participate in SACCOs depends on the tangible and expected outputs which they thought it can bring for them and may be because age taught them to thoroughly see the risks and benefits associated with participating in cooperatives. Sex of the member (being a male) increased the intensity of members’ participation by 0.14(14%) among APMs, and by 0.026(2.6%) among the entire sample. This implies that male members have relatively sufficient time to patron and actively participate on SACCOs affairs than female members. The marginal effect result revealed that the change in the education status of the members (from illiterate to literate) increases participation index by 0.1729(17.3%) among APMs, and by 0.03(3.2%) among the whole sample respondents. This may be possible due to members’ better intellectual capital have the ability to improve their access to seek information so that they can easily understand the benefit of collective efforts, their duties and responsibilities, and the principles and values of cooperation in the study area. Access to training opportunities was also significant explanatory variable, which represents institutional characteristics. The study revealed that as members have accesses to more training opportunities, the probability of participation in SACCOs increases. An increase in the number of the training opportunities increases the level of participation by 0.046(4.6%) for APMs and by 0.0074(0.74%) for the whole sample respondents. This variable may affect participation of members in such a way that participation in SACCOs reflects knowledge and awareness about SACCOs through training of members’. The condition members joined to cooperatives had positively influenced the intensity of members’ participation. The condition of membership to be member in cooperatives influenced positively the level of participation. The marginal effect result showed that being a member through self-initiation and convincing mechanisms (promotional efforts) increases the index of participation by 0.044(4.4%) for the actively participating members and by 0.084(8.4%) for the whole sample respondents. Promotional effort is so essential to enhance self-initiated membership so that members’ level of participation in cooperatives can be improved. The marginal effect result showed that as members’ saving per month increases, the intensity of participation of members increases by 0.056(5.6%) for the actively participating members and by 0.0087(0.87%) for the whole sample respondents. This may be attributed to the senses of ownership and commitment to participate in SACCOs of members increases as their saving per month increases. The marginal effect result revealed that as member’s membership duration increases, the intensity of participation of members increases by 0.05(5%) for APMs and 0.009 (0.9%) for the whole sample respondents. This implies that long duration of members’ in cooperatives, increases the members’ sense of ownership and commitment to participate in SACCOs affairs. In summary, the significant variables identified ( sex, age; member’s saving per month,duration of membership, education,membership situation and training) to have statistically significant impact on members participation on SACCOs affairs proved that they have significant impact on intensity of members participation among the active participant members and the whole sample respondents.
7. CONCLUSIONS AND RECOMMENDATIONS Based on the results of the study, the following recommendations are forwarded in order to overcome the low level of participation of members in their SACCOs affairs and, to be considered in the future intervention strategies which are aiming to enhance the level of participation of members on their SACCOs affairs.
Variables Coef. Change among APMs Marginal effect among the whole sample
AGE -.1040647 -.0523193 -.0098426
SEX .2792033 .1403717 .0264074
EDUC .3440311 .1729644 .0325389
MSHN .0888253 .0446576 .0084012
ACTNG .1123096 .0460937 .0074358
SPNZ .0916818 .0564645 .0086714
MDUR .1011553 .0508566 .0095674

VOLUME NO. 4 (2014), ISSUE NO. 06 (JUNE) ISSN 2231-5756
INTERNATIONAL JOURNAL OF RESEARCH IN COMMERCE, IT & MANAGEMENT A Monthly Double-Blind Peer Reviewed (Refereed/Juried) Open Access International e-Journal - Included in the International Serial Directories
http://ijrcm.org.in/
22
To tackle the problem of passive participation of members, the intervention strategies of the marketing and cooperative promotion office of Mekelle city and other stake holders should focus on the members’ awareness that they are owners, users and have responsibility to control SACCO’s activities. The Tobit model has indicated that male members are active participants than male members’. So, the Government, NGOs and, especially the office of marketing and cooperative promotion of Mekelle city need to give a due attention to enhance the level of participation of female members. The Tobit model has also revealed that most of the members in the study area were not joined through self-initiatives or convinced with the objectives and benefits of the cooperatives but to get NGO /GO funds. Thus, the office of marketing and cooperative promotion should change this situation to self-initiatives or convinced with the objectives and benefits of the cooperatives to be a membership by working hard on raising the members’ awareness. The study result has indicated that the level of education of members has positive effect to become active participant members. This is a good opportunity and strength that can help members to understand their rights easily to be a member, use available services like loan and also meet their obligation such as contributing share capital and, the role of education to motivate and let members participate on cooperatives’ affairs actively. Moreover, the Tobit model result has showed that as members’ saving per month increases, the intensity of participation of members’ also increases. Therefore, the office of marketing and cooperative promotion should focus on how to increase members’ saving per month to enhance the level of their participation in the cooperatives by raising the members’ awareness on this issue. The marginal effect result has revealed that as member’s membership duration increases, the intensity of participation of members’ increases. Thus, the Government, NGOs and specially the office of marketing and cooperative promotion need to give a due attention to how the members of cooperatives continue as membership by working hard on different promotional activities and by using different Medias. The marginal effect result has also showed that as members’ age increases, the probability of participation of members decreases (i.e., age has inverse relationship with the intensity of participation). Thus, this situation should be adjusted in a way that regardless of their age, all members should participate actively in the SACCOs affairs. It would not be realistic to entirely rely on the development of SACCOs on government regulatory agency’s support for promotion, training, auditing, fulfilling facilities and other supports important for them. SACCCOs should enhance their capability to become self- help institutions to finance their own affairs. As they become more relied on external supports, they would potentially compromise their autonomy. Efforts by the office of marketing and cooperative promotion have to be done to raise awareness of members on the principles, values including their duties and responsibilities. Besides, the Board of SACCOs is expected to run and follow up all the activities of these cooperatives The office should give emphasis (due attention) on the level of members’ participation on the SACCOs affairs and, work strongly on raising awareness of members, up grading the overall capacity of Boards and management committee, specifically, to improve active participation of members and the performance of SACCOs in general. Poor participation of sample respondents in various activities of SACCOs was not only indicators of limitations on organizational and institutional capacity of the SACCOs of the study area. Also it implies for the need of effective intervention measures to improve the situation. Therefore, to overcome the problems of passive participation of members in SACOOs affairs sustainably, the Government, NGOs and other cooperatives should focus on the factors that affect active participation of members in these cooperatives. Research based comprehensive technical and legal support should be introduced in order to enhance the level of participation of members. The level of participation of members in the SACCOs affairs may affect the organizational and institutional overall performance capabilities. Therefore, this requires proper design to adopt area and activity specific management system or procedure and operational manual and needs to be introduced into all SACCOs. So, the office of marketing and cooperative promotion of Mekelle city and the government need to give due attention. Besides, involvement of the members in designing, developing and demonstrating the appropriate SACCOs’ policy, regulations/procedures and approaches that enhance proper identification of social, cultural, political and economic constraints should be enhanced by the office. Well designed and developed approach is essential to promote vertical and horizontal integration among SACCOs, other cooperatives, and other financial institutions to promote available and cost effective credit to bring about efficiency in the level of participation of members and performances SACCOs in general. Finally, union of SACCOs (secondary level of SACCOs) should be established by the help of marketing and cooperative promotion of Mekelle city and other stake holders to give technical, financial and other supports to the primary SACCOs in the study area.
8. LIMITATIONS AND SUGGESTIONS FOR FURTHER RESEARCH The study has taken four women members dominated associations (“Mahibers”) as representative for a sample by stratified random sampling method and, the other six sample associations (“Mahibers”) were employee member associations and trader member associations (“Mahibers”) including female members. Thus, there was a limitation in taking the samples to compare whether male or female members are active participants. The second limitation was that among the 10 sample SACCOs, no comparison was made by their name, that is which associations (“Mahiber”) has the most active members and which association (“Mahiber”) has the most passive members in their participation in the SACCOs affairs and why. Thus, the study suggests that the above two limitations should be resolved by taking a sample that contains proportional number of sample members by their sex and make comparative analysis on gender as well as association(“Mahiber”) basis.
REFERENCES 1. Aghajani, M. (2008). Study and assessment of activities of rural production cooperatives.Master Thesis, Isfahan University of Technology, Iran. 2. Ahmed, M. (2011).Factors influencing members’ participation of RUSACCOs in AysaitaWoreda. Master Thesis,College of Business and Economics, Mekelle
University, Ethiopia. 3. Alema, S. (2008).Analysis of the role of cooperatives in agricultural input and output marketing in Tigray.Master Thesis, Department of Cooperatives,
Mekelle University, Ethiopia. 4. Arayesh, B. (2011). An analysis of people’s participation barriers in protection and regeneration of forests and pastures in Iran. Master Thesis, College of
Agriculture, Isfahan University of Technology. 5. Arayesh, B., &Mammi, S. (2010). Prioritization psychological factors in the process of popular participation groups to preserve, revival, develop and using
natural resources. Procedia-Soc. Behavior. Sci., 5, 174-177. DOI: 10.1016/j.sbspro.2010.07.068 6. Beyene, J. (2009). Participation of women in rural saving and credit cooperatives.Master Thesis, Department of Cooperatives, Mekelle University, Ethiopia. 7. Bhuyan, S. (2007). The people factor in cooperatives: An analysis of members’ attitudes and behavior. Journal of Agricultural economics, 55(3), 275- 298. 8. Birchall, J., &Simmon, R. (2004). What motivates members to participate in co-operative and mutual businesses?Annals of Public & Cooperative Economics,
75(3), 465- 495. 9. Brian, D., &Blume, G. (2009).Individual and organizational level consequences of organizational citizenship behaviors: A Meta-analysis. Journal of Applied
Psychology, 94(1), 122-141. 10. Burney, N.A., & Khan, A.H. (1992). Socioeconomic characteristics and household savings: An analysis of the households’ saving behavior in Pakistan. The
Pakistan Development Review, 31(1), 31-48. Retrieved on 21 September 2012 from www.econpapers.repec.org. 11. Chowdhry, K., & Gilbert, H.(1996). Reforming agricultural extension: Blending greater participation and sustainability with institutional strengthening in
Bangladesh. Agricultural Research and Extension Network Paper. 12. Christina, V., Kostas, K., & Sanjib, B. (2008) .Organizational characteristics and member participation in agricultural cooperatives: Evidence from Modern
Danish Cooperatives. Danish Advisory Center: University of Copenhagen, Denmark. 13. Clark ,G.C.(1991). An effective strategy for securing sustainable participation of small farmers in rain fed areas: Extension strategies for rain fed
Agriculture. India: ISEE & ICAR, New Delhi, 142-147. 14. Cooperative Marketing and Promotion. (2013). Annual report of 2013 submitted to Tigray Cooperative Marketing and Promotion Agency, Mekelle,
Ethiopia.

VOLUME NO. 4 (2014), ISSUE NO. 06 (JUNE) ISSN 2231-5756
INTERNATIONAL JOURNAL OF RESEARCH IN COMMERCE, IT & MANAGEMENT A Monthly Double-Blind Peer Reviewed (Refereed/Juried) Open Access International e-Journal - Included in the International Serial Directories
http://ijrcm.org.in/
23
15. Develter, P., &Pollet, I. (2005). Cooperative and fair trade: Background paper commissioned by the committee for the promotion and advancement of cooperatives (COPAC) for COPAC open forum on fair trade cooperatives. Berlin (Germany): Leuven, HIVA.
16. Dougherty, W. (1987).Making money in credit unions: The financial services handbook. New York: John Wiley & Sons. 17. FAO. (1991). Plan of action for people’s participation in rural development. Rome, Italy:ED to FAO . 26th Conference. 18. Flick, U. (2009).An Introduction to qualitative research. London: 1st ed., SAGE Publications Ltd, ISBN-10: 1847873243, pp: 528. 19. Galor Z.(n.d.) .A new conceptual approach: International Cooperative Review. Israel: Retrieved on March 19, 2013 fromwww.coopgalor.com.pdf. 20. Gebru, D. (2006). The benefits of cooperative membership: A comparative study in Ofla and KafitaHumera District, Tigray Region, Ethiopia. A Thesis in
University College of Cork, National University of Ireland, Cork. 21. Grahm, (2007). Rural outreach and financial cooperatives. SACCOS in Kenya. 22. Gray, T., & Charles, A. K.(1998). Member participation in agricultural cooperatives: A Regression and Scale Analysis. Rural Business Cooperative Service,
Research Report 165. Department of Agriculture, Washington, D.C: United States. 23. Gray, W. (1998).Member Participation in agricultural cooperatives: A regression and scale Analysis. Rural Business- Cooperative Service (RBS), Research
Report 165. Department of Agriculture, United States. 24. Gujarati, D. (1995). Basic econometric.New York: McGraw Hill, Inc. 25. Haileselasie, G. (2003). The benefits of cooperative membership: A comparative study in SaesieTsaedaEmba District, Tigray Region, Ethiopia. A Master
Thesis in University College of Cork, National University of Ireland, Cork. 26. Hansen, M., & Juan, B.( 2002). The impact of trust on cooperative membership retention, Performance and, satisfaction: An exploratory study.
International Food and Agribusiness Management Review 5(1), 41-59. 27. Hendrikse, W., &Bijman, R. (2002). The emergence of new growers associations: Self-selection versus countervailing power. European Review of
Agricultural Economics, 29(2), 255-269. 28. Henry, A., & Ellen, G. (2005).Attitudes towards and satisfaction with credit unions. Alberta: Canadian Agricultural Economics Association. 29. Hoyt, A. (1996): And then there were seven: Cooperative principles. Available at www.uwcc.com 30. Jemal, M. (2008). Analysis of the role of cooperative in agricultural input marketing. Eastern Zone, Tigray Region.A Master Thesis, Dry land Agriculture and
Natural Resources, Mekelle University, Ethiopia. 31. Jember,(2009). Participation of women in rural saving and credit cooperatives: A case of Shebedino District, Sidama Zone, Southern Ethiopia. VanHall
Corenstein, Part of Wageningen University. 32. Khodashahri, H.A. (2009). A study of the fishermen participation impact on economic performance. India:Gilan Province Taavon Cooperatives. 33. Kifle, T. S. (2012). Determinants of saving behavior of cooperatives members’: Survey Evidence from Tigray Region, Ethiopia. 34. Kirub, A.(2008). Members’ participation in Awabel. A Master Thesis, Multi-Purpose Farmers’ Cooperative Union and Affiliates. Mekelle University,
Ethiopia. 35. Lyndon, N., Moorthy, A., & Selvaduri. (2011). Native understanding of participation and empowerment in community development.
Jsoc.Sci:7.643648DCI:10.3844/jssp.2011.643.648 36. Maghsoudi, A., &Jahanshahi, A. (2009). Estimates of (co)variance component for productive and composite reproductive traits. Cashmere Livestock
Science, 126, 162-167. DOI: 10.1016/j.livsci.2009.06.016. 37. Midgley, J. (1986).Community participation, social development and the state. London: Methuen. 38. Morrow, J., & Hansen, H.(2004). The cognitive and affective antecedents of general trust within cooperative organizations. Journal of Managerial Issues,
16(1), 48-64. 39. Mukherejee, N. (1997). Participatory appraisal of natural resources. New Delhi, India: Concept Publishing Company. 40. Narayanasmy, N., &Boraian, M. (1998).Community participation in small and big villages. London: Methuen 41. Nguyen, C.H. (2007). Determinants of credit participation and its impact on household consumption: Evidence from rural Vietnam. Discussion Paper
2007/03. 42. Njiru, L. (2003). Determinants of dividend payments by SACCOs in Nairobi.Unpublished MBA Project, University of Nairobi. 43. Organ, D. (1988).Organizational citizenship behavior: The good soldier syndrome. Lexington: Sage Publications. 44. Organ, D., & Scott, B.(2006). Organizational citizenship behavior: Its nature, antecedents, and consequence. Lexington: Thousand OA, Sage Publications. 45. Osterberg,& Jerker. (2009). Members’ perception of their participation in the governance of cooperatives: The key to trust and commitment in agriculture
Cooperatives. Agri-Business, 25(2), 181-197. 46. Ouma, S.(1989). Development in Kenya through cooperative. Nairobi: Book wise Ltd. 47. Peter, O., & Nilsson, J.(2009). Members’ perception of their participation in the governance of cooperatives: The key to trust and commitment in
agricultural cooperatives. Agri-Business, 25(2), 181-197. 48. Pimbert, M., & Pretty, J.(1997). Diversity and sustainability in community –based conservation. Paper presented at UNESCO-IIPA, Regional Workshop on
Community based Conservation, India, February 9-12. 49. Rahma, R., & Rehman, I. (1998). Hard core poor and NGO intervention. Mimeo, Bangladesh Institute of Development Studies. 50. Ramezani. (2006). Study of effective factors on success of poultry-farm cooperatives in Province of Isfahan – Iran. 51. Rawal.(1996) .Participation of the rural poor in dairy cooperatives.New Delhi, India: ISEE & ICAR, 142-147. 52. Rehman, H. (2010). House holds’ saving behavior in Pakistan: A case of Multan District, Pakistan. Journal of Social Science (PJSS), 30(1), 17-29. 53. Robinson, M.(2001). Saving mobilization and microfinance enterprise: The Indonesian experience. West Hartford, Connecticut: Kumarian Press. 54. Ruth, V., Tanguy, & Reno, D. (2008). Cooperative behavior in rural Uganda: Evidence from the Uganda national household survey 2005. Markets, Trade and
Institutions Division International Food Policy Research Institute, Washington, DC: USA. 55. Saharkhiz, E. (2009). A study of the ways of attracting the people participation in creating cooperatives-from the viewpoint of administrative managers
related to Cooperative sector. Department of Cooperatives, Hamadan Province. 56. Sanjib. (2007).The people factor in cooperatives: An analysis of members’ attitude and behavior. Canadian Journal of Agriculture, Rutgers University, New
Jersey. 57. Scrimgeour, F., & Sheath, G. (2006).New Zealand agribusiness success: Exploring the role of strategy on firm performance.Proceedings of the New Zealand
Agricultural and Resource Economics Society (Inc.) Conference, Aug., 24-25, Nelson, 25-27, New Zealand. 58. Sebhatu, T.(2011). Determinants of saving behavior of cooperative members.Journal of Research in Economics and International Finance (JREIF), 1(5), 150-
158. 59. Selvaraj, R.(2000). Cooperatives in the new millennium.Vikas Publishing House. 60. Shali, R.(2010). A survey of the activities and performance of poultry agricultural Cooperatives ofTehran Province.College of Agriculture, Isfahan University
of Technology, Iran. 61. Shikhi, M. (2009). A study of the factors influencing the member participation of agricultural cooperatives in decision making relative to the management
of Tehran Province agricultural cooperatives. (MA thesis). Tehran University. 62. Siebert, & Park. (2010). Maintaining a healthy equity structure: A policy change at producers cooperative association. International Food and Agribusiness.
Management Review, 13(3), 87-96. 63. Surendran, G. (2000). Participatory group approach for sustainable development of agriculture in Kerala.Unpublished PhD Thesis, Kerala Agricultural
University, India.

VOLUME NO. 4 (2014), ISSUE NO. 06 (JUNE) ISSN 2231-5756
INTERNATIONAL JOURNAL OF RESEARCH IN COMMERCE, IT & MANAGEMENT A Monthly Double-Blind Peer Reviewed (Refereed/Juried) Open Access International e-Journal - Included in the International Serial Directories
http://ijrcm.org.in/
24
64. Teka, G. (2008). Household savings behavior and determinants of savings in rural SACCOs. Mekelle University. 65. Tesfaye, L. (1995). An analysis of cooperativisation approach to agricultural development in Ethiopia with special attention to producers’ cooperatives. (MSc
thesis). University of Reading, England. 66. Thomas, &Kraenzle, A. (1998) .Member participation in agricultural cooperatives: A regression & scale analysis. Research Report 165, Rural
Development,U.S.A. 67. UNDP.(1993). Human development report. London: Oxford University press. 68. Vahidzadeh, A. (2004). Pathology of management in production cooperatives.Taavon J. Cooperatives. 69. Van, W. & Richard, M. (1994).Organizational citizenship behavior, construction, redefinition, measurement andvalidation.Academy of Management
Journal, 37(4), 765-802. 70. Veerakumaran, G.(2007). Ethiopian cooperative movement: An explorative study. Department of Cooperatives, Faculty of Dry land Agriculture and Natural
Resources, Mekelle University, Ethiopia. 71. Vishwanathan.(1994). Environment for cooperatives.India National Council for Cooperative Training of National Cooperative Union. New Delhi, India. 72. Whitman, D., &Chockalingam, V. (2010). Satisfaction, citizenship behaviors and performance in work units: A meta-analysis of collective construct relations.
Personnel Psychology, 63(1), 41-81. 73. Wolday, A.(2004). The development microfinance industry in Ethiopia: Current status and the prospect for growth. Association of Ethiopian Microfinance
Institutions (AEMFI), Addis Abeba, Ethiopia. 74. Yamane, T. (1967). Statistics, an introductory analysis (2nd ed.). New York, NY: Harper and Row.

VOLUME NO. 4 (2014), ISSUE NO. 06 (JUNE) ISSN 2231-5756
INTERNATIONAL JOURNAL OF RESEARCH IN COMMERCE, IT & MANAGEMENT A Monthly Double-Blind Peer Reviewed (Refereed/Juried) Open Access International e-Journal - Included in the International Serial Directories
http://ijrcm.org.in/
25
AN APPROACH TOWARDS EFFICIENT PREFERNCED DATA RETRIVAL BY PRESORTING
SUNITA DWIVEDI SR. ASST. PROFESSOR
MAKHANLAL CHATURVEDI NATIONAL UNIVERSITY OF JOURANALISM BHOPAL
DR. ANIL RAJPUT
PROFESSOR DEPARTMENT OF MATHEMATICS & COMPUTER SCIENCE
CHANDRA SHEKHAR AZAD GOVERNMENT P.G. NODAL COLLEGE SEHORE
ABSTRACT
Skyline query processing has become an important issue in database research. The popularity of the skyline operator is mainly due to its applicability for decision making applications. In such applications, the database tuples are represented as a set of multidimensional data points and the skyline set contains those points that are the best trade-offs between the different dimensions. Evaluating skylines, existing techniques primarily focus on skyline algorithms to produce skyline after complete scan of dataset where each tuple is compared with every tuple for Skyline selection. This techniques faces serious limitations, namely (1) Decision making lasts after complete dataset scan, and (that is why) (2) Skyline can only be computed after execution of other relational operator. Developed method PRESORT TO GET SKYLINE (PGS) introduced as an extension to existing Block Nested Loop (BNL) method by improve response time in answering skyline. We claim once a tuple is included in skyline candidate list no subsequent tuple can dominate it hence is not required to compare with tuples following it.
KEYWORDS Skyline Query, Multidimensional Data, Relational Operator, Decision Making Applications.
INTRODUCTION
kyline queries are a specific, yet relevant, example of preference queries and have been recognized as a useful and practical way to make database systems more flexible in supporting user requirements. This has motivated the development of many algorithms for the efficient skyline evaluation on large Datasets.
Skyline operator, returns a set of tuples not dominated by any other tuples, has widely been applied in preference queries in relational databases. Skyline has a history before introduced in database, as maximal vector or pareto operator [2,8,9]. Its implementation enables maximal vector applications to be built on relational database systems efficiently [6,7]. Given a set of hotels with the attributes of price (price) and distance to the beach (distance). Hotel A dominates hotel B if A.price ≤ B.price, A.distance ≤ B.distance, and strictly A.price < B.price or A.distance < B.distance. The most interesting hotels are called skyline hotels which are not better by any other hotels in price and distance. It is proposed to build the Skyline operator on top of the other operator as Join and Order By in [3] in relational database. If we start the Skyline evaluation above all operations, then the total cost of the query is the sum of the query cost and Skyline computation. Additionally, this sequential execution causes the Skyline evaluation to be blocked by the other operators. We observe that efficient Skyline evaluation with other relational operator require a continuous execution of both Skyline and the other operator. In this paper, our goal is to develop an algorithm, to behave efficient execution of skyline query in relational settings. We are aiming to develop an extension to basic BNL produced in [3], BNL requires scanning of the whole dataset to output the first Skyline object which blocks the result up to end of execution. Developed method Presort to Get Skyline (PGS) produced skyline results in pipelined fashion so fusion of skyline with other operators can be further performed. Similar to BNL, our proposed method PGS also maintains a window and adopts multi-pass processing but has less bookkeeping overhead than BNL. We developed PGS with the idea, when a point (tuple) is added to the window it is already known that the point is non dominated as per preference. The window’s points are used to eliminate stream points. Any stream point not eliminated is itself added to the window. We arrange the tuples in an order by providing a score based on preferences. The tuples with a lower score have higher possibility to dominate a larger number of tuples. It is impossible for a point off the stream to dominate any of the points in the window. Any point is thus known to be maximal at the time it is placed in the window. So if lower score tuples are inserted to the candidates list first, the number of comparisons can be largely reduced that makes the filtering process much quicker. In addition, when a tuple is added to the candidate list of the window, it is for sure a Skyline point since this tuple cannot be dominated by any tuple that has not yet been presented. Such a scored list approach also enables the progressive output of skylines while BNL has to wait till all tuples are being compared. In regards to the window operation developed method does not replace tuples already in window.
RELATED WORK
In application of decision making user preferences consideration is important. Two areas are emerged for implementing preferences. One is using preference functions [1,4]. Preferences are defined by applying a score to each tuple based on attribute values. Many unrealistic preferences are than generated. Other approach which attracted interest of database research community is based on Skyline Operator. The skyline operator is an elegant summary method over multidimensional datasets. Skyline queries are applied as popular and powerful paradigm for extracting interesting objects from a multidimensional dataset. Given a set r of d-dimensional objects (or points), the skyline of r is the set of nondominated, points in r where domination is defined as a point p dominates point pi if p is at least as good as pi on all the attributes of interest, and strictly better than pi on at least one attribute. SQL syntax for the skyline operator first introduced in [3]; The Skyline operator encapsulates the implementation of the Skyline of clause. Much of the recent Skyline work has focused on designing good algorithms [3,10] that are well-behaved in the context of a relational query engine. Nearest neighbor is closest database problem to skyline evaluation. The implementation uses both indexed and non indexed approaches. Using indexes has its own disadvantages of maintaining indexes. The basic Block Nested Loop (BNL) introduced in [3] is straight forward way to compute the skyline. In BNL each data point P is compared with all the other data points and report P as a Skyline point if P is not dominated. In implementation of BNL a window of candidate (Skyline) is maintain in main memory and each data element in data set is compared with every candidate element one by one. When a data point P is evaluated, P is compared against all the candidate points in the window. There are three cases: Case 1 P is dominated by a candidate point in the window, it is discarded immediately without further comparison with other candidate points. Case 2 P dominates some candidate points in the window, the dominated candidates points are removed from the window and P is inserted into the window as a new candidate point.
S

VOLUME NO. 4 (2014), ISSUE NO. 06 (JUNE) ISSN 2231-5756
INTERNATIONAL JOURNAL OF RESEARCH IN COMMERCE, IT & MANAGEMENT A Monthly Double-Blind Peer Reviewed (Refereed/Juried) Open Access International e-Journal - Included in the International Serial Directories
http://ijrcm.org.in/
26
Case 3 P is neither dominated by nor dominates any candidate point in the window; P is inserted into the window as a new candidate point. After all the data points are processed, the candidate points in the window are reported as the skyline. When the window grows larger than the main memory, BNL adopts a temporary file to store the candidate points. Specifically, when the window is full the new candidate point found in Case is written to the temporary file. After the dataset is scanned, all the candidate points in the window which are processed before the creation of the temporary file are output as part of the skyline. Then, BNL evaluates all data points in the temporary file in the same way again in next pass until no temporary file is created. Finally, all candidate points in the window are output as part of the skyline. Example 1 We use an example to illustrate BNL algorithm. Consider preference point is close (near) point. Consider computing Skyline of the given dataset shown Table 1 by BNL with window size 3 (can keep 3 points at maximum). The dataset is processed in the order of the subscript number of each data point. Initially, P1 is inserted into the window as it is empty. The next data point, P2, is processed. Since P1 is far in both dimensions P2, P1 is removed and P2 is inserted into the window. Similarly, after P3 is processed, only P3 is in the window. Then, P4 is inserted into the window as it is not dominate by any data point in the window (i.e., P3). After that, P5 and P6 are processed in the same way and P6 is inserted into the window. When P7 is processed, it is written to the temporary file as the window is full with data points (P3, P4, and P6). The time stamp of this temporary file is 7. At the end of this iteration, the data points in the window are P3, P8, and P9, and the temporary file contains data points P7 and P10. Then, the data points in the window which is processed before time stamp of the temporary file (i.e., 7) are output as Skyline points. In this case, P3 is output. After that, BNL continues to process the temporary file in the same way till no data point is remained in any temporary file. The Skyline result is (P3, P8, P9, and P10). To speed up the comparisons between the data points in question and the candidate points, the window is organized as self-organizing list. In this list, when a candidate point is found dominating other data points, it is moved to the beginning of the list. Consequently, it is first compared when evaluate the next data point. This variant reduces the number of comparisons as the data points which dominate more others may be compared first. Only Skyline tuples are added to list and same time pipelined to output, all we need is that we can check subsequent tuples for whether they are dominated by this tuple. For this, we only need the tuple’s Skyline attributes. Real data will have many attributes in addition to the attributes we are using as Skyline criteria. Therefore we are not maintaining the actual tuple in the window, only Skyline attributes are projected and kept in window for comparison. The Skyline generation worked only for numerical data so Integer and float values are only taking part in Skyline computation. PRELIMINARY: The property described in [3], for any monotone scoring function M →R if p ∈ M maximizes that scoring function, then p is in the Skyline. In addition, for every point p in the Skyline, there exists a monotone scoring function such that p maximizes that scoring function. In other words, no matter how you weigh your personal preferences towards price and distance of hotels you will find your favorite hotel in the Skyline and Skyline does not contain any hotels which are nobody’s favorite. We use this property for sorting tuples on their scores (with a scoring function). Again we observe that, any nested sort of Relation R over the Skyline attributes a1,a2…,ak (sorting in descending order on each), as in the figure 1.1 is a topological sort with respect to the dominance. Justification of the above is: Let us assume domains of ai are define in reals over 0..1 non inclusive. Let a nested query in figure 1.1 is applied. As R be a finite table there is an ε > 0 such that for i ∈ 1…..k for all r , t ∈ if r (ai) < t (ai) then t(ai) - r(ai) > ε. Consider a scoring function
T(r)=
i-1[ai] If r(a1) > t(a1) than T(r) > T(t)
i.e. T gives total preference to ai over all ai+1…..ak This is equivalent to nested sort.
TABLE 1: SKYLINE OF THE EXAMPLE DATASET USING BNL This observation leads to our concept, As a result of nested sort query a current tuple is dominated by one of the tuples preceded it only. No following tuple to it will dominate current tuple. An external sort is a well known component in relational engine which can be called using an ORDER BY clause in SQL adaptation of sort need not require any addition in optimizer. Figure 1 An order by query SELECT * FROM R ORDER BY a1 desc,…, ak desc; Let F be dominance function in relation R with n tuples. F(t) can range from 0 to n-1 i.e. dominance of tuple t under definition of F ranges from none to all tuples. If t is input in first pass for dominance at least F(t) tuples get eliminated. Again F(t) is non additive i.e. window tuples may dominate same tuples in common. If we maximize cumulative F of tuples in window will improve reduction factor [5]. We already implemented it comparing to sorted data. Again with dominance definition even for non Skyline F may high (any non Skyline point may also dominate some other non skyline). For a non Skyline tuple r there exists at least a t such that F (t) ≻ F(r) and all s dominated by r all also dominated by t under F. Every time a tuple replaced by a new tuple in window, F for new tuple is higher than a maximum F over the tuple it is replacing when window is full cumulative F is fixed for next pass, and strategy is to fill the window with high F.i.e. high order in sorted list must appear first. It is accomplished by sorting of tuples in ascending order of F. If a tuples F is known to sort off course F will be monotone. Calculating F for each tuple is costly but we can estimate probability that a given tuple dominate an arbitrary tuple. Probability of t[ai] ≻ r[ai] is t[ai] under the assumption that domain of tuple is normalized between reals 0..1,and data in dataset is uniformly distributed and each data is independent. Probability t ≻ r considering all dimensions is
This probability is monotone and can be computed from each tuple. The definition of monotone function is that addition can be applied only on Skyline attributes. So the monotone function can defined as
E(t) = has same order as ordering by probability, and as E is an Entropy we use it as Entropy Scoring for our implementation.
Example 2 Take the same dataset shown in Table1 as example. The corresponding normalized coordinates and entropy value of the data points are listed in Figure Suppose the window size is 3 and now after sorting on the entropy values the processing order of data points is p8, p3, p9, p10, p4, p6, p7, p5, p2, and p1. Clearly, the first three points p8, p3, and p9 do not dominate each other. So, all of them are inserted into the window and the window is full now. Then, p10 is
Point X dim Y dim
P1 10 9
P2 6 8
P3 1 7
P4 3 6
P5 7 6
P6 4 5
P7 8 4
P8 2 3
P9 5 2
P10 9 1

VOLUME NO. 4 (2014), ISSUE NO. 06 (JUNE) ISSN 2231-5756
INTERNATIONAL JOURNAL OF RESEARCH IN COMMERCE, IT & MANAGEMENT A Monthly Double-Blind Peer Reviewed (Refereed/Juried) Open Access International e-Journal - Included in the International Serial Directories
http://ijrcm.org.in/
27
processed and it is written to the temporary file as it is not dominated by any data points in the window. After that, all other data points are processed and discarded due to each of them is dominated by one of p8, p3, and p9. Now, the first iteration is done. In the beginning of the next iteration, all the data points in the window are output as the Skyline points as they are processed before the temporary file. Since p10 is the only data point in the temporary file, the process terminates after it.
TABLE 2: CALCULATING ENTROPY ON EXAMPLE DATA PRESORT TO GET SKYLINE (PGS) As studied in previous section BNL produce results only after a complete cycle of scanning. We attempt to improve BNL with early Skyline result generation. We developed here a new algorithm with the objective of early results on domination test, so the Skyline points are continuously produced and may further combined with other database operation. In the proposed PGS execution sorting is applied first on input set; Candidate points are inserted into the list in sorted order next and sorted stream is filtered for the non dominance as in BNL. A window is than created as in BNL to hold the Skyline tuples. The Skyline objects are output to a window. The window is a data structure used to hold the Skyline tuples. We applied a doubly list for implementation of window. The sorted tuples are sweep and checked against tuples in window; objects put into the window are guaranteed to be in the Skyline If current tuple is dominated by any of the window tuple can easily be discarded otherwise it is a Skyline tuple. The current tuple if not discarded can be added as an Skyline and also pipelined to output stream. Each object is compared only with the tuples existing in window not with all the tuples preceded is due to the transitive property [5] of Skyline dominance relation. If the window is full and cannot accommodate the current tuple can be move to another temporary file. Next comparison is takes place with the elements of window and again either discarded or keeps in window or temporary file. At the end if all the tuples are compared and no temporary file exists we have completed with our results else the algorithm repeats with opening the temporary file as input stream. Multiple passes are only required if window is not large enough to hold all the Skyline tuples.
THE ALGORITHM Input: (a) Data set D with n tuples.(List of data) (b)An external sort method (Quick sort is used) Output: (a) set of Skylinepoints 1. I presot = sort(I); //Presorting dataset 2. Set O = Φ; W = Φ; Temp = Φ//Initialization 3. while ¬EOF(I presot )//Loop 4. p = next(I presot ) 5. isSkyline = true 6. for each q ∈ W 7. if q ≻ p //Dominance test in window 8. free(p); 9. isSkyline= false; 10. Break; 11. elseif p ≻ q //dominated p. 12. Release(W,q); 13. If isskyline 14. If hasfreespace(W) 15. Add(W,p);// include p in window. 16. Else 17. Append(T,p) // write p to temporary file for second pass. 18. Free(p)//remove p from dataset. 19. Append(O,p) 20. EOF(Ipresot) 21. Ipresot ← Temp ; Temp ← Φ ; 22. W ← Φ; 23. Return (O); Experiment and RESULTS: With experiment we provide the features of our developed method and compare with basic BNL on early skyline result generation criteria.PGS produces early results as soon as catches as skyline candidate. Skyline algorithm execution. Our experiment is based on following features. Our experiments are carried out on an Intel Pentium IV 2.2 GHz duo CPU machine with 2GB main memory and a 80 GB hard disk, running Microsoft
Windows XP. We implemented the algorithm on a random dataset on student marks using C++ with 3, 5,7 dimension of Skyline query with 419 Skyline points in d, 876
Skyline points in 5d and 9816 Skyline in 7d comparisons. We consider sort phase and Skyline phase as two different operations. The time required to sort the data is included in the execution time shown. We execute the methods on 50,000 tuple dataset. A tuple is of 100 bytes with 10 integer values (40 byte) and a 60 byte string value. Both behave similar in and 5 dimensions while in 7 dimension the execution time differ, PGS perform better to BNL. We observe when BNL is given more main-memory allocation and thus, its window is larger—its performance deteriorates.
ID Coordinate Normalized Coordinate Entropy Value
P1 10,9 1.0.0.9 1.4
P2 6,8 0.6,0.8 1.06
P3 1,7 0.1,0.7 0.6
P4 ,6 0.,0.6 0.7
P5 7,6 0.7,0.6 1.00
P6 4,5 0.4,0.5 0.74
P7 8,4 0.8,0.4 0.92
P8 2, 0.2,0. 0.44
P9 5,2 0.5,0.2 0.59
P10 9,1 0.9,0.1 0.74

VOLUME NO. 4 (2014), ISSUE NO. 06 (JUNE) ISSN 2231-5756
INTERNATIONAL JOURNAL OF RESEARCH IN COMMERCE, IT & MANAGEMENT A Monthly Double-Blind Peer Reviewed (Refereed/Juried) Open Access International e-Journal - Included in the International Serial Directories
http://ijrcm.org.in/
28
FIGURE 2: EXECUTION TIME VS. WINDOW SIZE IN BNL AND PGS
FIGURE 3: COMPARISON BNL AND PGS
FIGURE 4: BNL-PGS EFFECT OF MEMORY ALLOCATION
CONCLUSION
Skyline operator offers a good start to provide preference query results in relational database. There may be ways to reduce dominance check. We implemented as improvements on BNL. BNL differ with our developed method as BNL is comparing each tuple with other tuple using replacement policy while developed method operate on sorted data set. In PGS management of window is largely simplifies and points in the skyline can be progressively returned without having to wait for all the input to be read We believe with performance test that our algorithm is a good start to incorporate Skyline computation within other relational operators.
0
0.2
0.4
0.6
0.8
1
1.2
1.4
#3page # 5 Page # 10 Page
Exe
cuti
on
tim
e in
Se
c 3d Skyline BNL-PGS
BNL
PGS
4.56 5.8
7.1
10.7
14.2
4.72 4.69 4.51 4.46 4.4
0
5
10
15
10 Page 20 Page 50 page 100 page 200 page
Exe
cuti
on
Tim
e in
Se
con
d
Window (No. Of Pages Allocated)
5d Skyline BNL - PGS BNL PGS
7.68 10.3
14.1 16.2
21.1
6.21 5.98 5.76 5.54 5.51
0
5
10
15
20
25
10 Page Window 20 page 50 Page 100 Page 200 Page Exe
cuti
on
Tim
e in
Se
con
d
Window(No. of pages Allocated)
7d Skyline BNL-PGS
BNL PGS

VOLUME NO. 4 (2014), ISSUE NO. 06 (JUNE) ISSN 2231-5756
INTERNATIONAL JOURNAL OF RESEARCH IN COMMERCE, IT & MANAGEMENT A Monthly Double-Blind Peer Reviewed (Refereed/Juried) Open Access International e-Journal - Included in the International Serial Directories
http://ijrcm.org.in/
29
REFERENCES 1. Agrawal R. and Wimmers E. L.. “A framework for expressing and combining preferences.”, SIGMOD, pages 297–06, 2000. 2. Bentley J. L., Clarkson K.1., and Levine D. B., "Fast linear expected-time alogrithms for computing maxima and convex hulls.", Proceedings of the First
Annual ACM-SIAM Symposium on Discrete Algorithms (SODA), pp. 179-187, 1990. 3. Borzsonyi S.,Kossmann D. and Stocker K., “The skyline operator." Proceedings of the 17th International Conference on Data Engineering (ICDE), pages 421-
40, 2001. 4. Hristidis V Koudas N., and . Papakonstantinou Y. PREFER, “A system for the efficient execution of multi-parametric ranked queries.” SIGMOD, pages 259–
270, 2001. 5. Khalefa M., Mokbel M. and Levandoski J., “Skyline Query Processing for Incomplete Data.”, Proceedings of International Conference on Data Engineering
(ICDE), pp. 556- 565 ,2008. 6. Kiessling W. “Foundations of preferences in database systems.”, Proceedings of the 28th International Conference on Very Large Data Bases (VLDB). Hong
Kong, China. MorganKaufmann, San Francisco, CA, pp.11–22,2002\5 7. Kiessling W. and Koestler G., “Preference SQL: Design, implementation, experiences.”, In VLDB, Aug. 2002. 8. Kung H. T., Luccio F., and Preparata F. P., "On finding the maxima of a set of vectors." Journal of the ACM (JACM), 22(4):pp. 469-476, 1975. 9. Preparata F. P. and M. I. Shamos. “Computational Geometry: An Introduction.” Springer-Verlag, New York, Berlin, etc., 1985. 10. Tan K. L., Eng P. K., and Ooi B. C., “Efficient progressive skyline computation.”, Proceedings of 27th International Conference on Very Large Data Bases
(VLDB), pp.01-10, 2001.

VOLUME NO. 4 (2014), ISSUE NO. 06 (JUNE) ISSN 2231-5756
INTERNATIONAL JOURNAL OF RESEARCH IN COMMERCE, IT & MANAGEMENT A Monthly Double-Blind Peer Reviewed (Refereed/Juried) Open Access International e-Journal - Included in the International Serial Directories
http://ijrcm.org.in/
30
PERCEIVED USEFULNESS, USER ACCEPTANCE OF E-BANKING AND SUCCESSFUL TRANSITION TO CASHLESS POLICY IN NIGERIA
CLEMENT IKENNA OKEKE ASSOCIATE PROFESSOR
SCHOOL OF MANAGEMENT SCIENCES NATIONAL OPEN UNIVERSITY OF NIGERIA
LAGOS
ABSTRACT The study examined the nature of e-banking transactions against the backdrop of modalities CBN has put in place to operationalize its cashless policy in Nigeria. From the survey of 234 e-banking users in Nigeria, using the framework of Technology Acceptance Model (TAM),we sought to determine the Perceived Usefulness(PU) of e-banking as a basis for articulating strategies and measures for getting them to accept and use it as the dominant payment option in financial transactions .Based on tested hypotheses and answered research questions, we came to the conclusion that electronic based transaction has great many advantages over Cash based transaction and that its benefits are clear and demonstrable and consequently can be sold to Nigerians without application of force. From the perspective of selling a very good and needed product to expectedly able and willing market we made a number of recommendations hinging on communicating the benefits of electronic based transaction effectively and offering some incentives to facilitate speedy adoption and sustained use of the platform.
KEYWORDS Cashless Policy, Electronic-Based Transactions, Perceived Ease of Use, Perceived Usefulness, and Technology Acceptance Model (TAM).
1.0 INTRODUCTION he cashless policy of Central Bank of Nigeria (CBN) is expected to drive development and modernize our payment system as all individuals and corporates will be encouraged to adopt electronic payment and banking options. It aims to reduce the amount of physical cash circulating in the economy and encourage more electronic-based transactions in payment for goods, services, transfers, etc.
The following modalities have been introduced in a bid to operationalize the policy: The cash-in-transit lodgments and cash evacuation services will no longer be available to customers or merchants. 3rd party cheques above N150, 000 shall not be eligible for encashment over the counter. Value for such cheques shall only be received through lodgments into customers account. For individual account holders, charges will apply when daily withdrawals and deposits are in excess of N500, 000. For corporate account holders, charges will apply when daily withdrawals and deposits are in excess of N3000, 000. The applicable charges are for individuals: 2% on excess for deposit and 3% on excess for withdrawal. For corporates, it is: 3% on excess for deposit and 5% on excess for withdrawal. Exemptions have however been granted on lodgments and withdrawals for accounts operated by Embassies, Diplomatic Missions, Multilateral Agencies, Aid Donor Agencies, Ministries, Departments And Agencies Of Government ( Revenue Collections Only), Microfinance Banks (MFBs) And Primary Mortgage Institutions (PMIs).
2.0 REVIEW OF LITERATURE 2.1 CONCEPTUAL FRAMEWORK To accelerate the adoption and use of e-banking platforms in achieving the objectives of cashless policy of CBN, many studies have been recently conducted. One of such a study is the Market Research survey conducted by NIBBS in collaboration with CBN. The survey investigated the progress of POS terminal adoption by merchants, and the drivers of acceptance and inhibitions towards the adoption of point of sale terminals in the Lagos metropolis. The study established that there is a significant underutilization of installed capacity of available POS terminals in Lagos. There are only an average of 89,000 transactions per month from the available 108,288 POS terminals in Lagos. For consumers/end-users, the survey established that despite the high ownership of cards (82.4%), cash was still the most used means of payment across the density areas (88.5%-high density, 93.9%- middle density and 87.7%- low density). The reasons highlighted by the consumers for their continued use of cash include, connection and network difficulties of the PoS terminals, delay in transaction time, fear of fraud amongst others. Another study on the acceptance and rate of attitude change among consumers in Lagos was conducted by E-PPAN (a non-profit organization representing the Nigerian e- payment industry and its body of stakeholders, with a holistic, result-oriented approach to driving the growth of e-payment). E-PPAN carried out the survey in Surulere LGA of Lagos state to establish current status of e-payment service delivery to the end user in Lagos and identify any barriers in application and acceptance of the cashless Nigerian policy and the pilot in Lagos state. The survey established that: 1. 66% of respondents were aware of cashless policy in Lagos 2. 55% were aware of the withdrawal limits allowed under the policy 3. Awareness of the cashless policy was highest among 26-35 years 4. The observed new changes in payment mode among the respondents were:
Adoption of alternative channels other than cash (35%)
Shift of cash withdrawals from across the counter to ATM machine (25%)
Increase in online transfer (20%)
Reduced withdrawal of cash across the counter (15%)
Increase in the use of cheque (5%).
The preferred mode of payment remained cash (85%) 5. The identified challenges with e-payment channels are:
Network/communication failure (60)
Hidden charges (13)
Long queues at ATM points (12)
Fraud (10)
Insufficiency of channels (9). 6. Impact of cashless policy:
I do not trust this policy
It may fail like other government initiatives for lack of proper implementation
T

VOLUME NO. 4 (2014), ISSUE NO. 06 (JUNE) ISSN 2231-5756
INTERNATIONAL JOURNAL OF RESEARCH IN COMMERCE, IT & MANAGEMENT A Monthly Double-Blind Peer Reviewed (Refereed/Juried) Open Access International e-Journal - Included in the International Serial Directories
http://ijrcm.org.in/
31
With this policy, people are no longer spending so much because they do not withdraw plenty cash any more
It has caused reduction in sales
There is insufficient and low presence of e-payment channels at various service points such as the hospitals, motor parks and other centres. Another report on cashless policy in Lagos was presented by CBN EFINA. It had the objectives of: 1. Establishing the effect t of the cashless policy; 2. Reducing cash based transactions 3. Increasing electronic transactions; 4. Measuring the impact if any of the cashless policy on promoting financial 5. Identifying the incentives that will encourage merchants, mobile money agents and customers to move from predominantly cash based transactions to
electronic transactions; 6. Determining the challenges that currently deter customers from using e-channels; 7. Providing evidence based guidance to CBN on best approach to rolling out the cashless policy nation-wide and increasing its impact on financial inclusion. The major findings of this research are that:
Banks see e-payment as a CBN mandate, that also aligns with their long term interests and as an opportunity and a necessity to stay in a competitive market.
Banks in Lagos report some increase in e-transactions;
Nationwide data shows a 167% increase comparing January and august 2012 with fluctuating activity volume and value of electronic payment channels.
Consumers have begun shifting to self-service banking channels, especially cards and ATMs, increased use of branch-based electronic transfers-especially the NIBBS instant payments (nips) system. But consumers complain that PoS machines are not always
Increased use of ATMs, though largely still cash withdrawals, signal growing working comfort with the use of cards.
For merchants, banks reported that corporate customers with cash-based value chains have changed their banking behavior- mandated distributors to pay for goods and services using only electronic transfers , enforced no cash deposit restriction on their bank accounts and included transaction fees in cost of goods and services if paid in cash to off-set cash processing fees for excess cash deposits
The most elaborate study on Lagos cashless policy was conducted in November, 2012 by Lagos Chamber Of Commerce and Industry (lCCI). The survey had the following objectives: 1. Estimate the awareness level of the cashless initiative policy; 2. Measure the usage pattern; 3. Determine the likes and dislikes of the policy; 4. Measure the reliability of the Cashless platforms; 5. Assess the Impact of cashless policy on business transactions; 6. Assess the impact of cashless policy on economic growth; 7. Identify the challenges faced with cashless facility; 8. Measure the reactions to service charge; 9. Measure the perception about the cashless policy; 10. Assess the implementation of cashless policy in the informal sector; 11. Determine the legal and regulatory framework for e-banking channels; and 12. Make suggestions for improvement. The major findings of the survey are:
Campaign for cashless policy is overwhelming as 80% of the respondents across sectors of the economy claimed awareness for the policy;
Over three-quarter (76%) of the respondents espoused that they use cashless facility (ATM, online, credit/master card, POS and mobile money) for their business transactions;
The major advantages of using cashless platforms are in a descending order- free from carrying large sum of money, make transactions faster, convenient to use, reduce frauds/theft, have access to money out of bank branch and make impulse purchase possible.
The major reasons for not using cashless facility centred on safety and quality of service. The specific reasons mentioned include: safer to use cash (32%), high service charge (17%), customers rejection (16%), not reliable (10%),doesn’t handle large sum of money (9%), prone to error (6%), increase spending (4%), not available everywhere (3%) and take time to get an ATM card (3%).
Majority of respondents across board pointed out that cashless facility has impacted on their business transactions by reducing cash-related crimes, increased convenience of doing business, reduced cash handling cost, more payment options, and easy access to cash out of bank branch and reduced revenue leakage.
Cashless policy has impacted on the economy in the following ways in a descending order: reduced risk of carrying large sum of money, reduced money related crimes/frauds, generated more revenue for government, facilitated business transactions, increased tax collections, created business opportunities, emergence of more mobile money companies, opened door for foreign investors, local manufacturing of POS devices, reduced inflation rate and created employment.
For banks /e-companies cashless policy has had the following positive impacts-speed/convenience, increased profitability, increased turnover, increased patronage and reduced congestion in the banking hall.
Over 70% of respondents across board applaud the idea of cashless policy.
59% of the respondents claimed that e-payment platforms especially POS machines as a means of cashless transaction is not reliable because of their usage experience.
60% of company’s representatives considered service charge high, individuals (54%) and trade (56%).
74% of the respondents support launching the cashless policy in other states as proposed by CBN subject to stability of power supply, improved it infrastructure, effective campaign to create awareness, prompt remittance, guaranteeing security for customers data among others.
For cashless policy to succeed in the informal sector the following should be done-extensive campaign to create awareness, enlightenment/education on the benefits, availability of POS devices everywhere, opening zero naira bank account, prompt issuance of cards, reduced service charge, training of local traders, constant power supply and guaranteed security.
For regulatory /legal support to drive cashless policy, the following were identified-a law on e-payment dispute resolution, electronic data support policy, reduced withdrawal limit to N150, 000 and N2m, enforced across the counter limit, interbank e-fraud forum/resolution platform, single transaction settlement, severe punitive law against cybercrime/fraud, commission to monitor the operations of cashless policy, clear legal/regulatory framework and centralized regulatory policy.
2.2 THEORETICAL FRAMEWORK Diffusion of innovations is a theory that seeks to explain how, why, and at what rate new ideas and technology spread through cultures. It is the process by which an innovation is communicated through certain channels over time among the members of a social system. Rogers (1962) espoused the theory that there are four main elements that influence the spread of a new idea: the innovation, communication channels, time, and a social system. Within the rate of adoption, there is a point at which an innovation reaches a critical mass. Building a critical mass is important in achieving mass adoption and sustainability of any

VOLUME NO. 4 (2014), ISSUE NO. 06 (JUNE) ISSN 2231-5756
INTERNATIONAL JOURNAL OF RESEARCH IN COMMERCE, IT & MANAGEMENT A Monthly Double-Blind Peer Reviewed (Refereed/Juried) Open Access International e-Journal - Included in the International Serial Directories
http://ijrcm.org.in/
32
technology or innovation. This is a major challenge facing CBN, banks and sundry organizations that produce service and apply e-banking tools and facilities. To do this effectively, they should appreciate and appropriately focus on the desired categories of adopters: innovators, early adopters, early majority, late majority, and laggards (Rogers 1962). It is also important that the main elements influencing the spread of a new idea: the innovation, communication channels, time, and a social system are identified and targeted. According to Rogers (1962) Individuals pass through 5 stages of accepting a new innovation: these are knowledge, persuasion, decision, implementation, and confirmation. If the innovation is adopted, it spreads via various communication channels. During communication, the idea is rarely evaluated from a scientific standpoint; rather, subjective perceptions of the innovation influence diffusion. Illustrating how an innovation reaches critical mass, Rogers (1962) outlines several strategies in order to help an innovation reach this stage. Strategies to propel diffusion include: when an innovation is adopted by a highly respected individual within a social network, creating an instinctive desire for a specific innovation. Another strategy is injecting an innovation into a group of individuals who would readily use said technology, and provide positive reactions and benefits for early adopters of an innovation. Rogers (1962) defines several intrinsic characteristics of innovations that influence an individual’s decision to adopt or reject an innovation. These include relative advantage, compatibility, complexity or simplicity, trialability and observability. For a new technology, Peres, Muller and Mahajan (2010) suggest that Innovation diffusion is "the process of the market penetration of new products and services that is driven by social influences, which include all interdependencies among consumers that affect various market players with or without their explicit knowledge". Eveland (1986) evaluates diffusion of innovations from a strictly phenomenological view, which is very different than the other perspectives. He asserts that, “Technology is information, and exists only to the degree that people can put it into practice and use it to achieve values”. Diffusion of existing technologies has been measured in S curves. These technologies include radio, television, VCR, cable, flush toilet, clothes washer, refrigerator, home ownership, air conditioning, dishwasher, electrified households, telephone, cordless phone, cellular phone, per capita airline miles, personal computer and the Internet. There are both positive and negative outcomes when an individual or organization chooses to adopt a particular innovation. Rogers (2005) states that this is an area that needs further research because of the biased positive attitude that is associated with the adoption of an innovation. In the Diffusion of Innovation, Rogers lists three categories for consequences: desirable vs. undesirable, direct vs. indirect, and anticipated vs. unanticipated. Wejnert (2002) details two categories for consequences: public vs. private and benefits vs. costs. Public consequences refer to the impact of an innovation on those other than the actor, while private consequences refer to the impact on the actor itself. Public consequences usually involve collective actors, such as countries, states, organizations, or social movements. The results are usually concerned with issues of societal well-being. Private consequences usually involve individuals or small collective entities, such as a community. The innovations are usually concerned with the improvement of quality of life or the reform of organizational or social structures. The benefits of an innovation obviously refer to the positive consequences, while the costs refer to the negative. Costs may be monetary or nonmonetary, direct or indirect. Direct costs are usually related to financial uncertainty and the economic state of the actor. Indirect costs are more difficult to identify. Marketers are particularly interested in the diffusion process as it determines the success or failure of a new product. It is quite important for a marketer to understand the diffusion process so as to ensure proper management of the spread of a new product or service. The model of technology diffusion has spawned a range of adaptations that extend the concept or apply it to specific domains of interest. Moore (2013) proposes a variation of the original lifecycle. He suggests that for discontinuous or disruptive innovations, there is a gap or chasm between the first two adopter groups (innovators/early adopters), and the early majority. In Educational technology , McKeown (2013) has provided a similar model (a pencil metaphor) describing the ICT uptake in education. Wenger, White and Smith (2010), in their book Digital habitats: Stewarding technology for communities, talk of technology stewards: people with sufficient understanding of the technology available and the technological needs of a community to steward the community through the technology adoption process. For the understanding of the basis for acceptance and use of e-banking platforms, the most advanced and widely used model is Technology Acceptance Model (TAM).To specially address the challenge of acceptance and use of technology Davis (1989) and Davis et al. (1989) propose TAM to address why users accept or reject information technology. A key purpose of TAM is to provide a basis for tracing the impact of external variables on internal beliefs, attitudes, and intentions. It suggests that perceived ease of use (PEOU), and perceived usefulness (PU) are the two most important factors in explaining system use. Davis (1989) defines PU as the degree to which a person believes that using a particular system would enhance his job performance and PEOU as the degree to which a person believes that using a particular system would be free from effort. PU is majorly measured by five independent factors, namely image, output quality, result demonstrability, voluntariness and job relevance. These factors according to Davis et al (1989) are explained below: Image: The degree to which use of an innovation is perceived to enhance one's status in one's social system. Job relevance: Individual's perception regarding the degree to which the target system is relevant to his or her job. Output quality: The degree to which an individual believes that the system performs his or her job tasks well. Result demonstrability: Tangibility of the results of using the innovation. Voluntariness: The extent to which potential adopters perceive the adoption decision to be non-mandatory. Davis (1989) in his study of PU, proposed a six items measurement tool. The six items include the four items most commonly used: (1) using (application) increases my productivity; (2) using (application) increases my job performance; (3) using (application) enhances my effectiveness on the job; and (4) overall, I find the (application) useful in my job. All measures of PU are found to lead to an acceptable level of internal consistency (greater or equal to 0.83). The Technology Acceptance Model (TAM) has emerged as a powerful and parsimonious model that belongs to the information systems (IS) field.
FIGURE 1: THE TECHNOLOGICAL ACCEPTANCE MODEL

VOLUME NO. 4 (2014), ISSUE NO. 06 (JUNE) ISSN 2231-5756
INTERNATIONAL JOURNAL OF RESEARCH IN COMMERCE, IT & MANAGEMENT A Monthly Double-Blind Peer Reviewed (Refereed/Juried) Open Access International e-Journal - Included in the International Serial Directories
http://ijrcm.org.in/
33
Depicted in Figure 1, TAM hypothesizes that a person’s acceptance of a technology is determined by his/her voluntarily intentions to use that technology. The intention, in turn, is determined by the person’s attitude toward the use of that technology and his/ her perception concerning its usefulness. Attitudes are formed from the beliefs a person holds about the use of the technology. The first dimensions of the attitude are PU and PEOU. The limitations of TAM have been well documented by Legris, Ingham and Collerette (2003). Most of the studies involved students. It would have been better if the studies were conducted in a business environment. Secondly the types of applications studied have also been questioned. While most of the studies examined the introduction of office automation software or systems development they felt that the studies would have benefited from examining the introduction of business process applications. They also reported that since most of the studies did not measure system use, TAM actually measured the variance in self-reported use. They concluded that self-reported use should at best serve as a relative indicator. Legris, ingham and collerette (2003) concluded that TAM has proven to be a useful theoretical model in helping to understand and explain use behavior in information system implementation. It has been tested in many empirical researches and the tools used with the model have proven to be of quality and to yield statistically reliable results Specifically, TAM has fully mediated the effects of system characteristics on use behavior. It predicts intention to use well. PU predicts intentions to use whereas PEOU is secondary and acts through PU. PU and not ease of use is a determinant of predicted future use. PU is a more important factor than ease of use in determining system use.
3.0 NEED/IMPORTANCE OF THE STUDY The reviewed literature has given an indication as to the impact that e –banking will have on consumers, businesses, banks and e-payment companies, government and the economy if it is entrenched as the dominant payment system. A viable e-payment platform will make for financial inclusion, mainstreaming of Nigerian economy into the global financial system, greater economic activity and prosperity for all participants, increased tax revenue to government, increased sales revenue to businesses, reduced government and businesses revenue leakages, reduced money laundering and transparent financial transfers leading to reduction in corruption in the society, more employment creation, lower inflation rates, greater lending to productive businesses, safer society on account of need to carry cash, seamless financial transactions among many other benefits. Specifically, the study will articulate measures and strategies for enhancing the perceived usefulness of e-banking among Nigerians and make them better predisposed to accepting and using e-payment options and ultimately achieving a high success rate of the CBN cashless policy in Nigeria.
4.0 STATEMENT OF THE PROBLEM The efforts of CBN to achieve rapid transition from cash-based to electronic-based transactions in Nigeria are informed by the great benefits that will accrue to the economy because of the established relationship between an effective payment system and level of economic activity and national development. As noted by Financial Derivatives Company Limited (2012) a well-functioning payment system is important to boost the efficiency of the financial system, improve consumer confidence and facilitate economic interactions and trade in both goods and services. Thus the impact of developments in electronic payment systems leads to a virtuous economic cycle originating from consumers, thanks to higher availability of credit and increased efficiency in transactions, and from merchants that find themselves with a larger pool of consumers and better guaranteed payments. This increase in efficiencies is found to positively impact on GDP and trade. The cashless policy commenced in Lagos on April 1, 2012 and July 1, 2013 in the Federal Capital Territory (Abuja), Abia, Anambra, Kano, Ogun and Rivers States and will be extended to all states of the federation subsequently. The rationale for the phased implementation of the policy is to learn from initial efforts and modify the modalities as appropriate before being rolled out nationally. This is a best practice and well intentioned approach because of the magnitude of the intervention and the need to ensure its reasonable successful implementation. It is in furtherance of the logic of ensuring that this important national intervention is successful that this study is being carried out. It aims to identify alternative and complementary strategies and measures that will support the implementation of CBN cashless policy based on theoretical understanding of the workings of Technology Acceptance Model (TAM) and Rogers’s Diffusion Theory.
5.0 OBJECTIVES The general objective of the study is to measure the perceived usefulness of e-banking using the five factors of image, voluntariness, result demonstrability, job relevance and output quality as a basis for explaining the rate of acceptance and use of e-banking services in Nigeria. The specific objectives of the study include:
Identify the important factors by which e-banking users appraise financial transactions;
Articulate the promotion implications of the factors that influence users of e-banking services;
Determine the characteristics of e-banking and its Nigerian users that are amenable to encouraging more Nigerians to accept and use e-banking platforms more and cash based transactions less; and
Proffer measures and strategies by which CBN will persuade more Nigerians other than through compulsion, to accept and use e-banking platforms as the preferred payment options
To achieve the general and specific objectives of the study, the following questions were posed for the study:
Is e-banking enhancing the status of users in the society (image measure)?
Is the use of e-banking essentially mandatory in Nigeria (voluntariness)?
Are the results/benefits of e-banking clearly demonstrable in Nigeria (result demonstrability)?
Are e-banking services relevant to the job performance and/or productivity of users in Nigeria (job relevance)?
Are e-banking services helping users in Nigeria to perform their financial transactions well (output quality)?
5.1 HYPOTHESES OF THE STUDY To properly define the data needs of the study, the following hypotheses were formulated and will be tested for acceptance and/or rejection:
Ho1: use of e-banking does not reduce the incidences of fraud in financial transactions
Ho2: e-banking does not give users greater control over their financial transactions.
Ho3: e-banking does not enable users to accomplish financial transactions more quickly
Ho4: e-banking does not reduce the cost/bank charges of financial transactions
Ho5: use of e-banking does not increase the convenience of financial transactions
Ho6: use of e-banking does not reduce the need of users to carry cash
Ho7: e-banking does not allow the minimization of mistakes/errors in financial transactions
Ho8: use of e-banking does not make financial transactions more reliable
Ho9: use of e-banking does not make financials more dependable
Ho10: e-banking users do not find it useful in their financial transactions and overall productivity.
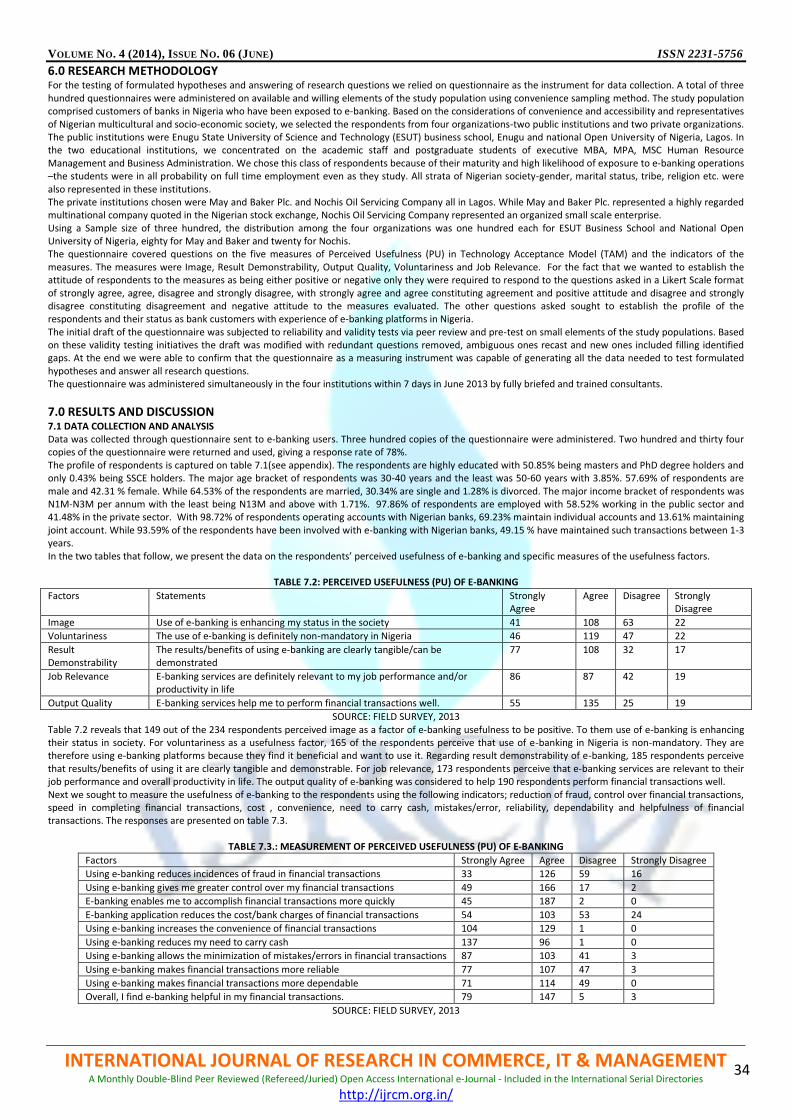
VOLUME NO. 4 (2014), ISSUE NO. 06 (JUNE) ISSN 2231-5756
INTERNATIONAL JOURNAL OF RESEARCH IN COMMERCE, IT & MANAGEMENT A Monthly Double-Blind Peer Reviewed (Refereed/Juried) Open Access International e-Journal - Included in the International Serial Directories
http://ijrcm.org.in/
34
6.0 RESEARCH METHODOLOGY For the testing of formulated hypotheses and answering of research questions we relied on questionnaire as the instrument for data collection. A total of three hundred questionnaires were administered on available and willing elements of the study population using convenience sampling method. The study population comprised customers of banks in Nigeria who have been exposed to e-banking. Based on the considerations of convenience and accessibility and representatives of Nigerian multicultural and socio-economic society, we selected the respondents from four organizations-two public institutions and two private organizations. The public institutions were Enugu State University of Science and Technology (ESUT) business school, Enugu and national Open University of Nigeria, Lagos. In the two educational institutions, we concentrated on the academic staff and postgraduate students of executive MBA, MPA, MSC Human Resource Management and Business Administration. We chose this class of respondents because of their maturity and high likelihood of exposure to e-banking operations –the students were in all probability on full time employment even as they study. All strata of Nigerian society-gender, marital status, tribe, religion etc. were also represented in these institutions. The private institutions chosen were May and Baker Plc. and Nochis Oil Servicing Company all in Lagos. While May and Baker Plc. represented a highly regarded multinational company quoted in the Nigerian stock exchange, Nochis Oil Servicing Company represented an organized small scale enterprise. Using a Sample size of three hundred, the distribution among the four organizations was one hundred each for ESUT Business School and National Open University of Nigeria, eighty for May and Baker and twenty for Nochis. The questionnaire covered questions on the five measures of Perceived Usefulness (PU) in Technology Acceptance Model (TAM) and the indicators of the measures. The measures were Image, Result Demonstrability, Output Quality, Voluntariness and Job Relevance. For the fact that we wanted to establish the attitude of respondents to the measures as being either positive or negative only they were required to respond to the questions asked in a Likert Scale format of strongly agree, agree, disagree and strongly disagree, with strongly agree and agree constituting agreement and positive attitude and disagree and strongly disagree constituting disagreement and negative attitude to the measures evaluated. The other questions asked sought to establish the profile of the respondents and their status as bank customers with experience of e-banking platforms in Nigeria. The initial draft of the questionnaire was subjected to reliability and validity tests via peer review and pre-test on small elements of the study populations. Based on these validity testing initiatives the draft was modified with redundant questions removed, ambiguous ones recast and new ones included filling identified gaps. At the end we were able to confirm that the questionnaire as a measuring instrument was capable of generating all the data needed to test formulated hypotheses and answer all research questions. The questionnaire was administered simultaneously in the four institutions within 7 days in June 2013 by fully briefed and trained consultants.
7.0 RESULTS AND DISCUSSION 7.1 DATA COLLECTION AND ANALYSIS Data was collected through questionnaire sent to e-banking users. Three hundred copies of the questionnaire were administered. Two hundred and thirty four copies of the questionnaire were returned and used, giving a response rate of 78%. The profile of respondents is captured on table 7.1(see appendix). The respondents are highly educated with 50.85% being masters and PhD degree holders and only 0.43% being SSCE holders. The major age bracket of respondents was 30-40 years and the least was 50-60 years with 3.85%. 57.69% of respondents are male and 42.31 % female. While 64.53% of the respondents are married, 30.34% are single and 1.28% is divorced. The major income bracket of respondents was N1M-N3M per annum with the least being N13M and above with 1.71%. 97.86% of respondents are employed with 58.52% working in the public sector and 41.48% in the private sector. With 98.72% of respondents operating accounts with Nigerian banks, 69.23% maintain individual accounts and 13.61% maintaining joint account. While 93.59% of the respondents have been involved with e-banking with Nigerian banks, 49.15 % have maintained such transactions between 1-3 years. In the two tables that follow, we present the data on the respondents’ perceived usefulness of e-banking and specific measures of the usefulness factors.
TABLE 7.2: PERCEIVED USEFULNESS (PU) OF E-BANKING
Factors Statements Strongly Agree
Agree Disagree Strongly Disagree
Image Use of e-banking is enhancing my status in the society 41 108 63 22
Voluntariness The use of e-banking is definitely non-mandatory in Nigeria 46 119 47 22
Result Demonstrability
The results/benefits of using e-banking are clearly tangible/can be demonstrated
77 108 32 17
Job Relevance E-banking services are definitely relevant to my job performance and/or productivity in life
86 87 42 19
Output Quality E-banking services help me to perform financial transactions well. 55 135 25 19
SOURCE: FIELD SURVEY, 2013 Table 7.2 reveals that 149 out of the 234 respondents perceived image as a factor of e-banking usefulness to be positive. To them use of e-banking is enhancing their status in society. For voluntariness as a usefulness factor, 165 of the respondents perceive that use of e-banking in Nigeria is non-mandatory. They are therefore using e-banking platforms because they find it beneficial and want to use it. Regarding result demonstrability of e-banking, 185 respondents perceive that results/benefits of using it are clearly tangible and demonstrable. For job relevance, 173 respondents perceive that e-banking services are relevant to their job performance and overall productivity in life. The output quality of e-banking was considered to help 190 respondents perform financial transactions well. Next we sought to measure the usefulness of e-banking to the respondents using the following indicators; reduction of fraud, control over financial transactions, speed in completing financial transactions, cost , convenience, need to carry cash, mistakes/error, reliability, dependability and helpfulness of financial transactions. The responses are presented on table 7.3.
TABLE 7.3.: MEASUREMENT OF PERCEIVED USEFULNESS (PU) OF E-BANKING
Factors Strongly Agree Agree Disagree Strongly Disagree
Using e-banking reduces incidences of fraud in financial transactions 33 126 59 16
Using e-banking gives me greater control over my financial transactions 49 166 17 2
E-banking enables me to accomplish financial transactions more quickly 45 187 2 0
E-banking application reduces the cost/bank charges of financial transactions 54 103 53 24
Using e-banking increases the convenience of financial transactions 104 129 1 0
Using e-banking reduces my need to carry cash 137 96 1 0
Using e-banking allows the minimization of mistakes/errors in financial transactions 87 103 41 3
Using e-banking makes financial transactions more reliable 77 107 47 3
Using e-banking makes financial transactions more dependable 71 114 49 0
Overall, I find e-banking helpful in my financial transactions. 79 147 5 3
SOURCE: FIELD SURVEY, 2013

VOLUME NO. 4 (2014), ISSUE NO. 06 (JUNE) ISSN 2231-5756
INTERNATIONAL JOURNAL OF RESEARCH IN COMMERCE, IT & MANAGEMENT A Monthly Double-Blind Peer Reviewed (Refereed/Juried) Open Access International e-Journal - Included in the International Serial Directories
http://ijrcm.org.in/
35
We note from table 7.3 that 159 respondents agreed that e-banking reduced the incidence of fraud in financial transactions for them. For greater control over financial transactions, 215 respondents agreed that e-banking gives it to them. On accomplishing financial transactions more quickly, 232 respondents agreed that e-banking does it for them. 157 respondents also agreed that e-banking applications reduce the cost of their financial transactions. For convenience and the need to carry cash, 233 respondents agreed that e-banking increases and reduces them respectively. While for 190 respondents e-banking allows the minimization of mistakes/errors, 184 and 185 respondents agreed that e-banking makes their financial transactions more reliable and dependable respectively. Conclusively, 226 respondents agreed that e-banking is very helpful in their financial transactions. 7.2 TEST OF HYPOTHESES The 10 hypotheses formulated for the study were tested at 95% level of significance using z-test of proportion for data generated from 234 e-banking users. The formula used for z statistics is:
Z=x-np/ np (1-p) Where X=respondents supporting Ho N=sampled size P=probability for Ho acceptance A=level of significance (0. 05). Decision rule: reject Ho and accept hi when the computed z value is greater than the absolute Z 0.05 and accept Ho when the computed Z is less than the absolute value of Z0.05. 7.2.1. HYPOTHESIS ONE Ho1: use of e-banking does not reduce the incidence of fraud in financial transactions Hi1: use of e-banking reduces the incidence of fraud in financial transactions We note the following values from analyzed data for hypothesis one: X= 75, N= 234, P= 50% (0.5) Z= 75-234(0.5)/7.65=-5.49 Given that the computed value of Z (-5.49) falls outside the acceptance region of +- 1.64, we reject Ho and conclude that use of e-banking reduces the incidence of fraud in financial transactions. 7.2.2 HYPOTHESIS TWO Ho2: e-banking does not give users greater control over their financial transactions. Hi2: e-banking gives users greater control over their financial transactions. We note the following values from analyzed data for hypothesis two: X=19, N=234, P=0.5 Z= 19-117/7.65=-12.81 Given that the computed value of Z (-12.81) falls outside the acceptance region of +- 1.64, we reject Ho and conclude that e-banking gives users greater control over their financial transactions 7.2.3 HYPOTHESIS THREE Ho3: e-banking does not enable users to accomplish financial transactions more quickly HI3: e-banking enables users to accomplish financial transactions more quickly We note the following values from analyzed data for hypothesis three: X=2, N=234, P=0.5 Z= 2-117/7.65=-15.03 Given that the computed value of Z (-15.03) falls outside the acceptance region of +- 1.64, we reject Ho and conclude that e-banking enables users to accomplish financial transactions more quickly. 7.2.4 HYPOTHESIS FOUR Ho4: e-banking does not reduce the cost/bank charges of financial transactions Hi4: e-banking reduces the cost/bank charges of financial transactions We note the following values from analyzed data for hypothesis four: X=77, N=234, P=0.5 Z=77-117/7.65=-5.23 Given that the computed value of Z (-5.23) falls outside the acceptance region of +- 1.64, we reject Ho and conclude that e-banking reduces the cost/bank charges of financial transactions 7.2.5 HYPOTHESIS FIVE Ho5: use of e-banking does not increase the convenience of financial transactions Hi5: use of e-banking increases the convenience of financial transactions We note the following values from analyzed data for hypothesis five: X=1, N=234, P=0.5 Z= 1-117/7.65=-15.16 Given that the computed value of Z (-15.16) falls outside the acceptance region of +- 1.64, we reject Ho and conclude that use of e-banking increases the convenience of financial transactions. 7.2.6 HYPOTHESIS SIX Ho6: use of e-banking does not reduce the need of users to carry cash Hi6: use of e-banking reduces the need of users to carry cash We note the following values from analyzed data for hypothesis six: X=1, N=234, P=0.5 Z= 1-117/7.65=-15.16 Given that the computed value of Z (-15.16) falls outside the acceptance region of +- 1.64, we reject Ho and conclude that use of e-banking reduces the need of users to carry cash 7.2.7 HYPOTHESIS SEVEN Ho7: e-banking does not allow the minimization of mistakes/errors in financial transactions Hi7: e-banking allows the minimization of mistakes/errors in financial transactions We note the following values from analyzed data for hypothesis seven: X=44, N=234, P=0.5 Z= 44-117/7.65=-9.54 Given that the computed value of Z (-9.54) falls outside the acceptance region of +- 1.64, we reject Ho and conclude that e-banking allows the minimization of mistakes/errors in financial transactions. 7.2.8 HYPOTHESIS EIGHT Ho8: use of e-banking does not make financial transactions more reliable

VOLUME NO. 4 (2014), ISSUE NO. 06 (JUNE) ISSN 2231-5756
INTERNATIONAL JOURNAL OF RESEARCH IN COMMERCE, IT & MANAGEMENT A Monthly Double-Blind Peer Reviewed (Refereed/Juried) Open Access International e-Journal - Included in the International Serial Directories
http://ijrcm.org.in/
36
Hi8: use of e-banking makes financial transactions more reliable We note the following values from analyzed data for hypothesis eight: X=50, N=234, P=0.5 Z= 50-117/7.65=-8.76 Given that the computed value of Z (-8.76) falls outside the acceptance region of +- 1.64, we reject Ho and conclude that use of e-banking makes financial transactions more reliable. 7.2.9 HYPOTHESIS NINE Ho9: use of e-banking does not make financials more dependable Hi9: use of e-banking makes financials more dependable We note the following values from analyzed data for hypothesis nine: X=49, N=234, P=0.5 Z= 49-117/7.65=-8.89 Given that the computed value of Z (-8.89) falls outside the acceptance region of +- 1.64, we reject Ho and conclude that use of e-banking makes financials more dependable. 7.2.10 HYPOTHESIS TEN Ho10: e-banking users do not find it useful in their financial transactions and overall productivity Hi10: e-banking users find it useful in their financial transactions and overall productivity We note the following values from analyzed data for hypothesis ten: X=8, N=234, P=0.5 Z= 8-117/7.65=-14.23 Given that the computed value of Z (-14.23) falls outside the acceptance region of +- 1.64, we reject Ho and conclude that e-banking users find it useful in their financial transactions and overall productivity. 7.3 ANSWERS TO RESEARCH QUESTIONS The research questions are answered here using data on table 7.2. Research question one
Is e-banking enhancing the status of users in the society (image measure)? Refer to table 7.2 and note that 149 (63.68%) respondents considered the use of e-banking to be enhancing their status in the society. We conclude therefore that majority of e-banking users believe that it is enhancing their status in the society. This implies that use of e-banking can have a bandwagon effect as many will adopt it because their friends and associates are using it and they will want to belong. Nonuse of e-banking will make many feel not being fashionable. Research question two
Is the use of e-banking essentially mandatory in Nigeria (voluntariness)? Refer to table 7.2 and note that 165 (70.51%) respondents indicated that their use of e-banking is not borne out of compulsion/it is non-mandatory. They are essentially using e-banking because they want and like to do so. This suggests that Government and/or CBN must not necessarily compel Nigerians for them to accept and use e-banking services as payment options. Research question three
Are the results/benefits of e-banking clearly demonstrable in Nigeria (result demonstrability)? We note from table 7.2 that 185 (79.06%) respondents indicated that the benefits of using e-banking in financial transactions can be clearly demonstrated. The feature of demonstrability implies that benefits can be communicated using most forms of personal and/or mass communication. Promoting e-banking becomes therefore easy. Research question four
Are e-banking services relevant to the job performance and/or productivity of users in Nigeria (job relevance)? Refer to table 7.2 and note that 173 (73.93%) respondents agreed that e-banking services are relevant to their job performance and enhance their overall productivity in life. It follows that the usefulness of e-banking is not limited to facilitating financial transactions but extends to freeing users to do their jobs and other socio-economic obligations better. This is additional ammunition to salesmen, advertisers and other promoters of e-banking services. Research question five
Are e-banking services helping users in Nigeria to perform their financial transactions well (output quality)? We note that 190(81.20%) respondents agreed that e-banking services are helping them to perform their financial transactions well. This supports the claim that e-banking output quality is high and should therefore be easy to persuade the average person to accept and use. 7.4 GENERAL COMMENTS AND RECOMMENDATIONS OF RESPONDENTS. The challenges militating against the enhanced perception of the usefulness of e-banking to users in Nigeria are: 1. Inadequacy of necessary infrastructure-power, network etc.; 2. Absence of recognized mechanism for the resolution of issues/customer complaints on failed transactions; 3. Possibility of hacking and exposure to internet fraud and other forms of cybercrime; 4. Unavailability and inaccessibility of ATMs and POS platforms in convenient places; 5. Absence of trust and loss of privacy; 6. Difficulty in providing evidence for completed transactions; and 7. Seemingly difficult and complex procedure in operating many e-banking platforms. The implied benefits of e-banking identified by the respondents are:
Being easy and convenient, it is boosting economic, social and financial transactions;
It saves time and reduces the risk of carrying cash;
It reduces incidents of fraud and misplacement of cash;
It reduces the need to visit banks and the attendant travel costs;
It reduces long queues in banks;
it helps to keep audit trails of transactions;
It is promoting the cashless policy of CBN;
It reduces the motivation for robbery attacks; and
Being an effective and efficient payment system, it is facilitating commercial activities. The direct measures and strategies recommended by respondents in making e-banking seamless and cashless policy successful are: a) Create more awareness of its benefits; b) Educate and train current and prospective users on how best to operate e-banking platforms; c) Motivate/extend incentives to make more people to accept and use e-banking platforms; d) Perfect the security and safety mechanisms of e-banking in Nigeria.

VOLUME NO. 4 (2014), ISSUE NO. 06 (JUNE) ISSN 2231-5756
INTERNATIONAL JOURNAL OF RESEARCH IN COMMERCE, IT & MANAGEMENT A Monthly Double-Blind Peer Reviewed (Refereed/Juried) Open Access International e-Journal - Included in the International Serial Directories
http://ijrcm.org.in/
37
8.0 FINDINGS The major findings of the study based on tested hypotheses and answered research questions are summarized below:
Use of e-banking reduces the incidence of fraud in financial transactions
E-banking gives users greater control over their financial transactions.
E-banking enables users to accomplish financial transactions more quickly
E-banking reduces the cost/bank charges of financial transactions
Use of e-banking increases the convenience of financial transactions
Use of e-banking reduces the need of users to carry cash
E-banking allows the minimization of mistakes/errors in financial transactions
Use of e- banking makes financial transactions more reliable
Use of e-banking makes financial transactions more dependable
E-banking users find it useful in their financial transactions and overall productivity
E-banking is enhancing the status of users in the society (image value of e-banking is high)
The use of e-banking is essentially non-mandatory in Nigeria (individuals are voluntarily adopting its usage).
The results/benefits of e-banking are clearly demonstrable in Nigeria (result demonstrability value of e-banking is high).
E-banking services are relevant to the job performance and/or productivity of users in Nigeria (job relevance of e-banking is positive and high).
E-banking services are helping users in Nigeria to perform their financial transactions well (output quality of e-banking is high).
9.0 RECOMMENDATIONS/SUGGESTIONS To get Nigerians to willingly accept and use e-banking payment options and ultimately transit from cash-based to electronic based transactions we proffer the following: Massive and Sustained Sensitization to inform and educate Nigerians especially in the rural areas on the meaning, workings and benefits of electronic payment options as viable alternatives to cash based transactions. The fact that the benefits of electronic payment options are manifest and self-evident makes the task a lot easier. Once people get to know what e-banking is and are convinced that there is no ulterior motive (like using information on their financial transactions as basis for taxing the people or seeking to establish their financial worth), many will sign in as it advances their own self-interest. Testimonials from credible Nigerians, not necessarily celebrities, known in their localities will be helpful in overcoming people’s lethargy and apathy to government initiatives. Once the not so educated Nigerians hear the testimonies of people they know and trust, on the invaluable benefits and promises of using electronic banking options in their financial transactions, they will be sold on the scheme. As many use the platforms and there are positive reinforcements, many disciples and apostles will emerge and spread the good news and persuade reluctant and not so convinced people to join the bandwagon. Electronic Communication Social Networks should be deployed in promoting the acceptance and use of e-banking platforms. The power of these new media cannot be overestimated especially among the youth. Recruitment of Missionary Salesmen and Operations Consultants. Banks and other electronic payment companies will be advised to recruit many missionary salesmen and officers whose task will be to train and facilitate the mastery of the intricacies of operating electronic payment platforms for people who show up at banks and points of use of the platforms. Their role will strategically be to help willing prospective users to know how to use the platforms and not to seek to attract customers for particular banks. Massive Deployment of ATMs and PoS Terminals. We should avoid the Nigerian malaise of generating primary demand only to destroy it by unavailability and inaccessibility of facilities and personnel at the operational points. Even before promoting electronic payment platforms, efforts should be made to make the platforms available and functioning and in adequate number and locations before people throng to the designated points. There is nothing as difficult as convincing a disillusioned customer to come back. CBN and banks should be ready before inviting Nigerians to visit and have a wonderful experience. Establishing and Clarifying Obligations and Responsibilities of Banks and Customers in Electronic Based Transactions. All exchange relationships are inherently conflictual. This realization should inform the setting up of definite conflict resolution mechanisms as banks and customers engage each other in electronic based financial transactions. Customer complaints will also come up and must be settled speedily and not allowed to linger like court cases that can drag for ages. Massive Retooling and Up Scaling of Infrastructural Facilities and Communication Networks: Before rolling out the national campaign on electronic banking adoption on a large scale, the twin challenges of infrastructural facilities and communication networks that the system critically depend on, should be massively retooled and up scaled for uninterrupted delivery. Leading by Example: the leading lights in service delivery in Nigeria should champion the adoption of e-banking payment options. The moment organizations like CBN, Ministries, Departments And Agencies Of Government (MDAs), Schools, Hospitals, And Large Corporates Like NNPC, NPA, Nigeria Breweries, MTN, GLO, Guinness Nigeria limited, Stock Brokers, Registrars etc. adopt exclusive e-payment options, it will be a matter of time before others and every individual join the bandwagon. It will become the best practice and a benchmark for progressivism. Throw in a Deal/Incentive: a chance to gain something will always work wonders. Giving of discount and /or rebate for individuals who pay via electronic options will be the ultimate clincher.
10.0 CONCLUSIONS Based on the findings of this study which showed clearly that the perceived usefulness of e-banking is positive in all dimensions, we conclude that the attitude of Nigerians to e-banking is definitely positive. When attitude toward a given technology is positive, it follows logically that the people will willingly accept and use it especially where the use of the technology is also perceived to be easy. This is the whole logic of Technology Acceptance Model (TAM). The challenge in achieving the cashless policy of CBN which is anchored on transiting from cash based to electronic based transactions is contingent not on legislating, coercing or mandating Nigerians to comply with the policy but on adopting measures to facilitate the ability and willingness of Nigerians to accept and use e-banking platforms which offer effective and efficient financial transactions with demonstrable benefits to all stakeholders.
11.0 LIMITATIONS This report has proceeded on the assumption that once the Perceived Usefulness of e-banking is present and positive that individuals will always accept and use e-banking platforms as their preferred payment options. This is not tenable. More so when it is realized that Technology Acceptance Model (TAM) that is the framework for this study is hinged on two interdependent legs, namely, Perceived Usefulness and Perceived Ease of Use. To conclusively draw the analysis of this study to a logical conclusion and make postulations, it will be necessary to conclude the second leg of the study by critically examining the perceived ease of use of e-banking tools, facilities and processes. If e-banking services are manifestly beneficial and will best serve the interest of users but its operation is complex, difficult and seemingly impossible, then its acceptance and use will be greatly hampered if not rejected. For the acceptance and use of e-banking services to be general and common place, two conditions will be met-it should be manifestly useful and easy to use by the average person. Stretched further, an enabling environment anchored on legal/regulatory framework, steady power supply and availability of communication network, availability and accessibility of ATMs and POS facilities at convenient locations are all measures that will guarantee a seamless e-banking operation in Nigeria. Building of trust, securing of privacy and assurance of security are still measures that will augment and promote mass acceptance and use of e-payment options in Nigeria.

VOLUME NO. 4 (2014), ISSUE NO. 06 (JUNE) ISSN 2231-5756
INTERNATIONAL JOURNAL OF RESEARCH IN COMMERCE, IT & MANAGEMENT A Monthly Double-Blind Peer Reviewed (Refereed/Juried) Open Access International e-Journal - Included in the International Serial Directories
http://ijrcm.org.in/
38
12.0 SCOPE FOR FURTHER RESEARCH Further studies in the following areas will be needed in facilitating the transition to electronic based payment options from cash based ones: Strategies and measures for enhancing the perceived ease of use of e-banking platforms Legal and regulatory framework that will promote mass adoption and sustained use of e-banking services in Nigeria Overcoming illiteracy challenges in operating e-banking services in rural areas in Nigeria Building trust, securing privacy and sustaining security for effective e-banking in Nigeria.
REFERENCES 1. Carl, May (“normalization process theory”. ctrl+click to follow link) 2. Davis, F.D. (1989) “perceived usefulness, perceived ease of use and user acceptance of IT”. MIS Quarterly. 3. Davis, F.D., Bagozzi, R.P. and Warshaw, P.R. (1989) “user acceptance of computer technology: a comparison of two theoretical models.” Management
science 4. EFINA (2012) “Market research in Lagos state of banks, switches and consumers,” September/October 5. E-payment providers association of Nigeria (E-PPAN) (2013) “cashless Lagos success monitoring.” 6. Eveland, J.D. (1986). “Diffusion, technology transfer and implementation.” Knowledge: creation, diffusion, utilization. 7. Financial Derivatives Company Limited (2012) Cash-Less PoS Survey-Lagos from Cash to Card, November 8. Mckeown, lindy http:en.wikipedia.org/wiki/technology_adoption_lifecycle#cite_note_8 9. Moore, Geoffrey “Crossing the chasm” ctrl+click to follow link 10. Peres, Renana, Muller, Eitan and Mahajan, Vijay (2010).”Innovation Diffusion and New Product Growth Models: A Critical Review and Research Direction”,
International Journal of Research in Marketing. 11. Rogers, Everett (1962Diffusion of innovation. Glencoe: Free Press 12. Rogers, Everett (2005). Diffusion of innovation. New York: free press 13. Wejnert, Barbara (2002). “Integrating models of diffusion of innovation: A Conceptual Framework”. Annual Review of Sociology (Annual Reviews) 14. Wenger, E., White, N. and Smith, J.D. (2010). Digital habitats: stasdfghjkl; ewarding technology for communities. Portland.
APPENDIX/ANNEXURE TABLE 8.1: PROFILE OF SURVEY RESPONDENTS
Category Statistics
EDUCATION Masters & PhD BSC /HND OND/ NCE SSCE GENDER Male Female AGE 20-30 years 30-40 years 40-50 years 50-60 years 60 years and above MARITAL STATUS Single Married Divorced Widowed GROSS ANNUAL INCOME Less than N1m N1M-N3M N3M-N5M N5M-N7M N7M-N9M N9M- N11M N11M-N13M N13M and above EMPLOYMENT STATUS Employed Unemployed SECTOR OF EMPLOYMENT Private Public OPERATION OF ACCOUNT WITH NIGERIAN BANKS Yes No TYPE OF ACCOUNT WITH NIGERIAN BANKS Individual Corporate Joint INVOLVEMENT WITH E-BANKING IN NIGERIA Yes No DURATION OF EXPERIENCE OF E- BANKING IN NIGERIA Less than one year 1-3 years 3-5 years 5 years and above
119(50.85%) 107(45.73%) 07(4.27%) 01(0.43%) 135(57.69%) 99(42.31%) 44(18.80%) 128(54.70%) 53(22.65%) 9(3.85%) 0 71(30.34%) 151(64.53%) 3(1.28%) 9(3.85%) 74(31.62%) 98(41.88%) 32(13.68%) 8(3.42%) 5(2.14%) 5(2.14%) 8(3.42%) 4(1.71%) 229(97.86%) 5(2.14%) 95(41.48%) 134(58.52%) 231(98.72%) 3(1.28%) 234(69.23%) 58(17.16%) 46(13.61%) 219(93.59%) 15(6.41%) 61(26.07%) 115(49.15%) 27(11.54%) 31(13.25%)
SOURCE: FIELD SURVEY, 2013

VOLUME NO. 4 (2014), ISSUE NO. 06 (JUNE) ISSN 2231-5756
INTERNATIONAL JOURNAL OF RESEARCH IN COMMERCE, IT & MANAGEMENT A Monthly Double-Blind Peer Reviewed (Refereed/Juried) Open Access International e-Journal - Included in the International Serial Directories
http://ijrcm.org.in/
39
SENSITIVITY OF INTERNAL AND EXTERNAL CHANGE JUSTICE AS A PREDICTOR IN PRIVATE SECTOR
UROOS FATIMA RIZVI GUEST FACULTY
UNIVERSITY INSTITUTE OF MANAGEMENT RANI DURGAWATI UNIVERSITY
JABALPUR
FASAHAT HUSAIN QAZI REGISTRAR (IT)
M. P. HIGH COURT JABALPUR
ABSTRACT
The demand of global market have collectively transformed the ownership and structure of Indian organization, which is leading towards stress among employees, restructuring organizational pattern, downsizing, change in technology, change in product quality, job rotation, change in responsibility of Managers as well as workers. The present paper deals with a case study of two industries (private sector) located in Allahabad district and its process of change, reason and effectiveness in terms of job satisfaction, productivity and quality. And the influence of ownership change and technology change on manager’s perception.
KEYWORDS change, private sector.
INTRODUCTION he business environment is fast changing due to pervasive liberalization and globalization phenomena. The change in the shape of economic activities is seen in recent years is mainly due to revolutionary changes in erstwhile Soviet Union, Emergence of European Community and Eastern Europe and many emerging nations. Change inspires many organizations to do business in more than one organization, to add powerful new business dimensions to
organizational behavior. It is also being perceived as a frightening step into different political, social, legal and eco-environment. A change in organization refers to an alternative of structure relationship and role of people in the organization. The change pressurized by internal and external factors (forces) may affect only one or all levels and departments or related to the organizational structure and people technology, work setting or social environments. The alteration disturbs the existing equilibrium and creates adjustment problem. At a conceptual level the change is desire for moving from one state to other and it is accomplished as a result of achieving three types of goals, Transform, Reduce and Apply. Transform goals are concerned with identifying difference between two states. Reduce goals are concerned with determining ways of eliminating these differences. Apply goals are concerned with putting into play operators that actually effectuate the elimination of these differences. The change agent or top management can create the change or it can be based on diagnosis and recognition of problems by involving people at all level of organization. By implementing the change the cemented old values, attitudes, habits and behavior which were the instruments in developing the personality composition like perception, learning and motivation get disturbed and persons feel psychological distress. In organizational context in the event of change the employee resist every effort, which disturbs the equilibrium and change become less smooth unless the status quo is systematically unfrozen Adjustment among people, technology and structural set up is established when an organization operates for a long time. People adjust with their jobs, working conditions, colleagues and supervisor etc. Similarly organization establishes new relationship with the external environment. Change requires individual and organizations to make new adjustment. Complexity and fear of adjustment give rise to resistance and the problem of effective change management.
RESPONSES TO CHANGE People react in different and varying ways to change as the perception of employees differs. Each behavior is interpreted by employee’s attitude. And the attitude depends on the employee belongingness. It can be different due to varied socio-economic status, and qualification etc. due to individual differences the perception of an individual will differ; if one perceives benefit other can perceive loss/cost in same situation, it can lead to mixed response. Variety can be seen in similar change situation. Feelings are not matter of logic. Feeling can be neither is logical nor illogical, but different from both. In-group individual’s behavior is influenced by the code, pattern and norms of the group environment. Which becomes common pattern behavior among the group members? This becomes an indication of particular group. The tolerance level for change within a group of employees can range from relatively high for one person to relatively low to other, whenever the level exceeded, stressful responses develop that can undermine health. Response varies from individual to individual: 1. Acceptance of Change 2. Indifference 3. Resistance
NEED FOR EFFECTIVE MANAGEMENT OF CHANGE Many changes in organizations occurred with the telemarketer. Organizations are treating all changes as an accidental occurrence. There are two goals of change: 1. First is to improve the ability of the organization to adapt to changes in its environment; and 2. Second is seeks to change the employees’ behaviour. To survive organization are responding to change in their own environment. The organization needs to effort to stimulate innovations, empower employees and introduce work team when competitors introducing new products, new organizational services, government agencies enacting new laws, importing new sources of supply, going out of business or similar environmental changes are taking place.
LITERATURE REVIEW Researchers and psychologists have tried to find out related factors and their responses to organizational change. The aspects on which they have studied most to find the affects of change are: 1. DETERMINANTS OF ORGANIZATIONAL CHANGE: Mankidy 1993, Nagrelli and Tren 1995, Cutches Greshenfeld et al, 1996, Karassavidau and Markovits 1996 did an experiment and pointed out that traditional industrial relation system are mostly centered around conflict management and demand orientation are gradually veering more towards collaboration and operation.
T

VOLUME NO. 4 (2014), ISSUE NO. 06 (JUNE) ISSN 2231-5756
INTERNATIONAL JOURNAL OF RESEARCH IN COMMERCE, IT & MANAGEMENT A Monthly Double-Blind Peer Reviewed (Refereed/Juried) Open Access International e-Journal - Included in the International Serial Directories
http://ijrcm.org.in/
40
The study was designed to find out the situational and personnel determinants of organization commitment by Madan Lal Sharma, 200 skilled workers of a private sector manufacturing organization were interviewed. The obtained result shows that both situational and personnel factors contribute to workers commitment to organization. Between the two situational factors contribution is more to commitment than personal related factors. 2. GLOBALIZATION AND INNOVATION Pleffer(1982) wrote, “Once an innovation is institutionalized it is adopted and accepted not because it has rational or technical properties but because social expectations are that good managed organizations will do so”. The success of organizational innovations depends great deal on timing, and perhaps the change agents are strategic about when they began encouraging their clients to implement. Three groups of variable which influence the organizational innovativeness have been found by Rogers (1983), these are:
Individual characteristics of leader.
Internal characteristics of organization.
External characteristics of organization. He found positive attitude of leaders towards change organization and organizational innovativeness. Rogers (1983) also highlighted six key elements of organizational structure which have been found to influence the innovation of the organization: a. Centralization b. Formalization c. Size d. Organizational stack e. Complexity f. Interconnectedness. “Changes are often considered to be messy and troublesome. But changes and the search for new forceful structures constitute a basic mechanism in development of commerce and industry, with change as the driving wedge companies can create strong new organizations that are adapted to new conditions”, Mikael Lilius, President and CEO of Sweden’s Incentive group. According to Robert J., Samuelson International Herald Tribune 2000 ‘globalization is a double edged sword’ which raises economic growth and improves the standard of living in rich as well as in poor countries with this it is also has an immense controversial process that assaults national sovereignty, erodes local culture and traditions, and threatens economic and social stability. 3. OWNERSHIP Pareek (1985) found private as well as public sectors share many common characteristics related to ownership and on the other hand they differ on many aspects. Empirical data based on isolated case studies indicate that merger and acquisitions can result in cultural integration and the creation of new culture (Graves 1981) or the cultural displacement of the acquired or smaller and/or less powerful partner (Buono, Bowditch & Lewis 1985). Hall & Norburn(1987) hypothesized that the degree of cultural fit between merger organizations would be directly correlated to merger success. According to Marks (1988) merger and acquisitions differ from any other process major organizational change in terms of the speed of change, the scale of change and the critical man of the unknown they present for both the parties. The build up and aftermath of recession major social economic and political changes within Europe and the demands of an increasingly global market have collectively transformed the ownership, shape and structure of many organizations. During the last decade there has been substantial growth in the number of mergers acquisition, joint ventures and other forms of strategic alliances, both domestically and internationally (Cartright & Cooper 1994,1996). 4. DOWNSIZING AND TERMINATION OF EMPLOYEES Brocknet et al (1985) suggested that survivor with low self-esteem may actually improve their work performance because they experience a high level of positive inequality (i.e. guilt) about the way in which a downsizing is conducted. In his study Brocknet et al. (1992) found employees who were highly committed to the organization before downsizing and where management is perceived to be unfair and are likely to suffer from negative reactions. Newell & Dopson (1996) said that the use of downsizing might also impair an attempt to introduce another type of change strategy where it produces negative reactions amongst those who survive. It can be seen as either a primary lever to introduce organization change as a link in a chain of change events. Barret, Power (1997) defined the downsizing more as a constellation of stressor events entering around pressures towards workforce and reductions, which places demand upon the organization, work groups, individual employee and require a process of coping and adaptation. RESEARCH DESIGN It involves a particular method of research, rather than using large samples and following a rigid protocol to examine a limited number of variables, case study methods involve an in-depth, longitudinal examination of a single instance or event: a explorative case study. Exploratory case studies condense the case study process: Where considerable uncertainty exists about program operations, goals, and results, exploratory case studies help identify questions, select measurement constructs, and develop measures; they also serve to safeguard investment in larger studies. THE SURVEY The research was planned through two stages (Primary and secondary study). The basic objective behind conducting preliminary study was to explore the concept of managing change in organizations. The responses obtained from the preliminary study forms a basis for final questionnaire. The information was sought through structured questionnaire administered on the managers (implied change agents) CASE STUDY I Alstom: In India: Alstom is active in two major areas of business i.e. Power and transport Commencing its operation in Kolkata in 1910s and later in Chennai in 1950s Alstom in India traces its linkage to English Electric, CEGELEC, AEI, GEC Alsthom, ASED, HBB, FLAKT and ABB drawing its strengths from technologies developed over the years by these companies. General Electric Company was established in 1957 at Naini Industrial, aiming to produce power transformers. In 1989 GEC and Alcatel Alsthom announced that they have reached at agreement about the future ownership structure of GEC ALSTHOM. Since its formation it became a major player in the worldwide power generation, power transmission and distribution and rail transportation industries. GEC ALSTHOM announced about their business to be floated in Paris, New York and London in 1998 with new name ALSTHOM on 5th Dec ‘1997. GEC ALSTHOM in India became ALSTOM 1998. Areva a Nuclear Giant (a French Government concern) after completing its formality with RBI and Stock exchange has undertaken over nine factories in Indian; among them one is Alstom, on September 28,2005. CASE STUDY II Shervani Industrial Syndicate Limited: Sherwani industry was running two branches at Allahabad district and producing cells with the reputated logo ‘Geep’ mean while the organization became sick, even at that time 2200 employees were working. Sickness of organization became the cause of change, they started terminating their employees without giving reasons and offering them VRS schemes for the cost reason, one day came when the SISL sold its one of the Allahabad unit and its Logo to Gillet Company. After eliminating the number of employees now the total workforce In SISL is approximately 20-25 managers and approximately 150 workers. Every month they are terminating their employees and they suppose to hire the same terminated employees on daily wages to fulfill their demand targets. They believe daily wage labour scheme would reduce the cost of production; and they don’t have to pay the extra amount for the leave and the hours they are not working. Now Gillet has handover to Topiwala.

VOLUME NO. 4 (2014), ISSUE NO. 06 (JUNE) ISSN 2231-5756
INTERNATIONAL JOURNAL OF RESEARCH IN COMMERCE, IT & MANAGEMENT A Monthly Double-Blind Peer Reviewed (Refereed/Juried) Open Access International e-Journal - Included in the International Serial Directories
http://ijrcm.org.in/
41
Sample: Stratified random sampling method was used to select workers and managers for the study. Taken number of subjects for study was based on the number of total employees in the organization, so varies from organization to organization. Instrument: closed-ended questionnaire was used to seek information. English questionnaire for supervisors and managers Questionnaire was framed to seek information (Based on Likert’s scale) using Lewin’s Model of Resistance. Personal information Family Related Job Related. Main Questionnaire Restraining Forces Driving Forces Implementation of Change Outcome of Implemented Change Ownership Training Task People Technology WHY FACTOR ANALYSIS Factor analysis is identified as the explanatory analysis tool and is commonly used for the data reduction in social science research (multivariate technique). It assumes that underlying dimension on factors can be used to explain complex phenomenon without losing much of the important information. The variables that do not appear to be related to other variables can also be identified from the matrix. It produces a correlation matrix for all variables PCA is most widely used and inexpensive method of extracting factors. In this study Factor Analysis tool has been used to test the formed hypotheses and to take out the effective restraining and driving forces with implementing factors and their output.
ANALYSIS RESTRAINING FORCES: Acting to restrain or decrease the driving force may be likened to walls or barriers. They only prevent or retard movement toward them.
TABLE 1: TOTAL VARIANCE EXPLAINED (a)
Component Initial Eigenvalues Rotation Sums of Squared Loadings
Total % of Variance Cumulative % Total % of Variance Cumulative %
1 1.675 20.944 20.944 1.491 18.637 18.637
2 1.576 19.700 40.644 1.409 17.611 36.248
3 1.269 15.866 56.510 1.339 16.734 52.981
4 1.043 13.042 69.552 1.326 16.571 69.552
5 .826 10.321 79.873
6 .727 9.086 88.959
7 .526 6.571 95.530
8 .358 4.470 100.000
EXTRACTION METHOD: PRINCIPAL COMPONENT ANALYSIS
GRAPH 1
Scree Plot
Component Number
87654321
Eig
en
va
lue
1.8
1.6
1.4
1.2
1.0
.8
.6
.4
.2
TABLE 2: ROTATED COMPONENT MATRIX (a,b)
Component
1 2 3 4
Fear of demotion -.070 -.048 .094 .740
Training cost high .705 -.474 .261 -.037
New social adjustment .118 .883 -.033 .176
High workload .833 .257 -.063 .126
High absenteeism -.207 .546 .480 -.410
High responsibility -.129 -.172 -.121 -.634
Objective reducing workforce -.437 .071 .551 .362
Job insecurity .178 -.060 .842 .167
Extraction Method: Principal Component Analysis Rotation Method: Varimax with Kaiser Normalization

VOLUME NO. 4 (2014), ISSUE NO. 06 (JUNE) ISSN 2231-5756
INTERNATIONAL JOURNAL OF RESEARCH IN COMMERCE, IT & MANAGEMENT A Monthly Double-Blind Peer Reviewed (Refereed/Juried) Open Access International e-Journal - Included in the International Serial Directories
http://ijrcm.org.in/
42
Total variance is about 70 percent with four emerging factors in private sectors. Around 80 percent managers agreed the employees need proper training to release the workload, but due to lack of enough fund, training seems to be costly. About 88 percent managers said it is necessary to adjust in a new social setting with change because it is a pre requisite of organization to survive. They believe introducing change is to reduce the cost of organization by terminating the employees and demoting them, which automatically develops the insecure feeling among them. DRIVING FORCES: Factors affecting a situation which are ‘pushing” in a particular direction; they tend to initiate a change and keep it going.
TABLE 3: TOTAL VARIANCE EXPLAINED
Initial Eigenvalues Rotation Sums of Squared Loadings
Component Total % of Variance Cumulative % Total % of Variance Cumulative %
1 2.444 20.364 20.364 1.910 15.915 15.915
2 1.878 15.647 36.012 1.904 15.864 31.780
3 1.575 13.122 49.133 1.720 14.330 46.109
4 1.321 11.010 60.143 1.514 12.613 58.722
5 1.039 8.656 68.800 1.209 10.078 68.800
6 .947 7.891 76.691
7 .783 6.522 83.213
8 .684 5.699 88.911
9 .523 4.358 93.269
10 .337 2.812 96.081
11 .306 2.550 98.631
12 .164 1.369 100.000
Extraction Method: Principal Component Analysis GRAPH 2
Scree Plot
Component Number
121110987654321
Eig
en
va
lue
3.0
2.5
2.0
1.5
1.0
.5
0.0
TABLE 4: ROTATED COMPONENT MATRIX
Component
1 2 3 4 5
Market competition -7.162E-02 9.907E-02 .198 .106 .780
Need for international status -.373 .669 .229 .292 -.303
Brighten future .192 .732 -2.648E-02 .177 .383
Organization survive .514 .426 -.228 -.334 -.137
Improved quality .843 -5.271E-03 3.823E-02 .186 .162
Increase production .743 .172 .154 .180 -.375
Available facilities enough .114 1.440E-02 -3.430E-02 .585 .213
Expecting better salaries .110 -.167 .767 -.320 2.113E-02
Expecting career advancement/promotion -.194 -.137 .503 .518 .107
Expecting recognition 2.319E-02 5.687E-02 .805 9.916E-02 .139
Increased demand .332 5.777E-02 -.159 .658 -.315
Increased international demand .171 .804 -.187 -.226 3.442E-02
Extraction Method: Principal Component Analysis Rotation Method: Varimax with Kaiser Normalization Total number of factors minimized due to Rotation Process for private sectors is five, with total accounted variance of 69 percent. About 84 percent managers said implementing change would improve the quality of product and the level of production. They also said introducing change is to improve the international status and to compete in international market, and the better salary, career advancement /promotion and recognition of employee in an organization. Implementation Implementation is a part of analysis dealing with questions related to cost of training, available facilities in organization and the extent to which the workers or managers support in the process of change.

VOLUME NO. 4 (2014), ISSUE NO. 06 (JUNE) ISSN 2231-5756
INTERNATIONAL JOURNAL OF RESEARCH IN COMMERCE, IT & MANAGEMENT A Monthly Double-Blind Peer Reviewed (Refereed/Juried) Open Access International e-Journal - Included in the International Serial Directories
http://ijrcm.org.in/
43
TABLE 5: TOTAL VARIANCE EXPLAINED (a)
Initial Eigenvalues Rotation Sums of Squared Loadings
Component Total % of Variance Cumulative % Total % of Variance Cumulative %
1 1.712 24.464 24.464 1.595 22.787 22.787
2 1.604 22.919 47.383 1.507 21.524 44.311
3 1.269 18.132 65.515 1.484 21.204 65.515
4 .827 11.818 77.333
5 .753 10.758 88.091
6 .552 7.888 95.980
7 .281 4.020 100.000
Extraction Method: Principal Component Analysis. GRAPH 3
Scree Plot
Component Number
7654321
Eig
en
va
lue
2.0
1.5
1.0
.5
0.0
TABLE 6: ROTATED COMPONENT MATRIX (a,b)
Component
1 2 3
Workers capable .762 .159 .101
Old employees cope .342 -.226 .730
Both gender ready .126 .437 .670
Cost equivalent to one month salary .146 .786 .104
Top levels implemented .379 2.945E-02 -.682
Possible due to technicians support -.212 .764 -.123
Workshop is part .819 -.193 -3.704E-02
Extraction Method: Principal Component Analysis. Rotation Method: Varimax with Kaiser Normalization Four factors emerging with aggregate of 66 percent variance. About 81 percent managers said workshop held in organization played an important role in teaching new techniques to their employees, they also said they themselves and workers were capable enough to learn new pattern of work. In learning and releasing the responsibilities old technicians supported a lot. According to them the cost of training was equivalent to one-month salary of the employee. Another -68 percent result shows top-level managers did not implement change in organization. OUTPUT The affect of implemented change is measured on different scales, which is put in one category to get the meaningful result. The factor analysis tool used to reduce the overloading factors.
TABLE 7: TOTAL VARIANCE EXPLAINED (a)
Component Initial Eigenvalues Rotation Sums of Squared Loadings
Total % of Variance Cumulative % Total % of Variance Cumulative %
1 1.880 20.886 20.886 1.818 20.197 20.197
2 1.360 15.112 35.999 1.360 15.110 35.307
3 1.313 14.588 50.586 1.335 14.830 50.137
4 1.170 13.000 63.586 1.210 13.449 63.586
5 .979 10.876 74.462
6 .863 9.591 84.053
7 .614 6.824 90.878
8 .465 5.162 96.040
9 .356 3.960 100.000
Extraction Method: Principal Component Analysis.

VOLUME NO. 4 (2014), ISSUE NO. 06 (JUNE) ISSN 2231-5756
INTERNATIONAL JOURNAL OF RESEARCH IN COMMERCE, IT & MANAGEMENT A Monthly Double-Blind Peer Reviewed (Refereed/Juried) Open Access International e-Journal - Included in the International Serial Directories
http://ijrcm.org.in/
44
GRAPH 4
Scree Plot
Component Number
987654321
Eig
en
va
lue
2.0
1.5
1.0
.5
0.0
TABLE 8: ROTATED COMPONENT MATRIX (a,b)
Component
1 2 3 4
Improved communication channel .634 -.465 -.061 -.418
Smoothen communication bet managers and workers .620 .123 -.108 -.027
More facilities .637 -.160 .211 .420
Salary of managers increased .665 .031 -.101 .046
Workers getting less benefit .306 .756 .142 -.050
Increased absenteeism .043 -.059 -.116 .919
Increased workload .005 .272 .858 -.088
Premature retirement/termination -.148 .520 -.052 -.036
Job insecurity -.255 -.429 .701 -.006
Extraction Method: Principal Component Analysis Rotation Method: Varimax with Kaiser Normalization Four emerging factors with 64 percent of total variance Managers agreed on statement that change improves organization’s communication channel; and with the improvement in channel the relations between workers and managers improves. They also accepted that their salary increases and they are getting more benefits after change in comparison to what they were getting before change. According to managers, workers are getting less benefit in comparison to mangers. 85 percent managers said there is increase in workload after change and their jobs are not secure with change.
CONCLUSION On the basis of above description and data we say according to managers the main cause of change are to improve the quality of the product so that they can easily compete in the international market and have bright future of organization, which was not possible without the support of technical staff, even without change the possibility of organization’s survival was in doubt, employee’s developed the feeling of insecurity and fear of being demoted, therefore to survive it is must to go with change otherwise its very difficult for organization to survive in the world of change and competition. With the changing world every organization thought without change the demand of product will decline and the problem of organization’s survival exists and employees would be eliminated to reduce the cost of industry, therefore the employees get ready to adopt new working pattern and learned new technique with the cooperation of other employees to produce goods. The restraining forces according to managers and workers are every industry is aiming to produce more quantity with fewer employees and eliminating employees without telling any cause and without their faults by introducing VRS schemes and by retiring them prematurely. Workers having insecure feeling and having fear of being demoted, the load of work is high, the ill mannered managers not behaving properly with technicians, so to adjust and equalize the working condition, and to reduce the overloaded responsibility from the employees shoulder and create an environment to adjust in new society it as necessary to introduce change. Implementation of change according to managers require different facilities supporting training conditions, cost of training including charges of external experts, organizing workshop as a part of training, cooperation of old technicians with new technicians and adjusting to new situations with resistance until the condition stabilizes. And the most important thing is workers were capable and ready to learn new patterns of work. Percent of variables varies with the organization but directions of result are same. The output found in the form of improved quality of product, with the quality chances of demand increases and marketing at high level became possible, demand increases responsibility and workload of each employees. Managers said they are getting more facilities with change but in other side workers are not accepting they are getting fewer facilities as compared to managers and they believe their jobs are secure. With the security of job the industrial relationship improved (relationship between the managers and workers improved and among managers). Managers supported to reduce the frequency of resistance. And the survival of organization became possible with good position in market.
REFERENCES JOURNALS 1. Ashok Pratap Singh & Kedar Nath, ‘ Effects Of Organizational Climate, Role Stress And Locus Of Control On Job Involvement Of Banking Personnel’, Journal
Of Industrial Relation 1990-1991. 2. Indian Journal Of Training And Development Vol. XXXII No. 4. Oct-Dec 2002. 3. Jai B. Sinha & Sarita Singh,’Employees Satisfaction And Its Organizational Predictors’, Journal Of Industrial Relation 1995-1996. 4. P.M.Mathew, Management And Change Journal Vol. 2 No. 2 July-Dec 1998.

VOLUME NO. 4 (2014), ISSUE NO. 06 (JUNE) ISSN 2231-5756
INTERNATIONAL JOURNAL OF RESEARCH IN COMMERCE, IT & MANAGEMENT A Monthly Double-Blind Peer Reviewed (Refereed/Juried) Open Access International e-Journal - Included in the International Serial Directories
http://ijrcm.org.in/
45
5. Park SH, Ungson GR, 19997, The Effect Of National Culture, Organizational Complementarily, And Economical Motivation On Joint Venture Dissolution, Academy Of Management Journal 40: 279-307.
6. PRAJNAN ‘Journal Of Social And Management Science’, Integrated Learning. 2001. 7. Ram J. Joshi & Baldev R Sharma,’Detreminants Of Managerial Job Satisfactinin Private Organziations’,Journal Of Industrial Relation 1997. 8. Richard Tanner Pascale 7 Jerry Sternin’ Your Company’s Secret Change Agents’ Harward Business Review 2005, 72-85 9. Somnath Ghosh, ’Industrial Restructuring And Labour Relations’, Journal Of Industrial Relation 1995-1996. 10. The Indian Journal Of Labour Economics Vol. 43 No. 4 Oct-Dec 2000 Conference Issue. 11. The Journal Of BIM-TECH VYAS BAJPAI, ‘Business Perspective’ (Birla Imtech). 12. Wiley, ‘Personality, Behviour And Situational Modifiers Of Work Stressors’, Journal Of Industrial Relation 1990-1991 13. Zajc EJ, Kraatz MS, Bresser RKF, 2000 Modeling The Dynamics Of Strategic Change, Strategic Management Journal 21(4): 429-453. BOOKS 14. Abrahamsson Bengt, ‘Why Organizations? How And Why People Organizes’, Sage Publication New Delhi.1983. 15. Adler Valeria ‘Little Control-Lots Of Stress’ 16. Banaji, Jairas, ‘Corporate Governance And The Private Sector: A Report’, Queen Elizabeth House Oxford, London. 17. Beardwell Ian, Holden Len, ‘Human Resource Management’, Industrial Park, New Delhi.1995 pg 499-550. 18. Blake Robert R.,Mouton Jane S., ‘The Managerial Grid’, Jaico Publishing House, Delhi, Mumbai. 19. Blum Milton L., Naylor James C. ’Industrial Psychology’ 20. Buckingham G.L.,Jeffery R.G.,Thorne B.A.,’Job Enrichment And Organziational Change’. 21. Edited By Cooper Cary L., Jackson Susan E., Wiley John & Sons, ‘Creating Tomorrows Organization: A Handbook For Future Research In Organizational
Behavior. 22. Edited By Richard N. Ottaway, ‘Change Agent At Work’, Business Press London. 23. Edited Rogelberg Steven G., ‘Industrial & Organizational Psychology’. 24. Gaur Keshav Dev, Ghosh D.K., Jawa Ruchita, ’Globalization, Structural Change & Poverty’, Sunrise Publication. 25. Ghosh P.K., Chorpade M.B., ‘Industrial Psychology’, Himalaya Publishing House, Bombay. 26. Luthans Fred, ‘Organizational Behaviour’, Mc Graw Hill International.1998, pg 273-622. 27. Lyon Herbert L., Ivoncevide John M., Jr Donnelly James M., ‘Management Science In Organizations’, Goodyear Publishing Company, California. 28. Malhan, Naresh R., ‘Role Stress In Work Organization’ 29. Mamoria C.B., Mamoria S., ’Dynamics Of Industrial Relations In India’ 30. Milan Kundra ‘Laughter And Forgetting’ 31. Morgan Gareth, ‘Imagination: New Mindsets For Seeing, Organizationizing, And Managing’, Sage Publication. 32. Munck Ronaldo , ‘Globalization And Labour: The New Great Transformation’. 33. Murthy C.S.V. ‘Management Information System’ 34. Rao Subha P. ‘Human Aspects Of Management ‘ Himalaya Publishing House 1995 35. Ratnam C.S. Venkata, ‘Globalization & Labour Management Relations (Dynamics Of Change) Sage Publication, New Delhi. 36. Robbins Stephen P.,’Organizational Behaviour 9th Edition’, Practice Hall, New Delhi. 37. Robbins Stephen R. ‘Organizational Theory And Behaviour’ Prentice Hall of India 2000 pg 412-590 38. Roethlisberger F.J. ‘Management And Morale’ 39. Rogers S. Pressman ‘Software Engineering: A Practical Approach’ 40. Rurabasavaraj M.N., ‘Human Factor In Managemnet’,Himalaya Pblishing House. 41. Saini Debi. S.,’Redressal Of Labour Grievances, Claims And Disputes’,Mohan Primlani For Oxford & IBH Pub. Co. Pvt. Ltd., New Delhi. 1994. 42. Schutz Don E., Kitchen Philip J., ‘Communicating Globally: An Integrated Marketing Approach’, NTC/Contemporary Publishing Group Delhi. 43. Sen A. ‘Industrial Organization ‘ 44. Slocum Hellriegel, ‘Organizational Behaviour’ 8th Edition. 45. Stoner A.F.James, Freeman R.Edward, Gilbert Daniel R., ’Managements ‘ 6th Edition. Prentice Hall of India 2000 pg 410-432. 46. Thorn Jeremy,‘Notes For Managers, Managing Change’, University Press, India.1997.

VOLUME NO. 4 (2014), ISSUE NO. 06 (JUNE) ISSN 2231-5756
INTERNATIONAL JOURNAL OF RESEARCH IN COMMERCE, IT & MANAGEMENT A Monthly Double-Blind Peer Reviewed (Refereed/Juried) Open Access International e-Journal - Included in the International Serial Directories
http://ijrcm.org.in/
46
PRODUCTIVITY IMPROVEMENT THROUGH PREVENTIVE MAINTENANCE: THE CASE OF ATSC TEXTILE MANUFACTURING FIRM
AMARE MATEBU KASSA ASST. PROFESSOR & CHAIR OF PRODUCTION SYSTEM ENGINEERING
SCHOOL OF MECHANICAL AND INDUSTRIAL ENGINEERING INSTITUTE OF TECHNOLOGY
BAHIRDAR UNIVERSITY BAHIRDAR
ABSTRACT
Through effective preventive maintenance system, there is a way for the manufacturing firms to enhance their capacity and to provide better product than they are doing at present. This paper examines how preventive maintenance improves the productivity of textile machines in textile manufacturing firms, especially focused on weaving machines (looms). The study has explored the major problems and causes of machine breakdown at the existing situations and proposed the means to avoid the breakdowns. The investigation of this work indicates an increase of 46.26 % of productivity improvement and mean time between failures (MTBF) increased to 75.41 % from 44.4 %. The mean time to repair (MTTR) also decreases from 12 hrs per breakdown to 10.04 hrs per break down which is a 10.19 % reduction.
KEYWORDS productivity improvement, preventive maintenance.
1. INTRODUCTION ew approaches in modern service and manufacturing industries have been rummaged around, developed and implemented so as to survive in the dynamic and fierce competitive system that are becoming ever more complex. The need for driving down costs, integrating every activities and available resources of a company, empowering the employee to make decision, eliminating waste generated by failure across the value adding process,
shortening of production lead time and delivery of quality assured services and products have been given due attention. Therefore, many manufacturing firms must improve their activities for maintaining their business in the competitive world. Textile manufacturing firm is one of the manufacturing firms that must plan to improve the working process and environment for higher efficiency of production processes. Preventive maintenance is one of the techniques used to improve efficiency of production processes and to drive the maintenance costs down. Maintenance is the process of making a certain machine or equipment available and keeps to the expected performance standard, so that it can avoid sudden break down and minimize down time cost of the equipment. There are two basic types of maintenance: breakdown maintenance and preventive maintenance. In the case of breakdown maintenance, the operators are waiting until equipment fails before repairing or servicing it. But preventive maintenance is a time-based or run-based periodically inspecting, servicing, cleaning, or replacing parts to prevent sudden failure. Moreover, in preventive maintenance system allows monitoring of machinery in order to use important/ expensive parts to the limit of their serviceable life. Preventive maintenance system is used to: reduce the size and scale of repairs, reduce down time (increase uptime), reduce number of repairs, increases quality of output, reduce overtime for responding to emergency breakdown, increase equipment availability, decreases potential exposure to liability, lowers overall maintenance costs through better use of labor and materials, extends the useful life of equipment, finds small problems before they become big ones, and greatly reduces unplanned downtime.
2. OVERVIEW OF ATSC TEXTILE MANUFACTURING FIRM The textile sub-sector includes spinning, weaving and finishing plants. Most integrated textile firms (including spinning, weaving and finishing) are public enterprises in Ethiopia. The textile industry has since considerably expanded gaining an important place in the country's manufacturing sector. Textile is the most employment generating industry accounting for more than 27% of the total manufacturing employment in Ethiopia. And relatively textile industry is labor intensive compared to all other industries. This paper has considered ATSC Textile Manufacturing Firm – Weaving machines (looms) as a case study. ATSC Textile Manufacturing Firm is one of modern textile manufacturing firms in Ethiopia and the weaving machineries (Rapier Sommet looms) are the latest ones. The company is capable of producing different items (like dyed fabric, grey fabric, bleached canvas, 100% cotton fabric, P/C grey fabric, printed fabric, etc) using these weaving machines. However, the company has been operating under its capacity due to high rate of unplanned failure, high dependency on some imported materials and spare parts, set-ups and changeovers, running at reduced speeds minor stops and idling, quality defects (like scrap, yield, rework), lack of skilled manpower, low level of development, poor quality of raw materials, and so on. There is a great deviation between the planned and actual production of fabrics in the weaving shed. The author has considered the production data of ATSC Textile Manufacturing Firm for the fiscal year of 2011/ 2012. The production rate of the 100% Cotton grey fabric for instance shows a great fluctuation throughout the year (see figure 1). The minimum (17.5%) and the maximum of 78.9 % of the production performance have been observed in July and December respectively, 2011/2012 fiscal year.
N

VOLUME NO. 4 (2014), ISSUE NO. 06 (JUNE) ISSN 2231-5756
INTERNATIONAL JOURNAL OF RESEARCH IN COMMERCE, IT & MANAGEMENT A Monthly Double-Blind Peer Reviewed (Refereed/Juried) Open Access International e-Journal - Included in the International Serial Directories
http://ijrcm.org.in/
47
FIGURE 1: PLANNED AND ACTUAL PRODUCTION (from July 2011 to June, 2012)
(Source: Author’s analysis from ATSC Textile Firm. 2011/2012 production reports)
3. MAINTENANCE SYSTEM OF ATSC TEXTILE MANUFACTURING FIRM As the country is having high demand of textile products, enhancing the performance of the company through implementing well developed and organized maintenance system will not only help the company to have efficient way of maintaining its different machineries but also it contributes to the improvement of the productivity and quality of its products supplied to garment manufacturing firms. Furthermore, it enables the company to keep the level of spare parts in stock at a minimum level for effective maintenance and for savings of foreign currency. Hence, this study aims at addressing and improving the maintenance system of the company to clearly scrutinize the hidden factors, which hinder the capacity of the company. The study has focused on weaving machines breakdown and the maintenance activities performed in the weaving shed. There are so many reasons for machine breakdowns and all of these problems are investigated in this study. The machinery that is failed may be out of function for a long period of time attributable to shortage of spare parts, poor controlling system and reporting system prevailing in the industry. The observations and the interview with the production manager of ATSC Textile Manufacturing Firm has indicated that the company is following traditional type of maintenance system. Traditional maintenance is re-active rather than pro-active, ad-hoc and essentially costly. Reliability works focuses on a pro-active and structured program, meaning less downtime, higher productivity and improvement of bottom line. The traditional maintenance approach cannot meet the needs of today’s dynamic business environment. Traditional maintenance concepts assume that failures are a fact of life, or that they can be prevented through regular preventive maintenance regimes. The traditional maintenance approach can also introduce failures of their own (MIF: Maintenance Induced Failure) due to training or procedure problems. In these scenarios, it is not uncommon to find that fixing breakdowns consumes a disproportionate quantity of budgetary resources and little is left over for effective preventive maintenance activities, or continuous improvements. Traditional maintenance approach is characterized by almost total reliance upon the "mechanic" for all actions. It is the old basic craftsman approach to maintenance. In other words, the company is implementing the logic of “run-to-failure management system” and this is simple and straightforward. When a machine breaks down ... fix it. This means “If it is not broke, don’t fix it” method of maintaining company’s machinery has been a major part of company maintenance operations. The company using run-to failure management does not spend any money on maintenance until a machine or system fails to operate. Run-to-failure is a reactive management technique that waits for machine or equipment failure before any maintenance action is taken. It is also the most expensive method of maintenance management. Therefore, the maintenance cost after the breakdown is very high. The company has a maintenance department. The maintenance staff of the department uses a reactive maintenance methods or run- to- failure and waits until the failure of the machines. There is no procedure manual for maintenance. The maintenance personnel just changes the items which failed by the operation after the failure occurs. There is no analysis done to find the causes and the effect of the failure. It is necessary to consider some statistics of actual maintenance performance in ATSC Textile Manufacturing Firm. The data and information has been collected in the fiscal year of 2011/2012. Table 1 indicates the ranges of maintenance costs in various months expressed as a percentage of the total manufacturing costs. The lowest band is around 3.46 % in October and the highest averages 51.36 % in May of the same fiscal year. And the expenditure on maintenance in ATSC Textile Manufacturing Firm has been estimated as 9.13 percent of total turnover; with a total annual spend of Birr 3,454,235. This expenditure is high (almost doubled) as compare to European countries, (like UK = 5.0%, Italy = 5.1%, France = 4.0%).
TABLE 1: ATSC MAINTENANCE EXPENDITURE
Month Total expense (Birr) Maintenance expense(Birr) Percent
July 6,058,974 386,107 6.37 % August 1,105,036 116,717 10.56 % September 2,670,350 133,570 5.00 % October 4,341,143 150,044 3.46 % November 2,224,384 190,339 8.56 % December 4,280,035 319,177 7.46 % January 5,381,756 313,735 5.83 % February 2,941,911 185,409 6.30 % March 3,351,115 454,368 13.56 % April 2,642,289 307,862 11.65 % May 1,468,181 754,099 51.36 % June 1,376,093 142,808 10.38 %
Total 37,841,267 3,454,235 9.13 %
(Source: Author’s analysis from ATSC Firm data)
June
May
April
March
February
January
December
November
October
September
August
July
Planned Production Actual Production
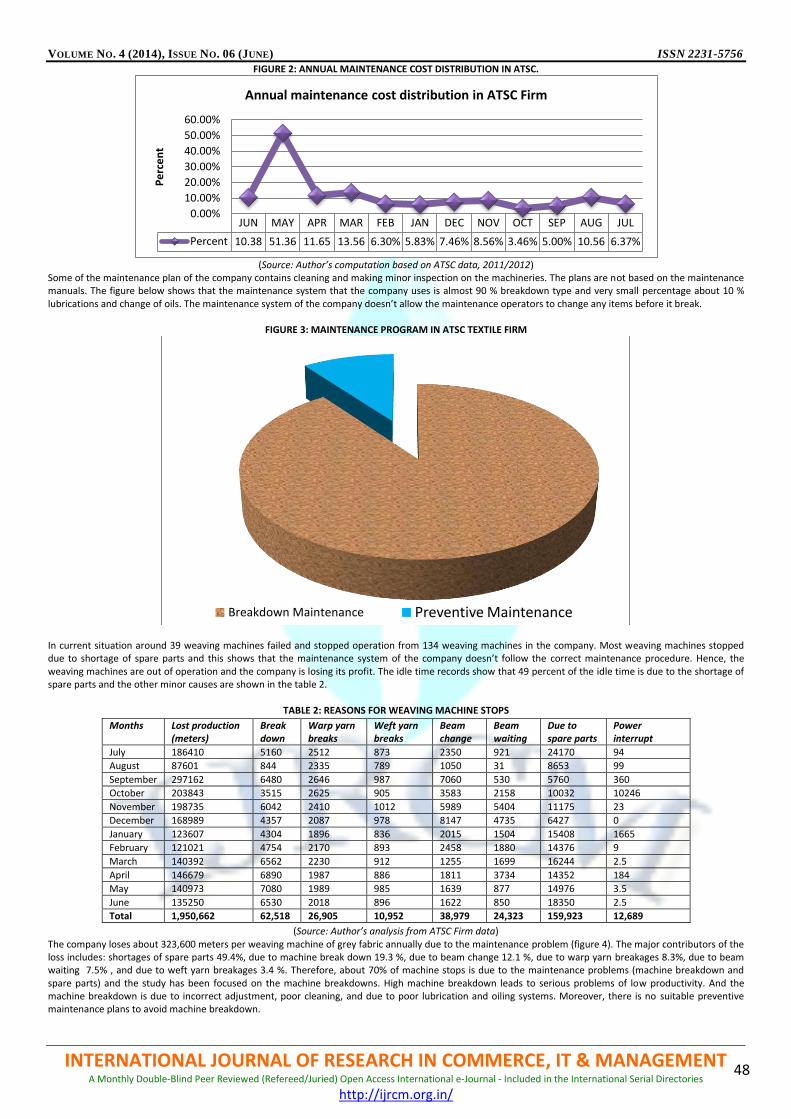
VOLUME NO. 4 (2014), ISSUE NO. 06 (JUNE) ISSN 2231-5756
INTERNATIONAL JOURNAL OF RESEARCH IN COMMERCE, IT & MANAGEMENT A Monthly Double-Blind Peer Reviewed (Refereed/Juried) Open Access International e-Journal - Included in the International Serial Directories
http://ijrcm.org.in/
48
FIGURE 2: ANNUAL MAINTENANCE COST DISTRIBUTION IN ATSC.
(Source: Author’s computation based on ATSC data, 2011/2012)
Some of the maintenance plan of the company contains cleaning and making minor inspection on the machineries. The plans are not based on the maintenance manuals. The figure below shows that the maintenance system that the company uses is almost 90 % breakdown type and very small percentage about 10 % lubrications and change of oils. The maintenance system of the company doesn’t allow the maintenance operators to change any items before it break.
FIGURE 3: MAINTENANCE PROGRAM IN ATSC TEXTILE FIRM
In current situation around 39 weaving machines failed and stopped operation from 134 weaving machines in the company. Most weaving machines stopped due to shortage of spare parts and this shows that the maintenance system of the company doesn’t follow the correct maintenance procedure. Hence, the weaving machines are out of operation and the company is losing its profit. The idle time records show that 49 percent of the idle time is due to the shortage of spare parts and the other minor causes are shown in the table 2.
TABLE 2: REASONS FOR WEAVING MACHINE STOPS
(Source: Author’s analysis from ATSC Firm data) The company loses about 323,600 meters per weaving machine of grey fabric annually due to the maintenance problem (figure 4). The major contributors of the loss includes: shortages of spare parts 49.4%, due to machine break down 19.3 %, due to beam change 12.1 %, due to warp yarn breakages 8.3%, due to beam waiting 7.5% , and due to weft yarn breakages 3.4 %. Therefore, about 70% of machine stops is due to the maintenance problems (machine breakdown and spare parts) and the study has been focused on the machine breakdowns. High machine breakdown leads to serious problems of low productivity. And the machine breakdown is due to incorrect adjustment, poor cleaning, and due to poor lubrication and oiling systems. Moreover, there is no suitable preventive maintenance plans to avoid machine breakdown.
JUN MAY APR MAR FEB JAN DEC NOV OCT SEP AUG JUL
Percent 10.38 51.36 11.65 13.56 6.30% 5.83% 7.46% 8.56% 3.46% 5.00% 10.56 6.37%
0.00%
10.00%
20.00%
30.00%
40.00%
50.00%
60.00%
Pe
rce
nt
Annual maintenance cost distribution in ATSC Firm
Breakdown Maintenance Preventive Maintenance
Months Lost production (meters)
Break down
Warp yarn breaks
Weft yarn breaks
Beam change
Beam waiting
Due to spare parts
Power interrupt
July 186410 5160 2512 873 2350 921 24170 94
August 87601 844 2335 789 1050 31 8653 99
September 297162 6480 2646 987 7060 530 5760 360
October 203843 3515 2625 905 3583 2158 10032 10246
November 198735 6042 2410 1012 5989 5404 11175 23
December 168989 4357 2087 978 8147 4735 6427 0
January 123607 4304 1896 836 2015 1504 15408 1665
February 121021 4754 2170 893 2458 1880 14376 9
March 140392 6562 2230 912 1255 1699 16244 2.5
April 146679 6890 1987 886 1811 3734 14352 184
May 140973 7080 1989 985 1639 877 14976 3.5
June 135250 6530 2018 896 1622 850 18350 2.5
Total 1,950,662 62,518 26,905 10,952 38,979 24,323 159,923 12,689
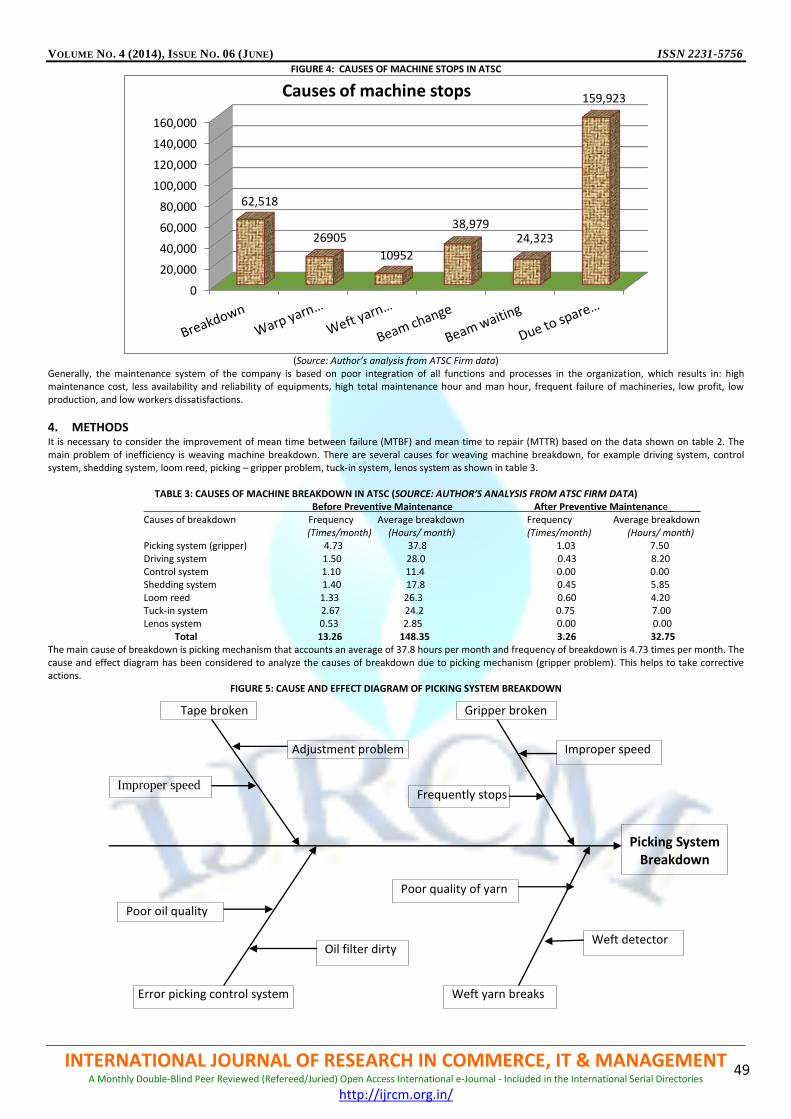
VOLUME NO. 4 (2014), ISSUE NO. 06 (JUNE) ISSN 2231-5756
INTERNATIONAL JOURNAL OF RESEARCH IN COMMERCE, IT & MANAGEMENT A Monthly Double-Blind Peer Reviewed (Refereed/Juried) Open Access International e-Journal - Included in the International Serial Directories
http://ijrcm.org.in/
49
FIGURE 4: CAUSES OF MACHINE STOPS IN ATSC
(Source: Author’s analysis from ATSC Firm data)
Generally, the maintenance system of the company is based on poor integration of all functions and processes in the organization, which results in: high maintenance cost, less availability and reliability of equipments, high total maintenance hour and man hour, frequent failure of machineries, low profit, low production, and low workers dissatisfactions.
4. METHODS It is necessary to consider the improvement of mean time between failure (MTBF) and mean time to repair (MTTR) based on the data shown on table 2. The main problem of inefficiency is weaving machine breakdown. There are several causes for weaving machine breakdown, for example driving system, control system, shedding system, loom reed, picking – gripper problem, tuck-in system, lenos system as shown in table 3.
TABLE 3: CAUSES OF MACHINE BREAKDOWN IN ATSC (SOURCE: AUTHOR’S ANALYSIS FROM ATSC FIRM DATA) Before Preventive Maintenance After Preventive Maintenance_ __ Causes of breakdown Frequency Average breakdown Frequency Average breakdown (Times/month) (Hours/ month) (Times/month) (Hours/ month) Picking system (gripper) 4.73 37.8 1.03 7.50 Driving system 1.50 28.0 0.43 8.20 Control system 1.10 11.4 0.00 0.00 Shedding system 1.40 17.8 0.45 5.85 Loom reed 1.33 26.3 0.60 4.20 Tuck-in system 2.67 24.2 0.75 7.00 Lenos system 0.53 2.85 0.00 0.00 Total 13.26 148.35 3.26 32.75
The main cause of breakdown is picking mechanism that accounts an average of 37.8 hours per month and frequency of breakdown is 4.73 times per month. The cause and effect diagram has been considered to analyze the causes of breakdown due to picking mechanism (gripper problem). This helps to take corrective actions.
FIGURE 5: CAUSE AND EFFECT DIAGRAM OF PICKING SYSTEM BREAKDOWN
0
20,000
40,000
60,000
80,000
100,000
120,000
140,000
160,000
62,518
26905
10952
38,979 24,323
159,923 Causes of machine stops
Picking System Breakdown
Gripper broken
Tape broken
Weft yarn breaks
Error picking control system
Frequently stops
Poor quality of yarn
Weft detector
Adjustment problem
Oil filter dirty
Improper speed
Poor oil quality
Improper speed

VOLUME NO. 4 (2014), ISSUE NO. 06 (JUNE) ISSN 2231-5756
INTERNATIONAL JOURNAL OF RESEARCH IN COMMERCE, IT & MANAGEMENT A Monthly Double-Blind Peer Reviewed (Refereed/Juried) Open Access International e-Journal - Included in the International Serial Directories
http://ijrcm.org.in/
50
5. DISCUSSION After the information of machine breakdown was studied and analyzed with cause and effect diagram, the maintenance plan is set as a daily, weekly, and monthly maintenance. Daily maintenance composes of cleaning, lubrication and adjustment plans. By working with maintenance plan, the average production output during 2012 fiscal year (September, October, and November) was 299,545 meters/machine. Before planned maintenance, it was 160,794 meters/machine and the output increased up to nearly 86.1 % to meet the target. The results of comparing the machine performance before and after preventive maintenance are as follow. It was found that the weaving machine availability was 91.81% or increased by 28.9% while the percentage of machine breakdown was decreased to 62.91%. In contrast, mean time between failures: MTBF was increased to 122.70 hours/time while lost of machine breakdown was decreased 6.5%. Mean time to repair: MTTR was decrease to 10.05 hours/time and average of machine breakdown/month was decreased from 148.35 hours/month to 32.75 hours/month. Then, the efficiency of production before and after Preventive maintenance was compared. Production was more effective as shown by the increase of average efficiency to 138,571 meters/month/machine.
6. CONCLUSION A preventive maintenance technique has utilized to improve the performance efficiency of machine in this study. As the information obtained from this study, machine breakdown times are analyzed. The data presented above shows many causes of system breakdowns. Due to the productivity improvement, preventive maintenance programs could be done for the higher machine capacity utilization and save the ATSC Textile manufacturing firm cost.
7. RECOMMENDATIONS Based on the analysis and discussions done so far, the solutions of this study improvement have been summarized as follows: 1) Instructor’s manual for setup the balance shedding was necessary, 2) Daily maintenance inspection should set and used, 3) Well-trained operators are necessary for understanding the importance of the daily lubrication of parts and cleaning weaving machines, 4) It is necessary to set the weekly changing spare parts plan for each weaving machines, 5) Plan the annual lubrication oil changing and check the lubrication systems every two months, 6) Inspection manual for setup the weaving machine.
REFERENCES 1. B.S Dhillon, (2002), “Engineering Maintenance – A modern approach”, CRC press, London, UK. 2. B.S Dhillon, (2006), “Maintainability, Maintenance, and Reliability for Engineers”, Taylor and Francis, New York. 3. Gaither, N. and Fraizer, G. (1999), “Production Operations Management”, 8th ed, SW college, USA. 4. Paul, D. Tomlingson, (1993), «Effective Maintenance », USA. 5. Stevenson, W.J. , (1999), “Production Operations Management”, 6th ed, Boston McGraw.

VOLUME NO. 4 (2014), ISSUE NO. 06 (JUNE) ISSN 2231-5756
INTERNATIONAL JOURNAL OF RESEARCH IN COMMERCE, IT & MANAGEMENT A Monthly Double-Blind Peer Reviewed (Refereed/Juried) Open Access International e-Journal - Included in the International Serial Directories
http://ijrcm.org.in/
51
A STUDY OF FACTORS RELATED TO SUCCESS & FAILURE OF ENTREPRENEURS IN SMALL SCALE INDUSTRIES WITH IMPORTANCE ON THEIR LEVEL OF EDUCATION AND TRAINING
DEEPAK KUMAR ASST. PROFESSOR
DEPARTMENT OF MANAGEMENT DS INSTITUTE OF TECHNOLOGY & MANAGEMENT
GHAZIABAD
ABSTRACT This paper explore the determinants of the business long & short-term success and failure of small scale enterprises/businesses. Entrepreneurs & small firm success and failure have been the subject of wide research. It is important to understand the external, internal, & motivational factors that responsible for business start-up, the obstacles faced during the starting and continue the business & advice 0r help available to entrepreneurs. The aim of this paper is to explain the main factors are related to success & failure of entrepreneurs in small scale industries/business in local area of Muradnagar & Modinagar (NCR), India, and Based on a random sampling of more than 10 enterprises marked as successful & failures are selected. The collected data is based on the triangulation method (i.e. interview, observation and questionnaire).
KEYWORDS Entrepreneurs, Enterprises, motivational factors, Questionnaire and Small scale industries.
1. INTRODUCTION mall businesses can be a path for both entrepreneurs introducing new product & processes that change the industry for the peoples who simply run their business for living. During the last decades of the century, small businesses were both a way for entrepreneurship & a source of employment and income. In order to develop a theoretical framework for this study focused on some important factors. Based on the review of literature, theories for
total quality management, entrepreneur theories, & our explorative interview with knowledgeable managerial staff members & entrepreneurs. And design a framework (See figure 1). There are so many factors, which influence the formation of new business venture & its subsequent success/failure. These include internal factors (such as: Personalities of entrepreneurs, their motivation, taking risk, efforts, tolerance for pursuing, lack of training and development etc.) & external factors (Such as: Economic & infrastructure conditions, market information, inflation, supply & demand for products and services, trade regulation, banks system, skilled personnel, and government policies etc). Mainly, these two factors together with start-up function influence the entrepreneur’s decision to start a business. Year of a new entrepreneur is critical level in determining the success/failure of new business. At this level entrepreneurs abilities to compromise the internal & external factors to make better organization & structured for his/her business. If they could make a reasonable compromise, they will successfully continue their business.
FIGURE 1: DESIGNED FRAMEWORK OF STUDY
2. OBJECTIVE OF THE STUDY The main objective of the study is to know about the factors that responsible for the success/failure of any small business/small scale enterprises. How the training and education helps to make any business success, most important, the human resource department of any enterprise plays an important/precious role for the business status, image and goodwill, the Human resource department analysis the need of training and education for the employees time to time with in the enterprises or organization. In small business there is a lack/absence of HR department that decide or plan the training and education for the employees time to time. This is the most important question, why some of the entrepreneurs get success and others are failed to continue their business/enterprise after a short period. The main purpose of this research is that, to know how human resource helps to make a business successful.
S
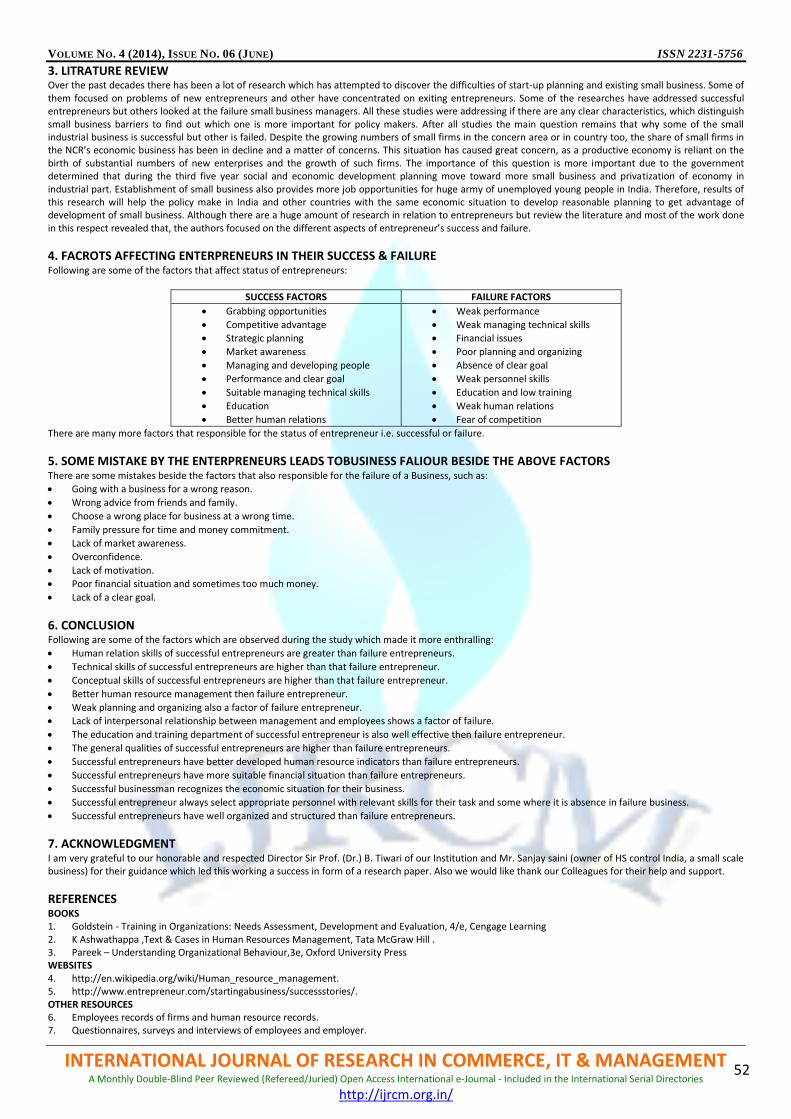
VOLUME NO. 4 (2014), ISSUE NO. 06 (JUNE) ISSN 2231-5756
INTERNATIONAL JOURNAL OF RESEARCH IN COMMERCE, IT & MANAGEMENT A Monthly Double-Blind Peer Reviewed (Refereed/Juried) Open Access International e-Journal - Included in the International Serial Directories
http://ijrcm.org.in/
52
3. LITRATURE REVIEW Over the past decades there has been a lot of research which has attempted to discover the difficulties of start-up planning and existing small business. Some of them focused on problems of new entrepreneurs and other have concentrated on exiting entrepreneurs. Some of the researches have addressed successful entrepreneurs but others looked at the failure small business managers. All these studies were addressing if there are any clear characteristics, which distinguish small business barriers to find out which one is more important for policy makers. After all studies the main question remains that why some of the small industrial business is successful but other is failed. Despite the growing numbers of small firms in the concern area or in country too, the share of small firms in the NCR’s economic business has been in decline and a matter of concerns. This situation has caused great concern, as a productive economy is reliant on the birth of substantial numbers of new enterprises and the growth of such firms. The importance of this question is more important due to the government determined that during the third five year social and economic development planning move toward more small business and privatization of economy in industrial part. Establishment of small business also provides more job opportunities for huge army of unemployed young people in India. Therefore, results of this research will help the policy make in India and other countries with the same economic situation to develop reasonable planning to get advantage of development of small business. Although there are a huge amount of research in relation to entrepreneurs but review the literature and most of the work done in this respect revealed that, the authors focused on the different aspects of entrepreneur’s success and failure.
4. FACROTS AFFECTING ENTERPRENEURS IN THEIR SUCCESS & FAILURE Following are some of the factors that affect status of entrepreneurs:
SUCCESS FACTORS FAILURE FACTORS
Grabbing opportunities
Competitive advantage
Strategic planning
Market awareness
Managing and developing people
Performance and clear goal
Suitable managing technical skills
Education
Better human relations
Weak performance
Weak managing technical skills
Financial issues
Poor planning and organizing
Absence of clear goal
Weak personnel skills
Education and low training
Weak human relations
Fear of competition
There are many more factors that responsible for the status of entrepreneur i.e. successful or failure.
5. SOME MISTAKE BY THE ENTERPRENEURS LEADS TOBUSINESS FALIOUR BESIDE THE ABOVE FACTORS There are some mistakes beside the factors that also responsible for the failure of a Business, such as:
Going with a business for a wrong reason.
Wrong advice from friends and family.
Choose a wrong place for business at a wrong time.
Family pressure for time and money commitment.
Lack of market awareness.
Overconfidence.
Lack of motivation.
Poor financial situation and sometimes too much money.
Lack of a clear goal.
6. CONCLUSION Following are some of the factors which are observed during the study which made it more enthralling:
Human relation skills of successful entrepreneurs are greater than failure entrepreneurs.
Technical skills of successful entrepreneurs are higher than that failure entrepreneur.
Conceptual skills of successful entrepreneurs are higher than that failure entrepreneur.
Better human resource management then failure entrepreneur.
Weak planning and organizing also a factor of failure entrepreneur.
Lack of interpersonal relationship between management and employees shows a factor of failure.
The education and training department of successful entrepreneur is also well effective then failure entrepreneur.
The general qualities of successful entrepreneurs are higher than failure entrepreneurs.
Successful entrepreneurs have better developed human resource indicators than failure entrepreneurs.
Successful entrepreneurs have more suitable financial situation than failure entrepreneurs.
Successful businessman recognizes the economic situation for their business.
Successful entrepreneur always select appropriate personnel with relevant skills for their task and some where it is absence in failure business.
Successful entrepreneurs have well organized and structured than failure entrepreneurs.
7. ACKNOWLEDGMENT I am very grateful to our honorable and respected Director Sir Prof. (Dr.) B. Tiwari of our Institution and Mr. Sanjay saini (owner of HS control India, a small scale business) for their guidance which led this working a success in form of a research paper. Also we would like thank our Colleagues for their help and support.
REFERENCES BOOKS 1. Goldstein - Training in Organizations: Needs Assessment, Development and Evaluation, 4/e, Cengage Learning 2. K Ashwathappa ,Text & Cases in Human Resources Management, Tata McGraw Hill . 3. Pareek – Understanding Organizational Behaviour,3e, Oxford University Press WEBSITES 4. http://en.wikipedia.org/wiki/Human_resource_management. 5. http://www.entrepreneur.com/startingabusiness/successstories/. OTHER RESOURCES 6. Employees records of firms and human resource records. 7. Questionnaires, surveys and interviews of employees and employer.

VOLUME NO. 4 (2014), ISSUE NO. 06 (JUNE) ISSN 2231-5756
INTERNATIONAL JOURNAL OF RESEARCH IN COMMERCE, IT & MANAGEMENT A Monthly Double-Blind Peer Reviewed (Refereed/Juried) Open Access International e-Journal - Included in the International Serial Directories
http://ijrcm.org.in/
53
MAJOR USES AND PREFERRED PAYMENT SYSTEMS IN NIGERIA: APPLICATION OF WORD OF MOUTH COMMUNICATION IN PROMOTING CASHLESS POLICY OF CBN
CLEMENT IKENNA OKEKE ASSOCIATE PROFESSOR
SCHOOL OF MANAGEMENT SCIENCES NATIONAL OPEN UNIVERSITY OF NIGERIA
LAGOS
ABSTRACT Given the imperative of developing an effective national payments system that will drive economic growth and development and in furtherance of the cashless policy of Central Bank of Nigeria, this study sought to establish how Word of Mouth Communication can facilitate the transition from a cash-based to an e-payment dominant payment system in Nigeria. Towards this end, 282 respondents who are aware of the three payment systems in operation in Nigeria were surveyed to determine their preferred payment system, what they use the payment systems to do mostly, why they are not using cheque and e-payment systems and the payment systems they will likely recommend to their friends and relations. Based on analyzed data, the study came to the conclusion that the respondents are satisfied with e-payment system, use it mostly for transfer of funds, payment for goods and services and payment for utilities, and will mostly recommend e-payment system to their friends and relations. For effective and cost efficient achievement of cashless policy, the study recommended the use of, product advocates (using word of mouth communication), influence marketing/marketers (using word of mouth marketing) and application of ICT to facilitate word of mouth marketing (using electronic word of mouth).
KEYWORDS Cashless Policy, Electronic Word of Mouth (EWOM), Product Advocates, Word of Mouth (WOM) Communication and Word of Mouth Marketing (WOMM).
1.0 INTRODUCTION keke (2013), Ovia (2013) and FDCL (2012) have all demonstrated the importance of payments systems in modern economies. Research according to Odior and Banuso (2013) has shown that 10% increase in the efficiency of the national payments system leads to 1% increase in the GDP ceteris paribus. An efficient payments system will depend less on cash, and has great potential to grow the national economy by: Increasing the velocity of money, this
in turn promotes economic growth; Reducing the volume of cash kept outside the banking system; Providing banks with more liquidity for lending to the needy sectors of the economy, at attractive rates; Reducing corruption; and Reducing overall cost of banking and payments, thereby reducing bank charges. Perhaps because of the demonstrated role of an effective and efficient payment system, particularly one that is less cash driven and predominantly electronic driven, the Central Bank of Nigeria in 2012 introduced cashless policy in Nigeria. It sought to introduce a new policy on cash-based transactions which stipulates a ‘cash handling charge’ on daily cash withdrawals or cash deposits that exceed N500, 000 for Individuals and N3, 000,000 for corporate bodies. The new policy on cash-based transactions (withdrawals & deposits) in banks, aims at reducing (not eliminating) the amount of physical cash (coins and notes) circulating in the economy, and encouraging more electronic-based transactions (payments for goods, services, transfers, etc.). The cashless policy was introduced to among other objectives: 1. Drive development and modernization of our payment system in line with Nigeria’s vision 2020 goal of being amongst the top 20 economies by the year
2020. An efficient and modern payment system is positively correlated with economic development, and is a key enabler for economic growth; 2. Reduce the cost of banking services (including cost of credit) and drive financial inclusion by providing more efficient transaction options and greater reach;
and 3. Improve the effectiveness of monetary policy in managing inflation and driving economic growth. In addition, the cash policy aims to curb some of the negative consequences associated with the high usage of physical cash in the economy, including:
High cost of cash: There is a high cost of cash along the value chain - from the CBN & the banks, to corporations and traders; everyone bears the high costs associated with volume cash handling.
High risk of using cash: Cash encourages robberies and other cash-related crimes. It also can lead to financial loss in the case of fire and flooding incidents.
High subsidy: CBN analysis showed that only 10percent of daily banking transactions are above 150k, but the 10percent account for majority of the high value transactions. This suggests that the entire banking population subsidizes the costs that the tiny minority 10percent incurs in terms of high cash usage.
Informal Economy: High cash usage results in a lot of money outside the formal economy, thus limiting the effectiveness of monetary policy in managing inflation and encouraging economic growth.
Inefficiency & Corruption: High cash usage enables corruption, leakages and money laundering, amongst other cash-related fraudulent activities. A variety of benefits are expected to be derived by various stakeholders from an increased utilization of e-payment systems. These include:
For Consumers: Increased convenience; more service options; reduced risk of cash-related crimes; cheaper access to (out-of-branch) banking services and access to credit.
For Corporations: Faster access to capital; reduced revenue leakage; and reduced cash handling costs.
For Government: Increased tax collections; greater financial inclusion; increased economic development; increased tax collections; greater financial inclusion; and increased economic development.
The cashless policy has been introduced on pilot basis first in Lagos state (2012) and now in six states of Abia, Anambra, Kano, Ogun, Rivers and Federal Capital Territory (FCT), Abuja(October 1, 2013). It is planned that a national roll out of the policy will commence in July 2014. This effort epitomizes the concerted effort to transit the Nigerian economy from a cash-based to an e-payment options system. To facilitate the acceptance, adoption and preference of the e-payment systems platforms in Nigeria, the CBN has been running a set of targeted stakeholder engagement sessions as a first stage of its planned communication campaign. These have targeted key groups that will be most impacted by the cash policy, with the objective of creating awareness and providing an opportunity for them to raise issues and concerns. The stakeholders so far have included markets, associations, professional bodies, etc. These stakeholder sessions were concluded in November 2011.CBN is now implementing the phase 2 of the communication strategy, which is the Mass communication campaign, leveraging the inputs derived during the stakeholder sessions. The objective of this paper is to establish the rationale and cost effective way of using Nigerians who have tried, are satisfied and accepted e-payment as the preferred payment system option as apostles in spreading the goodness of the system and getting their friends and relations to try, accept and also prefer it as the payment system of choice in their financial transactions. This will, supplement the efforts and not replace it, of CBN in promoting cashless policy and seeing that e-payment becomes the dominant payment system in Nigeria. The key research questions that the study will seek to provide answers to are: 1. Are people engaging in financial transactions aware of the three payment systems available?
O

VOLUME NO. 4 (2014), ISSUE NO. 06 (JUNE) ISSN 2231-5756
INTERNATIONAL JOURNAL OF RESEARCH IN COMMERCE, IT & MANAGEMENT A Monthly Double-Blind Peer Reviewed (Refereed/Juried) Open Access International e-Journal - Included in the International Serial Directories
http://ijrcm.org.in/
54
2. What are the payment systems that are being presently used? 3. What are the major reasons for people not using some payment systems? 4. What are the major uses to which payment systems are being applied? 5. How do users of payment systems rank them? 6. What are the payment systems that most people will recommend and not recommend for use by their friends and relations?
2.0 LITERATURE REVIEW Word of Mouth (WOM), is the passing of information from person to person by oral communication, which could be as simple as telling someone the time of day. Traditionally, oral stories were committed to memory and then passed from generation to generation. However, in literate societies, written and televised media have largely replaced this method of communicating local, family, and cultural histories. Oral storytelling remains the dominant medium of learning in some countries with low literacy rates (http://www.thefreedictionary.com/by+word+of+mouth). In Marketing, word-of-mouth communication (WOM) involves the passing of information between a non-commercial communicator (i.e. someone who is not rewarded) and a receiver concerning a brand, a product, or a service (Dichter, 1966). When WOM is mediated through electronic means, the resulting Electronic Word Of Mouth (eWoM) refers to any statement consumers share via the Internet (e.g., web sites, social networks, instant messages, news feeds) about a product, service, brand, or company (Kietzmann and Canhoto, 2013). If the sender of word-of-mouth communication is rewarded then this process is referred to as word-of-mouth marketing, which relies on the added credibility of person-to-person communication, a personal recommendation (http://www.entrepreneur.com/encyclopedia/term/82660.html). Using WOM as an opposing force to commercially motivated word-of-mouth marketing has been coined Pro-consumer WOM (Lang and Lawson, 2013). Researchers have formulated a series of recommendations for how nonprofits and public sector organizations can utilize Pro-consumer WOM effectively. WOM has been researched for many years and as a result much is known about what drives WOM (e.g. customer satisfaction, trust and brand commitment) and its far-reaching consequences (e.g. affective/emotional, cognitive, and behavioral) for both consumers and organizations (Lang and Lawson, 2013). WOM's effectiveness as an information source for consumers can be broken down into two factors: WOM's reach and WOM's impact. These two factors are in turn explained by 13 other drivers (Lang and Lawson, 2013)
1. age of the brand in the marketplace 2. type of good 3. complexity 4. knowledge about a brand 5. differentiation 6. relevance of a brand to a broad audience 7. quality - esteem given to a brand 8. premium 9. visibility 10. excitement 11. satisfaction 12. perceived risk 13. involvement Word-of-mouth marketing implies that an organization takes active steps to encourage WOM (e.g. offering a reward to the WOM sender), whereas normal WOM implies that the sender is not rewarded. Word-of-mouth marketing, which encompasses a variety of subcategories, including buzz, blog, viral, grassroots, brand advocates, cause influencers and social media marketing, as well as ambassador programs, work with consumer-generated media and more, can be highly valued by product, social media and performance marketers. Pro-consumer WOM has been suggested to act as counter balance to commercially motivated word-of-mouth marketing (Lang and Lawson, 2013). Because of the personal nature of the communications between individuals, it is believed that they are more credible (Keakopa, 1998). Research points to individuals being more inclined to believe WOMM than more formal forms of promotion methods; the listener tends to believe that the communicator is being honest and doesn't have an ulterior motive (i.e. the receiver believes that the sender is not rewarded for engaging in WOM) (Keakopa, 1998: Grewal, Cline and Davies, 2003). Word-of-mouth depends on the extent of customer satisfaction with the product or service (Stach, and Serenko, 2010) and on the degree of its perceived value (Turel, Serenko,and Bontis, 2010). To promote and manage word-of-mouth communications, marketers use publicity techniques as well as viral marketing methods to achieve desired behavioral response. Companies can focus on brand advocates, the people who proactively recommend their favorite brands and products online and offline without being paid to do so (http://www.reuters.com/article/2010/11/08/us-vcj-zuberance-idUSTRE6A731G20101108). Influencer marketing is also increasingly used to seed WOMM by targeting key individuals who have authority and many personal connections. Marketers place significant value on positive word-of-mouth, which is traditionally achieved by creating products, services and customer experiences that generate conversation-worthy "buzz" naturally (Word of mouth advertising: Marketing-made-simple.com). The relatively new practice of word-of-mouth marketing attempts to inject positive "buzz" into conversations directly. While marketers have always hoped to achieve positive word-of-mouth, intentional marketing relying on such techniques is subject to regulation in some jurisdictions. For example, in the United States, deliberate efforts to generate beneficial consumer conversations must be transparent and honestly conducted in order to meet the requirements of Section 5 of the Federal Trade Commission Act that prohibits "unfair or deceptive acts or practices" (Laws Enforced by the Federal Trade). Commission To help marketers understand the difference between legitimate and unfair practices, a number of professional organizations have put forward recommendations for ethical conduct (Word of Mouth Marketing Association Ethics Code-http://www.womma.org/ethics/code/read/) and (American Marketing Association Best Practices for Word-of-Mouth Communications-http://www.marketing power.com/content1943490.php). A Nielsen global survey in 2013 found that word-of-mouth is not only the most trusted source of consumer information, but it is the most likely to be acted upon (http://www.idiro.com/2013/09/nielsen-report-finds-that-word-of-mouth-is-the-most-trusted-source-again/). George Silverman, a psychologist, pioneered word-of-mouth marketing when he created what he called "teleconferenced peer influence groups" in order to engage physicians in dialogue about new pharmaceutical products. Silverman noticed an interesting phenomenon while conducting focus groups with physicians in the early 1970s. "One or two physicians who were having good experiences with a drug would sway an entire group of skeptics. They would even sway dissatisfied group of ex-prescribers who had had negative experiences!"(http://en.wikipedia.org/wiki/word-of-mouth_marketing#cite_note-3). Marketing buzz or simply "buzz" is a term used in word-of-mouth marketing—the interaction of consumers and users of a product or service serve to amplify the original marketing message (http://en.wikipedia.org/wiki/word-of-mouth_marketing#cite_note-thomas-8). Some describe buzz as a form of hype among consumers (http://en.wikipedia.org/wiki/word-of-mouth_marketing#cite_note-hbr-9) a vague but positive association, excitement, or anticipation about a product or service. Positive "buzz" is often a goal of viral marketing, public relations, and of advertising on Web 2.0 media. The term refers both to the execution of the marketing technique, and the resulting goodwill that is created. Examples of products with strong marketing buzz upon introduction were Harry Potter, the Volkswagen New Beetle, Pokémon, Beanie Babies, and the Blair Witch Project (http://en.wikipedia.org/wiki/word-of-mouth_marketing#cite_note-hbr-9) Viral marketing and viral advertising are buzzwords referring to marketing techniques that use pre-existing social networks to produce increases in brand awareness or to achieve other marketing objectives (such as product sales) through self-replicating viral processes, analogous to the spread of virus or computer viruses. It can be word-of-mouth delivered or enhanced by the network effects of the Internet (http://en.wikipedia.org/wiki/word-of-mouth_marketing#cite_note-hbr-9).Viral promotions may take the form of video clips, interactive Flash games, advergames, ebooks, brandable software, images, or even text messages. The goal of marketers interested in creating successful viral marketing programs is to identify individuals with high Social

VOLUME NO. 4 (2014), ISSUE NO. 06 (JUNE) ISSN 2231-5756
INTERNATIONAL JOURNAL OF RESEARCH IN COMMERCE, IT & MANAGEMENT A Monthly Double-Blind Peer Reviewed (Refereed/Juried) Open Access International e-Journal - Included in the International Serial Directories
http://ijrcm.org.in/
55
Networking Potential (SNP) — and have a high probability of being taken by another competitor — and create viral messages that appeal to this segment of the population. The term "viral marketing" has also been used pejoratively to refer to stealth marketing campaigns—the unscrupulous use of astroturfing on-line combined with under market advertising in shopping centers to create the impression of spontaneous word-of-mouth enthusiasm (http://en.wikipedia.org/wiki/ word-of-mouth_marketing#cite_note-10). Consumers may promote brands by word-of-mouth due to social, functional, and emotional factors (http://en.wikipedia.org/wiki/word-of-mouth_marketing#cite_note-12). This research also found that while social and functional drivers are the most important for promotion via WOM online, the emotional driver pre-dominates offline. Positive word of mouth can be very useful in creating awareness and generating demand for desired products. There are two forms of word of mouth communication that can serve the need of promoting e-payment platforms in Nigeria. These are normal word of mouth communication-this relies on satisfied and willing users to become product advocates (individuals who are satisfied with the product and without inducement are willing to talk other people into buying/using the product), and Word Of Mouth Marketing that consciously induces influential individuals to talk to and convert non users to users of the product. We therefore talk of word of mouth (WOM) communication, word of mouth marketing (WOMM) and electronic word of mouth (EWOM) communication. EWOM is particularly critical in this new age of ICT and many new ways of engaging large audience and even individuals quickly, effectively and economically. All share peculiar characteristics but on the whole are effective in promoting especially new products to consumers who often are skeptical to less trusting of other forms of marketing communication.
3.0 RESEARCH METHODOLOGY The data need of this study was defined in two broad areas: first was the awareness of payment systems, determination of the ones being presently used and the preferred ones; second was establishment of the major reasons for not using cheque and e-payment systems by some, ranking of the major uses of the payment systems; and third was establishment of the payment systems that would be recommended to friends and relations. While yes and no options were used in determining the awareness of the payment systems and the ones being presently used, five factors each were listed for the reasons for not using cheque and e-payment systems and for the uses of the three payment systems. Respondents for these two issues were requested to choose the three most important factors and rank them first, second and third in order of importance. For ranking of major uses of the three payment systems, five factors of payment for goods and ser4vices, payment of utilities, transfer of funds, store of value and safe keeping were listed and respondents identified and ranked the three most important ones on a range of first, second and third. For recommendation of payment systems to friends and relations, yes or no options were made available and respondents chose as they deemed fit. The aggregate cumulative point was used in ranking the payment systems from first to third on relevant factors. The study relied on questionnaire as the survey instrument for collecting data on the ranking of payment systems based on Nigerian experience of respondents. The questionnaire listed the factors and required respondents to rank them based on their personal experience of payment systems. It became imperative therefore to select respondents from a population of highly literate and financially active Nigerians who are aware of the three payment systems obtainable in Nigeria. To meet the outlined requirements of the data collection source, the study used a population of students of Enugu State University of Technology (ESUT) Business School, located in Enugu, the capital of Enugu state in south east, Nigeria. Being an executive programme with students mostly working, drawn from all states, tribes and religions in Nigeria, the population surveyed met the requirement of financially well to do and active users of e- payment system in Nigeria. This is in line with the Grounded Theorists rule of selecting purposive samples from participants who represent the major categories of people relevant to the research (Charmaz, 2003) and (Henwood and Pidgeon, 1993). Being a lecturer on the ESUT programme facilitated access to the students and cooperation from them in completing the questionnaire. With a population of 600 students, the questionnaire was administered on all the students in MBA, MSc and PGD classes on the 14th and 15th of December, 2013. A total of 319 copies of the questionnaire were administered and retrieved within the two days. Given incompleteness’ and inconsistency in completion 37 returned questionnaire were rejected. Thus, 282 returned questionnaires were analyzed. This gave an effective response rate of 88.40%. The collected primary data were presented on tables and analyzed using frequency distribution and aggregation of points to arrive at cumulative points and enable ranking. Data were also collected and analyzed to define the profile of respondents (age, education, marital status, gender, gross annual income, and employment status, sector of the economy and operation of account with Nigerian banks).

VOLUME NO. 4 (2014), ISSUE NO. 06 (JUNE) ISSN 2231-5756
INTERNATIONAL JOURNAL OF RESEARCH IN COMMERCE, IT & MANAGEMENT A Monthly Double-Blind Peer Reviewed (Refereed/Juried) Open Access International e-Journal - Included in the International Serial Directories
http://ijrcm.org.in/
56
4.0 RESULTS AND DISCUSSION 4.1 PROFILE OF RESPONDENTS The profile of respondents is captured on Table 1 below.
TABLE 1: PROFILE OF RESPONDENTS
Category Statistics
Gender Male Female Age 20-30 years 30-40 years 40-50 years 50-60 years 60 years and above Marital Status Single Married Divorced Widowed Gross Annual Income Less than N1m N1M-N3M N3M-N5M N5M-N7M N7M-N9M N9M- N11M N11M-N13M N13M and above Employment Status Employed Unemployed Sector Of Employment Private Public Operation Of Account With Nigerian Banks Yes No Highest Educational Qualification HND/BSc PGD M.Sc/MBA/MPA PhD
177(62.77%) 105(37.23%) 42(14.89%) 165(58.51%) 45(15.96%) 27(9.57%) 03(1.06%) 73(25.89%) 201(71.28%) 4(1.42%) 4(1.42%) 54(19.15%) 111(39.36%) 63(22.34%) 27(9.58%) 6(2.13%) 3(1.06%) 2(0.71%) 1(0.36%) 267(94.68%) 15(5.32%) 119(42.20%) 163(57.80%) 282(100%) 0(0%) 177(62.77%) 33(11.70%) 69(24.47%) 03(1.06%).
Source: Field Survey, 2013. The respondents are highly educated with 62.77% having a minimum educational qualification of first degree (BSc, BA and HND. Others hold higher educational qualifications. The major age bracket of respondents was 30-40 years, accounting for 58.00%, and the least, 60 years and above with 1.06%. 62.77% of respondents are male, while 71.28% of the respondents are married, 25.89% are single and 1.42% are divorced. The major income brackets of respondents were N1M-N3M (39.36%) and N3M-N5M (22.34%) per annum. 94.68% of respondents are employed with 57.80% working in the public sector and 42.420% in the private sector. 100% of the respondents have been involved with all payment system and maintain account with banks in Nigeria. 4.2 ANALYSIS OF DATA BASED ON RESEARCH QUESTIONS
TABLE 2: AWARENESS OF CASH, CHEQUE AND E-PAYMENT OPTIONS
Payment System Yes No
Cash 282(100%) 0(0%).
Cheque 282(100%) 0(0%).
E-Payment 282(100%) 0(0%).
Source: Field Survey, 2013 Table 2 reveals that all respondents are aware of the existence of the three payment systems in Nigeria. Given that awareness will not always translate to usage, the study wanted to establish the payment systems that respondents presently use in the normal course of their financial transactions. The response is on table 3 below.
TABLE 3: PAYMENT SYSTEMS PRESENTLY BEING USED
Payment System Yes No
Cash 282(100%) 0(0%)
Cheque 145(51.42%) 137(48.58%)
E-Payment 257(91.13%) 25(8.87%).
Source: Field Survey, 2013 Table 3 reveals that all respondents presently use cash in their financial transactions. For cheque payment system, 51.42% of the respondents use it in their financial transactions while 48.58% do not use it. 91.87% of respondents use e-payment platforms in their financial transactions while only 8.87% do not use as at present. In order of usage, the payment systems are ranked in a descending order as: cash (100%), e-payment (91.13%) and cheque (51.42%). Given that some respondents are not using cheque and e-payment systems in their financial transactions, the study wanted to establish the major reasons for this. The response is on table 4 below.

VOLUME NO. 4 (2014), ISSUE NO. 06 (JUNE) ISSN 2231-5756
INTERNATIONAL JOURNAL OF RESEARCH IN COMMERCE, IT & MANAGEMENT A Monthly Double-Blind Peer Reviewed (Refereed/Juried) Open Access International e-Journal - Included in the International Serial Directories
http://ijrcm.org.in/
57
TABLE 4: MAJOR REASONS FOR NOT USING CHEQUE AND E-PAYMENT SYSTEMS
Payment System Reasons For Not Using Ranking
Cheque Availability/Reliability First
Safety Issues Second
Cost of Usage Third
Ease of Use Fourth
Usefulness Fifth
E-Payment Safety Issues First
Ease of Use Second
Cost of Usage Third
Availability/Reliability Fourth
Usefulness Fifth
Source: Field Survey, 2013 Table 4 reveals the respondents’ reasons for not using cheque payment system in their financial transactions are ranked as first (availability /reliability), second (safety issues), third (cost of usage), fourth (ease of use) and fifth (usefulness). For e-payment platforms, the reasons for not using them are ranked as: first (safety issues), second (ease of use), third (cost of usage), fourth (availability/reliability) and fifth (usefulness). Having established the payment systems that respondents use and the reasons for some of them not using cheque and e-payment systems, the study went on to identify and rank the major uses of the payment systems by the respondents. The response is presented on table 5 below.
TABLE 5: RANKING OF MAJOR USES OF CASH, CHEQUE AND E-PAYMENT SYSTEMS
Payment system Uses Frequency Cumulative points Rank
First Second Third
Cash Payment for Goods and Services 231(3)=693 18(2)=36 15(1)=15 744 First
Payment of Utilities 6(3)=18 159(2)=318 105(1)=105 441 Second
Transfer of Funds 18(3)=54 57(2)=114 60(1)=60 228 Third
Store of Value 9(3)=27 36(2)=72 42(1) =42 141 Fourth
Safe Keeping 9(3)=27 12(2)=24 60(1)=60 111 Fifth
Cheque Payment for Goods and Services 186(3)=558 24(2)=48 30(1)=30 636 First
Transfer of Funds 54(3)=162 186(2)=372 12(10=12 546 Second
Payment of Utilities 15(3)=45 33(2)=66 177(1)=177 288 Third
Safe Keeping 18(3)=54 18(2)=36 39(1)=39 129 Fourth
Store of Value 9(3)=27 21(2)=42 24(1)=24 93 Fifth
e-payment Transfer of Funds 135(3)=405 147(2)=294 9(1)=9 708 First
Payment for Goods and Services 123(3)=369 60(2)=120 48(1)=48 537 Second
Payment of Utilities 15(3)=45 48(2)=96 192(1)=192 333 Third
Safe Keeping 9(3)=27 12(2)=24 18(10=18 49 Fourth
Store of Value 0 15(2)=30 15(1)=15 45 Fifth
Source: Field Survey, 2013 Table 5 ranks the major uses of the payment systems by the respondents. It reveals the major uses for cash payment system to be: first (payment for goods and services), second (payment for utilities), third (transfer of funds), fourth (store of value0 and fifth (safe keeping). For cheque payment system, the uses were ranked as: first (payment for goods and services), second (transfer of funds), third (payment of utilities), fourth (safe keeping) and fifth (store of value). For e-payment system, the uses were ranked as: first (transfer of funds), second (payment for goods and services), third (payment of utilities), fourth (safe keeping) and fifth (store of value). The major reasons for use of payment systems based on the first three that appeared for each payment system are: first (payment for goods and services-first in two and second in one),second (transfer of funds-first in one, second in one and third in one ) and third (payment of utilities- third in two and second in one). With the uses of the payment systems established, the study wanted to determine the ranking of the payment systems from the perspective of users. The responses are presented on tables 6 and 7 below. While Table 6 presents the ranking of preferred primary payment systems, table 7 presents the ranking of the preferred secondary payment systems.
TABLE 6: RANKING OF PREFERRED PRIMARY PAYMENT SYSTEMS
Payment System Frequency(percentage) Ranking
E-Payment 219(77.66%) First
Cash 33(11.70%) Second
Cheque 30(10.64%) Third
Source: Field Survey, 2013 Table 6 reveals that e-payment system is ranked as the first preferred payment system (77.66%). It is followed by cash payment system (11.70%) as the second preferred payment system. Cheque payment system is ranked as the third preferred payment system with 10.64%.
TABLE 7: RANKING OF PREFERRED SECONDARY PAYMENT SYSTEMS
Payment System Frequency(percentage) Ranking
Cheque 177(62.77%) First
Cash 66(23.40%) Second
E-Payment 39(13.83%) Third
Source: Field Survey, 2013 Table 7 reveals the ranking of preferred secondary payment systems. Cheque is first with 62.77%, cash is second with 23.40% and e-payment is third with 13.83%. The interpretation of the preferred secondary payment systems is that of the 219 and 33 respondents that chose e-payment and cash as their first and second preferred payment system options respectively, 177(62.77%) will settle for cheque as an alternative, while 66 respondents out of the number that chose e-payment and cheque will settle for cash as an alternative. The number that will settle for e-payment as an alternative is 39 out of the 33 and 30 that chose cash and cheque respectively as their primary preferred payment system. Having established both the primary and secondary ranking of the respondents preferred payment systems, the study sought to ascertain the payment systems that the respondents will recommend to their friends and relations. The response is presented on table 8 below.

VOLUME NO. 4 (2014), ISSUE NO. 06 (JUNE) ISSN 2231-5756
INTERNATIONAL JOURNAL OF RESEARCH IN COMMERCE, IT & MANAGEMENT A Monthly Double-Blind Peer Reviewed (Refereed/Juried) Open Access International e-Journal - Included in the International Serial Directories
http://ijrcm.org.in/
58
TABLE 8: RECOMMENDATION OF CASH, CHEQUE AND E-PAYMENT PAYMENTS TO FRIENDS AND RELATIONS
Payment System Yes No
Cash 48(17.02%) 234(82.98%).
Cheque 192(68.09%) 90(31.91%).
E-Payment 255(90.43%) 27(9.57%).
Source: Field Survey, 2013. Table 8 reveals that the 255, 192 and 48 respondents will recommend e-payment system, cheque payment system and cash payment systems respectively to their friends and relations. Similarly 234, 90 and 27 respondents will not recommend cash, cheque and e-payment systems respectively to their friends and relations. 4.3 ANSWERS TO RESEARCH QUESTIONS 1) Are People Engaging in Financial Transactions Aware of the Three Payment Systems Available? All the respondents are aware of cash, cheque and e-payment systems for settlement of their financial transactions. 2) What are the Payment Systems that are Being Presently Used? The payment systems being presently used in settlement of financial transactions are in a descending order: cash (100%), e-payment (91.13%) and cheque (51.42%). 3) What Are The Major Reasons For People Not Using Some Payment Systems? The payment systems not being used by all are e-payment and cheque payment systems. The major reasons for e-payment and cheque payment systems not being used are: Safety Issues, ease of use, cost of usage, availability/reliability and usefulness for e-payment system. For cheque payment system the major reasons are availability, safety issues, cost of usage, ease of use and usefulness. 4) What are The Major Uses to Which Payment Systems Are Being Applied? Payment systems are being applied in the following uses: for cash-first (payment for goods and services), second (payment for utilities), third (transfer of funds), fourth (store of value) and fifth (safe keeping). For cheque-first (payment for goods and services), second (transfer of funds), third (payment of utilities), fourth (safe keeping) and fifth (store of value). For e-payment -first (transfer of funds), second (payment for goods and services), third (payment of utilities), fourth (safe keeping) and fifth (store of value). 5) How Do Users of Payment Systems Rank Them? The study ranked the payment systems as follows: e-payment system is ranked as the first preferred payment system with 77.66%, cash payment system is ranked as the second preferred system with 11.70% and Cheque payment system is ranked as the third preferred payment system with 10.64%. 6) What are the Payment Systems that Most People Will Recommend for Use by Their Friends and Relations? Based on analyzed data as on table 8, the payment system that will be readily recommended to friends and relations by a clear majority of respondents (255 or 90.43%) is e-payment. This is followed by cheque payment system by 192 respondents or 68.09%. 234, 90 and 27 respondents will not recommend cash, cheque and e-payment systems respectively to their friends and relations.
5.0 CONCLUSION AND RECOMMENDATIONS 5.1 CONCLUSION The findings of this study are in line with the cashless policy of CBN. They support the desire of CBN to make e-payment the dominant payment system in Nigeria while reducing the predominance of cash in financial transactions. As more people recommend e-payment system to their friends and relations, and discourage them from using cash, the policy objective of CBN will be quickly realized at no effort and cost to CBN. Using individuals as proxies in educating, informing, persuading and reminding Nigerians to go cashless is a more effective and cost efficient way of promoting the cashless policy of CBN. The challenge of marketing the CBN cashless policy therefore reduces to sustaining the satisfaction of those who have embraced it and encouraging them to spread the good news of e-payment platforms to their friends and relations. Testimonials and word of mouth promotion are convincingly more credible, cost effective and certainly more behavior changing and demand driving marketing communication strategy. 5.2 RECOMMENDATIONS Deriving from the findings and the conclusion that has been drawn by the study, the following recommendations are proffered for driving the efforts of CBN to achieve the objectives of cashless policy in Nigeria. USE OF PRODUCT ADVOCATES (WOM) Given the findings of the study that confirm that many users of e-payment are satisfied and willing to recommend it to friends and relations, it can be concluded that many potential e-payment advocates exist. Most of the conversions from non e-payment platform users to active users may have been through the efforts of these unpaid salesmen. To make their efforts more effective and beneficial, it may be necessary to find out from new users how they came to become users and profile identified advocates and offer technical assistance that will make them better missionary salesmen. USE OF INFLUENCER MARKETING/MARKETERS (WOMM) Opinion leaders, celebrities, and other influential personalities who have used e-payment platforms and are satisfied and willing to openly associate with them, share their experiences and ultimately inform, educate, persuade and remind prospective users should be engaged and supported to lead campaigns aimed at converting the doubting Thomas’s to become active users of e-payment platforms. They will do this not through formal marketing communication channels but through word of mouth communication in the normal cause of their daily activities. The challenge will be in determining the number of converts traceable to their direct efforts and their consequent compensation. It is advised that a study be commissioned to make appropriate recommendations for instituting this scheme. APPLICATION OF ICT TO FACILITATE WOMM (EWOM) Especially for the younger generation that is ICT savvy, known and influential personalities who have authority and many personal connections should be recruited to reach them through modern ICT platforms like Facebook, twitter, and other social media and initiate conversations that will expose them to the benefits of e-payment platforms and convince them to make a switch from cash and cheque payment systems.
6.0 LIMITATIONS OF THE STUDY AND FURTHER RESEARCH The major limitation of the study was the segment of the population studied. The class of respondents represented the educated elite. With a minimum educational qualification of a first degree, this is an extreme segment of Nigerian population. Given that the literacy rate in Nigeria is 61.3 % (UNHDR, 2011), a segment as educated as this group cannot represent the reality of general Nigerian situation. Another extreme of the study sample is their level of employment which stood at 94.68%. This is a far cry from the employment circumstances of the Nigerian population. The unemployment level in Nigeria stands at 23.90 % (NBS, 2014). Given the centrality of education, level of financial activity and employment status of people in determining their preference and use of payment systems and the lopsidedness of the study sample in these three critical areas pose a limitation in drawing conclusions on the ranking of payment systems in Nigeria. It is useful however studying this segment of the population as a basis for the articulation of targeted interventions that may be necessary in securing quick wins and building a critical mass of early adopters of e-payment system that will serve as a platform for subsequent spreading of the need for the wider acceptance of the payment system by the general population. The choice of the sample studied was therefore deliberate and strategic. It nonetheless necessitates further

VOLUME NO. 4 (2014), ISSUE NO. 06 (JUNE) ISSN 2231-5756
INTERNATIONAL JOURNAL OF RESEARCH IN COMMERCE, IT & MANAGEMENT A Monthly Double-Blind Peer Reviewed (Refereed/Juried) Open Access International e-Journal - Included in the International Serial Directories
http://ijrcm.org.in/
59
studies to assess how other less educated and less financially active Nigerians rank payment systems in Nigeria. Other social issues like religion and tribe can also be explored in establishing the factors that define the ranking of payment systems in Nigeria and willingness to recommend e-payment to friends and relations.
REFERENCES 1. American Marketing Association Best Practices for Word-of-Mouth Communications (http://www.marketingpower.com/content1943490.php). 2. Charmaz, K. (2003), Grounded Theory: Objectivist and Constructivist Methods, In N.K. Denzin and Y.S. Lincoln (Eds.), Strategies of Qualitative Inquiry (2nd
Ed.), Thousand Oaks, CA; Sage. 3. Dichter, E. (1966). "How Word-of-Mouth Advertising Works". Harvard Business Review 44 (6): 147–166. 4. Financial Derivatives Company Limited (FDCL) (2012), Cash-Less POS Survey-Lagos From Cash To Card, November. 5. Grewal, R., Cline T. W. and Davies, A. ( 2003). Early-Entrant Advantage, Word-of-Mouth Communication, Brand Similarity, and the Consumer Decision-
Making Process. Journal of Consumer Psychology, 13(3). 6. Henwood, K. And Pidgeon, N. (1993), Qualitative Research and Psychological Theorizing, In Hammersley, Martyn(Ed.) Social Research: Philosophy, Politics
And Practice. London: Sage. 7. http://en.wikipedia.org/wiki/word-of-mouth_marketing#cite_note-10 8. http://en.wikipedia.org/wiki/word-of-mouth_marketing#cite_note-12 9. http://en.wikipedia.org/wiki/word-of-mouth_marketing#cite_note-3 10. http://en.wikipedia.org/wiki/word-of-mouth_marketing#cite_note-hbr-9 11. http://en.wikipedia.org/wiki/word-of-mouth_marketing#cite_note-thomas-8 12. http://www.entrepreneur.com/encyclopedia/term/82660.html 13. http://www.idiro.com/2013/09/nielsen-report-finds-that-word-of-mouth-is-the-most-trusted-source-again/ 14. http://www.reuters.com/article/2010/11/08/us-vcj-zuberance-idUSTRE6A731G20101108). 15. http://www.thefreedictionary.com/by+word+of+mouth 16. Keakopa, M. (1998). The role of the archivist in the collection and preservation of oral traditions. S.A. Archives Journal, 40, 87-93. 17. Kietzmann, J.H., Canhoto, A. (2013). "Bittersweet! Understanding and Managing Electronic Word of Mouth" (PDF). Journal of Public Affairs 13 (2): 146–159. 18. Lang, B and Hyde, K. (2013). "Word of mouth: What we know and what we have yet to learn". Journal of Consumer Satisfaction, Dissatisfaction and
Complaining Behavior 26: 1–18. 19. Lang, B. and Lawson, R. (2013). "Dissecting Word-of-Mouth's Effectiveness and How to Use It as a Pro-consumer Tool". Journal of Nonprofit & Public Sector
Marketing 25 (4): 374–399. 20. Laws Enforced by the Federal Trade Commission (http://www.ftc.gov/opp/gpra/append1.shtm#N-1-) 21. National Bureau of Statistics (NBS. 2014), Unemployment rate in Nigeria 22. Odior, E.S. And Banuso, F.B. (2013), Cashless Banking In Nigeria: Challenges, Benefits and Policy Implications, European Scientific Journal, June Edition.
Vol.8, No.13. 23. Okeke, C.I. (2014), Determination Of The Core Benefits And Challenges Associated With E-Payment System In Nigeria, International Journal Of Emerging
Knowledge, Vol.1 (12).204-218. 24. Ovia, J. (2005), Enhancing the Efficiency of the Nigerian Payments System, CBN, Volume 29no 1, 2005. 25. Stach, A. and Serenko A. (N.2010). The Impact of Expectation Disconfirmation on Customer Loyalty and Recommendation Behavior: Investigating Online
Travel and Tourism Services. Journal of Information Technology Management, XX (3), p. 26-41. 26. Turel, O., Serenko, A.and Bontis, N. (2010). User Acceptance of Hedonic Digital Artifacts: A Theory of Consumption Values Perspective. Information &
Management, 47(1), p. 53-59. 27. United Nations Human Development Report, World map indicating literacy by country, (UNHDR, 2014). 28. Word of mouth advertising: Marketing-made-simple.com (http://www.marketing-made-simple.com/articles/word-of-mouth-advertising.htm). 29. Word of Mouth Marketing Association Ethics Code (http://www.womma.org/ethics/code/read/)

VOLUME NO. 4 (2014), ISSUE NO. 06 (JUNE) ISSN 2231-5756
INTERNATIONAL JOURNAL OF RESEARCH IN COMMERCE, IT & MANAGEMENT A Monthly Double-Blind Peer Reviewed (Refereed/Juried) Open Access International e-Journal - Included in the International Serial Directories
http://ijrcm.org.in/
60
CHALLENGES FACED BY BANKING INDUSTRY IN UAE: REENGINEERING THE OPERATIONAL EFFICIENCIES
DR. BEENISH SHAMEEM ASST. PROFESSOR
DEPARTMENT OF BUSINESS ADMINISTRATION AL –KHWARIZMI INTERNATIONAL COLLEGE
UAE
ABSTRACT Banks in UAE primarily belong to two categories, national (local) and foreign, with the latter being restricted from operating more than eight branches. Currently, there are 46 banks operating in UAE, including branches and offices of foreign banks. There are 2national banks in UAE, all of which are listed either on Abu Dhabi Securities Market (ADSM) or Dubai Financial Market (DFM).Total assets of UAE banks grew by 13.1 per cent to Dh2, 025 billion in 2013 compared to Dh1, 791.6 billion in 2012, enabling the country’s banking sector to remain the largest in the Arab world in terms of assets. Total deposits increased from Dh1, 167.8 billion in 2012 to Dh1,278.9 billion in 2013, according to a statement of UAE Banks Federation. Among GCC countries, UAE has highest number of banks after Bahrain. Another notable feature is the rapid stride that Islamic banking has made in the UAE. A range of Sharia-compliant products was introduced in the market and Islamic finance deals like Ijara transactions have become common in property purchasing deals. The region has witnessed Islamic Sukuks attracting large investor volumes with subscriptions exceeding expected issuance, even in big issues. This paper attempts to unfold all the major operational aspects and challenges that continue to prevail in UAE banking system.
KEYWORDS
Banks, competition, Economy, Government, Interests, Pressures.
INTRODUCTION
he biggest and strongest beneficiary of the strong economic growth of UAE is the banking sector. Due to relatively low interest rate environment, high oil prices and a flourishing economy, banking sector assets witnessed strong growth. The UAE has a remarkably high number of banks. UAE has 21 local banks, 25 foreign banks, two specialized banks and around 50 representative offices of other foreign banks. UAE is under pressure from the World Trade
Organization to open up the banking sector more to foreign competition. In late 2004 the Central Bank of the UAE indicated that it will issue new licences, although none has so far been issued. Moreover, large stakes held by the government underline the significance of this sector, more so because of the government control on the macro-economy, which predominantly relies on oil revenues and trade. The UAE Central Bank is the primary financial regulatory authority. It is mandated to direct monetary, credit and banking policy and supervise over its implementation in accordance with the state's general policy and in such ways as to help support the national economy and stability of the currency. The banking sector of UAE is highly resourced to deal with global and domestic stress.
REENGENEERING THE OPERATIONAL EFFECIENCY
Dubai hosting the World Expo in 2020 will definitely have a positive impact on GDP and employment growth, and we will also see further expansion of the private sector leading to an increase in credit growth. The banking industry is safe and secure in the UAE and the overall confidence in the UAE banks is justifiably strong.The UAE’s banking sector is seen as highly liquid with the banking system’s liquid assets-to-total assets ratio of 30 per cent as of December 2012 as well as a loans-to-deposit ratio of 93 per cent (down from 108 per cent in 2008). Clearly, the recovery of asset values is also boosting the liquidity of banks. The UAE’s banking sector is seen as highly liquid with the banking system’s liquid assets-to-total assets ratio of 30 per cent as of December 2012 as well as a loans-to-deposit ratio of 93 per cent (down from 108 per cent in 2008). Clearly, the recovery of asset values is also boosting the liquidity of banks. “The real estate market has recovered significantly, although oversupply still hangs over segments of Dubai’s housing market. The banking sector in the UAE is quite fragmented, with the market currently being served by 23 domestic banks and 28 foreign banks. Banks incorporated in Abu Dhabi and Dubai hold the lion’s share of total domestic assets. In view of the ambitious outlook of the economy and the expansionist program of the country, is the banking sector able to support the pressure? Analyzing the gravity and intensity of the competitive scenario some of the measures that will possibly ease out the challenges in wake of this competition are as under:
LIQUIDITY AND GOVERNMENT SUPPORT
Funding and liquidity pressures remain on the banking system, with the average loan/deposit ratio for some major banks above 100% and in some cases above120%. The rising cost of domestic deposits in a competitive market and reduced access to the international debt capital market are also major contributors to the challenge in fueling the banking sector with resources to match the ambitious development plans of the country. Federal liquidity support measures greatly helped to stabilize the banking system in 2009. Over and above the federal support to UAE banks, the Abu Dhabi-based banks had received Tier 1 capital funding amounting to AED 16 billion, distributed among the four major banks, which contributed to liquidity in the sector. Capital adequacy ratios of UAE banks strengthened in2009 following government actions and greater retentions of net income by the banks and, in some cases, lower risk-weighted assets. According to the International Monetary Fund (IMF) reports, the UAE banking sector was able to pass stress tests, and became more flexible and more prepared, compared to previous years. This was due to the overall improved capital adequacy of State's banks in general, the supported quality of capital and the good management by the banks of their provisions in a more feasible manner under the supervision of the Central Bank.
ASSET QUALITY
Asset quality deteriorated significantly and the trend continued in 2010 with average NPL to gross loans ratio of banks increasing to 4.3% in 2009 from 1.7% at end-2008. The deterioration in the asset quality of banks will increase the impairment charge and will put pressure on the profitability of banks, which might cause an increase in the cost of funding on debtors as a compensation mechanism to sustain profitability. That, in turn, will have a direct impact on the profitability of debtors and their ability to meet their obligations as per original terms and conditions hence it is a vicious circle.
FALLING MARGINS
Banks are facing the challenges of falling margins. Margin compression is real and that is across the entire banking sector. Higher levels of liquidity in the market are putting pressures on the margins itself. So banks are changing their route of strategy to tackle this situation.
T

VOLUME NO. 4 (2014), ISSUE NO. 06 (JUNE) ISSN 2231-5756
INTERNATIONAL JOURNAL OF RESEARCH IN COMMERCE, IT & MANAGEMENT A Monthly Double-Blind Peer Reviewed (Refereed/Juried) Open Access International e-Journal - Included in the International Serial Directories
http://ijrcm.org.in/
61
PROFITABILITY
The UAE banking sector's profitability suffered in 2009 as the global economic crisis impacted the region more significantly and year-on-year comparatives in Q1 2010 were generally disappointing, although core interest and fee revenues are holding up relatively well. Impairment charges are still rising in both, retail and corporate portfolios. With Dubai World and other GREs(Government regulated entities) and the remainder of the troubled Saudi corporate exposures to provide for, sector profitability in 2010 is unlikely to be any better compared to 2009 levels. Not surprisingly, profits are expected to stagnate, or at least not decline, for some banks as a result of the key factors mentioned above. Increase in the cost of funding will put pressure on net interest margins. The decline in trade finance, IPO business and other operating income will have similar negative impact on fee and commission income which will eventually impact banks’ profitability. Stagnation in loans and advances growth as a result of higher funding cost and/or lower customer demand will also impact banks’ profitability. In such a competitive market, it is vital for banks to understand how customers and market sectors contribute towards profitability, and to what extent relationships with particular customers are profitable. More focus on client satisfaction, quality of service and innovation in products offered, will lead to the creation of new categories of interest income, charges, and commissions.
CONCLUSION
As UAE leaves behind the recovery phase and steadies itself to a new phase of economic growth, banks, while seeing a big jump in consumer business, are facing the challenge of margin compression in the wholesale arena mainly due to depressed credit growth in the market. “Margin compression is very real and that is across the banking sector,” said Morris. “Banks are chasing volumes. What the industry is seeing is that volumes are up substantially; however, the high levels of liquidity in the market, is putting pressure on margins. Trade finance and foreign exchange volumes are both up in the high teens, which is reflective of the economy and in particular, Dubai’s economic improvement.” “For banks to deliver sustainable performance you need topline growth and because of the current challenges in growing income, particularly in the Wholesale business, some banks are changing strategy and looking to expand overseas as well as developing new products and services. Banks need to revisit their operational efficiency because competition is both from local as well as foreign banks. Meanwhile, asset quality of the UAE banks are set to improve over the course of 2014 with the decline in non-performing loan (NPL) ratios and improving coverage ratios supported by asset and profit growth, Standard & Poor’s said in its UAE banking sector outlook for 2014.Most UAE banks’ NPL ratios have been stabilizing over the past 12 months, after a significant deterioration in asset quality over the past few years. The banks continue to generate strong pre-provision earnings and increase their coverage of reported NPLs, and the incidence of new NPLs has slowed substantially. Asset quality will continue to improve, although the cost of risk is unlikely to reduce further. Banks’ robust funding levels and good-quality capital should help them withstand adverse market developments, such as tighter liquidity and higher funding costs.
TABLE 1
Description0 Number
Number of Commercial Banks operating in UAE 51
Number of National Banks operating in UAE 23 (including 8 Islamic banks)
Number of Foreign Banks operating in UAE 28 (including 6 GCC Bnaks)
Number of Business Banks 4
Number of Finance Companies 25
Number of Representative offices 117
Number of finance investment exchanges 23
Number of Money exchanges 122
REFERENCES 1. http://gulfnews.com/business/banking/uae-banks-facing-pressure-on-margin-standard-chartered-ceo-says-1.1226209 2. http://www.deloitte.com/assets/DcomLebanon/Local%20Assets/Documents/ME%20PoV/ME%20PoV%20issue%205/POV%205%2 Clearly%20very%20un
clear.pdf 3. http://www.economy.gov.ae/English/Documents/MOE%20ANNUAL%20REPORT%202013%20ENG%20091013.pdf 4. http://www.uaebf.ae/Activities-&-Reports/Annual-Reports.html 5. http://www.uaeinteract.com/business/financial.asp 6. https://www.menafn.com/updates/research_center/UAE/Equity_val/gihJan2007.pdf
VOLUME NO. 4 (2014), ISSUE NO. 06 (JUNE) ISSN 2231-5756
INTERNATIONAL JOURNAL OF RESEARCH IN COMMERCE, IT & MANAGEMENT A Monthly Double-Blind Peer Reviewed (Refereed/Juried) Open Access International e-Journal - Included in the International Serial Directories
http://ijrcm.org.in/
62
FACE DETECTION IN NIGHT VISION IMAGES: AN APPLICATION OF BPDFHE METHODOLOGY
ANURAG RAY STUDENT
CSE DEPARTMENT SIKKIM MANIPAL INSTITUTE OF TECHNOLOGY
MAJITAR
ASHIS PRADHAN ASST. PROFESSOR CSE DEPARTMENT
SIKKIM MANIPAL INSTITUTE OF TECHNOLOGY MAJITAR
ABSTRACT
In this era, the importance and usage of face detection has reached its apex as it finds a lot of applications in Surveillance, Biometrics, Social Networking Sites, photo tagging, password protection, security etc. Scholars in the field of digital image processing are facing huge challenge to prescribe a methodology that is simple to implement and relatively faster to operate in ‘subjective contrast enhancement’ of an image. This paper attempts to detect face in Night-Vision Images. Although there are a few existing ‘complex but not robust’ methodologies for face detection in Night-Vision Images, we have attempted to present a simple, efficient but faster approach for the same. As a part of preprocessing, this study grossly follow the Histogram equalization methodology for enhancement of the contrast of image and specifically the Brightness preserving dynamic fuzzy histogram equalization technique (BPDFHE) proposed by Sheet et al,2010. The process followed by the authors is not complex to implement and is faster than the other widely used methods for detecting face in night time images. Furthermore, the process works best in a controlled environment and when only the face is exposed with a little exposure of skin.
KEYWORDS
Global Histogram Equalization, Dynamic Histogram Equalization, Preserving Dynamic Histogram Equalization, Brightness Preserving Dynamic Fuzzy Histogram Equalization, Flood Fill.
1. INTRODUCTION ace Detection, irrespective to the time of capturing the image, can have a huge implementation on the fields of Surveillance, photo tagging, password protection and security. Scholars in the field of digital image processing are facing huge challenge in prescribing a methodology that is simple to implement and relatively faster to operate in ‘subjective contrast enhancement’ of an image. The design of the Face detection Device is expected to be
based on a common hardware platform that uses minimum system resources. This paper is a humble attempt in this area of research. As a part of preprocessing we would grossly follow the Histogram equalization methodology for enhancement of the contrast of image. In general, the main objective of an image enhancement is either to identify the hidden image details or to enhance the image contrast. Histogram equalization (HE) is very popular and widely used technique for enhancing contrast of image since HE is computationally fast and simple to implement [1, 2]. Special Digital Cameras are required to capture the Night-time Images and then the image can be easily processed in a personal computer with very limited resources.
2. SURVEY OF LITERATURE Although the HE is very popular technique but it has some limitations. The use of HE is rarely suggested in some consumer electronic applications like, video surveillance, digital camera, television, etc., as HE tends to introduce some noisy artifacts and artificial enhancement, including intensity saturation effect [3]. One of the probable reasons for these type of problems is that the HE normally changes the brightness of the image significantly and makes the output image saturated with very bright or dark intensity values. In order to preserve the essential qualities of image, several improved brightness preserving histogram equalization techniques have been proposed. R. C. Gonzalez et. al [4] introduced Global Histogram Equalization (GHE), it introduces major changes in the image gray level when the spread of the histogram is not significant and cannot preserve the mean image-brightness. Kim proposed brightness preserving bi-Histogram equalization technique (BBHE) [5], which parts the input image histogram into two on the basis of the mean of the input image, and subsequently each part is equalized independently resulting preservation of the mean brightness as the original mean brightness is not disturbed and retained as such. Using median of the input image brightness in partitioning histogram ,Wan et al. posited dualistic sub-image histogram equalization technique (DSIHE), [6]. The technique, on other counts, is similar to BBHE . Chen and Ramli proposed minimum mean brightness error bi-histogram equalization (MMBEBHE), which is nothing but an extension of the BBHE method [7]. This algorithm finds the minimum mean brightness error between the original and the enhanced image. It employs the optimal point as the separating point instead of the mean or median of the input image. Though these methods can perform good contrast enhancement, they also cause more annoying side effects depending on the variation of gray level distribution in the histogram. Recursive mean separate HE (RMSHE) is another improved version of BBHE [8]. Unlike BBHE, recursive methodology is propped to separates the histogram into multi-sub-histograms instead of two sub-histograms. Initially, two sub-histograms are created based on the mean brightness of the original histogram. Next, the mean brightness of the two sub-histograms obtained is used as the second and third separating points. The process is posited to continue until the desired numbers of sub-histograms are created. Then, the HE approach is applied independently on each of the sub-histograms. In sum, although the mean brightness is well preserved by the methods discussed above but they cannot substantially expand the region of sub-histogram located nearer to the minimum or maximum value of the dynamic range. The methodologies are not free from the shortcomings like, washed-out appearance, undesirable checkerboard effects, etc. Abdullah-Al-Wadud et al. introduced a dynamic histogram equalization (DHE) technique [9] which is claimed to be superior than the above mentioned methods to tackle the detected limitations of the partitioned HE methodologies . DHE partitions the original histogram based on local minima. However, DHE also suffers from many limitations and fails to preserve the proper brightness of images. Recently, Ibrahim and Kong proposed brightness preserving dynamic histogram equalization (BPDHE) technique [10].This method partitions the image histogram based on the local maxima of the smoothed histogram. It assigns a new dynamic range to each partition and finally the output intensity is normalized to make the mean intensity of the resulting image equal to the input one. The BPDHE , in general, performs well in preserving the mean brightness, the ratio for brightness normalization plays a vital role in the whole game. A small ratio value fails to enhance the contrasts significantly and a large ratio value (more than 1) may cause to exceed the maximum intensity value of the output dynamic range. The exceed pixels quantized the maximum intensity value of gray levels and produce intensity saturation problem (in general, in widely used software’s environment like, MATLAB).
F

VOLUME NO. 4 (2014), ISSUE NO. 06 (JUNE) ISSN 2231-5756
INTERNATIONAL JOURNAL OF RESEARCH IN COMMERCE, IT & MANAGEMENT A Monthly Double-Blind Peer Reviewed (Refereed/Juried) Open Access International e-Journal - Included in the International Serial Directories
http://ijrcm.org.in/
63
Brightness preserving dynamic fuzzy histogram equalization technique (BPDFHE) has been proposed by Sheet et al. which is an enhanced version of BPDHE [11]. The BPDFHE technique manoeuvres the image histogram in such a way that no remapping of the histogram peaks occurs; only redistribution of the gray-level values in the valley portions between two consecutive peaks occurs. The results using BPDFHE method depicts well-enhanced contrast and little artifacts. The fuzzy logic-based histogram equalization technique is suggested to use for both gray scale and color images as it drastically reduces the unwanted over enhancement of brightness and noise amplifying and improves the local contrast of the original image. First, fuzzy histogram is computed using fuzzy set theory. Second, the fuzzy histogram is separated into two based on the median value of the original image. Finally, the HE approach is applied independently on each sub-histogram to improve the contrast. This paper chooses BPDFHE technique over the other histogram equalization techniques for its merits to study and suggest a method in detecting face in night vision images. The methodologies discussed in this paper are very popular and widely used in literature. Detailed elaboration and symbolic presentation of the methodologies referred above are seems to be excess as the detailed discussions are also available in text books. The remainder of this paper is organized as follows. The proposed methodology, algorithm for fuzzification and enhancement and results are presented in Section III and Section IV concludes this paper.
3. EMPIRICAL METHODOLOGY, ALGORITHM AND RESULTS: This paper basically is concerned to detect a face in a night-time image. Recognition of the face by extracting its morphological features is beyond the scope of this paper. The methodology comprises of very basic and simple steps. After surveying the major literature we choose BPDFHE technique suggested by Sheet et al[11] over all the other techniques because: i).it works well for noisy images, ii) contrast enhancement is appropriate for night time images and iii) mean brightness of the image is preserved since the peaks in the histogram are not tampered. Folowing Sheet et al, [11], the methodology used in this study consist of the following steps: i. Histogram equalization of Input image using BPDFHE that involves: a). Fuzzy Histogram Computation. b). Partitioning of the Histogram. c). Dynamic Histogram Equalization of the Partitions. d). Normalization of the image brightness. ii. Face detection and Segmentation iii. Filling the holes using Flood Fill iv. Eliminating smaller patches based on pixel count ratio v. Putting Bounding boxes around detected face
FIGURE 1: FLOW DIAGRAM OF THE METHOD FOLLOWED
In the first step contrast enhancement is done on the image so that the pixels in the image having low brightness intensity gains higher brightness. The Brightness Preserving Dynamic Fuzzy Histogram Equalization technique is followed according to the steps suggested by D. Sheet et al. We are, for the brevity of the paper, not going into further details. The next step deals with the identification of the skin regions. We have dynamically extracted the skin of the face but there remained some error as it detected some patches of skin as well from other body parts. To reduce the impact of the problems we have, at the first step, created a binary image with some white patches which are nothing but the detected skin. Then the face detected was filled using flood fill method to get a uniform white blob. In the next step, the smaller patches were removed, that is, the noises were removed. Then we have plotted the bounding boxes around the detected faces. .

VOLUME NO. 4 (2014), ISSUE NO. 06 (JUNE) ISSN 2231-5756
INTERNATIONAL JOURNAL OF RESEARCH IN COMMERCE, IT & MANAGEMENT A Monthly Double-Blind Peer Reviewed (Refereed/Juried) Open Access International e-Journal - Included in the International Serial Directories
http://ijrcm.org.in/
64
4. RESULTS AND DISCUSSION The above mentioned steps were carried on a real time image. The table 1 shown below lists the task performed serially for a sample image.
TABLE-I: SAMPLE RESULT FOR TEST IMAGE
Operation Output
Original Image
Image after contras enhancement.
Image after converting to Binary Image.
Image after filling holes.
Image after removing smaller patches.
Image after putting Bounding Boxes.

VOLUME NO. 4 (2014), ISSUE NO. 06 (JUNE) ISSN 2231-5756
INTERNATIONAL JOURNAL OF RESEARCH IN COMMERCE, IT & MANAGEMENT A Monthly Double-Blind Peer Reviewed (Refereed/Juried) Open Access International e-Journal - Included in the International Serial Directories
http://ijrcm.org.in/
65
Here we considered an image (see Original Image, Table 1) as our input image and after applying Brightness Preserving Dynamic Fuzzy Histogram Equalization technique we got the Image after contras enhancement (see Table 1).Then we have applied face detection and segmentation techniques and got the third image which captured and detected most of the facial parts along with some noise as in Image after converting to Binary Image (see Table 1). Then we filled the holes to remove the shadows of the eyes and the noses to get a bigger and cleaner white blob as depicted in Image after filling holes (see Table 1). Now to remove the noise if we can remove the smaller white patches based on pixel count ratio then we would get an image which mostly contains the face portion (see Image after removing smaller patches, Table 1). Finally we put the bounding boxes around the face detected and got the final output-image (see Image after putting Bounding Boxes, Table 1).
CONCLUSION The method suggested by this study is not complex to implement and is faster in operation as compared to the other existing methods for detecting face in a night time image. The image found to work best in a controlled environment and when only the face is exposed with a little exposure of skin. The failure rate is low compared to other techniques. Furthermore any advanced image enhancement technique can be used and the suggested methodology can also be expanded to detect faces in videos.
REFERENCES 1. C. G. Ravichandran and V. Magudeeswaran, “An efficient method for contrast enhancement in still images using histogram modification framework,”
Journal of Computer Science, vol. 8, no. 5, pp. 775–779, 2012. 2. D. Sheet, H. Garud, A. Suveer, M. Mahadevappa, and J. Chatterjee, “Brightness preserving dynamic fuzzy histogram equalization,” IEEE Transactions on
Consumer Electronics, vol. 56, no. 4, pp. 2475–2480, 2010. 3. M. Abdullah-Al-Wadud, M. H. Kabir, M. A. A. Dewan, and O. Chae, “A dynamic histogram equalization for image contrast enhancement,” IEEE Transactions
on Consumer Electronics, vol. 53, no. 2, pp. 593–600, 2007. 4. N. S. P. Kong and H. Ibrahim, “Color image enhancement using brightness preserving dynamic histogram equalization,” IEEE Transactions on Consumer
Electronics, vol. 54, no. 4, 2008. 5. R. C. Gonzalez and R. E. Woods, “Digital Image Processing”, Prentice Hall 2002 6. S. D. Chen and A. R. Ramli, “Contrast enhancement using recursive mean-separate histogram equalization for scalable brightness preservation,” IEEE
Transactions on Consumer Electronics, vol. 49, no. 4, pp. 1301–1309, 2003. 7. S. D. Chen and A. R. Ramli, “Minimum mean brightness error bi-histogramequalization in contrast enhancement,” IEEE Transactions on Consumer
Electronics, vol. 49, no. 4, pp. 1310–1319, 2003. 8. X. Su, W. Fang, Q. Shen, and X. Hao, “An image enhancement method using the quantum-behaved particle swarm optimization with an adaptive strategy,”
Mathematical Problems in Engineering, vol. 2013,Article ID 824787, 13 pages, 2013. 9. Y. Kim, “Contrast enhancement using brightness preserving bi-histogram equalization,” IEEE Transactions on Consumer Electronics, vol. 43, no. 1, pp. 1–8,
1997. 10. Y. Wan, Q. Chen, and B.-M. Zhang, “Image enhancement based on equal area dualistic sub-image histogramequalization method,” IEEE Transactions on
Consumer Electronics, vol. 45, no. 1, pp. 68–75, 1999. 11. Y. Yang, J. Zhang, and X. Huang, “Adaptive image enhancement algorithmcombining kernel regression and local homogeneity,” Mathematical Problems in
Engineering, vol. 2010, Article ID 693532, 14 pages, 2010

VOLUME NO. 4 (2014), ISSUE NO. 06 (JUNE) ISSN 2231-5756
INTERNATIONAL JOURNAL OF RESEARCH IN COMMERCE, IT & MANAGEMENT A Monthly Double-Blind Peer Reviewed (Refereed/Juried) Open Access International e-Journal - Included in the International Serial Directories
http://ijrcm.org.in/
66
UNITED ARAB EMIRATES: THE INTEGRATION OF BUSINESS TECHNOLOGY AND CORPORATE COMPETIVENESS
DR. BEENISH SHAMEEM ASST. PROFESSOR
DEPARTMENT OF BUSINESS ADMINISTRATION AL –KHWARIZMI INTERNATIONAL COLLEGE
UAE
ABSTRACT In less than 40 years, UAE has transformed itself from a trading community into one of the most inspirational, exciting and successful destinations of the world in the world.UAE's progress continues to make global headlines and its attraction as a destination for tourists and businesses alike is now legendary. With a diverse, multicultural population, UAE offers its residents and businesses a unique environment, enriched with the cultures of more than 190 nationalities and a quality of life and work unrivalled in the Middle East. It is a bustling metropolis with a combination of Emirati heritage, Arabic vitality, Western spontaneity and Asian ambition. With an indigenous population of just 170,000, the expatriate residents now stands at more than two million, thanks to its lifestyle appeal and investment incentives. The tax-free policies and penalty-free repatriation of earnings have enormous benefits on both a personal and business level, with outstanding opportunities for private savings and professional profits. The paper shows how UAE is dynamically acting as a perfect gateway for the rest of world and provides most lucrative opportunities for the exports and imports.
KEYWORDS
Business, Competitive advantage, Culture, competitiveness, Development, Technology.
INTRODUCTION
AE has dynamically changed in last three decades, becoming a major commercial center of the world enjoying a strategic position and a major export and import center in the world. Its low logistical and operational costs and excellent infrastructure, international outlook and liberal government policies are attracting investors in a big way. Activities such as trade, transport, tourism, industry and finance have shown steady growth and helped the
economy to achieve a high degree of expansion and diversification. UAE economy enjoys a competitive combination of cost, market and environmental advantages that create an ideal and attractive investment climate for local and expatriate businesses alike. These advantages have helped UAE to become leading business center and placed it at the forefront of the globes dynamic and emerging market economies.
COMPETITIVE ADVANTAGE OF UAE
UAE is one of the world’s preferred trade and logistics hubs. In 2012 the World Bank Doing Business Report ranked the UAE 5th for the ease of Trading across Borders, out of 183 countries. This is significant in a world of rising global interdependence and growth in international trade. Trade is a key economic activity in the globalized economy, as reflected in the dramatic rise in exports internationally. Between 1994 and 2009, total world exports increased by 120% from US$5 trillion to US$11 trillion, surpassing world GDP growth. STRATEGIC LOCATION: UAE is a gateway to a market that can be characterized as: Large - well established trading links exist with the greater than 1.5 billion people in the neighboring region covering the Gulf, Middle East/Eastern Mediterranean, CIS, Central Asia, Africa and the Asian sub-continent. Growing - Total international trade has grown on average by over 11% per year since 1988 and regional economic growth and liberalization should boost demand further. Prosperous - a buoyant local economy strategically located in the midst of one of the world’s richest regions and well-endowed with ample supplies of cheap energy and primary aluminum; also adjacent to major regional suppliers of vital agro-export commodities. Diversified - varied and significant import requirements generate opportunities for product suppliers and re-exporters Accessible - served by over 120 shipping lines and linked via 85 airlines to over 130 global destinations. Open - no exchange controls, quotas or trade barriers. POLITICAL AND ECONOMIC STABILITY: Dubai is part of the UAE which is a low-crime and politically-stable country. Also, the UAE enjoys financial and monetary stability. Its well-developed, sophisticated banking system features extensive credit facilities and ample liquidity. The Emirate’s emerging capital markets are built on a basis of leading-edge technologies and sound regulatory systems. The government has a long, consistent commitment to pro-business, liberal economic policies including the protection of intellectual property rights. The UAE benefits from stable and harmonious industrial relations. Finally, there is a well-defined, sound legal framework for business and a clear set of ownership rules. Foreigners are permitted ownership rights of up to 49% for limited liability companies established within the Emirate of Dubai and up to 100% for professional companies, branches and representative offices of foreign companies and free zones enterprises. OPEN AND FREE ECONOMIC SYSTEM:UAE economy has been kept open and free to attract investors and business. Government control and regulation of private sector activities has been kept to a minimum. There are no direct taxes on corporate profits or personal income (except for oil companies that pay a flat rate of 55% and branches of foreign banks that pay a flat rate of 20% on net profit generated within Dubai). Customs duties are low at 4% with many exemptions, 100% repatriation of capital and profits is permitted, there are no foreign exchange controls, trade quotas or barriers and a stable exchange rate exists between the US Dollar and the UAE Dirham (US$1.00=AED 3.678). Liberal visa policies permit easy importation of expatriate labor of various skill levels from almost all over the world. WORLD CLASS INFRASTRUCTURE AND SERVICE SECTOR: UAE's deliberate policy of investing heavily in transport, telecommunications, energy and industrial infrastructure has enabled it to have one of the best infrastructure facilities in the world; Dubai also contributed significantly both to its ongoing prosperity and attractiveness to international business. The Emirate features a network of seven industrial areas, one business park and three highly successful, specialized free zones of international distinction, two world class seaports, a major international airport and cargo village, a modern highway network, state-of-the-art telecommunications and reliable power and utilities all of which deliver efficiency, flexibility, reliability, reasonable cost and size. Complementing its world class infrastructure is a sophisticated service sector that features leading regional and international freight forwarders, shipping companies, insurers plus major international hotels, banks and financial service firms, lawyers, accounting firms, consultants, advertising agencies, top international exhibition and conference facilities, high quality office and residential accommodation, first class hospitals, schools, shopping centers and recreational facilities. Free Zones Websites: Dubai Airport Free Zone Jebel Ali Free Zone Dubai Media City Dubai Internet City COMPETITIVE COST STRUCTURE: The major factors that contribute to the cost advantages that are generally not available internationally are: • No foreign exchange controls, • No trade barriers or quotas, • Competitive import duties • Competitive labor costs – labor force is multi-lingual and skilled, • Competitive energy costs,
U

VOLUME NO. 4 (2014), ISSUE NO. 06 (JUNE) ISSN 2231-5756
INTERNATIONAL JOURNAL OF RESEARCH IN COMMERCE, IT & MANAGEMENT A Monthly Double-Blind Peer Reviewed (Refereed/Juried) Open Access International e-Journal - Included in the International Serial Directories
http://ijrcm.org.in/
67
• Competitive real estate costs, • Competitive financing costs and high levels of liquidity, • No corporate profit or personal income taxes (except for oil companies and branches of foreign banks). You can refer to the tables under the "Cost of Doing Business" section. HIGH QUALITY OF LIFE, EXCELLENT LIVING CONDITIONS: Dubai’s private sector has invested heavily in real estate such as hotels, residential and commercial properties, recreational and leisure facilities. In addition, a number of factors have contributed to the Emirate’s high quality of life and superior living conditions making it a model location for many to emulate. Those factors include excellent infrastructural facilities, low crime, clean environment, tolerance and cultural diversity, cosmopolitan life style, modern public administration, availability of a wide range of consumer goods and services, mild winters and clean, palm fringed beaches. STRONG LOCAL COMMERCIAL TRADITION AND WIDE CHOICE OF POTENTIAL BUSINESS PARTNERS: The local business class has a long tradition of trading activity and wide exposure to international business practices and state-of-the-art technologies. Local entrepreneurs have already gained successful experience with international partnerships in franchising, licensing, joint ventures, etc, in various sectors of the economy. EXTENSIVE FOREIGN TRADE NETWORK & MAJOR ACHIEVEMENTS IN EXPORT AND RE-EXPORT PERFORMANCE: UAE boasts an extensive foreign trade network extending to 179 states thus offering the investor an extensive choice of potential global marketing outlets for a diverse portfolio of goods and services. As a member of the UAE federation, Dubai is also part of the world’s third-largest export and re-export center after Hong Kong and Singapore. RAPIDLY DEVELOPING MANUFACTURING SECTOR PRODUCING A WIDE RANGE OF HIGH QUALITY, COMPETITIVE EXPORT PRODUCTS: Major gains have already been made in the profitable manufacture and export of aluminum ingots, fabricated metal products, textiles and ready-made garments, gold and jewelry, prepared foodstuffs, consumer electronics, refined petroleum, chemical and non-metallic mineral products. Supportive commercial, industrial, political and economic factors are currently in place that makes possible the extension of these gains to other manufacturing sub-sectors.
CONCLUSION Trade has been an important contributor to the UAE’s economy. The country’s central geographical location has given it a comparative advantage, and in recent years it has turned this location advantage into a strategic, competitive advantage. The UAE government has pursued a strategy to encourage a robust business-enabling environment that advances economic growth and increases UAE’s competitiveness and productivity. Policies to promote trade are an important feature of this strategy, and the country has developed an invaluable infrastructure that has allowed it to become a major player in international trade. The UAE has invested heavily in world-class infrastructure, including roads across the country; state-of-the-art airports and cargo hubs in Dubai, Abu Dhabi and Sharjah, and model seaport facilities at Port Jebel Ali (See Figure 2, below). With this infrastructure in place, the UAE has gone even further to create competitive advantage in trade by improving the efficiency of its trade process. In the current environment of increased global trade, efficient logistics processes relate directly to the competitiveness of a country’s economy. The less time-consuming and more cost-effective it is to export and import, the easier it is for traders to be competitive and reach international markets. Understandably, the business community engaged in international trade is keenly interested in how easily and quickly their intermediary and final products can transit through a country, and choose to invest in countries or regions that are most conducive to trade. Similarly, in a trade-enabling environment, firms within the country are encouraged to export their goods to external markets and participate in global value chains, contributing to the country’s export sector growth. Potential Impact on GDP: It is difficult to compute the exact impact of trade facilitation given the large number and complexity of variables involved. Factors that enable trade in a country include its macroeconomic and political stability, policies favoring trade and the general growth of the economy. Economists and academics including the World Trade Organization, the Organization for Economic Cooperation and Development (OECD), United Nations Conference on Trade and Development (UNCTAD), and the World Bank have demonstrated amply that increased trade is enormously beneficial to the business community and governments alike, potentially accounting for billions of dollars in revenues generated from improved trade processes. As trade rises the general welfare within a county also increases. Below we highlight the main ways in which trade facilitation and increased trade in the UAE has been advantageous to the public and private sectors in the UAE. A partial analysis of the gains from reducing time to trade in the UAE demonstrates that the impact is sizeable , a partial calculation of the impact on trade by reducing time to trade potentially accounts for total savings of over $40 billion—about 17% of the UAE’s 2009 GDP. 17 The calculation takes into account that cost of trade includes the amount of capital that is tied up in trade processes, compared to available liquid assets which could potentially be invested. As time to trade is reduced, not only do the number of trade deals per year increase, but the capital that is freed up can now be potentially used more efficiently by the private sector. The calculation below is based on the fact that in the UAE between 2005 and 2009, the number of days to export and import goods dropped by 3 days each. Create a Competitive Advantage from a Comparative Advantage. The county’s early move to set in place its world-class infrastructure built its capacity as a logistics hub, provided the foundation of an important logistics hub for the region and the world. Savvy policy makers recognized an opportunity to further develop this into a competitive advantage as a center for trade excellence both existing and emerging conditions for trade. Ensure a Customer-Centric Focus:. Customer loyalty and feedback have facilitated further improved processes, higher efficiencies, better business performances, leading to increased economic growth through increased trade. Develop Networks for Competitive Advantage: Innovation is generally thought of as the creation of improved products and processes. Dubai Trade has demonstrated that effective networks can also be innovative. By bringing together synergistic relations that did not exist before, UAE created new value and synergy through partnerships between government entities, companies and individuals. These synergies are what bring its strategies and polices to life and are at the heart of this sustainable industry network. The synergies among the various actors inspired collaboration, improved processes and also healthy competition.
REFERENCES 1. American Association of Port Authorities (AAPA) Survey. Available: http://www.aapa-ports.org/Industry/content.cfm?ItemNumber=900 &navIte mNumbe
r=551 2. Arocha, Marcos, Intermediate Results, Programming for Growth Briefing Note 9, (Washington: USAID) June 2010. Available: http://www.countrycompass.
com/policy_briefs.php 3. DP World website. Available: www.dpworld.com 4. Dubai Economic Council, Clusters and Dubai’s Competitiveness (Dubai: Dubai Economic Council) 2009 Available:http://www.isc.hbs.edu/pdf/ Dubai_Clust
ers_and_Competitiveness_2009.pdf 5. Dubai Trade website. Available: www.dubaitrade.ae 6. http://dubai.ae/en/aboutdubai/Pages/DubaiEconomy.aspx 7. http://www.dubaifdi.gov.ae/en/fdiservices/whydubai/pages/competitiveadvantage 8. Mokadem, Faysal, Policy in Action, Economic Growth, Productivity and Competitiveness, (UAE: Emirates Competitiveness Council) April 2011 Available:
http://www.ecc.ae/en/downloads.aspx 9. Porter, Michael, Presentations to the UAE Public and Private Sectors, Jan 2010 Available: www.ecc.ae 10. Report by emirates competitive council(ECC 2012) 11. World Bank Database, online. Available: http://www.worldbank.org 12. World Bank, Doing Business Report 2012, (Washington: The International Bank for Reconstruction and Development / The World Bank) 2010 Available:
http://www.doingbusiness.org/ 13. World Development Indicators, online. Sept 201 Available:http://data.worldbank.org/data-catalog/world-development-indicators

VOLUME NO. 4 (2014), ISSUE NO. 06 (JUNE) ISSN 2231-5756
INTERNATIONAL JOURNAL OF RESEARCH IN COMMERCE, IT & MANAGEMENT A Monthly Double-Blind Peer Reviewed (Refereed/Juried) Open Access International e-Journal - Included in the International Serial Directories
http://ijrcm.org.in/
68
A STUDY OF RECRUITMENT PRACTICES FROM TRADITIONAL TO e-RECRUITMENT: A PARADIGM SHIFT
ABDUL GHANI FAIYYAZ RESEARCH SCHOLAR
DEPARTMENT OF COMMERCE ALIGARH MUSLIM UNIVERSITY
ALIGARH
ABSTRACT This paper is based on the importance of E-Recruitment in recruitment process of the companies. Each and every organisation is set up with the purpose of achieving some objectives. It can be achieved only when all the resources are put to best use. Of all the resources, human resource is most important resource because full and proper utilisation of all others resources depend upon human resource. Management of human resource is of strategic importance for every concern. It deals with how to attract, maintain and retain best and potential employees inside the organisation. For the past two decades, there has been drastic change in field of human resource management; internet has influenced overall functioning of human resource department in one way and another. Today E- recruitment has become most sought after method for companies to recruit people in organisation. The purpose of the study is to know up to what Extent Company uses information technology for recruiting employees inside the organization. The study tries to provide some insight on the Recruitment practices with the special focus on E-Recruitment and current trends in India.
KEYWORDS e-Recruitment, traditional recruitment, internet, organisation, Human Resource Management, personnel management.
INTRODUCTION uman resource is the most precious resource for any organization. Full and proper utilization of all others resources depends upon human resource. But in the past little attention was paid on this factor. Recruitment of right person on the board of a company is indispensable for success of the any organization. In current scenario, only those companies will survive which have an edge over other in form of human resource. How to attract, retain,
manage and develop high potential employees in the organisation is the main and most important challenging task before human resource department. Thus, high potential’s specific interest and preference in context of application must be taken in to account in addition to general candidate for recruitment, and high potential like to use electronic tools for their application. Thus company shall focus and improve on E-recruiting tools to meet the special Candidates’ specific interest and give an opportunity and incentive to apply at the company
WHAT IS RECRUITMENT AND e-RECRUITMENT It is extremely important for an organisation to be adequately staffed. Systematic steps must be observed to ensure that the right types of persons are available in the organisation at right number and at the right time. Neither in organisation there should be overstaffing nor understaffing because in future both may create problem for the organisation. Thus, Human resource department must know how many and what types of employee are needed, where and how to look for individual with the appropriate qualification and interest that are needed for the better job performance. According to Edwin B. Flippo, recruitment is the process of searching the Candidates for employment activity that links the employers and the job seekers. It is the process to discover sources of manpower to meet the requirement of Staffing schedule and to employ effective measures for attracting that manpower in adequate numbers to facilitate effective selection of an efficient working force. Whereas “E-Recruitment “.also known as “Online Recruitment”, it is the use of technology or web based tools to assist the recruitment process. The tool can be a job website like naukri.com, the organisation’s corporate web site or its own intranet Many big and Small organizations are using Internet as a source of recruitment. They advertise Job vacancies through worldwide web. The job seekers send their applications or Curriculum vitae (CV) through an e-mail using the Internet. Alternatively jobseekers place their CV’s in worldwide web, which can be drawn by prospective Employers depending upon their requirements. The internet penetration in India is increasing and has tremendous potential. According to a study conducted by Cisco’s VNI (Visual Networking Index) news published in The Economic Times on 4th June, 2013 "In India, there will be 348 million Internet users in 2017, up from 138 million in 2012," the VNI (visual networking index).
LITERATURE REVIEW This section on the literature review will be devoted to different theories and finding on e-recruitment that are relevant to this study. A study conducted by Avinash et al (2012) on e- recruitment where they explored the loopholes of e-recruitment and suggested that these shortcomings can be covered by traditional recruitment and concluded that traditional recruitment cannot be replaced by E -recruitment completely. Taygi Aastha (2012) explored the benefit of e- recruitment in attracting and selecting best talent available in the market. She concluded that e- recruitment ensures efficient functioning of Human Resource Department. Dhamija Pavitra (2012) pointed out that E-recruitment can benefit organisation remarkably to reducing administrative task, cost and improving efficiency. It can also be used to track and manage large applications especially among big organisation. Poorangi, Razavi and Rahmani (2011) empirically examined the effectiveness of e-recruitment method in improving external and internal interaction and communication between jobseekers, firms, employees and other stakeholder. It concluded that e- recruitment helps organisation to store, recall and build database. Lorens J Jared(2010) pointed out that how more technology savvy organisation have rapidly begun to adopt multifaceted and innovative approaches to recruiting employees through use of Web 2.0 and third party recruitment network .He concluded the variation in public sector e-recruitment adoption and impact of robust and limited adoption e-recruitment on the company. Karla jurgan et al (2008) highlighted current trend, usage of Information technology and web2.0 service in recruitment process in Germany. How e- recruitment helped IBM company to reduce recruiting time from six weeks to one day and Bank of Montreal saved 1 million dollar cost. At last it was concluded that company can retain and attract high potential candidate only if their specific interest and preferences are meet in context of application in addition to general candidate. From the literature it is evident that use of e- recruitment helps the company to reduce cost, save time and expedite the recruitment process.
OBJECTIVES OF THE STUDY 1. To analyse the recent trends and current development in area of E-Recruitment 2. To evaluate significance of E-Recruitment over Traditional recruitment in the recruitment process of the company
CURRENT TRENDS IN RECRUITMENT IN INDIA Employee Referral/Recommendations: Many organisations have structured system where the current employees of the organisation can refer their friends
and relatives for some position in their organisation also, office bearers of trade unions are often aware of the suitability of candidates. Human resource
H

VOLUME NO. 4 (2014), ISSUE NO. 06 (JUNE) ISSN 2231-5756
INTERNATIONAL JOURNAL OF RESEARCH IN COMMERCE, IT & MANAGEMENT A Monthly Double-Blind Peer Reviewed (Refereed/Juried) Open Access International e-Journal - Included in the International Serial Directories
http://ijrcm.org.in/
69
department can inquire these leaders for suitable jobs. In some organisation these are formal agreements to give priority in recruitment to the candidates recommended by the trade union. According to a survey this system is 2nd most widely used recruitment technique being followed in India.
Vertical Search: The vertical search feature lets one search up on a specific topic or area. So in case of any specific job role requirement, this comes handy. Websites like Indeed and Simply Hired provide vertical search options.
Direct Search: This is like simply searching up the requirements and browsing through the results that may be thrown up. Plain e-recruitment suites: These are tailor-made software’s made by software firms which one can integrate with their content on the websites and other
places on the web. Jobs portals: The tried and tested methodology is still among the most popular. Online people database: With websites like LinkedIn wherein the
professional details of a person are easily available, the companies now have a ready database of potential candidates. Employees Referral programs: Over the past decade or so , this has gained much popularity, wherein an existing employee or anyone who sees a job posting on the web can recommend or refer someone else they know who might be appropriate for the job .
Raiding and Poaching: Poaching means employing a competent and experienced person already working with another reputed company in the same or different industry; A company can attract talent from another firm by offering attractive pay packages and other terms and conditions, better than the current employer of the candidate. But it is seen as an unethical practice and not openly talked about. Indian software and the retail sector are the sectors facing the most severe brunt of poaching today, it has also found in Hotel industry. It has become a challenge for human resource managers to face and tackle poaching, as it weakens the competitive strength of the firm.
Outsourcing: A company may draw required personnel from outsourcing firms. The outsourcing firms help the organisation by the initial screening of the candidates according to the needs of the organisation and creating a suitable pool of talent for the final selection by the organisation. Outsourcing firms develop their human resource pool by employing people for them and make available personnel to various companies as per their needs. In turn, the outsourcing firms or the intermediaries charge the organisations for their services.
Web 2.0: The recruitment landscape has shifted to more and more advanced technology and we come across a word called Web 2.0 refers to those technologies that represent the second wave of web-based functionality :blogs, wikis, photo-sharing, video-sharing, social networking, social bookmarking, mashups, widgets, virtual worlds and microblogs” are the common Web 2.0 technologies(2010) . But in India use of Web 2.0 is limited in requirement
According to a Global Recruiting Trend Survey conducted by LINKEDIN 2011 in India explored the recruitment trend and revealed the top three recruitment techniques which are being followed in India are upgrading Employment branding, referral programs and social professional networking. Employee referrals rates are higher in India than any other countries in the world. However the quality of most referrals is not high enough and hence Employee referral programs suffer from lack of quality referrals and insufficient promotion/incentives.
CHART 1
Dramatically just opposite of above survey a study conducted in USA by Social Recruiting Survey, Jobvite 2011 it was revealed that Best Outside Talent Comes from Referrals, internal transfer then direct sourcing. Referral applicants are high quality compared to other sources.
CHART 2
38
36
33
upgrading employment branding
employee referrals
use of social and profeesional network
Top Three Recruiting Trends in India
% who considers one of the top three trends
8.6
8.2
7.8
referral
internal trasnfer
direct sourcing
7.4 7.6 7.8 8 8.2 8.4 8.6 8.8
Quality Of Candidates Where 10 Represent Highest Quality
quality of candidates where 10 represent highest quality

VOLUME NO. 4 (2014), ISSUE NO. 06 (JUNE) ISSN 2231-5756
INTERNATIONAL JOURNAL OF RESEARCH IN COMMERCE, IT & MANAGEMENT A Monthly Double-Blind Peer Reviewed (Refereed/Juried) Open Access International e-Journal - Included in the International Serial Directories
http://ijrcm.org.in/
70
A TYPICAL FRAMEWORK FOR E- RECRUITMENT ADOPTION AND ITS IMPACT In India there has been limited research on public sector e-recruitment adoption focussing on the changes in the field and highlighting need for public organisation to adopt new technique of recruitment to meet and compete in contemporary labour market. Paul windolf’s typology for classifying organisational recruitment strategies provides a useful basis for evaluating e -recruitment efforts (1986). In a study conducted on British and German firms he found that an organisation choice of recruitment strategies of firm determined by both labor market power of organisation and its intelligence. Within this typology labor market power is defined “degree of freedom of choice with which the firm can exercise in deciding particular recruitment strategies whereas organisational intelligence refers to the “capacity of firm to use technical and professional knowledge to collect and process information and to workout complex labor market strategies. His typology can be readily adopted and applied to public sector e- recruitment. This typology serves as a useful tool for explaining variation in public sector e- recruitment. In this he explained how a low status small organisation with robust technical competency overpowers the high-status organisation with limited technical competency in retaining, attracting best and potential employees in the organisation.
Organisational Status Limited high
Technical Competency Note: figure adopted from Windolf’s (1986) typology of organisational recruitment strategies. This figure can be useful in predicting the adoption of e- recruitment technologies and its potential impact on the quality of applicant. In first quadrant Organisation with high status and limited technical competency the adoption of technologies in recruitment process is limited and within that organisation the resulting applicant pool would most likely to remain stable due to relatively high status of organisation (e.g. technology limited government employer) for this type of organisation, stakes of e-recruitment adoption are relatively low since non-use of new technologies will not affect their ability to recruit quality candidate in labor market. While in quadrant IV (low status-high technical competency) organisation stand to gain most from robust adoption of e- recruitment technologies in this organisation there is increase in quality of applicant pool due to its ability to reach out beyond local geographical boundaries because of robust adoption technology. Firm operating in quadrant III will miss out such opportunities and also experience the full consequence of being low status organization. Lastly, organisation operating in quadrant II is that ideal organisation that benefit from having a high status among job seekers and a robust adoption of e- recruitment technologies due to its high technical competencies. As a result one would expect to find best and brightest applicant for the vacant position and in turn better organisational performance
SIGNIFICANCE OF e-RECRUITMENT OVER TRADITIONAL RECRUITMENT i) Cost efficiency: advertisements posted on internet are cheaper as compared to those on newspapers or magazines. Posting of vacancy on company
own website cost very less as compared to others methods of recruitment available with the company. Karla jurgan et al (2008) had empirically examined cost effectiveness of e-recruitment over traditional recruitment and argued that how Bank of Montreal saved 1 million dollar cost by using e-recruitment for recruiting employees.
ii) Larger audience: in the era of globalisation and liberalisation. The pool of applicants has widened and crossed the national boundaries’. Today youths are fully dependent on internet for any new information’s, and job vacancies are not the exception, through internet they can easily log on the internet from anywhere, at any time.
iii) Reduced paper work: In e-recruitment system all the works are done electronically so it reduce paper work iv) Greater chance to find right candidate quicker/with greater effectiveness: As e-recruitment spread over larger geographical area it gives an
opportunity to the larger number of prospective employees to apply for the same and selection will be made from larger pool of applicant so there is every possibility to find right candidate among huge applications.
v) Faster process: Today e-recruitment saves a lot of time which was highly involved in conventional methods of recruitment. Karla jurgan et al (2008) examined how e- recruitment helped IBM company to reduce recruiting time from six weeks to one day;
vi) 24/7 - no waiting for issue dates: it provides round 24 hours services to both organisation and the applicants. It has resulted both win-win situation for both the company and employees
vii) More opportunities for smaller companies: E-recruitment is still under its nascent stage and it will take time to penetrate so there are more opportunities for smaller companies to reap the benefit of e-recruitment in terms of cost, time and efficiency.
LIMITATION OF E-RECRUITMENT (ii) Development fees for small companies: it requires huge cost if a company wants to shift its system from traditional recruitment to e-recruitment for
recruiting so it is not wise for the small company to make use of this method as it requires huge development cost. (iii) Outdated résumés: There is every possibility of false and outdated resumes being uploaded by prospective employees, as there is no complete
authenticity about the originality and correctness of the résumé uploaded by a particular person (iv) Huge number of unqualified candidates: Many organisations have reported of getting larger number of unqualified candidate. Due to larger number
of unqualified candidates it becomes very difficult for the companies to choose the appropriate candidates for the various vacancies posted by them on the internet.
(v) Poor segmentation of the market: There is no segmentation of market as vacancies are posted online and anyone can access to a vacancy from anywhere, anytime there is no question of market segmentation.
(vi) Transparency of data: In this system of recruitment there is no transparency of data as it is available on internet and anyone can access one’s data instantly as there is no privacy of data.
CONCLUSION There are two important methods of recruitment available with the companies’ i.e. traditional method and recruitment through internet. In the discussion it was found that e-recruitment is superior to traditional recruitment in many aspects but, still the importance of employing traditional method of recruitment in the recruitment process of the companies cannot be ignored. There is many times in which only traditional method can be used while recruiting the employees. Therefore, traditional recruitment cannot be replaced by e-recruitment completely, and the limitations of traditional method of recruitment can better be utilized by e-recruitment and vice versa. Due to rapid increase in technology many new techniques of recruitment are available with the companies which are better than traditional techniques in many aspects as seen in discussion. In India there has been drastic increase in the number of internet users and this numbers expected to rise in future also, so it is advisable for the companies to employ online method of recruitment as it reduces recruitment cost, time and expedite recruitment process.
I Limited adoption/ traditional applicant pool
II Robust adoption/ premium applicant pool
III Limited adoption/ Limited applicant pool
IV Robust adoption/ enhanced applicant pool

VOLUME NO. 4 (2014), ISSUE NO. 06 (JUNE) ISSN 2231-5756
INTERNATIONAL JOURNAL OF RESEARCH IN COMMERCE, IT & MANAGEMENT A Monthly Double-Blind Peer Reviewed (Refereed/Juried) Open Access International e-Journal - Included in the International Serial Directories
http://ijrcm.org.in/
71
REFERENCES 1. Armstrong, M. (2006) a Handbook of Management Techniques: A Comprehensive Guide to Achieving Managerial Excellence 2. Aswathappa, K. (2005). Human resource and personnel management Tata McGraw-Hill Education 3. Avinash S. Kapse, Vishal S. Patil, Nikhil V. Patil (2012). E recruitment International Journal of Engineering and Advanced Technology (IJEAT) ISSN: 2249 –
8958, Volume-1, Issue-4 4. Dhamija, P. (2012) E-RECRUITMENT: A ROADMAP TOWARDS E-HUMAN RESOURCE MANAGEMENT. 5. Du Plessis, A. (2010). International human resource management: An overview of its effect on managers in global organizations. Interdisciplinary Journal of
Contemporary Research in Business, 2(4), 178-192. 6. Du Plessis, A. J., & Frederick, H. (2012) Effectiveness of e-recruiting: empirical evidence from the Rosebank business cluster in Auckland, New Zealand.
Science journal of business management, 2012 7. Du Plessis, A., Nel, P.S., Marriott, J., and Mathew, A. (2007) the use of e-recruiting methods: are they in a vogue and effective? Some views. ANZAM 4-7
December, Sydney. Chapman, R. CD Rom. Proceedings of the 21st Australia and New Zealand Academy of Management Conference (ANZAM) 8. Galanaki, E. (2002). The decision to recruit online: a descriptive study. Career Development International, 7(4), 243-251. 9. Hopkins, B &Markham, J. (2003) E-HR: using intranets to improve the effectiveness of yours People. Gower Publishing, Ltd. 10. Keep, E., & James, S. (2010). Recruitment and selection: the great neglected topic. SKOPE Research Paper, 88 11. Llorens, J. J. (2011) .A model of public sector e-recruitment adoption in a time of hyper technological change Review of Public Personnel Administration,
31(4), 410-423 12. Marr, E. R. (2007). E-recruitment: the effectiveness of the internet as a recruitment source. 13. Poorangi, M. M., Razavi, S., & Rahmani, N. (2011) An Evaluation of the Effectiveness of E-recruitment Practices for SMEs in Malaysia 14. Sharma, V. (2011).Impact of e-recruitment on human resource supply chain management: an empirical investigation of service industry in Indian context. 15. Tong, D. Y. K. (2009) A study of e-recruitment technology adoption in Malaysia. Industrial Management & Data Systems, 109(2), 281-300. 16. TYAGI, A. (2012) EFFECTIVE TALENT ACQUISITION THROUGH E-RECRUITMENT: A STUDY. 17. Verhoeven .H. & Williams, S. (2008). Advantages and disadvantages of internet recruitment: a UK study into employers’ perceptions’. International review
of business research papers, 4(1), 364-373.

VOLUME NO. 4 (2014), ISSUE NO. 06 (JUNE) ISSN 2231-5756
INTERNATIONAL JOURNAL OF RESEARCH IN COMMERCE, IT & MANAGEMENT A Monthly Double-Blind Peer Reviewed (Refereed/Juried) Open Access International e-Journal - Included in the International Serial Directories
http://ijrcm.org.in/
72
REQUEST FOR FEEDBACK
Dear Readers At the very outset, International Journal of Research in Commerce, IT & Management (IJRCM) acknowledges & appreciates your efforts in showing interest in our present issue under your kind perusal. I would like to request you tosupply your critical comments and suggestions about the material published in this issue as well as on the journal as a whole, on our [email protected] for further improvements in the interest of research. If youhave any queries please feel free to contact us on our E-mail [email protected]. I am sure that your feedback and deliberations would make future issues better – a result of our joint effort. Looking forward an appropriate consideration. With sincere regards Thanking you profoundly Academically yours Sd/- Co-ordinator
DISCLAIMER The information and opinions presented in the Journal reflect the views of the authors and not of the Journal or its Editorial Board or the Publishers/Editors. Publication does not constitute endorsement by the journal. Neither the Journal nor its publishers/Editors/Editorial Board nor anyone else involved in creating, producing or delivering the journal or the materials contained therein, assumes any liability or responsibility for the accuracy, completeness, or usefulness of any information provided in the journal, nor shall they be liable for any direct, indirect, incidental, special, consequential or punitive damages arising out of the use of information/material contained in the journal. The journal, nor its publishers/Editors/ Editorial Board, nor any other party involved in the preparation of material contained in the journal represents or warrants that the information contained herein is in every respect accurate or complete, and they are not responsible for any errors or omissions or for the results obtained from the use of such material. Readers are encouraged to confirm the information contained herein with other sources. The responsibility of the contents and the opinions expressed in this journal is exclusively of the author (s) concerned.

VOLUME NO. 4 (2014), ISSUE NO. 06 (JUNE) ISSN 2231-5756
INTERNATIONAL JOURNAL OF RESEARCH IN COMMERCE, IT & MANAGEMENT A Monthly Double-Blind Peer Reviewed (Refereed/Juried) Open Access International e-Journal - Included in the International Serial Directories
http://ijrcm.org.in/
IV