volume ii - geodetic vertical and water level datums - medical and
TRANSCRIPT

Volume II Geodetic Vertical and Water Level Datums II-i This is a preliminary report subject to revision; it does not contain final conclusions of the United States Army Corps of Engineers.
Performance Evaluation of the New Orleans and Southeast Louisiana Hurricane Protection System Final Report of the Interagency Performance Evaluation Task Force
Volume II – Geodetic Vertical and Water Level Datums
26 March 2007
FINAL

DISCLAIMER: The contents of this report are not to be used for advertising, publication, or promotional purposes. Citation of trade names does not constitute an official endorsement or approval of the use of such commercial products. All product names and trademarks cited are the property of their respective owners. The findings of this report are not to be construed as an official Department of the Army position unless so designated by other authorized documents.
Volume I – Executive Summary and Overview Volume II – Geodetic Vertical and Water Level Datums Volume III – The Hurricane Protection System Volume IV – The Storm Volume V – The Performance – Levees and Floodwalls Volume VI – The Performance – Interior Drainage and Pumping Volume VII – The Consequences Volume VIII – Engineering and Operational Risk and Reliability Analysis Volume IX – General Appendices
Volume II Geodetic Vertical and Water Level Datums
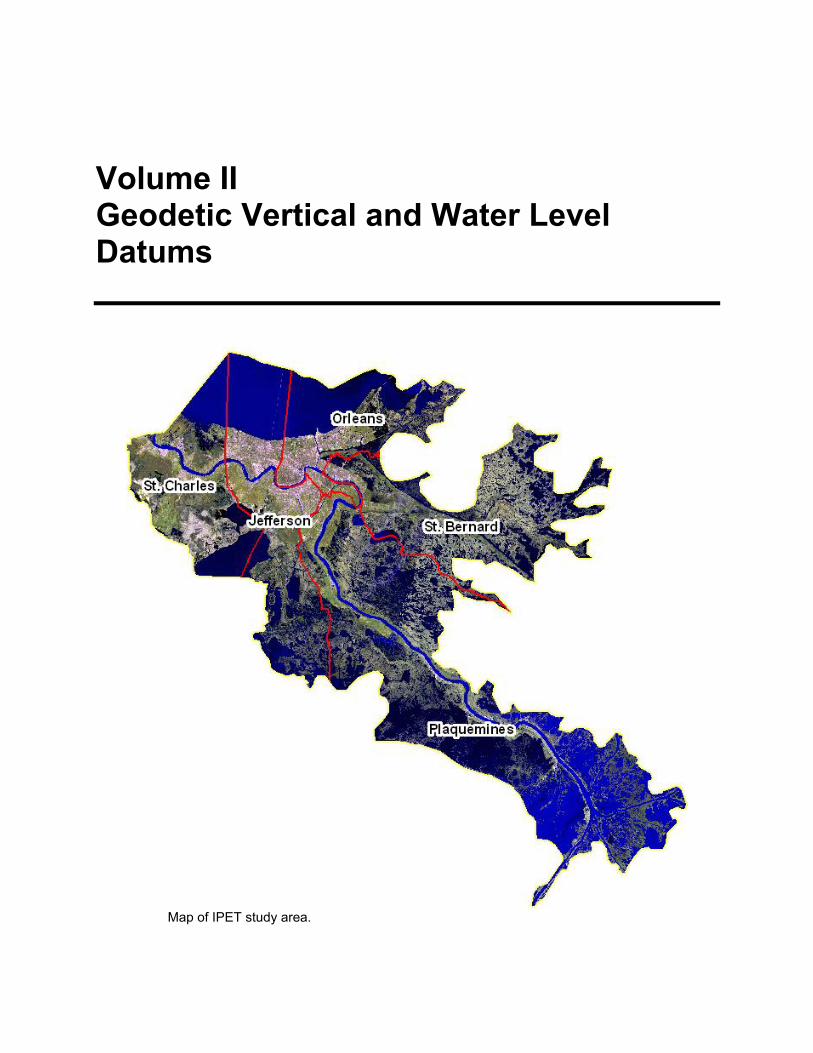
Map of IPET study area.

II-ii Volume II Geodetic Vertical and Water Level Datums This report is the independent opinion of the IPET and is not necessarily the official position of the U.S. Army Corps of Engineers.
Contents
Executive Summary .........................................................................................................................1
Participants.......................................................................................................................................3
Scope and Purpose ...........................................................................................................................4
General Background on Elevation Datums Used in Coastal Engineering Design and Construction in Southeast Louisiana ...................................................................................5
Overview of Vertical Datums ..........................................................................................................7
Geodetic Datums........................................................................................................................7 National Geodetic Vertical Datum of 1929 (NGVD29).............................................................8 Equipotential Surfaces and the Geoid .......................................................................................9 Measuring Heights (Elevations) from GPS Observations .......................................................10 North American Vertical Datum of 1988 (NAVD88)--Definitions and Adjustment ................11 Development of the Time-Dependent NAVD88 (2004.65) Reference Framework for
Southeast Louisiana...........................................................................................................14 Accuracy Assessment of the NAVD88 (2004.65) Framework in Southeast Louisiana............15 Tidal Reference Datums...........................................................................................................16
Other Reference Datums Used for Navigation and Flood Control Structure Construction in Southeast Louisiana...........................................................................................................18
New Cairo Datum of 1910 .......................................................................................................18 Mean Gulf Level (MGL) and Mean Low Gulf (MLG) Datums................................................19 Mississippi River Low Water Reference Plane (LWRP) Datums ............................................22
GPS Data Collection and Processing to Update Reference Elevations on Southeast Louisiana Tide Gauges ......................................................................................................24
Development of GPS Survey Data Collection Network Design...............................................24 Static GPS Survey Phases........................................................................................................24 GPS Data Collection and Processing Procedures ..................................................................27 Estimated Accuracy of the Resultant GPS Vertical Control Survey........................................29 Comparison of Provisional and Final Elevation Adjustments ................................................30 Comparison of CORS-Only Elevation Adjustment ..................................................................30
NOAA Tidal Datum Computational Procedures and Estimated Accuracies in Southeast Louisiana ...........................................................................................................................32
Review of Tidal Datums and Tidal Datum Computation Procedures .....................................32 NOAA Definitions of Tidal Datums .........................................................................................32 Tidal Datum Computation Overview.......................................................................................33 Errors in Determination of Tidal Datums Using NOAA Procedures ......................................36 Total Estimated Uncertainty in Tidal Datum Computation for Subordinate Station ..............39

Volume II Geodetic Vertical and Water Level Datums II-iii This report is the independent opinion of the IPET and is not necessarily the official position of the U.S. Army Corps of Engineers.
Reestablishment of New Canal (17th Street Canal) Gauge Station and Associated Tidal Datum Error.......................................................................................................................40
Connection between Tidal Datums and Geodetic Datums in Southeast Louisiana.......................44
Use of a Modified NTDE Procedure for Geographical Areas with High Rates of Sea-Level Change .....................................................................................................................45
Areas with Anomalous Sea Level Trends.................................................................................45 Local Mean Sea Level (LMSL) ................................................................................................46
Updated Tidal Datums in the IPET Study Area--LMSL Relationships to NAVD88 (2004.65) ...........................................................................................................................47
Preliminary Local Mean Sea Level Relationship (December 2005) .......................................47 Rationale for Connections to Additional NOS Water Level Stations ......................................50
Local Mean Sea Level Relationships in the IPET Study Area ......................................................52
Modified 5-Year Tidal Datum Analysis for New Orleans Study Area .........................................56
Local Mean Sea Level at IHNC Florida Avenue Gauge Site (1969) ............................................59
Relative Sea Level Trends in the IPET Study Area.......................................................................61
Introduction..............................................................................................................................61 Variation in Sea Levels and Global Sea Level Rise.................................................................61 Seasonal Variation...................................................................................................................61 Error Estimates........................................................................................................................63 Analysis Stations ......................................................................................................................65 Sea Level Rates at USACE Stations.........................................................................................67 Conclusions on Sea Level and Subsidence Trends ..................................................................69
Data Analysis and Impacts: Evaluation of Designed and Constructed Elevations on Flood Control and Hurricane Protection Structures ...................................................................71
Purpose ....................................................................................................................................71 Methodology ............................................................................................................................71 Geodetic Vertical Datum and Tidal Epoch Elevations............................................................71 Typical Geodetic and Water Level Datums Used in New Orleans Area Floodwall
Construction.......................................................................................................................73 Subsidence and Settlement Considerations in Protective Structure Elevations ......................77
Data Analysis and Impacts: Orleans Avenue Outfall Canal Construction Reference Datums.....79
Summary of Findings ...............................................................................................................79 Reference Documents...............................................................................................................79 Design Elevation Parameters ..................................................................................................80 Reference Benchmark for Orleans Canal Floodwall Construction.........................................81 Local Mean Sea Level Relationships at the Orleans Avenue Outfall Canal ...........................83 Impact of Datum Variations on Constructed Floodwall Elevations........................................83 Assessment of Pre- and Post-Katrina Flood Protection Elevations (Orleans Avenue
Outfall Canal) ....................................................................................................................84
Data Analysis and Impacts: London Avenue Outfall Canal Construction Reference Datums......87

II-iv Volume II Geodetic Vertical and Water Level Datums This report is the independent opinion of the IPET and is not necessarily the official position of the U.S. Army Corps of Engineers.
Summary of Findings ...............................................................................................................87 Reference Documents...............................................................................................................87 Design Elevation Parameters ..................................................................................................87 Reference Benchmark Used in London Outfall Canal Parallel Floodwall
Construction.......................................................................................................................90 Local Mean Sea Level Relationships at the London Avenue Outfall Canal ............................91 Impact of Datum Variations on Constructed Floodwall Elevations........................................92 Assessment of Pre- and Post-Katrina Flood Protection Elevations (London Avenue
Outfall Canal) ....................................................................................................................92
Data Analysis and Impacts: 17th Street Outfall Canal Construction Reference Datums ..............96
Summary of Findings ...............................................................................................................96 Reference Documents...............................................................................................................96 Design Elevation Parameters for 17th Street Canal ...............................................................96 Reference Benchmark Used in 17th Street Canal Parallel Floodwall Protection ................100 Derived Elevations of Benchmark MONUMENT 14 .............................................................101 Assessment of Pre- and Post-Katrina Flood Protection Elevations (17th Street
Outfall Canal) ..................................................................................................................102
Data Analysis and Impacts: Inner Harbor Navigation Canal (IHNC) Construction Reference Datums ...........................................................................................................105
Summary of Findings .............................................................................................................105 Reference Documents.............................................................................................................105 Design Elevation Parameters for East Levee Floodwall Capping (1969)--IHNC Lock
to Florida Ave Sta. 0+00 to 56+20..................................................................................105 Historical Adjustments to Reference Benchmark M 152 (1951 to date) ...............................106 Assessment of Pre- and Post-Katrina Flood Protection Elevations (IHNC East Bank
Floodwall between Claiborne and Florida Avenues)......................................................108 Design versus Current Floodwall Elevations in the IHNC between the GIWW
Confluence to the Seabrook Bridge (East and West Banks) ............................................111
Reference Datums for Hurricane Protection Projects in St. Bernard and Plaquemines Parishes............................................................................................................................113
Lake Pontchartrain and Vicinity Projects .............................................................................113 New Orleans to Venice Projects ............................................................................................115 Mississippi River Gulf Outlet (MRGO) Projects ...................................................................116
Estimating Subsidence Rates in the Southeast Louisiana Region from Geodetic Observations ....................................................................................................................118
Corps of Engineers Policies on Use of Geodetic and Water Level Datum Relationships in Design and Construction of Hurricane Protection Structures .........................................122
Background............................................................................................................................122 Assumed Relationship between Geodetic Datums and Sea Level..........................................122 Corps Policy Guidance on the Redefined NAVD88 Geodetic Datum ...................................125 New Orleans District Policy Memorandum on Geodetic Datum Readjustments ..................126 Historical Event Timeline on Use of Geodetic Vertical Datums in New Orleans
District .............................................................................................................................129

Volume II Geodetic Vertical and Water Level Datums II-v This report is the independent opinion of the IPET and is not necessarily the official position of the U.S. Army Corps of Engineers.
Field Topographic Survey Support to Other IPET Teams...........................................................135
Field Survey Procedures and Specifications .........................................................................137 Data Processing and Submittal .............................................................................................141 Quality Control and Quality Assurance Procedures .............................................................141 Methodology for Converting Previous Vertical Datums/Adjustments to NAVD88
(2004.65)..........................................................................................................................141
Summary of Findings and Lessons Learned................................................................................143
High-Resolution Hydrodynamic Model Relationships to Geodetic and Sea Level Datums .............................................................................................................................143
Mean Low Gulf Datum Conversion to Mean Lower Low Water Datum ...............................143 Dual Elevations on Flood Control and Hurricane Protection Structures.............................143 Geospatial Data Source Feature or Metadata Records ........................................................144 Epoch Designations of Published Topographic Elevations...................................................144 Future Updates to Geodetic Elevations in Southeast Louisiana Region...............................144 Co-located CORS and NWLON Sites for Subsidence Monitoring.........................................145 New Orleans District Water Level Gauges............................................................................145 Local Mean Sea Level Epoch Updates and Relationships.....................................................146 Definitions of NGVD29, NAVD88, Mean Sea Level, and Local Mean Sea Level .................146 Hurricane Season Biases in Local Mean Sea Level Averages ..............................................146 Coordination of Topographic Survey Data Collection, Processing, and Management ........146 Vertical Control Monumentation Requirements and Stakeout Procedures on Flood
Control Construction Projects.........................................................................................147 LIDAR and Photogrammetric Mapping Calibration and Testing .........................................147 USACE Policy and Manual on Maintaining Geodetic and Water Level Datums in
High Subsidence Areas ....................................................................................................148 Differential GPS and Related Survey Standards for Establishing Construction
Control .............................................................................................................................148 Certification Policy on Use of Vertical Datums for All Applications....................................148
References....................................................................................................................................149
Corps of Engineers References..............................................................................................149 Federal Geographic Data Committee References.................................................................151 NOAA NGS References ..........................................................................................................152 NOAA CO-OPS References ...................................................................................................153
Glossary of Abbreviations and Acronyms...................................................................................155
Appendix 1: Lidar Patch Check Areas
Appendix 2: Topographic and Hydrographic Cross Section Data
Appendix 3: Topographic and Hydrographic Cross Section Data
Appendix 4: IHNC West Bank Breach Surveys
Appendix 5: Railroad Detail
Appendix 6: 17th Street Canal – Low Chord Elevations
Appendix 7: Inner Harbor Navigation Canal – Low Chord Elevations

II-vi Volume II Geodetic Vertical and Water Level Datums This report is the independent opinion of the IPET and is not necessarily the official position of the U.S. Army Corps of Engineers.
Appendix 8: London Avenue Canal – Low Chord Elevations
Appendix 9: Orleans Avenue Canal – Low Chord Elevations
Appendix 10: High Water Marks – Orleans Parish, Interior
Appendix 11: High Water Marks Inner Harbor Navigation Canal, West Bank
Appendix 12: High Water Marks, Lower Plaquemines Parish
Appendix 13: High Water Mark, St. Bernard Parish
Appendix 14: Inner Harbor Navigation Canal West/SeaLand-Maresk Topographic Detail
Appendix 15: Lake Pontchartrain/IHNC Gauge Connections
Appendix 16: Time Stamped Surge Elevations - New Orleans Lakefront Airport
Appendix 17: Time Stamped Surge Elevations – Orleans Marina (Near New Canal at Lakefront)
Appendix 18: Topographic and Hydrographic Cross Section Data
Appendix 19: Topographic and Hydrographic Cross Section Data
Appendix 20: Topographic and Hydrographic Cross Section Data
Appendix 21: Bridge/Floodwall Ties
Appendix 22: Orleans Outfall Canal BM ALCO to CHRYSLER Level Run
Appendix 23: Permanent and Temporary Control Used and Established for IPET Surveys
Appendix 24: Pump Stations Surveyed, Listed by Parish
Appendix 25: Jefferson Parish Pump Stations
Appendix 26: Orleans Parish Pump Stations
Appendix 27: Plaquemines Parish Pump Stations
Appendix 28: St. Bernard Parish Pump Stations
Appendix 29: St. Charles Parish Pump Stations
Appendix 30: 1985 New Orleans Policy on NGS Benchmarks
Appendix 31: GPS Network Adjustment - IPET Project Report
Appendix 32: IPET Digital Leveling Specifications
Appendix 33: IPET Survey Task Order–Contract Scope of Work
Appendix 34: NAVD88 ETL 1110-1-152 1994
Appendix 35: NGS Data Sheet for IPET GPS Control
Appendix 36: Outfall Canal Post-Katrina Topographic Surveys
Appendix 37: IPET Supplemental Survey Scope of Work
Appendix 38: ETL 1110-2-349 Coastal MLLW Datum
Appendix 39: Monument Memo

Volume II Geodetic Vertical and Water Level Datums II-vii This report is the independent opinion of the IPET and is not necessarily the official position of the U.S. Army Corps of Engineers.
Appendix 40: Historical Timeline
Appendix 41: Benchmark History
Appendix 42: Leveling Abstracts
List of Figures
Figure 1. Precise level lines and tide gauges used to define the NGVD29 datum. ................ 9 Figure 2. Relationship between the ellipsoid, geoid, and orthometric heights..................... 10 Figure 3. Differences in centimeters between NGVD29 and NAVD88. ............................. 12 Figure 4. Location of fixed benchmarks defining NAVD88 (2004.65). .............................. 15 Figure 5. New Orleans District datum plane conversions. ................................................... 21 Figure 6. Martello Castle, Lake Borgne. .............................................................................. 25 Figure 7. Shell Beach, Lake Borgne..................................................................................... 25 Figure 8. Phase 1a and Phase 1b geodetic connections established by 3001, Inc. ............... 26 Figure 9. Comparison of presently accepted tidal datums with preliminary tidal
datums computed on most recent data from New Canal Station (8761927). Elevations are relative to arbitrary station “0”...................................................... 40
Figure 10. Estimation of uncertainty in tidal datum computation for 9-year historical data collected at NOAA Tide Station 876 1927, units in feet. ............................. 42
Figure 11. Estimation of uncertainty in tidal datum computation for newly collected 3 months of data at NOAA Tide Station 876 1927, units in feet............................. 43
Figure 12. Excerpt from published benchmark sheet for Waveland, MS, showing the relationship of NAVD88 to tidal datums. ............................................................. 44
Figure 13. NOS preliminary Local Mean Sea Level (LMSL) (1983-2001 NTDE) minus NAVD88 (2004.65) differences for southern Lake Pontchartrain............. 48
Figure 14. Excerpt from NOS tidal benchmark sheet summarizing the procedure used to obtain the new relationship between LMSL (1983-2001) and NAVD88 (2004.65)—December 2005. ................................................................................ 49
Figure 15. Planned locations of the 3001, Inc. Phase 1a and Phase 1b operations plan to tie in additional NOS water level stations in support of the IPET.................... 50
Figure 16. Phase 1a and Phase 1b geodetic connections established by 3001, Inc. in support of the IPET............................................................................................... 51
Figure 17. Excerpt from NOS tidal benchmark sheet summarizing the procedure used to obtain the relationship between LMSL and NAVD88 (2004.65) at New Canal Station......................................................................................................... 53
Figure 18. Preliminary LMSL (1983-2001 NTDE) – NAVD88 (2004.65) relationships in the IPET region. Values in feet......................................................................... 54
Figure 19. Rates of vertical displacement for benchmarks near Michoud Substation from NOAA Technical Report 50 (NGS 2004). ................................................... 55
Figure 20. New LMSL (2001-2005 NTDE) – NAVD88 (2004.65) relationships based on 2001-2005 updated tidal datums...................................................................... 57

II-viii Volume II Geodetic Vertical and Water Level Datums This report is the independent opinion of the IPET and is not necessarily the official position of the U.S. Army Corps of Engineers.
Figure 21. Methodology for determining LMSL (2001-2005 NTDE) – NAVD88 (2004.65) relationship at USACE water level stations. ........................................ 58
Figure 22. Long-term water level data collected at Florida Avenue, USACE water level station (1944-2003). ..................................................................................... 59
Figure 23. January 1967 to October 1971 water level data collected at Florida Avenue, USACE water level station. .................................................................................. 60
Figure 24. Monthly LMSLs from Pensacola to Galveston (meters above LMSL). ............... 62 Figure 25. Seasonal variations in the IHNC (Florida Avenue gauge).................................... 63 Figure 26. Standard error of linear LMSL trends versus year range in data .......................... 64 Figure 27. 95% confidence interval for linear MSL trends versus year range of data ........... 65 Figure 28. LMSL trends from 1982 to present for selected Stations in the IPET study
area........................................................................................................................ 66 Figure 29. LMSL trends from 1982 -1992 for selected Stations in the IPET study area. ...... 66 Figure 30. Possible datum shifts identified from raw COE data through comparison
with NOS data series at Pensacola, Dauphin Island, and Grand Isle.................... 68 Figure 31. Three separate time series derived from simultaneous comparison of
USACE Florida Avenue data with NOS data identifying significant datum shifts near 1978 and 1982. .................................................................................... 68
Figure 32. Sea level trend calculated from combination of the three segments identified in the previous analysis is approximately 7.90 mm/yr. ........................ 68
Figure 33. Datum relationships at Benchmark ALCO and NOAA New Canal Gauge (1951 to 2006) (Source: NOAA). ......................................................................... 75
Figure 34. IPET GPS surveys in December 2005 at Benchmark ALCO on seawall bulkhead at USCG station vicinity NOAA New Canal Gauge (3001, Inc.)......... 76
Figure 35. Typical I-wall section at elevation 14.90 ft (DACW29-93-C-0077). ................... 80 Figure 36. “Normal Water Surface” notation on flood-side of Orleans Outfall Canal
(typical) DACW29-95-B-0035. ............................................................................ 81 Figure 37. Impact of using NGVD elevation instead of LMSL elevation for construc-
tion stakeout of Orleans Avenue Outfall Canal floodwall construction (DACW29-93-C-0077). (Elevation differences are rounded to the nearest tenth of a foot.)...................................................................................................... 86
Figure 38. Hydraulic profiles referenced to “NGVD” in GDM 20 (Revised May 1990). .................................................................................................................... 88
Figure 39. Typical section of floodwall with 14.4 ft design elevation on London Avenue I-wall........................................................................................................ 89
Figure 40. Typical portion of stage hydrograph on London Avenue Canal depicting 1+ ft superelevation based on the gauge at the Seabrook Bridge in the IHNC (DACW29-94-C-0079 (94-B-0047)........................................................... 89
Figure 41. Reference benchmarks (Gentilly Blvd. Bridge floodproofing—DACW29-99-C-0005)............................................................................................................ 90
Figure 42. Impact of using NGVD elevation instead of LMSL elevation for con-struction stakeout of London Ave. Outfall Canal floodwall construction. ........... 95
Figure 43. Typical section and General Note depicting “normal water surface” in 17th Street Canal at 1.5 to 2.0 ft elevation. (Contract 92-1 Board of Levee Commissioners of East Jefferson Levee District -17th Street Canal West Side Levee Improvements). .................................................................................. 97

Volume II Geodetic Vertical and Water Level Datums II-ix This report is the independent opinion of the IPET and is not necessarily the official position of the U.S. Army Corps of Engineers.
Figure 44. Typical section depicting “normal water surface” in 17th Street Canal at 1.0 ft elevation (Orleans Levee District Contract 02043-0489--1990-As-Built). .................................................................................................................... 98
Figure 45. DM 20 design flowlines. ....................................................................................... 99 Figure 46. 17th Street Canal Reference Benchmark USACE MONUMENT 14 near
Hammond Hwy................................................................................................... 100 Figure 47. Design versus current floodwall elevation—East Bank 17th St. Outfall
Canal. .................................................................................................................. 104 Figure 48. Location and description for Benchmark BM 1 (M 152 USC&GS) at IHNC
Lock. ................................................................................................................... 106 Figure 49. East side I-wall design elevation 15.0 ft (Sta. 2+00 typical). ............................. 107 Figure 50. IHNC East side floodwall capping—IHNC Lock north to Florida Avenue
(Lower 9th Ward breach at approximately Sta. 2+00). ...................................... 107 Figure 51. Selected post-Katrina elevations on IHNC Floodwalls. ..................................... 109 Figure 52. Apparent sea level rise at Corps IHNC Florida Ave. Gauge 1944 to 2003
(Source: IPET New Orleans District and NOAA CO-OPS)............................... 111 Figure 53. Design versus current elevations in IHNC. Design elevations in feet
referenced to MSL. Current elevations in feet referenced to LMSL (2001-2005). Grade sectors and current elevations are approximate. ........................... 112
Figure 54. Average Lake Pontchartrain stages (DM 01 Part 3—1968). .............................. 113 Figure 55. +1.0 ft superelevation on Lake Borgne and Lake Pontchartrain (DM 01
Part 1).................................................................................................................. 114 Figure 56. +1.0 ft “Mean Lake Level” relative to MSL for Lake Pontchartrain (DM 01
Part 3).................................................................................................................. 115 Figure 57. NGVD29 network adjustment impact (Appendix B--DM 01 GDM Supp 06
(1987))................................................................................................................. 116 Figure 58. GIWW water level stages at Paris Road (DM 01 GDM).................................... 117 Figure 59. Apparent sea level rise at Corps IHNC Florida Ave. Gauge 1944 to 2003
(Source: IPET MVN and NOAA CO-OPS). ...................................................... 119 Figure 60. Estimated subsidence (in centimeters) in the New Orleans to Venice
region. ................................................................................................................. 121 Figure 61. National vertical net name change. ..................................................................... 122 Figure 62. ETL 1110-1-97.................................................................................................... 123 Figure 63. (Left) Static GPS survey to establish elevation on a benchmark outside a
St. Bernard Parish pump station. (Right) Leveling first floor elevation inside Jefferson Parish Pump Station No. 3........................................................ 138
Figure 64. (Left) IHNC Almonaster Bridge—low chord elevation 3.51 ft NAVD88 (2004.65). (Right) Leveling to USGS recording gauge and Orleans Levee District staff gauge on I-10 bridge over IHNC. .................................................. 138
Figure 65. General map depicting locations of pump stations surveyed by IPET/3001, Inc. in the five-parish area. ................................................................................. 139
Figure 66. Typical low chord measurement—London Avenue Canal Bridge No 4 (IPET/3001, Inc.). ............................................................................................... 140
Figure 67. Surge and high water mark elevations at Orleans Marina (17th Street Canal) (IPET/3001, Inc.)..................................................................................... 140
Figure 68. Elevation changes at Benchmark ALCO 1931 since 1951. ................................ 142

II-x Volume II Geodetic Vertical and Water Level Datums This report is the independent opinion of the IPET and is not necessarily the official position of the U.S. Army Corps of Engineers.
List of Tables
Table 1. Adjustments in the United States between 1900 and 1929 ..................................... 8 Table 2. Comparison between NGVD29 and NAVD88 Adjustments................................ 13 Table 3. Louisiana Vertical Time-Dependent Position (VTDP) Free Adjustment ............. 15 Table 4. Historical Datums in Southeast Louisiana Region1.............................................. 19 Table 5. Phase 1a and 1b Comparisons between GrafNet and ADJUST............................ 30 Table 6. Phase 1a & 1b Comparisons between GrafNet CORS-Only Solution and
ADJUST................................................................................................................ 30 Table 7. Generalized Accuracy of Tidal Datums for East, Gulf, and West Coasts
When Determined from Short-Term Series of Record (one sigma) from Swanson (1974) .................................................................................................... 37
Table 8. Preliminary relationships of LMSL (1983-2001 NTDE) relative to NAVD88 (2004.65) .............................................................................................. 49
Table 9. Summary of Geodetic Connections Established after 3001, Inc. Surveying Operations ............................................................................................................. 52
Table 10. Initial LMSL 1983-2001 NTDE – NAVD88 (2004.65) Relationships in IPET Study Area ................................................................................................... 54
Table 11. New LMSL (2001-2005 NTDE) – NAVD88 (2004.65) Relationships Based on 2001-2005 Updated Tidal Datums ........................................................ 56
Table 12. Summary of Rise in Sea Level for Selected Gulf Stations ................................... 69 Table 13. Successive Elevations on Benchmark CHRYSLER RM from 1951 to 2006....... 82 Table 14. Design and Current Floodwall Elevations in Selected Reaches (Orleans
Avenue Outfall Canal) .......................................................................................... 84 Table 15. Current Flood Protection Elevations on Orleans Avenue Outfall Canal
Floodwalls Relative to LMSL Epochs (elevations in feet)................................... 85 Table 16. Successive Elevations on Benchmark P 153 from 1951 to 2006.......................... 91 Table 17. Design and Current Floodwall Elevations in Selected Reaches (London
Avenue Outfall Canal) New Orleans District/Task Force Guardian Post-Katrina Surveys Oct-Dec 2005 ............................................................................. 93
Table 18. Post-Katrina Floodwall Elevations Vicinity Breach Areas (London Avenue Outfall Canal) IPET Overbank Surveys January 2006 (3001, Inc.) ..................... 94
Table 19. Current Flood Protection Elevations on London Avenue Outfall Canal Floodwalls Relative to LMSL (1983-2001 epoch) (elevations in feet) ................ 95
Table 20. Design and Current Floodwall Elevations in Selected Reaches (17th Street Outfall Canal) New Orleans District/Task Force Guardian Post-Katrina Surveys Oct-Dec 2005 ........................................................................................ 102
Table 21. Post-Katrina Floodwall Elevations Vicinity East Bank Breach Area (17th Street Outfall Canal) IPET Overbank Surveys January 2006 (3001, Inc.)......... 103
Table 22. Current Flood Protection Elevations on 17th Street Outfall Canal Floodwalls Relative to LMSL (1983-2001 epoch) ............................................. 103
Table 23. Successive Elevations on Benchmark M 152 from 1951 to 2005 ...................... 108 Table 24. Post-Katrina Floodwall Elevations in Selected Reaches (East Bank IHNC)
IPET Surveys Overbank Surveys January 2006 (3001, Inc.) ............................. 110
Volume II Geodetic Vertical and Water Level Datums II-xi This report is the independent opinion of the IPET and is not necessarily the official position of the U.S. Army Corps of Engineers.
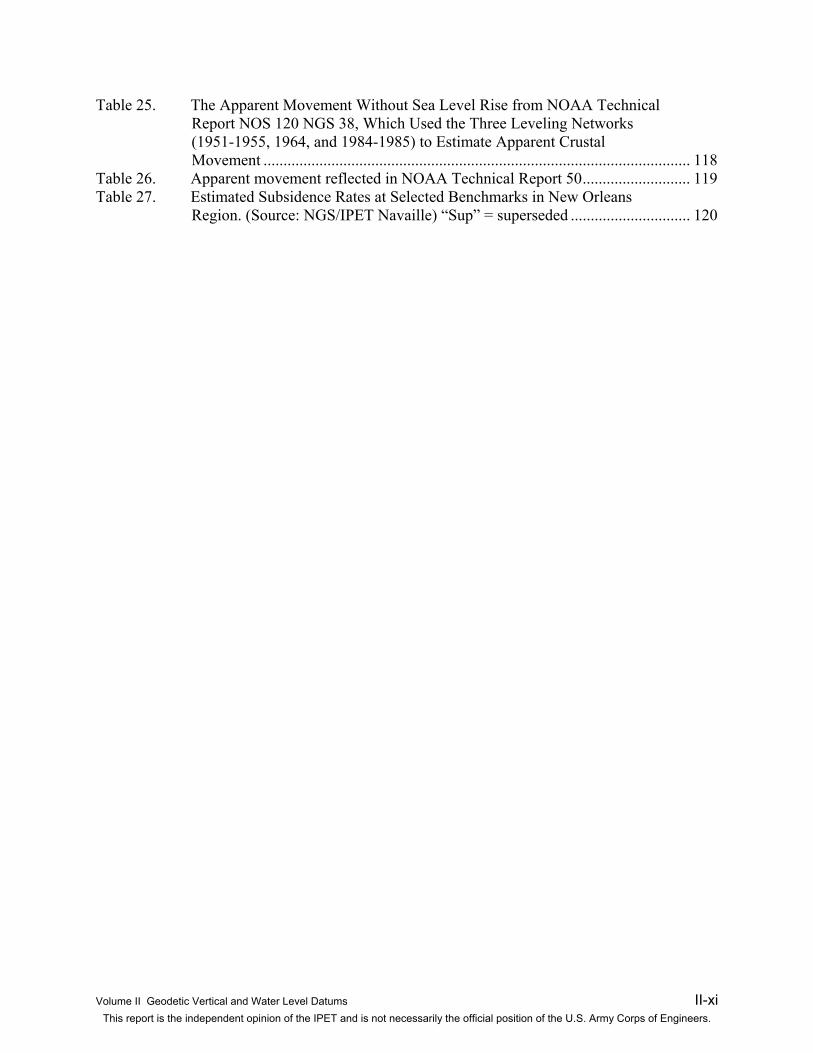
Table 25. The Apparent Movement Without Sea Level Rise from NOAA Technical Report NOS 120 NGS 38, Which Used the Three Leveling Networks (1951-1955, 1964, and 1984-1985) to Estimate Apparent Crustal Movement ........................................................................................................... 118
Table 26. Apparent movement reflected in NOAA Technical Report 50........................... 119 Table 27. Estimated Subsidence Rates at Selected Benchmarks in New Orleans
Region. (Source: NGS/IPET Navaille) “Sup” = superseded .............................. 120

Volume II Geodetic Vertical and Water Level Datums II-1 This report is the independent opinion of the IPET and is not necessarily the official position of the U.S. Army Corps of Engineers.
Executive Summary
An interagency team to study vertical reference datums was formed consisting of U.S. Army Corps of Engineers (USACE) and U.S. Department of Commerce National Oceanic and Atmospheric Administration (NOAA) personnel. The primary purpose was to define and eval-uate a vertical reference datum for the Southeast Louisiana area that would be compatible with concurrent Interagency Performance Evaluation Task Force (IPET) teams performing hydraulic model studies in the region (the preliminary IPET study area was Orleans, St. Bernard, Plaque-mines, St. Charles, and Jefferson Parishes in Southeast Louisiana). A secondary purpose was to evaluate the designed, constructed, and pre-Katrina elevations of flood control and hurricane protection structures in the region. This team, the Geodetic Vertical and Water Level Datums Team (GVWLDT), also provided significant field topographic surveying support to the IPET for various physical and numerical models.
The NOAA National Geodetic Survey (NGS) participants on this IPET team (GVWLDT) developed a new (October 2005) time-stamped vertical reference framework for this high subsidence region—termed North American Vertical Datum of 1988 NAVD88 (2004.65). The NOAA Center for Operational Oceanographic Products and Services (CO-OPS) participants were included on this study team given their expertise in tidal datums and defining water level-based references consistent with hydrodynamic models of the region.
A spatial and temporal variation was found to exist between the geodetic datums and the water level reference datums used to define elevations for regional hydrodynamic conditions. This 0.2- to 3.0-ft variation is critical in relating measurements of wave heights and water level elevations, high-resolution hydrodynamic conditions, water elevations of hydrostatic forces and loadings at levees and floodwalls, elevations of pump station inverts, and related elevations of flood inundation models deriving drainage volumes or first-floor elevations in residential areas. Flood control structures in this region were authorized, designed, and numerically modeled rela-tive to a water level reference datum (e.g., mean sea level). However, these structures were con-structed relative to a geodetic vertical datum that was incorrectly assumed as being equivalent to, or constantly offset from, a water level datum. These varied datums, coupled with redefinitions and periodic readjustments to account for the high subsidence and sea level variations in this region, significantly complicated the process of obtaining a basic reference elevation for hydro-dynamic modeling, risk assessment, and design, construction, and maintenance of flood control and hurricane protection systems. An IPET follow-on study by intergovernmental teams is recommended to refine the relationships between the various datums that are numerically com-patible with the varied hydraulic, hydrodynamic, geodetic, and flood inundation models such as those used by the Federal Emergency Management Agency (FEMA).
To the maximum extent possible, topographic surveys of flood control and hurricane protec-tion structures, interior drainage regions, hurricane surge, and high water marks used in various high-resolution hydrodynamic models were performed relative to the updated geodetic vertical datum developed by the NGS for this region—NAVD88 (2004.65). Some older geospatial data-sets acquired for this project were obtained from a variety of federal, state, regional, parish, and private entities. Many of these datasets had unverifiable vertical datum references and were of uncertain reliability or had not been ground-truthed. They were converted to the newer vertical datum framework, with mixed results and varying levels of confidence.

II-2 Volume II Geodetic Vertical and Water Level Datums This report is the independent opinion of the IPET and is not necessarily the official position of the U.S. Army Corps of Engineers.
Use of terrestrial-based geodetic vertical datums instead of water-level-referenced datums for floodwall design and construction was found to have caused flood protection deficiencies throughout the region.
In the Lake Pontchartrain Lakefront Outfall Canals in Orleans and Jefferson Parishes (London Avenue, Orleans Avenue, and 17th Street Outfall Canals), protection was constructed about 1 to 2 ft lower than intended —this would have been avoided had water level datums referenced in the concept designs been used. Subsequent land subsidence since construction has resulted in additional loss of protection. In effect, current flood protection levels have lost most of the freeboard allowances provided for in the original design, even though these freeboard allowances were not intended to compensate for datum or subsidence impacts. Hurricane Katrina water surface elevations (6 to 8 ft) were well below the later maximum surge heights at the time of the 17th Street Canal and London Avenue Canal breaches. These datum and subsidence effects did not play a role in these particular floodwall failures.
Current (pre-Katrina) flood protection elevations along the Inner Harbor Navigation Canal (IHNC) were also found to be below original design/constructed elevations—just over 2 ft in places. Most of this deficiency is the result of subsidence occurring over the past 35 years. As in the Lake Pontchartrain outfall canals, this equates to a loss of most, if not all, of the design free-board allowance. Because observed surge elevations in the IHNC at the time of failure were less than the current or pre-Katrina elevations of the floodwalls, it is uncertain whether the lost free-board would have had any impact on the failures.
The impact of spatially or temporally varying vertical datums and subsidence on hurricane protection levees in St. Bernard and Plaquemines Parishes was not directly evaluated, given the relative magnitude of Hurricane Katrina surge elevations over the design or pre-Katrina ele-vations on many of these structures. This is not to say these flood control structures are not subject to the same datum and subsidence losses in protection as those in Orleans Parish.
Volume II contains a concluding section summarizing GDWLDT’s findings and lessons learned during the course of this project.
The members of this interagency team feel that a continued (i.e., post-IPET) interagency USACE-NOAA partnership is needed. This partnership would include Headquarters, U.S. Army Corps of Engineers (HQUSACE), the New Orleans District, NOAA NGS, NOAA CO-OPS, and perhaps other federal or local agencies, such as FEMA. This continued technical cooperation will provide a long-term solution to accurately monitoring protective structure and surface drainage elevations in this region. To reach this end, however, significant institutional and technical changes will be required by both the USACE and NOAA to ensure efficient, but substantive and sustainable, engineering solutions are developed. NOAA possesses expertise in geodesy and tidal hydraulics that are essential to USACE high-resolution hydraulic modeling used in design and risk assessment. This enhanced and elevated interagency partnership and cooperation will pro-vide significantly improved baseline elevation data for near-term and long-term risk/reliability assessments of hurricane protection system performance evaluations in the New Orleans region.

Volume II Geodetic Vertical and Water Level Datums II-3 This report is the independent opinion of the IPET and is not necessarily the official position of the U.S. Army Corps of Engineers.
Participants
This report represents a joint effort by intergovernmental agencies (USACE and NOAA) with essential contract support from 3001, Inc., a New Orleans-based geospatial surveying and mapping firm. The following is a listing of individuals that actively participated on this project during the period October 2005 through May 2006, and directly or indirectly contributed to this report.
Name Agency Role
Jim Garster USACE/ERDC-TEC Lead Project Coordinator and Manager
Brian Shannon USACE/ERDC-TEC Planning, GPS Network Design, ties to MSL/gauges
M. K. Miles Headquarters, USACE HQUSACE sponsor
Bill Bergen Headquarters, USACE Co-Lead—Onsite New Orleans
Dave Zilkoski NOAA-NGS Co-Lead -- Director, National Geodetic Survey (NGS)
Dru Smith NOAA-NGS Chief Geodesist, National Geodetic Survey Ronnie Taylor NOAA-NGS National Geodetic Survey
Jeff Navaille USACE/SAJ (Jacksonville District) Onsite coordination and QC/QA of New Orleans survey crews
Mike Szabados NOAA/CO-OPS Co-Lead-- Director, Center for Operational Oceanographic Products and Services (CO-OPS)
Jerry Hovis NOAA/CO-OPS Tidal Datum Analysis and Computations
Steve Gill NOAA/CO-OPS Tidal Datum Analysis and Computations
Tom Landon NOAA/CO-OPS Tidal Datum Analysis
Mark Huber USACE/MVN (New Orleans District)
New Orleans District IPET Representative
Bob Mesko USACE/MVS (St. Louis District)
IPET A-E Contract support
John Purpera
A-E Contractor 3001, Inc. (New Orleans)
Field Survey Coordinator
Lonnie Zurfluh A-E Contractor 3001, Inc. (New Orleans)
GPS Computations
Dillon Payne A-E Contractor 3001, Inc. (New Orleans)
3001, Inc. Project Manager, Geospatial Analyst
Thomas Wolff Assoc. Dean, Michigan State University
Independent Technical Review
Thomas Leicht USACE/SAJ (Jacksonville District) Chief, Design Branch
Independent Technical Review
Bruce Taylor Taylor Engineering Independent Technical Review
Christine Anderson Director of Public Works, City of Long Beach, CA
ASCE External Review Panel Primary Contact

II-4 Volume II Geodetic Vertical and Water Level Datums This report is the independent opinion of the IPET and is not necessarily the official position of the U.S. Army Corps of Engineers.
Scope and Purpose
The primary focus of this study was to identify a common vertical reference framework for the various IPET physical models and high-resolution hydrodynamic models developed on this project. The common vertical reference framework chosen was the North American Vertical Datum of 1988—actually the 2004.65 adjustment to this datum (NAVD88 (2004.65)). This framework was adopted in order to relate flood control and hurricane protection system eleva-tions to the local water surface reference datum used in hydrologic, hydraulic, flood inundation, and risk assessment models, e.g., local mean sea level and river low water reference planes, etc. Controlling elevations on floodwalls, levees, pump stations, and bridges through the Southeast Louisiana region were surveyed relative to this geodetic framework. This geodetic framework was intended to provide a consistent, or common, reference system for numerical and physical model studies, interior drainage models, and hydrodynamic models in the IPET study region. In addition to developing this basic framework, an evaluation was made of changes in flood/ hurricane protection resulting from elevation changes (i.e., net land subsidence and sea level rise) throughout the region. This entailed comparing flood/hurricane structure protection elevations (and reference datums) at the time of original design/construction with the current elevations (“pre-Katrina”). This work was accomplished in the field using water level gauge data (existing and historical), static and kinematic GPS observations, and conventional topographic surveying methods. Archival data from the New Orleans District, National Oceanic and Atmospheric Administration (NOAA) National Geodetic Survey (NGS), and NOAA Center for Operational Oceanographic Products and Services (CO-OPS) were used in these assessments.

Volume II Geodetic Vertical and Water Level Datums II-5 This report is the independent opinion of the IPET and is not necessarily the official position of the U.S. Army Corps of Engineers.
General Background on Elevation Datums Used in Coastal Engineering Design and Construction in Southeast Louisiana
Published elevations relative to the vertical datums in the Southeast Louisiana area are not as reliable as in other regions of the United States. This is due to the uneven temporal and spatial movement of the land throughout this region, primarily caused by subsidence. Thus any geodetic or terrestrial-based elevation is not constant and must be periodically observed and adjusted for local subsidence. Likewise, hydraulic or sea level based reference datums are subject to varia-tions due to subsidence and sea level rise at each gauge site. Sea level datums also have time varying astronomical components making their reference definition more complex than terrestrial-based datums. Hydraulic low water reference datums used to define navigation and flood protection elevations on the Mississippi River or Gulf Intracoastal Waterway systems also are subject to subsidence and long-term variations, and thus these datums are spatially and temporally variable.
Flood control structures in this region were authorized, designed, and numerically modeled relative to a water level reference datum (e.g., Mean Sea Level (MSL); Local Mean Sea Level (LMSL)). However, these structures were constructed relative to a geodetic vertical datum which was incorrectly assumed as being equivalent to, or constantly offset from a water level datum. These hydraulic datums are often erroneously assumed as being equivalent to, or constantly offset from, a terrestrial geodetic datum (e.g., SLD29, NGVD29, NAVD88, NAVD88 (2004.65)). Navigation projects in the Southeast Louisiana area are authorized, designed, con-structed, and maintained relative to low water datums (e.g., Mean Lower Low Water), river low water reference planes (LWRP) (e.g., Mississippi River LWRP 1974), or a mixed geodetic and sea level reference surface (Mean Low Gulf (MLG) datum). All of these geodetic and hydraulic-based reference systems have been (and still are) subject to periodic readjustments and redefi-nitions. These datum definitions and readjustments, coupled with the high subsidence and sea level variations in this region, have significantly complicated the process of obtaining a basic reference elevation for high-resolution hydrodynamic modeling, risk assessment, design, con-struction, and maintenance of flood control and hurricane protection systems.
Since the terrestrial-based geodetic datums (i.e., NGVD29 and NAVD88) are not based on any local water surface elevation in the New Orleans region, they cannot be directly used to define flood inundation or flood protection structure elevations—especially in coastal regions where subsidence and sea level trends are changing. These geodetic (terrestrial) datums must be related to the local mean water surface in order to obtain true flood elevations or inundation levels for input into hydrodynamic and interior drainage models. These relationships are further complicated in that both the sea level and terrestrial elevations have spatial and temporal variations.
In the Southeast Louisiana region, elevations on existing maps, charts, and engineering draw-ings (or in any digital elevation model database) are referenced to a variety of vertical datums and often different temporal epochs of those datums. Depending on their age, U.S. Geological Survey (USGS) quadrangle maps reference elevations to SLD29, NGVD29, or NAVD88 geo-detic datums. Elevations on NOAA nautical/bathymetric charts are referred to a Mean High

II-6 Volume II Geodetic Vertical and Water Level Datums This report is the independent opinion of the IPET and is not necessarily the official position of the U.S. Army Corps of Engineers.
Water (MHW) tidal datum and depths are referred to either Mean Low Water (MLW) or Mean Lower Low Water (MLLW) tidal datum, depending on the age of the chart. Corps of Engineers inland navigation charts and drawings use a variety of reference datums, such as LWRP, MLG, and Mean Pool Level (MPL). In the New Orleans area, design and construction documents from different agencies variously refer elevations to datums such as Mean Tide Level (MTL), MLG, MSL, LWRP, NGVD, NGVD29, NAVD88, NAVD88 (2004.65), or Cairo Datum. Relationships between these datums are often uncertain or unknown. Consolidating disparate databases on different datums for hydrodynamic modeling is difficult and, depending on the model sensitivity, can significantly impact the resultant accuracy.
The next few sections in Volume II provide additional background on the various vertical datums used in Southeast Louisiana, and how these datums interrelate with one another—or per-haps how they do not relate to one another. Also described are satellite-based techniques devel-oped by NOAA which should provide a consistent, time-dependent vertical reference system from which to monitor regional and local subsidence, and sea level rise, and more accurately and reliably relate these terrestrial geodetic datums to the design elevations of protective structures based on hydraulic assessments.

Volume II Geodetic Vertical and Water Level Datums II-7 This report is the independent opinion of the IPET and is not necessarily the official position of the U.S. Army Corps of Engineers.
Overview of Vertical Datums
Vertical datums typically represent a terrestrial or earth-based surface to which geospatial coordinates (such as elevations) are referenced. Elevations of points may be referred to local or regional reference planes. These may be either geodetic or hydraulic based reference planes. These reference planes are not necessarily planar and may deviate spatially over a region, due to a variety of reasons. They may also have temporal deviations due to land subsidence, sea level changes, or geodetic readjustments. Thus, it is impossible to define a truly consistent, non-varying, terrestrial-based, vertical geodetic framework for coastal areas such as the New Orleans study region. Recent (i.e., over the last 20 years) implementation of Global Positioning System (GPS) satellite reference systems does provide potential mechanisms for establishing an external reference framework from which vertical datums can be related spatially and temporally. Such a framework was developed by NOAA in October 2005 and used for this IPET project.
The following discussion is intended to be a brief overview of terrestrial and hydraulic-based reference datums used in the Southeast Louisiana region. More comprehensive treatments on geodesy specific to vertical datums can be found in NOAA, USACE, ASCE, and academic publications.
Geodetic Datums
A geodetic vertical datum is a reference system whereby heights are consistently determined above some reference surface. Previously the reference surface for a vertical datum has been some approximation of LMSL, but this is not a strict requirement. By 1900, the vertical control network for the United States had grown to 21,095 km of geodetic leveling. A reference surface was determined in 1900 by holding elevations referenced to LMSL fixed at five tide stations. Data from two other tide stations indirectly influenced the determination of the reference surface. Subsequent readjustments of the leveling network were performed by the U.S. Coast and Geodetic Survey (USC&GS) in 1903, 1907, and 1912.
Since 1929, only two official national vertical datums have been established. Due to sub-sidence and other factors, several readjustments have been made to the published heights in these datums in areas such as Southern Louisiana. The first of these national datums was the Sea Level Datum of 1929 (SLD29). It was created by the USC&GS as the datum to adjust all vertical con-trol to in North America. The SLD29 is defined by 26 tide stations, held fixed to LMSL: 21 tide stations in the United States and 5 tide stations in Canada. When it was established in 1929, SLD29 was believed to be a MSL datum. However, over time, with sea level rise and other fac-tors, it was no longer considered a MSL datum. In 1973 the name of SLD29 was changed to the National Geodetic Vertical Datum of 1929 (NGVD29).
In the early 1990s, the NOAA NGS established a new geodetic vertical datum for North America—the North American Vertical Datum of 1988 (NAVD88). NAVD88 is defined by a single tidal benchmark at Father Point/Rimouski, an International Great Lakes Datum of 1985 (IGLD85) water level station at the mouth of the Lower St. Lawrence River in Quebec, Canada. This Rimouski benchmark elevation was held fixed in a minimally constrained, least squares adjustment, which is not distorted by constraints of LMSL in different areas, as was NGVD29. However, NAVD88 is not related to LMSL at any point—even at its original Quebec origin.

II-8 Volume II Geodetic Vertical and Water Level Datums This report is the independent opinion of the IPET and is not necessarily the official position of the U.S. Army Corps of Engineers.
Both the name change from SLD29 to NGVD29 in 1973 and the adoption of the NAVD88 vertical datum in 1993 were approved by the Federal Geodetic Control Committee (FGCC) and the Federal Geographic Data Committee’s (FGDC), Federal Geodetic Control Subcommittee (FGCS) respectively. Both the FGCC and FGCS have representation from most federal agencies concerned with engineering, geodesy, and surveying activities, including NOAA, which chairs the FGCS, and USACE.
National Geodetic Vertical Datum of 1929 (NGVD29)
In 1929 the international nature of geodetic networks was well understood, and Canada provided data from its first-order vertical network to combine with the U.S. network. The two networks were connected at 24 locations through vertical control points (benchmarks) from Maine/New Brunswick to Washington/British Columbia. Although Canada did not adopt the SLD29 determined by the United States, Canadian-U.S. cooperation in the general adjustment greatly strengthened the 1929 network. Table 1 lists the kilometers of leveling involved in the readjustments and the number of tide stations used to establish the datums.
Table 1 Adjustments in the United States between 1900 and 1929 Year of Adjustment
Kilometers of Leveling
Number of Tide Stations
1900 21,095 5 1903 31,789 8 1907 38,359 8 1912 46,468 9 1929 75,159 (U.S.) 21 (U.S.) 31,565 (Canada) 5 (Canada)
Holding LMSL heights fixed at these tide stations did not mean that the geodetic vertical datum and the LMSL were the same at any location outside of the 26 tide gauges. Immediately after the 1929 adjustment, the relationship between NGVD29 and LMSL began to deviate due to apparent sea level rise. There were several later adjustments to the datum, but no change in the definition of the datum until 1991, when NGS established the NAVD88. Adjustments to the datum are noted by the year in parentheses after the datum name, i.e., NGVD29 (19xx) where 19xx is the year the NGVD29 datum was readjusted in a region or local area based on either new or releveling of an existing level line. It is noted that this is only an adjustment and not a new datum. Figure 1 below depicts level lines run through the CONUS (continental United States) portion of the primary network used in the 1929 readjustment.

Volume II Geodetic Vertical and Water Level Datums II-9 This report is the independent opinion of the IPET and is not necessarily the official position of the U.S. Army Corps of Engineers.
Figure 1. Precise level lines and tide gauges used to define the NGVD29 datum.
Equipotential Surfaces and the Geoid
Before defining NAVD88 and explaining the difference between it and NGVD29, some key definitions of important factors must be explained. The term “equipotential surface” is defined as an irregular surface, whose gravity potential energy is constant at every point. By extension, therefore, the force of gravity is perpendicular to an equipotential surface at every location on that surface. Because the value of gravity potential energy can be any number (corresponding to one equipotential surface), there are, therefore, an infinite number of equipotential surfaces sur-rounding the Earth with each equipotential surface lying either completely within or completely without another surface; they do not intersect one another. Due to the non-homogenous distribu-tion of Earth’s masses, each of these surfaces has its own distinct shape. The geoid is the one equipotential surface which most closely fits Global Mean Sea Level (GMSL) in a least squares sense. However variations between LMSL and the geoid at one location may be radically differ-ent from such variations at another location. As an example, the LMSL-geoid difference in New Orleans is not the same as LMSL-geoid difference in Miami, FL, since the geoid is fit to GMSL and its definition is not strongly influenced by the local hydrodynamic phenomena which affect LMSL.
In the absence of all forces besides gravity, the ocean surface would lie on the geoid. How-ever, tides, currents, river runoff, wind, circulation, and other forces all impact sea level. Some of these forces do not average to zero over time, and since these forces vary from site to site, any given tide gauge may determine LMSL but not directly determine the geoid. Due to this

II-10 Volume II Geodetic Vertical and Water Level Datums This report is the independent opinion of the IPET and is not necessarily the official position of the U.S. Army Corps of Engineers.
difference in variations between the geoid and LMSL, and the fact that 26 tide stations were held fixed, the NGVD29 reference surface was warped to allow the LMSL at tide stations to define the zero elevation of heights in the NGVD29 datum; hence, NGVD29 reference surface is not equipotential. Following are definitions of some key geodetic terms.
Geopotential number: The numerical difference between gravity potential at the geoid and gravity potential at any other point.
Plumb line: The curved line between a point on the Earth’s surface and a point on the geoid, everywhere tangent to the direction of gravity (everywhere perpendicular to all equipotential surfaces through which the line passes).
Orthometric height: The exact distance along this curved plumb line between the geoid and point on the Earth’s surface. Close approximations can be made, but for absolute accuracy, gravity needs to be measured along this line, requiring a bored hole, which is impractical.
Measuring Heights (Elevations) from GPS Observations
In recent years much emphasis has been put on the determination of orthometric heights from GPS, rather than through traditional (leveling) observations. Such a method is possible, but approaches the determination from a very different perspective. Specifically, a highly accurate model of the geoid must exist, and then the purely geometric height (called ellipsoidal height) determined by GPS can be transformed into an orthometric height. See Figure 2 for clarification of the connection between these height systems.
Figure 2. Relationship between the ellipsoid, geoid, and orthometric heights.

Volume II Geodetic Vertical and Water Level Datums II-11 This report is the independent opinion of the IPET and is not necessarily the official position of the U.S. Army Corps of Engineers.
From Figure 2, one can obtain an orthometric height from the geoid height (ellipsoid-geoid separation) and the ellipsoid height (obtained from GPS). From this figure H ≈ h - N, but this will generally not produce the same height that has been determined using first-order leveling procedures to obtain the orthometric height as shown in the published NGS data sheets. Figure 2 shows the relationship of the mathematical ellipsoid surface with level surfaces, and orthometric heights. The ellipsoid surface has nothing to do with the level surfaces and it cuts through all level surfaces because it is not a function of the Earth’s gravity field. Therefore GPS-derived ellipsoid heights are not related to the geoid or the gravity field—requiring a model to obtain differences between the geoid and ellipsoid to determine orthometric height. Geoid height (also termed geoid separation or geoid undulation) is the difference between the geoid and ellipsoid at any given point on the Earth’s surface. The equation h ≈ H + N shown in the above figure is accurate to 1 mm in the New Orleans region as long as all the components are known. The geiod height is always negative in CONUS (as shown in the above figure).
North American Vertical Datum of 1988 (NAVD88)--Definitions and Adjustment
Unlike the multiple points which define the zero level of NGVD29, NAVD88 is defined by a single tidal benchmark at Father Point/Rimouski, an IGLD85 water level station at the mouth of the Lower St. Lawrence River, in Quebec, Canada. Its elevation was held fixed in a minimally constrained, least squares adjustment, which is not distorted by constraints of LMSL in different areas, as in NGVD29. The warping of NGVD29’s reference surface means that the heights deter-mined in that datum are not strictly “orthometric.” Conversely, NAVD88’s reference surface is equipotential, and therefore heights in that datum are nearly orthometric. The reason they are not truly orthometric is that the reference surface of NAVD88 was not specifically chosen as the geoid. In fact, most estimates of the difference between the NAVD88 reference surface and the geoid put the difference at the level of a few decimeters.
In support of NAVD88, the NGS Vertical Network Branch converted the historic height difference links involved in the 1929 general adjustment to computer-readable form. The 1929 general adjustment was recreated by constraining the heights of the original 26 coastal stations. Free-adjustment results were then compared with the general adjustment constrained results. Several differences exceeded 50 cm. A large relative difference, 86 cm, exists between St. Augustine, FL, and Fort Stevens, OR. This is indicative of the amount of distortion present in the 1929 general adjustment (see Figure 3).
NAVD 88 combined 1,300,000 km of leveling surveys held in the NGS database, into a sin-gle least squares adjustment to provide users with improved heights for over 500,000 vertical control points distributed throughout the United States, on a common datum. There had been approximately 625,000 km of leveling added to the National Geodetic Reference System (NGRS) since NGVD29 was created. An extensive inventory of the vertical control network resulted in the identification of lost benchmarks, several affected by crustal motion associated with earthquake activity, postglacial rebound (uplift), and subsidence. Other problems (distor-tions in the network) were caused by forcing the 625,000 km of leveling to fit previously deter-mined NGVD29 height values. Some observed changes, amounting to as much as 9 m, are discussed in the referenced reports.

II-12 Volume II Geodetic Vertical and Water Level Datums This report is the independent opinion of the IPET and is not necessarily the official position of the U.S. Army Corps of Engineers.
Figure 3. Differences in centimeters between NGVD29 and NAVD88.
The NAVD88 datum adjustment formally began in October 1977 with the releveling of much of the first-order NGS vertical control network in the United States. The nature of such a net-work required a framework of newly observed height differences to obtain realistic, contempo-rary height values to form the readjustment. To accomplish this, NGS identified 81,500 km (50,600 miles) for releveling to be completed by NGS field crews. In addition to the NGS releveling, other federal agencies such as the USACE, many state agencies such as state Depart-ments of Transportation, Departments of Natural Resources, etc. provided NGS with approxi-mately another 20,000 km (32,400 miles) of new and releveled surveys. Replacement of disturbed and destroyed monuments preceded the actual leveling. This effort also included the establishment of “deep-rod” benchmarks, which provided reference points for future “tradi-tional” and GPS leveling techniques. Field leveling of the 81,500 km network and the 20,000 km submitted by state agencies was accomplished to FGCC First-Order, Class II specifications, using the double-simultaneous method. NGS worked closely with both Canada and Mexico to ensure sufficient connections were made along both borders of the United States. NGS field crews also worked closely with both countries by carrying the vertical control into both countries and making connections to their vertical network; both countries ran levels into the United States making connections. Both Canada and Mexico provided NGS with their leveling data so the NAVD88 would be more extensively “North American” than NGVD29 had been.
The general adjustment of NAVD88 was completed in June 1991. The general adjustment did not include about 20 percent of the vertical network. The benchmarks that were not adjusted were referred to as “POSTed benchmarks.” Benchmarks were POSTed due to many factors such

Volume II Geodetic Vertical and Water Level Datums II-13 This report is the independent opinion of the IPET and is not necessarily the official position of the U.S. Army Corps of Engineers.
as some of the older data being inconsistent with newer data. Other benchmarks were POSTed because they were in areas of crustal movement, such as in Southern Louisiana. POSTed benchmarks were not included in the original NAVD88 adjustment so they would not influence the adjustment. The benchmarks that had been POSTed in Southern Louisiana were adjusted in 1994 using observation data tied to areas outside of the area of subsidence.
The leveling observations used in NAVD88 were corrected for rod scale and temperature, level collimation, and astronomic, refraction, and magnetic effects (NOAA 1992). All geopoten-tial differences were generated and validated, using interpolated gravity values based on actual surface gravity data. Geopotential differences were used as observations in the least squares adjustment, geopotential numbers were solved for as unknowns, and after the adjustment was complete orthometric heights were computed using the Helmert height reduction.
H = C / (g + 0.0424 · H)
where C is the estimated geopotential number in gpu (geopotential units), g is the gravity value at the benchmark in gallons, and H is the orthometric height in kilometers. The weight of an observation was calculated as the inverse of the variance of the observation, where the variance of the observation is the square of the a priori standard error multiplied by the kilometers of leveling divided by the number of level sections.
Table 2 below shows the comparison between NGVD29 and NAVD88 vertical adjustment.
Table 2 Comparison between NGVD29 and NAVD88 Adjustments Category Sub-Category NGVD29 NAVD88 Datum Considerations Defining Height(s) 26 Local MSL 1 Local MSL
Tidal Epoch Various 1960-78 (18.6 years)
Treatment of Leveling Data Gravity Correction Ortho Correction (normal gravity)
Geopotential Numbers (observed gravity)
Other Corrections Level, Rod, Temperature Level, Rod, Astro, Temp, Magnetic, and Refraction
Adjustments Considerations Method Least Squares Least Squares
Technique Condition Equations Observation Equations
Units of Measure Meters Geopotential Units
Observation Type Links Between Junction Marks
Height Differences Between Adjacent BMs
Adjustments Statistics Number of Benchmarks 100,000 (est.) 450,000 (US only)
Km of Leveling Data 75,159 (US) 31,565 (Canada)
1,001,500
Published Information Orthometric Height Type Normal Helmert
Orthometric Height Units Meters Meters
Gravity Value Normal Actual
II-14 Volume II Geodetic Vertical and Water Level Datums This report is the independent opinion of the IPET and is not necessarily the official position of the U.S. Army Corps of Engineers.
Development of the Time-Dependent NAVD88 (2004.65) Reference Framework for Southeast Louisiana
Beginning in 2004, NGS began a series of reobservations in Louisiana for the purpose of updating the NAVD88 published heights in the region in support of hurricane evacuation route mapping. These reobservations included both GPS campaigns and leveling observations. The GPS data were collected according to the guidelines in Publication 58, “GPS Derived Ellipsoid Heights” (NOAA 1997) and the draft guidelines in Publication 59 for “GPS Derived Orthometric Heights” (NOAA 2005). These guidelines required a set of three 5½-hour sessions with at least 4 hours difference in the starting time of one session on different days. The data collected were processed using the NGS program PAGES and adjusted using the NGS program ADJUST. How-ever, prior to this adjustment, the published orthometric heights of benchmarks in the gulf coast region from Pensacola, FL, to Houston, TX (which included benchmarks occupied in the GPS reobservations in Louisiana) were updated using the most recent subsidence rates as published in Technical Report 50 (NGS 2004) applied to previous observation data and adjusted. This readjustment used 151 previously observed level lines connecting across the entire region consisting of 16,331 benchmarks. Rates of all published benchmarks included in Technical Report 50 (NGS 2004) were applied. A total of 85 such benchmarks were part of this reobserva-tion campaign.
When the GPS-derived orthometric heights were compared with leveling data (corrected for subsidence rates and tied to non-subsiding benchmarks outside the subsidence area) at these 85 benchmarks, there was a variety of agreements and disagreements. First, 32 of the 85 bench-marks showed better than 2 cm agreement between the GPS-derived and leveling-derived ortho-metric heights, indicating very accurate subsidence rates at those points.
After finding the 32 points to have the most reliable subsidence rates, their heights were then held as stochastic constraints (along with fixing the heights of four points outside the subsidence area) in a constrained adjustment of all 85 benchmarks. The resultant adjustment of 85 heights was given the notation “NAVD88 (2004.65)”, where the 2004.65 is the date (in years and deci-mal portions of a year) of the midpoint of the observation campaign. The formal accuracy esti-mates on these 85 benchmarks fall in the 2 to 5 cm range. Note that even as these points have been adjusted to 2004.65, they are all susceptible to subsidence, and therefore it will be critical to use Continuously Operating Reference Stations (CORS) data and possibly future releveling to readjust these heights and recompute their subsidence rates with a higher accuracy than the 2004.65 adjustment produced.
The NAVD88 (2004.65) adjustment, again, was not a local adjustment. It went outside of the subsidence area and held fixed what was felt to be stable benchmarks. The four benchmarks held fixed were: LAKE HOUSTON 2050, which is a galvanized steel pipe driven to a depth of 2,050 ft; 872 9816 TIDAL 1 a TIDAL Benchmark in Pensacola, FL; FOREST EAST BASE in Scott County, MS; and M 237 in Latanier, LA. A free adjustment holding LAKE HOUSTON 2050 fixed was run with the results shown in Table 3. The difference between the NAVD88 (1994) and NAVD88 (2004.65) reflects the apparent subsidence of the benchmarks due to the procedures used in the adjustment.

Volume II Geodetic Vertical and Water Level Datums II-15 This report is the independent opinion of the IPET and is not necessarily the official position of the U.S. Army Corps of Engineers.
Table 3 Louisiana Vertical Time-Dependent Position (VTDP) Free Adjustment Designation Published, meters Adjusted, meters Published Minus
Adjusted, meters
872 9816 TIDAL 1 1.3479 1.3741 -0.0262
FOREST EAST BASE 136.4527 136.4622 -0.0095
LAKE HOUSTON 2050 17.0714 Constrained 0.0000
M 237 20.3830 20.3422 0.0408
The geographical location of these fixed benchmarks relative to the Southern Louisiana subsidence area are shown in Figure 4 below.
Figure 4. Location of fixed benchmarks defining NAVD88 (2004.65).
Accuracy Assessment of the NAVD88 (2004.65) Framework in Southeast Louisiana
During IPET field survey operations in early 2006, a problem was detected at benchmark GRAHAM which is located along the Lake Pontcharterain Lakefront near the Orleans Avenue Outfall Canal. It was noted that the elevation differed by 0.29 ft (8.84 cm) between a recently

II-16 Volume II Geodetic Vertical and Water Level Datums This report is the independent opinion of the IPET and is not necessarily the official position of the U.S. Army Corps of Engineers.
observed GPS elevation and the updated NAVD88 (2004.65) elevation. This was higher than expected and several questions were asked about the GPS procedures to ensure nothing had gone astray. It was decided to run conventional Third-Order levels from station ALCO, one of the 85 NAVD88 (2004.65) published stations to station GRAHAM. This level run checked the published NAVD88 (2004.65) elevation of station ALCO with the unvalidated NAVD88 (2004.65) elevation of station GRAHAM by 0.03 ft (0.0091 m), less than a centimeter. This validates station GRAHAM and indicates the network accuracy to be well within the 2 to 5 cm stated by the NGS as the accuracy of the 85 existing stations of the NAVD88 (2004.65) adjust-ment. The problem was later discovered to be a height of instrument (HI) error on the GPS antenna setup that was subsequently corrected. This, along with other observations made during the IPET study, validates the VTDP rates and NOAA procedures used by IPET to determine the NAVD88 (2004.65) elevations on additional benchmarks established to be used as the founda-tion for the vertical control in Southeast Louisiana.
Tidal Reference Datums
Tidal datums are used to establish local tidal phase averages as reference levels from which to reckon height or depth observations. One of these tidal averages is the MSL in the water sur-rounding the gauge. MSL is the basis for hurricane protection structures in the New Orleans region. Observations are typically taken at a tide gauge that has been collecting data for a period of over a 19-year National Tidal Datum Epoch (NTDE). This time period allows inclusion of all variations in the path of the moon about the sun. The Louisiana coast has anomalous relative sea level trends compared to most other geographic regions in the United States. This is due to a gen-eral subsidence of land in this area, which has been occurring at a rapid rate. Tidal datums are locally derived and should not be extended into areas which have differing hydrographic charac-teristics, without substantiating measurements. The most commonly used tidal datums used in engineering are:
• Mean High Water (MHW) - the average height of all high waters at a place, covering a 19-year period. Heights of bridges over navigable waterways and legal coastal shoreline boundaries are typically referred to this datum. Coastal shorelines shown on navigation charts typically (but not always) depict MHW whereas depths on the same chart are referred to Mean Lower Low Water. Exceptions to this are found in Corps of Engineers inland navigation charts.
• Mean Tide Level (MTL), a plane often confused with LMSL that lies close to LMSL. MTL is the midpoint plane exactly between the average of MHW and MLW at a tide station. The difference is MTL does not include all the tide levels (i.e., MHHW and MLLW) unless the tide at a particular location is diurnal. Hydraulic design manuals sometimes refer to MTL as being synonymous with MSL.
• Mean Sea Level (MSL) or Local Mean Sea Level (LMSL) - the average height of the surface of the sea at a tide station for all stages of the tide, typically (but not always) covering a 19-year period which is usually determined from hourly height readings measured from a fixed and predetermined reference level.

Volume II Geodetic Vertical and Water Level Datums II-17 This report is the independent opinion of the IPET and is not necessarily the official position of the U.S. Army Corps of Engineers.
• Mean Lower Low Water (MLLW) - the average height of the lower of the two low waters occurring in a day, at a tide gauge over a 19-year period. Coastal navigation projects are referred to this datum. This datum superseded Mean Low Water (MLW) which was previously used as the navigation reference datum for the East Coast CONUS.
• Mean Low Gulf (MLG) – a low water tidal datum unique to Gulf Coast Districts, used as a navigation (and construction) reference datum in coastal waterways such as the Gulf Intracoastal Waterway (GIWW), the Mississippi River Gulf Outlet (MRGO).
• Mean Gulf Level (MGL) – a gulf tidal datum established ca 1899 from which Mean Low Gulf (MLG) is derived and defined to this day. Presumed to be Mean Sea Level (MSL) at 1899 origin in Biloxi, MS.
Additional details on these tidal reference planes are covered in a subsequent section in this Volume, including references to NOAA technical publications in that section and listed in the References section of this Volume.

II-18 Volume II Geodetic Vertical and Water Level Datums This report is the independent opinion of the IPET and is not necessarily the official position of the U.S. Army Corps of Engineers.
Other Reference Datums Used for Navigation and Flood Control Structure Construction in Southeast Louisiana
A variety of vertical reference datums have been used in the Southeast Louisiana region over the past 150 years. Although most of these datums have been superseded, some are still in use. Older datums still in use are basically local reference systems that bear no firm relationship to the current geodetic or water level reference frameworks. It is important to understand these datums when evaluating historical design documents. Examples include the New Cairo Datum (NCD) used to reference pump station, utility grade, and real property elevations, and the MLG Datum used for navigation and some flood protection structures.
New Cairo Datum of 1910
Historical background on some of the various datums in this region is contained in the following excerpt taken from a U.S. Army Corps of Engineers Report:
“In 1850, pursuant to an Act of Congress, the Secretary of War directed Mr. Charles Ellet, Jr. to make a complete survey of the Ohio and Mississippi Rivers, with a view toward a master plan for flood prevention and navigation. In 1876, before the Mississippi River Commission was formed to coordinate all activities on the river, a survey of the Mississippi was begun in the vicinity of Cairo, Illinois, nicknamed Little Egypt. A temporary datum was adopted at 300 feet below a plane known as the Cairo City Datum of 1871. When the same survey was begun in the vicinity of Memphis in 1877, another temporary datum was adopted at 225 feet below the high water of June 23, 1858 at Memphis without any connection to the lower Delta Survey Datum of 1858. The first connection by precise levels between Memphis and Cairo was completed in 1880. The Mississippi River Commission established a tide gauge at Biloxi, Mississippi. In 1882, a final value was adopted for Mean Gulf Level by the Mississippi River Commission based on the mean years of 1882, 1884, 1896, 1897, and 1898. In 1890, re-leveling was started at Fort Adams, Mississippi. The re-leveling ran south to Baton Rouge, Louisiana and north to Cairo, Illinois. In 1910 the level line from Memphis to Cairo was completed.
The U.S. Coast and Geodetic Survey (USC&GS) adopted the Mississippi River Com-mission (MRC) value of MGL of 1899 and used it in the general adjustment of 1898, 1903 and 1907. The USC&GS later performed the General Adjustment of 1929, in refer-ence to adjustments and datum relationships. The published elevations of the MRC for level lines between Biloxi and New Orleans and along the Mississippi River are mainly observed elevations based on one tide station, without orthometric corrections applied or corrected for closure. The relationship of MRC vertical datums with the MSL datum of 1929 will vary as a function of observational error and as the orthometric height varies. In 1944, the varying difference was noted between MRC vertical datum and USC&GS 1929 resulted in the tie-point method being established. However, the tie-point method seems to have faded from use. The MRC vertical datums have evolved into merely a number of indices that are transformed by algebraic addition. The true relations between the various MRC vertical datums and MSL 1929 are now obscured by time and no longer used. The index relationships are as follows:

Volume II Geodetic Vertical and Water Level Datums II-19 This report is the independent opinion of the IPET and is not necessarily the official position of the U.S. Army Corps of Engineers.
Table 4 Historical Datums in Southeast Louisiana Region1
Datum Conversion to Mean Sea Level 1929
Ellet Datum of 1850 unknown
Delta Survey Datum of 1858 0.86
Old Memphis Datum of 1858 -8.13
Old Cairo Datum of 1871 -21.26
New Memphis Datum of 1880 -6.63
Mean Gulf Level Datum (preliminary) 1882 0.318
Mean Gulf Level Datum of 1899 0.00
New Cairo Datum of 1910 -20.434
Mean Low Gulf Level Datum of 1911 -0.78
Note: Datums and Conversions, all differences are in feet. 1 Reference: Point of Beginning Magazine, “Surveying Little Egypt,” by Milton Denny, PLS. Reference also Mississippi River Commission Annual Report for 1899, p. 3296, and Stages of the Mississippi River for 1937, p. LXXIII.
The Cairo Datum (also referred to as New Cairo Datum (NCD) or the Cairo Datum of 1910) was originally based on a benchmark at a Corps of Engineers facility in Cairo, IL, at the con-fluence of the Ohio and Mississippi Rivers. The General Survey of 1879 ran levels down the Mississippi River to New Orleans. The starting elevation of the benchmark in Cairo was arbi-trarily increased to ensure that elevations values downstream would always be positive. In the New Orleans area, the arbitrary reference for the Cairo Datum is 20.434 ft below MSL—thus all land elevations in this region are positive on this datum. No benchmark or epoch for this MSL relationship could be found in the literature. Thus, the arbitrary 20.434 ft relationship is no longer valid—Cairo Datum is simply a relative reference system. It is still used by the New Orleans Sewerage and Water Board (NOS&WB) and the New Orleans District in pump station construction specifications.
Mean Gulf Level (MGL) and Mean Low Gulf (MLG) Datums
A 1 January 1944 New Orleans District Memorandum, “Notes on the Relationship between Various Datum Planes that have been used by the New Orleans District,” describes the origins of the gulf-based datums. This memorandum was excerpted in the “Louisiana Engineer,” dated October 1991.
On June 21, 1899 a value of 6.083 ft on the staff gage at Biloxi, MS was adopted by the Mississippi River Commission (MRC) as ‘mean level of the Gulf of Mexico at Biloxi, MS.’
The elevations of Mean Gulf Level and Mean Sea Level at Biloxi, MS are the same as shown by the 1929 General Adjustment of the first order level net by the USC&GS, which gives the elevation of PBM [permanent benchmark] KENNOR (BOLT) as 18.097 ft above Mean Sea Level (see USC&GS Report of 1903).
The MRC stage pamphlets show that the elevation of PBM KENNOR (BOLT) 24.181 ft above the zero of the gage, or 18.098 ft above Mean Gulf Level (MGL), a difference of 0.001 ft, which is negligible. See Report of Chief of Engineers, US Army, 1900 party 7, p. 4726.
The 1941 Alluvial Valley Adjustment gives the elevation of PBM KENNOR (BOLT) as 18.146 ft, or 0.049 ft higher than the 1929 General Adjustment.

II-20 Volume II Geodetic Vertical and Water Level Datums This report is the independent opinion of the IPET and is not necessarily the official position of the U.S. Army Corps of Engineers.
The elevation of Mean Low Gulf (MLG) Datum as established by the former First New Orleans District is 0.78 ft below Mean Gulf Level.
Of significance is that the 0.78 ft difference from MSL (i.e., Mean Gulf Level (MGL)) down to Mean Low Gulf (MLG) is still being used as a conversion factor throughout the region even though this relationship was established many decades ago at a single point in Biloxi, MS. The origin of the 0.78 ft value is uncertain; however, it would most likely have been based on the tidal range at Biloxi—the average half tide range currently being about 0.79 ft (NOAA gauge 874 3735). Tidal ranges are not constant in a region—they will vary based on the tidal hydrau-lics. Benchmarks with original MLG Datum elevations may not have been updated for subsi-dence and sea level changes (apparent sea level rise)—potentially 1- to 3-ft differences. Since MLG is the accepted reference datum for many navigation projects, use of original MLG eleva-tions that are not corrected for apparent sea level rise results in significant over-dredging relative to a current low water reference datum. Dredging and other construction are performed relative to the MLG datum.
Relationships between MLG and the NOAA certified MLLW reference navigation datum have been estimated for selected places in the region. These estimates are used to convert MLG to MLLW for input onto NOAA navigation charts. Figure 5 below illustrates MSL and MLG datum conversions currently used by the New Orleans District. A constant 0.78 ft conversion does not consider locally varying tidal ranges. MLG is still used as the reference datum for the GIWW, MRGO, and portions of the Mississippi River, among others.
On 1 April 1993, HQUSACE issued a policy directive that local coastal datums such as MLG should be converted to the NOAA certified MLLW reference datum. This directive was promul-gated in an Engineer Technical Letter (ETL 1110-2-349), “Requirements and Procedures for Referencing Coastal Navigation Projects to Mean Lower Low Water Datum.” (A complete copy of this technical letter is included in the Technical Appendix 38 to this Volume. This letter was subsequently superseded by inclusion in EM 1110-1-1005.)
As stated in the Technical Letter, its purpose was to
“... provide guidance, technical considerations, and general implementation procedures for referencing coastal navigation projects to a consistent Mean Lower Low Water (MLLW) datum based on tidal characteristics defined and published by the U.S. Department of Commerce. This guidance is necessary to implement applicable portions of Section 224 of the Water Resources Development Act of 1992.”
WRDA 92, Section 224, specified that USACE project datums and NOAA marine charting datums shall be consistent. WRDA 92 amended Section 5 of the Rivers and Harbors Appropri-ation Act of 1915 to define project depths of operational projects as being measured relative to a MLLW reference datum for all coastal regions.

Volume II Geodetic Vertical and Water Level Datums II-21 This report is the independent opinion of the IPET and is not necessarily the official position of the U.S. Army Corps of Engineers.
Figure 5. New Orleans District datum plane conversions.

II-22 Volume II Geodetic Vertical and Water Level Datums This report is the independent opinion of the IPET and is not necessarily the official position of the U.S. Army Corps of Engineers.
The 1993 Technical Letter specifically directed Districts to implement the WRDA 92 pro-visions, stating “Corps navigation projects that are referenced to older datums (e.g., Mean Low Water along the Atlantic coast or various Gulf coast low water reference planes) must be con-verted to and correlated with the local MLLW tidal reference established by the NOS [National Ocean Service].” The letter provided technical guidance on performing the conversions. These implementation actions were apparently not implemented in the New Orleans District; presum-ably under the interpretation that WRDA 92 could not supersede the original project authoriza-tion documents containing the older MLG Datum reference.
It should be noted that other USACE Districts on the east and gulf coasts have not fully implemented the provisions of ETL 1110-2-349.
Mississippi River Low Water Reference Plane (LWRP) Datums
The LWRP is the statistical elevation profile of the Mississippi River from which river stage elevations are referenced. There are currently two active LWRP epochs of the Mississippi River: LWRP 1974 and LWRP 1993.
This hydraulic-based reference plane is established from long-term observations of the river’s stage, discharge rates, and flow duration periods. The low water profile was developed about the 97 percent flow duration line. The elevation of the LWRP drops gradually throughout the course of the Mississippi River; however, some anomalies in the profile are present in places (particularly in areas containing a rock bottom or at control structures). The gradient is approxi-mately 0.5 ft per river mile. The ever-changing river bottom will influence the LWRP gradient. Changes in the stage-discharge relationship will influence the theoretical flow line for the LWRP.
On the Mississippi River, between the mouths of the Missouri and the Ohio Rivers (the Middle Mississippi River), depths and improvements are referenced to the LWRP. No specific LWRP year is used for the Middle Mississippi River north of Cairo, IL. Below Cairo, IL, south to the Head of Passes, depths and improvements along the Mississippi River are referenced to the LWRP. At Head of Passes south of Pilot Town, the LWRP merges into a tidal reference system (both MLLW and MLG). Below Head of Passes, elevations in the New Orleans District River-book are referenced to NGVD29. MLG is also referenced at gauges along these lower portions of the Mississippi River. The LWRP 1974 from mile 313.7 to mile 242.0 is based on the 97 percent discharge duration at Tarbert Landing (1954-1973) and corresponding stages; mile 242.0 to Head of Passes is based on the mean of 40 years (1891-1930) at regular MRC gauges, and adjusted from low water information obtained between September 1931 and November 1933. Near Venice, LA, the Mississippi River LWRP transitions into a purely tidal regime although the tidal characteristics are present in the flow profile as far north as Baton Rouge.
Construction and improvements along the river are performed relative to the LWRP at a par-ticular point. Differences in LWRP elevations between successive points along the river are determined from simultaneous staff readings and are referenced to benchmarks along the bank. The LWRP slope gradients between any two points must be corrected by linear interpolation of the profile. Thus, over a typical 1-mile-long section of river with a 0.5-ft gradient, each 1,000-ft

Volume II Geodetic Vertical and Water Level Datums II-23 This report is the independent opinion of the IPET and is not necessarily the official position of the U.S. Army Corps of Engineers.
interval river cross section will have a different LWRP correction, each dropping successively at 0.1-ft increments.
Guidance in EM 1110-2-1003 (Hydrographic Surveying) noted that
“...from 1993 on, NAVD88 was intended to replace NGVD29 as the common reference plane from which LWRP 1974 elevations are measured. The relationship of all project datums to both NGVD29 and NAVD88 will be clearly noted on all drawings, charts, maps, and elevation data files. All initial surveys should be referenced to both NAVD88 and NGVD29. If this is not possible then NGVD29 should be used as the common reference plane from which LWRP 1974 elevations are measured until the move to NAVD88 can be made.”
Over the past five years, the New Orleans District has conducted extensive geodetic surveys along the Mississippi River between Baton Rouge and Venice. These GPS-based vertical control surveys at various river gauges effectively provided conversion references between the LWRP and NAVD88—and post-Katrina, with the updated NAVD88 (2004.65) adjustment. IPET GPS surveys performed in January and February 2006 connected these earlier GPS surveys at selected gauge sites—providing additional information to update the prior surveys to the NAVD88 (2004.65) reference.

II-24 Volume II Geodetic Vertical and Water Level Datums This report is the independent opinion of the IPET and is not necessarily the official position of the U.S. Army Corps of Engineers.
GPS Data Collection and Processing to Update Reference Elevations on Southeast Louisiana Tide Gauges Development of GPS Survey Data Collection Network Design
In order to develop a relationship between the LMSL and the current geodetic vertical net-work across the project area, measurements were made between tidal stations and the geodetic vertical network. This data collection effort was referred to as the IPET Phase 1 survey. The Phase 1 survey involved GPS static survey measurements of existing and historical NOAA and USACE water level and tidal stations measured relative to NAVD88 (2004.65) benchmarks. Because of time constraints and to meet the project schedule, the idea to use existing and histor-ical gauge information was chosen versus installing gauges over greater New Orleans for a period of one year. Conventional leveling, using precise digital leveling instruments, was used to measure differences between a minimum of three tidal benchmarks at each tidal station location to check for consistency as required by NOAA. GPS surveys were performed using four NAVD88 (2004.65) benchmarks and four CORS for each tidal benchmark elevation required. All GPS receivers performed two sessions at each site for a session duration of 4 hours. A total of seven gauges were connected by GPS observations to the geodetic vertical framework.
Static GPS Survey Phases
Three subphases of GPS surveys were planned in November 2005. Two phases were planned from a meeting in November 2005 and a third phase was added and then abandoned as the crews found tide gauge sites underwater and monuments destroyed. The phases were called Phase 1a, Phase 1b, and Phase 1c.
The Phase 1a GPS static survey design unfolded as government personnel and contractors slowly reentered restricted areas just outside the city of New Orleans. Originally six tide stations were to be measured for the purpose of tying the tidal datums to the geodetic datum in Phase 1a. Three of the six tide stations were found to be totally destroyed during a reconnaissance survey to recover monuments and take photographs of these tide station sites. On 9 November 2005, IPET team members visited the site of NOAA Tide Station 876 1426 Greens Ditch, Lake St. Catherine to recover tidal benchmarks. They reported the entire area had been destroyed by Hurricane Katrina with no sign of “All in the Family Camp” (a reference sited in the benchmark descriptions) or any of the tidal benchmarks. They reported no references existed to measure distances in order to recover the monuments. On 9 December 2005, personnel from IPET and 3001, Inc. visited Tide Station 876 1529, Martello Castle, Lake Borgne. A photograph (Figure 6) taken with a camera direction to the northeast shows the complete destruction of the castle. The three tidal benchmarks on this structure are considered destroyed. To the southeast of the castle on the marsh shoreline, four tidal benchmarks (A, B, C and D) were monumented in 1982; how-ever, the personnel indicated that since 1982 those marks would now be 30 or 40 ft off the shore-line underwater. On 9 December 2005, personnel from IPET and 3001, Inc. visited Tide Station 876 1305, Shell Beach, Lake Borgne (Figure 7). Three photographs taken showed the total destruction of the tide station that once recorded water level measurements from a large concrete quay built in World War II. One photograph to the west with the Fort Beauregard ruins in the background depicts the shoreline difference since 1982. The tidal benchmark in the

Volume II Geodetic Vertical and Water Level Datums II-25 This report is the independent opinion of the IPET and is not necessarily the official position of the U.S. Army Corps of Engineers.
Figure 6. Martello Castle, Lake Borgne.
Figure 7. Shell Beach, Lake Borgne.

II-26 Volume II Geodetic Vertical and Water Level Datums This report is the independent opinion of the IPET and is not necessarily the official position of the U.S. Army Corps of Engineers.
Figure 8. Phase 1a and Phase 1b geodetic connections established by 3001, Inc.
foreground assumed to be 1305F or 1305G is bent and out in the water. This shoreline retreated at least 20 to 30 ft. One tide station at the New Orleans District Office was added to the survey. NOAA named the station Carrollton. The USACE tide station was not measured to NOAA stan-dards; however, useful information for this report will be tabulated including this tide station on the Mississippi River.
Phase 1b changed four or five times during the reconnaissance. Access to most of the tide stations in this area is by boat. The final GPS network for this static survey included NOAA Tide Stations: 8761602, Lake Judge Perez, Hermitage Bayou and 876 1799, M.V. Petroleum Dock, Bayou St. Denis. Also included was USACE Tide Station West Point, a la Hatche on the Mississippi River. Seven benchmarks were recovered at 876 1602, Lake Judge Perez, Hermitage Bayou (Lake Judge Perez), one of which was damaged. This site was used in Phase 1b observa-tions. USACE Tide Station West Point, a la Hatche, Mississippi River was visited and incorpo-rated into the Phase 1b GPS network. At Tide Station 876 1799, M.V. Petroleum Dock, Bayou St. Denis (MV Petro), 4 of the 5 monuments were recovered. Several tidal stations that were pro-posed to be included in the Phase 1b survey were reported destroyed. Only two primary NOAA benchmarks at USACE Alliance, Mississippi River (Alliance) were not recovered. Three NOAA vertical rod marks were recovered along the highway. Instead of using this site, the tidal station

Volume II Geodetic Vertical and Water Level Datums II-27 This report is the independent opinion of the IPET and is not necessarily the official position of the U.S. Army Corps of Engineers.
at Empire was used because more monumentation listed on the description sheet was recovered at that site. It was also in close proximity to one of the NAVD88 (2004.65) marks, so only level work needed to be performed here. Tide Station 876 1679 St. Mary’s, Barataria Bay (St. Mary’s Point) was not used since no monuments were recovered at this site as it is now in open water. Tide Station 876 1108 Bay Gardene, Gulf of Mexico, was not used because insufficient monu-ments were recovered for it to be considered for use in the Phase 1b scheme. One of the monu-ments was found bent over, another was in about three feet of water, and another was believed to be under a pile of shell material. Pictures were taken to document the site.
The initial Phase 1c survey was removed due to time constraints, access to tidal benchmarks, and speculation, based on aerial photography, that the marks would not be found in useable con-dition. Another task order called Phase 1c, was executed 28 February 2006 to identity, if possible with GPS, a 0.1-ft difference noticed in the Phase 1a measurements at Tide Station 876 1927 USCG (U.S. Coast Guard), New Canal relative to Tide Stations 876 1487, Chef Menteur and 876 1402 , The Rigolets, east of New Orleans. This task order additionally checked the vertical con-trol back to the primary tide gauge for Lake Pontchartrain and Lake Borgne, which is 874 7437, Bay Waveland Yacht Club, Bay St. Louis, MS.
The initial design of the GPS networks was based on the location and type of vehicle access to the tide stations. A NOAA requirement for at least four NAVD88 (2004.65) geodetic marks surrounding the tide stations was carried out to ensure no recent benchmark settlements were placing unwanted bias into the GPS network measurements. An IPET member developed the preliminary GPS networks that could be field modified, if necessary, by an IPET field survey coordinator on the ground. The network GPS diagrams were then sent to NOAA for pre-approval to ensure inclusion in the National Spatial Reference System (NSRS) database of geodetic infor-mation. The networks were also checked to ensure they met NGS GPS derived orthometric height specifications for data collection under the NGS 2-cm standard—(NOAA 2005).
The Phase 1a GPS survey was exclusively land vehicle access after Tide Stations Martello Castle and Shell Beach were found destroyed. The Phase 1b GPS survey network went through numerous changes as many sites were either destroyed or found under water. A few USACE water level gauge sites on the Mississippi River were added and removed as field conditions changed.
GPS Data Collection and Processing Procedures
All of the data collection for this task was accomplished through a St. Louis District A-E Task Order to 3001, Inc., who performed the field data collection and initial baseline processing. A copy of this Task order is attached as Technical Appendix 33 to this Volume (IPET Survey Task Order-Contract Scope of Work--20 November 2005).
The GPS data were collected using four Trimble 4000 SSE receivers, two Trimble 4000 SSI receivers, one Trimble 4700 receiver, seven fixed-height tripods, six Trimble Compact L1/L2 antennas with ground plane, and one Trimble microcentered L1/L2 antenna with ground plane. The differential leveling was performed with a Leica DNA 03 digital bar code level with digital Invar rods. As part of the quality assurance (QA) procedure, all the collected data were sent to NOAA for verification that it could meet the requirements of the 2 cm/5 cm specification.

II-28 Volume II Geodetic Vertical and Water Level Datums This report is the independent opinion of the IPET and is not necessarily the official position of the U.S. Army Corps of Engineers.
GPS Data Collection and Processing. The static GPS network for this part of the project was designed to provide measurements from newly published NGS control points with NAVD88 (2004.65) elevations to existing and historical tide stations. The GPS field procedures followed the NGS Bluebook specifications, as defined by (NOAA 2005), as well as the guidelines estab-lished in EM 1110-1-1003. The GPS network design was approved by the NGS IPET represen-tative on the project. The network was designed to include enough existing local control to estab-lish elevations and positions on the temporary benchmarks which were surveyed as part of the network. The network was also tied into CORS in the region. The datasheets for the CORS and the NGS monuments occupied is included as Technical Appendix 35 to this Volume. The net-work was designed with multiple, simultaneous occupations, with 4 hours between start times, of points in order to provide redundant vectors and loop closures.
The GPS observations were processed using Trimble Geomatics Office’s baseline processing module, WAVE (Weighted Ambiguity Vector Estimator). Ionosphere-free fixed solutions were found to provide the best results. Preliminary blunder detections were undertaken using “Redun-dant Vectors” and Global Network Closures and any extremely large errors were eliminated.
The data were adjusted using a minimally constrained geodetic control network to test the network internally, without external constraints, and produce a statistical summary. The statistics from this process are required to be within the tolerances outlined in (FGCS 1988). These toler-ances are represented as ellipsoids showing the margin of error value on a graph of the theoreti-cal points, covariance values that indicate the degree of error of the vectors relative to the other vectors in the network, and a chi-square test that compares the predicted variance determined through a least squares analysis to the observed variance. The summary was then evaluated to eliminate vectors that are outside of the error tolerances to be replaced with redundant vectors that are within the tolerances until all tolerances are met.
The quality of the existing horizontal control was assessed before undertaking the con-strained adjustment. Geodetic inverses between the control monuments were compared with the geodetic inverses derived from the minimally constrained least square adjustment results. This distance analysis is especially useful, since it provides a datum invariant means of comparison. Once the minimally constrained network satisfies the requirements of the above tests, control points in the network are selected with an optimum spatial relationship to fully constrain the net-work to known control points, and have their provided values entered as the position for those points and the network readjusted. The same statistical tests are rerun on the adjusted network, as well as visually comparing adjusted values of control points to provided values of control points not used as constraints. Again, the summary is evaluated to identify vectors outside of the toler-ances and constraining points reselected to obtain the best fit to the geoid where all vectors are within the prescribed tolerances.
The preliminary adjustment results showed that the a posteriori variance factor of the net-work was close to 1.0, as should be desired, and passed the chi-square test. None of the residual components in the network were flagged for possible rejection under the τ-max test at the 0.05 level of significance. The relative confidence ellipses reveal that the horizontal positional accuracy between all directly connected pairs of stations in the network were better than (1:100,000) at the 95 percent level of confidence.

Volume II Geodetic Vertical and Water Level Datums II-29 This report is the independent opinion of the IPET and is not necessarily the official position of the U.S. Army Corps of Engineers.
Leveling Procedures Used. Leveling to tidal marks in the marsh area were performed to Second Order, Class II modified guidelines that were developed by USACE and NOAA specific-ally for this project by IPET members. These guidelines are included as Technical Appendix 32 to this Volume (IPET Digital Leveling Specifications). All leveling that was done on land, that could be driven to, followed the Second Order, Class I leveling procedures as described by the accuracy specification and standards established by FGCS (1984).
Preliminary USACE processing of GPS data and network adjustments. Preliminary processing of the GPS data collected for Phase 1a and 1b was performed by ERDC Topographic Engineering Center and USACE Jacksonville District using Trimble Geomatics Office and Waypoint GrafNet 7.50 software, respectively. The preliminary results were used in the compu-tation of the initial calculations for the LMSL values.
Final NGS processing, data validating, Blue Booking, and publishing of Phase 1 survey points. All of the GPS and leveling data were processed and adjusted to NGS Blue Booking standards for publishing control to provide the final NAVD88 (2004.65) elevations for each tidal station observed in the Phase 1 surveys. During this adjustment process, the data were repro-cessed using NOAA program PAGES. This final processing was completed in mid-April 2006 and data were posted on the NGS server at that time. A copy of the final adjustment report pre-pared jointly by IPET team members is attached as Technical Appendix 31 to this Volume (GPS Network Adjustment-IPET Project Report). These data were used by NOAA to determine the relationship between LMSL and the NAVD88 (2004.65) datum adjustment at the various tide stations. Field leveling abstracts at individual tide gauge stations are at Technical Appendix 42.
Estimated Accuracy of the Resultant GPS Vertical Control Survey
The resultant vertical accuracy varied across the project with the most errors, probably set-tlements, on the south side of New Orleans with the exception, A 193, near Mississippi to the northeast. This station was readjusted and assigned a vertical height different by 0.22 ft (0.067 m). The next worst vertical residual of 0.20 ft (0.0602 m) was in the vector from G 358 to 876 1899 B Tidal, both to the southwest of New Orleans. These are both vertical control points, and 876 1899 B Tidal is no longer associated with a NOAA tide station in the current NOAA database. The next largest residual between two stations was 0.16 ft (0.0492 m) between two different types of control points: a CORS and a NAVD88 (2004.65) vertical control point. The project error quickly drops to 0.1 ft or 3 cm. Comparisons between the free and constrained adjustments described above are tabulated in Technical Appendix 31 to this Volume. With the exception of benchmark A 193, the network fit within the accuracies of the NAVD88 (2004.65) network.
Based on the results of this control survey the vertical accuracy in the New Orleans area should be measured to 0.01 ft with desired results to ± 0.05 ft. The entire region should be thought of as a project to 0.1 ft. The ± 0.1 ft shifts noted in the GPS static survey did not warrant a readjustment of the NAVD88 (2004.65) vertical control in the NGS database. In other words, the values in the database will not change with the recent survey, except at the new locations. Some of the benchmarks along Route 1 south to Grande Isle should be releveled in an attempt to improve the vertical accuracy.

II-30 Volume II Geodetic Vertical and Water Level Datums This report is the independent opinion of the IPET and is not necessarily the official position of the U.S. Army Corps of Engineers.
Comparison of Provisional and Final Elevation Adjustments
Table 5 compares the preliminary elevations of the seven new points established on Phase 1a and Phase 1b static GPS surveys. The preliminary elevations were computed using the commer-cial geodetic software baseline reduction and adjustment program GrafNet (Version 7.5), holding fixed the VTDP points. These baseline reductions and adjustments were performed immediately after the observations were performed in January 2006. The computed differences are compared with the final elevations derived by NGS in April 2006.
Table 5 Phase 1a and 1b Comparisons between GrafNet and ADJUST Designation
WAYPOINT GrafNet Jan. 2006
NGS ADJUST April 2006
Difference (meters)
E3145 CHEF MENTEUR 4.834 4.818 0.016
DIST 1A 3.301 3.297 0.004
PIKE RM3 2.805 2.802 0.003
MICHOUD WES 19 -0.113 -0.113 0
1602C LAKE JUDGE PEREZ 0.165 0.163 0.002
1799B MV PETRO 0.77 0.773 -0.003
1494C A LA HATCHE 0.574 0.579 -0.005
The mean difference between the two adjustments was + 2 mm and the standard deviation
± 7 mm. These small differences indicate that commercial software is adequate to meet vertical accuracies required for engineering and construction control. Commercial software adjustments are significantly more efficient, both in time and cost.
Comparison of CORS-Only Elevation Adjustment
Table 6 shows a comparison of a CORS-only solution with the final adjusted elevations—using all 8 hours of static GPS observations. The four CORS sites used are listed in Appen-dix 31. This GrafNet solution held fixed only the CORS stations and removed the VTDP points from the network.
Table 6 Phase 1a & 1b Comparisons between GrafNet CORS-Only Solution and ADJUST Designation
WAYPOINT GrafNet CORS Solution Jan. 2006
NGS ADJUST April 2006
Difference meters
E3145 CHEF MENTEUR 4.837 4.818 0.019
DIST 1A 3.305 3.297 0.008
PIKE RM3 2.809 2.802 0.007
MICHOUD WES 19 -0.105 -0.113 0.008
1602C LAKE JUDGE PEREZ 0.176 0.163 0.013
1799B MV PETRO 0.781 0.773 -0.008
1494C A LA HATCHE 0.584 0.579 -0.005
The mean difference between the two adjustments was + 10 mm and the standard deviation ± 5 mm. These results are likely biased from the E3145 Chef Menteur result in that this

Volume II Geodetic Vertical and Water Level Datums II-31 This report is the independent opinion of the IPET and is not necessarily the official position of the U.S. Army Corps of Engineers.
benchmark was located adjacent to a large bridge structure. This indicates that sufficient accu-racy for engineering applications is available from CORS without simultaneously occupying 4 to 5 VTDP points as was done during this project. The efficiency and savings from reducing VTDP occupations are significant.

II-32 Volume II Geodetic Vertical and Water Level Datums This report is the independent opinion of the IPET and is not necessarily the official position of the U.S. Army Corps of Engineers.
NOAA Tidal Datum Computational Procedures and Estimated Accuracies in Southeast Louisiana Review of Tidal Datums and Tidal Datum Computation Procedures
The following discussion provides and overview of the working definitions of tidal datums and how they are computed by NOAA. The text is compiled directly from two NOAA major references on tidal datums, NOS CO-OPS 1 (NOS 2001) and NOS CO-OPS 2 (NOS 2003).
NOAA Definitions of Tidal Datums
The tide is the name given to the alternate rising and falling of the level of the sea due to the gravitational forces of the sun and moon. The observed tide at a given coastal location is a func-tion of the response of the ocean basin from which the tide progresses onshore and any local effects that serve to modify the incoming ocean tide. Fundamentally, the tides are broadly cate-gorized as once daily (diurnal), twice daily (semidiurnal), or a mixture of the two (mixed). The dominant tide type on the east coast of the United States is semidiurnal; mixed on the west coast. In contrast, the northern Gulf of Mexico exhibits chiefly diurnal tides or mixed tides with the switch from mixed to diurnal varying both with time at a single location and with location along the coast.
A vertical datum is termed a tidal datum when it is defined by a certain phase of the tide. Tidal datums are local datums and should not be extended into areas which have differing hydro-graphic characteristics without substantiating measurements. In order that they may be recovered when needed, such datums are referenced to fixed points known as benchmarks.
The NOAA definitions of tidal datums are as follows:
MHHW (Mean Higher High Water) is defined as the arithmetic mean of the higher high water heights of the tide observed over a specific 19-year Metonic cycle (the National Tidal Datum Epoch). Only the higher high water of each pair of high waters of a tidal day is included in the mean. For stations with shorter series, a comparison of simultaneous observations is made with a primary control tide station in order to derive the equivalent of a 19-year value (Marmer 1951).
MHW is defined as the arithmetic mean of all of the high water heights observed over a spe-cific 19-year Metonic cycle (the NTDE). For stations with shorter series, a comparison of simul-taneous observations is made with a primary control tide station in order to derive the equivalent of a 19-year value.
MSL is defined as the arithmetic mean of hourly heights observed over a specific 19-year Metonic cycle (the NTDE). Shorter series are specified in the name, like monthly MSL or yearly MSL (e.g., Marmer 1951; Hicks 1985).

Volume II Geodetic Vertical and Water Level Datums II-33 This report is the independent opinion of the IPET and is not necessarily the official position of the U.S. Army Corps of Engineers.
MLW is defined as the arithmetic mean of all of the low water heights observed over a spe-
cific 19-year Metonic cycle (the NTDE). For stations with shorter series, a comparison of simul-taneous observations is made with a primary control tide station in order to derive the equivalent of a 19-year value.
MLLW is defined as the arithmetic mean of the lower low water heights of the tide observed over a specific 19-year Metonic cycle (the NTDE). Only the lower low water of each pair of low waters of a tidal day is included in the mean. For stations with shorter series, a comparison of simultaneous observations is made with a primary control tide station in order to derive the equivalent of a 19-year value.
In addition, the Mean Tide Level (MTL), Diurnal Tide Level (DTL), Mean Range (Mn), Diurnal High Water Inequality (DHQ), Diurnal Low Water Inequality (DLQ), and Great Diurnal Range (Gt) are defined as follows:
MTL is a tidal datum equivalent to the average of MHW and MLW.
DTL is a tidal datum equivalent to the average of MHHW and MLLW.
Mn is the difference in elevation between MHW and the MLW.
DHQ is the difference in elevation between MHHW and MHW.
DLQ is the difference in elevation between MLW and MLLW.
Gt is the difference in elevation between MHHW and MLLW.
Tidal Datum Computation Overview
There is a variation in the path of the moon about the Earth that has a period of about 18.6 years, and this variation is called the regression of the moon’s nodes. The regression of the nodes introduces an important variation into the amplitude of the monthly and annual mean range of the tide. It is the regression of the moon’s nodes which forms the basis of the definition of the NTDE. Because the variability of the monthly mean range is larger than the regression of the nodes, the NTDE is defined as an even 19-year period so as not to bias the estimate of the tidal datum. For datum computation, the NTDE is used as the fixed period of time for the deter-mination of tidal datums because it includes all significant tidal periods, is long enough to average out the local meteorological effects on sea level, and by specifying the NTDE, uniform-ity is applied to all the tidal datums. However, because of relative sea level change, as the years pass, tidal datums become out of date for navigational purposes and for other applications. Thus,
NOTE: It needs to be emphasized that tidal datums are locally dependent datums and should not be extended into areas which have differing hydrographic characteristics. This is particularly important in discussing MSL as the plane of the surface of the sea meeting the land which is locally variable and dependent upon topographic features and local tectonic movement. It should become the practice of all who rely on tidal datums to refer to MSL as Local Mean Sea Level (LMSL) and to not broaden the practical application of this datum into locations that do not share similar tidal characteristics or its relationship to geodetic datums in regions with dissimilar topography.

II-34 Volume II Geodetic Vertical and Water Level Datums This report is the independent opinion of the IPET and is not necessarily the official position of the U.S. Army Corps of Engineers.
a new NTDE must be considered periodically (Hicks 1985). The policy of NOS is to consider a new tidal datum epoch every 25 years to appropriately update the tidal datums to account for the global sea level change and long-term vertical adjustment of the local landmass (e.g., due to subsidence or glacial rebound) (Gill et al. 1998). NOS has recently updated from the 1960-1978 NTDE to a 1983-2001 NTDE in 2003. Estimated relative sea level trends compiled from obser-vations at U.S. tide stations found in Zervas (2001) were used to make this determination that a new NTDE was required.
A primary determination of any tidal datum is based directly on the average of observations over a 19 year period. For example, a primary determination of MHW is based directly on the average of the tabulated observed high waters at a tide station over a 19 year period. Tidal datums must be specified with regard to the NTDE. The four fundamental steps required in com-puting tidal datums are:
1. Make Observations - Tidal datums are computed from continuous water level observa-tions over specified lengths of time. Observations are made at specific locations called tide stations. Each tide station consists of a water level gauge or sensor(s), a data collec-tion platform or data logger and data transmission system, and a set of tidal benchmarks established in the vicinity of the tide station. NOS collects water level data at 6-minute intervals.
2. Tabulate the Tide - Once the 6-minute interval data are quality controlled and any small gaps filled, the data are processed by tabulating the high and low tides and hourly heights for each day. Tidal parameters from these daily tabulations of the tide are then reduced to mean values, typically on a calendar month basis for longer period records or over a few days or weeks for shorter-term records.
3. Compute Tidal Datums - First reduction tidal datums are determined directly by averag-ing values of the tidal parameters over a 19-year NTDE. Equivalent NTDE tidal datums are computed from tide stations operating for shorter time periods through comparison of simultaneous data between the short-term station and a long-term station.
4. Compute Benchmark Elevations - Once the tidal datums are computed from the tabula-tions, the elevations are referenced to the benchmarks established on the land using the elevation differences established by differential leveling between the tide gauge sensor “zero” and the benchmarks during the station operation. The benchmark elevations and descriptions are disseminated by NOS through a station-specific published benchmark sheet. Connections between tidal datum elevations and geodetic elevations are obtained after leveling between tidal benchmarks and geodetic network benchmarks. Traditionally, this has been accomplished using differential leveling; however, GPS surveying tech-niques can also be used (NGS 1997).
NOAA makes publicly available tidal datum values for most NOS currently active and his-torical water level stations via benchmark sheets. All tidal datum values contained in the bench-mark report are referenced to MLLW by convention as the chart datum used by NOAA’s Office of Coast Survey (OCS) for displaying water depths on NOAA charts. The sheets are also careful to reference all of the associated benchmarks that permit accurate computation of the locally specific tidal datums. By convention all benchmark elevations are also referenced to MLLW. It is the practice of NOS to install a minimum of ten marks for National Water Level Observation

Volume II Geodetic Vertical and Water Level Datums II-35 This report is the independent opinion of the IPET and is not necessarily the official position of the U.S. Army Corps of Engineers.
Network (NWLON) stations and a minimum of five marks for subordinate stations installed for hydrographic, photogrammetry surveys, special projects, and contract projects for the USACE (NOAA 2005).
Due to time and resource constraints, primary determinations of tidal datums (i.e., using 19 years of data) are not practical at every location along the entire coast where tidal datums are required. At intermediate locations, a secondary determination of tidal datums can usually be made using observations covering much shorter periods than 19 years. Results are corrected to an equivalent mean value by comparison with a suitable control tide station (Marmer 1951).
Conceptually, the following steps need to be completed in order to compute equivalent NTDE tidal datums at short-term stations using the method of comparison of simultaneous observations:
1. Select the time period over which the simultaneous comparison will be made.
2. Select the appropriate control tide station for the subordinate station of interest based on location, tidal characteristics, and availability of data.
3. Obtain the simultaneous data from subordinate and control stations and obtain or tabulate the tides and compute monthly means, as appropriate.
4. Obtain the accepted NTDE values of the tidal datums at the control station from NOS via the CO-OPS Website (http://tidesandcurrents.noaa.gov).
5. Compute the mean differences and/or ratios (as appropriate) in the tidal parameters between the subordinate and control station over the period of comparison.
6. Apply the mean differences and ratios computed in step 5, above, to the accepted values at the control station to obtain equivalent or corrected NTDE values for the subordinate station.
The computations use slightly different formulas depending on the type of station. The
following are some key datum computation methods used by NOS (in step 6 above) that differ slightly depending upon the tidal characteristics and the type of tide.
Standard Method. This method is generally used for the west coast and Pacific Island stations and is also called the Range Ratio Method. First, equivalent NTDE values for MTL, Mn, DHQ, and DLQ are determined by comparison with an appropriate control. From these, the following are then computed:
MLW = MTL - (0.5 x Mn)
MHW = MLW + Mn
MLLW = MLW - DLQ
MHHW = MHW + DHQ.

II-36 Volume II Geodetic Vertical and Water Level Datums This report is the independent opinion of the IPET and is not necessarily the official position of the U.S. Army Corps of Engineers.
Modified-Range Ratio Method. This method is generally used for the east coast, gulf coast, and Caribbean Island stations. First, equivalent NTDE values for MTL, DTL, Mn, and Gt as determined by comparison with an appropriate control. The difference from the Standard Method is that ratios of the DHQ and DLQ values are not used to compute MHHW and MLLW because numerically the values are very small for semidiurnal tide areas and, consequently, a Gt ratio about DTL is used instead. From these, the following are computed:
MLW = MTL - (0.5 x Mn)
MHW = MLW + Mn
MLLW = DTL - (0.5 x Gt)
MHHW = MLLW + Gt.
Note: For the short-term stations in the IPET project region, the type of tide is chiefly diurnal with one low tide per tidal day. As such, the Modified Range Ratio method described above is used by NOAA to compute equivalent 19-year NTDE tidal datums at short-term stations.
Errors in Determination of Tidal Datums Using NOAA Procedures
Errors in determination of tidal datums are derived from the nature of the basic theory of the computational process in which equivalent NTDE 19-year tidal datums are determined from time series much shorter than 19 years. The error in a tidal datum computed from a 19-year first reduction of data is assumed to be zero.
Swanson (1974) performed an error analysis for determining tidal datums from short-term observations. Using the comparison of simultaneous observations method, Swanson developed datum uncertainties at 1-, 3-, 6-, and 12-month time periods based on comparisons between NWLON station pairs proceeding along the coast. One NWLON station was selected as control, the other as subordinate. The resulting datums for the shorter time periods were compared to the accepted values based on a NTDE. This comparison resulted in the generalized accuracy esti-mates for tidal datums determined at short-term stations for the east coast, west coast, and gulf coast. These are summarized in Table 7.
The uncertainties of datums for gulf coast stations are generally higher because of the low amplitude tidal signal in that area and the relatively larger effects of weather on the water levels than the east and west coasts. These generalized accuracy estimates have been used operationally for error budgets and error estimates for NOAA tidal datum products since the report was issued in 1974. It is recognized that these are regional in nature and are expressions of maximum errors as subordinate stations are typically installed between NWLON stations, thus shortening the geographic and tidal distances between control and subordinate pairs. Because of these con-straints, the Swanson regional pooled analysis does not provide the most precise technique for operational purposes to estimate errors at the resolution needed for exact locations of interest.

Volume II Geodetic Vertical and Water Level Datums II-37 This report is the independent opinion of the IPET and is not necessarily the official position of the U.S. Army Corps of Engineers.
Table 7 Generalized Accuracy of Tidal Datums for East, Gulf, and West Coasts When Determined from Short-Term Series of Record (one sigma) from Swanson (1974)
In applied research performed by NOS (Bodnar 1981), multiple curvilinear regression equa-tions estimating the accuracy of computed datums were developed using a regression analysis of the standard deviations found in the Swanson (1974) report. Bodnar’s analyses effectively deter-mined which independent variables related to differences in tidal characteristics might explain the variations in the Swanson standard deviations using the standard deviations as the dependent variables. The list below summarizes the independent variables that proved to be highly signifi-cant and displays them in equation form with the slope coefficients for each variable produced by the regression model. Bodnar noted deficiencies of his approach in the sample size, inter-dependence of station pairs, and statistical population representation. Operationally, NOAA has adopted the formulas for MLW for use in practice to estimate the error in datum determination because the low water differences express the effects of shallow water and bottom friction better than MHW and provide the most conservative estimate.
The regression equations and parameters for estimating uncertainties in tidal datums for MLW from series lengths 1 to 12 months (from Bodnar 1981) are as follows:
S1M = 0.0068 ADLWI + 0.0053 SRGDIST + 0.0302 MNR + 0.029
S3M = 0.0043 ADLWI + 0.0036 SRGDIST + 0.0255 MNR + 0.029
S6M = 0.0019 ADLWI + 0.0023 SRGDIST + 0.0207 MNR + 0.030
S12M = 0.0045 SRSMN + 0.128 MNR + 0.025
where
S = standard deviation (in feet)
M = number of months of subordinate station observation
ADLWI = absolute time difference of the Low Water Intervals between control and subordinate stations (in hours)

II-38 Volume II Geodetic Vertical and Water Level Datums This report is the independent opinion of the IPET and is not necessarily the official position of the U.S. Army Corps of Engineers.
SRGDIST = square root of the geodetic distance between control and subordinate stations (in nautical miles)
MNR = a mean range ratio that is defined as the absolute value of the difference in mean range between control and subordinate stations divided by the mean range of tide at the control station (using range values in feet), and
SRSMN = square root of the sum of the mean ranges at the control and subordinate stations (in feet)
These equations state that the error in determination of tidal datums at a subordinate station is a function of the geographic distance and the tidal distance from the long-term control to which simultaneous observations are being made. Tidal distance is expressed by the differences in time and range of tide between the control/short term stations. The further away the station is and the larger the differences in tidal characteristics from the control, the larger the error will be.
Pensacola, FL, is the closest NWLON station with NTDE-accepted 19-year datums near the IPET study region. The station's tidal datums are based on a first reduction of hourly height observations over the full NTDE period. The gap in NOAA NWLON coverage in this area will be discussed in the section on sea level trends. It is accepted procedure to “bring in” 19-year equivalent datums to a subordinate short-term station by using an intermediary long-term station if appropriate. Tidal datums at New Canal Station were computed by simultaneous comparison of 9 years of data with concurrent data at Bay Waveland Yacht Club. The accepted tidal datums at Bay Waveland Yacht Club were based upon a simultaneous comparison of 14 years of data with Pensacola, FL. This approach has been found to be more accurate than directly comparing data from New Canal Station with Pensacola because of the extreme geographical and tidal distances involved.
NOAA also uses the methodology described in Bodnar (1981) when a station has longer than one year of data to estimate errors in tidal datum determination. Based on this approach, the fol-lowing procedures were applied to the estimation of the error at New Canal Station using the two-step approach:
First Component: Error in subordinate datum at New Canal
S (12 months) = 0.0045 SRSMN + 0.0128 MNR + 0.025 (in feet)
SRSMN = SQRT (GTsub + GTcon)
MNR = ABS (GTsub - GTcon) / GTcon
where New Canal is the subordinate station (sub) and Bay Waveland Yacht Club is the Control (con). This 12-month error estimate is then interpolated to the true series length of 9 years. Thus the error difference between a 12-month estimate and a 19-year estimate for 9 years of observa-tions can be linearly interpolated by:
S (9 years) = S(12Mo) · (19 years – 9 years) / 19 years.

Volume II Geodetic Vertical and Water Level Datums II-39 This report is the independent opinion of the IPET and is not necessarily the official position of the U.S. Army Corps of Engineers.
Second Component: Error in control datum at Waveland Yacht Club
S (12 months) = 0.0045 SRSMN + 0.0128 MNR + 0.025 (in feet)
SRSMN = SQRT (GTsub + GTcon)
MNR = ABS (GTsub - GTcon) / GTcon
where Bay Waveland Yacht Club is the subordinate station with 14 years of data and Pensacola is the 19-year control station. Thus the error difference between a 12-month estimate and a 19-year estimate for 14 years of observations can be linearly interpolated by:
S (14 years) = S (12 Mo) · (19 years – 14 years) / 19 years.
Total Estimated Uncertainty in Tidal Datum Computation for Subordinate Station
Using the example for New Canal Station above, at the one-standard deviation level, the total uncertainty in the computation of tidal datums at subordinate (New Canal) based on 9 years of simultaneously compared observations with the secondary control station (Bay Waveland Yacht Club) can be expressed as the square root of the sum of the squares of the component errors described above:
S total = SQRT (S sub l 2 + S con 2 ).
At the 95% confidence interval (CI), the total uncertainty is:
1.96 (S total) = Z (95% CI).
Actual numerical estimates for IPET study stations are presented in the next section.

II-40 Volume II Geodetic Vertical and Water Level Datums This report is the independent opinion of the IPET and is not necessarily the official position of the U.S. Army Corps of Engineers.
Reestablishment of New Canal (17th Street Canal) Gauge Station and Associated Tidal Datum Error
One component in determining the LMSL – NAVD88 relationship for the IPET study area involved the reestablishment of the NOAA historical water level station at New Canal (876 1927) located on the southern shore of Lake Pontchartrain near the 17th Street Canal levee breach. For this IPET project, NOAA reestablished the station as a means to validate datums computed for that site based on the previous 1983-1992 time period. Six-minute data collected at the location for a 3-month time period from December 2005 to February 2006 were quality controlled by NOAA analysts and tabulated to obtain monthly means. The means were then compared with simultaneous observations from Waveland, MS, as per NOAA standards for computing tidal datums at subordinate stations. Preliminary tidal datums were obtained for New Canal Station for the most recent data. Figure 9 is a tabular comparison of the results showing the similarity of the elevations and ranges of tide. Mindful that the comparison is between a 9-year period and a recent 3-month period, the datum recovery is considered acceptable, indicat-ing that the new installation and associated benchmark survey were correctly done and the new gauge is operating well. For operational purposes, the datum based on the 9-year time series is still considered the accepted series. NOAA is in the process of upgrading and hardening the station at New Canal for long-term operation and will be able to use this station to further update tidal datums and relative sea level trends as time series are accrued.
Figure 9. Comparison of presently accepted tidal datums with preliminary tidal datums computed on most recent data from New Canal Station (876 1927). Elevations are relative to arbitrary station “0”.
The justification for retaining the datums computed from the data on the older, but longer data series can also be illustrated through a datum error analysis described below. The currently published tidal datums for New Canal are based on 108 months of observations from October 1983 through September 1992. These datums are based on the latest 1983-2001 NTDE through comparison of simultaneous observations with the control station Bay Waveland Yacht Club, (874 7437). The accepted tidal datums at Bay Waveland Yacht Club are in turn based on 14 years of observation from September 1979 through August 1993 referenced to the latest 1983-2001 NTDE through comparison of simultaneous observations with the primary control station at Pensacola, FL (872 9840).

Volume II Geodetic Vertical and Water Level Datums II-41 This report is the independent opinion of the IPET and is not necessarily the official position of the U.S. Army Corps of Engineers.
The estimation of the uncertainty in tidal datums at New Canal Station is determined from two separate components. The first is the uncertainty of the datums at New Canal using com-parison of simultaneous observations with the long-term secondary control station at Bay Waveland Yacht Club. The second component is the uncertainty of the datums at Bay Waveland Yacht Club using the comparison of simultaneous observations with the primary control station at Pensacola. Pensacola accepted tidal datums were determined directly from a reduction of hourly heights from 19 years of observation, 1983-2001.
The estimated uncertainty in the tidal datums at New Canal Station based on a 9-year com-parison of simultaneous observations with Bay Waveland Yacht Club is 0.021 ft at the one-standard deviation level. The estimated uncertainty in the tidal datums at Bay Waveland Yacht Club based on a 14-year comparison of simultaneous observations with Pensacola, FL, is 0.010 ft at the one-standard deviation level. The total estimated uncertainty in the tidal datum computation for New Canal Station (876 1927) can be expressed as the square root of the sum of the squares of the component errors. As shown in Figure 10, at the one-standard deviation level, the total uncertainty in the computation of tidal datums at New Canal based on 9 years of com-parison of simultaneous observations with the secondary control station at Bay Waveland Yacht Club is estimated to be 0.024 ft. At the 95% CI, the total uncertainty is:
1.96 (0.024) = 0.047 ft
At the one-standard deviation level, the total uncertainty in the computation of tidal datums at New Canal Station based on a 3-month comparison of simultaneous observations with the secondary control station at Bay Waveland Yacht Club is estimated to be 0.042 ft (Figure 11).
At the 95% CI, the total uncertainty is:
1.96 (0.042) = 0.0814 ft
Thus the error in the estimation of tidal datums at the 95% CI at New Canal for 3 months is almost twice the error for a 9-year series.

II-42 Volume II Geodetic Vertical and Water Level Datums This report is the independent opinion of the IPET and is not necessarily the official position of the U.S. Army Corps of Engineers.
Figure 10. Estimation of uncertainty in tidal datum computation for 9-year historical data collected at NOAA Tide Station 876 1927, units in feet.

Volume II Geodetic Vertical and Water Level Datums II-43 This report is the independent opinion of the IPET and is not necessarily the official position of the U.S. Army Corps of Engineers.
Figure 11. Estimation of uncertainty in tidal datum computation for newly collected 3 months of data at NOAA Tide Station 876 1927, units in feet.

II-44 Volume II Geodetic Vertical and Water Level Datums This report is the independent opinion of the IPET and is not necessarily the official position of the U.S. Army Corps of Engineers.
Connection between Tidal Datums and Geodetic Datums in Southeast Louisiana
Establishment of tidal datums and connection to geodetic datum at tide stations required survey connections between tidal benchmarks and geodetic benchmarks using differential levels or GPS. Use of GPS survey equipment to occupy tidal benchmarks is the emerging state-of-the-art method for making the connections. See the NOS web site at http://tidesandcurrents .noaa.gov and www.ngs.noaa.gov for further detailed information on geodetic and tidal datum elevations on benchmarks.
NOAA publishes elevation references to the NAVD88 where sufficient connections to the NSRS benchmarks exist. NOAA no longer publishes relationships of tidal datums to the NGVD29 since NOAA is not maintaining NGVD29 as a vertical reference datum and the NAVD88 is the only official recognized vertical datum. As a matter of standard procedure, NOAA will not publish tidal datum relationships relative to NAVD88 at a tide station unless there has been a verified survey connection between the tidal benchmarks and at least two benchmarks with published geodetic elevations. Basing a connection on only one isolated benchmark could provide an erroneous value if that particular mark were unstable. As will be noted later, NOAA will publish these relationships for the IPET stations using one nearby geodetic benchmark because the geodetic levels and ties were not done in isolation and all the benchmarks used have established network stability shown in the IPET surveys. Figure 12 is a page from the published benchmark sheet showing the relationship of NAVD88 to tidal datums at Waveland, MS.
Figure 12. Excerpt from published benchmark sheet for Waveland, MS, showing the relationship of NAVD88 to tidal datums.

Volume II Geodetic Vertical and Water Level Datums II-45 This report is the independent opinion of the IPET and is not necessarily the official position of the U.S. Army Corps of Engineers.
Since tidal datums are local datums relative to the land based upon tide gauge measurements, great care must be taken to interpolate and extrapolate tidal datum differences and relationships to geodetic datums away from a particular tide station location. In some instances, linear inter-polation can be used to estimate datum relationships between two known points along a stretch of shoreline that is not very complicated in a topographic and bathymetric sense. It is known that elevation differences of LMSL relative to NAVD88 generally increase going up into estuaries and tidal rivers. Relationships of the various other tidal datums (such as MLLW and MHW) relative to LMSL and NAVD88 are sloped surfaces dependent upon geographic changes in the range of tide.
Use of a Modified NTDE Procedure for Geographical Areas with High Rates of Sea-Level Change
The current NTDE used by NOAA to compute accepted tidal datums at tide stations is the 1983-2001 NTDE. The 1983-2001 NTDE was officially adopted in 2003. Prior to this update tidal datums were updated from 1941-1959 to 1960-1978. NTDE periods are updated after anal-yses of MSL trends show significant changes in MSL throughout stations in the NWLON. A change in mean sea level datum of approximately 0.10 ft is considered significant enough to warrant NTDE updates. The NTDE updates are made to ensure that tidal datums are the most accurate and practical for application by the navigation, surveying, and engineering communities and reflect the existing local stand of sea level.
Areas with Anomalous Sea Level Trends
Analyses of relative sea level trends observed around the U.S. show an average trend of +1.5 mm/yr based on trends from 67 stations over the period 1950 through 1999. There are three main geographic areas that are strongly anomalous from this average. They are Galveston Bay, Texas; southeast Louisiana; and portions of southeast Alaska. The magnitude of the sea level trends is so large in those areas +0.02 ft/yr (+6 mm/yr) in Galveston; +0.03 ft/yr (+10 mm/yr) in Grand Isle; and -0.04 ft/yr (-13 mm/yr) in Juneau, that computation of a 19-year epoch value for MSL has no practical meaning. The analysis of sea level trends at these locations showed that a new NTDE period was required, and NOAA has adopted a modified procedure in these areas to compute accepted tidal datums based solely on the most recent 5 years of observations rather than a 19-year epoch value. It is named a modified epoch procedure because only the LMSL, MTL, and DTL datums are determined based on the latest 5 years of data. The mean ranges of tide and the diurnal inequalities are still all determined based on the full 19-year period NTDE (1983-2001). The period of the most recent modified NTDE for areas with rapidly changing sea level rates was 1980-1998 where the LMSL was based on data collected from last 5 years of that period. This update was necessary to ensure that the tidal datums accurately represent the exist-ing stand of sea level. Users relying on products based on the old datums will find significant differences in products based on the new datums based on this update. As a result of analyses completed by Zervas (2001), NOAA Technical Report 50 (NGS 2004) and the current IPET surveys updates will be made more frequently than 19 years for these anomalous areas to adjust to the relatively rapidly changing sea level.
There are no changes required to the tidal prediction products released by NOAA as a result of these datum updates. Prior to the most recent update, observed water levels were typically

II-46 Volume II Geodetic Vertical and Water Level Datums This report is the independent opinion of the IPET and is not necessarily the official position of the U.S. Army Corps of Engineers.
biased several tenths of a foot higher than predicted water levels because the observed water levels were based on outdated tidal datums. Users will note that predicted and observed eleva-tions will generally agree more closely during normal weather conditions after the update than previous predicted tides versus observed water levels.
Local Mean Sea Level (LMSL)
Based on the above discussion, NOAA uses two official practical working definitions of LMSL. One is for areas of relative slowly changing MSL relative to the land for which LMSL is determined over the standard 19-year NTDE, and other one for areas of fast-changing MSL relative to the land for which LMSL is determined from the last 5 years of record in the NTDE period. In the following discussion of the IPET study area surrounding New Orleans, it has been found that this area falls into the second category, with apparent local land subsidence rates any-where from 0.02 to 0.04 ft/yr (6-11 mm/yr). Based on the IPET analyses, the NOAA estimates for subsidence from NOAA Technical Report 50 (NGS 2004), and the NOAA estimates of sea level trends, the IPET study area falls into the second category of an area with fast-changing MSL.

Volume II Geodetic Vertical and Water Level Datums II-47 This report is the independent opinion of the IPET and is not necessarily the official position of the U.S. Army Corps of Engineers.
Updated Tidal Datums in the IPET Study Area--LMSL Relationships to NAVD88 (2004.65)
In the Mississippi Delta region diurnal tidal ranges of tide vary from 0.50 ft at USCG New Canal Station in Lake Pontchartrain to 1.0 ft at Southwest Pass to 1.50 ft at Comfort Island north of the Mississippi River Gulf Coast Outlet in Chandelier Sound. The Mississippi River proper is classified as non-tidal above the Head of Passes where the Mississippi River diverges into distinct branches. NOAA refers soundings above this location to the LWRP maintained by the USACE. NOAA uses the reference datum of MLLW for all NOAA navigation products, tide tables and charts. In Louisiana, the New Orleans District uses MLG as the reference datum for hydrographic surveys. As discussed on other sections of this report, the elevation relationships between MLG and MLLW are the subject of an operational study by NOAA and the USACE and are also tied to the update of NAVD88.
NOAA has operated about 245 historical water level stations in Louisiana. NOAA has com-puted 1983-2001 NTDE-accepted tidal datums for 49 stations and published benchmark sheets for 38, of which only 10 have any reference to NAVD88. In contrast, NOAA has operated about 1,029 historical water level stations in Florida and has computed 1983-2001 NTDE-accepted tidal datums for 558 stations, has published benchmark sheets for 509 of those stations, and has references to NAVD88 for 389 of those. This resulted in about 20 percent of Louisiana tide sta-tions having accepted datums with geodetic connections compared to 70 percent in Florida. Florida has enjoyed a close continuing partnership among NOAA and the Florida Department of Environmental Protection (FLDEP) since the 1970s when many of the tide stations were estab-lished as part of a state/federal marine boundary program. A similar program in Louisiana ended with only 3 of 5 phases completed and with no follow-up activities due to lack of funding by the State and NOAA. (For more information see CO-OPS’ web site referencing the NOAA NVCN (National Vertical Control Network) VDatum program). Until this recent IPET activity, NOAA updates of tidal datums were through a cooperative effort with two stations in St. Charles Parish and a few short-term stations in Atchafalaya Bay and near Port Fourchon in support of hydrographic surveys. NOAA published an exhaustive assessment of the geodetic conditions in the region in NOAA Technical Report 50 (NGS 2004).
Preliminary Local Mean Sea Level Relationship (December 2005)
Utilizing the new orthometric elevations that NGS and NGS contactors provided for the Southeast Louisiana region, NOAA, in support of the IPET, began the process of updating the relationships between LMSL and NAVD88 (2004.65). Initial orthometric elevations were obtained and compared to LMSL at four locations in the IPET study area (Figure 13).

II-48 Volume II Geodetic Vertical and Water Level Datums This report is the independent opinion of the IPET and is not necessarily the official position of the U.S. Army Corps of Engineers.
Figure 13. NOS preliminary Local Mean Sea Level (LMSL) (1983-2001 NTDE) minus NAVD88 (2004.65) differences for southern Lake Pontchartrain.
The relationships were established by comparing NAVD88 (2004.65) orthometric elevations with existing 1983-2001 NTDE tidal benchmark elevations from NOAA benchmark sheets as detailed in Figure 14.

Volume II Geodetic Vertical and Water Level Datums II-49 This report is the independent opinion of the IPET and is not necessarily the official position of the U.S. Army Corps of Engineers.
Figure 14. Excerpt from NOS tidal benchmark sheet summarizing the procedure used to obtain the new relationship between LMSL (1983-2001) and NAVD88 (2004.65)—December 2005.
Based on the preliminary orthometric elevations NAVD88 (2004.65), 1983-2001 datums, and benchmark elevations computed from 10 years of data collected between 1983 and 1992, NOS calculated relationships between LMSL and NAVD88 (2004.65). It was determined that New Canal Station was the most representative of the southern Lake Pontchartrain region. Table 8 below summarizes all of the relationships used in analysis supporting the data in Figure 13.
Table 8 Preliminary relationships of LMSL (1983-2001 NTDE) relative to NAVD88 (2004.65)

II-50 Volume II Geodetic Vertical and Water Level Datums This report is the independent opinion of the IPET and is not necessarily the official position of the U.S. Army Corps of Engineers.
Rationale for Connections to Additional NOS Water Level Stations
Following the initial assessment of LMSL – NAVD88 2004.65 relationships USACE IPET contractor (3001, Inc.) surveyed additional benchmark elevations in the IPET region during Phase 1a and Phase 1b of its operations plan (Figure 15 below).
Figure 15. Planned locations of the 3001, Inc. Phase 1a and Phase 1b operations plan to tie in additional NOS water level stations in support of the IPET.
Careful consideration was given to the stations that were tied into the NAVD88 (2004.65) network in an effort to provide the most accurate coverage for the IPET region. Primary con-sideration was given to those stations with updated NOAA 1983-2001 benchmark sheets in the IPET study area. Secondary consideration was given to water level stations that had more than one year of data. Tertiary consideration was given to water level stations that had recoverable benchmarks and were easily accessible to the 3001, Inc. field crew. Finally, the decision was made to include several of the New Orleans District water level stations in order to better estab-lish the LMSL – NAVD88 (2004.65) relationship in the immediate vicinity of New Orleans and locations of select breached levees. Phase 1a of the field operations plan was successful in con-necting four NOAA historical water level stations at Michoud, Chef Menteur, The Rigolets, and Carrollton on the Mississippi River.

Volume II Geodetic Vertical and Water Level Datums II-51 This report is the independent opinion of the IPET and is not necessarily the official position of the U.S. Army Corps of Engineers.
Phase 1b of the field operations plan was successful in connecting three additional NOS water level stations at West Point a la Hatche, Lake Judge Perez, and MV Petrol. An additional surveying effort established connections at Lafitte, Alliance, Empire, and Venice. Upon com-pletion of Phase 1a and 1b surveying operations, 14 NOS water level stations had been tied into the NGS benchmark network for use in determining the LMSL - NAVD88 (2004.65) relation-ship in the IPET study area, as shown in Figure 16 and Table 9 below.
Figure 16. Phase 1a and Phase 1b geodetic connections established by 3001, Inc. in support of the IPET.
A-E contractor, 3001, Inc., established geodetic connections for five stations along the Mississippi River from Venice to Carrollton during the Phase 1a and 1b surveying effort. How-ever, only one of the stations was included in the establishment of the final LMSL – NAVD88 (2004.65) relationship for IPET. The upper four stations connected in the Mississippi River are above the Head of Passes and are classified by NOAA as non-tidal. The water level regime within the Mississippi River channel is functionally and oceanographically very different from a tidal regime; consequently these stations were not included in the analysis. A river LWRP is a different concept than LMSL.

II-52 Volume II Geodetic Vertical and Water Level Datums This report is the independent opinion of the IPET and is not necessarily the official position of the U.S. Army Corps of Engineers.
Table 9 Summary of Geodetic Connections Established after 3001, Inc. Surveying Operations
Local Mean Sea Level Relationships in the IPET Study Area
Based on the validation of historic and present data from the currently operating station at New Canal Station and the orthometric geodetic elevation values supplied by 3001, Inc., it is possible to estimate the relationship between LMSL and NAVD88 (2004.65) in the IPET study region. Drawing upon methodology outlined in the previous sections and reviewed in Figure 17 below, benchmark elevations relative to MLLW were compared to NOAA validated NAVD88 (2004.65) values. Initially the elevation of benchmark ALCO 1931 (1.871 m or 6.138 ft) was compared to the NAVD88 (2004.65) elevation (1.870 m or 6.135 ft). The difference of these elevations results in the elevation of NAVD88 (2004.65) relative to MLLW, which can then be compared to the published LMSL value (0.078 m). Following this procedure the relationship between LMSL and NAVD88 (2004.65) is shown to be 0.25 ft.
The values in Figure 18 and Table 10 suggest a regional average difference of LMSL above NAVD88 (2004.65) of approximately 0.20 ft. Outliers to this approximation are noted at Michoud near the confluence of the MRGO and GIWW between Orleans Parish and St. Bernard Parish, and at Venice just north of the Head of Passes. The former anomaly is addressed in NOAA Technical Report 50 (NGS 2004) that shows that rates of vertical displacement for benchmarks at that location are significantly greater in the region than other areas surrounding New Orleans—as shown in Figure 19 below.
The anomaly at Venice may be explainable in terms of the tidal datums tabulated at that loca-tion. As was stated earlier, NOAA considers all water of the Mississippi River north of the Head of Passes as non-tidal. Elevations in the Mississippi River north of this location are referred to the LWRP maintained by the USACE, and not MLLW used by NOAA for charting purposes. The tidal datums at Venice have not been published as a proper long-term control on the river station; the relationship has not yet been established to understand the seasonal variability. While the data collected from January to October 1986 should offer a good representation of tidal char-acteristics during low river stages, other historical river stations show a distinct masking of all tidal characteristics during the spring season due to periods of high river flow and river manage-ment practices.

Volume II Geodetic Vertical and Water Level Datums II-53 This report is the independent opinion of the IPET and is not necessarily the official position of the U.S. Army Corps of Engineers.
Figure 17. Excerpt from NOS tidal benchmark sheet summarizing the procedure used to obtain the relationship between LMSL and NAVD88 (2004.65) at New Canal Station.
In addition, NOAA Report 50 (NGS 2004) also shows a very high rate of local subsidence in the vicinity of Venice estimated to be from -10 to -30 mm/yr vertical change.

II-54 Volume II Geodetic Vertical and Water Level Datums This report is the independent opinion of the IPET and is not necessarily the official position of the U.S. Army Corps of Engineers.
Figure 18. Preliminary LMSL (1983-2001 NTDE) – NAVD88 (2004.65) relationships in the IPET region. Values in feet.
Table 10 Initial LMSL 1983-2001 NTDE – NAVD88 (2004.65) Relationships in IPET Study Area

Volume II Geodetic Vertical and Water Level Datums II-55 This report is the independent opinion of the IPET and is not necessarily the official position of the U.S. Army Corps of Engineers.
Figure 19. Rates of vertical displacement for benchmarks near Michoud Substation from NOAA Technical Report 50 (NGS 2004).

II-56 Volume II Geodetic Vertical and Water Level Datums This report is the independent opinion of the IPET and is not necessarily the official position of the U.S. Army Corps of Engineers.
Modified 5-Year Tidal Datum Analysis for New Orleans Study Area
As previously stated, in areas of rapidly increasing or decreasing sea level it has become important to update tidal datums on a modified 5-year epoch. Grand Isle, LA, was one of the stations chosen to have the 5-year update methodology applied due to a sea level trend of 0.03 ft/yr (10 mm/yr) (Zervas 2001). The current 1983-2001 tidal datums at Grand Isle are based on data from January 1997 to December 2001. Due to the rapid sea level trends seen at other locations around the IPET study region it was determined that updating all currently published datums used in the analysis would provide a better estimate of the LMSL – NAVD88 (2004.65) relationship in the region.
Procedurally the methodology involves establishing a 5-year tidal datum for the control station which is used in the simultaneous comparison process previously detailed. The nearest stations with reliable data that could be used for this purpose were at Waveland, MS, and Grand Isle, LA. Based on a separate analysis of general sea level trends and other tidal characteristics in the area, it was determined that Waveland, MS, could be used as a control for the stations in the northern region and Grand Isle, LA, could be used for the southern region.
Data from January 2001 to December 2005 were processed according to standard procedures for tabulating tidal datums for primary controls. Hourly height observations collected over the most recent 5-year period were averaged providing an updated LMSL value. These values were then used in the simultaneous computation of tidal datums for all subordinate stations including data from three USACE water level stations that had hourly heights supplied by the New Orleans District. LMSL – NAVD88 (2004.65) relationships based on 2001-2005 updated tidal datums generally showed an increase of about 0.20 to 0.30 ft—see Table 11.
Table 11 New LMSL (2001-2005 NTDE) – NAVD88 (2004.65) Relationships Based on 2001-2005 Updated Tidal Datums

Volume II Geodetic Vertical and Water Level Datums II-57 This report is the independent opinion of the IPET and is not necessarily the official position of the U.S. Army Corps of Engineers.
Notable exceptions to this occurred at the two locations being compared with Grand Isle. The reason for the generally smaller changes at Lake Judge Perez and MV Petrol Station were that the tidal datum at Grand Isle had already been updated to a 5-year epoch so the new 2001-2005 epoch accounted for slightly less change than at Waveland, MS, which was used for comparisons in the north. These are shown in Figure 20.
Figure 20. New LMSL (2001-2005 NTDE) – NAVD88 (2004.65) relationships based on 2001-2005 updated tidal datums.
The three values calculated for the USACE stations at Florida Avenue, Paris Road, and Shell Beach were consistent with other values though the methodology in their calculation was slightly different. Hourly heights for the three USACE stations were supplied by New Orleans District. Data from these locations were referenced to NGVD29. The raw data were processed to NOS subordinate station standards using NGVD29 as station datum. Hourly heights were averaged and simultaneously compared to the same time period at Waveland, MS, and adjusted by a pre-liminary 2001-2005 LMSL datum for Waveland, MS. The LMSL above NGVD29 was deter-mined and compared to the known NGVD29 (station datum) and NAVD88 (2004.65) values supplied by New Orleans District. From this comparison LMSL above NAVD88 (2004.65) was determined for Paris Road, Florida Avenue, Shell Beach, and Seabrook. See Figure 21 for the methodology used for determining the LMSL relationship.

II-58 Volume II Geodetic Vertical and Water Level Datums This report is the independent opinion of the IPET and is not necessarily the official position of the U.S. Army Corps of Engineers.
Figure 21. Methodology for determining LMSL (2001-2005 NTDE) – NAVD88 (2004.65) relationship at USACE water level stations.

Volume II Geodetic Vertical and Water Level Datums II-59 This report is the independent opinion of the IPET and is not necessarily the official position of the U.S. Army Corps of Engineers.
Local Mean Sea Level at IHNC Florida Avenue Gauge Site (1969)
Daily water level values at Florida Avenue were supplied by New Orleans District. These data were quality checked for gaps and datum adjustments which appear to have occurred at least two times to the Florida Avenue water level data as shown in Figure 22.
Data from 1944 to date were further analyzed with a sea level trend comparison which showed that Grand Isle, LA, was an appropriate station to use as a control for the time period near 1969, as shown in Figure 23. An accepted datum was obtained for Grand Isle from histor-ical summary information for a 1964 – 1975 tidal epoch. This value was used in a comparison with Florida Avenue water level data to obtain an approximate 1969 LMSL tidal datum of 0.493 m (1.617 ft). The correct NGVD29 adjustment value used as station datum is pending. This value can be compared with the LMSL value computed for Florida Avenue based on recent data from that location which was computed to be 0.381 m (1.25 ft) used in determining LMSL – NAVD88 (2004.65) in the previous section. Figure 22 suggests that the two adjustments in 1978 and 1982 effectively lowered the computed LMSL by 0.112 m (0.4 ft) resulting in slightly higher LMSL value for data used before 1978.
Figure 22. Long-term water level data collected at Florida Avenue, USACE water level station (1944-2003).

II-60 Volume II Geodetic Vertical and Water Level Datums This report is the independent opinion of the IPET and is not necessarily the official position of the U.S. Army Corps of Engineers.
Figure 23. January 1967 to October 1971 water level data collected at Florida Avenue, USACE water level station.

Volume II Geodetic Vertical and Water Level Datums II-61 This report is the independent opinion of the IPET and is not necessarily the official position of the U.S. Army Corps of Engineers.
Relative Sea Level Trends in the IPET Study Area Introduction
Monthly MSL variations from calendar months of observed hourly heights from NOAA and USACE water level stations were analyzed to determine LMSL trends in the greater IPET study area. Results presented in the “NOAA Sea Level Variations of the United States, 1854-1999” report (Zervas 2001) were incorporated into the analysis as a comparison and to ensure validity.
Variation in Sea Levels and Global Sea Level Rise
Tide stations provide information on relative trends in LMSL as they do not distinguish sea level change due to land subsidence (or emergence) from that due to regional or global sea level rise due to climate change. Tide stations simply provide what the water is doing relative to the land. Vertical land movement at different rates may be expected during each period and conse-quently, can cause variations in relative LMSL trends. Therefore, the trends derived from tide station records are relative LMSL trends and can be considered valid only for a region near the gauge with uniform vertical land motion. Calculation of absolute LMSL trends requires the accurate determination of vertical land motion at the gauges and is beyond the scope of this description. Additionally, a number of studies (e.g., Parker 1992) have attempted to determine the global MSL trend due to the thermal expansion of seawater caused by global temperature changes and glacial melting. Although most coastal regions of the world indicate a MSL rise, some coastlines show rapidly falling LMSL. This is a consequence of water level gauges mea-suring relative LMSL change, which combines the effects of absolute MSL change and any vertical land movement. Various averaging schemes and/or corrections for vertical land motions have been devised, resulting in estimates of global MSL rise ranging from 1.0 to 2.4 mm/yr (Douglas et al. 2001), which need to be accounted for in attempting to determine LMSL rise for the region. The latest research in estimating potential acceleration in global sea level rise can be found in Church (2006).
Seasonal Variation
The average seasonal cycles in monthly LMSL can show large variations depending on the seasonal variations in water temperature, winds, and circulation pattern currents in the nearby coastal ocean. Zervas (2001) presents an analysis of the seasonal variations for the NWLON stations in which he shows that seasonal variations can be a significant factor in determination of sea level trends.
Figure 24 shows four plots of monthly LMSL for the IPET region from Pensacola to Grand Isle. It can be seen that there is a slow progression from a single mode of a seasonal high and low sea level stand at Pensacola (high in September, low in January) to a bi-modal variation at Galveston, TX, with secondary high and low in May and July, respectively. Hurricane season, from June through November, coincides with the periods of high monthly LMSL--this generally adds to the elevation of storm surge.

II-62 Volume II Geodetic Vertical and Water Level Datums This report is the independent opinion of the IPET and is not necessarily the official position of the U.S. Army Corps of Engineers.
Figure 24. Monthly LMSL from Pensacola to Galveston (meters above LMSL).

Volume II Geodetic Vertical and Water Level Datums II-63 This report is the independent opinion of the IPET and is not necessarily the official position of the U.S. Army Corps of Engineers.
Seasonal variations in the IHNC are shown in Figure 25 which was constructed by comput-ing average water surface elevations for selected years at the Florida Avenue gauge. (Elevations are in feet and are referred to approximate LMSL or NGVD29 (1983 adjustment).)
Figure 25 clearly shows a quarter-foot bias in average surface elevation during the fall hurri-cane season. Hydrodynamic modeling, risk analysis, and design criteria need to consider sea-sonal bias is assessing flood protection elevations.
Figure 25. Seasonal variations in the IHNC (Florida Avenue gauge).
Error Estimates
Figure 26 from Zervas (2001) shows the standard error of the slope of the regression line on sea level versus the year range of data. The plot indicates a standard error of approximately 0.5 mm/yr in sea level trend for stations with less than 40 years of data and 1.2 mm/yr for stations with less than 20 years of data.
An estimated 50 to 60 years of data are required for obtaining linear LMSL trends having a 95% confidence interval of ± 1 mm/yr (Zervas 2001). Any data series with less than 50 years will have a greater uncertainty, as can been seen in Figure 27.
The range of the confidence interval is inversely proportional to the length of the data series. The widest confidence intervals are for the stations with the shortest time periods of data. This indicates the danger in relying on only 25 years of data to determine a long-term LMSL trend without considering the confidence interval.

II-64 Volume II Geodetic Vertical and Water Level Datums This report is the independent opinion of the IPET and is not necessarily the official position of the U.S. Army Corps of Engineers.
Figure 26. Standard error of linear LMSL trends versus year range in data.

Volume II Geodetic Vertical and Water Level Datums II-65 This report is the independent opinion of the IPET and is not necessarily the official position of the U.S. Army Corps of Engineers.
Figure 27. 95% confidence interval for linear MSL trends versus year range of data.
Analysis Stations
NOS water level data from NWLON stations closest to the IPET study area at Galveston Pier 21, Pensacola, Grand Isle, and Dauphin Island were examined from the longest common time period from 1982 to the present. Data were also obtained from closely neighboring stations at Waveland, MS, and Waveland Yacht Club, which were combined into one series allowing for approximately 25 years of data at that location. This can be accomplished if the vertical datum (or datum of tabulation) has been carefully maintained through frequent leveling to fixed bench-marks maintained in the vicinity of the station. Figure 28 shows the simultaneous plots, with the much shorter time series from the New Canal Station shown in red. The slopes of the simple linear regressions that follow have been shown to be similar to the work done by Zervas (2001); however, the standard error is greater and the uncertainty in LMSL trends will be underestimated because the Zervas (2001) method of using autoregressive residuals of Order 1 were not pos-sible with the short time series. The elevations of the data series are not relative to the same reference zero and are plotted relative to arbitrary station datum to enable viewing of each plot.

II-66 Volume II Geodetic Vertical and Water Level Datums This report is the independent opinion of the IPET and is not necessarily the official position of the U.S. Army Corps of Engineers.
Figure 28. LMSL trends from 1982 to present for selected stations in the IPET study area.
Figure 29. LMSL trends from 1982 -1992 for selected stations in the IPET study area.
Comparison of LMSL trends from Galveston Pier 21 to Pensacola for Data bewteen 1982 - 2006
Galveston Pier (8771450) 21 y = 0.0004x + 1.5062+ 4.8 mm / yr
0.000
0.500
1.000
1.500
2.000
2.500
3.000
3.500
1-82 10
-
7-83
4-84
1-85 10
-
7-86
4-87
1-88 10
-
7-89
4-90
1-91 10
-
7-92
4-93
1-94 10
-
7-95
4-96
1-97 10
-
7-98
4-99
1-00 10
-
7-01
4-02
1-03 10
-
7-04
4-05
1-06
Monthly LMSL
Loca
l Mea
n Se
a Le
vel a
bove
Sta
tion
datu
m (m
)
8761927 8761724 7437 / 7766 8735180 8729840 8771450
Pensacola (8729840) y = 0.000195x + 2.733139 + 2.34 mm / yr
Grand Isle (8741724) y = 0.000487x + 1.847928+ 5.84 mm / yr
New Canal Station (8761927) y = 0.000332x + 1.330525+ 3.98 mm / yr
Waveland (7437 / 7766) y = 0.000293x + 0.963590 + 3.52 mm / yr
Dauphin Island (8735180) y = 0.000342x + 1.011000 + 4.10 mm / yr
Regional MSL Trends for 1982 - 1993 Time Period during which Data at New Canal was Collected
Pensacola y = -0.000124x + 2.756371 - 1.48 mm / yr
Grand Isle y = 0.000451x + 1.856832+ 5.4 mm / yr
Galveston y = 0.0007083x + 1.487143415906+ 8.49 mm / yr
New Canal y = 0.00033x + 1.33417+ 3.98 mm / yr
Waveland y = 0.00017x + 0.97613+ 2.05 mm / yr
Dauphin Island y = 0.0000032175x + 1.0361221208 + 0.036 mm / yr
0.000
0.500
1.000
1.500
2.000
2.500
3.000
3.500
12-82 4-8
38-8
312
-83 4-84
8-8412
-84 4-85
8-8512
-85 4-86
8-8612
-86 4-87
8-8712
-87 4-88
8-8812
-88 4-89
8-8912
-89 4-90
8-9012
-90 4-91
8-9112
-91 4-92
8-92
Monthly LMSL
Loca
l Mea
n Se
a Le
vel a
bove
Sta
tion
Dat
um (m
)
8761927 8761724 7437 / 7766 8735180 8729840 8771450

Volume II Geodetic Vertical and Water Level Datums II-67 This report is the independent opinion of the IPET and is not necessarily the official position of the U.S. Army Corps of Engineers.
Data series from the stations in Figure 29 were reduced to the time period that New Canal Station was operating. The above figure compares the sea level trends for the original stations for the period of 1982 – 1992. The results show that with the exception of Galveston all sea level trends based on the shorter time series during that particular decade are underestimates of the longer term rates. This suggests that the trend obtained for New Canal Station for the period of 1982-1992 is probably an underestimate of the actual sea level trend at that location; the con-clusion is supported by Zervas (2001) for series of less than 50 years. The estimated trend at New Canal can be extrapolated to a 20-year period assuming that the ratio of the 10-year trend to the 20-year trend at Waveland is the same at New Canal. This ratio at Waveland is 3.52 mm/yr (20 yr)/ 2.05 mm/yr (10 yr) = 1.72. Applying this ratio to the 3.98 mm/yr trend over 10 years at New Canal results in an extrapolated trend of 6.83 mm/yr for a 20-year period.
Sea Level Rates at USACE Stations
Daily values from 1944 to 2003 from New Orleans District water level station 76120 at Florida Avenue were examined by comparison with NOS stations at Pensacola, Dauphin Island, and Grand Isle.
Daily values are once per day water level readings taken at the same time each day in con-trast to the continuous hourly readings taken by the NOAA tide gauges. However, over a long enough time period, the daily readings should provide an unbiased estimate than can be used to estimate a MSL trend. Possible datum shifts were identified from the raw USACE data as shown in Figures 30–31. Datum shifts were analyzed further by subtracting the USACE data from the simultaneous NOAA data, which effectively removed any annual trends or other regional vari-ations that could mask datum shifts. Three separate time series in the USACE Florida Avenue data were identified that showed significant datum shifts near 1978 and 1982.
The documentation of the operation of these gauges and the exact information on the datum shifts do not exist. Without knowing the exact datum adjustment applied by New Orleans District water resource personnel in order to correct the data to a common datum, statistical software was used to calculate an overall trend based on the segments.
The overall sea level trend calculated from the three segments identified in the analysis is approximately 7.90 mm/yr as shown in Figure 32. This value, based on 60 years of data, should fall into the 95% confidence interval identified by Zervas (2001) at +/- 1 mm/yr. This trend is more in line with the benchmark subsidence rates from NOAA Technical Report 50 (NGS 2004) and is consistent with the trends of the shorter time periods, including New Canal, which under-estimated the long term trends. In contrast to the NOAA stations, the details of gauge changes, calibrations, and station maintenance are not known at the Florida Avenue station—this will add an undetermined amount of uncertainty to the estimated trend.

II-68 Volume II Geodetic Vertical and Water Level Datums This report is the independent opinion of the IPET and is not necessarily the official position of the U.S. Army Corps of Engineers.
Figure 30. Possible datum shifts identified from raw USACE data through comparison with NOS data series at Pensacola, Dauphin Island, and Grand Isle.
Figure 31. Three separate time series derived from simultaneous comparison of USACE Florida Avenue data with NOS data identifying significant datum shifts near 1978 and 1982.
Figure 32. Sea level trend calculated from combination of the three segments identified in the previous analysis is approximately 7.90 mm/yr.
20032002
20012000
19991998
19971996
19951994
19931992
19911990
19891988
19871986
19851984
19831982
19811980
19791978
19771976
19751974
19731972
19711970
19691968
19671966
19651964
19631962
19611960
19591958
19571956
19551954
19531952
19511950
19491948
19471946
19451944
1.5
1.0
.5
0.0
-.5
-1.0
Florida Ave
Pensacola
Dauphin Is.
Grand Isle
20032002
20012000
19991998
19971996
19951994
19931992
19911990
19891988
19871986
19851984
19831982
19811980
19791978
19771976
19751974
19731972
19711970
19691968
19671966
19651964
19631962
19611960
19591958
19571956
19551954
19531952
19511950
19491948
19471946
19451944
.6
.4
.2
-.0
-.2
-.4
-.6
FLA_PEN
FLA_DAU
FLA_GRA

Volume II Geodetic Vertical and Water Level Datums II-69 This report is the independent opinion of the IPET and is not necessarily the official position of the U.S. Army Corps of Engineers.
Table 12 summarizes the MSL trends from gulf stations for the time periods of 1982 – Present, 1982 – 1992, and for long-term series examined by Zervas (2001) near the IPET study area. Calculated values for the 1982 – Present time period range from +2.34 mm/yr for Pensacola, FL, to + 5.84 mm/yr at Grand Isle, LA. These values are in contrast to the shorter term series rates, which range from –1.48 mm/yr at Pensacola to 5.40 mm/yr at Grand Isle.
Table 12 Summary of Rise in Sea Level for Selected Gulf Stations
Only Galveston showed an increase in sea level rise at 8.49 mm/yr. These data are compared to sea level trends calculated by Zervas (2001) for the entire length of the data series, which due to length should be considered the values with the least uncertainty. Data collected from 1944-2003 at USACE Florida Avenue water level station are included for comparison.
Conclusions on Sea Level and Subsidence Trends
Long-term tide station records provide estimates of local relative sea level trends as opposed to the absolute rates of global sea level that are the subject of basic research in climate change and recent media attention. These local relative sea level trends from tide stations are a combi-nation of whatever global sea level variations are taking place, whatever regional climate scale water level variations are taking place, and whatever local vertical land movement due to local or regional subsidence (or land emergence) is taking place. Thus, the tide stations provide the infor-mation desired by studies such as the IPET study because they provide direct information on variations of water levels relative to the local land elevations.
NOAA has performed analyses of relative sea level trends for all of the long-term NWLON stations. Unfortunately, the New Orleans area and Lake Pontchartrain are geographical areas of data gaps for locations with measurements of sea level variations necessary to estimate sea level trends with high certainty. The closest NWLON stations in this category are Dauphin Island, AL; Pensacola, FL; and Grand Isle, LA. The analyses done for estimating relative sea level trends in the New Orleans area include using a 23-year monthly mean time series pieced together for Waveland, MS (3.52 mm/yr with a +/- 2.6 mm/yr 95% confidence interval) and a 10-year monthly mean time series a New Canal, LA (3.98 mm/yr with an 95% confidence interval > +/-3.0 mm/yr). Historical once per day readings from long term USACE stations have also been analyzed; however, there have been many adjustments to the gauges that were not readily available for this review.

II-70 Volume II Geodetic Vertical and Water Level Datums This report is the independent opinion of the IPET and is not necessarily the official position of the U.S. Army Corps of Engineers.
a. Analysis of the USACE record at Florida Avenue, New Orleans, LA, provides a composite estimate of 7.90 mm/yr with a 95% confidence interval of ±1.5 mm/yr.
b. Using an assumption of similar ratio relationships of shorter period trends to longer period trends, the relative sea level trend at New Canal was estimated to be 6.83 mm/yr for a 23-year period (comparing with Waveland trends).
c. By performing a difference of the simultaneous monthly LMSLs between New Canal and Waveland, a trend fit to the differences shows that relative LMSL is rising 1.9 mm/yr faster at New Canal than at Waveland. Adding the 1.9 mm/yr rate to the 3.98 mm/yr estimate for 10 months gives an estimate of 5.88 mm/yr.
Although limited by the 10-year period length and with a spread of 2 mm/yr, these three independent estimates of the relative sea level trend at New Canal are consistent with inde-pendent estimates of local subsidence in the region based on NOAA Report 50 (NGS 2004), which relied on repeat geodetic surveys all within the expected uncertainty.
The results of the analyses used to estimate relative sea level trends for the IPET study area provide corroboration of the drawbacks of estimating sea level trends from only a few decades of measurement and the need to look at simultaneous time periods when comparing trends across a region.

Volume II Geodetic Vertical and Water Level Datums II-71 This report is the independent opinion of the IPET and is not necessarily the official position of the U.S. Army Corps of Engineers.
Data Analysis and Impacts: Evaluation of Designed and Constructed Elevations on Flood Control and Hurricane Protection Structures Purpose
The following sections review the various datums and elevations used in the design and con-struction of selected flood control and hurricane protection structures in the New Orleans region. An estimate is made of the originally constructed flood protection elevations relative to the local water surface and geodetic vertical datums then used as construction references. Pre-Katrina flood protection elevations are estimated relative to the current local mean water surface and the latest geodetic reference scheme, based on topographic and geodetic surveys performed after the hurricane. Emphasis is placed on assessing elevations relative to the local mean water surface since hydraulic analyses and flood protection elevations must be computed relative to this sur-face. The focus is primarily on floodwall projects in Orleans Parish where surge elevations were near the design elevation of the structures. (Note: all USACE publications referenced herein refer to the current edition unless otherwise indicated).
Methodology
Original constructed elevations were estimated based on a review of design memorandums and contract documents associated with a project. Archive geodetic control data were obtained from NOAA NGS. Water level information was obtained from the NOAA CO-OPS, as is described in preceding sections. An evaluation of pre-Katrina (August 2005) elevations was based on post-Katrina geodetic and topographic surveys performed by New Orleans District, Task Force Guardian (TFG), and IPET survey crews.
Geodetic Vertical Datum and Tidal Epoch Elevations
As outlined in the initial sections to this Volume, elevations throughout the IPET study area are now being referenced to a consistent, time-stamped, geodetic datum—NAVD88 (2004.65). In order to relate this geodetic reference datum to the local water surface which is used to develop flood inundation levels from hydrodynamic models, long-term observations from water level gauge data need to be analyzed. The requirement to reference geodetic elevations to a water surface elevation is clearly outlined in Section II-5-4 (Water Surface Elevation Datums) of the Coastal Engineering Manual (EM 1110-2-1100):
Water level and its change with respect to time have to be measured relative to some specified elevation or datum in order to have a physical significance. In the fields of coastal engineering and oceanography this datum represents a critical design parameter because reported water levels provide an indication of minimum navigational depths or maximum surface elevations at which protective levees or berms are overtopped. It is therefore necessary that coastal datums represent some reference point which is universally understood and meaningful, both onshore and offshore. Ideally, two criteria should be expected of a datum: 1) that it provides local depth of water information, and 2) that it is fixed regardless of location such that elevations at different locations can be compared. These two criteria are not necessarily compatible.
The two criteria expected of a datum are important concepts—especially the statement that they are “not necessarily compatible.” This is exactly the case in the New Orleans area. The local

II-72 Volume II Geodetic Vertical and Water Level Datums This report is the independent opinion of the IPET and is not necessarily the official position of the U.S. Army Corps of Engineers.
water surface (e.g., LMSL) cannot be simply correlated at different locations with a geodetic vertical datum, such as NAVD88 (2004.65). Although geodetic vertical datums are useful for providing consistent surveying, modeling, and subsidence analysis over a region, they do not provide a direct relationship to regional water surface elevations that are the basis for flood protection elevations. Where this water surface is not constant (e.g., in tidal areas or rivers), a dense gauge network is needed to model this water surface relative to the geodetic vertical datum.
USACE EM 1110-2-1003 (Hydrographic Surveying) notes the importance of obtaining updated water level reference datums and tidal epochs for dredging navigation projects:
All USACE project reference datums, including those currently believed to be on MLLW, must be checked to ensure that they are properly referred to the latest tidal epoch, and that variations in secular sea level, local reference gage or benchmark subsidence/uplift, and other long-term physical phenomena are properly accounted for. In addition, projects should be reviewed to ensure that tidal phase and range characteristics are properly modeled and corrected during dredging, surveying, and other marine construction activity, and that specified project clearances above grade properly compensate for any tidal range variances. Depending on the age and technical adequacy of the existing MLLW reference (relative to NOS MLLW), significant differ-ences could be encountered. Such differences may dictate changes in channels currently main-tained. Future NOS tidal epoch revisions will also change the project reference planes. In many projects, existing NOS tidal records can be used ... tidal observations and/or comparisons will be necessary for projects in areas not monitored by NOS or in cases where no recent or reliable observations are available.
Other Corps guidance documents emphasize the need to obtain accurate water surface profiles for use in design and construction. These include EM 1110-2-1416 (River Hydraulics), EM 1110-2-1607 (Tidal Hydraulics), EM 1110-2-1913 (Design & Construction of Levees), and EM 1110-2-1614 (Design of Coastal Revetments, Seawalls, and Bulkheads). The Hydraulic Engineering Center (HEC) Research Document No. 26 “Accuracy of Computed Water Surface Profiles” (1986) states in its Introduction that:
“Water surface profiles are computed for a variety of technical uses ... flood insurance studies, flood hazard mitigation investigations, drainage crossing analysis, and other similar design needs. The accuracy of the resulting computed profiles has profound implications. In the case of flood insurance studies, the computed profile is the determining factor in the acceptability of parcels of land for development. For flood control projects, the water surface elevation is important in plan-ning and design of project features and in determining the economic feasibility of proposed solu-tions ... the relationship between mapping accuracy and resultant computed profile accuracy is therefore of major interest to engineers responsible for providing cost-effective technical analysis.”
FEMA guidance appears to differ from the above assessment. FEMA’s “Flood Insurance Study Guidelines and Specifications for Study Contractors” (FEMA 1995) counters the use of hydraulic-based datums for Flood Insurance Studies (FIS).
Local Mean Sea Level: The use of this designation in FISs has decreased since the introduction of NGVD29 and will continue to do so as NAVD88 becomes the datum of reference for all Federal mapping efforts. Local mean sea level has the inherent drawback of varying from location to loca-tion in the areas of concern to the NFIP. Its use will continue as a local datum, but will no longer be referenced as a datum for use in FIS efforts. The initial use of local mean sea level as a datum reference was based on the readily observed tidal cycles of mean hourly water elevations observed over a 19-year period (the National Tidal Datum Epoch). The arithmetic mean of these

Volume II Geodetic Vertical and Water Level Datums II-73 This report is the independent opinion of the IPET and is not necessarily the official position of the U.S. Army Corps of Engineers.
observations provided the level used as local mean sea level. However, there are many variables that affect the determination of local mean sea level, and it has been demonstrated since the adoption of NGVD 29 that differences between local mean sea level and NGVD 29 vary from location to location and from time to time. To assist in evaluating these local differences, geo-desists have been searching for a datum definition that would more closely represent the true shape of the geoid.
Guidance in Appendix D (Guidance for Coastal Flooding Analyses and Mapping) of FEMA 2003 (Guidelines and Specifications for Flood Hazard Mapping Partners) variously refer still-water elevations to either MSL or NGVD29. Appendix H (Guidance for Mapping of Areas Protected by Levee Systems) refers to “water surface elevations.” The distinction between geo-detic and hydraulic datums, particularly in coastal areas, is not altogether clear in this updated FEMA manual.
Given the relatively large spatial and temporal variances between geodetic and sea level datums in the New Orleans region, coupled with the small terrain gradients in the protected areas below sea level, it is obvious that the geodetic-hydraulic datum relationship is critical to hydro-dynamic modeling and flood/hurricane protection structure design.
In analyzing pre- and post-Katrina levee/floodwall elevations, geodetic elevations on either NGVD29 or NAVD88 (2004.65) are adjusted to the local water level datum (e.g., sea level) published by NOAA. The latest NTDE available is the 19-year period 1983-2001, which was released by NOAA in 2003. Nearly all of the floodwalls in the study area were designed and constructed during the previous tidal epoch (1960-1978); however, there is no indication in design memorandums or contract documents of this, or previous, tidal epoch. The difference between the 1960-1978 and 1983-2001 epochs at the New Canal gauge in Lake Pontchartrain is 0.15 ft—primarily due to a sea level rise adjustment. In general, the MSL epoch change in the region averages about 0.2 ft.
In a high subsidence area such as New Orleans, the “apparent sea level” increase is signifi-cant—upwards of 3 ft per century. This means that an average MSL computed over a 19-year period may not represent the latest sea level condition, and related flood protection levels. As explained in a previous section, in high-subsidence areas NOAA has adopted alternate pro-cedures for computing accepted tidal datums using the last several years of sea level data rather than the 19-year tidal epoch—typically the latest 5-year epoch.
References to MSL or LMSL in the following sections generally relate to the 1983-2001 tidal epoch established by NOAA. Given the historic subsidence occurring in this area, as outlined in previous sections, elevations referenced to a later tidal epoch (e.g., 2001-2005) will be 0.1 to 0.3 ft lower than the 1983-2001 epoch elevation.
Typical Geodetic and Water Level Datums Used in New Orleans Area Floodwall Construction
Figure 33 illustrates the various geodetic vertical and water level datums and adjustments existent over the years on a 1931 benchmark near the 17th Street Canal on Lake Pontchartrain. This graphic is typical of benchmarks throughout this high subsidence region. It shows that ele-vation differences relative to MSL/LMSL are dependent on which NGVD29/NAVD88 datum or adjustment is selected. This is especially critical in a high subsidence area where using an

II-74 Volume II Geodetic Vertical and Water Level Datums This report is the independent opinion of the IPET and is not necessarily the official position of the U.S. Army Corps of Engineers.
outdated or superseded datum to construct a flood protection structure can result in a lower ele-vation than that intended in the design. Likewise, hydrologic or hydraulic models using terrain data based on disparate datums can have adverse computational impacts.
Lake Pontchartrain water level data is based on direct vertical control connections between Benchmark ALCO and the NOAA New Canal gauge. This benchmark is located near the gauge site. Published water level data (and reference datums) for this gauge are based on data obtained between October 1983 and September 1992, and adjusted by NOAA for subsequent epoch changes. As part of this IPET project, NOAA in November 2005 reinstalled a gauge at this site and data collected from that time have been used to evaluate later epoch references. As described in previous sections in this Volume, similar evaluations were made at other NOAA gauge sites in the region—both at historic sites and at newly established sites. In addition, a number of Corps gauges are situated throughout the region. These gauges, although not part of the NWLON net-work, were used by NOAA to evaluate later tidal epochs, elevations, and subsidence rates.
Figure 33 also clearly indicates the complex relationships between geodetic and hydraulic datums in this region, notwithstanding the various geodetic readjustments. Not shown are MSL/LMSL relationships before the 1980s since there was no NOAA gauge at this New Canal site prior to that time. (Note that Benchmark ALCO was not directly referenced in contract plans for any floodwall construction on the 17th Street Outfall Canal).
These periodic leveling and readjustments to the geodetic vertical datums were later deemed by NOAA to have been unreliable for assessing elevations, as stated in NOAA’s Technical Report 50 (NGS 2004):
The old leveling data is useless for determining current elevations. The historical data, even that of only ten years ago, describes a topography and spatial relationship between benchmarks that no longer exists. Since benchmarks, even spatially adjacent benchmarks, move at different rates, their relative elevation differences have changed over time. A readjustment of old leveling data seems pointless.

Volume II Geodetic Vertical and Water Level Datums II-75 This report is the independent opinion of the IPET and is not necessarily the official position of the U.S. Army Corps of Engineers.
Figure 33. Datum relationships at Benchmark ALCO and NOAA New Canal Gauge (1951 to 2006) (Source: NOAA).
The above realization precipitated the implementation of a time-dependent geodetic reference system—NAVD88 (2004.65)—to better and more reliably monitor subsidence in the region. Prior to Hurricane Katrina, the New Orleans District was closely involved with NOAA in this effort.
Figure 33 does not show the original presumed convergence (or equivalency) of MSL and NGVD29, perhaps prior to 1930, if ever. Although NAVD29 (and previous adjustments) was originally based (or adjusted) to a sea level datum, it is not absolutely certain that NGVD29 and MSL converged at Lake Pontchartrain in the 1930s. (See previous sections discussing the origi-nal adjustment of NGVD29 and sea level datum connections from Biloxi, MS).
The LMSL elevation based on the NTDE 1983-2001 was determined from NOAA estimates for LMSL at the NOAA New Canal Gauge (17th Street Canal) based on observations over the period 1983 to 1992, and supplemented by IPET GPS and vertical control surveys post-Katrina. The LMSL elevation averaged for the more recent NTDE 2001-2005 epoch is an indicator of the apparent sea level rise occurring between the two epoch periods.
Various Reference Datums at BM ALCO 1931 (17th Street Canal)NOAA CO-OPS Gage 8761927 – New Canal
1951-2006
5.5
6.0
6.5
7.0
7.5
6.76 ft NGVD29 (05/21/91) NGS PID BJ1342 (L25283/3)
6.955 ft NGVD29 (MVN 1985) NGS 30 Jan 86 Adjustment L24903
7.375 ft NGVD29 (MVN 1964) NGS 9 Apr 1965 Adjustment L-19622/5
7.621 ft NGVD29 (MVN 1951 ) NGS Adjustment of 1951 (19 Mar 52) L-13860 (readjusted level run ca 1969?)
6.83 ft NGVD29 (VERTCON 1994 NAVD88-NGVD delta = 0.26 ft)
6.14 ft NAVD88 (2004.65) NGS PID BJ13426.14 ft MLLW (1983-1992) CO-OPS 8761927
5.88 ft LMSL (1983-1992) CO-OPS 8761927 epoch 83-015.87 ft LMSL (2005) CO-OPS 12/05 (Preliminary) IPET
6.59 ft NAVD88 (12/05/96) NGS PID BJ1342
Elevation in feet below BM ALCO 1931
6.869 ft NGVD29 NGS 1 Sep 1982 Adjustment L-13860&19622/5
6.04 ft LMSL (1983-1990) CO-OPS 8761927 epoch 60-78
6.31 ft MLLW (1983-1990) CO-OPS 8761927 epoch 60-78
8.235 ft NGVD29 (19 Mar 1952 ) NGS
17th Street Outfall CanalEast & West Bank Floodwall Construction
ca 1991-1994 Floodwall Protection/Capping Projects (High Level Plan)
7.84 ft NGVD29 (?) computed construction reference ca 1993 PBM 14 8.0
Updated 19 Apr 06 Bergen
6.57 ft NAVD88 (02/14/94) NGS PID BJ1342
5.64 ft LMSL (2001-2005) CO-OPS 04/06 IPET
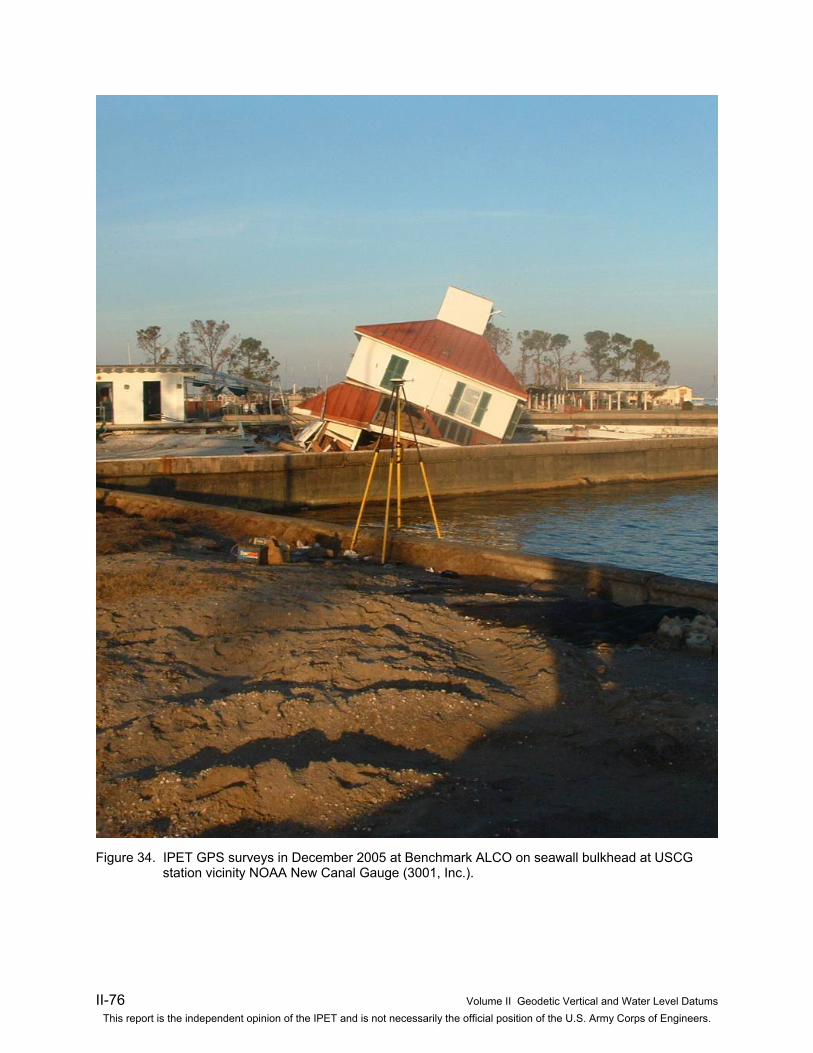
II-76 Volume II Geodetic Vertical and Water Level Datums This report is the independent opinion of the IPET and is not necessarily the official position of the U.S. Army Corps of Engineers.
Figure 34. IPET GPS surveys in December 2005 at Benchmark ALCO on seawall bulkhead at USCG station vicinity NOAA New Canal Gauge (3001, Inc.).

Volume II Geodetic Vertical and Water Level Datums II-77 This report is the independent opinion of the IPET and is not necessarily the official position of the U.S. Army Corps of Engineers.
Subsidence and Settlement Considerations in Protective Structure Elevations
In reviewing the design memorandums (DMs) and related documents, it was not clear how projected subsidence rates were applied in structural elevation design, if at all. Subsidence was apparently not factored into the design freeboard allowance. Most subsidence estimates in the DMs were small—e.g., less that 1 ft/century. This would seemingly be almost negligible. It is possible that subsidence was included in the settlement allowances—typically 0.5 ft was applied—or possibly in overbuild allowances. For information, the following CFR excerpts pertaining to FEMA certification do not specify or include subsidence allowances within coastal levee freeboard.
Code of Federal Regulations, Title 44, Volume: 44CFR65.10
FEMA Levee Elevation and Certification Requirements
(iii) For coastal levees, the freeboard must be established at one foot above the height of the one percent wave or the maximum wave runup (whichever is greater) associated with the 100-year stillwater surge elevation at the site.
(iv) Occasionally, exceptions to the minimum coastal levee freeboard requirement described in paragraph (b)(1)(iii) of this section, may be approved. Appropriate engi-neering analyses demonstrating adequate protection with a lesser freeboard must be submitted to support a request for such an exception. The material presented must evaluate the uncertainty in the estimated base flood loading conditions. Particular emphasis must be placed on the effects of wave attack and overtopping on the stability of the levee. Under no circumstances, however, will a freeboard of less than two feet above the 100-year stillwater surge elevation be accepted.
(5) Settlement. Engineering analyses must be submitted that assess the poten-tial and magnitude of future losses of freeboard as a result of levee settlement and dem-onstrate that freeboard will be maintained within the minimum standards set forth in paragraph (b)(1) of this section. This analysis must address embankment loads, com-pressibility of embankment soils, compressibility of foundation soils, age of the levee system, and construction compaction methods. In addition, detailed settlement analysis using procedures such as those described in the COE manual, ``Soil Mechanics Design--Settlement Analysis’’ (EM 1100-2-1904) must be submitted.
(d) Maintenance plans and criteria. For levee systems to be recognized as pro-viding protection from the base flood, the maintenance criteria must be as described herein. Levee systems must be maintained in accordance with an officially adopted maintenance plan, and a copy of this plan must be provided to FEMA by the owner of the levee system when recognition is being sought or when the plan for a previously recog-nized system is revised in any manner. All maintenance activities must be under the jurisdiction of a Federal or State agency, an agency created by Federal or State law, or an agency of a community participating in the NFIP that must assume ultimate respon-sibility for maintenance. This plan must document the formal procedure that ensures that the stability, height, and overall integrity of the levee and its associated structures and systems are maintained. At a minimum, maintenance plans shall specify the maintenance activities to be performed, the frequency of their performance, and the person by name or title responsible for their performance.

II-78 Volume II Geodetic Vertical and Water Level Datums This report is the independent opinion of the IPET and is not necessarily the official position of the U.S. Army Corps of Engineers.
(e) Certification requirements. Data submitted to support that a given levee system complies with the structural requirements set forth in paragraphs (b)(1) through (7) of this section must be certified by a registered professional engineer. Also, certified as-built plans of the levee must be submitted. Certifications are subject to the definition given at Sec. 65.2 of this subchapter. In lieu of these structural requirements, a Federal agency with responsibility for levee design may certify that the levee has been ade-quately designed and constructed to provide protection against the base flood.
The above reference points out that subsidence is generally not considered in the design. Additional discussion on subsidence is covered later in this Volume.

Volume II Geodetic Vertical and Water Level Datums II-79 This report is the independent opinion of the IPET and is not necessarily the official position of the U.S. Army Corps of Engineers.
Data Analysis and Impacts: Orleans Avenue Outfall Canal Construction Reference Datums Summary of Findings
This Section covers the evaluation of the constructed and current elevations on flood protec-tion structures along the Orleans Outfall Canal. The floodwalls on the east and west banks were found to be constructed approximately 1 ft below their intended design elevations. This was caused by using a geodetic elevation reference instead of a hydraulic (sea level) reference datum. Pre-Katrina and current flood protection elevations in the canal floodwalls are approximately 1.5 ft below design when related to the latest tidal epoch.
Reference Documents
The following construction drawings and Design Memorandums were reviewed as part of this assessment:
• DACW29-93-C-0077: Orleans Avenue Canal—Flood Protection Improvement Project—Phase II-D (West Side: B/L Sta. 2+39.00 to Sta. 29+07.50)
• DACW29-97-C-0029: Orleans Avenue Outfall Canal—Parallel Protection-Phase II-A—East Side Floodwall (B/L Sta. 3+60.00 to Sta. 90+26.33)
• DACW29-95-B-0035: Orleans Avenue Outfall Canal—Parallel Protection-Phase II-C—West Side Floodwall (B/L Sta. 21+34.52 to Sta. 63+66.22)
• DACW29-99-C-0025: Filmore and Harrison Avenue Bridges—Phase I-C
• DACW29-00-B-0094: Robert E. Lee Boulevard Bridge—Phase I-B
• GDM No. 19—Orleans Avenue Outfall Canal (Volumes I, II, & III)—1988
• DM 01 Part III Hydrology and Hydraulic Analysis—Lake Pontchartrain and Vicinity-Lakeshore (Sept. 1968)

II-80 Volume II Geodetic Vertical and Water Level Datums This report is the independent opinion of the IPET and is not necessarily the official position of the U.S. Army Corps of Engineers.
Figure 35. Typical I-wall section at elevation 14.90 ft (DACW29-93-C-0077).
Design Elevation Parameters
Parallel protection elevations are shown in GDM No. 19 and on various contract plans. GDM No. 19 (Volume I) notes a Standard Project Hurricane (SPH) design still-water surface elevation of Lake Pontchartrain at 11.5 ft NGVD (i.e., NGVD29). This base elevation was used in subse-quent HEC-2 models to compute required floodwall elevation on each side of the canal and at the bridges. The design still-water elevation in the canal at the Filmore Avenue Bridge is 12.10 ft NGVD, and 12.30 ft NGVD at the Harrison Avenue Bridge (DACW29-99-C-0025). The design canal still-water elevation at the Robert E. Lee Boulevard Bridge was 11.90 ft NGVD (DACW29-00-B-0094). In these hydraulic analysis models, the still-water elevation relative to NGVD (i.e., NGVD29) was generally assumed to be MSL. A standard freeboard (2 ft typical) and settlement (0.5 ft typical) was added to these still-water heights to arrive at a design protec-tion elevation referenced to NGVD. Typical design flood protection elevations in the canal thus ranged from 14.0 to 14.9 ft—see Figure 35. (DM 01 Part II noted a USACE recommendation for

Volume II Geodetic Vertical and Water Level Datums II-81 This report is the independent opinion of the IPET and is not necessarily the official position of the U.S. Army Corps of Engineers.
Figure 36. “Normal Water Surface” notation on floodside of Orleans Outfall Canal (typical) DACW29-95-B-0035.
a 3-ft freeboard allowance versus 2 ft previously authorized—this recommendation was rejected).
Various contract plans indicate a “normal water surface” or “normal water level” elevation of 1.0 ft NGVD in the canal. The source of this apparent superelevation is not noted, nor is there any indication that this value was incorporated into the hydraulic analyses used in determining floodwall heights. (This is based on discussions with New Orleans District personnel who ran these original hydraulic models). The 1.0 ft canal superelevation is believed to have been taken from pump station hydrograph records, or perhaps from gauge records on Lake Pontchartrain (Orleans Marina) or on the IHNC (Seabrook Bridge). Although a “NGVD” datum is noted, the year or adjustment epoch is not shown. The superelevation does roughly correlate with the approximate 0.9 ft amount that the MSL elevation is above NGVD29 at Benchmark ALCO. A typical section showing the normal canal water elevation is shown in Figure 36, taken from DACW29-95-B-0035.
Reference Benchmark for Orleans Canal Floodwall Construction
Contract drawings indicate that Benchmark CHRYSLER RM was used as the vertical reference for design and construction associated with floodwalls constructed on the Orleans Avenue Outfall Canal. This mark was used for all the projects referenced above. This bench-mark, originally set in 1931 by the USC&GS (now the National Geodetic Survey), is located in a concrete retaining wall at the intersection of Lakeshore Drive and the Orleans Outfall Canal.

II-82 Volume II Geodetic Vertical and Water Level Datums This report is the independent opinion of the IPET and is not necessarily the official position of the U.S. Army Corps of Engineers.
No other benchmarks are noted in the reviewed construction plans. It is presumed all construction stake out during the period 1993 to 2000 was performed relative to this single benchmark.
Reference Datum of Benchmark CHRYSLER RM. The Phase II-D Plans (DACW29-93-C-0077) note that PROJECT BM CHRYSLER RM is at elevation 7.11 ft “M.S.L.” (Mean Sea Level) and on a “1983 Datum.” The General Notes on the Phase II-D Plans indicate that “all elevations are expressed in feet and refer to National Geodetic Vertical Datum (N.G.V.D.).” No reference is made to an epoch or adjustment date for the datum.
The Phase II-A Plans (DACW29-97-C-0029) and Phase I-C Plans (DACW29-99-C-0025) note in the “Tabulation of Bench Marks” that CHRYSLER RM is at elevation “7.11 [ft] N.G.V.D. (1983 Epoch).” No reference to “NGVD29” or a subsequent adjustment is made.
The Phase I-B Plans (DACW29-00-B-0094) note CHRYSLER RM as “7.11 ft N.G.V.D.” on the “1984 Epoch.”
Thus, all construction documents are consistent in specifying a constant reference elevation and benchmark, even though various datums and epochs are indicated.
Historical Adjustments to CHRYSLER RM (1951 to date). Table 13 below illustrates the various elevations associated with Benchmark CHRYSLER RM. Most of the changes are due to readjustments of level lines by the NOAA.
Table 13 Successive Elevations on Benchmark CHRYSLER RM from 1951 to 2006 Elev, ft Datum Adjustment Agency Reference
8.533 NGVD29 1951 (19 Mar 52 adj) USC&GS
7.923 NGVD29 1951 (1957 adj) USC&GS L-13860 7.694 NGVD29 9 Apr 65 USC&GS L-19622 7.108 NGVD29 1 Sep 82 NGS L-19622/13860 7.231 NGVD29 30 Jan 86 NGS L-24903 7.03 NGVD29 21 May 91 NGS L-25283 6.83 NAVD88 14 Feb 94 NGS BJ1349 6.85 NAVD88 Dec 96 NGS BJ1349 6.42 NAVD88 (2004.65) 10 Feb 06 NGS (unpublished/L-25517) 6.38 NAVD88 (2004.65) 11 Feb 06 USACE IPET Survey Team
6.30 LMSL (1960-1978) ca 1985 NOAA CO-OPS NOAA 6.15 LMSL (1983-2001) Dec 2005 NOAA CO-OPS IPET Study 5.94 LMSL (2001-2005) Apr 2006 NOAA CO-OPS IPET Study
The “7.108” ft elevation from the 01 September 1982 adjustment of CHRYSLER RM appears to be the source for the “7.11” ft elevation shown on the contract plans. Although more recent adjustments were available (1986 and 1991), the variance between these adjustments (± 0.1 ft) is not significant. It appears the “1983 Epoch” referenced in various contract documents
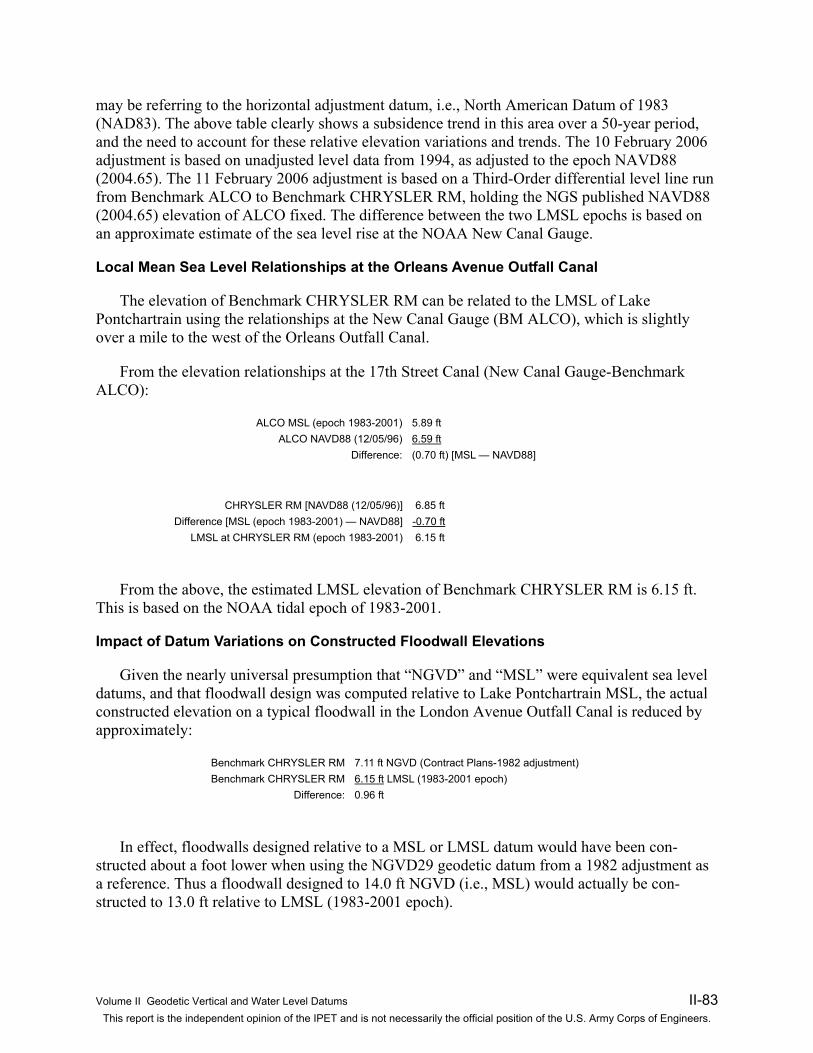
Volume II Geodetic Vertical and Water Level Datums II-83 This report is the independent opinion of the IPET and is not necessarily the official position of the U.S. Army Corps of Engineers.
may be referring to the horizontal adjustment datum, i.e., North American Datum of 1983 (NAD83). The above table clearly shows a subsidence trend in this area over a 50-year period, and the need to account for these relative elevation variations and trends. The 10 February 2006 adjustment is based on unadjusted level data from 1994, as adjusted to the epoch NAVD88 (2004.65). The 11 February 2006 adjustment is based on a Third-Order differential level line run from Benchmark ALCO to Benchmark CHRYSLER RM, holding the NGS published NAVD88 (2004.65) elevation of ALCO fixed. The difference between the two LMSL epochs is based on an approximate estimate of the sea level rise at the NOAA New Canal Gauge.
Local Mean Sea Level Relationships at the Orleans Avenue Outfall Canal
The elevation of Benchmark CHRYSLER RM can be related to the LMSL of Lake Pontchartrain using the relationships at the New Canal Gauge (BM ALCO), which is slightly over a mile to the west of the Orleans Outfall Canal.
From the elevation relationships at the 17th Street Canal (New Canal Gauge-Benchmark ALCO):
ALCO MSL (epoch 1983-2001) 5.89 ft ALCO NAVD88 (12/05/96) 6.59 ft
Difference: (0.70 ft) [MSL — NAVD88]
CHRYSLER RM [NAVD88 (12/05/96)] 6.85 ft Difference [MSL (epoch 1983-2001) — NAVD88] -0.70 ft
LMSL at CHRYSLER RM (epoch 1983-2001) 6.15 ft
From the above, the estimated LMSL elevation of Benchmark CHRYSLER RM is 6.15 ft. This is based on the NOAA tidal epoch of 1983-2001.
Impact of Datum Variations on Constructed Floodwall Elevations
Given the nearly universal presumption that “NGVD” and “MSL” were equivalent sea level datums, and that floodwall design was computed relative to Lake Pontchartrain MSL, the actual constructed elevation on a typical floodwall in the London Avenue Outfall Canal is reduced by approximately:
Benchmark CHRYSLER RM 7.11 ft NGVD (Contract Plans-1982 adjustment) Benchmark CHRYSLER RM 6.15 ft LMSL (1983-2001 epoch)
Difference: 0.96 ft
In effect, floodwalls designed relative to a MSL or LMSL datum would have been con-structed about a foot lower when using the NGVD29 geodetic datum from a 1982 adjustment as a reference. Thus a floodwall designed to 14.0 ft NGVD (i.e., MSL) would actually be con-structed to 13.0 ft relative to LMSL (1983-2001 epoch).

II-84 Volume II Geodetic Vertical and Water Level Datums This report is the independent opinion of the IPET and is not necessarily the official position of the U.S. Army Corps of Engineers.
Assessment of Pre- and Post-Katrina Flood Protection Elevations (Orleans Avenue Outfall Canal)
To evaluate pre-Katrina flood protection elevations, conventional topographic survey data taken just after the hurricane were obtained—see survey extracts in the spreadsheet in Technical Appendix 36 to this Volume (Outfall Canal Post-Katrina Topographic Surveys). Post-Katrina floodwall cap elevations were observed in unbreached areas using conventional topographic sur-veying techniques—differential leveling and real-time kinematic (RTK) methods. These ele-vations are also likely representative of pre-Katrina conditions in August 2005. These surveys on the NAVD88 (2004.65) geodetic reference system can be adjusted to LMSL using the 1983-2001 tidal datum epoch—e.g., topographic survey elevations observed on the NAVD88 (2004.65) geodetic datum were reduced by 0.25 ft to relate them to the LMSL (1983-2001 epoch) elevation of Lake Pontchartrain. As noted in this report, this 0.25 ft conversion is does not necessarily reflect the current (2001-2005) LMSL epoch estimates by NOAA in Lake Pontchartrain.
Designed and current floodwall elevations for selected sections of the Orleans Avenue Canal are listed in Table 14. The average elevation was computed from representative shot points taken atop the floodwall along each reach. Variances in the floodwall cap elevation were as much as ± 0.5 ft along some reaches—probably due to uneven settlement.
Table 14 Design and Current Floodwall Elevations in Selected Reaches (Orleans Avenue Outfall Canal)
Average Elevation (2005-2006)
Reach No. of Shot Points Design ElevationNGVD (MSL) NAVD88 (2004.65) LMSL (1983-2001)
WEST BANK RE Lee Blvd. to Filmore Ave. 15 N/A 13.2 ft 13.0 ft
WEST BANK Filmore Ave. to Harrison Ave. 20 14.0 ft (T-Wall) 13.4 ft 13.2 ft
WEST BANK Harrison Ave. to PS 7 / I-610 28 N/A 14.0 ft 13.8 ft
EAST BANK RE Lee Blvd. to Filmore Ave. 21 14.4 ft (I-Wall) 13.4 ft 13.2 ft
EAST BANK Filmore Ave. to Harrison Ave. 25 14.8 ft (I-Wall) 13.8 ft 13.6 ft
EAST BANK Harrison Ave. to PS 7 / I-610 19 14.9 ft (I-Wall) 13.9 ft 13.6 ft
Applying the 0.5 ft difference between LMSL (2001-2005) and NAVD88 (2004.65) at the NOAA New Canal Gauge (refer to the previous discussion on 5-year tidal epochs), the following flood protection elevation differences result (Table 15).

Volume II Geodetic Vertical and Water Level Datums II-85 This report is the independent opinion of the IPET and is not necessarily the official position of the U.S. Army Corps of Engineers.
Table 15 Current Flood Protection Elevations on Orleans Avenue Outfall Canal Floodwalls Relative to LMSL Epochs (elevations in feet) LMSL (1983-2001) LMSL (2001-2005)
Section Design Current Difference Current Difference
West Bank
Filmore to Harrison (T) 14.0 13.2 0.8 12.9 1.1
East Bank (I-Wall)
Filmore to Harrison 14.8 13.6 1.2 13.3 1.5
RE Lee to Filmore 14.4 13.2 1.2 12.9 1.5
Harrison to I-610 PS#7 14.9 13.6 1.3 13.4 1.5
Differences between design and current average floodwall cap elevations range between 0.8 and 1.3 ft relative to the 1983-2001 tidal epoch and another quarter-foot larger if the later (2001-2005) tidal epoch is used. Most of this difference is attributable to the initial construction being performed relative to an outdated geodetic datum—i.e., NGVD29 (01 September 1982). Subsequent subsidence and perhaps settlement since ca 1993 has further reduced the protection elevation relative to LMSL, as shown above.
Figure 37 summarizes the loss in protection resulting from using a geodetic elevation instead of a sea level-based elevation to construct the floodwalls.

II-86 Volume II Geodetic Vertical and Water Level Datums This report is the independent opinion of the IPET and is not necessarily the official position of the U.S. Army Corps of Engineers.
Figure 37. Impact of using NGVD elevation instead of LMSL elevation for construction stakeout of Orleans Avenue Outfall Canal floodwall construction (DACW29-93-C-0077). (Elevation differences are rounded to the nearest tenth of a foot.)
1717
(Not to Scale)
DACW29-93-C-0077 typical
Orleans Avenue Outfall CanalOrleans Avenue Outfall CanalDesign v Constructed Floodwall ElevationsDesign v Constructed Floodwall Elevations
NGVD (1983)or MSL
Design Elevation14.0 to 14.9 ft
typical
1.0 foot
LMSL (1983-2001)
6.15 ft 7.11 ft
BenchmarkCHRYSLER RM
1.0 foot
Constructed Elevation

Volume II Geodetic Vertical and Water Level Datums II-87 This report is the independent opinion of the IPET and is not necessarily the official position of the U.S. Army Corps of Engineers.
Data Analysis and Impacts: London Avenue Outfall Canal Construction Reference Datums Summary of Findings
This section covers the evaluation of the constructed and current elevations on flood protec-tion structures along the London Avenue Outfall Canal. The floodwalls on the east and west banks were found to be constructed approximately 1.7 ft below their intended design elevations. This was caused by using a superseded (1965) geodetic elevation reference instead of an up-to-date hydraulic-based (sea level) reference datum. Pre-Katrina and current flood protection eleva-tions in the canal floodwalls are approximately 2 ft below design when related to the latest tidal epoch.
Reference Documents
The following construction drawings and DMs were reviewed as part of this assessment:
• DACW29-94-C-0079 (94-B-0047) As-Built Mark Up—London Avenue Outfall Canal Parallel Protection— Mirabeau Avenue-to Robert E. Lee Boulevard (West Bank)—Mirabeau Avenue to Leon C. Simon Boulevard (East Bank)
• DACW29-02-C-0013 (01-B-0092) London Avenue Outfall Canal Parallel Protection—Floodproofing Mirabeau and Filmore Avenue Bridges
• DACW29-94-C-0003 (93-B-0080) As-Built London Avenue Outfall Canal Parallel Protection—Pump Station 3 to Mirabeau Avenue Floodwall
• DACW29-99-C-0005 (98-B-0060) As-Built London Avenue Outfall Canal Parallel Protection—Floodproofing Gentilly Boulevard Bridge
• DACW29-98-C-0082 (98-B-0065)As-Built London Avenue Outfall Canal Parallel Protection— Floodproofing Leon C. Simon Boulevard Bridge
• GDM 19A (Vol I and II) London Avenue Outfall Canal (1989)
• GDM 20 (Draft) London Avenue Canal Floodwalls and Levees—Orleans Levee District—April 1986; and Revised GDM 20 (May 1990)
• DM01 Part III Hydrology and Hydraulic Analysis—Lake Pontchartrain and Vicinity-Lakeshore (September 1968)
Design Elevation Parameters
Parallel protection elevations in GDM No. 19A, GDM 20, and on various contract plans, state the design SPH still-water surface elevation of Lake Pontchartrain is 11.5 ft NGVD or MSL. This base elevation was used in subsequent HEC-2 models to compute required floodwall elevation on each side of the canal and at the bridges. As in other Lake Pontchartrain projects, the “NGVD” elevation is assumed to be MSL or LMSL—e.g., “Lake Pontchartrain Normal Water Level = 0.0 ft MSL.” Design Memorandum No. 1, Part III (1968) notes that “average high tide” in Lake Pontchartrain is 0.7 ft. It also states the average tidal range in Lake Pontchartrain is 0.5 ft and Lake Borgne is 1.0 ft. GDM20 references all elevations to “NGVD”

II-88 Volume II Geodetic Vertical and Water Level Datums This report is the independent opinion of the IPET and is not necessarily the official position of the U.S. Army Corps of Engineers.
but does not identify any particular epoch, as shown in Figure 38 depicting hydraulic profiles for various flood frequencies.
Figure 38. Hydraulic profiles referenced to “NGVD” in GDM 20 (Revised May 1990).
The design still-water elevation in the London Avenue Outfall Canal was 11.85 ft “NGVD.” The 14.4 ft NGVD floodwall design (Figure 39) was derived by adding 2.0 ft freeboard and 0.5 ft settlement allowances to the 11.85 ft still-water elevation. Again, the NGVD floodwall elevation was generally assumed to be equivalent to MSL.
The As-Built DACW29-94-C-0079 hydrograph shows the canal water surface 1 to 2 ft above NGVD--this factor was not noted in 1986 GDM hydraulic study (DM01 Part III Hydrology and Hydraulic Analysis—Lake Pontchartrain and Vicinity-Lakeshore (Sept. 1968). A portion from the hydrograph is shown in Figure 40. The referenced gauge is located to the east in the IHNC south of the Seabrook Bridge.

Volume II Geodetic Vertical and Water Level Datums II-89 This report is the independent opinion of the IPET and is not necessarily the official position of the U.S. Army Corps of Engineers.
Figure 39. Typical section of floodwall with 14.4 ft design elevation on London Avenue I-wall.
Figure 40. Typical portion of stage hydrograph on London Avenue Canal depicting 1+ ft superelevation based on the gauge at the Seabrook Bridge in the IHNC (DACW29-94-C-0079 (94-B-0047).

II-90 Volume II Geodetic Vertical and Water Level Datums This report is the independent opinion of the IPET and is not necessarily the official position of the U.S. Army Corps of Engineers.
Reference Benchmark Used in London Outfall Canal Parallel Floodwall Construction
Benchmark P 153 was used as the vertical reference for design and construction associated with most of the floodwalls constructed on both banks of the London Avenue Outfall Canal. This benchmark, originally set in 1951 by the USC&GS, is destroyed. It was located on the Lakeshore Drive Bridge over the London Avenue Canal. The mark was destroyed ca 2002 when a new bridge was constructed. (2005/2006 post-Katrina construction and topographic surveys in the London Avenue Canal have been referenced to Benchmarks GRAHAM and GRAHAM RM, both of which were on the original USC&GS level line with P 153).
Benchmark P 153 was used for most of the floodwall projects listed above. No other bench-marks are noted in the construction plans except on the 1998 Leon C. Simon Boulevard Bridge floodproofing project (DACW29-98-C-0082) where Benchmark AA 190 was listed in addition to P 153. On the 1999 Gentilly Boulevard Bridge floodproofing project (DACW29-99-C-0005), a Benchmark U 153 is referenced in addition to P 153—as shown in Figure 41. Other than on these two projects, it is presumed all other floodwall construction stakeout was performed rela-tive to the single benchmark P 153.
Reference Datum of Benchmark P 153. Contract DACW29-94-C-0079 is typical in refer-encing the elevation of Benchmark P 153 relative to “N.G.V.D. (EPOCH 1964).” The elevation noted for the “1964 Epoch” is 11.270 ft. This elevation is actually based on a 9 April 1965 USC&GS readjustment of the NGVD29 network in this area. Bridge floodproofing projects in the late 1990s show both the 11.270 ft NGVD 1964 Epoch and a 10.39 ft elevation based on the 1991 epoch. Figure 41 shows dual NGVD29 reference datums (epochs) for P 153.
Figure 41. Reference benchmarks (Gentilly Blvd. Bridge floodproofing—DACW29-99-C-0005).
Historical Adjustments to P 153 (1951 to date). Table 16 illustrates the various elevations associated with Benchmark P 153. Most of the changes are due to readjustments of level lines by NOAA.

Volume II Geodetic Vertical and Water Level Datums II-91 This report is the independent opinion of the IPET and is not necessarily the official position of the U.S. Army Corps of Engineers.
Table 16 Successive Elevations on Benchmark P 153 from 1951 to 2006
Elevation, ft Datum Adjustment Agency Reference
12.087 NGVD29 1951 (19 Mar 52 adj) USC&GS
11.476 NGVD29 1951 (1957 adj) USC&GS L-13860 11.270 NGVD29 9 Apr 65 USC&GS L-19622 10.708 NGVD29 1 Sep 82 NGS L-19622/13860 10.623 NGVD29 30 Jan 86 NGS L-24903 10.39 NGVD29 21 May 91 NGS L-25283 10.20 NAVD88 14 Feb 94 NGS BJ1361 10.21 NAVD88 5 Dec 96 NGS BJ1361 9.79 NAVD88 (2004.65) 10 Feb 06 NGS (unpublished/L-25517)
9.54 (comp) LMSL (1983-2001) Dec 2005 NOAA CO-OPS IPET Study 9.31 (comp) LMSL (2001-2005) Apr 2006 NOAA CO-OPS IPET Study
The 10 February 2006 NAVD88 (2004.65) elevation shown for P 153 is not based on recent observations since the mark no longer exists. This is the computed elevation assuming no sub-sidence has occurred since 1994. Likewise, the subsequent LMSL elevations are computed. The 09 April 1965 NGVD29 elevation of 11.27 ft corresponds to that used for most of the London Avenue Canal floodwall construction during the early 1990s. This elevation is listed as “Epoch 1964.”
It is uncertain why the later readjustment elevations (i.e., 1982 and 1986) were not used for contracts issued after 1990. The 0.65 ft elevation change from 1965 to 1986 is significant. One of the As-Builts from a later contract that listed the 1991 elevation of P 153 (10.39 ft) appears to have held the 1965 elevation for construction stakeout in setting the top of the floodwall, in lieu of the 1991 elevation—a 0.9 ft difference. This may be a result of the 1985 New Orleans District policy memorandum on NGS datums—see the section of Corps Policy later in this Volume.
As in the other outfall canal projects in this area of Lake Pontchartrain, Table 16 clearly shows a subsidence trend over a 50-year period, and the need to account for these relative eleva-tion variations.
The LMSL elevation based on the epoch (1983-2001) is determined from NOAA estimates for LMSL at the NOAA New Canal Gauge (17th Street Canal). The LMSL elevation for the more recent 2001-2005 epoch reflects the apparent sea level change occurring between the two epoch periods.
Local Mean Sea Level Relationships at the London Avenue Outfall Canal
The elevation of Benchmark P 153 can be related to the LMSL (1983-2001) of Lake Pontchartrain using the relationships at the New Canal Gauge (BM ALCO), which is about 2 ½ miles to the west of the London Outfall Canal.
Using geodetic-hydraulic datum elevation data, the 17th Street Canal (New Canal Gauge-Benchmark ALCO):

II-92 Volume II Geodetic Vertical and Water Level Datums This report is the independent opinion of the IPET and is not necessarily the official position of the U.S. Army Corps of Engineers.
ALCO LMSL (epoch 1983-2001) 5.89 ft ALCO NAVD88 (12/05/96) 6.59 ft
Difference: (0.70 ft) [LMSL — NAVD88]
P 153 [NAVD88 (12/05/96)] 10.21 ft Difference [LMSL (epoch 1983-2001) — NAVD88] -0.70 ft LMSL at P 153 (epoch 1983-2001) 9.51 ft
From the above, the estimated LMSL elevation of Benchmark P 153 is 9.51 ft. This is based on the NOAA tidal epoch of 1983-2001 and is approximately representative of the LMSL eleva-tion at the time of construction.
Impact of Datum Variations on Constructed Floodwall Elevations
Given the nearly universal presumption that NGVD and MSL were equivalent datums, and that floodwall design was computed relative to MSL = 0.0 ft on Lake Pontchartrain, the actual constructed elevation on a typical floodwall in the London Avenue Outfall Canal is reduced by approximately:
Benchmark P 153 11.27 ft NGVD (Contract Plans) Benchmark P 153 9.51 ft LMSL (1983-2001epoch)
Difference: 1.76 ft
In effect, floodwall elevations designed relative to a LMSL datum would be constructed about 1.7 ft lower than intended when using the 1965 adjustment of the NGVD29 geodetic vertical datum as a reference. Thus a floodwall designed to 14.4 ft NGVD (i.e., MSL) would actually be constructed to 12.7 ft relative to LMSL (1983-2001 epoch).
Assessment of Pre- and Post-Katrina Flood Protection Elevations (London Avenue Outfall Canal)
Design and current floodwall elevations for selected sections of the London Avenue Canal are listed in Table 17 below. Data were obtained and adjusted using identical procedures outlined for the Orleans Avenue Outfall Canal evaluation. The average elevation was computed from representative shot points taken atop the floodwall along each reach. Variances in the floodwall cap elevation were typically ± 0.2 ft along some reaches.
During January 2006, post-Katrina overbank cross-section surveys were taken north and south of the breach areas by 3001, Inc. (Table 18). These surveys were performed to support IPET physical models of the two breach sites on the canal. They also provide a quality assurance check on the above Task Force Guardian surveys performed shortly after Katrina. State plane coordinates are LA 1702 South and elevations are in feet NAVD88 (2004.65). The stationing is not the floodwall alignment.

Volume II Geodetic Vertical and Water Level Datums II-93 This report is the independent opinion of the IPET and is not necessarily the official position of the U.S. Army Corps of Engineers.
Table 17 Design and Current Floodwall Elevations in Selected Reaches (London Avenue Outfall Canal) New Orleans District/Task Force Guardian Post-Katrina Surveys Oct-Dec 2005
Average Elevation (2005-2006)
Reach Number of Shot Points
Design Elevation NGVD29 (MSL)
NAVD88 (2004.65)
LMSL (1983-2001)
WEST BANK Leon Simon Ave. to RE Lee Blvd. N/A N/A N/A N/A
WEST BANK Robert E. Lee Blvd. to Filmore Ave. 18 14.4 ft 13.0 ft 12.8 ft
WEST BANK Filmore Ave. to Mirabeau Ave. 23 14.4 ft 12.9 ft 12.7 ft
WEST BANK Mirabeau Ave. to Gentilly Ave. 27 14.4 ft 12.9 ft 12.7 ft
WEST BANK Gentilly Ave. to Pump Station 3 19 14.4 ft 12.9 ft 12.7 ft
EAST BANK Leon Simon Ave. to Robert E. Lee Blvd. 8 14.4 ft 12.8 ft 12.6 ft
EAST BANK Robert E. Lee Blvd. to Filmore Ave. 26 14.4 ft 12.9 ft 12.6 ft
EAST BANK Filmore Ave. to Mirabeau Ave. 17 14.4 ft 12.9 ft 12.6 ft
EAST BANK Mirabeau Ave. to Gentilly Ave. 24 14.4 ft 12.9 ft 12.7 ft
EAST BANK Gentilly Ave. to Pump Station 3 18 14.4 ft 13.1 ft 12.8 ft
Comparison between the Oct.-Dec. 2005 MVN/Task Force Guardian surveys and the 2006 IPET surveys indicates a NAVD88 (2004.65) elevation agreement to within ± 0.1 ft. In general, current floodwall cap elevations are about 1.7 ft below the original design elevation. This is consistent with the 1.6 ft estimated reduction computed in the preceding paragraph.
Floodwall elevations near the Mirabeau Avenue breach area are between 12.5 and 12.6 ft LMSL (1983-2001). This assumes no abnormal undulation in the breach site—a reasonable assumption given the fairly uniform elevations in the existing floodwalls.
Current differences in flood protection elevations are shown in Table 19. Elevations of the floodwalls adjacent to the west and east bank breach areas are in italics. A modified NTDE 2001-2005 will reduce the current flood protection by another 0.25 ft, as was shown for the Orleans Outfall Canal.
Figure 42 below summarizes the approximate 1.7 ft loss in protection resulting from using a geodetic elevation instead of a sea level-based elevation to construct the floodwalls.

II-94 Volume II Geodetic Vertical and Water Level Datums This report is the independent opinion of the IPET and is not necessarily the official position of the U.S. Army Corps of Engineers.
Table 18 Post-Katrina Floodwall Elevations Vicinity Breach Areas (London Avenue Outfall Canal) IPET Overbank Surveys January 2006 (3001, Inc.)
X Y Elev (ft) NAVD88 (2004.65) Location
Data File Reference
North Breach — West Bank — South of RE Lee Blvd
Vicinity of Burbank Drive (South of Robert E. Lee Blvd.)
Sta. 15+50
3680399.87 554667.93 13.041 Top Edge Conc Fldwal 17thLondon.dc
3680399.17 554667.96 13.107 Top Edge Conc Fldwal 17thLondon.dc
Sta. 16+00
3680403.85 554618.86 13.013 Top Edge Conc Fldwal 17thLondon.dc
3680403.4 554618.87 13.013 Top Edge Conc Fldwal 17thLondon.dc
South Breach — East Bank — North of Mirabeau Avenue
Vicinity of Wildair Drive (North of Mirabeau)
Sta. 51+00
3680710.06 551132.49 12.86 TPF * (West Bank) Book# 060856
3680709.06 551132.43 12.86 TPF (West Bank) Book# 060856
Sta 51+50
3680712.27 551082.53 12.86 TPF (West Bank) Book# 060856
3680711.27 551082.47 12.87 TPF (West Bank) Book# 060856
3680837.01 551090.56 12.87 TPF (East Bank) Book# 060856
Sta. 52+00
3680841.23 551040.73 12.87 TPF (East Bank) Book# 060856
3680717.48 551032.76 12.88 TPF (West Bank) Book# 060856
3680716.49 551032.7 12.89 TPF (West Bank) Book# 060856
Vicinity of Mirabeau Avenue Bridge
Sta. 58+00
3680889.96 550392.53 12.72 TPF (East Bank) Book# 060856
3580888.97 550392.46 12.72 TPF (East Bank) Book# 060856
Sta. 59+00
3680895.17 550342.76 12.77 TPF (East Bank) Book# 060856
3680894.17 550342.69 12.77 TPF (East Bank) Book# 060856
3680763.44 550334.28 12.87 TPF (West Bank) Book# 060856
3680762.44 550334.21 12.87 TPF (West Bank) Book# 060856
Sta. 59+50
3680898.39 550292.86 12.77 TPF (East Bank) Book# 060856
3680897.39 550292.79 12.77 TPF (East Bank) Book# 060856
* TPF – top of concrete floodwall. Note: duplicate shots are at the floodside and protected side of the floodwall concrete cap.

Volume II Geodetic Vertical and Water Level Datums II-95 This report is the independent opinion of the IPET and is not necessarily the official position of the U.S. Army Corps of Engineers.
Table 19 Current Flood Protection Elevations on London Avenue Outfall Canal Floodwalls Relative to LMSL (1983-2001 epoch) (elevations in feet) LMSL (1983-2001) Section Design Current Difference
WEST BANK Leon Simon Ave to Robert E. Lee Blvd. n/a n/a Robert E. Lee Blvd. to Filmore Ave. 14.4 ft 12.8 ft 1.6 ft Filmore Ave. to Mirabeau Ave. 14.4 ft 12.7 ft 1.7 ft Mirabeau Ave. to Gentilly Ave. 14.4 ft 12.7 ft 1.7 ft Gentilly Ave. to Pump Station 3 14.4 ft 12.7 ft 1.7 ft
EAST BANK Leon Simon Ave. to Robert E. Lee Blvd. 14.4 ft 12.6 ft 1.8 ft Robert E. Lee Blvd. to Filmore Ave. 14.4 ft 12.6 ft 1.8 ft Filmore Ave. to Mirabeau Ave. 14.4 ft 12.6 ft 1.8 ft Mirabeau Ave. to Gentilly Ave. 14.4 ft 12.7 ft 1.7 ft Gentilly Ave. to Pump Station 3 14.4 ft 12.8 ft 1.6 ft
1414
(Not to Scale)
London Avenue Outfall CanalLondon Avenue Outfall CanalDesign v Constructed Floodwall ElevationsDesign v Constructed Floodwall Elevations
NGVD (1983)or MSL
Design Elevation14.4 ft
1.6 feet
LMSL (1983-2001)
9.51 ft 11.27 ft
BenchmarkP 153
1.8 feet
Constructed Elevation
12.8 ft
Figure 42. Impact of using NGVD elevation instead of LMSL elevation for construction stakeout of London Ave. Outfall Canal floodwall construction.

II-96 Volume II Geodetic Vertical and Water Level Datums This report is the independent opinion of the IPET and is not necessarily the official position of the U.S. Army Corps of Engineers.
Data Analysis and Impacts: 17th Street Outfall Canal Construction Reference Datums Summary of Findings
This section covers the evaluation of the constructed and current elevations on flood protec-tion structures along the 17th Street Outfall Canal. The High Level Plan floodwalls on the east and west banks were found to be constructed nearly 2 feet below their intended design eleva-tions. This was caused by using a geodetic elevation reference instead of a hydraulic (sea level) reference datum and the likely use of a disturbed benchmark to set floodwall construction grades. Pre-Katrina and current flood protection elevations in the canal floodwalls are 2.0 to 2.3 ft below the intended design when related to the latest tidal epoch.
Reference Documents
The following construction drawings and DMs were reviewed as part of this assessment:
• Contract 92-1 Board of Levee Commissioners of East Jefferson Levee District -17th Street Canal West Side Levee Improvements
• Orleans Levee District (OLD) Contract 02043-0489 As-Built—17th Street Canal Phase IB—Hammond Hwy to Southern RR 1990
• DACW29-93-B-0025 Excavation and Flood Protection 17th St. Canal—Capping of Floodwalls—East Side Levee Improvements
• DACW29-95-C-0093 (95-B-0095) As-Built Markup—17th St. Outfall Canal-Metairie Relief—Floodproofing Veterans Blvd. Bridges
• GDM 20 Vol I & II-17th St. Outfall Canal (Metairie Relief) Orleans Parish and Jefferson Parish 1990
• DM01 Part III Hydrology and Hydraulic Analysis—Lake Pontchartrain and Vicinity-Lakeshore (Sept. 1968)
Design Elevation Parameters for 17th Street Canal
The following paragraphs containing design parameters are extracted from the various DMs and construction documents listed above.
EAST SIDE LEVEE IMPROVEMENTS—FLOODWALL CAPPING (DACW29-93-B-0025)
Floodwall cap elevations: Southern Railway Sta 126+02 to I-10 Bridge Sta 97+52 elev. 15.0 ft NGVD I-10 Bridge Sta 94+17 to Vet Hwy Sta 81+52 elev. 14.5 ft Vet Hwy Sta 80+00 to Hammond Hwy Sta 8+49 elev. 14.0 ft Hammond Hwy Sta 7+03 to Sta 0+00 elev. 14.0 ft Plans state normal water surface 1.5 to 2.0 ft NGVD (source of hydrograph not noted in plans)

Volume II Geodetic Vertical and Water Level Datums II-97 This report is the independent opinion of the IPET and is not necessarily the official position of the U.S. Army Corps of Engineers.
Contract plan elevations are referenced to “USCE MONUMENT 14” elevation 8.77 ft NGVD
WEST SIDE LEVEE IMPROVEMENTS (Contract 92-1—1992) As-Builts
Top of Required Floodwall Elevations: Lakefront Levee (Sta 549+78) to Vet Hwy (Sta 625+02) elev. 14.0 ft Vet Hwy (Sta 626+25) to I-10 Bridge (Sta 638+84) elev. 14.5 ft I-10 Bridge (Sta 642+23) to South. Railway Bridge (Sta 669+17) elev. 15.0 ft Normal water surface elevation 1.5 ft to 2.0 ft Reference construction benchmark: USCE Monument 14—elev. 8.77 NGVD (no epoch noted)
Figure 43. Typical section and General Note depicting “normal water surface” in
17th Street Canal at 1.5 to 2.0 ft elevation. (Contract 92-1 Board of Levee Commissioners of East Jefferson Levee District -17th Street Canal West Side Levee Improvements).

II-98 Volume II Geodetic Vertical and Water Level Datums This report is the independent opinion of the IPET and is not necessarily the official position of the U.S. Army Corps of Engineers.
VETERANS BLVD BRIDGE FLOODPROOFING (DACW29-95-C-0093)
Still water level 12.5 ft NGVD Wave action 14.5 ft NGVD Design water level 12.5 ft at 6,650 cfs at 300 yr Normal water level 1.5 to 2.0 ft NGVD at 0 cfs (no hydrograph shown in plans— specifications not available) Project Reference Benchmark: T-193 elev. 9.741 (NGVD 1972 epoch) on bridge abutment (last recovered 1994)
Phase I-B HAMMOND HWY TO SOUTHERN RAILWAY (OLD Contract 02043-0489 —1990):
Contract plans note that elevations are referred to MSL. “Normal Water Surface” elevation ranges from 1.0 to 2.0 ft ... apparently either based on a pump station gauge hydrograph or perhaps from a gauge at Lake Pontchartrain (not indicated in the plans). Section views indicate the normal water surface elevation is 1.0 ft (typical). Floodwall sheet pile top elevations vary: 13.5, 14.0, and 14.5 ft
Figure 44. Typical section depicting “normal water surface” in 17th Street Canal at 1.0 ft elevation (Orleans Levee District Contract 02043-0489--1990-As-Built).
GENERAL DESIGN MEMORANDUM 20 (1990)
Elevations referenced to NGVD (no epoch date noted). Hydraulic and Structural design criteria:
Lake Pontchartrain still-water elevation 11.5 ft at 300-year SPH

Volume II Geodetic Vertical and Water Level Datums II-99 This report is the independent opinion of the IPET and is not necessarily the official position of the U.S. Army Corps of Engineers.
Wind tide level (17th St Canal) 11.50 to 12.50 ft East Bank floodwall elevations: 14.00 to 15.00 ft West Bank floodwall elevations: 16.50 to 15.00 ft
Figure 45. DM 20 design flowlines.

II-100 Volume II Geodetic Vertical and Water Level Datums This report is the independent opinion of the IPET and is not necessarily the official position of the U.S. Army Corps of Engineers.
Reference Benchmark Used in 17th Street Canal Parallel Floodwall Protection
Benchmark USACE MONUMENT 14 was apparently used as the vertical reference for nearly all the floodwall design and construction on the 17th Street Outfall Canal. The exception is the ca 1995 Veterans Blvd. Bridge floodproofing project (DACW29-95-C-0093) in which Benchmark T 193 is indicated on the contract plans. The origin of Benchmark MONUMENT 14 is believed to have been established by a survey performed during March-April 1987 by Walker & Avery, Inc. It was connected by differential levels from Benchmark T 193 with a starting ele-vation of T 193 being 9.741 ft “NGVD.” This appears to be the 1965 adjustment. T 193 is on the bridge abutment of Veterans Memorial Bridge. This mark (T 193) is believed to have been dis-turbed and its elevation could not be verified by New Orleans District Survey Section (according to the records). A later survey (1995) determined that MONUMENT 14 was 0.45 ft lower than the 1987 elevation. The source survey data for the elevation shown on the contract drawings (8.77 ft NGVD) is verified. The mark was never incorporated into the USC&GS/NGS database. Additional information is contained in Technical Appendix 39.
No other benchmarks are noted in the construction plans reviewed above. It is presumed all construction stakeout for the East Bank (Orleans Parish) and West Bank (Jefferson Parish) flood-walls was performed relative to a single benchmark—MONUMENT 14.
Figure 46. 17th Street Canal Reference Benchmark USACE MONUMENT 14 near Hammond Hwy.

Volume II Geodetic Vertical and Water Level Datums II-101 This report is the independent opinion of the IPET and is not necessarily the official position of the U.S. Army Corps of Engineers.
Derived Elevations of Benchmark MONUMENT 14
Post-Katrina New Orleans District surveys to MONUMENT 14 indicated its elevation was suspect—not only currently but also most likely at the time of initial floodwall construction.
A New Orleans District differential level line run in November 2005 from primary Benchmark ALCO to MONUMENT 14 yielded an elevation of 7.06 ft NAVD88 (2004.65) on MONUMENT 14. Using geodetic elevation adjustment data from Benchmark ALCO equivalent reference datums and adjustment epochs are compared as follows:
MONUMENT 14 7.06 ft NAVD88 (2004.65) Difference (NGVD29-NAVD88 (2004.65)) at ALCO +0.62 ft
MONUMENT 14 (most probable elevation) 7.68 ft NGVD29 (05/21/91)
Thus, the most probable elevation in 1991 is 7.68 ft (assuming no significant subsidence to date). The difference in elevation due to datum epoch uncertainty is estimated as:
MONUMENT 14 (construction plans) 8.77 ft NGVD (unknown adjustment epoch) MONUMENT 14 (most probable elevation) 7.68 ft (05/21/91)
Difference 1.09 ft (due to datum epoch readjustment)
It is not likely a datum epoch readjustment accounted for the large 1.09 ft difference.
Given NGVD was generally assumed to equal MSL on design and construction documents, the LMSL (1983-2001) elevation of MONUMENT 14 is estimated as:
MONUMENT 14 7.06 ft NAVD88 (2004.65) Difference LMSL (1983-2001) - NAVD88 (2004.65)) at ALCO -0.25 ft
MONUMENT 14 6.81 ft LMSL (1983-2001)
Then,
MONUMENT 14 (Construction Plans) 8.77 ft NGVD ≈ MSL MONUMENT 14 6.81 ft LMSL (1983-2001)
Difference 1.96 ft
This 1.96 ft elevation disparity at Benchmark MONUMENT 14 may be due to a number of factors:
• The 8.77 ft elevation shown on the plans is suspect due to a possible disturbed origin benchmark.
• Assumption that NGVD = MSL.
• Subsidence may have occurred since the elevation was established.
• The benchmark had incorrect elevation in 1990 (this is believed to be the likely problem based on verbal recollections by New Orleans District personnel).

II-102 Volume II Geodetic Vertical and Water Level Datums This report is the independent opinion of the IPET and is not necessarily the official position of the U.S. Army Corps of Engineers.
The relative likelihood and significance of the above factors can be approximately evaluated using pre-Katrina LIDAR topography (2000) and/or post-Katrina conventional topographic sur-veys in 2005 and 2006—see following section.
Assessment of Pre- and Post-Katrina Flood Protection Elevations (17th Street Outfall Canal)
Design and current floodwall elevations for selected sections of the 17th Street Canal are listed in the following Table 20, based on post-Katrina topographic surveys performed by New Orleans District/Task Force Guardian and IPET survey forces. A spreadsheet containing extracts from these surveys is in Technical Appendix 36 to this Volume (Outfall Canal Post-Katrina Topographic Surveys). Data were obtained and adjusted using identical procedures outlined for the previous Orleans and London Canal evaluations. The average elevation was computed from representative shot points taken atop the floodwall along each reach. Variances in the floodwall cap elevation were typically less than ± 0.2 ft along most reaches.
Table 20 Design and Current Floodwall Elevations in Selected Reaches (17th Street Outfall Canal) New Orleans District/Task Force Guardian Post-Katrina Surveys Oct-Dec 2005
Average Elevation (2005-2006)
Reach Number of Shot Points
Design Elevation NGVD29 (MSL)
NAVD88 (2004.65)
LMSL (1983-2001)
WEST BANK Lakefront Levee to Veterans Hwy 58 14.0 ft 12.7 ft 12.4 ft
WEST BANK Veterans Hwy to I-10 Bridge 23 14.5 ft 13.4 ft 13.1 ft
WEST BANK I-10 Bridge to Southern RR 16 15.0 ft 13.4 ft 13.1 ft
EAST BANK Hammond Hwy to Veterans Hwy 26 14.0 ft 12.4 ft 12.1 ft
EAST BANK Veterans Hwy to I-10 Bridge 37 14.5 ft 13.5 ft 13.2 ft
EAST BANK I-10 Bridge to Southern RR 18 15.0 ft 13.6 ft 13.3 ft
During January 2006, post-Katrina overbank surveys were taken north and south of the breach areas by 3001, Inc. These surveys were performed in support of IPET physical models of the breach sites. They also provided a quality assurance check on Task Force Guardian surveys performed post-Katrina. In Table 21, state plane coordinates are LA 1702 South and elevations are in feet NAVD88 (2004.65). The stationing shown is not the floodwall alignment.
Based on provisional observations, current floodwall cap elevations appear to be about 1.5 to 2.0 ft below the intended design elevation, as shown in Table 22. This is somewhat consistent with the 1.96 ft estimated reduction computed in the preceding paragraphs. Thus, current eleva-tions referenced to LMSL (1983-2001) are not significantly different from those originally constructed.

Volume II Geodetic Vertical and Water Level Datums II-103 This report is the independent opinion of the IPET and is not necessarily the official position of the U.S. Army Corps of Engineers.
Table 21 Post-Katrina Floodwall Elevations Vicinity East Bank Breach Area (17th Street Outfall Canal) IPET Overbank Surveys January 2006 (3001, Inc.) X Y Elev (ft) Location Data File Reference
South of Hammond Hwy (Vicinity Hay Place) Sta. 4+50 3664412.64 554305.82 12.373 Top Conc Fldwall 17thLondon.dc 3664413.38 554305.78 12.376 Top Conc Fldwall 17thLondon.dc Sta. 5+00 3664409.22 554256.33 12.418 Top Conc Fldwall 17thLondon.dc 3664409.99 554256.3 12.425 Top Conc Fldwall 17thLondon.dc Sta. 5+50 3664406.5 554205.41 12.329 Top Conc Fldwall 17thLondon.dc 3664405.82 554205.56 12.318 Top Conc Fldwall 17thLondon.dc
South of Hammond Hwy (Vicinity 40th Street) Sta. 14+00 3664348.77 553357.14 12.409 Top Conc Fldwall 17thLondon.dc 3664348.05 553357.13 12.36 Top Conc Fldwall 17thLondon.dc Sta. 14+50 3664345.33 553307.32 12.389 Top Conc Fldwall 17thLondon.dc 3664344.67 553307.28 12.414 Top Conc Fldwall 17thLondon.dc Sta. 15+00 3664341.03 553257.2 12.461 Top Conc Fldwall 17thLondon.dc 3664341.86 553257.23 12.475 Top Conc Fldwall 17thLondon.dc
Note: Duplicate shots are at the floodside and protected side of the floodwall concrete cap. Elevations are in feet NAVD88 (2004.65)
Table 22 Current Flood Protection Elevations on 17th Street Outfall Canal Floodwalls Relative to LMSL (1983-2001 epoch) LMSL (1983-2001) Section Design Current Difference
WEST BANK Lakefront Levee to Veterans Hwy 14.0 ft 12.4 ft 1.6 ft Veterans Hwy to I-10 Bridge 14.5 ft 13.1 ft 1.4 ft I-10 Bridge to Southern RR 15.0 ft 13.1 ft 1.9 ft
EAST BANK Hammond Hwy to Veterans Hwy 14.0 ft 12.1 ft 1.9 ft Veterans Hwy to I-10 Bridge 14.5 ft 13.2 ft 1.3 ft I-10 Bridge to Southern RR 15.0 ft 13.3 ft 1.7 ft
Floodwall elevations near the Hammond Highway breach area were between 12.1 and 12.2 ft LMSL (1983-2001) based on the IPET surveys and slightly lower (11.9 to 12.1 ft) using New Orleans District survey data closer to the breach site. (Shots on floodwalls on each side of the breach indicated actual elevations as low as 11.7 ft; however, it is not clear from the raw dataset if the walls were deformed/deflected at these points). A modified NTDE (2001-2005) will reduce the flood protection relative elevations even further.

II-104 Volume II Geodetic Vertical and Water Level Datums This report is the independent opinion of the IPET and is not necessarily the official position of the U.S. Army Corps of Engineers.
The approximately 2-ft difference indicated in the above table correlates with the elevation projections made in the previous paragraphs. The above can be illustrated in the following graphic (Figure 47).
Figure 47. Design versus current floodwall elevation—East Bank 17th St. Outfall Canal.
1111
(Not to Scale)
USACE Monument 14 used as reference for floodwall construction
Elevations are referenced to an estimated LMSL (1983-2001 epoch) at
Lake Pontchartrain
Existing floodwall elevations running ~12.1 ft (LMSL 1983-2001) —from 2005 post-Katrina
field surveys
1717thth Street Outfall CanalStreet Outfall CanalEast Bank Floodwall ConstructionEast Bank Floodwall Construction
ca 1993 Floodwall Protection/Capping Project (High Level Plan)ca 1993 Floodwall Protection/Capping Project (High Level Plan)Hammond Hwy to Veterans Blvd Sta. 8+50 to 80+00 (Hammond Hwy to Veterans Blvd Sta. 8+50 to 80+00 (±±) ) ---- TypicalTypical
Contract plan “NGVD” (unspecified epoch)-assumed ≈ MSL (LMSL) in 1993
LMSL (1983-1992 & 2005) (from 2005 level line)
elev 6.81 ft
elev 8.77 ft
~ 1.9 to 2.0 ft difference likely due to:
• Uncertain BM 14 elevation … believed by MVN to be suspect/disturbed
• Uncertain BM 14 datum (1951 or ?)
• Settlement (probably < 0.3 ft)
14.0 ft NGVD Design
Elevation
~ 1.9 to 2.0 feet

Volume II Geodetic Vertical and Water Level Datums II-105 This report is the independent opinion of the IPET and is not necessarily the official position of the U.S. Army Corps of Engineers.
Data Analysis and Impacts: Inner Harbor Navigation Canal (IHNC) Construction Reference Datums Summary of Findings
This section covers the evaluation of the constructed and current elevations on flood protec-tion structures along selected portions of the IHNC. The floodwall on the east bank between Florida Avenue and Claiborne Avenue (i.e., Lower East 9th Ward breach area) was found to have been constructed using the best available elevation data. Subsequent subsidence since the late 1960s construction has resulted in pre-Katrina and current flood protection elevations approxi-mately 2.5 ft below original design—in effect, a loss of the original freeboard allowance factored into the design elevation of the protective structures. Similar subsidence rates were noted on east and west bank floodwalls between the IHNC-GIWW confluence north to the Seabrook Bridge.
Reference Documents
The following as-built construction drawings and DM were reviewed as part of this assessment:
• DACW29-70-B-0088 As-Built Mark Up-IHNC Inner Harbor Navigation Canal East Levee—IHNC Lock to Florida Ave. Levee and Floodwall Capping
• DACW29-68-B-0148 As-Built—Levee Floodwall Capping—IHNC East Levee—Hayne Blvd. to Dwyer Ave.—Sta 33+95 to Sta 83+00 (1968)
• DACW29-68-B-0126 As-Built—Levee Floodwall Capping—IHNC West Levee—U.S. Hwy 90 to Alamanster Ave.—Sta 105+66 to Sta 167+00 (1970)
• DM02 Supplement 08 GDM-IHNC Remaining Levees (Feb 1968)
Other floodwalls along the IHNC East or West Bank were not evaluated in this assessment since the above area covers the critical breach site at the Lower 9th Ward.
Design Elevation Parameters for East Levee Floodwall Capping (1969)--IHNC Lock to Florida Ave Sta. 0+00 to 56+20
Reference benchmark used for construction: BM 1 is the same mark as USC&GS M-152—see Figure 48 below.
• Elevation 21.811 ft MSL (1969 contract plans)
• (Located on IHNC East Lockwall—intact 2006)
• 2005 Post-Katrina GPS connection (MVN 10 November 2005): Elevation 20.34 ft NAVD88 (2004.65)
• I-Walls constructed to 15.0 ft MSL—per As-Built plans—see typical plan at Figure 49
• (No DM/GDM could be found noting design and freeboard parameters).

II-106 Volume II Geodetic Vertical and Water Level Datums This report is the independent opinion of the IPET and is not necessarily the official position of the U.S. Army Corps of Engineers.
Historical Adjustments to Reference Benchmark M 152 (1951 to date)
Table 23 illustrates the various elevations associated with Benchmark M 152. Most of the changes are due to readjustments of level lines by NOAA to account for apparent subsidence.
From Table 23 it is apparent that the then (1969) most current elevation (21.811 ft) of M 152 was used in the contract plans, irrespective of the fact that the NGVD29 elevation was given as MSL. The Florida Avenue Gauge was active since 1949 and could have been used to determine the LMSL relationship.
Figure 48. Location and description for Benchmark BM 1 (M 152 USC&GS) at IHNC Lock.

Volume II Geodetic Vertical and Water Level Datums II-107 This report is the independent opinion of the IPET and is not necessarily the official position of the U.S. Army Corps of Engineers.
Figure 49. East side I-wall design elevation 15.0 ft (Sta. 2+00 typical).
Figure 50. IHNC East side floodwall capping—IHNC Lock north to Florida Avenue (Lower 9th Ward breach at approximately Sta. 2+00).

II-108 Volume II Geodetic Vertical and Water Level Datums This report is the independent opinion of the IPET and is not necessarily the official position of the U.S. Army Corps of Engineers.
Table 23 Successive Elevations on Benchmark M 152 from 1951 to 2005 Elev, ft Datum Adjustment Agency Reference 22.090 NGVD29 1951 USC&GS L-13860 22.697 NGVD29 19 March 1952 USC&GS 21.811 NGVD29 1963/9 April 1965 USC&GS L-19622 21.811 MSL 1969 Contract Plans MVN DACW29-70-B-0088 21.070 NGVD29 1982 NGS L-19622 21.148 NGVD29 1985/30 Jan 1986 NGS L-24903 20.96 NGVD29 21 June 1991 NGS L-25283/AU0668 20.963 NGVD29 1995 NGS L-25517 20.76 NAVD88 14 Feb 1994 NGS AU0668 20.81 NAVD88 Dec 1996 NGS AU0668 20.34 NAVD88 (2004.65) 10 Nov 1905 USACE MVN
20.0 LMSL (1983-2001) April 2006 NOAA CO-OPS IPET Study
19.7 LMSL (2001-2005) April 2006 NOAA CO-OPS IPET Study
The difference between LMSL and NGVD29 at this location on the IHNC during the 1963-1969 period was not estimated in this study. It is uncertain that data from historical USACE gauges in the IHNC (Seabrook Bridge, IHNC Lock, and Florida Avenue) would be able to quantify this difference to any level of confidence since the gauge references were periodically revised.
LMSL elevation differences in the IHNC were computed by NOAA using historical USACE gauge records. The approximate LMSL (1983-2001) difference from NAVD88 (2004.65) is 0.2 ft ± 0.1 ft. The difference is approximately 0.6 ft for the later LMSL modified NTDE (2001-2005) as described in a previous section of this Volume.
Assessment of Pre- and Post-Katrina Flood Protection Elevations (IHNC East Bank Floodwall between Claiborne and Florida Avenues)
New Orleans District survey crews ran levels to various points along the IHNC, as shown in Figure 51.

Volume II Geodetic Vertical and Water Level Datums II-109 This report is the independent opinion of the IPET and is not necessarily the official position of the U.S. Army Corps of Engineers.
Figure 51. Selected post-Katrina elevations on IHNC Floodwalls.
During January 2006, post-Katrina overbank surveys extracted in the following table (Table 24) were taken north and south of the breach area by 3001, Inc. These surveys were per-formed in support of IPET physical modeling. They also provide a quality assurance check on New Orleans District Task Force Guardian surveys performed after Katrina. State plane coordi-nates are LA 1702 South and elevations are in feet NAVD88 (2004.65). The stationing is not the floodwall alignment.
12.35 ft - 50' south of floodgate w-27/w-28 off France road. 12.62 ft - 150' north of same floodgate off France road. 12.61 ft - near pumping station on Florida Ave. 12.76 ft - 300' south of pump station Florida Ave.
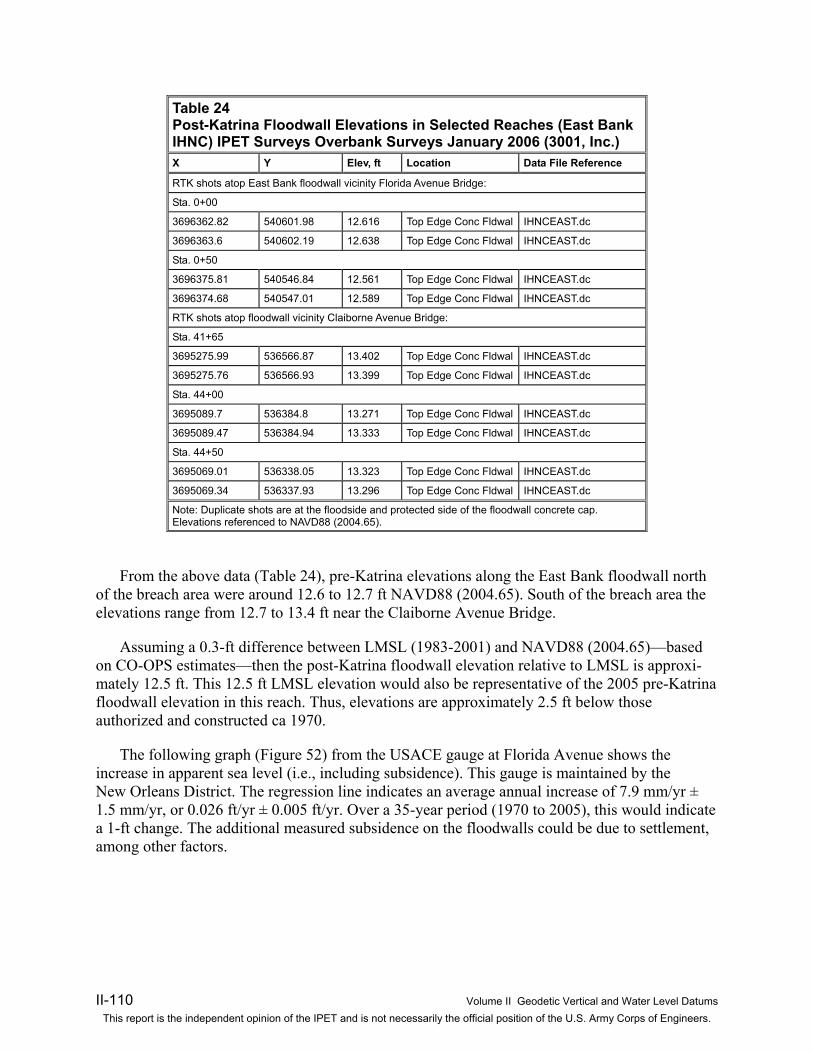
II-110 Volume II Geodetic Vertical and Water Level Datums This report is the independent opinion of the IPET and is not necessarily the official position of the U.S. Army Corps of Engineers.
Table 24 Post-Katrina Floodwall Elevations in Selected Reaches (East Bank IHNC) IPET Surveys Overbank Surveys January 2006 (3001, Inc.) X Y Elev, ft Location Data File Reference
RTK shots atop East Bank floodwall vicinity Florida Avenue Bridge:
Sta. 0+00
3696362.82 540601.98 12.616 Top Edge Conc Fldwal IHNCEAST.dc
3696363.6 540602.19 12.638 Top Edge Conc Fldwal IHNCEAST.dc
Sta. 0+50
3696375.81 540546.84 12.561 Top Edge Conc Fldwal IHNCEAST.dc
3696374.68 540547.01 12.589 Top Edge Conc Fldwal IHNCEAST.dc
RTK shots atop floodwall vicinity Claiborne Avenue Bridge:
Sta. 41+65
3695275.99 536566.87 13.402 Top Edge Conc Fldwal IHNCEAST.dc
3695275.76 536566.93 13.399 Top Edge Conc Fldwal IHNCEAST.dc
Sta. 44+00
3695089.7 536384.8 13.271 Top Edge Conc Fldwal IHNCEAST.dc
3695089.47 536384.94 13.333 Top Edge Conc Fldwal IHNCEAST.dc
Sta. 44+50
3695069.01 536338.05 13.323 Top Edge Conc Fldwal IHNCEAST.dc
3695069.34 536337.93 13.296 Top Edge Conc Fldwal IHNCEAST.dc
Note: Duplicate shots are at the floodside and protected side of the floodwall concrete cap. Elevations referenced to NAVD88 (2004.65).
From the above data (Table 24), pre-Katrina elevations along the East Bank floodwall north of the breach area were around 12.6 to 12.7 ft NAVD88 (2004.65). South of the breach area the elevations range from 12.7 to 13.4 ft near the Claiborne Avenue Bridge.
Assuming a 0.3-ft difference between LMSL (1983-2001) and NAVD88 (2004.65)—based on CO-OPS estimates—then the post-Katrina floodwall elevation relative to LMSL is approxi-mately 12.5 ft. This 12.5 ft LMSL elevation would also be representative of the 2005 pre-Katrina floodwall elevation in this reach. Thus, elevations are approximately 2.5 ft below those authorized and constructed ca 1970.
The following graph (Figure 52) from the USACE gauge at Florida Avenue shows the increase in apparent sea level (i.e., including subsidence). This gauge is maintained by the New Orleans District. The regression line indicates an average annual increase of 7.9 mm/yr ± 1.5 mm/yr, or 0.026 ft/yr ± 0.005 ft/yr. Over a 35-year period (1970 to 2005), this would indicate a 1-ft change. The additional measured subsidence on the floodwalls could be due to settlement, among other factors.

Volume II Geodetic Vertical and Water Level Datums II-111 This report is the independent opinion of the IPET and is not necessarily the official position of the U.S. Army Corps of Engineers.
Figure 52. Apparent sea level rise at Corps IHNC Florida Ave. Gauge 1944 to 2003 (Source: IPET New Orleans District and NOAA CO-OPS).
Design versus Current Floodwall Elevations in the IHNC between the GIWW Confluence to the Seabrook Bridge (East and West Banks)
Figure 53 depicts differences between constructed and current floodwall elevations on the IHNC. The floodwall grades shown are only approximately located. The current elevations were obtained from Task Force Guardian post-Katrina levee profiles. These elevations are an average over the sectors—high variability (e.g., ± 1 ft) was observed in some sectors—probably due to varying settlement.
The reduced flood protection (relative to LMSL) in this portion of the GIWW is typically between 2.0 and 2.5 ft—similar to that seen in the East Bank section below Florida Avenue. This is consistent with subsidence estimates over the past 35 years.
Florida Avenue Trend 7.90 mm/yr +/- 1.50
20032002
20012000
19991998
19971996
19951994
19931992
19911990
19891988
19871986
19851984
19831982
19811980
19791978
19771976
19751974
19731972
19711970
19691968
19671966
19651964
19631962
19611960
19591958
19571956
19551954
19531952
19511950
19491948
19471946
19451944
met
ers
1.2
1.0
.8
.6
.4
.2
0.0
-.2
.195 offset
.158 offset
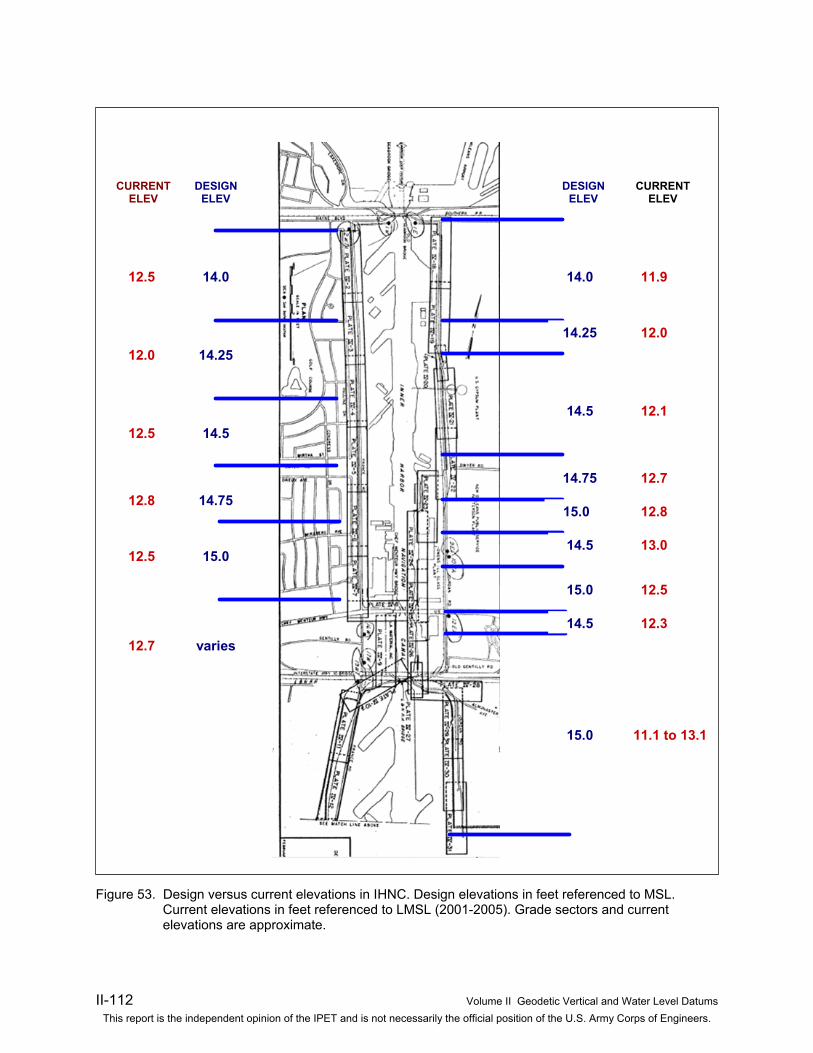
II-112 Volume II Geodetic Vertical and Water Level Datums This report is the independent opinion of the IPET and is not necessarily the official position of the U.S. Army Corps of Engineers.
Figure 53. Design versus current elevations in IHNC. Design elevations in feet referenced to MSL. Current elevations in feet referenced to LMSL (2001-2005). Grade sectors and current elevations are approximate.
DESIGN ELEV
CURRENTELEV
DESIGN ELEV
CURRENT ELEV
14.0
14.25
14.5
14.75
15.0
varies
12.5
12.0
12.5
12.8
12.5
12.7
14.0
14.25
14.5
14.75
15.0
14.5
15.0
14.5
15.0
11.9
12.0
12.1
12.7
12.8
13.0
12.5
12.3
11.1 to 13.1

Volume II Geodetic Vertical and Water Level Datums II-113 This report is the independent opinion of the IPET and is not necessarily the official position of the U.S. Army Corps of Engineers.
Reference Datums for Hurricane Protection Projects in St. Bernard and Plaquemines Parishes
This section represents a review of elevation datums on hurricane protection structures south-east of the New Orleans area. Given the magnitude of the overtopping surge heights relative to the small size of the geodetic-hydraulic datum variations, and the lack of available design and construction documents, only a cursory study was performed in this region.
Various DMs were reviewed to assess the reference datums used in determining hurricane design elevations on flood protection projects along the GIWW, the MRGO, and Mississippi River. These included:
• DM 01 Part 1 Hydrology and Hydraulic Analysis--Lake Pontchartrain and Vicinity--Chalmette (Aug. 1966)
• DM 01 Part 2 Hydrology and Hydraulic Analysis--Lake Pontchartrain and Vicinity--Barrier (Aug. 1967)
• DM 01 Part 3 Hydrology and Hydraulic Analysis--Lakeshore (Sept. 1968)
• DM 13 Vol I GDM Orleans Parish Lakefront Levee West of IHNC (Nov. 1984)
Lake Pontchartrain and Vicinity Projects
DM 01 Part 2 (1967) states the average high tide of Lake Pontchartrain at 1.4 ft. This level is used as a base (or initial) elevation for subsequent storm surge modeling. The DM notes all ele-vations are referred to Mean Sea Level.
DM 01 Part 3 (1968) and DM 13 Vol 1 (1984) later noted the average high tide in Lake Pontchartrain at 0.7 ft. This was adjusted down 0.7 ft from the 1.4 ft average high tide cited in the 1967 Barrier Plan (DM 01 Part 2). This was based on a USC&GS releveling and gauge adjustment.
Figure 54. Average Lake Pontchartrain stages (DM 01 Part 3—1968).
Other DMs note the “normal water level” of Lake Pontchartrain at 0.0 ft MSL (Appendix B of GDM 20 (Draft) London Ave. Canal Floodwalls and Levees—Orleans Levee District—(April 1986).

II-114 Volume II Geodetic Vertical and Water Level Datums This report is the independent opinion of the IPET and is not necessarily the official position of the U.S. Army Corps of Engineers.
(Note that the design or hurricane tide is the maximum still-water surface elevation experi-enced at the location during the passage of a hurricane. This design tide uses the initial normal (predicted) tide as a base reference, or alternately the high tide. EM 1110-2-1913 notes freeboard was, in the past, used to account for hydraulic, geotechnical, construction, operation, and main-tenance uncertainties. This current EM develops a risk-based analysis to set the final levee grade to account for settlement, shrinkage, cracking, geologic subsidence, and construction tolerances.)
DM 01 Part 1—Chalmette (1966) indicates a “normal predicted tide” of 1.60 ft (MLW) and a -0.60 ft correction from MLW to MSL. This implies a normal predicted tide of 1.0 ft MSL at the Chalmette area. Resultant observed and computed hurricane surge heights are relative to MSL. A plate (Figure 55) depicting typical tidal cycles in Lake Borgne and Lake Pontchartrain indicates MSL elevations average +1.0 ft above 0.0 MSL in both areas. DM 01 states the average tidal ranges in Lake Borgne and Lake Pontchartrain are +1.0 ft and 0.5 ft respectively, and the average elevation of the lakes “differs very little.” The elevation of Lake Borgne is given at 0.9 ft and Lake Pontchartrain 1.0 ft. The source of these elevations (i.e., gauge and/or leveling datum) is not readily apparent in the DM. Given all elevations in the DM refer to MSL it is presumed that these 0.9 ft and 1.0 ft “normal water surface” superelevations also refer to MSL. If these eleva-tions are based on gauges referenced to a “NGVD” datum, this is not apparent from the limited records viewed.
Figure 55. +1.0 ft superelevation on Lake Borgne and Lake Pontchartrain (DM 01 Part 1).

Volume II Geodetic Vertical and Water Level Datums II-115 This report is the independent opinion of the IPET and is not necessarily the official position of the U.S. Army Corps of Engineers.
The following plate (Figure 56) from DM 01 Part 3 depicting wind tide profiles indicates the Mean Lake Level of Lake Pontchartrain as +1.0 ft.
Figure 56. +1.0 ft “Mean Lake Level” relative to MSL for Lake Pontchartrain (DM 01 Part 3).
New Orleans to Venice Projects
Referenced DMs:
• DM 01 GDM Supp 04—New Orleans to Venice--Reach B2--Fort Jackson to Venice (Aug. 1972)
• DM 01 GDM Supp 06--West Bank Mississippi River Levee--City Price to Venice (March 1987).
Still-water elevations and hurricane design elevations on the New Orleans to Venice projects generally refer to the MSL datum (DM 01 GDM Supp 04--1972). Tides along the coast are noted having a mean range of 1 ft. Both headwater flooding and tidal effects are compensated for in computing surge elevations in the Mississippi River north of Venice. Page A-16 of DM 01 GDM Supp 04 states the Predicted “Mean Normal Tide” in the project area ranges from 0.4 to 1.0 ft MSL. It is unclear if this Mean Tide is equivalent to Mean Tide Level or how it relates to MSL. The design hurricane surge height for the project area is given as 11.5 ft MSL.

II-116 Volume II Geodetic Vertical and Water Level Datums This report is the independent opinion of the IPET and is not necessarily the official position of the U.S. Army Corps of Engineers.
DM 01 GDM Supp 06 (1987) noted that surge studies performed after Hurricane Betsy in 1965 were in error by as much as 1 ft due to readjustments to the NGVD level network in this area—see Figure 57 below. This resulted in hurricane stages being 1 ft higher than calculated by storm surge modeling.
Figure 57. NGVD29 network adjustment impact (Appendix B--DM 01 GDM Supp 06 (1987)).
Mississippi River Gulf Outlet (MRGO) Projects
Referenced DMs:
• DM 01 A--MRGO Channels Mile 63.77 to 68.85 (July 1957)
• DM 01 B--MRGO Channels Mile 39.01 to 63.77 (May 1959)
• DM 01 C--MRGO Channels Mile 0 to 36.43 (Bayou La Loutre) Mile 0.0 to (-) 9.75 (38 ft Contour) (Nov. 1959)
• DM 02 GDM Supp 03-Bayou La Loutre Reservation (Feb. 1968)
• DM 01 GDM--Michoud Canal (July 1973).
All documents refer MRGO channel elevations to MLG, which is 0.78 ft below MSL. This reference is standard for dredging and navigation projects in this region—see the Background Section to this Volume.
Records from a water level recording gauge on the GIWW at Paris Road indicated average yearly high and low water stages significantly above that expected for an area subject to direct tidal flow, as shown in Figure 58 below. The reason for this anomaly is unclear.
DM 02 GDM Supp 03-Bayou La Loutre Reservation (Feb 1968) notes the Average Water Surface for this section of the MRGO at 0.75 ft MSL. The maximum expected hurricane surge (SPH) is 15.0 ft MSL.

Volume II Geodetic Vertical and Water Level Datums II-117 This report is the independent opinion of the IPET and is not necessarily the official position of the U.S. Army Corps of Engineers.
Figure 58. GIWW water level stages at Paris Road (DM 01 GDM).

II-118 Volume II Geodetic Vertical and Water Level Datums This report is the independent opinion of the IPET and is not necessarily the official position of the U.S. Army Corps of Engineers.
Estimating Subsidence Rates in the Southeast Louisiana Region from Geodetic Observations
This section will focus on subsidence occurring at benchmarks throughout the IPET project area. This benchmark subsidence may be different from that occurring in the adjacent ground. Subsidence is the lowering or sinking of Earth’s surface (often quantified relative to non-sinking portions of the Earth’s crust). In Louisiana, subsidence is occurring at a rate of up to 0.1 ft every 3 years in some areas--especially in Southern Louisiana. Over the years there have been several studies that have been published documenting the subsidence of New Orleans and southern Louisiana (Mitchell and Zilkoski 1986). There are many potential factors that contribute to the subsidence, including the geologic composition of the area and withdrawal of ground water and oil. The subsidence in New Orleans and Southern Louisiana presents unique problems for the NGS.
In November 1986, NOAA Technical Report NOS 120 NGS 38, “Subsidence in the Vicinity of New Orleans as Indicated by Analysis of Geodetic Leveling Data” (NOAA 1986), used three different adjustments to determine the apparent movement of benchmarks in this area. It was noted in this report that this would be helpful to engineers when planning projects, to surveyors when evaluating leveling data, and to scientists when correlating apparent movements to geo-logic and hydrologic parameters. Report NGS 38 does not show sea level rise--only the apparent movement of the mark. It should also be noted that the movement reflected in this report, as well as in NOAA Technical Report 50, “Rates of Vertical Displacement at Benchmarks in the Lower Mississippi Valley and the Northern Gulf Coast” (NGS 2004), reflects the movement of the mark based on leveling observations. Table 25 shows not only the apparent subsidence but also that the subsidence is neither linear nor at the same rate based on location and different epochs.
Table 25 The Apparent Movement Without Sea Level Rise from NOAA Technical Report NOS 120 NGS 38, Which Used the Three Leveling Networks (1951-1955, 1964, and 1984-1985) to Estimate Apparent Crustal Movement DESIGNATION 1985.0 – 1964.0 1985 – 1951 1964 - 1951
A 148 (AU0429) -6.88 mm/yr (21 yr) -5.57 mm/yr (34 yr) -3.1 mm/yr (13 yr)
PIKE RESET (BH1164) -1.36 mm/yr -1.59 mm/yr -1.97 mm/yr
231 LAGS (BH1073) -16.39 mm/yr -10.90 mm/yr -2.03 mm/yr
A 92 (BH1136) -2.36 mm/yr -2.66 mm/yr -3.13 mm/yr
The rate of subsidence varies from epoch to epoch (survey to survey) due to many factors, such as compaction, removal of subsurface fluids, and geologic events. Therefore, one cannot predict future subsidence with any degree of accuracy. Table 26 shows the rate of change reflected in at least two different epochs of First-Order, Class II leveling as published in NOAA Technical Report 50 (NGS 2004).

Volume II Geodetic Vertical and Water Level Datums II-119 This report is the independent opinion of the IPET and is not necessarily the official position of the U.S. Army Corps of Engineers.
Table 26 Apparent movement reflected in NOAA Technical Report 50 DESIGNATION Rates of Movement, mm/yr
A 148 (AU0429) -11.01
PIKE RESET (BH1164) -6.99
231 LAGS (BH1073) -16.08
A 92 (BH1136) -7.39
In October 2005 NOAA updated official elevations on 85 existing benchmarks located in southern Louisiana. Prior to this time elevations of benchmarks in Southern Louisiana were questionable at best. The expected accuracy of the updated elevation values are between 2 and 5 cm, though it must be mentioned that these heights are continuing to change over time. Surveyors, engineers, and the USACE in New Orleans, along with other federal, state, and local governments, used heights that had not been calibrated nor checked for several years.
The average rate of apparent subsidence across the region was about 0.6 ft over the same 10-year period. This indicates that elevations published in the 1960’s, 1970’s, 1980’s, and early 1990s may have changed even more than 1 ft. NOAA’s long-term objective is to improve upon the current vertical reference system, the NAVD88 (2004.65) epoch, which consistently evalu-ates previously constructed, and proposed flood control and hurricane protection structures in New Orleans and Southeast Louisiana.
Figure 59 below depicts the apparent sea level increase (i.e., mostly subsidence) at the Florida Avenue gauge on the IHNC. These gauge data support independent geodetic observations.
Figure 59. Apparent sea level rise at Corps IHNC Florida Ave. Gauge 1944 to 2003 (Source: IPET MVN and NOAA CO-OPS).
Table 27 depicts estimated subsidence rates occurring at 18 benchmarks in the New Orleans region based on the adjusted elevations. These rates, compared with those published in NOAA Technical Report 50 (NGS 2004), do not all agree since the adjusted elevations contain
Florida Avenue Trend 7.90 mm/yr +/- 1.50
20032002
20012000
19991998
19971996
19951994
19931992
19911990
19891988
19871986
19851984
19831982
19811980
19791978
19771976
19751974
19731972
19711970
19691968
19671966
19651964
19631962
19611960
19591958
19571956
19551954
19531952
19511950
19491948
19471946
19451944
met
ers
1.2
1.0
.8
.6
.4
.2
0.0
-.2
.195 offset
.158 offset

II-120 Volume II Geodetic Vertical and Water Level Datums This report is the independent opinion of the IPET and is not necessarily the official position of the U.S. Army Corps of Engineers.
distributed errors from the adjustment computations. Therefore, Table 27 points out the need to use unadjusted values in determining subsidence rates as documented in Technical Report 50.
Table 27 Estimated Subsidence Rates at Selected Benchmarks in New Orleans Region. (Source: NGS/IPET Navaille) “Sup” = superseded
PID Designation Rate m/yr
2004.65 m Procedure Sup-Date Sup-m
Sup-ft
Leveling Year
NAVD88 (2004.65) ft
BH1119 C 189 -0.016 0.63 LEVELING(2004.65) 12/5/1996 0.794 2.60 1994 -0.54 AU2163 B 369 -0.015 1.84 LEVELING(2004.65) 12/5/1996 1.975 6.48 1995 -0.44
AU2310 876 1899 B TIDAL -0.015 0.01 LEVELING(2004.65) 12/5/1996 0.141 0.46 1995 -0.43
AU0429 A 148 -0.015 1.77 GPS OBS(2004.65) 12/5/1996 1.915 6.28 1994 -0.48 BJ1342 ALCO -0.014 1.87 LEVELING(2004.65) 12/5/1996 2.008 6.59 1994 -0.45 AT0804 REGGIO 2 -0.012 1.52 GPS OBS(2004.65) 2/14/1994 1.714 5.62 1988 -0.64 BH1212 A 193 -0.012 0.75 LEVELING(2004.65) 2/14/1994 0.879 2.88 1993 -0.42 AU2110 G 365 -0.011 0.24 GPS OBS(2004.65) 12/5/1996 0.342 1.12 1995 -0.33
AT1390 876 0849 A TIDAL -0.011 0.85 GPS OBS(2004.65) 8/31/2001 0.972 3.19 1993 -0.40
AT0407 A 152 -0.010 0.67 GPS OBS(2004.65) 2/14/1994 0.870 2.85 1984 -0.66 BJ3744 S 379 -0.010 4.31 GPS OBS(2004.65) 2/14/1994 4.482 14.70 1986 -0.56 AT0376 R 194 -0.008 1.39 GPS OBS(2004.65) 2/14/1994 1.554 5.10 1984 -0.54 AT0357 D 194 -0.008 1.68 LEVELING(2004.65) 2/14/1994 1.835 6.02 1984 -0.51 AT0200 MILAN 2 -0.008 -0.15 GPS OBS(2004.65) 2/14/1994 0.005 0.02 1984 -0.51 AT0332 L 278 -0.007 2.11 LEVELING(2004.65) 2/14/1994 2.253 7.39 1984 -0.47
AT0231
EMPIRE AZ MK 2 1934 1966 -0.007 -0.01 GPS OBS(2004.65) 2/14/1994 0.129 0.42 1984 -0.46
AT0247 C 279 -0.007 -0.23 GPS OBS(2004.65) 2/14/1994 -0.100 -0.33 1984 -0.43 AT0731 N 367 -0.007 0.34 GPS OBS(2004.65) 2/14/1994 0.470 1.54 1984 -0.43
Subsidence can be measured by using either conventional leveling procedure or GPS follow-ing Publication 58, “GPS Derived Ellipsoid Heights” (NOAA 1997) and the draft guidelines Publication 59 for “GPS Derived Orthometric Heights” (NOAA 2005)--or a combination of both. Figure 60 below contains a map showing the estimated amount of subsidence between New Orleans and Venice, LA. The leveling for this line was done in 1984 and adjusted to the NGVD29 datum at that time. In 1991 NGS adjusted the entire CONUS to the NGVD29 datum getting ready for the NAVD88 adjustment. As previously mentioned, this area was POSTed for the NAVD88 original adjustment in 1991 due to the subsidence in the area. During the 1992/ 1994 NGS adjustment, all the area that had been POSTed to establish an NAVD88 height for each of the benchmarks in this area. In Southern Louisiana an extensive “GPS Derived Height” was completed establishing new heights (elevations) for 85 benchmarks. The adjustment, as pre-viously noted, held control outside of the subsidence area establishing new NAVD88 adjusted heights for the 85 benchmarks. Because the 1992/1994 NAVD88 adjustment held control outside of the area, as did the NAVD88 (2004.65) adjustment, the change in the heights reflects the apparent movement of the marks between the observation periods. In order to determine the amount of subsidence from the time the original leveling was done, it is necessary to determine the amount of movement between the original adjustment and the 1991 national readjustment of the NGVD29 and then the amount of movement between the original NAVD88 adjustment and the NAVD88 (2004.65) adjustment. As an example of how the apparent subsidence is

Volume II Geodetic Vertical and Water Level Datums II-121 This report is the independent opinion of the IPET and is not necessarily the official position of the U.S. Army Corps of Engineers.
Figure 60. Estimated subsidence (in centimeters) in the New Orleans to Venice region.
determined between a 1984 leveling project and then during a 1991 leveling that only had a few marks in the 1984 leveling included in the 1991 leveling and adjustment. A 1991 line of levels ran from outside the area of subsidence through the New Orleans study area tied to only a few of the benchmarks leveled in 1984. The marks that are connected directly in the leveling and then adjusted in the 1991 adjustment provided more accurate heights showing apparent subsidence. The other marks that were observed in 1984 also took adjustment based on the 1984 leveling, and the connection made to the level line through the connection made in the 1991 leveling. This adjustment took care of some of the problems along the level line, but does not show subsidence over either a 10-year period or 20-year period based on the 2004.65 GPS Derived Orthometric Height survey determined through direct GPS observations. Therefore, the difference between the original NAVD88 adjustment, which happened in 1994, and the NAVD88 (2004.65) adjust-ment shows subsidence/change of a period between 1984 (date of original leveling with junction connections in 1991) and 2004.65 (midpoint of GPS Derived Orthometric Height survey) reflects the subsidence/change of a time period somewhere between 10 to 20 years, except those marks directly leveled in both the 1984 and 1991 leveling. This is due to the fact, as stated above, that the 1991 adjustment took care of some of the problems in the 1984 adjustment, but did not show how much the mark may have moved. Therefore, the amount of subsidence lies somewhere between 10 to 20 years on the level line that was run in 1984 and the GPS observations taken in 2004.65 and adjusted in 2005.
NOAA does not predict the rates of subsidence, nor attempt to determine its causes.

II-122 Volume II Geodetic Vertical and Water Level Datums This report is the independent opinion of the IPET and is not necessarily the official position of the U.S. Army Corps of Engineers.
Corps of Engineers Policies on Use of Geodetic and Water Level Datum Relationships in Design and Construction of Hurricane Protection Structures Background
As outlined in previous sections in this Volume, numerous definitions, and adjustment epochs are associated with geodetic and water level reference datums in Southeast Louisiana. These readjustments and various definitions, coupled with the temporal and spatially varying subsidence, resulted in inconsistent and often conflicting reference datums for flood control projects. Prior to the availability of functioning continuous GPS measurement systems in the mid-1990s, only limited technical guidance was available to the New Orleans District to reliably monitor subsidence and update the elevations in the area. Little, if any, technical guidance on geodetic vertical datums was contained in Corps of Engineers manuals until the mid-1990s. Prior to this time, Corps Districts throughout CONUS obtained guidance primarily from other Federal agencies, such as the NOAA or the USGS, and from standard civil engineering or surveying texts. Distribution of this guidance was often limited, sometimes conflicting, and normally not applicable for engineering applications. As such, many Corps Districts, including New Orleans, established internal policies on engineering uses and applications of the various geodetic datums.
Assumed Relationship between Geodetic Datums and Sea Level
As stated in the introductory sections to this Volume, NGVD29 was originally known as the Sea Level Datum of 1929. This change was disseminated by a Federal Register Notice dated 7 May 1973—Figure 61 below.
Figure 61. National vertical net name change.

Volume II Geodetic Vertical and Water Level Datums II-123 This report is the independent opinion of the IPET and is not necessarily the official position of the U.S. Army Corps of Engineers.
The name change from SLD29 to NGVD29 in 1973 was not disseminated to Corps Districts until HQUSACE issued Engineer Technical Letter (ETL) 1110-1-97 (Change in Name of National Vertical Control Net) on 31 October 1978. This ETL noted that elevations of the 26 controlling SLD29 tide stations did not necessarily reflect the actual LMSL. The Lower Mississippi Valley Division forwarded the ETL to its subordinate districts in a 9 February 1979 memorandum. This memorandum emphasized that this was a change in “nomenclature.” The fact that NGVD29 elevations (also known as SLD29 elevations) bore no relationship to a hydraulic water surface was not emphasized in either directive. A portion of the 1978 ETL is shown in Figure 62 below.
Figure 62. ETL 1110-1-97.
II-124 Volume II Geodetic Vertical and Water Level Datums This report is the independent opinion of the IPET and is not necessarily the official position of the U.S. Army Corps of Engineers.
The assumed equivalency of NGVD29 to MSL is predominant in both government and academic texts published well after the 1973 redefinition. This is illustrated in the following excerpts which are typical throughout the literature of the period:
“Datum, Mean Sea Level: A determination of mean sea level that has been adopted as a standard datum for heights or elevations. The Sea Level Datum of 1929, the current standard datum for geodetic leveling in the United States, is based on tidal observations over a number of years at various tide stations along the coast.” (“Definitions of Surveying and Associated Terms” Joint Committee of the American Congress on Surveying and Mapping and the American Society of Civil Engineers, 1978 (reprinted 1981, 1984, 1989)).
“Datum, Sea Level, 1929 [National Geodetic Vertical Datum of 1929 (see Federal Register, May 17, 1976, Vol. 41, No. 96, p. 20202)]: A determination of mean sea level that has been adopted as a standard datum for heights. The sea level is subjected to some variations from year to year, but, as the permanency of any datum is of prime importance in engineering work, a sea-level datum after adoption should, in general, be maintained indefinitely even though differing slightly from later determinations of mean sea level based on longer series of observations. The sea-level datum now used for the United States Coast and Geodetic Survey (now known as the National Ocean Survey) level net is officially known as the ‘Sea Level Datum of 1929,’ the year referring to the last general adjustment based on tide observations taken at various tide stations along the coasts of the United States over a number of years. See also ‘mean sea level’; ‘datum, tidal’.” (“Definitions of Surveying and Associated Terms” Joint Committee of the American Congress on Surveying and Mapping and the American Society of Civil Engineers, 1978 (reprinted 1981, 1984, 1989.))
“NGVD29, a synonym for ‘Sea Level Datum of 1929.’ This term was officially adopted by the NGS on May 17, 1976. It was a change in name only—the datum remains the same.” (“Geodetic Glossary,” NGS, 1986.)
“GPS surveys yield, at best, ellipsoidal height differences. These are rather meaningless from an engineering point of view. Therefore, extreme caution should be exercised when GPS height information, even after correction for geoidal undulations, is to be merged with height information from leveling ... In principle any equipotential surface can act as a vertical datum such as the ‘National Geodetic Vertical datum of 1929 (NGVD29). Problems may arise merging GPS heights, gravity surveys, and orthometric heights referring to NGVD29. Heights referring to NAVD88 datum will be more suitable for use with GPS surveys.” (Chapter 52, “The Civil Engineering Handbook,” Chen, 1995.)
“Datum: Any level surface to which elevations are referred. Mean Sea Level is usually used for a datum.” (Chapter 21—Measurements and Field practice, Land Surveyor Reference Manual, 2nd Edition, 1989.)
“Definitions ... An elevation is a vertical distance above or below a reference datum. In surveying, the reference datum that is universally employed is that of Mean Sea Level (MSL). In North America, 19 years of observations at tidal stations in 26 locations on the Atlantic, Pacific, and Gulf of Mexico shorelines were reduced and adjusted to provide the National Geodetic Vertical Datum (NGVD) of 1929.” (Chapter 3—Leveling, “Surveying With Construction Applications, Third Edition” Kavavagh, 1997.)
“Vertical Control Datum: A vertical-control datum has little relationship to either a geodetic datum or a horizontal-control datum ... it is convenient to have ‘heights’ along coastlines close to zero, and this would not be the case if geodetic heights were used. So a vertical-control datum was introduced... In the United States it is approximated by a surface based on mean sea level, and the precise definition of this surface is nearly impossible ... it is based on mean sea level at 26 tidal gages ... and was known for a long time as ‘Sea Level Datum of 1929,’ and so indicated

Volume II Geodetic Vertical and Water Level Datums II-125 This report is the independent opinion of the IPET and is not necessarily the official position of the U.S. Army Corps of Engineers.
on topographic maps. The name was changed in 1973 to ‘National Geodetic Vertical Datum of 1929’ to avoid the implication that the datum is mean sea level; the datum itself was left unchanged.” (“Manual of Photogrammetry, 4th Edition,” American Society of Photogrammetry, 1980.)
“Mean Sea Level: ... arrived at from readings ... at 26 gaging stations ... The elevation of the sea differs from station to station depending on local influences of the tide ... Therefore, to provide a common reference for elevations throughout North America, it was necessary to adopt a ‘mean sea level.’ The [1929] adjustment ... incorporated long-term from the 26 tidal gagging stations; hence it was related to mean sea level. In fact, the network of benchmarks with their resulting adjusted elevations defined the mean sea level datum. It was called the ‘National Geodetic Vertical Datum of 1929 (NGVD29) ... Throughout the years after 1929, the NGVD29 deteriorated somewhat due to changes in sea level and shifting of the earth’s crust ... The [North American Vertical Datum of 1988] adjustment shifted the position of mean sea level somewhat, and thus resulted in changes to the elevations of all benchmarks in the vertical network ... [references Figure showing differences between NGVD29 and NAVD88]” (“Elementary Surveying, 9th Edition,” Wolf & Brinker1994.)
From the above examples, it is apparent that many in the engineering community would (and did) continue to reasonably conclude after 1973 that geodetic datums referenced to NGVD29 were equivalent to MSL. The last example from Wolf & Brinker most completely details the nonequivalence. The impact is that many flood control and hurricane protection projects were designed and constructed under the assumption that NGVD29 closely approximated MSL when in fact it may have differed by as much as 1 ft in places. This misinterpretation continues to the present--even with the revised NAVD88 which has absolutely no relationship to a local sea level surface.
Corps Policy Guidance on the Redefined NAVD88 Geodetic Datum
In January 1994 HQUSACE issued an Engineer Technical Letter to the field, “Conversion to the North American Vertical Datum of 1988” (ETL 1110-1-152, 1 January 1994). This document was intended to provide “technical guidance and implementation procedures for the conversion from the National Geodetic Vertical Datum of 1929 (NGVD29) to the North American Vertical Datum of 1988 (NAVD88).” This guidance letter stated, in part:
“The Federal Geodetic Control Subcommittee (FGCS) of the Federal Geographic Data Committee (FGDC) has affirmed that NAVD88 shall be the official vertical reference datum for the U.S. The FGDC has prescribed that all surveying and mapping activities performed or financed by the Federal Government make every effort to begin an orderly transition to NAVD88, where practicable and feasible. Both tidal and non-tidal low water reference planes and datums are affected by the change to NAVD88. … Elevations of reference points/datums along the various inland waterway systems will also be impacted by the change in datums. … The transition to NAVD88 may have considerable impact on Corps projects, including maps, draw-ings, and other spatial data products representing those projects. However, once completed, the transition will result in a more accurate vertical reference datum that has removed leveling errors, accounts for subsidence, and other changes in elevation.”
The Technical Letter also contained specific actions that should be taken regarding the datum
conversion:

II-126 Volume II Geodetic Vertical and Water Level Datums This report is the independent opinion of the IPET and is not necessarily the official position of the U.S. Army Corps of Engineers.
• USACE commands should begin the orderly transition to NAVD88. Procedural guidance for performing this conversion is given in Appendix A [to the Technical Letter].
• The conversion to NAVD88 should be accomplished on a project-by-project basis. The relationship of all project datums to both NGVD29 and NAVD88 will be clearly noted on all drawings, charts, maps, and elevation data files.
• In accordance with Section 24 of WRDA 92, when elevations are referred to a tidal reference plane in coastal waters of the U.S., Mean Lower Low Water (MLLW) shall be used as the vertical datum. Tidal BMs should be tied to NAVD88 instead of NGVD29 where NAVD88 data is available. Tidal datums shall be established in accordance with the procedures outlined in EM 1110-2-1003.
• Other hydraulic-based reference planes established by USACE for the various inland waterways, reservoirs, and pools between control structures should continue to be used for consistency; however, they should also be connected with the NAVD88 where practicable and feasible.
• In project areas where local municipal or sanitary jurisdictions have established their own vertical reference planes, every attempt should be made to obtain the relationship between that local datum and NGVD29 and/or NAVD88; and clearly note this relationship on all drawings, charts, maps, and elevation data files.
A complete copy of this 1994 Technical Letter is included Technical Appendix 34 to this Volume. This ETL was subsequently incorporated into various engineering manuals—e.g., EM 1110-1-1004 and EM 1110-1-1005.
The redefinition of the geodetic datum from NGVD29 to NAVD88 in the early 1990s did not necessarily eliminate the misconception that a geodetic datum represented a local sea level surface. A typical example where NAVD88 is equated to MSL is contained in the 2005 ACSE-NSF Hurricane Katrina Levee Performance Report, as follows.
It should be noted that a number of different datums have been used as elevation references throughout the historic development of the New Orleans regional levee systems, and this situation is further complicated by ongoing subsidence in the region. This investigation has not yet had time to adequately resolve differences between different datums, so all elevations stated in this preliminary report should be regarded as somewhat approximate, and should be taken as referring approximately to elevation with respect to NAVD88 or “mean sea level” in the region. (ASCE-NSF Preliminary Report on the Performance of the New Orleans Levee Systems in Hurricane Katrina on August 29, 2005 dated 2 Nov 05, Section 1-4).
New Orleans District Policy Memorandum on Geodetic Datum Readjustments
In 1985 the New Orleans District issued the following proposed policy regarding periodic NGS readjustments to benchmark elevations. This particular memorandum (copied in entirety below) apparently was in response to changes or readjustments in benchmark elevations ca 1983, followed by another NGS elevation readjustment shortly thereafter. The (Lower) Mississippi Valley Division approved the proposed policy by First Endorsement on 19 Sept. 1985—see Technical Appendix 30 to this Volume (1985 New Orleans District Policy on NGS Benchmarks).

Volume II Geodetic Vertical and Water Level Datums II-127 This report is the independent opinion of the IPET and is not necessarily the official position of the U.S. Army Corps of Engineers.
LMNED-S 7 August 1985 SUBJECT: NGS Benchmarks TO: Commander, Lower Mississippi Valley Division ATTN: LMVED. 1. Reference is made to the following: a. LMNED letter 2 November 1984 to LMVED, subject supra. b. LMVED letter dated 5 March 1985 to RA John D. Bossler, subject: Adjustments to NGS Benchmarks. c. John D. Bossler letter to LMVD dated 29 March 1985 in response to reference b above. d. LMVED-TS letter dated 12 April 1985 to LMNED-S subject: Adjustments to NGS Benchmarks. e. LMVED letter dated 1 May 1985 to LMNED-S subject: Adjustments to NGS Benchmarks, and 1st End thereto. 2. In essence, it is the position of NGS as set forth in reference c above that the current (1983) benchmark elevations are correct, but that they cannot be used in conjunction with earlier values to derive estimates of subsidence which are necessarily valid even in order of magnitude. Thus we are left with a problem of setting project grades to provide the level of protection authorized. The problem is particularly acute on projects which are partially complete, in that, if we adopt the new benchmark elevations for construction without altering design flowlines, we ensure that those projects will provide inconsistent levels of protection; with the previously constructed portions offering lower levels of protection than those to be constructed in the future. At the same time, it would hardly be prudent, based on what we now know about benchmark elevations, to embark on a program of wholesale raising of previous construction to conform to the latest elevations. This is particularly true in situations in which design flowlines are primarily a function of discharge with tide level having little effect, and in tidal cases where increases in grade can only be achieved through demolition and reconstruction. 3. The problem extends as well to our stream gaging network since the gages which comprise that a network are ordinarily adjusted to conform to the latest information published by NGS. As an example, consider the Carrollton gage, which is typical of gages at and below New Orleans. It has been raised about 0.6 foot since 1952 (1983 data have not yet been applied) with the result that the reading of the staff now corresponds to a reading 0.6 foot lower on the 1952 staff. Application of the 1983 data would result in raising the staff another half-foot or a total increase of over 1 foot. 4. The problem is exacerbated by the information, recently received, that the 1983 data have been superseded by the results of releveling done in the New Orleans area at the request of local officials. New elevations for benchmarks in Jefferson, St. Bernard, Plaquemines, and Orleans Parishes have been published which, in most instances, represent significant upward revisions of the 1983 data. Additional results of the releveling are being processed and it seems reasonable to expect that they will reflect the same upward trends. The overall significance of these changes in the light of the repeated and ringing affirmations of confidence in the 1983 data which appear in NOAA’s letter of 29 March 1985 is not easy to assess, but it does further weaken the case for imputing, which any reasonable confidence, hard physical significance to the changes in benchmark elevations. Yet the data promulgated by NOAA, given their presumed primacy in deciding where the earth’s crust is in the vertical plane, cannot be ignored. 5. While the NGS program (cadastre) for evaluation subsidence may well produce data relevant to our problem (and for this reason alone, we would be well advised to support it) that program offers little if utility in the foreseeable future. Thus we must select a course of action without material assistance from NGS. 6. Despite the absence of firm implications to be drawn from changing benchmark data, we believe that a clearly defined policy should be derived concerning the use of benchmark data in our various activities. Accordingly, we propose the following actions:

II-128 Volume II Geodetic Vertical and Water Level Datums This report is the independent opinion of the IPET and is not necessarily the official position of the U.S. Army Corps of Engineers.
a. All gages will be set to conform to the latest available benchmark information published by NGS. Since both the gage information and the NGS data are widely disseminated, to do otherwise would be to court public confusion. b. Modification of projects which have been completed will not be considered. The level of precision in the current data, and the practical difficulty and cost of changing such projects combine to mandate this course of action at least for the foreseeable future. c. The main stem features of the MR&T project, such as MRL and Atchafalaya Basin, will be constructed utilizing the latest pre-1983 benchmark elevations. The grade requirements for these features are driven primarily by discharge and since subsidence presumably affects both bed and banks, required levee heights should be little affected by it. Thus, a shift to the new, lower benchmarks would result in the construction of levees higher than required to provide the authorization level of protection. There may be some problem with this approach at the lower (gulfward) ends of the system where tide becomes an increasingly important factor, and we plan to give that continuing consideration. d. Off-main stem projects of the MR&T which are under construction or will be constructed in the future will use the latest benchmark data published by NGS at the time construction is/was started. The need for revision will be considered as construction proceeds. e. All O&M dredging will use the latest available benchmark data published by NGS prior to the 1983 data. A change to the new data would mean that the depth of dredging in Southwest Pass, for example, would be lowered by about 1 foot. Given the perennial commotion by navigation interests, and considering the intensity of it this past year, such a course of action will be ill advised to say the least. f. Hurricane protection projects which are partially complete will use the NGS benchmarks current at the time of construction of the first increment of the project. To shift to the later NGS data without altering the heights of previously constructed portions would make “fuseplugs” of those portions and thus impose a gratuitous servitude on the lands and facilities they protect. And altering previously constructed works would not be practicable. g. New hurricane protection projects will be constructed using the latest available NGS benchmark data. h. We plan to respond affirmatively to NOAA’s invitation to participate in this “cadastre” program to better evaluate subsidence. Based on NOAA’s estimates, the total costs would be $2.0 million in the first year, $525 thousand in the second year, and $345 thousand annually thereafter. Our participation would be in the form of membership on technical study groups and providing data. We do not, at this time, anticipate providing any direct funding. 7. Approval of the course of action set forth in paragraph 6 is recommended. FOR THE COMMANDER; Chief, Engineering Division Encls
The above memorandum appears to spell out a policy for resetting water level gauges to agree with periodic NGS datum (NGVD29) readjustments. This might imply, in coastal areas, that the gauges are being adjusted to correspond to some water level reference.
More significantly, the policy memorandum recommends not updating navigation dredging datums with the new NGS readjustments. It also recommends that hurricane protection projects “use the NGS benchmarks current at the time of construction of the first increment of the proj-ect.” This might explain why some projects continued to use superseded benchmark elevations for design and construction. The rationale for such an approach is difficult to determine at this later point in time; however, it does appear to stem from some degree of exacerbation with the ever-changing NGS benchmark readjustments. The memorandum does note a need to get a better handle on evaluating subsidence in the region.

Volume II Geodetic Vertical and Water Level Datums II-129 This report is the independent opinion of the IPET and is not necessarily the official position of the U.S. Army Corps of Engineers.
The above 1985 policy was superseded by an updated New Orleans District policy letter dated 26 October 2000. This revised policy was endorsed by the Division by memorandum dated 31 January 2001—see memorandum in the Technical Appendix 30 to this Volume (1985 New Orleans District Policy on NGS Benchmarks). The new policy emphasized that the 1985 datum policy had become “untenable” and was “causing great confusion,” and that the District would henceforth focus efforts on updating to the new NAVD88 datum supplemented by CORS observations to monitor subsidence.
Subsequently, a 20 December 2002 “Vertical Datum Policy” memorandum was issued by the New Orleans District Engineering Division that stated all gauge and protection structure eleva-tions should be referenced to NAVD88. This memorandum emphasized that “assigned bench-mark elevations represent a ‘snapshot’ and may change on future contracts depending on benchmark movement … Engineers must use sound engineering judgment in employing the NAVD88 datum, recognizing that projects have already been designed and/or constructed using the NGVD29 datum against various epochs and that projects may require a significant number of years from conception to completion, and therefore allowances must be made for vertical move-ment.” The subsequent implementation of a time-dependent vertical datum concept in October 2005 further reinforces this District policy.
Since the early 2000s, the New Orleans District’s Engineering Division was actively involved with, and contributed funding to, the NGS and the Louisiana Spatial Reference Center (LSRC) in varied efforts to update the vertical control datum in Southeast Louisiana.
These events are further detailed in the following section.
Historical Event Timeline on Use of Geodetic Vertical Datums in New Orleans District
1929 – The United States uses MSL at 26 tide station locations around the country, including the gulf coast, to establish the SLD29.
1956 – Corps asks the USC&GS (now NGS) about their changing of benchmark elevations in New Orleans. (See Technical Appendix 40)
1958 – USC&GS, now NGS, notifies the Corps of subsidence and vertical datum problems in New Orleans, noting there has been almost 3 ft of subsidence in the Houston-Galveston area and that no benchmark be trusted to be absolutely stable due to changes in the Earth’s crust. (See Technical Appendix 40)
1973 – The United States renames its SLD29 to NGVD29, noting that is was a close approx-imation of MSL in 1929 near the 26 tide stations held fixed, but no longer due to subsidence and other factors. “In order to avoid such apparent confusion and the costly errors that may result through failure to consider local sea level when engi-neering projects are undertaken, it is proposed to change the present name of the vertical control datum from the “Sea Level Datum of 1929” to the “National Geodetic Vertical Datum of 1929.” (See Technical Appendix 40)
1978 – Corps HQ in Washington issues new technical guidance (ETL 1110-1-97) to all its field offices on the change in name of the National Vertical Control Network

II-130 Volume II Geodetic Vertical and Water Level Datums This report is the independent opinion of the IPET and is not necessarily the official position of the U.S. Army Corps of Engineers.
(NVCN), noting: “Elevations of some stations are not necessarily based on local mean sea level and this may vary from one location to another.” (See Technical Appendix 40)
1979 – Corps MVD forwards HQ’s ETL 1110-1-97 to its four districts. (See Technical Appendix 40)
1981 – Corps MVD memo from Engineering to Planning on subsidence of Coastal Louisiana, including settlement of benchmarks. (See Technical Appendix 40)
1984 April – NGS and Corps meet to discuss subsidence and vertical datum problems in New Orleans. Projects impacted included drainage canals and navigation, and scenarios discussed included the fact that datum changes would accentuate the need for replace-ment or modification of projects. It was also noted that if a steady but relatively slow settlement continues, development within the protected area will continue and we will continue to raise the protective system to protect the improvements. (See Technical Appendix 40)
1984 November – Corps New Orleans District sends memo to MVD asking for meeting with NGS to discuss use of new benchmark elevations. (See Technical Appendix 40)
1984 November – NOAA/NGS briefs Corps New Orleans District and the Greater New Orleans Planning Council on a subsidence monitoring plan similar to the Houston-Galveston, TX plan. (See Technical Appendix 40)
1985 March 5 – Corps MVD letter to NOAA/NGS notes that their 1983 adjustments to benchmark elevation would have significant implications for a number of Corps flood control and hurricane protection projects in southern Louisiana. The top elevation of some Corps facilities would be down over 1 ft in only 20 years. MVD asks NOAA/ NGS to provide information on their level of confidence in their 1983 adjusted benchmark elevations “before we begin using this new elevation data in current projects and before initiating any modifications to existing facilities.” (See Technical Appendix 40)
1985 March 29 - NOAA/NGS responds to MVD that they have a very high level of confi-dence in their 1983 adjustment in the gulf coast area. They refer to the November 1984 meeting in New Orleans and their offer to establish a subsidence monitoring geocadastre in southern Louisiana. (See Technical Appendix 40)
1985 April – Corps MVD provides NOAA/NGS letter to New Orleans District. (See Technical Appendix 40)
1985 May 1 – Corps MVD, referencing the NOAA/NGS letter on regional subsidence and its potential significant consequences on projects in New Orleans District, requests the New Orleans District to reexamine the information in the NOAA/NGS letter, to con-sult further with the NOAA/NGS staff and to “propose a course of action for incor-porating the changes in elevation into your projects and studies and for defining in a

Volume II Geodetic Vertical and Water Level Datums II-131 This report is the independent opinion of the IPET and is not necessarily the official position of the U.S. Army Corps of Engineers.
more reliable manner the subsidence of the area. Your action plan should include a schedule and cost estimate.” (See Technical Appendix 40)
1985 May 24 – Corps New Orleans District responds to MVD that the Regional Planning Commission representing Jefferson, Orleans, St. Bernard, and St. Tammany Parishes met with NOAA/NGS and are contributing funds for resurveys and that the District is planning to meet with NOAA on 12 June 1985 to discuss a more reliable network to predict subsidence. (See Technical Appendix 40)
1985 August 7 – Corps New Orleans District recommends to MVD that (See Technical Appendix 40):
• All gauges to be changed to conform to latest NGS elevations, to do otherwise would be to court pubic confusion.
• Modification of completed projects will not be considered. The level of precision of the current data and the practical difficulty and cost of changes mandate this for the foreseeable future.
• The main stem features of the MR&T project will be constructed using latest pre-1983 benchmark elevations.
• Off-main stem features of the MR&T will use latest NGS values at the time the con-struction is/was started. Revisions during construction will be considered.
• All O&M dredging will use pre-1983 data. A change to the new data would mean that the depth of dredging in Southwest Pass, for example, would be about 1 ft less. Given the perennial controversy by navigation interests, and considering the intensity of it this past year, such a course of action would be ill advised.
• Hurricane protection projects which are partially complete will use the NGS eleva-tions current at the time of construction of the first increment of the project. To shift to the later NGS data without altering the heights of previously constructed portions would make “fuseplugs” of those portions and thus impose a gratuitous servitude on the lands and facilities they protect. And altering previously constructed works would not be practicable.
• New hurricane protection projects will be constructed using the latest NGS data. • We plan to respond affirmatively to NOAA’s invitation to participate in this cadastre
program to better evaluate subsidence, by membership on the study group. We do not anticipate providing any funding to study subsidence.
1985 September – MVD approves District recommendations with caveats such as “Consider-
ation should be given to reanalyzing and modifying (if needed) hurricane protection work in high density urban areas where the datum changes will drastically reduce the level of protection.” (See Technical Appendix 40)
1986 March – Corps HQ memo on “Relative Sea Level Change” discussing “allowance in project design.” (See Technical Appendix 40)
1986 April – Corps MVD forwards HQ memo to Vicksburg and New Orleans Districts. (See Technical Appendix 40)

II-132 Volume II Geodetic Vertical and Water Level Datums This report is the independent opinion of the IPET and is not necessarily the official position of the U.S. Army Corps of Engineers.
1986 August – Internal New Orleans District note concerning how to adjust gauge readings over time to compensate for changes (subsidence). (See Technical Appendix 40)
1986 September – Internal New Orleans District memo on how to deal with benchmark changes and their impacts on project operations, such as floodgates, in manuals. (See Technical Appendix 40)
1987 – Internal New Orleans District memo on a suggested rational for inclusion of an extra foot of freeboard in the WBHP levees as an allowance for future change in apparent sea level. This referred to the Reevaluation Study for Lake Pontchartrain. It was noted that “subsidence rates in some parts of the project area of as much as 2.0 – 2.5 feet per century have been observed.” (See Technical Appendix 40)
1993 April – Corps HQ Engineer Technical Letter No. 1110-2-349, Requirements and Procedures for Referencing Coastal Navigation Projects to Mean Lower Low Water (MLLW) Datum, which implemented Section 224 of the Water Resources Develop-ment Act of 1992 requiring Corps coastal navigation projects to be referred to the same datum used by NOAA. (See Technical Appendix 38)
1993 June – Federal Register Notice of Change of Vertical Datum to the North American Vertical Datum of 1988 (NAVD88) as the official datum for all surveying and map-ping activities performed or financed by the federal government. (See Technical Appendix 40)
1993 August – Orleans Levee District requests the New Orleans District to make a datum adjustment as the “flood protection for the Orleans Canal is higher than that for the London Canal. This appears to be an intolerable situation. Please adjust as may be required so as to provide maximum protection for both canals.” (See Technical Appendix 40)
1994 January – Corps HQ issues new technical guidance (ETL 1110-1-152) to all its field offices on the national conversion to the new NAVD88 noting there will be consider-able impact on Corps projects, but it will result in a more accurate reference to account for subsidence, among other things. Specific guidance was provided on the National Flood Insurance Program, coastal flooding, use of LMSL, mixing the old and new datum and use of stable benchmarks in subsidence areas. (See Technical Appendix 34)
2000 October – New Orleans District proposes to the MVD that they abandon their 1985 policy to rely on the old datum, noting that “most assuredly we have witnessed continued subsidence” and that “it is becoming increasingly untenable to maintain the existing (1985) policy.” They proposed using the NAVD88 datum and the GPS and to cooperate with state and other federal agencies working in the area. (See Technical Appendix 40)
2001 January – MVD concurs with the New Orleans District proposal to use NAVD88, including hurricane protection projects under construction or to be constructed in the future. They also noted that they should begin evaluation of completed projects to

Volume II Geodetic Vertical and Water Level Datums II-133 This report is the independent opinion of the IPET and is not necessarily the official position of the U.S. Army Corps of Engineers.
determine whether or not modifications are necessary to achieve authorized levels of protection. They also asked for semi-annual status reports showing, among other things, subsidence rates. (See Technical Appendix 40)
2002 April – New Orleans District, Engineering Division Chief notifies all his Branch Chiefs that NAVD88 will be used and that the Survey Section will provide the most current elevations of benchmarks. It was also noted the GPS would be used to update eleva-tions of benchmarks and to predict future subsidence. (See Technical Appendix 40)
2002 December – New Orleans District, Engineering Division Chief notifies all his Branch Chiefs, Section Chiefs, Functional Team Leaders, and Technical Managers that NAVD88 will be used for water level gauges, engineering studies, designs and con-struction documents and for reporting of all levels of protection.. He also noted that the Survey Section will review all field surveying efforts to insure this policy is followed and that it is a responsibility of the design engineers to assure the correct values are used. He also noted that these elevations were snapshots and may change in the future based on benchmark movement and that allowances must be made for vertical movement. (See Technical Appendix 40)
2002 to Present – New Orleans District worked with and contributed funding to NGS and the LSRC to help solve the problem. District Chiefs of Engineering, Gerry Satterlee and Walter Baumy, were members of the LSRC’s steering committee. They worked with the LSRC to recruit key participants from Louisiana Department of Natural Resources and Louisiana Department of Transportation to unify the major players in the state for flood control and coastal restoration purposes. A report by NGS (NGS 2004) identified the existing vertical control system as unreliable and specified the need for action. Regarding the Lake Pontchartrain project, there was a need to reassess the system and the District plan was to start that effort when vertical control was established. Funding levels were insufficient to complete construction at existing holes in the system that were crucial to flood protection for the New Orleans East Bank and levees in St. Bernard - New Orleans East. Hence levees were below design grade in quite a few areas and the outfall canals (London and Orleans) lacked fronting protection. The fronting protection was critical to stability of the pump stations and for preventing backflow through the large diameter pumps. This is evidenced by the Plans and Specifications (P&S) that were on the shelf and awaiting funds. A report issued by NGS and the LSRC in 2005 clearly identified the problem and formed the framework for the IPET solution. (Information provided by Walter Baumy in an e-mail of 11 April 2006).
2006 May – ERP Progress Report (See 1 May 2006 letter from ASCE to LTG Strock):
• There was a lack of consistency with existing agency guidance documents that address the critical need for carefully monitoring the geodetic and water surface elevation in the New Orleans area.
• The use of older geodetic elevation data and unsupported assumptions regarding MSL elevations have apparently led to significant reductions in design protection level expectations.

II-134 Volume II Geodetic Vertical and Water Level Datums This report is the independent opinion of the IPET and is not necessarily the official position of the U.S. Army Corps of Engineers.
• The IPET 60 percent draft report offers a comprehensive set of recommendations to correct the problems identified. Such guidance should be reflected in a new USACE manual on maintaining geodetic and water level datums in areas of high subsidence.
• The role proposed for NOAA and the necessary coordination with other agencies require a lasting commitment.
• Given the design guidance documents already in place, there is a clear need for stronger commitment to consistent use of existing policies and procedures than has been the case in the past.

Volume II Geodetic Vertical and Water Level Datums II-135 This report is the independent opinion of the IPET and is not necessarily the official position of the U.S. Army Corps of Engineers.
Field Topographic Survey Support to Other IPET Teams
This section summarizes topographic survey support performed by IPET field survey crews in support of hydrodynamic, physical, and interior drainage modeling requirements needed by other IPET study teams. Approximately 75 percent of this (GVWLDT) team’s field survey work involved support to other IPET Teams. These surveys were performed concurrent with the pri-mary geodetic control surveys connecting NOAA NWLON gauges. Field survey operations began in early December 2005 and were completed by the end of March 2006. Surveys were performed throughout the entire study area: Orleans, St. Bernard, Plaquemines, St. Charles, and Jefferson Parishes.
Field survey operations were performed by 3001, Inc.—a Louisiana based surveying com-pany. This firm was under an Indefinite Delivery Contract to St. Louis District (MVS). St. Louis District awarded a labor-hour type task order to 3001, Inc. on 5 December 2005. IPET team members Bill Bergen (HQUSACE) and Jeff Navaille (Jacksonville District) arrived in New Orleans on 4 December 2005 and began working out of the New Orleans District Office. Initial efforts involved controlling pump stations, high water mark (HWM) locations, and NOAA NWLON tidal gauge sites, which included setting benchmarks for subsequent GPS connections to the NGS NAVD88 (2004.65) reference network. A scope of work for this initial effort was drafted on 10 December 2005—a copy of this scope is included in Technical Appendix 37 to this Volume (IPET Supplemental Survey Scope of Work-10 December 2005). Subsequent to this initial scope, additional survey support was continuously requested over the next 4 months by IPET teams. This 10 December 2005 scope was supplemented with these additional requests on an almost daily basis. The first 3001, Inc. survey crew arrived in New Orleans on 11 December 2005 and began static GPS surveys for benchmarks at pump stations and priority HWM sites. Three 3001, Inc. survey crews were fully operating by 14 December 2005 and continued work-ing on the various tasks outlined below through 23 December 2005. Survey operations resumed on 3 January 2006 and continued through the end of March with some additional water level gauge connections being performed into April and May 2006.
The following list summarizes various field survey projects performed from 5 December 2005 through April 2006. Data collected on these projects is assembled in the technical appen-dices to this Volume, with the Technical Appendix number shown in brackets. The supported IPET model is shown in parenthesis. Original survey data are held in the IPET repository at ERDC and/or the New Orleans District.
• High Water Mark Surveys: Leveling to approximately 50 HWM points plus 2,000 ft of levee profile surveys along a 5-mile levee in St. Bernard Parish (Numerical Storm Surge Models) [13]
• High Water Mark Surveys: Interior Orleans Parish—levels to various residential loca-tions (Numerical Storm Surge Models) [10]
• High Water Mark Surveys: Plaquemines Parish—levels to various locations (Numerical Storm Surge Models) [12]
• Surge Elevation Surveys: Orleans Marina and Lakefront Airport—levels to time-stamped Katrina storm surge points (Numerical Storm Surge Models) [16 and 17]—e.g., Figure 67

II-136 Volume II Geodetic Vertical and Water Level Datums This report is the independent opinion of the IPET and is not necessarily the official position of the U.S. Army Corps of Engineers.
• Bridge Surveys: Low-chord elevation and obstruction surveys (Numerical Storm Surge Models) [6, 7, 8, 9, and 21]—e.g., Figures 64 and 66 Orleans Outfall Canal: four auto bridges London Ave Canal: one RR bridge and six auto bridges IHNC: three RR bridges 17th St Canal: five auto bridges
• Pump Station Control Surveys: Approximately 69 pump station first floor elevations throughout Orleans, Jefferson, St. Bernard, and Plaquemines Parishes (Pump Station Performance Assessment) [24, 25, 26, 27, and 28]—Figure 65
• Pump Station Control Surveys: Five pump station first floor elevations in St. Charles Parish (Pump Station Performance Assessment) [29]
• Lake Pontchartrain Water Level Gauge GPS Surveys: Tie in reference marks on eight USGS, NWS, and Levee Board gauges in the vicinity of Lake Pontchartrain and the IHNC(Numerical Storm Surge Models) [15]
• IHNC West Bank Levee Profile Surveys: SeaLand/Maersk Private Levee (Numerical Storm Surge Models) [4 and 11]
• IHNC West Bank Breach Area Topographic Surveys: Florida Ave to I-10 Bridge (Interior Drainage Modeling) [14]
• Ground Truthing/Calibration Surveys of Low-Altitude 2000/2005 LIDAR DEMs: (Various hydrodynamic models) [various]
• Ground Truthing/Calibration of High-Altitude JALBTCX 2005 LIDAR: North shore of Lake Pontchartrain (Various hydrodynamic models) [1]
• Ground Truthing/Calibration of High-Altitude FEMA/LSU LIDAR: Selected side shot calibration points throughout region (Various hydrodynamic models) [various]
• Hydrographic and Topographic Canal Cross Sections: Selected sites in Jefferson and Orleans Parishes (Interior Drainage Model) [18, 19, and 20]
• Levee/Floodwall Overbank Cross Sections: London Avenue, 17th Street, and IHNC Breach Sites: (Physical Model of Breaches and Floodwall Performance Analysis) [various]
• Interior Drainage Topographic Sections: Approximately 85 cross sections at selected locations throughout St. Bernard Parish (Interior Drainage Support) [3]
• Invert Elevations: London and Orleans Outfall Canal pump stations (Numerical Storm Surge Models) [25, 26, 27, 28, and 29]
• TBM Descriptions: Stable and recoverable marks to be documented and described in accordance with New Orleans District procedures (MVN/Task Force Guardian) [23]
• Orleans Outfall Canal BM ALCO to CHRYSLER Level Run [22]
• IHNC Hydrographic Multibeam Survey: Seabrook Bridge to GIWW and GIWW to Mississippi River (Storm Surge/Wave Hydrodynamics) [not included]

Volume II Geodetic Vertical and Water Level Datums II-137 This report is the independent opinion of the IPET and is not necessarily the official position of the U.S. Army Corps of Engineers.
• High Water Mark Surveys: Orleans Parish vicinity Ninth Ward—levels to various locations (Numerical Storm Surge Models) [11]
• Cross-section surveys of railroads, culverts, etc: East Orleans Parish (Interior Drainage Models) [5].
Field Survey Procedures and Specifications
All field surveys for supplemental topographic work were performed following established Corps and NOAA standards and specifications.
Static GPS surveys were performed to set permanent or temporary benchmarks throughout the five-parish area. Supplemental topographic surveys were performed from these benchmarks to HWMs, pump stations, floodwalls, etc. Over 100 benchmarks have been established to date.
These static GPS surveys were rigorously connected to the NGS approved NAVD88 (2004.65) network. Procedural GPS survey methods followed (and actually exceeded) the guidelines in the following NOAA publications:
• NOAA 1997. NOAA Technical Memorandum NOS NGS-58, Zilkoski, D’Onofrio, and Frankes. (Nov. 1997) “Guidelines for Establishing GPS-Derived Ellipsoid Heights (Standards: 2 cm and 5 cm),” Version 4.1.3. Silver Spring, Maryland.
• NOAA 2005. “Guidelines for Establishing GPS Derived Orthometric Heights (Standards: 2 cm and 5 cm)” version 1.4, NGS (2005 Draft).
Procedural specifications applicable to topographic engineering and construction surveys included:
• EM 1110-1-1003 NAVSTAR Global Positioning System Surveying
• EM 1110-1-1005 Control and Topographic Surveying (1 January 2006 Draft).
The above guidance documents also contain the accuracy standards required for hydraulic modeling type surveys involved on these projects. In general, required vertical accuracy tolerances were ± 0.1 ft. Horizontal accuracy varied depending on the nature of the survey—e.g., HWM horizontal locations are not as critical as floodwall cap locations.
• Topographic surveys were performed using all of the following methods and equipment:
• Conventional differential leveling (spirit/compensator/digital levels)
• Electronic total stations
• Static differential GPS surveys
• GPS real-time kinematic (RTK) methods.
Field survey data were collected in a standard bound survey book and/or on an electronic data collector attached to or part of a total station or RTK survey system. Digital images were taken for HWM and pump station first floor elevation shots—e.g., Figure 63.
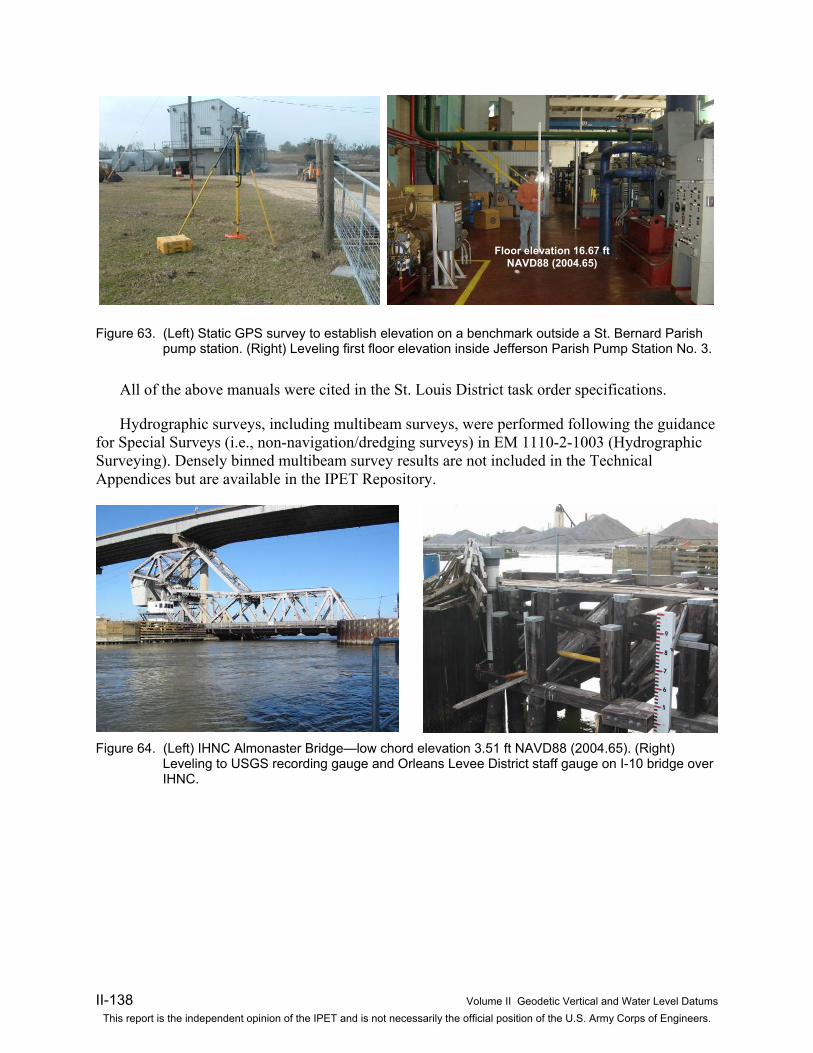
II-138 Volume II Geodetic Vertical and Water Level Datums This report is the independent opinion of the IPET and is not necessarily the official position of the U.S. Army Corps of Engineers.
Figure 63. (Left) Static GPS survey to establish elevation on a benchmark outside a St. Bernard Parish pump station. (Right) Leveling first floor elevation inside Jefferson Parish Pump Station No. 3.
All of the above manuals were cited in the St. Louis District task order specifications.
Hydrographic surveys, including multibeam surveys, were performed following the guidance for Special Surveys (i.e., non-navigation/dredging surveys) in EM 1110-2-1003 (Hydrographic Surveying). Densely binned multibeam survey results are not included in the Technical Appendices but are available in the IPET Repository.
Figure 64. (Left) IHNC Almonaster Bridge—low chord elevation 3.51 ft NAVD88 (2004.65). (Right) Leveling to USGS recording gauge and Orleans Levee District staff gauge on I-10 bridge over IHNC.
Floor elevation 16.67 ft NAVD88 (2004.65)

Volume II Geodetic Vertical and Water Level Datums II-139 This report is the independent opinion of the IPET and is not necessarily the official position of the U.S. Army Corps of Engineers.
Figure 65. General map depicting locations of pump stations surveyed by IPET/3001, Inc. in the five-parish area.

II-140 Volume II Geodetic Vertical and Water Level Datums This report is the independent opinion of the IPET and is not necessarily the official position of the U.S. Army Corps of Engineers.
Figure 66. Typical low chord measurement—London Avenue Canal Bridge No 4 (IPET/3001, Inc.).
Figure 67. Surge and high water mark elevations at Orleans Marina (17th Street Canal) (IPET/3001, Inc.).
High Water Mark SurveysHigh Water Mark SurveysJefferson, Orleans and St Bernard ParishesJefferson, Orleans and St Bernard Parishes(IPET (IPET Support to Support to CHLCHL / MVN / TF Guardian)/ MVN / TF Guardian)
11.91 ft 11:00 AM 29 Aug 05
5.61 ft 6:00 AM 29 Aug 055.06 ft 4:00 AM 29 Aug 05
3.73 ft 3:00? AM 29 Aug 052.97 ft 1:30 AM 29 Aug 05
Orleans Marina (17th St Canal) Local Observer’s Logged Water Surface Estimates

Volume II Geodetic Vertical and Water Level Datums II-141 This report is the independent opinion of the IPET and is not necessarily the official position of the U.S. Army Corps of Engineers.
Data Processing and Submittal
The contractor processed and reduced all survey data to a submittal format consistent with EM 1110-1-1005 and New Orleans District standards. GPS baselines were reduced and networks adjusted using standard commercial off-the-shelf (COTS) software packages — e.g., Trimble Geomatics Office. Data submittals were posted on an ERDC ftp site for transfer to the requesting IPET team.
All data submittals contain supplemental metadata records that are compliant with the Federal Geographic Data Committee Standard “Content Standard for Digital Geospatial Metadata,” FGDC-STD-001-1998.
Quality Control and Quality Assurance Procedures
The survey contractor (3001, Inc.) was responsible for performing quality control over all work performed, in accordance with the Quality Control Plan submitted on award of the basic Indefinite Delivery Contract. Many of the specifications listed above provide forms of quality control by requiring specific observing schemes, redundant observations, connection checks between control points, closed loop level lines, periodic RTK calibration checks, level peg tests, etc. The contractor was expected to perform additional quality control checks during data processing and prior to submittal.
Quality assurance checks were performed by both the contractor and government (IPET sur-vey team). GPS observations establishing supplemental vertical control points were checked by running independent solutions from NOAA CORS stations distant from the NAVD88 (2004.65) project network. This afforded a blunder check on all points. The government performed spot checks on data submittals, including reality checks by modelers receiving the data.
A few isolated survey data errors or blunders were found by both the contractor and govern-ment, indicating a quality control/assurance process was in place.
Methodology for Converting Previous Vertical Datums/Adjustments to NAVD88 (2004.65)
The methodology used to shift historical survey data to NAVD88 (2004.65) will vary depen-dent upon many factors such as time, funds, accuracy requirements, etc. Generally there are four methods to determine the datum/epoch shift.
a. Field Measurements with Known Historical Elevation: This method will yield the most accurate values based on the historical reference marks. The reference marks will need to be recovered and occupied/surveyed using the guidelines in NGS 58 (NOAA 1997). The difference between the elevation used for the original survey and the elevation estab-lished from the new network will directly tie in the old work to the latest control. This will not account for any differential subsidence that occurred between the reference mark and the survey positions.
b. Field Measurements without Known Historical Elevation: When the reference benchmark is not recorded and unknown, some assumptions will be required such as what mark was used and what its elevation was. Again follow the procedures in NGS 58 (NOAA 1997)

II-142 Volume II Geodetic Vertical and Water Level Datums This report is the independent opinion of the IPET and is not necessarily the official position of the U.S. Army Corps of Engineers.
to establish new elevations on the reference mark. The historical elevation will have to be assumed based on what was available at the time of design. The difference between the assumed historical elevation and the newly established elevation will be used to shift the survey to the new datum/epoch.
c. Common Published Marks in Survey Area: When time and money are constraints, the closest marks with published elevations in both datum/epochs can be used to determine an average shift for the area. This method contains many assumptions and, therefore, is the least accurate but may be of some use for projects that do not require high accuracy.
d. CORPSCON: This method does not account for subsidence or the change in elevation from epoch to epoch. CORPSCON model was also tied to the published elevations at the time the model was created which contained errors associated with the already deterior-ating elevation accuracies. This method should not be used for anything other that a pure datum shift keeping in mind that subsidence is not accounted for.
Figure 68 shows the changes in the elevation values at Benchmark ALCO 1931 from 1952 until present including an elevation of LMSL in 2005. The changes in elevation are due to vari-ous adjustments on the datums and a datum shift (between NGVD29 and NAVD88). Additional examples for other benchmarks are shown in Technical Appendix 41.
LMSL (1983-1992 &
2005)
NA
VD88 (02/14/94)
NG
VD29 (05/21/91)
NA
VD88 (2004.65)
7.375 ft6.869 ft
7.621 ft
6.53 ft
[not to scale]
6.57 ft
6.14 ft5.89 ft
6.76 ft
The changes in the above values point out the problem of errors in various adjustments on the datum(s) and not a direct solution to it.
Source: NOAA (NGS and CO-OPS)
Published
Elevation
Changes in the Published Heights (Elevations) for
Benchmark “ALCO 1931” (PID: BJ1342)
NA
VD88 (VertC
on)
NG
VD29 (1987) A
dj. D
ate: 30Jan1986
NG
VD29 (1964)
pub. 09Apr1965
NG
VD29 (1951)
pub. 10Oct1957
NA
VD88 (12/05/96)
6.59 ft
8.235 ft
NG
VD29 (1951)
pub. 19Mar1952
NG
VD29 (1982)
pub. Jan 1984
6.955 ft
Figure 68. Elevation changes at Benchmark ALCO 1931 since 1951.

Volume II Geodetic Vertical and Water Level Datums II-143 This report is the independent opinion of the IPET and is not necessarily the official position of the U.S. Army Corps of Engineers.
Summary of Findings and Lessons Learned
This section summarizes the findings and lessons learned from this portion of the IPET study. For each finding a lesson learned is provided.
High-Resolution Hydrodynamic Model Relationships to Geodetic and Sea Level Datums
Finding: Geodetic vertical datums have varying biases from hydraulic surfaces that were not well-correlated in the New Orleans region. High-resolution hydrodynamic model surge eleva-tions were dependent on topographic and bathymetric data sources on varying geodetic and hydraulic datum definitions. This can impact the accuracy and reliability of calculated surge elevations, and resultant flood inundation elevations used in interior drainage flooding and first-floor elevation levels.
Lesson Learned: All government agencies, including USACE, NOAA, FEMA, USGS and other state and local, need to be consistent in the use of geodetic and water level surfaces in coastal regions. An IPET follow-on study by intergovernmental teams is needed to refine the relationships between the various datums that are numerically compatible with the varied hydraulic, hydrodynamic, geodetic, and flood inundation models such as those used by FEMA.
Mean Low Gulf Datum Conversion to Mean Lower Low Water Datum
Finding: New Orleans District project design, construction, operations and maintenance activities still maintain elevation references to Mean Low Gulf Datum despite HQUSACE direc-tives in 1993 to convert to MLLW datum, in accordance with the provisions of Section 224 of the Water Resources Development Act of 1992.
Lesson Learned: Implement the guidance contained in ETL 1110-2-349 (Requirements and Procedures for Referencing Coastal Navigation Projects to MLLW datum) dated 1 April 1993. This action needs to include solidifying the MLLW datum relationships to the LWRP at the Head of Passes.
Dual Elevations on Flood Control and Hurricane Protection Structures
Finding: The geodetic vertical datum was assumed to be equal to LMSL. Design and con-struction documents referenced both geodetic datums (e.g., NGVD29) and water level datums (e.g., MSL) without defining the geographical relationships, numerical differences, observation epochs, or other significant metadata associated with these datums.
Lesson Learned: Planning, design, construction, and operation and maintenance inspection documents containing elevation data on flood control structures needs to show both geodetic and water surface referenced elevations. The relative water surface reference datum (i.e., LMSL) is used as the baseline for hydraulic modeling and related levee height design computations. The terrestrial geodetic datum typically used by surveyors for construction stakeout and subsequent periodic subsidence modeling must be corrected to be relative to the local water datum. The base gauge with its correction to NAVD88 defining a water level datum must be clearly defined, along with applicable tidal or river stage epochs, and conversion parameters to relate water level datums to the local geodetic datum.

II-144 Volume II Geodetic Vertical and Water Level Datums This report is the independent opinion of the IPET and is not necessarily the official position of the U.S. Army Corps of Engineers.
Geospatial Data Source Feature or Metadata Records
Finding: Design and construction documents seldom identified the source of hydrographic, topographic, or construction survey records, including water level gauge records. Field survey book records and reduced data collector files were also found to be lacking essential metadata indexing and archiving.
Lesson Learned: Planning, design, and construction documents containing survey informa-tion needs to contain detailed source (i.e., metadata) information on geospatial coordinates or terrain models included in those documents. This would include the location and repository for the original source data, field book numbers, monument descriptions, etc. Geospatial metadata incorporated in basic documents such as field survey books need to have sufficient detail such that there is no uncertainty (currently or in the future) as to the purpose and scope of the data, its origin, and other temporal relationships.
Epoch Designations of Published Topographic Elevations
Finding: Design and construction documents seldom identified the epoch associated with a particular datum. This is critical in a high subsidence area where apparent sea level rise (i.e., combined sea level rise with subsidence) does have significant changes over a relatively short period.
Lesson Learned: Reported elevations of surface topography, subsurface bathymetry, and/or constructed structures in high subsidence areas need to contain feature (metadata) information on the source datum and applicable adjustment epoch date. This applies to both geodetic elevations (e.g., 12.34 ft NAVD88 (2004.65)) and water level based elevations (e.g., -5.25 ft LMSL (2001-2005) or 35.0 ft MLLW (1983-2001) or 12.3 ft LWRP (1974)). Hard copy or CADD data files should place this metadata information in the General Notes on the first sheet or digital file of a series, with appropriate references on subsequent sheets/files that depict topographic information and source files names and locations.
Future Updates to Geodetic Elevations in Southeast Louisiana Region
Finding: Geodetic elevations are extremely time-dependent in this region and must be peri-odically adjusted to account for apparent sea level changes.
Lesson Learned: The current (2004.65) adjustment to the “vertical time-dependent” (VTDP) NAVD88 network for the Southeast Louisiana area should be periodically reviewed for subsi-dence relative to the nationwide spatial reference system. This review should be performed by the NGS using CORS observations and other applicable geodetic leveling sources. When peri-odic reviews by NGS indicates average elevation changes in the VTDP network exceed 0.13 ft (4 cm), then actions need to be taken to revise and update the time-stamped NAVD88 VTDP network for this region. This update should be performed at least every 5 years regardless of ele-vation changes. NGS must closely coordinate subsequent updates with the Corps and other fed-eral, state, parish, levee board, and local agencies, to ensure that engineers and others responsible for the planning, design, and construction of flood control and hurricane protection structures are made aware of the revised adjustments and make appropriate engineering corrections and deci-sions based on these updates. These subsequent adjustments must also be closely coordinated

Volume II Geodetic Vertical and Water Level Datums II-145 This report is the independent opinion of the IPET and is not necessarily the official position of the U.S. Army Corps of Engineers.
within NOAA to ensure CO-OPS water level datum references are appropriately revised with respect to any geodetic datum revisions. The New Orleans District needs to expand its partner-ship with the NGS towards the densification of the CORS network in the Southeast Louisiana region. USACE project control needs to be referenced to the latest CORS network adjustment. The periodic inspection (PICES) program needs to incorporate scheduling to include new GPS elevation surveys of structure monumentation relative to the latest network adjustment. The intervals will be determined based on the measured rate of subsidence and the accuracy toler-ance. When the predicted elevation change is greater than half the tolerance, new surveys would be necessary to update the local structure control. NGS needs to provide updated elevations based on the CORS network. Given that the current adjustment is based on historical leveling and was best fit to GPS observations, a comprehensive network of new CORS stations and geodetic leveling is required to validate NAVD88 (20XX) elevations relative to stable bench-marks outside the region. This level network will also be used to better define/validate the geoid model. The geoid model for the Southeast Louisiana region needs to be periodically updated by NGS as additional information is received.
Co-located CORS and NWLON Sites for Subsidence Monitoring
Finding: There is an insufficient density of subsidence and water level monitoring points to adequately evaluate current elevations of flood control and hurricane protection structures.
Lesson Learned: Subsidence and water level monitoring instrumentation at the following sites in Southeast Louisiana are needed. These sites will be used to monitor future land subsi-dence, reference water level datums, and the relationship between geodetic and water level datums; as required to assess and update protection elevations of flood control structures throughout the region. Each site needs to contain complete NOAA quality CORS GPS and NWLON gauge instrumentation. Following are some suggested locations for future sites. This is subject to a more detailed study by NOAA.
1. Lake Pontchartrain (East end—The Rigolets area) 2. IHNC (Corps of Engineers Lock—existing gauge site) 3. GIWW-MRGO (Michoud Substation area) 4. Lake Borgne (New Shell Beach area) 5. Venice, LA (New Orleans District Project Office) 6. Mississippi River (Carrollton gauge site-New Orleans District Office)
New Orleans District Water Level Gauges
Finding: New Orleans District water level gauges are tied to local benchmarks and are not on a consistent geodetic vertical datum.
Lesson Learned: To provide additional surface modeling coverage in the Region, New Orleans District gauges (and possibly those maintained by the USGS, NWS, Levee Boards, and others) needs to be connected and referenced to the latest geodetic vertical datum and epoch pub-lished by NOAA. New Orleans District, working jointly with NOAA, needs to modify District-owned gauges to meet NOAA NWLON specifications and include these gauges in a local Southeast Louisiana NWLON. This will require long-term technology and NWLON partnering

II-146 Volume II Geodetic Vertical and Water Level Datums This report is the independent opinion of the IPET and is not necessarily the official position of the U.S. Army Corps of Engineers.
support with the New Orleans District. The New Orleans District will have to perform gauge inspections and adjustments in accordance with NOAA recommendations for engineering applications. Approximately 20 gauges are candidates for inclusion in the NWLON--the exact number would have to be evaluated by New Orleans District and NOAA.
Local Mean Sea Level Epoch Updates and Relationships
Finding: The standard 19-year NTDE update to LMSL computations is too long an interval in this high-subsidence area.
Lesson Learned: LMSL epochs need to be periodically updated by NOAA in order to moni-tor subsidence and/or apparent sea level rise at NWLON and other gauge sites. Stations in the region need to be evaluated based on sea level trend analysis and, where appropriate, 5-year tidal datums and apparent sea level rise should be computed and reevaluated yearly. NOAA needs to perform these periodic evaluations in close coordination with New Orleans District. The New Orleans District needs to conduct gauge inspections on non-NWLON gauges on an annual basis, in close coordination with NOAA reevaluations and updates. NOAA needs to develop and publish an operating manual specific to the process of maintaining water level datums in this southeast Louisiana region.
Definitions of NGVD29, NAVD88, Mean Sea Level, and Local Mean Sea Level
Finding: NGVD29, NAVD88, Mean Sea Level, and Local Mean Sea Level are often mis-understood and used interchangeably in various documents.
Lesson Learned: When referring to the mean water surface at or near a specific flood con-trol project, LMSL needs to be used. A LMSL-derived elevation needs to clearly identify the water level reference gauge location and the time series (epoch) over which the mean surface elevation was computed. NOAA geodetic and tidal datasheets need to be modified to clearly indicate orthometric heights/elevations differ from water level-based elevations.
Hurricane Season Biases in Local Mean Sea Level Averages
Finding: Distinct biases were noted in average water surface elevations during the fall hurri-cane season. It is not clear if these biases are factored into hydrodynamic or risk assessment models, or in design criteria used in developing flood protection structure elevations and flood inundation models.
Lesson Learned: Applicable hydrologic and hydraulic guidance documents need to be reviewed to verify that seasonal sea level biases are being properly applied.
Coordination of Topographic Survey Data Collection, Processing, and Management
Finding: A variety of survey data is produced by various elements within and outside the New Orleans District, primarily by contracted surveying and mapping firms. There is no stan-dard process to locate data sets and ensure that a common reference system is used.

Volume II Geodetic Vertical and Water Level Datums II-147 This report is the independent opinion of the IPET and is not necessarily the official position of the U.S. Army Corps of Engineers.
Lesson Learned: The New Orleans District needs to develop a comprehensive GIS system to maintain the hydrographic, topographic, and geodetic data requested by various engineering, construction, and operations entities within and/or external to the District. To minimize the con-fusion associated with several entities producing survey data, all surveys need to be coordinated and archived by a single office. This would standardize survey methods, survey control, deliver-ables, etc. Additionally all proposed surveys would be displayed on the GIS to prevent common requirements from being duplicated. Data formats need to be standardized based on existing Corps guidance—e.g., CADD/GIS Technology Center, EM 1110-1-1005, EM 1110-2-1003, etc.
Vertical Control Monumentation Requirements and Stakeout Procedures on Flood Control Construction Projects
Finding: Most construction contract documents referenced only one benchmark for control-ling construction. In at least one instance, an incorrect benchmark elevation contributed to a floodwall being constructed below intended design levels.
Lesson Learned: A minimum of three permanent benchmarks (new or existing) need to be identified on design and construction drawings for all flood control projects. Having three bench-marks provides redundancy to determine the reliability of the benchmarks used during the plan-ning, design, and construction process. These marks should be established during the planning and design phase. The marks should be situated in the middle and at each end of the project. They should be established relative to the most recent geodetic vertical datum established by NOAA, using either conventional differential leveling and/or the latest NOAA-defined GPS techniques, with appropriate corrections to the local hydraulic design surface (i.e., LMSL). Prior to and during actual construction stakeout, these primary reference marks need to be verified externally and internally. Field records of these survey verifications need to be permanently archived.
LIDAR and Photogrammetric Mapping Calibration and Testing
Finding: Various older LIDAR mapping projects covering the region that were used for IPET model input were not independently quality assured or ground-truthed for absolute accu-racy. Large anomalies and biases were found in this uncalibrated data. The original contract scopes for this mapping did not include adequate quality assurance checks. In addition, the LIDAR data were thinned to a DEM post-spacing that was too large to adequately define the terrain or floodwalls.
Lesson Learned: Major engineering projects, such as this IPET study, requiring accurate, up-to-date topographic detail, should not attempt to utilize older mapping data of uncertain origin, resolution, and accuracy—especially if this data was not reliably quality assured (i.e., ground truthed). Contracts for remote sensing services must contain quality assurance provisions for calibrating, ground truthing, and testing delivered mapping products. These methods should follow long-established QC/QA testing methods outlined in standards such as USACE EM 1110-1-1000 (Photogrammetric Mapping), FGDC, ASPRS, and FEMA (e.g., FEMA 2003—Appendix A, “Guidance for Aerial Mapping and Surveying”).

II-148 Volume II Geodetic Vertical and Water Level Datums This report is the independent opinion of the IPET and is not necessarily the official position of the U.S. Army Corps of Engineers.
USACE Policy and Manual on Maintaining Geodetic and Water Level Datums in High Subsidence Areas
Finding: USACE guidance on elevation datums used in coastal hurricane protection projects needs updating.
Lesson Learned: An Engineering Manual (or an addendum/update to the Coastal Engineer-ing Manual) providing theory, guidance, and procedures on maintaining reliable reference datums in high-subsidence areas, including distinguishing engineering applications between water level and geodetic vertical datums is needed. Alternatively, this guidance may be imple-mented by a policy document (Engineering Regulation).
Differential GPS and Related Survey Standards for Establishing Construction Control
Finding: Direct use of CORS data for establishing orthometric elevations, following NOAA guidelines, provides sufficient accuracy for engineering and construction applications.
Lesson Learned: GPS survey standards and procedures used during the Hurricane Katrina IPET project need to be promulgated by a HQUSACE policy directive. NOAA procedures must be used for establishing supplemental orthometric elevations using GPS. NOAA needs to develop and promulgate specific operating procedures applicable to this high-subsidence area. These procedures should include methods of determining orthometric elevations relative to local VTDP benchmarks as well as methods for direct establishment of orthometric elevations from CORS stations. Both geodetic accuracy and construction accuracy methods should be covered. Required accuracies are outlined in EM 1110-1-1005. Data can be adjusted using COTS geodetic software routines and not require Blue Booking. Third-Order differential leveling accuracy is adequate for engineering surveys, including referencing water level gauges.
Certification Policy on Use of Vertical Datums for All Applications
Finding: There was no coordination within New Orleans District to ensure that all projects were connected to a common vertical datum. In addition, established HQUSACE policies on vertical datums were not consistently followed.
Lesson Learned: Mandate a survey control certification process in all work requiring sur-veying, mapping, and GIS information, which would require a District/Major Support Command (MSC) Survey Coordinator’s certification of survey methods and the datum used. The Survey Coordinator needs to provide appropriate survey methods, verify existing control, check existing relationships between geodetic and tidal datums, and ensure compliance with IPET findings and lessons learned that are published in an engineer manual. When acting within this certification process, the Survey Coordinator will not be subject to management prerogatives or other non-technical infringements. They will serve as an independent technical authority in this regard. Adequate and separate project line item funding will be set aside for this purpose on all projects requiring surveying, mapping, and GIS information. A training program will be established by HQ to insure certifying individuals have the necessary skills to perform this task. A reporting system will also be established to insure all USACE project datums are adequately certified via this process, which will be monitored and verified by MSC and HQ Engineering and Construction organizations.

Volume II Geodetic Vertical and Water Level Datums II-149 This report is the independent opinion of the IPET and is not necessarily the official position of the U.S. Army Corps of Engineers.
References Corps of Engineers References
Most of the following USACE publications can be downloaded from the HQUSACE home page site on the Internet. http://www.usace.army.mil/publications/. Publication dates are indi-cated therein or on the document itself.
ER 1110-1-8156 Policies, Guidance, and Requirements for Geospatial Data and Systems ER 1110-2-1150 Engineering and Design for Civil Works Projects EM 1110-1-1000 Photogrammetric Mapping EM 1110-1-1002 Survey Markers and Monumentation EM 1110-1-1003 NAVSTAR Global Positioning System Surveying EM 1110-1-1005 Control and Topographic Surveying (01 January 2006 Draft) EM 1110-1-2909 Geospatial Data and Systems EM 1110-2-1003 Hydrographic Surveying EM 1110-2-1009 Structural Deformation Surveying EM 1110-2-1100 Coastal Engineering Manual EM 1110-2-1416 River Hydraulics EM 1110-2-1607 Tidal Hydraulics EM 1110-2-1913 Design and Construction of Levees

II-150 Volume II Geodetic Vertical and Water Level Datums This report is the independent opinion of the IPET and is not necessarily the official position of the U.S. Army Corps of Engineers.
EM 1110-2-1614 Design of Coastal Revetments, Seawalls, and Bulkheads ERDC/ITL 1999a “Computer-Aided Design and Drafting (CADD) and Geographic Information System (GIS)-- Concepts and Terminology, 1999,” The CADD/GIS Technology Center, The CADD/GIS Technology Center, Information Technology Laboratory, U.S. Army Engineer Research and Development Center, Vicksburg, MS ERDC/ITL 1999b “CADD/GIS Technology Center Guidelines for Installation Mapping and Geospatial Data,” 1999, The CADD/GIS Technology Center, The CADD/GIS Technology Center, Information Technology Laboratory, U.S. Army Engineer Research and Development Center, Vicksburg, MS ERDC/ITL 2001 “A/E/C CADD Standard (TR-01-6),” September 2001, The CADD/GIS Technology Center, The CADD/GIS Technology Center, Information Technology Laboratory, U.S. Army Engineer Research and Development Center, Vicksburg, MS ERDC/ITL 2002a Spatial Data Standards for Facilities, Infrastructure, and Environment (SDSFIE) and Facility Management Standards for Facilities, Infrastructure, and Environment (FMSFIE)--History of Development and Benefits,” June 2002, The CADD/GIS Technology Center, The CADD/GIS Technology Center, Information Technology Laboratory, U.S. Army Engineer Research and Development Center, Vicksburg, MS ERDC/ITL 2002b Spatial Data Standards for Facilities, Infrastructure, and Environment (SDSFIE) and Facility Management Standards for Facilities, Infrastructure, and Environment (FMSFIE)--Data Model and Structure,” June 2002, The CADD/GIS Technology Center, The CADD/GIS Technology Center, Information Technology Laboratory, U.S. Army Engineer Research and Development Center, Vicksburg, MS ETL 1110-1-97 Change in Name of National Vertical Control Net ETL 1110-1-152 Conversion to the North American Vertical Datum of 1988 (Rescinded, incorporated into EM 1110-1-1005) ETL 1110-2-349 Requirements and Procedures for Referencing Coastal Navigation Projects to Mean Lower Low Water Datum (Rescinded, incorporated into EM 1110-2-1003) FEMA 1995 Flood Insurance Study Guidelines and Specifications for Study Contractors

Volume II Geodetic Vertical and Water Level Datums II-151 This report is the independent opinion of the IPET and is not necessarily the official position of the U.S. Army Corps of Engineers.
FEMA 2003 Guidelines and Specifications for Flood Hazard Mapping Partners HEC 1986 The Hydraulic Engineering Center (HEC) Research Document No. 26, “Accuracy of Computed Water Surface Profiles” Chen 1995 The Civil Engineering Handbook, W.F. Chen, CRC Press Federal Geographic Data Committee References
FGDC 1998a “Geospatial Positioning Accuracy Standards, Part 1: Reporting Methodology,” Federal Geographic Data Committee, FGDC-STD-007.1-1998 FGDC 1998b “Geospatial Positioning Accuracy Standards, Part 2: Standards for Geodetic Networks,” Federal Geographic Data Committee, FGDC-STD-007.2-1998 FGDC 1998c “Geospatial Positioning Accuracy Standards, Part 3: National Standard for Spatial Data Accuracy,” Federal Geographic Data Committee, FGDC-STD-007.3-1998 FGDC 1998d “Content Standard for Digital Geospatial Metadata (Version 2.0),” Federal Geographic Data Committee, FGDC-STD-001-1998 FGDC 2002 “Geospatial Positioning Accuracy Standards, Part 4: Standards for Architecture, Engineering, Construction (A/E/C) and Facility Management,” Federal Geographic Data Committee, FGDC-STD-007.4-2002 FGCS 1984 Federal Geodetic Control Subcommittee 1984 “Standards and Specifications for Geodetic Control Networks,” Rockville, MD FGCS 1988 Federal Geodetic Control Subcommittee 1988 “Geometric Geodetic Accuracy Standards and Specifications for Using GPS Relative Positioning Techniques (Preliminary),” Rockville, MD. (Reprinted with Corrections: 1 August 1989).

II-152 Volume II Geodetic Vertical and Water Level Datums This report is the independent opinion of the IPET and is not necessarily the official position of the U.S. Army Corps of Engineers.
NOAA NGS References
NGS 1988 National Geodetic Survey 1988 “Guidelines for Submitting GPS Relative Positioning Data to the National Geodetic Survey” NGS 2004 Technical Report NOS/NGS 50, “Rates of Vertical Displacement at Benchmarks in the Lower Mississippi Valley and the Northern Gulf Coast,” NOAA, NGS, July 2004 NOAA 1992 “Results of the General Adjustment of the North American Vertical Datum of 1988,” Surveying and Land Information Systems 52(3): 133-149; Zilkoski, D., J. Richards, and G. Young, NOAA, NOS, NGS NOAA 1994 “Input Formats and Specifications of the National Geodetic Survey Data Base,” NOAA, National Geodetic Survey, September 1994 NOAA 1997 NOAA Technical Memorandum NOS NGS-58, Zilkoski, D. B., D’Onofrio, J. D., and Frankes, S. J. (Nov. 1997) “Guidelines for Establishing GPS-Derived Ellipsoid Heights (Standards: 2 cm and 5 cm),” Version 4.1.3. Silver Spring, Maryland NOAA 2005 “Guidelines for Establishing GPS Derived Orthometric Heights (Standards: 2cm and 5cm)” version 1.4, National Geodetic Survey 2005 DRAFT NOS NGS 59; D. B. Zilkoski, E. E. Carlson, and C. L. Smith, NOAA, NOS, NGS. NOAA 1989 NOAA Technical Report NOS 131 NGS 44 “Subsidence at Houston, Texas 1973-1987,” by S. R. Holdahi, J. C. Holzschuh, and D. B. Zilkoski, NOAA, NOS, NGS NOAA 1986 NOAA Technical Report NOS 120 NGS 38 “Subsidence in the Vicinity of New Orleans as Indicated by Analysis of Geodetic Leveling Data,” by D. B. Zilkoski and S. M. Reese, Jr., NOAA, NOS, NGS Mitchell and Zilkoski 1986 “A Geocadastre for New Orleans and Southern Louisiana,” Presented at the 1986 Spring ACSM/ASPRS Convention, Washington, DC, March 16-21, 1986, by G. J. Mitchell and D. B. Zilkoski, NOAA, NOS, NGS

Volume II Geodetic Vertical and Water Level Datums II-153 This report is the independent opinion of the IPET and is not necessarily the official position of the U.S. Army Corps of Engineers.
NOAA CO-OPS References
Bodnar, A. N. 1981. Estimated Accuracies of Tidal Datums from Short Term Observations, Draft Report, Tides and Water Levels Division, National Ocean Survey, Rockville, MD, March 1981.
Church, J. A. 2006. A 20th Century Acceleration in Global Sea-Level Rise. Geophysical
Research Letters, Vol. 33. Dokka, R. K. 2006. Modern-Day Tectonic Subsidence in Coastal Louisiana. Geology 34(4). Douglas, B. C., et al. 2001 Sea Level Rise: History of Consequences, International Geophysics
Series, Vol. 57, Academic Press. Gill, S. K., J. R. Hubbard, and W. D. Scherer. 1998. Updating the national tidal datum epoch for
the United States. Center for Operational Oceanographic Products and Services, National Ocean Survey, National Oceanic and Atmospheric Administration.
Hicks, S. D. 1985. Tidal Datums and Their Uses. National Ocean Survey, Rockville, MD. Marmer, H. A. 1951. Tidal Datum Planes. NOAA Special Publication No. 135, U.S. Coast and
Geodetic Survey, U.S. Govt. Printing Office, revised ed., 1951. Parker, B. B. 1992. Sea Level as an Indicator of Climate and Global Change, MTS Journal 25:
13-24. Shinkle, K. D. and R. K. Dokka. 2004. Rates of Vertical Displacement at Benchmarks in the
Lower Mississippi Valley and the Northern Gulf Coast. Swanson, R. L. E. 1974. Variability of Tidal Datums and Accuracy in Determining Datums from
Short Series of Observations, NOAA Technical Report NOS 64, NOAA, National Ocean Survey, Rockville, MD, October 1974.
Zervas, C. 2001. Sea Level Variations of the United States 1854-1999, NOAA Technical Report
NOS CO-OPS 36, NOAA/NOS, Center for Operational Oceanographic Products and Services, Silver Spring MD, July 2001.
NOS 2000. Tide and Current Glossary. Center for Operational Oceanographic Products and
Services, Silver Spring MD, January 2000. NOS 2001. Tidal Datums and Their Applications, NOAA Special Publication NOS CO-OPS 1,
NOAA/NOS, Center for Operational Oceanographic Products and Services, Silver Spring MD, February 2001.
NOS 2003. Computational Techniques for Tidal Datums Handbook, NOAA Special Publication
NOS CO-OPS 2, NOAA/NOS, Center for Operational Oceanographic Products and Services, Silver Spring MD, September 2003.

II-154 Volume II Geodetic Vertical and Water Level Datums This report is the independent opinion of the IPET and is not necessarily the official position of the U.S. Army Corps of Engineers.
NOS 2003. Specifications and Deliverables for Installation, Operation, and Removal of Water Level Stations. NOAA Special Publication NOS CO-OPS, NOAA/NOS, Center for Operational Oceanographic Products and Services, Silver Spring MD, February 2003.
NOS 2003. User’s Guide for GPS Observations. Center for Operational Oceanographic Products
and Services, Silver Spring MD, January 2003. NOS 2003. User’s Guide for Writing Bench Mark Descriptions. Center for Operational
Oceanographic Products and Services, Silver Spring MD, January 2003. NOS 2005. Standing Project Instructions and Requirements for the Coastal Water Level Stations.
Center for Operational Oceanographic Products and Services, Silver Spring MD, October 2005.

Volume II Geodetic Vertical and Water Level Datums II-155 This report is the independent opinion of the IPET and is not necessarily the official position of the U.S. Army Corps of Engineers.
Glossary of Abbreviations and Acronyms
A-E......................................................................................................................Architect-Engineer ACSM ...................................................................American Congress on Surveying and Mapping ASCE ..................................................................................... American Society of Civil Engineers ASPRS .............................................. American Society for Photogrammetry and Remote Sensing BM ..................................................................................................................................Benchmark CADD ...................................................................................Computer Aided Drafting and Design CI ..................................................................................................................... Confidence Interval COE.................................................................................................................... Corps of Engineers CONUS. ................................................................................................. CONtinental United States CO-OPS ...........................................Center for Operational Oceanographic Products and Services CORPSCON .........................................................................................................CORPS CONvert CORS ...........................................................................Continuously Operating Reference Stations COTS ........................................................................................................Commercial off-the-shelf DEM........................................................................................................... Digital Elevation Model DM ................................................................................................................. Design Memorandum DHQ................................................................................................. Diurnal High Water Inequality DLQ ..................................................................................................Diurnal Low Water Inequality DTL.....................................................................................................................Diurnal Tide Level DOD.............................................................................................................Department of Defense DGPS ..................................................................................Differential Global Positioning System EM..........................................................................................................................Engineer Manual ERDC......................................................................... Engineer Research and Development Center ETL ..........................................................................................................Engineer Technical Letter FEMA .............................................................................Federal Emergency Management Agency FGCC .....................................................................................Federal Geodetic Control Committee FGCS.................................................................................Federal Geodetic Control Subcommittee FGDC..................................................................................... Federal Geographic Data Committee FIS ................................................................................................................. Flood Insurance Study GDM .................................................................................................General Design Memorandum GIS. ................................................................................................Geographic Information System GIWW...................................................................................................Gulf Intracoastal Waterway GMSL ......................................................................................................... Global Mean Sea Level GPS. ....................................................................................................... Global Positioning System GRS 80.....................................................................................Geodetic Reference System of 1980 Gt ....................................................................................................................Great Diurnal Range GVWLDT ..........................................................Geodetic Vertical and Water Level Datums Team HEC................................................................................................... Hydraulic Engineering Center HI ....................................................................................................................Height of Instrument HQUSACE................................................................Headquarters, U.S. Army Corps of Engineers HWM ....................................................................................................................High Water Mark IGLD85........................................................................... International Great Lakes Datum of 1985 IHNC............................................................................................... Inner Harbor Navigation Canal IPET ..............................................................................Interagency Performance Evaluation Team ITL .......................................................................................... Information Technology Laboratory

II-156 Volume II Geodetic Vertical and Water Level Datums This report is the independent opinion of the IPET and is not necessarily the official position of the U.S. Army Corps of Engineers.
JALBTCX............................... Joint Airborne LIDAR Bathymetric Technical Center of Expertise LIDAR .............................................................................................. LIght Detection And Ranging LMVD....................................................................................... Lower Mississippi Valley Division LMSL............................................................................................................ Local Mean Sea Level LSRC.........................................................................................Louisiana Spatial Reference Center LWRP .................................................................................................. Low Water Reference Plane MGL.......................................................................................................................Mean Gulf Level MHHW .................................................................................................... Mean Higher High Water MHW ................................................................................................................... Mean High Water MLG.........................................................................................................................Mean Low Gulf MLLW. ......................................................................................................Mean Lower Low Water MLW..................................................................................................................... Mean Low Water Mn .................................................................................................................................Mean Range MPL .......................................................................................................................Mean Pool Level MRC.................................................................................................Mississippi River Commission MRGO................................................................................................Mississippi River Gulf Outlet MSC ......................................................................................................... Major Support Command MSL ........................................................................................................................ Mean Sea Level MTL .......................................................................................................................Mean Tide Level MVD .....................................................................................................Mississippi Valley Division MVN ............................................................................................................... New Orleans District MVS.......................................................................................................................St. Louis District NAD27...........................................................................................North American Datum of 1927 NAD83...........................................................................................North American Datum of 1983 NAVD88.......................................................................... North American Vertical Datum of 1988 NCD .....................................................................................................................New Cairo Datum NFIP...........................................................................................National Flood Insurance Program NGRS..................................................................................... National Geodetic Reference System NGS .........................................................................................................National Geodetic Survey NGVD29.......................................................................National Geodetic Vertical Datum of 1929 NOAA .............................................................National Oceanic and Atmospheric Administration NOS ............................................................................................................ National Ocean Service NOS&WB....................................................................... New Orleans Sewerage and Water Board NSRS......................................................................................... National Spatial Reference System NTDE..................................................................................................National Tidal Datum Epoch NVCN ....................................................................................... National Vertical Control Network NWLON...................................................................... National Water Level Observation Network OCS.............................................................................................................. Office of Coast Survey P&S............................................................................................................ Plans and Specifications PBM ..............................................................................................................Permanent Benchmark PICES............Periodic Inspection and Continuing Evaluation of Completed Civil Works Projects QA ........................................................................................................................Quality Assurance QC ............................................................................................................................ Quality Control RTK.................................................................................................................Real-Time Kinematic SLD29...................................................................................................... Sea Level Datum of 1929 SPH ........................................................................................................Standard Project Hurricane

Volume II Geodetic Vertical and Water Level Datums II-157 This report is the independent opinion of the IPET and is not necessarily the official position of the U.S. Army Corps of Engineers.
TBM............................................................................................................. Temporary Benchmark TEC...............................................................................................Topographic Engineering Center U.S. ..............................................................................................................................United States USACE ............................................................................................U.S. Army Corps of Engineers USC&GS .......................................................................................U.S. Coast and Geodetic Survey USCG.................................................................................................................... U.S. Coast Guard USGS .......................................................................................................... U.S. Geological Survey VTDP ......................................................................................... Vertical Time-Dependent Position WRDA ......................................................................................Water Resources Development Act