volume 6 / number 6 / 2012 healthmedbib.irb.hr/datoteka/572206.healthmed_6_6_-_final.pdf · ueno,...
TRANSCRIPT

EDITORIAL BOARD
Editor-in-chief Mensura Kudumovic
Execute Editor Mostafa Nejati
Associate Editor Azra Kudumovic
Technical Editor Eldin Huremovic
Cover design Mirza Basic Members Paul Andrew Bourne (Jamaica) Xiuxiang Liu (China) Nicolas Zdanowicz (Belgique) Farah Mustafa (Pakistan) Yann Meunier (USA) Suresh Vatsyayann (New Zealand) Maizirwan Mel (Malaysia) Budimka Novakovic (Serbia) Diaa Eldin Abdel Hameed Mohamad (Egypt) Zmago Turk (Slovenia) Chao Chen (Canada) Bakir Mehic (Bosnia & Herzegovina) Farid Ljuca (Bosnia & Herzegovina) Sukrija Zvizdic (Bosnia & Herzegovina) Damir Marjanovic (Bosnia & Herzegovina) Emina Nakas-Icindic (Bosnia & Herzegovina) Aida Hasanovic(Bosnia & Herzegovina) Bozo Banjanin (Bosnia & Herzegovina) Gordana Manic (Bosnia & Herzegovina) Address of the Sarajevo, Bolnicka BB Editorial Board phone/fax 00387 33 956 080
[email protected] http://www.healthmedjournal.com Published by DRUNPP, Sarajevo Volume 6 Number 6, 2012 ISSN 1840-2291
HealthMEDVolume 6 / Number 6 / 2012
Journal of Society for development in new net environment in B&H
Sadržaj / Table of Contents
HealthMED journal with impact factor indexed in: - Thomson Reuters ISI web of Science, - Science Citation Index-Expanded, - Scopus, - EBSCO Academic Search Premier, - Index Copernicus, - getCITED, and etc.
Body composition measurements determined byairdisplacement plethysmography and eight-polarbioelectrical impedance analysis are equivalent inAfrican American college students ............................... 1896Wi-Young So, Brenda Swearingin, Brandon Crooms, Rami Lee, Yunjung Choi, Teresa K. Dail, Deana Melton, Tiffany M. Fuller, Chang-Ho HaAn analysis of children’s thoughts about the nursingprofession using the method of having children drawpictures ............................................................................ 1900Nejla Canbulat, Ayşe Sonay Kurt, Serap Balci, Seda KaraHyperbaric oxygen promotes neural stem cellproliferation in neonatal rats with hypoxic-ischemic brain damage ..........................................................1906Zhi-Chun Feng, Jing Liu, Rong JuGood Pediatric Nurse’ Characteristics In AccordingTo Student Nurses........................................................... 1911Nursan Cinar, Insaf AltunFirst records of Ornithodoros sp. soft ticks from anendemic relapsing fever region in Northern Iran ...... 1916A.A. Enayati, F. Asgarian, A. Amouei,B. Esfandiari,M. Oshaghi, J. Hemingway, P.J. McCallCisplatin-induced nephrotoxicity in differentregimens of cancer chemotherapy ................................ 1922Furqan Khurshid Hashmi, Khalid Hussain, Muhammad Islam, Muzammil Ali, Muhammad Khalid Tipu, Muhammad Tanveer Khan, Abida LatifAttention deficit hyperactivity disorder (ADHD)symptoms and Adult ADHD Diagnosis in adultmen with cannabis dependence ................................... 1930Umut Mert Aksoy, Sennur Gunay Aksoy, Abdullah Akpinar, Fulya ManerQuality of Care by Good Medical RecordsDocumentation in Educational Hospitals .................1935Kobra Aligolbandi, Azita Bala Ghafari, Hasan SiamianPhysical activity levels of teachers and healthprofessionals in Turkey .................................................. 1940Atan T, Tural E, Imamoglu O1, Cicek G3, Tural S4
Extracellular signal-regulated kinase1/2 signallingpathway regulate the secretions of human bronchialsmooth muscle cells passively sensitized by asthmatic serum ................................................................................ 1948Min Xie, Xian-Sheng Liu, Yong-Jian Xu, Zhen-Xiang Zhang
Sadržaj / Table of Contents
Determining The Needs Of The Families That Havea Patient In The Pediatric Intensive Care Unit AndAnalyzing Characteristics Of These Families ............. 1956Birsen Altay, Demet Gonener, Nurse Seher Zengin, Bilge Bal OzkaptanFactors affecting efficiency of social securityhospitals in Iran: Data Envelopment Analysis ............ 1966Nahid Hatam, Kimia Pourmohammadi, Ali Keshtkaran, Mehdi Javanbakht, Mehrdad AskarianThe relationship between basal metabolic rate,lean body mass and femurs bone mineral densityof national level basketball players of India ................ 1974Behrooz Imeri, D. K. DurehaBehaviors of students towards safety measuresto prevent school accidents .......................................... 1979Hande Sahin, Sibel ErkalEffects of 12 weeks of combined exercise on thelevels of visfatin, resistin, and metabolism-relatedhormones in a sample of Korean obese femalecollege students ............................................................... 1987Chang-Ho Ha, Wi-Young SoSurvey of disaster preparedness of hospitals atShiraz University of Medical science, Iran .................. 1992Seyed Habibollah Kavari, Hossein MobarakiElazığ Başyurt Earthquake: Experiences on theEarthquake ...................................................................... 1999Mustafa Yildiz, Mehtap Gurger, Mustafa Sahan, Umut Gulacti, Tamer Gundogdu, Mehmet Nuri Bozdemir, Sukru Gurbuz, Mehmet Ayranci, Mehmet Cagri GoktekinEffects of Combination Therapy of Dexamethasoneand Fluoxetine on Levels of Interleukin-1β andInterleukin-6 in a Rat Model of Asthma withDepressive-like Behaviors .............................................. 2003Chengde Li, Shumei Mao, Yuliang Wang, Hongwei Sun Difference in the heart rate and the blood lactatelevel in football and hanball female players duringthe Conconi test............................................................... 2009Ivana Mladenovic Ciric, Slobodan Stojiljkovic, Ljiljana Bjelakovic, Maja Nikolic, Slavisa Djurdjevic, Danica PirslClinicopathologic Features and Risk Factors forBreast Cancer in Northern Iran Decent ...................... 2015Nasrin Rahmani, Seyyed Abbas Hashemi, Mohammad RaisianThe relationship of subjective global assessmentwith respiratory function and other nutritionparameters in COPD ...................................................... 2018Nalan Hakime NogayFI-CGA Score of old people by community basedInformation system ........................................................ 2023F. Teymoori, D. Mousavi, J. Demongeot, A Biglarian,M. Sarmadi, M. ShirazikhahDoes Nutrition Knowledge Change NutritionBehavior? ......................................................................... 2028Asli Ucar, Yahya Ozdogan, Ayse Ozfer Ozcelık
The clinical characteristics of fungal bloodstreaminfection in premature infants 37 cases ....................... 2035Shaodong Hua, Zhixin Wu, Xiuxiang Liu, Zhichun FengPostpartum Depression Among Working andNon-working Women in Denizli, Turkey ..................... 2043Gonul Ozgur, Senay Unsal Atan, Melek ArdahanThe Effects of Supplemental Iron on EducationalAchievements of Students with “Iron Deficiencywithout Anemia”: A Randomized, Double-Blind,Placebo-Controlled Trial ............................................. 2052Alireza Moafi, Soheila Rahgozar, Maryam Hajian, Majid Ghias, Fatemen Ghorbani, Akbar HassanzadehEffects of facet joint nerve block addition toradiofrequency in the treatment of low back pain ..... 2057Cevdet Duger, Iclal Ozdemir Kol, Kenan Kaygusuz, Sinan Gursoy, Caner MimarogluPhysical, financial unmet need and coping incancer patients ................................................................ 2062Fathollahbeigy F., Zamanian H., Karbasi Motlagh M., Anjedani E., Dastan M., Beheshtee M., Nochamani Zare M., Safaeefar M.Serum fgl2 levels elevated in patients with acutecoronary syndrome (ACS) ............................................. 2067Zhenzhong Zheng, Junfeng Zhan, Yanglong Zhang, Yunfeng Wei, Menghong Wang, Zeqi Zheng, Jintian PengAccuracy Of References In Eight Nursing Journal ...... 2071Zuhal Bahar, Ayse Beser, Ayfer Elcigil, Ozgul Karayurt, Fatma Vural, Ozlem Ugur, Ozlem KucukgucluIllegal drug self-poisoning induced death;Referred or not referred to Health system inMashhad, Iran 2004-2007. ............................................. 2079Khaki M, Afshari R, Zavar A, Alidoust M.Evaluation of alexithymic features of rheumatoidarthritis patients based on certain variables inTurkey .............................................................................. 2085Sevilay Hintistan, Nesrin Nural, İlknur Kahriman, Dilek CilingirThe Anti-oxidants status and lipid peroxidationproduct of newly diagnosed and three-weeks followup patients with pulmonary tuberculosis .................... 2093Ivana Stankovic, Slavica Golubovic, Tatjana Pejcic, Milan Radovic, Zorica CiricThe effect of oral fluid food support during laboron labor duration and perception of labor pains ........ 2098Sule Ergol, Kafiye Eroglu, Lale TaskinUsing Project Management as a Way to Excellencein Healthcare ................................................................... 2105Vladimir Obradovic, Petar Jovanovic, Nenad Djordjevic, Ivana Beric, Filip JovanovicThe level of adenosine deaminase in the serum ofpatients who have positive Entamoeba coli ................. 2113Tugba Raika Kiran, Ulku Karaman, Cemil Colak, Ali Ozer

Sadržaj / Table of ContentsThe estimation of oncological value of selectiveneck dissection in cervicofacial region tumors ............ 2117Aleksandar Trivic, Sanja Krejovic Trivic, Anton Mikic, Vojko Djukic, Jovica Milovanovic, Zeljko PetrovicInvestigation of validity and reliability of lungcancer quality of life from European Organizationfor Research and Treatment of Cancer(EORTC QLQ – LC13) in Iran .................................... 2126Karbasi Motlagh M., Anjedani E., Zamanian H., Fathollahbeigy F., Kiayee N., Aghaei Meibodi F., Beheshtee M.Health care and rehabilitation in breast cancerpatients ............................................................................. 2130Sanja Tomic, Svetlana Popovic-Petrovic, Dragana Milutinovic, Vasa PetrovicWilms tumor gene (WT1) protein expression inepithelial ovarian cancer ................................................ 2133Biljana Djordjevic, Predrag Vukomanovic, Simonida Stojanovic, Ljubinka Jankovic VelickovicTrue hyperkalaemia or pseudohyperkalaemia ina trauma patient after nephrectomy-differentialdiagnosis algorithm ........................................................ 2139Arsen Uvelin, Radmila Kolak, Vladimir Vrsajkov, Danica Hajdukovic, Ivanka PercicCharacteristics of fundamental laryngeal voice (f0)in developmental verbal apraxia .................................. 2145Vivien Djordjevic & Slavica GolubovicAnaerobic threshold determination by direct bloodlactate measurement with and without warm upprotocol in female athletes ............................................. 2152Ivana Mladenovic Ciric, Slobodan Stojiljkovic, NatalijaStefanovic, Slavisa Djurdjevic, Ljiljana Bjelakovic, Danica PirslStand-alone posterior ressection of lumbarhemivertebrae: case report ............................................ 2158Luciano M. R. Rodrigues, Adriano M. Yonezaki, Fabrício H. Ueno, Edgar S. Valesin, Luiz Carlos de Abreu, Vitor E. Valenti, Guilherme A. Foizer, Carlo MilaniClinical presentation of hospitalized Erysipelascases .................................................................................. 2162Branka Tomasev, Dejan Cvjetkovic, Ivana HrnjakovicCvjetkovic, Jovana Jovanovic, Sandra Stefan Mikic, Sinisa SevicTeam Effectiveness in Hospital Management:A literature Review ...................................................... 2169Davoud Adham, Bahram Delghoshaei, Seyedin Seyed Hesam, Masoud SalehiThe Effects of Physical Exercise on Reducing BodyWeight and Body Composition of Obese MiddleAged People. A Systematic review ................................ 2176Zoran Milanovic, Sasa Pantelic, Nebojsa Trajkovic, Goran Sporis, Marko AleksandrovicUse of complementary and alternative medicinein cardiovascular diseases: a literature review ........... 2190Ilkay Ozkan Arslan, Zeynep Canli Ozer, Ozen Kulakac
The Development of Physical Medicine andRehabilitation in Vojvodina ........................................... 2200Gordana Devecerski, Dusica SimicPregnancy and delivery after the breast carcinoma:is it possible? .................................................................... 2204Zorica Grujic, Mirjana Bogavac, Aleksandar Curcic, Aleksandra NikolicRenal artery stenosis in a solitary functioningkidney - case report ........................................................ 2209Edita Stokic, Ivana Bajkin, Slobodan Curic, Viktor Till, Sanja Stojanovic, Dragan Sagic, Dragana Tomic-NaglicQuality of life in students of University of Sarajevoin accordance to recommendations for lifestylemodification ..................................................................... 2216Zana PozderacCauses and differences in stress experience betweendoctors and nurses/medical technicians employedin Bureau of Emergency Medical Services ofCanton Sarajevo ............................................................. 2224Vedran Djido, Redzo Causevic, Aida Ramic-Catak, Gordana ManicSY level of amputation/versus CH chopart geldilemmas .......................................................................... 2230Sahib Muminagic, Faruk Hodzic, Oruc M.Angiographic evaluation of the dominancepatterns of coronary circulation ................................... 2234Aida Hasanovic, Belma Ascic-ButurovicIs Hyperprolactinemia a risk factor for Pulmonary Thromboembolism (PTE) in patients treatedwith Antipsychotic Drugs? ............................................ 2239Saida Fisekovic, Damir CelikInstructions for the authors ........................................... 2244

Vers
ion fo
r revie
w
1896
HealthMED - Volume 6 / Number 6 / 2012
Journal of Society for development in new net environment in B&H
Abstract
The purpose of this study was to compare body composition measurements taken with air displace-ment plethysmography (BOD POD) to eight-polar bioelectrical impedance analysis (BIA) in African American college students. The 143 subjects, aged 17–39 years, visited the participating Human Per-formance & Leisure Studies laboratory at North Carolina A&T State University, Greensboro, NC, United States, between June 1, 2011 and Decem-ber 31, 2011. Measurements of body composition, including fat mass (FM), fat free mass (FFM), and % body fat were determined using BOD POD (Life Measurement Inc., California, USA) and an eight-polar BIA (Inbody-720, Biospace, Seoul, Korea). The relationships between body composition me-asurements taken using BOD POD and eight-polar BIA were assessed using Pearson's r correlation. Results showed that body composition measure-ments taken using the BOD POD and the eight-polar BIA correlated significantly with respect to FFM (male, r=0.911, p<0.001; female, r=0.918, p<0.001); FM (male, r=0.938, p<0.001; female: r=0.931, p<0.001); and % body fat (male, r=0.871, p<0.001; female, r=0.717, p<0.001). The authors concluded that measurements taken using BOD POD and eight-polar BIA were similar in African American students. These methods are useful for fi-eld tests requiring body composition measurements and can be used interchangeably in the field.
Key words: Air-displacement plethysmograp-hy, eight-polar bioelectrical impedance analysis, Fat free mass, Fat mass, African American
Introduction
Body composition, such as fat free mass (FFM) and fat mass (FM), is an essential parameter in exercise training for athletes and non-athletes be-cause low fat and high muscle can improve exer-cise performance in many types of sports and re-creational activities. Many studies have reported on traditional measurements of body condition via body mass index (BMI), waist-hip ratio (WHR), waist circumference (WC), and skin-fold thic-kness (1–3). Recently, several studies introduced the measurement of body composition by magne-tic resonance imaging (MRI), dual energy x-ray absorptiometry (DEXA), underwater weighing (densitometry), dilution techniques, bioelectrical impedance analysis (BIA), and air-displacement plethysmography (BOD POD) (4–6). Although these measurements are reliable and show validi-ty, MRI, DEXA, densitometry, and dilution tech-niques are very expensive and inconvenient for the participants, and not feasible to conduct in the field because they require large specialized equipment. For these reasons, the use of these techniques is li-mited in many studies. By contrast, measurements using BIA and BOD POD are relatively simple, require only a few minutes to complete, and are non-invasive. Further, these methods deliver re-liable measurements of body composition (5–6). Studies have compared the measurements of body composition parameters, such as FM, FFM, and % body fat, among simpler methods such as BIA and BOD POD and more complex methods such as DEXA, MRI, and densitometry. Studies com-
Body composition measurements determined by air displacement plethysmography and eight-polar bioelectrical impedance analysis are equivalent in African American college studentsWi-Young So1, Brenda Swearingin2, Brandon Crooms2, Rami Lee 3, Yunjung Choi 3, Teresa K. Dail2, Deana Melton2, Tiffany M. Fuller2, Chang-Ho Ha2
1 Department of Human Movement Science, Seoul Women’s University, Seoul, Korea,2 Department of Human Performance & Leisure Studies, North Carolina A&T State University, United States of America,3 Biospace co., Ltd. Bio-engineering R&D Center, Seoul, Korea.

Vers
ion fo
r revie
w
HealthMED - Volume 6 / Number 6 / 2012
Journal of Society for development in new net environment in B&H 1897
paring BOD POD and DEXA have shown that the correlation between BOD POD and DEXA in predicting FM and FFM was very close to 1.00, ranging from 0.99 to 1.02 (7–9). A good correlati-on between BIA and DEXA in predicting FM and FFM was also shown (10–11).
Most of the previous studies of BOD POD and BIA have compared the accuracy of simple mea-suring methods, such as BOD POD and BIA, to more complex methods. Data comparing BOD POD and BIA to each other are lacking. In additi-on, previous studies on BIA were conducted using four-polar BIA with a single impedance frequency but not eight-polar BIA or impedance at multiple frequencies. Furthermore, very few of these studi-es have been conducted on the African-American ethnic minorities (11). Therefore, the purpose of this study was to compare measurements of body composition parameters, such as FM, FFM, and % body fat, between BOD POD and eight-polar BIA in African American college students.
Methods
Subject
The study cohort comprised 143 African Ame-rican college students (64 males, 79 females), aged 17–39 years, who visited the participating Human Performance & Leisure Studies laboratory at Nor-th Carolina A & T State University in Greensboro, NC, USA between June 1, 2011 and December 31, 2011. The FFM, FM, and % body fat of all su-bjects were determined via eight-polar BIA with impedance at multiple frequencies (Inbody720, Seoul, Korea) and BOD POD (Life Measurement Inc., Concord, California, USA). All study proce-dures were approved by the Institutional Review Board at North Carolina A & T State University.
Experimental procedures
The FFM, FM, and % BF were evaluated using an eight-polar BIA with multiple impedance frequencies (Inbody720, Seoul, Korea) and BOD POD (Life Measurement Inc., Concord, Califor-nia, USA). The BIA instrument measures the re-sistance of the right arm, left arm, trunk, right leg, and left leg at 6 frequencies, (1, 5, 50, 250, 500,
and 1000 kHz) via 30 impedance measurements in each of the 5 sites. The device uses 8 tactile electrodes: 2 in contact with the palm and thumb of each hand, and 2 with the anterior and posteri-or aspects of the sole of each foot (12). Subjects wore light clothing and removed all metal items that could interrupt the electronic current during the measurements.
The BOD POD instrument takes measurements using chamber pressure amplitudes, which were calibrated before each test by using a 50-L cali-bration cylinder. The subjects wore a tight-fitted swimsuit or body suit, and the FFM, FM, and % BF was determined in the chamber. The thoracic gas volume was measured in a separate step, in which the subject was required to sit quietly in the BOD POD chamber and breathe through a disposal tube and filter connected to the reference chamber at the rear of the BOD POD apparatus. After 4 or 5 breaths, the airway was occluded midway during exhalation, and the subject was instructed to blow 3 quick, light, panting breaths into the tube.
Before taking measurements, the subjects were prohibited from performing any exercise for 12 h, consuming anything for 4h, and urinating just before the impedance measurement. All methods employed for assessing body composition fo-llowed recommended guidelines (13).
Statistical analysis
All results from this study are represented as mean ± standard deviation. Pearson's r correlati-ons were calculated to examine the relationship between BOD POD and BIA with FFM, FM, and % body fat. Statistical significance was set at p < 0.05, and all analyses were performed using SPSS version 18.0 (SPSS, Chicago, IL, USA).
Results
The characteristics of the subjects are shown in Table 1. The average ages of the males and fema-les are 21.66 ± 2.99 years and 19.99 ± 2.83 years, respectively; their average heights are 176.95 ± 6.86 cm and 166.76 ± 8.80 cm, respectively; their average weights are 81.78 ± 14.97 kg and 69.94 ± 14.04 kg, respectively; their average BMIs are 26.11 ± 4.41 kg/m2 and 25.04 ± 4.05 kg/m2, res-

Vers
ion fo
r revie
w
1898
HealthMED - Volume 6 / Number 6 / 2012
Journal of Society for development in new net environment in B&H
pectively; their average waist circumferences are 83.88 ± 9.89 cm and 81.26 ± 9.80 cm, respecti-vely; their average hip circumference are 97.36 ± 8.63 cm and 99.06 ± 10.32 cm, respectively; and their average neck circumference are 38.07 ± 2.28 cm and 32.29 ± 1.99 cm, respectively.
The relationship between BOD POD and eight-polar BIA with respect to FFM, FM, and % body fat measurements are shown in Table 2. BOD POD showed significant positive correlations with eight-polar BIA in FFM (male, r=0.911, p<0.001; female, r=0.918; p<0.001), FM (male, r=0.938, p<0.001; female, r = 0.931, p<0.001), and % body fat (male, r=0.871, p<0.001; female, r=0.717, p<0.001).
Discussion
This study evaluated the correlation between BOD POD and eight-polar BIA in African Ameri-can college students. The results of this study de-monstrated a significant correlation between BOD POD and eight-polar BIA measurements obtained for FFM, FM, and % body fat.
The BOD POD and BIA methods have been widely used in clinics, in sports medicine, in public health centers, and in weight reduction programs (14–16). Many studies have compared predictions of body composition by BOD POD and BIA with
measurements made by reference methods such as DEXA and CT (17–19), but, to our knowled-ge, comparisons of BOD POD and BIA have not yet been reported. This is the first investigation to compare estimations of FFM, FM, and % body fat between BOD POD and eight-polar BIA in African American college students.
Our results showed significant correlations in the measurements taken for FFM, FM, and % body fat between BOD POD and BIA. These observati-ons indicate that although BOD POD is based on the principles of densitometry and BIA is based on the principles of bioelectrical impedance, these methods give similar outputs regarding these body composition parameters. This study shows not only a significant correlation between BOD POD and BIA but also that BOD POD and eight-polar BIA give measurements very close to that of DEXA (7–11). Based on these results, we conclude that BOD POD and eight-polar BIA are useful methods for field testing that requires wide scale use of body composition measurements, and that these methods can be used interchangeably in field.
This study has some limitations. Since the stu-dents were recruited from only 1 historically black college and university (HBCU) in Greensboro, NC, USA, the study population did not represent the entire African-American population. Further-
Table 1. Characteristics of subjects (N = 143)Variable Male (N = 64) Female (N = 79)
Age, years 21.66 ± 2.99 19.99 ± 2.83Height, cm 176.95 ± 6.86 166.76 ± 8.80Weight, kg 81.78 ± 14.97 69.94 ± 14.04
Body mass index, kg/m2 26.11 ± 4.41 25.04 ± 4.05Waist circumference, cm 83.88 ± 9.89 81.26 ± 9.80Hip circumference, cm 97.36 ± 8.63 99.06 ± 10.32
Neck circumference, cm 38.07 ± 2.28 32.29 ± 1.99
Table 2. The relationship between BOD POD and BIA with FFM, FM, and %body fat in African American (N = 143)
Male (N = 64) BOD POD INBODY r pFat free mass (kg) 65.76 ± 7.61 68.08 ± 8.76 0.911 <0.001***
Fat mass (kg) 15.99 ± 9.90 13.69 ± 8.14 0.938 <0.001***Body fat (%) 18.49 ± 8.45 15.81 ± 7.07 0.871 <0.001***
Female (N = 79) BOD POD INBODY r pFat free mass (kg) 51.55 ± 7.82 51.64 ± 8.78 0.918 <0.001***
Fat mass (kg) 18.33 ± 9.69 18.31 ± 9.24 0.931 <0.001***Body fat (%) 25.12 ± 8.83 24.97 ± 8.37 0.717 <0.001***
***p<0.001 by Pearson’s r correlations analysis

Vers
ion fo
r revie
w
HealthMED - Volume 6 / Number 6 / 2012
Journal of Society for development in new net environment in B&H 1899
more, it comprised only a few a small number of students (N = 143). However, we believe the grea-test merits of this research are that it was conduc-ted on subjects from the African-American ethnic minorities and that this is the first study to compa-re BOD POD and eight-polar BIA with multiple frequencies of impedance.
Conclusion
We concluded that the data of BOD POD and the data of eight-polar BIA were strong signifi-cantly correlated in African American students. These methods are useful methods in field test for measuring body composition and it can be used interchangeable in field.
Acknowledgements
This work was supported by a research grant from Seoul Women’s University (2012).
References
1. Wang J, Thornton JC, Kolesnik S, Pierson RN Jr. Ant-hropometry in body composition. An overview. Ann N Y Acad Sci 2000; 904: 317-26.
2. Womersley J. A comparison of the skinfold method with extent of 'overweight' and various weight-height relationships in the assessment of obesity. Br J Nutr 1977; 38: 271-84.
3. Dagenais GR, Yi Q, Mann JF, Bosch J, Pogue J, Yusuf S. Prognostic impact of body weight and abdominal obesity in women and men with cardiovascular disea-se. Am Heart J 2005; 149: 54-60.
4. Lee SY, Gallagher D. Assessment methods in human body composition. Curr Opin Clin Nutr Metab Care. 2008; 11 (5): 566-572.
5. Dehghan M, Merchant AT. Is bioelectrical impedan-ce accurate for use in large epidemiological studies? Nutr J 2008; 7: 26.
6. Mattsson S, Thomas BJ. Development of methods for body composition studies. Phys Med Biol. 2006; 51 (13): R203-228.
7. Levenhagen DK, Borel MJ, Welch DC, Piasecki JH, Piasecki DP, Chen KY, Flakoll PJ. A comparison of air displacement plethysmography with three other techniques to determine body fat in healthy adults. J Parenter Enteral Nutr 1999; 23: 293–299.
8. Collins MA, Millard-Stafford ML, Sparling PB, Snow TK, Rosskopf LB, Webb SA, Omer J. Evaluation of the BOD POD for assessing body fat in collegiate football players. Med Sci Sports Exerc 1999; 31: 1350–1356.
9. Fields DA, Wilson GD, Gladden LB, Hunter GR, Pas-coe DD, Goran MI. Comparison of the BOD POD with the four-compartment model in adult females. Med Sci Sports Exerc 2001; 33: 1605–1610.
10. Malavolti M, Mussi C, Poli M, Fantuzzi AL, Salvioli G, Battistini N, Bedogni G. Cross-calibration of eight-po-lar bioelectrical impedance analysis versus dual-energy X-ray absorptiometry for the assessment of total and appendicular body composition in healthy subjects aged 21-82 years. Ann Hum Biol. 2003; 30 (4): 380-391.
11. McClanahan BS, Stockton MB, Lanctot JQ, Relyea G, Klesges RC, Slawson DL, Schilling LP. Measure-ment of body composition in 8-10-year-old African-American girls: a comparison of dual-energy X-ray absorptiometry and foot-to-foot bioimpedance met-hods. Int J Pediatr Obes. 2009; 4 (4): 389-396.
12. Jensky-Squires NE, Dieli-Conwright CM, Rossuello A, Erceg DN, McCauley S, and Schroeder ET. Validity and reliability of body composition analysers in chil-dren and adults. Br J Nutr. 2008; 100 (4): 859-865.
13. Heyward VH, Wagner DR. Applied body compositi-on assessment (2nd ed.). Human Kinetics. 2004.
14. Barbosa-Silva MC, Barros AJ. Bioelectrical impe-dance analysis in clinical practice: a new perspective on its use beyond body composition equations. Curr Opin Clin Nutr Metab Care. 2005; 8 (3): 311-317.
15. Woodrow G, Devine Y, Cullen M, Lindley E. Appli-cation of bioelectrical impedance to clinical asse-ssment of body composition in peritoneal dialysis. Perit Dial Int. 2007; 27 (5): 496-502.
16. Fields DA, Goran MI, McCrory MA. Body-compo-sition assessment via air-displacement plethysmo-graphy in adults and children: a review. Am J Clin Nutr. 2002; 75 (3): 453-467.
17. Ball SD, Altena TS. Comparison of the Bod Pod and dual energy x-ray absorptiometry in men. Physiol Meas. 2004; 25 (3): 671-678.
18. Holmes JC, Gibson AL, Cremades JG, Mier CM. Body-density measurement in children: the BOD POD versus Hydrodensitometry. Int J Sport Nutr Exerc Metab. 2011; 21 (3): 240-247.
19. Yu OK, Rhee YK, Park TS, Cha YS. Comparisons of obesity assessments in over-weight elementary students using anthropometry, BIA, CT and DEXA. Nutr Res Pract. 2010; 4 (2): 128-135.
Corresponding Author Chang-Ho Ha, Department of Human Performance & Leisure Studies, North Carolina A&T State University, Greensboro, United States of America, E-mail: [email protected]

Vers
ion fo
r revie
w
1900
HealthMED - Volume 6 / Number 6 / 2012
Journal of Society for development in new net environment in B&H
Abstract
Purpose: The research was carried out for the purpose of analyzing the thoughts of children, ages 11-13, about the professions of nursing, using the method of having children draw pictures.
Materials and Methods: The study was of des-criptive design and the research universe comprised pupils in the second tier (6th, 7th, and 8th grades) of a primary school located in the Esenler District of Istanbul. Sample size was calculated with the fa-miliar sample formula and on the day of the study, 147 willing students who were present that day were accepted into the study group. Data was co-llected using a Questionnaire that consisted of 10 questions related to the children’s socio-demograp-hic characteristics and the topic of the research. To determine the children’s thoughts on the nursing profession, the students were asked to draw the first thing that came to their minds when they heard the word “nurse.” The pictures the children drew were analyzed in terms of the children’s positive/negati-ve concepts about the role of the nurse and about nurses in general. The data was analyzed in terms of descriptive statistics (percentages, means) and evaluated using the chi-square test.
Results: The mean age of the children in the study was 12.00 ± .82 and 54.4% were girls. Of the children, 58.5% stated that they had never been hospitalized and 78.2% said they had no acquain-tances who worked as a nurse. When the drawin-gs were examined, it was found that 68.7% of the children had included the figure of a nurse, 70.7% had depicted the therapeutic role of nurses in their drawings, and 83.2% were found to have positive thoughts about the nursing profession. It was de-termined that there was a significant difference in
children’s thoughts about nurses according to their genders and whether or not they were acquainted with an actual nurse (p<0.05).
Conclusion: The children in the study mostly reflected the therapeutic role of the nurse in their drawings, and it was found that girls in particular and also children who knew people who were nur-ses had more positive thoughts about nurses.
Key words: children, nurses, drawings, drawing pictures
Introduction
The Law on Nursing (2007) defines a nurse as an authorized health professional who is responsi-ble for performing the duties of planning, imple-menting, controlling and evaluating the nursing care that will answer the health needs of individu-als, families and the community as regards health issues that may be addressed through nursing in-terventions. In this context, the area of service of the nursing profession encompasses the individu-al, the family, and the community (Özsoy 2000).
The status of a profession is associated with the way society perceives that profession (Özsoy 2000). How an individual perceives a nurse is directly pro-portionate to his/her expectations from nursing, previous experiences, other people’s opinions, and the image of nursing as reflected in the mass media. Childhood is a period where everything is experien-ced for the first time and the impact of these experi-ences survive a lifetime. In childhood, a child’s per-ception of a nurse is more influenced by the child’s own experiences (Slusarska et al 2004).
A pediatric nurse must realize that children’s physical, physiological and psychological needs are different from those of adults and perceptive
An analysis of children’s thoughts about the nursing profession using the method of having children draw pictures Nejla Canbulat1, Ayşe Sonay Kurt2, Serap Balci3, Seda Kara4
1 Karamanoglu Mehmetbey University, School of Health, Nursing Department, Karaman, Turkey,2 Selcuk University, Faculty of Health Science Nursing Department, Konya, Turkey,3 Istanbul University, Faculty of Nursing Pediatric Nursing Department, Istanbul, Turkey,4 Beyoğlu Eye Hospital, Istanbul, Turkey.

Vers
ion fo
r revie
w
HealthMED - Volume 6 / Number 6 / 2012
Journal of Society for development in new net environment in B&H 1901
senses have not yet developed, but that children are in fact in constant development and their per-ception of and reaction to sickness varies accor-ding to chronological age and developmental cha-racteristics. The nurse should know that the child needs family-centered care and should be able to use verbal and non-verbal communication tech-niques appropriate to the child’s age and stage of development. Most important is to love children and to treat them with sincerity (Çavuşoğlu 2001). When all of these factors are considered, the im-portance of the qualifications nurses need in wor-king with children can be clearly seen.
To make changes in the status of the professi-on and encourage positive insights about nurses among the population, the feelings and thoughts of children should be taken into consideration. Chil-dren have more difficulty expressing their feelin-gs and thoughts compared to adults (Clatworthy, Simon ve Tiedeman 1999). One of the methods frequently used to interpret children’s feelings and perceptions makes use of the art of drawing (Jo-honson 1990). The fact that children like to draw pictures (Yavuzer 2003) places the art of drawing in a very special position in terms of being more able to understand what children mean to express (Yurtal ve Artut 2008).
The method of having children draw pictures may be useful in determining how children perce-ive nurses. This method may provide the means to explore children’s positive/negative thoughts about nursing, the image in their mind about the nursing profession, their experiences in this context, and the impressions these experiences have left with them. Such an approach would make it possible to plan interventions designed to support positive thoughts and eliminate negative thoughts and feelings.
Knowing how children perceive nurses and nursing is important in terms of providing guide-lines for planning and implementing nursing prac-tices. This study was thus designed to analyze the thoughts of children, 11-13, about the profession of nursing, using the method of drawing pictures.
Materials and methods
Type of Research: The research was a descrip-tive study carried out for the purpose of analyzing the thoughts of children, ages 11-13, about the
profession of nursing, using the method of having children draw pictures.
Universe and sample: The universe of this study, designed as descriptive research, was the gro-up of students in the second tier (6th-7th-8th grades) of a primary school located in Istanbul’s Esenler district. Sample size was calculated using the fami-liar sample formula. One hundred and forty-seven students in the age group 11-13 who were attending school during the days the research was carried out (April 21-25, 2011) and who were willing to parti-cipate comprised the sample for the study.
Data collection tools: Data was collected with a Questionnaire consisting of a total of 10 questi-ons related to the children’s socio-demographic characteristics (whether they had ever been hos-pitalized, whether they had ever been acquainted with a nurse, etc.) and the topic of the research. In order to understand the pupils’ thoughts about the nursing profession, they were asked to draw the first thing that came into their minds when they heard the word “nurse.”
Research questions: Answers were sought to 3 questions appropriate to the design of the study:
1. What was the image of nurses that came through in the children’s drawings?
2. What role did the nurses have in the pictures that the children drew?
3. Was there an association between the children’s socio-demographic characte-ristics and the image of nurses in their pictures?
Evaluation of the drawings: The children’s drawings were reviewed in terms of the positive and negative thoughts that were reflected about nurses and their roles, the features of the objects drawn in the pictures, and the gender of the nurses that appeared in the drawings.
Statistical evaluation: Data was evaluated in the electronic medium using the package program SPSS 11.5 and descriptive statistics (percentages, means) as well as the chi-square test.
Ethical matters: The written permission of the Provincial National Education Directorate was obtained in order to be able to carry out the pro-ject at the chosen school. The verbal consent of the students in the study was also obtained. The principle of volunteer participation was adopted.

Vers
ion fo
r revie
w
1902
HealthMED - Volume 6 / Number 6 / 2012
Journal of Society for development in new net environment in B&H
Research limitations: Since the research was conducted with children in only one school, the re-sults cannot be generalized to the whole of the pro-vince of Istanbul. A larger sample group, as well as qualitative studies based on different variables (the effect of the mass media on the image of the nurse), focus group and in-depth interviews are needed if a generalization is to be made. Another factor was that the study was carried out during school hours and in the school environment. Restricting the time to one hour may have diminished the originality of expression in the drawings. In addition, the fact that the children drew the pictures simultaneously in the same room may have resulted in their influencing each other. Moreover, since not too many published studies or data were accessible on this subject, this became a shortcoming in the evaluation process.
Results
Of the children in the study, 34% were 12 years old, 34% were in the 7th grade and 54.4% were girls. Most of the mothers (80.3%) and fathers (73.5%) of the children were primary school gra-duates, more than half of the children (58.5%) had never been hospitalized, and most (78.2%) had not been acquainted with any nurses (Table 1).
When the different features of the children’s drawings were considered, it was found that 70.7% drew nurses as treatment-providers (e.g., Figure 1), 68.7% drew the figure of a nurse in their pictures; 83.2% of those that drew nurses depicted them po-sitively. Additionally, 84.2% of the children depic-ted nurses as female, 15.8% as male (Table 2).
Figure 1. Drawing of nurse’s therapeutic role (Girl, 13 years)
Table 1. Children’s Socio-demographic Charac-teristics (N=147)
Characteristics Number (n)
Percentage (%)
Age111213
485049
32.734.033.3
Grade6th grade7th grade8th grade
485049
32.734.033.3
GenderGirlsBoys
8067
54.445.6
Mother’s EducationIlliterateLiteratePrimary SchoolHigh SchoolUniversity
67
118142
4.14.880.39.51.4
Father’s EducationLiteratePrimary SchoolHigh SchoolUniversity
7108284
4.873.519.02.7
HospitalizationYesNo
6186
41.558.5
Nurse AcquaintancesYes No
If yes, who? (N=32)RelativeNeighbor
32115
257
21.878.2
78.121.9
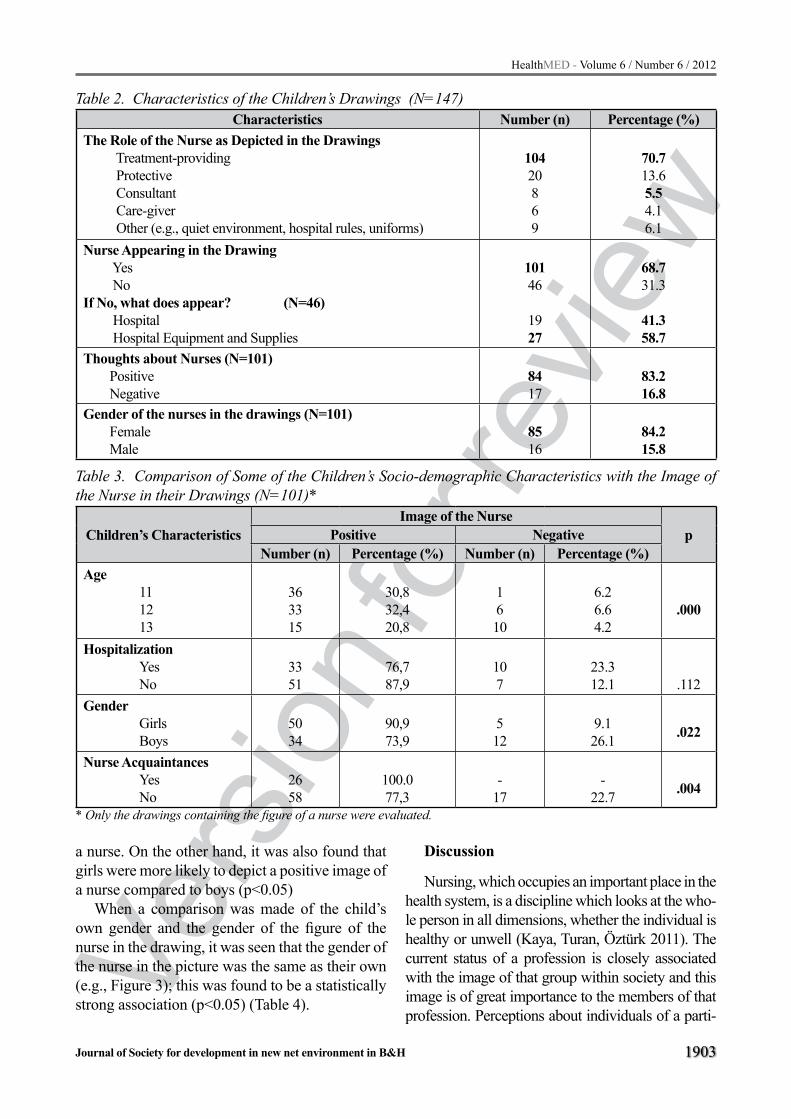
When the socio-demographic characteristics of the children shown in Table 3 are compared with the image of the nurse that they depicted in their drawings, it was seen that there was a pronounced statistical difference between groups (p<0.05). Advanced statistical analysis with the chi-square showed that the difference stemmed from the 13 year-old group. It was established that the older the children were, the more negative were their images of nurses (e.g., Figure 2). There were sta-tistical differences in groups in terms of the image of the nurse in the pictures and whether or not the child was acquainted with any nurses (p<0,05); it was discovered that all of the children who did have nurse acquaintances drew a positive image of
Vers
ion fo
r revie
w
HealthMED - Volume 6 / Number 6 / 2012
Journal of Society for development in new net environment in B&H 1903
a nurse. On the other hand, it was also found that girls were more likely to depict a positive image of a nurse compared to boys (p<0.05)
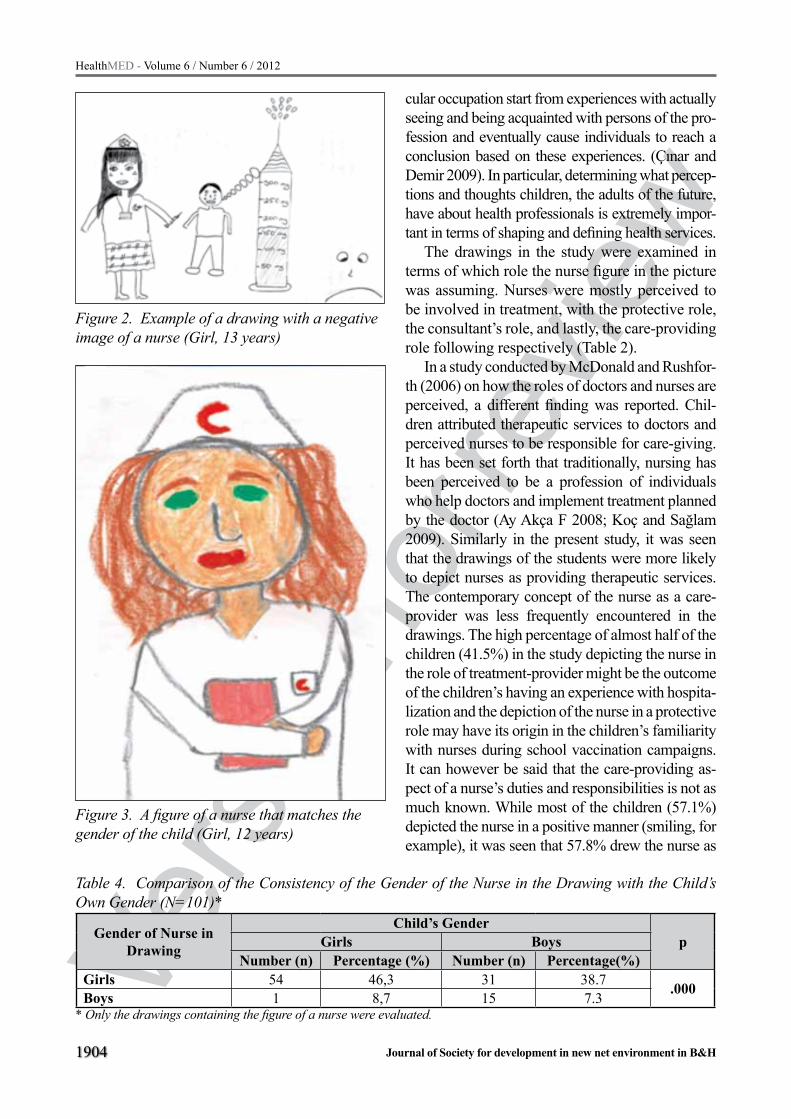
When a comparison was made of the child’s own gender and the gender of the figure of the nurse in the drawing, it was seen that the gender of the nurse in the picture was the same as their own (e.g., Figure 3); this was found to be a statistically strong association (p<0.05) (Table 4).
Discussion
Nursing, which occupies an important place in the health system, is a discipline which looks at the who-le person in all dimensions, whether the individual is healthy or unwell (Kaya, Turan, Öztürk 2011). The current status of a profession is closely associated with the image of that group within society and this image is of great importance to the members of that profession. Perceptions about individuals of a parti-
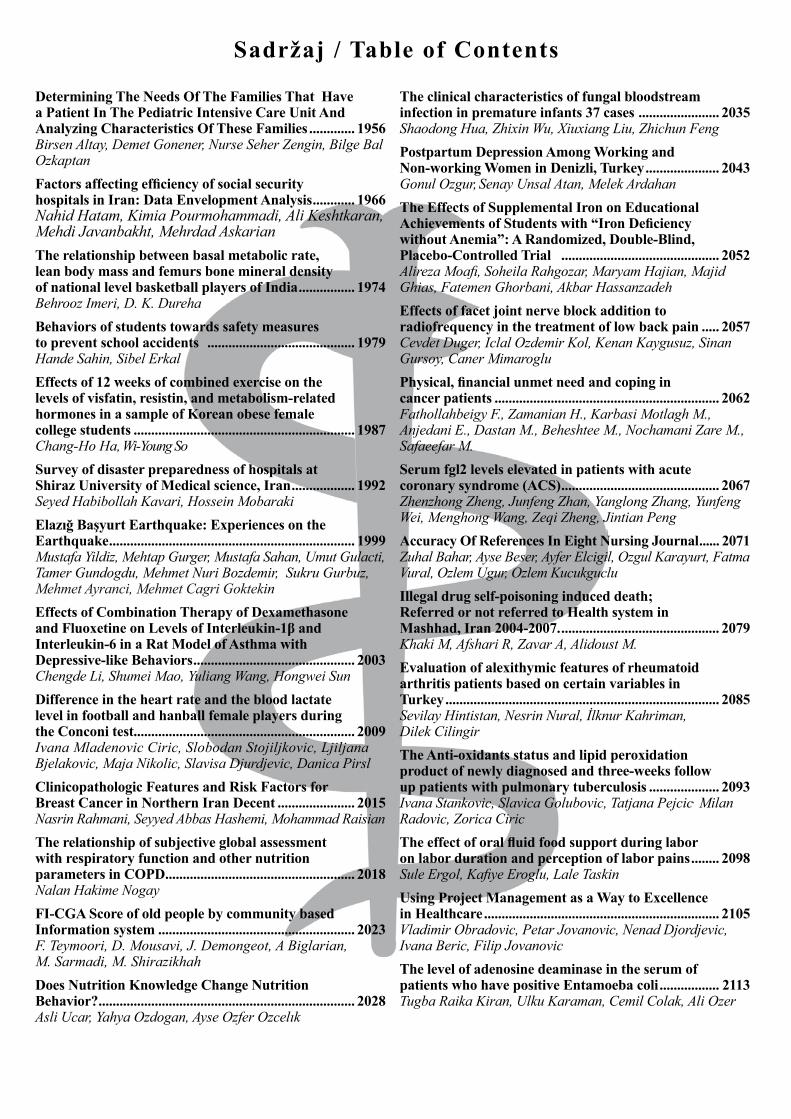
Table 2. Characteristics of the Children’s Drawings (N=147)Characteristics Number (n) Percentage (%)
The Role of the Nurse as Depicted in the Drawings Treatment-providing Protective Consultant Care-giver Other (e.g., quiet environment, hospital rules, uniforms)
10420869
70.713.65.54.16.1
Nurse Appearing in the Drawing Yes NoIf No, what does appear? (N=46) Hospital Hospital Equipment and Supplies
10146
1927
68.731.3
41.358.7
Thoughts about Nurses (N=101) Positive Negative
8417
83.216.8
Gender of the nurses in the drawings (N=101) Female Male
8516
84.215.8
Table 3. Comparison of Some of the Children’s Socio-demographic Characteristics with the Image of the Nurse in their Drawings (N=101)*
Children’s CharacteristicsImage of the Nurse
pPositive NegativeNumber (n) Percentage (%) Number (n) Percentage (%)
Age 11 12 13
363315
30,832,420,8
1610
6.26.64.2
.000
Hospitalization Yes No
3351
76,787,9
107
23.312.1 .112
Gender Girls Boys
5034
90,973,9
512
9.126.1 .022
Nurse Acquaintances Yes No
2658
100.077,3
-17
-22.7 .004
* Only the drawings containing the figure of a nurse were evaluated.
Vers
ion fo
r revie
w
1904
HealthMED - Volume 6 / Number 6 / 2012
Journal of Society for development in new net environment in B&H
cular occupation start from experiences with actually seeing and being acquainted with persons of the pro-fession and eventually cause individuals to reach a conclusion based on these experiences. (Çınar and Demir 2009). In particular, determining what percep-tions and thoughts children, the adults of the future, have about health professionals is extremely impor-tant in terms of shaping and defining health services.
The drawings in the study were examined in terms of which role the nurse figure in the picture was assuming. Nurses were mostly perceived to be involved in treatment, with the protective role, the consultant’s role, and lastly, the care-providing role following respectively (Table 2).
In a study conducted by McDonald and Rushfor-th (2006) on how the roles of doctors and nurses are perceived, a different finding was reported. Chil-dren attributed therapeutic services to doctors and perceived nurses to be responsible for care-giving. It has been set forth that traditionally, nursing has been perceived to be a profession of individuals who help doctors and implement treatment planned by the doctor (Ay Akça F 2008; Koç and Sağlam 2009). Similarly in the present study, it was seen that the drawings of the students were more likely to depict nurses as providing therapeutic services. The contemporary concept of the nurse as a care-provider was less frequently encountered in the drawings. The high percentage of almost half of the children (41.5%) in the study depicting the nurse in the role of treatment-provider might be the outcome of the children’s having an experience with hospita-lization and the depiction of the nurse in a protective role may have its origin in the children’s familiarity with nurses during school vaccination campaigns. It can however be said that the care-providing as-pect of a nurse’s duties and responsibilities is not as much known. While most of the children (57.1%) depicted the nurse in a positive manner (smiling, for example), it was seen that 57.8% drew the nurse as
Table 4. Comparison of the Consistency of the Gender of the Nurse in the Drawing with the Child’s Own Gender (N=101)*
Gender of Nurse in Drawing
Child’s GenderpGirls Boys
Number (n) Percentage (%) Number (n) Percentage(%)Girls 54 46,3 31 38.7 .000Boys 1 8,7 15 7.3
* Only the drawings containing the figure of a nurse were evaluated.
Figure 2. Example of a drawing with a negative image of a nurse (Girl, 13 years)
Figure 3. A figure of a nurse that matches the gender of the child (Girl, 12 years)

Vers
ion fo
r revie
w
HealthMED - Volume 6 / Number 6 / 2012
Journal of Society for development in new net environment in B&H 1905
a female figure and 10.9% as a male (Table 2). As the profession of nursing is more likely to be per-ceived as an occupation for women, the children’s drawings of nurses as women figures was an expec-ted outcome. Studies show, on the other hand (Kaya,Turan,Öztürk 2011; Koç and Sağlam 2009), that nursing is fast becoming a mixed-gender pro-fessional group and the profession of nursing, once perceived as exclusively for women, is experiencing a steady influx of males. To see children adding male figures to their depiction of nurses is a quite positive reflection of this development in nursing.
When certain socio-demographic characteristi-cs were compared with the image of nurses in the drawings, it was found that the older the children were, the more they were likely to portray nurses in a negative light; also, girls were more likely to be more positive about nurses than boys, and children who had nurse acquaintances were more likely to draw positive pictures of nurses. All of these findin-gs were statistically significant (Table 3).
These results are thought to have come about because older children might have had more expe-rience with hospitals and nurses, girls were likely to feel more of an affinity toward nursing, a profession that their age group could identify with, and finally, in the last case, children who were acquainted with a nurse could make closer observations about that person outside of the hospital environment.
To conclude, the findings of the study were the following: most of the children in the study drew nurses in the therapeutic context; there were figures of nurses in the drawings; more than half of the children who drew figures of nurses por-trayed them in a positive light; the older children were, the image they drew of the nurse became more negative; and finally, the gender of the nurse in the drawings was mostly consistent with their own. It is our recommendation that this subject be planned and explored in a larger sample and with different variables (e.g., the effect of the image of the nurse reflected in the mass media), supported with qualitative studies that include focus-group discussions and in-depth interviews.
References
1. Ay Akça F (2008). Mesleki temel kavramlar. İçinden: Temel Hemşirelik, Kavramlar, İlkeler, Uygulamalar
[Basic Professional Concepts: Incl. Basic Nursing, Concepts, Principles, Practices]. F.Akça Ay (Ed). İstanbul Medikal Yayıncılık, İstanbul
2. Clatworthy S, Simon K, Tiedeman ME (1999). Child Drawing: Hospital- An instrument designed to mea-sure the emotional status of hospitalized school- aged children. Journal of Pediatric Nursing, 14(1): 2-9
3. Çavuşoğlu H (2001). Çocuk Sağlığı Hemşireliği [Pe-diatric Nursing], Bizim Büro Basımevi, Ankara, 47-86
4. Çınar Ş, Demir Y (2009). Toplumdaki hemşirelik imajı: bir ölçek geliştirme çalışması [The image of nursing among the population in Turkey]. Atatürk Üniversi-tesi Hemşirelik Yüksekokulu Dergisi 12 (2):24-33
5. Hemşirelik Kanunu Kanun Numarası: 6283 [Nursing Law No. 6283] Kabul Tarihi [Accepted]: 25/02/1954 Yayımlandığı Resmi Gazete Tarihi [Date Published in Official Gazette]: 02/03/1954 Yayımlandığı Resmi Gazete Sayısı [Issue No. of Official Gazette]: 8647, Madde 4 [Article 4]- (Değişik madde [Revised Artic-le]: 25/04/2007-5634 S.K./3.mad.)
6. Johonson BH (1990). Children’s drawings as a pro-jective technique, Pediatr Nurs, 16(1): 11-16.
7. Kaya N, Turan N, Öztürk A (2011). Türkiye’de erkek hemşire imgesi [The image of male nurses in Turkey]. Uluslar arası İnsan Bilimleri Dergisi 8 (1):16-30.
8. Koç Z, Sağlam Z (2009). Lise son sınıf öğrencilerinin hemşirelik mesleğine ilişkin görüşleri ve mesleği seçme durumlarının belirlenmesi [Determining the views of high school seniors about the nursing pro-fession and choosing a profession]. Atatürk Üniversi-tesi Hemşirelik Yüksekokulu Dergisi, 12(3):1-7.
9. McDonald H, Rushforth H. Children's views of nur-sing and medical roles: implications for advanced nursing practice. Paediatr Nurs, 2006; 18(5): 32-36.
10. Özsoy SA, (2000) Toplumda Hemşirelik İmajının Be-lirlenmesi [Defining the Image of Nursing in Soci-ety], Ege Üniversitesi Hemşirelik Yüksekokulu Der-gisi, 16;1-19
11. Slusarska B, Krajewska- Kulak E, Zarzycka D, (2004). Children’s perceptions of the nursing professi-on in Poland, Nurse Education Today, 24(7):521-529
12. Yavuzer H (2003). Resimleriyle Çocuk [Children thro-ugh their Drawings]. Remzi Kitabevi. İstanbul, 11-67
13. Yurtal F, Artut K (2008), Çocukların Şiddeti Algılama Biçimlerinin Çizdikleri Resimlere Yansımaları [How Children Reflect their Perception of Violence in their Drawings] , Çocuk ve Gençlik Ruh Sağlığı Dergisi, 15(3); 149-155
Corresponding Author Nejla Canbulat, Karamanoglu Mehmetbey University, School of Health, Nursing Department, Karaman, Turkey, E-mail: [email protected]

Vers
ion fo
r revie
w
1906
HealthMED - Volume 6 / Number 6 / 2012
Journal of Society for development in new net environment in B&H
Abstract
Background: Hypoxic-ischemic brain dam-age (HIBD) is a common cause of neonatal brain injury, but there is no effective treatment for such an condition. This study was to investigate whether hyperbaric oxygen (HBO) could enhance neural stem cell (NSC) proliferation in neonatal rats af-ter hypoxic-ischemic brain damage (HIBD).
Methods: A total of 108 7-day-old rats were divided into three groups: (1) normal control; (2) hypoxic-ischemic (HI); and (3) HI + HBO. In the last group, HBO was administered 6 hours after HI, and then once daily for 7 days. Brdu and nestin immunohistochemistry was used to examine pro-liferating NSCs in the subventricular zone.
Results: The number of BrdU+nestin+ cells significantly increased 1 day after HI in the HBO treatment group (p < 0.05). The BrdU+nestin+ cells increased gradually on the 3rd day (p < 0.05) and peaked on the 5th day (p < 0.05) after HI. The num-ber of BrdU+nestin+ cells decreased gradually after the 7th day and reached the lowest level 21 days after HI. Strikingly, more BrdU+nestin+ cells were observed in the HBO group than in either the con-trol or HI group (p < 0.05).
Conclusion: Our results indicate that HBO treatment enhances the proliferation of NSCs in neonatal rats with HIBD. Thus, HBO treatment has therapeutic potential for promoting neurologi-cal recovery following brain injury.
Key words: hyperbaric oxygen, hypoxic-isch-emic brain damage, neural stem cells, rat, neonatal
Introduction
Hypoxic-ischemic brain damage (HIBD) is a common cause of neonatal brain injury with an incidence of two per 1000 term infants in the
developed world [1]. However, rates are higher in developing nations, and reach approximately 1.0 percent in China [2]. Although various strat-egies have been shown to improve the outcome of HIBD [3–6], there is no effective treatment for alleviating the debilitating sequelae to perinatal asphyxia. These include a high risk of mortality and the development of severe, long-term disabili-ties, such as cerebral palsy, cognitive impairment, learning disability, and epilepsy [7–10]. Hyper-baric oxygen (HBO) has shown promise for the treatment of ischemic brain damage in neonatal rat models [11–13], in neonatal HIBD [14, 15] and in adult traumatic brain injury [16], by reducing neuronal apoptosis and promoting the recovery of neurological function [11–13, 17]. In this study, we investigate whether HBO could promote neural stem cell (NSC) proliferation and differ-entiation in neonatal rats following HIBD.
Materials and Methods
Hypoxia-ischemia model: This study was approved by the Animal Care and Use Commi-ttee of the General Hospital of Beijing Military Command (No related number can be obtained in China). Timed pregnant Sprague Dawley rats were obtained from and reared in the Center of La-boratory Animal Science, Bayi Children’s Hospi-tal, affiliated with the General Hospital of Beijing Military Command (Beijing, China). Hypoxic-is-chemic (HI) brain damage was performed accor-ding to the method of Vannucci et al. [18, 19] and modified accordingly. Following normal delivery, litter size was adjusted to 10 pups. Cerebral HI injury was produced with a permanent unilateral common carotid ligation, followed by systemic hypoxia. Briefly, pups were anesthetized with diethyl ether inhalation. Once fully anesthetized,
Hyperbaric oxygen promotes neural stem cell proliferation in neonatal rats with hypoxic-ischemic brain damageZhi-Chun Feng, Jing Liu, Rong Ju
Department of Neonatology & NICU, Bayi Children’s Hospital affiliated with General Hospital of Beijing Military Command, Beijing, China

Vers
ion fo
r revie
w
HealthMED - Volume 6 / Number 6 / 2012
Journal of Society for development in new net environment in B&H 1907
a midline neck incision was made, and the right common carotid artery was separated from the va-gus nerve and ligated using 5-0 silk. The incision was then sutured and the animals were returned to the dam for 3 hours. The pups were warmed for 20 min in jars submerged in a 37 °C water bath. They were then exposed for 2.5 hours to 8% O2 and 92% N2 at 37 °C. For the HI + HBO trea-tment group, 100% oxygen was administered at a pressure of 3 atmospheres absolute within 6 hours after HI insult for 1 hour in a baby HBO chamber (YLC 0.5/1A, Wuhan, China). Pups were returned to their cages following treatment. HBO treatment was given once daily for 7 consecutive days. Con-trol animals were separated from the dam for the same amount of time as experimental animals but were otherwise not manipulated. The contralate-ral and ipsilateral hemispheres from experimental animals were examined separately.
Experimental groups: A total of 108 7-day-old rats were divided into three groups: (1) normal con-trol without anesthesia, carotid ligation, hypoxia, or HBO exposure; (2) HI; and (3) HI + HBO. Each group was composed of pups from each litter to obtain parity within the groups. The brains were re-moved at one of six sequential time points after HI insult, at either 1, 3, 5, 7, 14 or 21 days.
5-Bromo-2’-deoxyuridine (BrdU) labeling: Two animals in each group were randomly se-lected for intraperitoneal administering of BrdU (Sigma, St. Louis. MO,USA) by 200 mg/kg eight hours before executed, and take the brain fixed.
Tissue preparation: Animals were anesthe-tized with chloral hydrate after HI (n = 10 for each subgroup), and underwent transcardial per-fusion with 50-100 ml 0.9% saline followed by 50-100 ml cold 4% paraformaldehyde in 0.1 M PBS (pH 7.4). The anterior fontanelle was labeled with methylene blue and the brain was removed and post-fixed in paraformaldehyde for 24 h. Tis-sue was taken from 1.0 to -0.8 mm and -3.0 to -4.5 anterior to the anterior fontanelle, processed, embedded in paraffin wax, and cut coronally into 5-μm sections and transferred onto polylysine-coated slides.
Hematoxylin-eosin staining: After de-waxing, slides were stained with hematoxylin-eosin (HE) to examine the pathological changes in brain tis-sue under the optical microscope.
Nestin immunohistochemistry: The primary antibodies used to identify proliferating NSCs were anti-nestin (Chemicon, Temecula, CA, USA) and rat anti-BrdU (Accurate chemicals, Westbury, NY, USA). Frozen sections were placed at room temperature for 20 min, treated with xylene to re-move lipids, and subjected to gradual alcohol de-hydration. Sections then underwent a 0.6% meth-anol-H2O2 treatment for 20 min, PBS washing 3 × 5 min, and incubation in sheep serum for 20 min at room temperature. Subsequently, sections were incubated with 1:200 mouse anti-nestin and rat anti-BrdU monoclonal antibodies for 90 min at 37°C, and washed with PBS 3 × 10 min. They were then incubated with biotinylated goat anti-mouse IgG for 30 min at 37 °C, washed with PBS 4 × 5 min, stained with DAB for 5 min, washed, dehydrated, and cleared for observation. For nega-tive controls, primary antibody was replaced with 0.01 M PBS and secondary antibody was replaced with normal sheep serum.
Qualitative and quantitative evaluation of NSCs: Nestin-positive (nestin+) cells were consid-ered to be proliferating NSCs. NSC counts were performed at a magnification of ×400 on the mi-croscope. Five sections were examined for each sample and 10 different visual fields were ob-served randomly for each section to obtain cell counts for each group.
Statistical analyses: All data are presented as the mean ± standard deviation and were analyzed by Student’s t-test using SPSS 15.0 statistical soft-ware. p < 0.05 was considered to be statistically significant.
Results
Pathological changes in HI and HI + HBO groups: Based on microscopic examination of HE-stained sections from the HI group, the hippo-campus, cortex, and thalamus exhibited large areas of cell necrosis, swelling of the cell soma, and dis-rupted tissue architecture. Furthermore, neuronal cell loss and glial cell hyperplasia and glial scar formation were also observed. In striking contrast, the extent of nerve cell degeneration and necrosis was decreased and nerve cells appeared organized and their structure appeared normal in the HBO group.

Vers
ion fo
r revie
w
1908
HealthMED - Volume 6 / Number 6 / 2012
Journal of Society for development in new net environment in B&H
Change in the counts of BrdU+cells: The BrdU+ cells were in the shape of round or oval with a larger body and an obvious, claybank nu-cleolus. The counts of BrdU+cells were increased gradually from 1 day and reached the highest at 5th day in different groups. Thereafter, it began to decline at 14th days in each group and reached the lowest at 21 days of age. In the HI+HIBO group, however, the counts of BrdU+ cells were more than HIBD and control groups at each point (Fig.1).
Figure 1-1. The BrdU+ cells in control group
Figure 1-2. The BrdU+ cells in HI group
Figure 1-3. The BrdU+ cells HI+HBO group
Change in the counts of nestin+ cells: Nes-tin staining was present within the cytoplasm of NSCs having a round or spindle shape. As shown in Table 1 and Fig.2, the number of NSCs was higher in the HI group than in the normal control group, suggesting that hypoxia-ischemia can in-crease NSC proliferation to a certain degree. HBO treatment significantly increased the number of nestin+ cells 1 day after HI (p < 0.05). The number of nestin+cells increased more gradually on the 3rd day (p < 0.05) and peaked on the 5th day (p < 0.05). However, the number of nestin+ cells began to de-crease gradually after the 7th day and reached the lowest level on the 21st day. Nonetheless, a greater number of nestin+ cells were observed in the HBO group than in the control or HI group (p < 0.05).
Figure 2-1. The Nestin positive cells on 1st day
Figure 2-2. The Nestin positive cells on 5th day
Figure 2-3. The Nestin positive cells on 7th day
Table 1. Comparison of Nestin+cells in three groups in different time (x±s)1d 3d 5d 7d 14d 21d
Control groupsHIBD groups
HIBD+HBO group
91.5±7.399.9±7.5113.7±9.3
99.7±8.1107.3±9.3135.5±10.2
83.3±5.3119.5±9.3153.9±9.2
72.8±7.389.3±8.3112.9±9.2
67.6±7.171.8±9.397.9±9.2
55.1±7.261.6±7.187.74±9.1
Compared between HIBD and control groups, all p<0.05 within each time point except at 1st day.Compared between HIBD+HBO and HIBD groups, all p<0.05 within each time point.Compared between HIBD+HBO and control groups, all p<0.01 within each time point.

Vers
ion fo
r revie
w
HealthMED - Volume 6 / Number 6 / 2012
Journal of Society for development in new net environment in B&H 1909
Figure 2-4. The Nestin positive cells on 21st day
Change in the counts of dual positive cells of BrdU and Nestin after HBO treatment: The dual positive of BrdU and nestin (BrdU+nestin+) cells were in the shape of round or irregular with claybank endochylema and blue nucleolus. It was considered that the BrdU+nestin+ cells to be proliferating NSC. It could be seen from Figure 3 that HBO treatment significantly increased the number of BrdU+nestin+ cells in brain tissues 1st day after HI (p<0.01).Thereafter, the BrdU+nestin+cells increased gradually and peaked 5 days after HI (p<0.05). The number of BrdU+nestin+ cells decreased gradually at 14 days after HI, but more dual positive cells could been in HBO treated group than HI group.
Figure 3. The dynamic change of NSCs in differ-ent time after HI in brain tissues in three groups
Discussion
It was believed that BrdU+ cells were proliferating cells. In the developing brain, however, the proliferating cells including NSCs and astrocytes, thus an increase in BrdU+ cells cannot reflect the proliferation of NSCs alone. Nestin, an intermediate filament protein, expressed in NSCs, lineage-constricted progenitors and immature neurons, is widely used to identify NSCs. Thus, we used BrdU and Nestin double staining to distinguish between proliferating NSCs. In this study, we found that HBO treatment considerably increases the number of NSCs in rats with HIBD, especially during the first
5 days of treatment. Even with the gradual decrease in proliferating NSCs after the 14th day, the number of these cells in the HBO-treated group was signifi-cantly higher than in the control or HI group up to 21 days following brain injury. Taken together with the previous report by Yang et al. [20] that HBO signifi-cantly improves endogenous NSC proliferation and differentiation in neonatal rats following HIBD, our results provide additional support for the clinical ap-plication of HBO for treating neonatal HIBD.
Several mechanisms appear to contribute to the effectiveness of HBO for the treatment of brain HI damage: (1) HBO can lead to a remarkable increase in the amount of O2 delivered to brain tissue, includ-ing in HI injury patients. The rise in blood oxygen tension not only occurs during HBO treatment but persists thereafter, lasting at least 6 hours [16]. (2) HBO increases the oxygen dispersion distance in edematous brain tissue. (3) HBO significantly reduc-es CSF levels of lactate, thereby improving cerebral aerobic metabolism and cerebral metabolic rate of oxygen (an index reflecting mitochondrial function) [16]. (4) HBO promotes blood-brain barrier integrity and reduces cerebral edema and hyperemia, thereby decreasing intracranial hypertension. (5) HBO re-duces neuronal apoptosis, promotes cell survival, reduces cerebral infarct volume, and promotes the recovery of neurological function [11–13, 17].
Besides, the increase in the number of NSCs is more robust during the first 5 days of treatment, so we conclude that immediate or early HBO ad-ministration and a longer course of treatment may substantially enhance the prognosis for patients with HI brain injury.
Conclusion
In conclusion, the results of this study indicate that HBO treatment promotes the proliferation of NSCs and is likely to subsequently enhance reco-very following brain injury, thereby providing su-pport for the clinical application of HBO to treat neonatal HIBD.
Legends to the figures
Figure 1: the positive Brdu cells with SABC immunohistochemistry staining in different groups (×400). It showed that in HIBD+HIBO
Vers
ion fo
r revie
w
1910
HealthMED - Volume 6 / Number 6 / 2012
Journal of Society for development in new net environment in B&H
group, the counts of BrdU+ cells were more than HIBD and control groups at each point (1-1:control group,1-2: HI group,1-3: HBO treated group; A-5st days, B-14th days).
Figure 2: the Nestin positive NSCs with SABC immunohistochemisty staining in different time (×400). It can be seen from this picture that HBO treatment significantly increased the number of nestin+ cells after HI. The number of nestin+cells in-creased more gradually on the 3rd day and peaked on the 5th day. Thereafter, the number of nestin+ cells began to decrease gradually after the 14th day and reached the lowest levels on the 21st day (2-1: 1st d,2-2:5th d, 2-3:7th d and 2-4:21st d; A-control group, B-HIBD group, C-HIBD+HBO group).
Figure 3: Change in NSCs in different time after HI in three groups. The curve chart showed that the changing tendency of proliferating NSC in each group. The proliferation of NSC reached the highest levels at 5th day after HI and treatment with HBO. Compared between HIBD+HBO and HIBD or control groups, all p<0.05 within each time point.
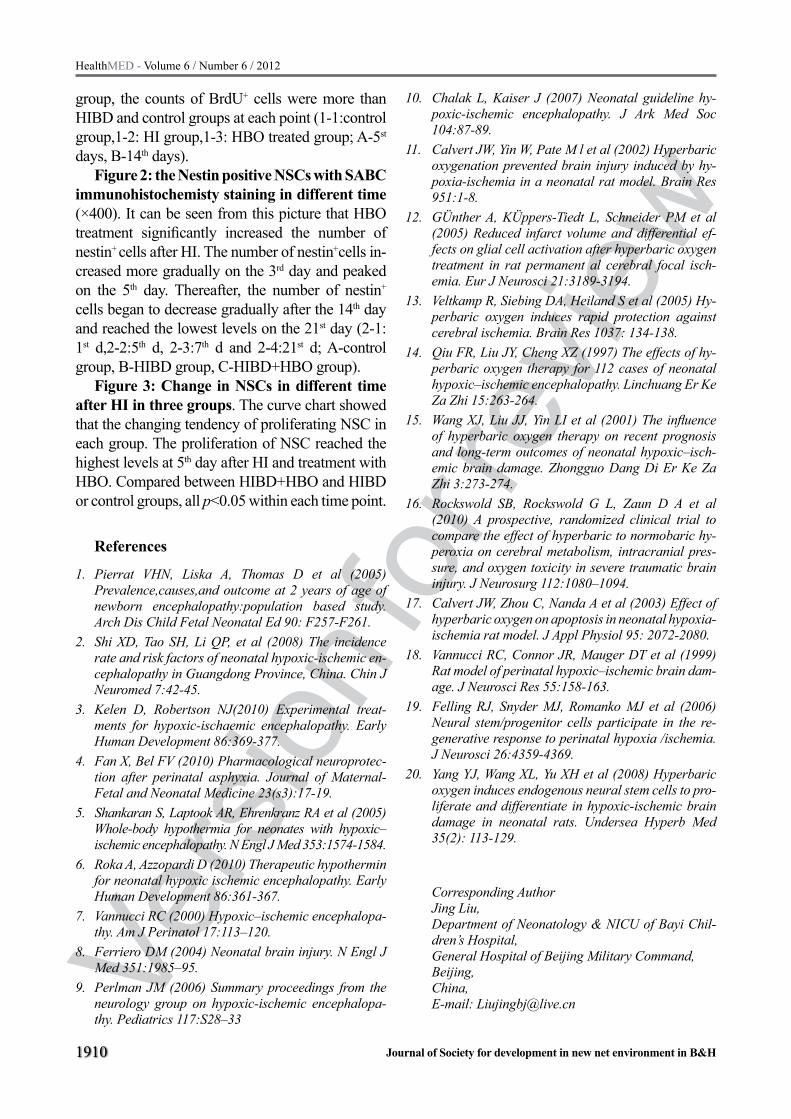
References
1. Pierrat VHN, Liska A, Thomas D et al (2005) Prevalence,causes,and outcome at 2 years of age of newborn encephalopathy:population based study. Arch Dis Child Fetal Neonatal Ed 90: F257-F261.
2. Shi XD, Tao SH, Li QP, et al (2008) The incidence rate and risk factors of neonatal hypoxic-ischemic en-cephalopathy in Guangdong Province, China. Chin J Neuromed 7:42-45.
3. Kelen D, Robertson NJ(2010) Experimental treat-ments for hypoxic-ischaemic encephalopathy. Early Human Development 86:369-377.
4. Fan X, Bel FV (2010) Pharmacological neuroprotec-tion after perinatal asphyxia. Journal of Maternal- Fetal and Neonatal Medicine 23(s3):17-19.
5. Shankaran S, Laptook AR, Ehrenkranz RA et al (2005) Whole-body hypothermia for neonates with hypoxic–ischemic encephalopathy. N Engl J Med 353:1574-1584.
6. Roka A, Azzopardi D (2010) Therapeutic hypothermin for neonatal hypoxic ischemic encephalopathy. Early Human Development 86:361-367.
7. Vannucci RC (2000) Hypoxic–ischemic encephalopa-thy. Am J Perinatol 17:113–120.
8. Ferriero DM (2004) Neonatal brain injury. N Engl J Med 351:1985–95.
9. Perlman JM (2006) Summary proceedings from the neurology group on hypoxic-ischemic encephalopa-thy. Pediatrics 117:S28–33
10. Chalak L, Kaiser J (2007) Neonatal guideline hy-poxic-ischemic encephalopathy. J Ark Med Soc 104:87-89.
11. Calvert JW, Yin W, Pate M l et al (2002) Hyperbaric oxygenation prevented brain injury induced by hy-poxia-ischemia in a neonatal rat model. Brain Res 951:1-8.
12. GÜnther A, KÜppers-Tiedt L, Schneider PM et al (2005) Reduced infarct volume and differential ef-fects on glial cell activation after hyperbaric oxygen treatment in rat permanent al cerebral focal isch-emia. Eur J Neurosci 21:3189-3194.
13. Veltkamp R, Siebing DA, Heiland S et al (2005) Hy-perbaric oxygen induces rapid protection against cerebral ischemia. Brain Res 1037: 134-138.
14. Qiu FR, Liu JY, Cheng XZ (1997) The effects of hy-perbaric oxygen therapy for 112 cases of neonatal hypoxic–ischemic encephalopathy. Linchuang Er Ke Za Zhi 15:263-264.
15. Wang XJ, Liu JJ, Yin LI et al (2001) The influence of hyperbaric oxygen therapy on recent prognosis and long-term outcomes of neonatal hypoxic–isch-emic brain damage. Zhongguo Dang Di Er Ke Za Zhi 3:273-274.
16. Rockswold SB, Rockswold G L, Zaun D A et al (2010) A prospective, randomized clinical trial to compare the effect of hyperbaric to normobaric hy-peroxia on cerebral metabolism, intracranial pres-sure, and oxygen toxicity in severe traumatic brain injury. J Neurosurg 112:1080–1094.
17. Calvert JW, Zhou C, Nanda A et al (2003) Effect of hyperbaric oxygen on apoptosis in neonatal hypoxia-ischemia rat model. J Appl Physiol 95: 2072-2080.
18. Vannucci RC, Connor JR, Mauger DT et al (1999) Rat model of perinatal hypoxic–ischemic brain dam-age. J Neurosci Res 55:158-163.
19. Felling RJ, Snyder MJ, Romanko MJ et al (2006) Neural stem/progenitor cells participate in the re-generative response to perinatal hypoxia /ischemia. J Neurosci 26:4359-4369.
20. Yang YJ, Wang XL, Yu XH et al (2008) Hyperbaric oxygen induces endogenous neural stem cells to pro-liferate and differentiate in hypoxic-ischemic brain damage in neonatal rats. Undersea Hyperb Med 35(2): 113-129.
Corresponding Author Jing Liu, Department of Neonatology & NICU of Bayi Chil-
dren’s Hospital, General Hospital of Beijing Military Command, Beijing, China, E-mail: [email protected]

Vers
ion fo
r revie
w
HealthMED - Volume 6 / Number 6 / 2012
Journal of Society for development in new net environment in B&H 1911
Abstract
This study has been done to identify nursing stu-dents' opinions about how should be the character-istics of nurses who working in the relevant sections with the children. The study was conducted with the nursing students who successfully complete the child health and illness nursing education in the third-year. This study was carried out with the third grade years. The conditions sought as the criteria for inclusion in the study to take lesson of Child Health and Nursing and having success and willing to participate in the study. The data was collected by questionnaire which distributed to students after necessary explanation. The open-ended question was asked to the students: ‘What is your opinion about how should be the characteristics of a good Pediatric Nurse?. The obtained data was classified and evaluated as a percentage by researchers.
It was determined that 83.6% of the students who participating in the study were girls (n = 46), 16.4% male (n=9) and the average age is as 21.85. The student nurses propose that good children nurse should have; patience and consideration % 72.7 (n=40), caress of children %50.9 (n=28), geniality %43.6 (n=24), adequate theoretically knowledge on pediatric nursing % 41.8 (n=23), communicate well % 41.8 (n=23), empathy %30.9 (n=17), prac-tice %27.2 (n=15), careful %25.4 (n=14), able to give discharge training %18.2 (n=10), social %14.5 (n=8) right medicine principles, keeping innova-tions, education, successfully, balance work and pri-vate life, courageous, follower, honest, importance at team work, humaneness, persuade, love in nurs-ing, harmonic, regard of hygiene, norm behaviors.
As a result, it was seen that most of students are expressed their properties, to be patient and love the children. Very few students reported love the job, team work and role of educators are not seriously.
Key words: Good Pediatric nurses’ character-istics, good characteristics, student nurses
Introduction
Good nurses are regaining attention as a way to establish a comprehensive nursing ethical model, which will appropriately reflect actual nursing (1). Ethical nursing is what happens when a good nurse does the right thing (2). Good nurses are shown to be characterized by specific, but inter-related, attitudes, skills and knowledge; they engage in person-to-per-son relationships, respect the uniqueness of patients, and provide support (3). Children’s nursing has much in common with other branches of the profes-sion but there are also differences. Children’s nurses have knowledge of the psychosocial and biological development of children and in common with all nurses; they are a communication conduit owing to their contact with members of the multidisciplinary team (4). Children and families are an integral part of that team, facilitated by the children’s nurse, who works in partnership with them to provide care (5).
Pediatric nurses play an important role in mak-ing children better. A good Children nurse have to be able some characteristics. A nurse with a quick smile, endless patience, and a friendly personal-ity can make the experience of staying in a hospi-tal a lot less scary for kids. Pediatric nurses must also be able to easily relate to worried parents and other family members. Professional and trained skills as well as broad and specific nursing and non-nursing knowledge are important (5).
Children's method of communicating with oth-ers is different from adults, so nurses caring for children need to understand that method in order to effectively communicate with young clients and develop appropriate strategies (6). A good Children nurse have the ability to put a child at ease. Good Children nurses are obliged to provide quality nurs-ing care that meets the good standards of their pro-fession. To acquire and practice the skill of good pediatric nurse is essential for nurses in order for them to be able to influence a health care receive.
Good Pediatric Nurse’ Characteristics In According To Student NursesNursan Cinar1, Insaf Altun2
1 Sakarya University School of Health Sciences, Department of Child Health Nursing Sakarya, Turkey,2 Kocaeli University Department of Fundamentals in Nursing, Umuttepe, Kocaeli, Turkey.

Vers
ion fo
r revie
w
1912
HealthMED - Volume 6 / Number 6 / 2012
Journal of Society for development in new net environment in B&H
Research relating to nurses' views of the good nurse has mainly focused on the perspectives of nurses ( 7-10), with little exploring the perceptions good Children nurse of nursing student.
The purpose of this descriptive, qualitative study was therefore to examine student nurses' perceptions of what it means to be a good Chil-dren nurse. We hope that the opinions of students about the characteristics of a good Children nurse, and the presence or absence of these opinions among the reported fields of competency, may be included in discussions leading to changes and de-velopment within structured Children nurse edu-cation program.
Method
This descriptive and qualitative study was con-ducted to determine nursing students' observation of good Children nurse’ characteristics expected in their clinical practice. We planned this study with nursing students at high school of health of Sakarya University to explore the perception that nursing students exhibit with good nurse in the finish (spring term 2010) their education. Three class student nurses were recruited during issues on at the good nurse characteristics in Children nursing lecture by lecturer. A convenience sample of 55 participant was achieved virtually all of the registrants at the lecture. Lecture attendees who chose to participate were asked to respond in wri-ting to the following one open-ended questions : “A good Children nurse is one who……….”
Data were collected through a questionnaire from 55 volunteer nursing students at a univer-sity-based nursing school in Sakarya, Turkey. Participant’s consent was obtained to use their an-swers for the purpose of this study. Open –ended question were analysed using content analysis and techniques
Results
This article presents findings from a qualitative study that explored views of the good Children nurse from the perspective of student nurses. The aims of the study were to identify characteristics of the good Children nurse from the perspective of student nurses in University. 55 student nurses
were interviewed using a write technique. We asked the participating student nurses which the most im-portant 5 Characteristics for Good Children Nur-ses’. Characteristics relating to student's views of the good nurse emerged from the analysis: patience and consideration % 72.7 (n=40), caress of chil-dren %50.9 (n=28), geniality %43.6 (n=24), adequ-ate theoretically Knowledge on pediatric nursing % 41.8 (n=23), communicate well % 41.8 (n=23), empathy %30.9 (n=17), practice %27.2 (n=15), ca-reful %25.4 (n=14), able to give discharge training %18.2 (n=10), social %14.5 (n=8) right medicine principles, keeping innovations, education, educa-tion, successfully, balance work and private life, courageous, follower, honest, importance at team work, humaneness, persuade, love in nursing, har-monic, regard of hygiene, norm behaviors. (Table 1). Each of these will be discussed in relation to good nurse literature and recommendations made for student nurses’ nursing practice.Table 1. Good Pediatric Nurses’ Characteristics (N=55)Good Pediatric nurse should have n % 1. patience and consideration, 40 72.72. caress of children, 28 50.93. geniality, 24 43.64. adequate theoretically knowledge on pediatric nursing, 23 41.8
5. communicate well, 23 41.86. empathy, 17 30.97. practice, 15 27.28. careful, 14 25.49. given discharge training, 10 18.210. social, 8 14.511. right medicine principles, 6 10.912. keeping innovations, 6 10.913. regard of hygiene, 6 10.914. love in nursing, 6 10.915. courageous, 6 10.916. follower, 6 10.917. honest, 6 10.918. humaneness, 6 10.919. harmonic, 5 9.120. importance at team work, 5 9.121. persuade, 4 7.322. education, 3 5.523. balance work and private life, 2 3.624. norm behaviour, 1 1.8

Vers
ion fo
r revie
w
HealthMED - Volume 6 / Number 6 / 2012
Journal of Society for development in new net environment in B&H 1913
Discussion
Children nurses play a key role in meeting children's nursing needs, taking into account their medical, social, cultural and family circumstanc-es. Good nurses do make a difference in the care of children patients. In addition to the basic char-acteristics that are beneficial to all nurses, pediat-ric nurses often possess additional skills and char-acteristics that help them with working with this specific age group.
This study sought to gain an insight into per-ceptions of a 'good nurse' among Children nurses, and to identify its central components. By under-standing these factors, it was hoped that common difficulties could be identified, enabling recom-mendations to be made to enhance patient care and reduce the pressures to which nurses are exposed.
In the study of Brady (5) presents findings from a qualitative study that explored views of the good nurse from the perspective of hospitalized children. Five themes relating to children's views of the good nurse emerged from the analysis: co-mmunication; professional competence; safety; professional appearance; and virtues. According to Brady (5) five themes relating to children's vi-ews of the good nurse emerged from the analysis: communication; professional competence; safety; professional appearance; and virtues.
In Brady's study (5) it was reported that be-ing smiling and speak with a soft tone, being clean and tidy such as features emphasizes mostly by children at the beginning of a good nurse charac-teristics. In our study as well, the student nurses' opinion among well pediatric nurse characteristi-cs, the first row is being smiling, to be patient and communicate well. This suggested to us that our students being a good observer and able to make empathy during children's course of clinical prac-tice. To focus on these features and learn the te-chniques of good communication with children is extremely important during the training of stu-dents. When they graduated and preferred to work in pediatric clinics, these properties will be the so-ught properties on themselves. At the same time they will be more successful and satisfied in the working environment.
In the study Schmidt et al (11) seven themes emerged from the children's responses. Children
appreciated nurses who smiled and used kind words (positive attitude/affect), took measures to reduce pain (physical comfort), provided age-appropriate diversion and light-hearted conversation (enterta-inment/humor), promoted positive well-being and a sense of security (advocacy), provided food and medicine (basic needs), interacted with them as an individual (acknowledgment), and provided com-fort and support (reassurance). Differences were noted by age, chronicity, parental presence, prior admission, and days in the hospital (11).
According to the results of the current study, pa-tience and consideration as the first ranking in the characteristic of good nurses (Table 1). It is likely that, although patience and consideration should be a desired characteristic in minds of the professio-nals, especially for the practical and registered nur-ses, there appears to be a considerable disagreement in the nurses' profession understanding.
Nonetheless, for their selves, the characteristic of caress of children, geniality adequate theoreti-cally knowledge on pediatric nursing, communi-cate well, empathy, practice, careful, able to give discharge training, social, right medicine prin-ciples, keeping innovations, education, education, successfully, balance work and private life, coura-geous, follower, honest, importance at team work, humaneness, persuade, love in nursing, harmonic, regard of hygiene, norm behaviors seems to have less importance (Table 1).
Randall et al. (12) had reported the children were able to identify three areas of learning that could help to make a good children's nurse. The researchers categorised these as: attitudinal and professional persona; Cognitive and psychomo-tor learning; experiential learning (12). A pediatric nurse has a true understanding of the special needs of children. Their bodies are growing and they often have particular needs in relation to injuries, illness, and medications. Pediatric nurses have to be able to communicate well with both children and adults to determine the best course of action in many situations. Children's nurses are special people with some innate characteristics; they also needed education to make them good at nursing children. A good pediatric nurse have the ability to put a child at ease and, often just as important, separate the child from the parent so that the pa-tient’s fears aren’t fed by the parent’s histrionics.

Vers
ion fo
r revie
w
1914
HealthMED - Volume 6 / Number 6 / 2012
Journal of Society for development in new net environment in B&H
Given that nurse-patient interaction is essential factor in nursing care, the ability to interact with patient is the one of the important characteristics as a professional nurse.
The data suggest that nursing student good nurse perceptions is often influenced by seeing nurses in practice. Therefore role models must be determined that the good nurse’ characteristic and served as good nurse (13). The characteristics that define good nurses lead to effective nursing care and increase the well-being of padeatric patients.
Nurses caring for children should acknowledge them (with conversation or smiles) with each in-teraction, provide age-appropriate diversion and friendly interaction, provide basic needs in a gentle manner, and engage in protective and advocacy be-haviors, such as frequent stops to assure a child's safety and well-being. Children appreciate a smile, a gentle touch, and kind words. Nurses who care for children should realize their continued need for physical comfort, reassurance, and conversation and know that these children understand and appre-ciate the advocacy roles nurses assume.
Conclusion
Pediatric nursing is very different from any other types of nursing. As a result, it was seen that most of students are expressed their properties, to be patient and love the children. Very few students reported love the job, team work and role of educa-tors are not seriously. Nurse education plays a cru-cial role in the development of good nursing prac-tices. Nursing ethics education in particular aims to encourage virtuous attitudes, forming the foundati-on from which to provide good care. Being a good nurse requires an effective learning process. There-fore nursing educators is must be prepared student nurses for good nurse characteristic. Also the good nurse perceptions of student in the teaching of nurs-ing will contribute to this process (13).
The result of this study would help us as educa-tors to design strategies for more effective clinical teaching. The results of this study should be con-sidered by nursing education and nursing practice professionals. Faculties of nursing need to be con-cerned about good Pediatric nurse characteristics in education and clinical practice. The findings support the need for Faculty of Nursing to plan
nursing curriculum in a way that nursing students be involved actively in their education.
If students can be educated in ways that sustain and enhance their good Children nurse charac-teristics, and in particular foster the concept they already possess (at the beginning of their three year) of an ‘good Children nurse’ who will meet the expectations of the patients they are preparing to serve professionally, this will contribute sig-nificantly to their development as good Children nurse. Equally, it is important that the curriculum include opportunities to identify and acquire any appropriate characteristics in which they are lack-ing. The authors believe that it would be useful to carry out further research studies on the way in which students change their characteristics, and their good Children nurse, during training. They would also welcome more research on how dif-ferent clinical situations can impact on students’ characteristics, as this could have an important impact on developing the good Children nurse characteristics of the lesson of Child Health and Nursing curriculum.
Our research results cannot be applied to all the children nurses in the country. More wide-ranging research would be necessary before generaliza-tions are made. This study sought to gain an in-sight into perceptions of a ' good Children nurse' among student nurses, and to identify its central components. Our findings suggest that many of the characteristics identified by these three-year nurs-ing students as ‘characteristics of a good Pediatric Nurses’’ are in line with the competency fields of the projects that combine clinical knowledge and skills with humanitarian values.
References
1. Izumi S, Konishi E, Yahiro M, Kodama M. Japanese patients' descriptions of "the good nurse": personal involvement and professionalism. ANS Adv Nurs Sci. 2006; 29(2): E14-26.
2. Smith KV, Godfrey NS. Being a good nurse and doing the right thing: a qualitative study. Nurs Ethics. 2002; 9(3): 301-12.
3. Rchaidia L, Dierckx de Casterlé B, De Blaeser L, Gastmans C. Cancer patients' perceptions of the good nurse: a literature review. Nurs Ethics. 2009; 16(5): 528-42.

Vers
ion fo
r revie
w
HealthMED - Volume 6 / Number 6 / 2012
Journal of Society for development in new net environment in B&H 1915
4. Chen JY. Morale and role strain of undergraduate nursing students in a pediatric clinical setting.J Nurs Res. 2010; 18(2):144-53.
5. Brady M. Hospitalized children's views of the good nurse. Nurs Ethics. 2009;16(5):543-60.
6. Hyunsook S. Analysis of Metacommunicative Epi-sodes between Nurses and Children. J Korean Acad Child Health Nurs 2009; 15 (1): 53-60.
7. Bektaş N, Yıldız B, Telli A, Ökke S, Gülhan G, Al-tun I. Patients’ perspections of good nurse: A pilot study.3th national nursing congress congress abstract book.2004;102.
8. Ersoy N, Altun I. Professional and Personal Values of Nursing in Turkey. Eubios Journal of Asian and Inter-national Bioethics.1998; 8: 72-75.
9. Gülhan G, Yıldız B, Bektaş N, Telli A, Ökke S, Altun I. In according to nurses characteristics of good nurse: A pilot study.3th national nursing congress congress abstract book.2004;100.
10. Yıldız B, Bektaş N, Ökke S, Telli A, Gülhan G, Altun I. Final Nursing students’ perceptions of good nurse: A pilot study.3th national nursing congress congress abstract book.2004;101.
11. Schmidt C, Bernaix L, Koski A, Weese J, Chiappetta M, Sandrik K. Hospitalized children's perceptions of nurses and nurse behaviors.MCN Am J Matern Child Nurs. 2007;32(6): 336-42; quiz 343-4.
12. Randall D, Brook G, Stammers P. How to make good children's nurses: children's view. Paediatr Nurs. 2008; 20(5): 22-5.
13. Altun I. Nursing students’ perceptions of good nurse: A pilot study. 2nd international 9th national nursing congress congress book. 2003; 409-13.
Corresponding Author Nursan Cinar, Sakarya University, School of Health Sciences, Turkey, E-mail: [email protected]
Vers
ion fo
r revie
w
1916
HealthMED - Volume 6 / Number 6 / 2012
Journal of Society for development in new net environment in B&H
Abstract
Tick borne relapsing fever (TBRF) is endemic in six north-western and central provinces of Iran, including Mazandaran, from where the disease has been reported for many years. In surveys carried out in 2008 and 2009, we recorded the presence of O. lahorensis and of Ornithodoros tholozani which is the main vector of TBRF in Iran. O. tholozani were found infesting the walls of animal housing adjacent to human homes while O. lahorensis were found on the bodies of domestic animals, particu-larly in the fleece on sheep, an apparent phoretic be-haviour that might facilitate dispersal of these soft ticks. O. tholozani is reported here for the first time in Mazandaran an increasingly popular holiday de-stination for the population of Tehran and Iran.
Key words: TBRF, relapsing fever, Ornitho-doros, tholozani, Borrelia, persica, tick, Argasid, vector, Iran
Introduction
Tick-borne relapsing fever (TBRF) is a poten-tially fatal human infection caused by Borrelia spirochaetes and transmitted by soft ticks (Argasi-dae), usually of the genus Ornithodoros. It is found worldwide with the exceptions of Australasia and the Pacific region (Assous & Wilamowski, 2009; Jongejan & Uilenberg, 2004; Service, 2008; Warre-ll & Parry, 2004). Typically it is a zoonotic disease with rodents as reservoir hosts, although in Africa, insectivores and some domestic animals also are in-fected (McCall et al., 2007; Vial et al., 2006).
In Iran, Joseph Désiré Tholozan first described the disease in 1879. As he also recognised the association with ticks, the vector species Ornitho-doros tholozani Laboulbène & Mégnin, 1882 was named after him (Rodhain, 1998; Théodoridès, 1998). TBRF still occurs today in 18 of the 30 Iranian provinces, and it is considered endemic in five provinces of the north west, Ardabil, Hama-dan, Zanjan, Kordestan and Qazvin, where 90% of all TBRF cases in Iran occur (Arshi et al., 2002; Nabian & Rahbari, 2008; Rahbari, Nabian, & Shayan, 2007). A total of 500 cases were reported in 2002, falling to 50 in 2006, a reduction that may be attributable to improvements in housing, acce-ss to healthcare, case detection and treatment and possibly reductions in domestic tick populations arising from the increased use of insecticides in the home against a range of vectors and nuisance insects (Aghighi et al., 2007).
Most TBRF cases occur in rural areas, particular-ly in communities where maintenance of livestock is the primary occupation. Cases occur in every month but reach highest levels during the drier se-ason from June to November (Arshi et al., 2002; Masoumi Asl et al., 2009). The disease is more common in children and in migrants from non-en-demic areas, suggesting that ongoing transmission in endemic areas sustains some degree of immuni-ty in local human populations (Arshi et al., 2002; Masoumi Asl et al., 2009). Although four Borrelia species, B. persica, B. microti, B. latyschewii and B. baltazardi, have been recorded in Iran, B. persica has been identified in the majority of clinical ca-
First records of Ornithodoros sp. soft ticks from an endemic relapsing fever region in Northern IranA.A. Enayati1, F. Asgarian1, A. Amouei2,B. Esfandiari3,M. Oshaghi4, J. Hemingway5, P.J. McCall5
1 Department of Medical Entomology, School of Public Health and Health Sciences Research Centre, Mazandaran University of Medical Sciences, Sari, Iran,2 Mazandaran Provincial Veterinary Department, Sari, Iran,3 Pasteur Institute of Iran, Tehran, Iran,4 Department of Medical Entomology and Vector Control, School of Public Health, Tehran University of Medical Sciences, Tehran, Iran,5 Liverpool School of Tropical Medicine, Liverpool, United Kingdom.
Vers
ion fo
r revie
w
HealthMED - Volume 6 / Number 6 / 2012
Journal of Society for development in new net environment in B&H 1917
ses (Aghighi et al., 2007; Masoumi Asl et al., 2009; Pouladfar, Alborzi, & Pourabbas, 2008; Rafinejad et al., 2011; Vatandoost et al., 2003), with B. balta-zardi found in only a few cases (Arshi et al., 2002).
Four Ornithodoros species (Ornithodoros tho-lozani Laboulbène & Mégnin, 1888; Ornithodo-ros lahorensis Neumann 1908; Ornithodoros ca-nestrinii Birula 1895 and Ornithodoros erraticus Lucas, 1849) have been recorded in Iran within the past ten years. O. lahorensisis the most wide-spread species and often the most abundant, while O. canestrinii was the only species found recently in the eight northwestern provinces (Nabian & Ra-hbari, 2008). O. tholozani is less common but pro-bably the most important vector of TBRF; the ot-her more common tick species may not be vectors. For example, O. lahorensis, O. canestrinii and O. tholozani were collected in animal and human shelters in Hamadan province, but only O. tho-lozani (3.7%) were infected with Borrelia (iden-tified as B. persica by (Vatandoost et al., 2003). In other locations, even when all four tick species were found, only O. tholozani was infected with B. persica (Aghighi et al., 2007; Arshi et al., 2002; Masoumi Asl et al., 2009; Nekoui, Assmar, Amir-khani, & Pyazak, 1999; Telmadarraiy, Bahrami, & Vatandoost, 2004). The only other infections found were B. microti in O. erraticus, which was found mainly in rodent burrows (Aghighi et al., 2007; Arshi et al., 2002; Masoumi Asl et al., 2009; Telmadarraiy et al., 2004). Hence, O. tholozani is considered the primary vector and B. persica the main causative agent of human TBRF in Iran.
The northern Province of Mazandaran is of par-ticular interest given that cases of TBRF have been reported here in recent years (Masoumi Asl et al., 2009). In terms of geography, rural practices and climate, it is similar to Ardabil province where the highest TBRF figures are recorded (Masoumi Asl et al., 2009), yet recent vector surveys either found no Ornithodoros ticks (Nabian, Rahbari, Shayan, & Haddadzadeh, 2007) or only O. lahorensis (Shaye-ghi, Khoram Rooz, & Piazak 2004). Mazandaran is of particular interest as it has become increasingly popular as a holiday destination for the population of Iran, and as it is relatively close as a potential study site to Tehran. We undertook a survey of selected parts of the province and report here on the first re-cords of potential TBRF vectors from this area.
Materials and Methods
The survey was undertaken in Sari Township, the capital of Mazandaran province (36° 34’ 4” North, 53° 3’ 31” East, map 1). Mazandaran pro-vince has two distinct geographical areas: a mo-untainous area where livestock (sheep, goats and cows) are common and a lower plain/littoral area where cultivation of rice and wheat predominates. At least one village was visited and sampled in both highland and plain areas in Sari Township in every month during 2008 and 2009. Daily recor-ds of temperature, relative humidity and rainfall were obtained from the meteorology departments of Mazandaran province and Sari town.
The walls of animal and human dwellings were closely examined and every crack, hole and cre-vice was widened or explored well beneath the surface, breaking apart lumps of material if neces-sary, as few ticks were ever seen in the superficial layers. Ticks were gently extracted with forceps and transferred to labelled plastic tubes containing corrugated filter paper for transport to an insectary (28±2○C temperature, 70±5% relative humidity and 12:12 dark: light photoperiod).
Individual animals were also examined for the presence of soft ticks. Attention was paid to all areas of the body, especially areas with thick wool.
Ticks were identified to species level using identification keys (Walker et al., 2003).
Results and Discussion
A total of 52 villages were sampled over the two-year study period, 14 in the plain and 38 in the higher mountainous region. No soft ticks were collected in any of the villages in the plain regi-on at any time of year. In the mountainous areas, ticks were found in only 2 villages. All the ticks were identified as either Ornithodoros tholozani Laboulbène & Mégnin, 1888 or Ornithodoros la-horensis Neumann 1908.
O. tholozani was collected in large numbers from the cracks and crevices of animal shelters in adobe houses in the village of Vary (36○15’52” N, 53○30’24” E; altitude 1225m) 75 km south of Sari, in April and December 2008. All samples of O. tholozani were collected from deep cracks and crevices in the walls of the mud-walled and that-

Vers
ion fo
r revie
w
1918
HealthMED - Volume 6 / Number 6 / 2012
Journal of Society for development in new net environment in B&H
ched animal shelters, a typical habitat for many Ornithodoros species. These animal shelters adjo-in human habitations and animals were often kept in the same rooms as sleeping humans at night. No ticks were found in newer brick and cement housing in the same villages.
O. lahorensis was collected from animals (mainly sheep) and housing in the village of Bard (36○13’01” N, 53○47’58” E; altitude 2250m) some 40 km from Vary, in September 2008. All stages and both sexes of O. lahorensis were more frequently found on the animals than in cracks and crevices of the walls even when not blood feeding. Here, animals were kept on a separate floor below the human-occupied level in the same mud-walled and thatched dwelling.
The human population of this region is predo-minantly rural and living standards and socio-eco-nomic levels are well below average for the region and Iran generally. Domestic animals are housed in close proximity to human dwellings or sometimes together with humans in the same house. The tradi-tional house building materials give rise over time to the numerous cracks and crevices that provide a highly suitable environment for argasid ticks.
The study area comprised of two main regi-ons of plain/littoral and mountainous areas. The mean annual rainfall in the Sari Township was 700 mm, however, much of the rainfall occurred in the plain/littoral region. The mountainous areas were comparatively dry and cold in winter. The clima-tological factors of the study area are summarized in Table 1. There are major differences in mean humidity and temperature between the two regi-ons of the study area, which may explain the dif-ferences in the fauna and the abundance of the soft ticks collected. No soft ticks were collected from the plain/littoral region of the study area.
The mountainous regions of the study area are mostly rural with low living standards. Domesti-cated animals are kept in close proximity to hu-man dwellings in the residential complex of each family. The houses and animal shelters are mainly made out of thick row mud brick walls often with many cracks and crevices which make the perfect hideouts and breeding places for the argasid ticks.
Although different Ornithodoros ticks have been found in northwest Iran, this is the first report of two species of soft ticks in the mountainous re-
Figure 1. Map of Iran and Mazandaran Province which is situated in the North of Iran and Alborz mountain range, and South of the Caspian Sea. Sari (in gray) is the capital city of the province.

Vers
ion fo
r revie
w
HealthMED - Volume 6 / Number 6 / 2012
Journal of Society for development in new net environment in B&H 1919
gion with totally different climatological characte-ristics (Table 2).
A seasonality in abundance of soft ticks was observed in northwestern parts of the country, whe-re the soft ticks were abundant during November to March (Nabian & Rahbari, 2008; Rahbari et al., 2007). In contrast, the abundance of O. lahorensis in Mazandaran province was much lower in winter than in other seasons (Shayeghi, piazak, Yazdi, & Abolhasani, 2004). However, in our study no cle-ar pattern of seasonality was observed. This might be attributable to climate differences between the northern and northwestern parts of the country. The average minimum temperature recorded in the nor-thern parts of the country where our study areas are situated, was rarely below -2 ºC, while the tem-perature in the northwestern parts of the country is lower than – 10ºC in most winter months .
During winter the O. lahorensis ticks may prefer the warmth of their animal host rather than occupy the cracks and crevices of the walls of the animal or human shelters, where they spend the warmer sum-mer months. During the winter it was possible to co-llect non-blood feeding and molting ticks and their shed exoskeletons from the fleece of their hosts.
Earlier studies, where seasonal abundance shifts were reported concentrated on examining the ani-mal hosts (Nabian & Rahbari, 2008; Rahbari et al., 2007), and may have under estimate the numbers
living in animal and human dwellings. Telmadarra-iy et al (2004) reported no seasonality in the abun-dance of soft ticks, predominantly O. lahorensis co-llected from West Azarbaijan Province in Iran, after searching both cracks and crevices of the walls and animal hosts (Telmadarraiy et al., 2004).
A clear difference was observed between the ecological niches of O. lahorensis and O. tholoza-ni. Although both species prefer the mountainous areas over the lowlands, O. lahorensis was more abundant in dryer and semi-arid environments compared with O. tholozani. The latter species was found in lower altitude mountainous areas with higher relative humidity and less extreme temperature fluctuations.
O. tholozani, did not show any seasonality in abundance and were rarely collected from ani-mals, but more commonly found from the cracks and crevices of the walls of the animal and human shelters throughout the year.
It is also important to distinguish between seaso-nal activity and seasonal abundance. What is repor-ted as seasonality might just be the seasonal activity of the ticks rather than the seasonal abundance.
Confirmed cases of TBRF have been recorded from Mazandaran in recent years (Masoumi Asl et al., 2009), but this is the first record of the main Iranian TBRF vector O. tholozani in the province. Future work will determine if they harbour Borre-
Table 1. Climatologic factors of the two study areas in Sari Township, North of Iran. Sari represents the plain/littoral area and Kiasar represents the mountainous area.Area/Month Mar. Apr. May June July Aug. Sep. Oct. Nov. Dec. Jan. Feb. M AM
Sari Mean T 17.6 20 23.6 26.1 28.7 28 21.2 14.6 11.4 7.4 10 13 18.4 7.4
AM min T 8.4 9.4 15.8 18.8 21.2 19 14.4 4.4 -1 -1.8 0 6 9.6 -1.8 M min RH 49 54 54 57 52 51 60 60 60 59 60 48 55 48
Kiasar Mean T 9.1 13.6 20.2 18.9 24.6 21.7 15.3 12.9 5.9 -3.4 0 9.5 12.4 -3.4
AM min T -1.4 2.4 10 12.4 14.6 12.4 6 3 -8 -12.8 -9.6 -5.8 1.9 -12.8 M min RH 52 58 48 70 45 42 47 36 51 54 54 29 44 29
Table 2. Frequency and collection point of the soft tick species in Sari Township, North of Iran.Location/species O. tholozani O. lahorensis Altitude (m), climateVary 56* - 1200, cold and dry Bard - 68* 2200, colder and drier
Collection point Cracks and crevices of the animal shelters
Cracks and crevices of the animal shelters but mostly animals (mainly sheep) body -
*more ticks could be collected from the same dwellings within the village, but not from other villages in the area.

Vers
ion fo
r revie
w
1920
HealthMED - Volume 6 / Number 6 / 2012
Journal of Society for development in new net environment in B&H
lia sp. infections. The presence of O. tholozani in animal shelters raises the question of whether do-mestic animals might also be infected with Borre-lia sp., possibly even acting as reservoir hosts for human TBRF, as has been suggested in East Afri-ca (McCall et al., 2007).
The proximity of both tick species to domestic animals was not surprising, although the presence of multiple stages and exuviae of O. lahorensis wi-thin the wool of its sheep hosts, was an interesting observation. This suggests a level of adaptation where these soft ticks apparently remain on the host between blood meals to moult. If confirmed, it seems plausible that this behaviour should be a response to the cold and dry climate: mean daily temperatures here range from -3.4 to 24.6○C and relative humidity does not exceed 60% (data from the Meteorology department, Mazandaran provin-ce). It is not known whether other activities such as mating might also occur on the host.
The propensity of O. lahorensis (and also po-ssibly other species) to infest hosts, rather than buildings, could be a seasonal phenomenon, and ticks might return to the house during the warmer summer months. If so, it could give rise to false negatives when prospecting for domestic soft tick infestations if both locations were not investigated. Telmadarraiy et al. (2004) reported no seasonality in the abundance of soft ticks, predominantly O. la-horensis, after searching both cracks and crevices of the walls and animal hosts, whereas seasonal abun-dance shifts were reported when animal hosts alone were investigated (Nabian & Rahbari, 2008; Rah-bari et al., 2007). This behaviour also could result in a phoretic outcome for the ticks, permitting them to ‘migrate’ and colonise new housing elsewhere, a phenomenon never before considered for Orni-thodoros sp. or the Borrelia spp. that they might carry. Notably, the more important vector species O. tholozaniwere rarely collected from animals.
It is of interest that a proportion of the houses in these study sites are only temporarily inhabited, as the house owners live in the towns and only re-turn to their rural house during the summer mon-ths. Locally, Ornithodoros sp. are called “Qarib-gaz”, meaning something that bites foreigners or newcomers, and TBRF is named “Tabe Qaribgaz” meaning a fever of foreigners and newcomers, su-ggesting that locals were less troubled by the ticks
and had some level of protective immunity to Borrelia, as has been reported for endemic TBRF elsewhere (Dupont, La Scola, Williams, & Raoult, 1997; Pampana, 1928). This seasonal movement might result in humans, domestic animals and ticks functioning as vehicles for the dissemination of Borrelia sp. infections in Iran.
Clearly these aspects of TBRF epidemiology in the north and north west regions of Iran merit furt-her investigation. However, given the public heal-th importance of TBRF, more immediate steps can be considered to reduce the risk of infection. Do-mestic soft tick infestations can be eliminated by residual spraying of insecticides (Talbert, Nyange, & Molteni, 1998; Telmadarraiy et al., 2007)and other methods for control of domestic infestation of haematophagous Hemiptera, Siphonaptera and Diptera are also likely to be effective. Soft tick in-festations and TBRF are typically associated with low-grade housing and when humans and animals sleep in close proximity, behavior most common-ly associated with poverty worldwide. Thus, im-proved socio-economic levels, in addition to the multiple other benefits they bring, are likely to result in the gradual reduction and eventual dis-appearance of Ornithodoros from the house, ulti-mately leading to the elimination of this disease.
Acknowledgements
This project was funded by a grant from the Research Deputy of the Mazandaran University of Medical Sciences, Sari, Iran. We also would like to extend our gratitude to the technicians at the Mazandaran Provincial Veterinary Office.
References
1. Aghighi, Z., Assmar, M., Piazak, N., Javadian, E., Seyedi Rashti, M. A., Kia, E. B., et al. (2007) Distri-bution of Soft Ticks and Their Natural Infection with Borrelia in a Focus of Relapsing Fever in Iran. Irani-an J. Arthropod-Borne Dis., 1, 14-18.
2. Arshi, S., Majidpoor, A., Sadeghi, H., Asmar, M., Em-dadi, D., & Derakhshan, M. H. (2002) Relapsing fe-ver in Ardabil, a northwestern province of Iran. Arc-hive of Iranian Medicine, 5, 141-145.
3. Assous, M. V., & Wilamowski, A. (2009) Relapsing fe-ver borreliosis in Eurasia-forgotten, but certainly not gone!. Clin Microbiol Infect, 15, 407-414.

Vers
ion fo
r revie
w
HealthMED - Volume 6 / Number 6 / 2012
Journal of Society for development in new net environment in B&H 1921
4. Dupont, H. T., La Scola, B., Williams, R., & Raoult, D. (1997) A Focus of Tick Borne Relapsing Fever in So-uthern Zaire doi:10.1086/514496. Clinical Infectious Diseases, 25, 139-144.
5. Jongejan, F., & Uilenberg, G. (2004) The global im-portance of ticks doi:10.1017/S0031182004005967. Parasitology, 129, S3-S14.
6. Masoumi Asl, H., Goya, M. M., Vatandoost, H., Za-hraei, S. M., Mafi, M., Asmar, M., et al. (2009) The epidemiology of tick-borne relapsing fever in Iran during 1997-2006. Travel Medicine and Infectious Disease, 7, 160-164.
7. McCall, P. J., Hume, J. C. C., Motshegwa, K., Pi-gnatelli, P., Talbert, A., & Kisinza, W. (2007) Does tick-borne relapsing fever have an animal reservoir in East Africa? Vector borne and zoonotic diseases, 7, 659-666.
8. Nabian, S., & Rahbari, S. (2008) Occurrence of Soft and Hard Ticks on Ruminants in Zagros Mountainous Areas of Iran. Iranian J Arthropod-Borne Dis, 2, 16-20.
9. Nabian, S., Rahbari, S., Shayan, P., & Haddadzadeh, H. R. (2007) Current Status of Tick Fauna in North of Iran. Iranian J Parasitol, 2, 12-17.
10. Nekoui, H., Assmar, M., Amirkhani, A., & Pyazak, N. (1999) Distribution of ticks and their association with Borrelia in Semnan province. Iranian Journal of Public Health, 28, 103-110.
11. Pampana, E. J. (1928) Notes on colombian relap-sing fever. Transactions of the Royal Society of Tro-pical Medicine and Hygiene, 21, 315-328.
12. Pouladfar, G. R., Alborzi, A., & Pourabbas, B. (2008) Tick-Borne Relapsing Fever, a Neglected Ca-use of Fever in Fars Province. Iran J Med Sci, 33, 177-179.
13. Rafinejad, J., Choubdar, N., Oshaghi, M. A., Piazak, N., Satvat, T., Mohtarami, F., et al. (2011) Detecti-on of Borrelia persica Infection in Ornithodoros tholo¬zani Using PCR Targeting rrs Gene and Xe-nodiagnosis Iranian Journal of Public Health, 40, 138-145
14. Rahbari, S., Nabian, S., & Shayan, P. (2007) Pri-mary report on distribution of tick fauna in Iran. Pa-rasitology Research, 101, S175-177.
15. Rodhain, F. (1998) Joseph Désiré Tholozan and the Persian relapsing fever[Article in French]. Hist. Sci. Med., 32, 309-313.
16. Service, M. W. (2008) Medical Entomology for stu-dents. Cambridge University Press, Cambridge.
17. Shayeghi, M., Khoram Rooz, A., & Piazak , N. (2004) Geographical Distribution of Ticks (Soft and Hard) in City of Boyerahmad (Kohghiloyeh and Boyerah-mad Province). J.Env.Sci. Tech., Spring.
18. Shayeghi, M., piazak , N., Yazdi, F., & Abolhasani, M. (2004) Geographical distribution of soft and hard ticks in Mazandaran province [English abstract]. The Journal of the School of Public Health and In-stitute of Health Research, 3, 49-56.
19. Talbert, A., Nyange, A., & Molteni, F. (1998) Spraying tick-infested houses with lambda-cyhalot-hrin reduces the incidence of tick-borne relapsing fever in children under five years old. Transactions of the Royal Society of Tropical Medicine and Hygi-ene, 92, 251-253.
20. Telmadarraiy, Z., Bahrami, A., & Vatandoost, H. (2004) A Survey on Fauna of Ticks in West Azerbai-jan Province, Iran. Iranian J Publ Health, 33, 65-69.
21. Telmadarraiy, Z., Nasirian, H., Vatandoost, H., Abu-olhassani, M., Tavakoli, M., Zarei, Z., et al. (2007) Comparative susceptibility of cypermethrin in Or-nithodoros lahorensis Neuman and Argas persicus Oken (Acari: Argasidae) field populations. Pakistan Journal of Biological Sciences, 10, 4315-4318.
22. Théodoridès, J. (1998) A great Franco-Mauritian epidemiologist: Joseph Désiré Tholozan (1820-1897)[Article in French]. Bull Soc Pathol Exot., 91, 104-108.
23. Vatandoost, H., Ghaderi, A., Javadian, E., Zahir Nia, A., Rassi, Y., Piazak, N., et al. (2003) Distribu-tion of Soft Ticks and Their Infection with Borrelia in Hamadan Province, Iran. Iranian J Publ Health, 32, 22-24.
24. Vial, L., Diatta, G., Tall, A., Ba el, H., Bouganali, H., Durand, P., et al. (2006) Incidence of tick-bor-ne relapsing fever in west Africa: longitudinal study. Lancet, 368, 37-43.
25. Walker, A. R., Bouattour, A., Camicas, J. L., Estera-da-Pena, A., Horak, I. G., Latif, A., et al. (2003) Ticks of domestic animals in Africa, A guide to identificati-on of species. Biosciences Reports, Edinburgh.
26. Warrell, D. A., & Parry, E. H. (2004) Relapsing Fe-ver. In Infectious Diseases (Ed. by J. Chohen & W. Powderly). Mosby.
Corresponding Author A. Enayati, Department of Medical Entomology, School of Public Health and Health Sciences Rese-
arch Centre, Mazandaran University of Medical Sciences, Sari, Iran, E-mails: [email protected], [email protected]

Vers
ion fo
r revie
w
1922
HealthMED - Volume 6 / Number 6 / 2012
Journal of Society for development in new net environment in B&H
Abstract
Background: The use of cisplatin alone and in combination with other anticancer agents is asso-ciated with nephrotoxicity in all age patients.
Objectives: To investigate the nephrotoxic ef-fects of high and low doses of cisplatin when used in combinations with other anticancer drugs and to evaluate the relationship of nephrotoxicity and age.
Methodology: Patients were selected randomly and prospective study was carried out on patients admitted in Department of Oncology, Mayo Hospi-tal, Lahore, Pakistan. Sixty confirmed patients of a certain type of cancer were included in the present study. Chemotherapeutic regimens were selected on the basis of presence of cisplatin. Nephrotoxicity was estimated by comparing serum creatinine level to that of the reference value, 0.6-1.2 mg/dL.
Results: Out of sixty patients, twenty one (35%) were found to be having mild nephrotoxi-city, thirty two (53.33%) moderate nephrotoxicity, six (10%) severe nephrotoxicity and one (1.67%) very severe nephrotoxicity. Independent sample t-test was performed and p-value for comparison of group I and II (low and high dose groups, respec-tively) was 0.838, and group III and IV (younger and elder patient groups, respectively) was 0.027.
Conclusion: Cisplatin-induced nephrotoxicity is independent of protocol of administration, rat-her it depends upon the rate of administration and preventive measures can only reduce degree of severity. Elderly people are found to be more vul-nerable to this side effect than the younger ones.
Key words: Cisplatin, nephrotoxicity, admini-stration protocols, creatinine
Introduction
Malignant diseases encompass a wide range of common as well as rare illnesses. The former ones include lung, breast and colon cancer and the latter ones include acute leukemias.1 Treatment may be given with curative or palliative intent, depending upon the evidence from continuing clinical trials. 1 Most human neoplasms are monoclonal in origin i.e. arise from genetic mutations within a single affected cell, however, upon subsequent divisions heteroge-neity develops through the accumulation of further abnormalities.1 The kinetics of cancer cell growth appears to be exponential, however, the doubling ti-mes of human tumors are enormously variable.
Malignant diseases are the major causes of de-ath in the developed nations. One out of three pe-ople may be diagnosed with cancer during their life time. In year 2001, 270,000 new cases of can-cer were reported in the UK.2 Moreover, cancer is responsible for approximately one quarter of all deaths in the UK.2
Cisplatin (cis-diamminedichloroplatinum [II]) is the first member of platinum coordination com-plex class of anticancer drugs3, 4. It is soluble in water and exhibits sufficient stability for intrave-nous use5. It is a commonly used chemotherapeutic agent for the treatment of solid tumors including neuroblastoma, osteosarcoma, hepatic tumors, brain tumors, lung cancer and carcinoma of head and neck, testicular cancer, ovarian cancer, cervi-cal cancer, cancer of endometrium, bladder cancer as well as oropharyngeal cancer.6 The clinical use of this drug is associated with dose-limiting nep-hrotoxicity which primarily affects S3 segment of the renal proximal tubules, which occurs in one-third of the patients despite intensive prophylac-tic measures7, 8. Although the exact mechanism of action is unknown but this is thought to be similar
Cisplatin-induced nephrotoxicity in different regimens of cancer chemotherapyFurqan Khurshid Hashmi1, Khalid Hussain1, Muhammad Islam2, Muzammil Ali1, Muhammad Khalid Tipu4, Muhammad Tanveer Khan1, Abida Latif1
1 University College of Pharmacy, University of the Punjab, Allama Iqbal Campus, Lahore, Pakistan,2 Lahore College of Pharmaceutical Sciences, Lahore, Pakistan,3 Department of Pharmacy, Faculty of Biological Sciences, Quaid-i-Azam University, Islamabad, Pakistan.

Vers
ion fo
r revie
w
HealthMED - Volume 6 / Number 6 / 2012
Journal of Society for development in new net environment in B&H 1923
to that of the bi-functional alkylating agents, that is, possible cross-linking and interference with the functions of DNA and a small effect on RNA.9
Twenty percent patients receiving high dose of cisplatin exhibit severe renal dysfunction.10 It is metabolized to toxic moiety intracellularly and its highest concentration is found in cytosol, mitochon-dria, nuclei and microsomes. The toxicity is more pronounced at doses greater than 50 mg per square meter of body surface area.9 It is recommended that cisplatin be administered with vigorous parenteral infusion to increase hydration which maintains uri-ne output and reduce nephrotoxicity and ototoxicity, although not prevent them.9 Therefore, there is a dire need of monitoring of renal functions during cispla-tin chemotherapy. Vigorous pretreatment intraveno-us hydration, followed by adequate hydration and urinary output monitoring for 24 h is recommended. Mannitol or furosemide may also be used to produ-ce excessive diuresis, provided that salt and water depletion are avoided.9
Cisplatin is used alone or in combination which are termed as regimens or protocols. Cisplatin is also been administered as a continuous intravenous infusion over a period ranging from 24 h to 5 days, and such administration appears to reduce nausea and vomiting but not nephrotoxicity or ototoxicity.9 Combination of antineoplastic drugs has produced beneficial effects because regimens/protocols have been devised by taking into consideration the cell cycle specificity (CCS) and cell cycle non-specifici-ty (CCS, CCNS) by observing patient’s response.11 The selected protocols are given in Table 1.
Efficiency of renal function is estimated through different tests like glomerular filtration test, serum creatinine level and creatinine clearance. Both cre-
atine and creatine-phosphate cyclize spontaneously at a slow but constant rate to form creatinine, which is then excreted in the urine. Any rise in blood cre-atinine is a sensitive indicator of kidney malfuncti-on, because normally creatinine is rapidly removed from the blood through renal excretion. A typical adult male excretes about 15 mmol of creatinine per day. Normal reference laboratory value of serum creatinine level is 0.6-1.2mg/dL.12, 13
Subjects and method
This study was conducted in a tertiary care hos-pital, Mayo Hospital, Lahore, Pakistan, during June 2011 to October 2011 after approval of the Ethi-cal Committee of the hospital. Total sixty patients, registered in the hospital during the study period, were included in this study. Among sixty, twenty eight were males (46.67%) and thirty two were fe-males (53.33%). The inclusion criterion of patients was the protocol/regimen containing cisplatin and diagnosed neoplastic disorder. Renal functions of all the patients were assessed before starting the chemotherapy and it was found that five patients (8.33%) were already suffering from mild nephro-toxicity due to previous or past medication. Rest of the patients was not nephrotoxic because their renal function test was normal. The study was conducted prospectively and patient’s histories including ant-hropometric measurements height and weight etc. were also compared with patient’s respective files. Range of age of the patients included was 43 ± 18 years. Among males, ten had testicular cancer, three had esophageal cancer, two had head and neck can-cer, eight had non-small cell lung cancer, and five had small cell lung cancer. Among females, eleven
Table 1. Selected protocols and dose of cisplatinNo. Protocol/Regimen Drugs of protocol Dose of cisplatin mg/m2)1 CF Cisplatin, 5-Florouracil 70-1002 DC Docetaxel, Cisplatin 1003 CE/PE Cisplatin, Etoposide 80
4 PIAF Cisplatin, Interferon α 2b, Doxorubicin, 5-Florouracil 30
5 GC Gemcitabin, Cisplatin 100
6 ESHAP Etoposide, Solumedrol (Methylprednisolone), High dose Cytarabine (ara-C), Cisplatin. 25
7 PEB Cisplatin, Etoposide, Bleomycin 25

Vers
ion fo
r revie
w
1924
HealthMED - Volume 6 / Number 6 / 2012
Journal of Society for development in new net environment in B&H
had ovarian cancer, four had esophageal cancer, se-ven had cervical cancer, three had head and neck cancer, three had non-small cell lung cancer, two had small cell lung cancer and two had trophobla-stic tumor. The demographic details of the respon-dents are given in Table 2.Table 2. Demographic details of respondentsRespondents, gender, age and laboratory report
Number of patients (n) 60Gender (M/F) 28/32Age (in years) 43 ± 18
Serum creatinine (mg/dL) 0.9 (0.6-1.2)Diseases
Head and neck cancer 5 (8.33%)Cervical cancer 7 (11.67%)
Testicular cancer 10 (16.67%)Ovarian cancer 11 (18.33%)
Esophageal cancer 7 (11.67%)NSCLC* 11 (18.33%)SCLC** 7 (11.67%)
Trophoblastic cancer 2 (3.33%)* Non-Small Cell Lung Cancer; ** Small Cell Lung Cancer
For the study, regimens/protocols selected in-cluded CF, GC, PIAF, ESHAP, PEB, CE (PC) and Docetaxel+Cisplatin. Range of dose of cisplatin in the selected protocols was 25-100 mg/m2, given over time of five courses, whereas, the dose per course ranged from 125-500 mg/m2/course. Avera-ge dose of all the protocols over five courses was 342.86 mg/m2/course. Rate of administration of ci-splatin in every patient was the same in every proto-col. The factors which could affect, increase or de-crease, the percentage of nephrotoxicity were con-trolled strictly during chemotherapy. Among such factors, hydration was the most important. Pre- and post-hydration was accomplished using either 0.9% NaCl solution or 5% dextrose solution or Ringer lactate solution. Cycles of chemotherapy were re-peated after three weeks or 21 days. Course dura-tion differed in regimens; the range was 3-5 days. Patients were divided into two groups depending upon the dose of cisplatin as group-I and group-II that were termed as low dose group and high dose group, respectively. Low dose group was receiving dose ≤ 30 mg/m2 of cisplatin and high dose gro-up was receiving dose ≥70 mg/m2 (maximum 100 mg/m2). Protocols included in low dose group were
PEB, ESHAP and PIAF and high dose group inclu-ded CF, GC, CE, Docetaxel+Cisplatin. Low dose group had twenty four (40%) patients and high dose group included thirty six patients (60%). Other che-motherapeutic agents included were 5-flourouracil, etoposide, gemcitabine, docetaxel, doxorubicin (adriamycin), interferon α 2b, cytarabine (ara-C), solumedrol (methylprednisolone) and bleomycin. Some of the patients were also receiving radiothe-rapy along with chemotherapy to improve response of neoplasm towards the therapy. These averages of all protocols were compared with one another by plotting bar graph. Then percentage contribution of every protocol in terms of increased creatinine levels in the given population of sixty patients was represented as pie chart. To compare low and high dose groups, independent sample t-test was perfor-med as there was only one population receiving low and high doses of cisplatin. The data was processed using SPSS 12 software.
It was hypothesized that older patients might be more prone to nephrotoxicity and to test this hypothesis the population was also divided into two groups with respect to the age as patients with age ranging from 25-43 years (34±9 years) were termed as group III and patients ranging from for-ty four years to sixty one years (52.5 ± 8.5 years) were termed as group IV. Group III was composed of thirty three (55%) patients and group IV was of twenty seven (45%) patients. The detail of patients of both the groups is given in Table 3. Table 3. Comparison of disease status of patients of group III and IV
Disease Group III (34±9 Years)
Group IV (52.5±8.5 Years)
Cervical cancer 4 (6.67%) 3 (5%)Testicular cancer 6 (10%) 4 (6.67%)Head and neck cancer 1 (1.67%) 4 (6.67%)
SCLC* 1 (1.67%) 6 (10%)Trophoblastic cancer 2 (3.33%) 0 (0.00%)
NSCLC** 5 (8.33%) 6 (10%)Ovarian cancer 6 (10%) 5 (8.33%)Esophageal cancer 2 (3.33%) 5 (8.33%)
Total 27 (45%) 33 (55%)* Small Cell Lung Cancer ** Non-Small Cell Lung Cancer
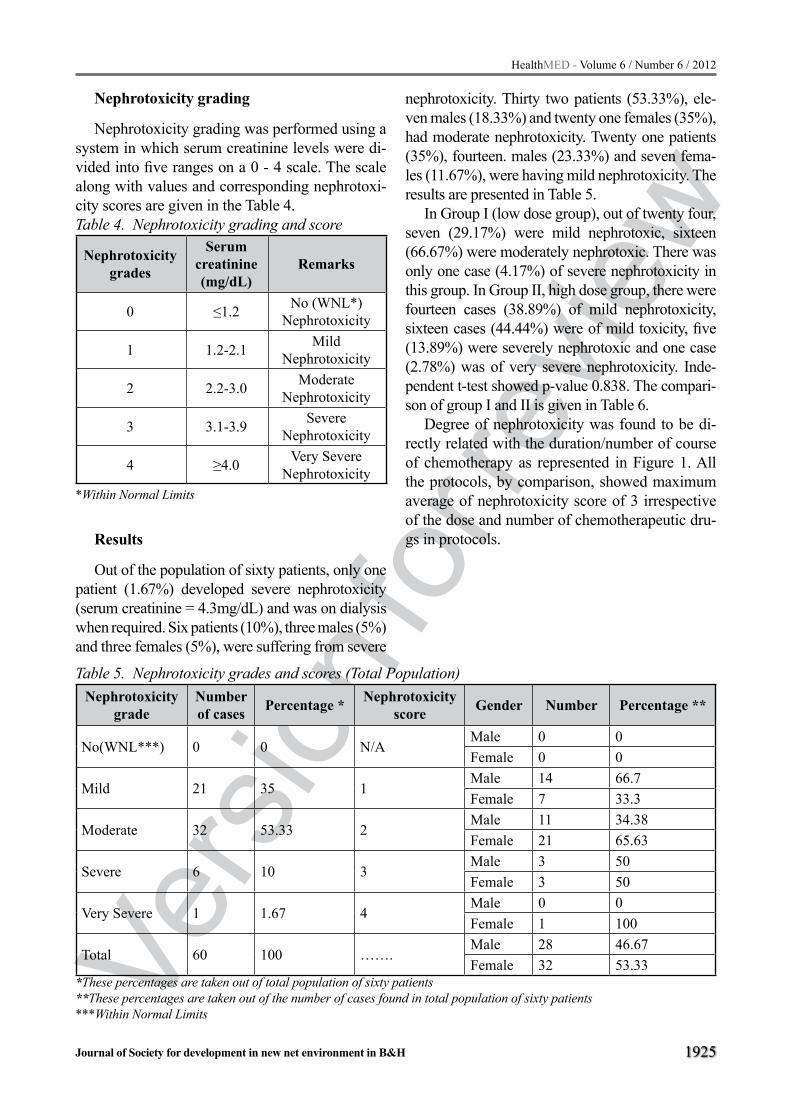
Vers
ion fo
r revie
w
HealthMED - Volume 6 / Number 6 / 2012
Journal of Society for development in new net environment in B&H 1925
Nephrotoxicity grading
Nephrotoxicity grading was performed using a system in which serum creatinine levels were di-vided into five ranges on a 0 - 4 scale. The scale along with values and corresponding nephrotoxi-city scores are given in the Table 4.Table 4. Nephrotoxicity grading and score
Nephrotoxicity grades
Serum creatinine (mg/dL)
Remarks
0 ≤1.2 No (WNL*) Nephrotoxicity
1 1.2-2.1 Mild Nephrotoxicity
2 2.2-3.0 Moderate Nephrotoxicity
3 3.1-3.9 Severe Nephrotoxicity
4 ≥4.0 Very Severe Nephrotoxicity
*Within Normal Limits
Results
Out of the population of sixty patients, only one patient (1.67%) developed severe nephrotoxicity (serum creatinine = 4.3mg/dL) and was on dialysis when required. Six patients (10%), three males (5%) and three females (5%), were suffering from severe
nephrotoxicity. Thirty two patients (53.33%), ele-ven males (18.33%) and twenty one females (35%), had moderate nephrotoxicity. Twenty one patients (35%), fourteen. males (23.33%) and seven fema-les (11.67%), were having mild nephrotoxicity. The results are presented in Table 5.
In Group I (low dose group), out of twenty four, seven (29.17%) were mild nephrotoxic, sixteen (66.67%) were moderately nephrotoxic. There was only one case (4.17%) of severe nephrotoxicity in this group. In Group II, high dose group, there were fourteen cases (38.89%) of mild nephrotoxicity, sixteen cases (44.44%) were of mild toxicity, five (13.89%) were severely nephrotoxic and one case (2.78%) was of very severe nephrotoxicity. Inde-pendent t-test showed p-value 0.838. The compari-son of group I and II is given in Table 6.
Degree of nephrotoxicity was found to be di-rectly related with the duration/number of course of chemotherapy as represented in Figure 1. All the protocols, by comparison, showed maximum average of nephrotoxicity score of 3 irrespective of the dose and number of chemotherapeutic dru-gs in protocols.
Table 5. Nephrotoxicity grades and scores (Total Population)Nephrotoxicity
gradeNumber of cases Percentage * Nephrotoxicity
score Gender Number Percentage **
No(WNL***) 0 0 N/AMale 0 0Female 0 0
Mild 21 35 1Male 14 66.7Female 7 33.3
Moderate 32 53.33 2Male 11 34.38Female 21 65.63
Severe 6 10 3Male 3 50Female 3 50
Very Severe 1 1.67 4Male 0 0Female 1 100
Total 60 100 …….Male 28 46.67Female 32 53.33
*These percentages are taken out of total population of sixty patients**These percentages are taken out of the number of cases found in total population of sixty patients***Within Normal Limits

Vers
ion fo
r revie
w
1926
HealthMED - Volume 6 / Number 6 / 2012
Journal of Society for development in new net environment in B&H
Figure 1. Comparison of creatinine level (mg/dL) of low dose and high dose groups receiving various regimens, Low dose group (CF (Cispla-tin, 5-Florouracil); DC (Docetaxel, Cisplatin); CE/PE (Cisplatin, Etoposide); GC (Gemcitabin, Cisplatin); ESHAP (Etoposide, Solumedrol (Met-hylprednisolone), High dose Cytarabine (ara-C), Cisplatin); High dose group: PIAF (Cisplatin, Interferon α 2b, Doxorubicin, 5-Florouracil; ES-HAP (Etoposide, Solumedrol (Methylprednisolo-ne), High dose Cytarabine (ara-C) PEB (Cispla-tin, Etoposide, Bleomycin)
In the selected population, when these proto-cols were compared with one another, CF protocol was found to be 15 % nephrotoxic as compared to other protocols. Similarly, in other protocols nep-hrotoxicity was as ESHAP (13%), CE (13%), DC (14%), PIAF (14%), GC (15%) and PEB (15%). The comparison of different protocols is given in Figure 2. The serum creatinine levels noted in dif-ferent protocols are given in Figure 3.
Figure 2. Pie chart of percentages of nephrotoxi-city induced by cisplatin in different protocol in a given population, ESHAP (Etoposide, Solumedrol (Methylprednisolone), High dose Cytarabine (ara-C), Cisplatin); PIAF (Cisplatin, Interferon α 2b, Doxorubicin, 5-Florouracil; ESHAP (Etoposide, Solumedrol (Methylprednisolone), Cytarabine (ara-C) PEB (Cisplatin, Etoposide, Bleomycin)
Figure 3. Comparison of maximum level of se-rum creatinine by all protocols, ESHAP (Etoposi-de, Solumedrol (Methylprednisolone), High dose Cytarabine (ara-C), Cisplatin); High dose group: PIAF (Cisplatin, Interferon α 2b, Doxorubicin, 5-Florouracil; ESHAP (Etoposide, Solumedrol (Methylprednisolone), High dose Cytarabine (ara-C) PEB (Cisplatin, Etoposide, Bleomycin)
Table 6. Comparison of high and low dose groups receiving cisplatin
Nephrotoxicity Score
Number of Cases in Groups
RemarksHigh Dose Group(CF+GC+CE/PE+DC)
Low Dose Group(ESHAP+PIAF+PEB)
Male Female Total Male Female Total1 9 5 14 5 2 7 Mild2 4 12 16 7 9 16 Moderate3 3 2 5 0 1 1 Severe4 0 1 1 0 0 0 Very Severe
CF (Cisplatin, 5-Florouracil); DC (Docetaxel, Cisplatin); CE/PE (Cisplatin, Etoposide); PIAF (Cisplatin, Interferon α 2b, Doxorubicin, 5-Florouracil); GC (Gemcitabin, Cisplatin); ESHAP (Etoposide, Solumedrol (Methylprednisolone), High dose Cytarabine (ara-C), Cisplatin); PEB (Cisplatin, Etoposide, Bleomycin)

Vers
ion fo
r revie
w
HealthMED - Volume 6 / Number 6 / 2012
Journal of Society for development in new net environment in B&H 1927
Division of population according to the age, in group III, ten (37.04%) were mildly nephrotoxic, fifteen (55.56%) were moderately, two (7.41%) were severely nephrotoxic. In group IV, cases with mild toxicity were eleven (33.33%), with modera-te toxicity were seventeen (51.52%), with severe toxicity were four (12.12%), and one (3.03%) case with very severe nephrotoxicity There was no case of severe tetany reported and no complaints of se-vere paresthesia. P-value for this group compari-son was 0.027 which is less than 0.05. The compa-rison of group III and group IV is given in Table 7.
Discussion
In this study, we found that degree of nephrotoxi-city induced by cisplatin is independent of the pro-tocols/regimens and the number of drugs included in protocol. Nephrotoxicity was also independent of the dose of cisplatin given as per square meter of body surface area, as per course or as total dose of five courses. The division of low and high dose gro-ups of cisplatin was also representing close results with each other and neglecting the total dose given to a patient throughout the study. Some of the pati-ents were also on other medication like antibiotics that can be nephrotoxic for them like aminoglyco-sides, vancomycin, amphotericin B, etc. Many fin-dings of the study were unexpected and deviating from the expected conclusion. It was not clear why some patients receiving cisplatin developed severe glomerular impairment. Considerable inter indivi-dual differences in nephrotoxicity was apparent in this study, even between patients of similar age and receiving similar administration schedules and total dose of cisplatin. The diversity/diversion of results from expected may be the result of inter individual
variability in cisplatin pharmacokinetics or may be at least partly responsible.16 These unexpected re-sults may also be due to other factors like hydration (including pre-, mid- and post hydration of chemot-herapy and self-oral hydration), age, concurrent medication, rate of administration of cisplatin, etc.
Most of the patients receiving cisplatin treatment have stable renal functions.20 Twenty five percent of patients have reversible azotemia for 1-2 weeks af-ter treatment.15 However, a significant minority of patients have a progressive decline in renal functi-on.10 Irreversible renal failure can occur with large doses and with multiple courses15, 16. Increased age, renal radiation and alcohol intake increase toxicity. Furthermore, 20% of all acute renal failure cases among hospitalized patients are attributed to cispla-tin containing chemotherapy7, 17. In our study, most of the patients were suffering from mild to moderate nephrotoxicity and there were no case of acute renal failure reported. Severe and moderate nephrotoxic patients were still risk factors for chronic renal failu-re. Once nephrotoxicity occurs, the mortality rate is very high especially in patients who require hemodi-alysis for the treatment of acute renal failure.
Pre- and post-hydration is an important factor in reducing nephrotoxicity but still it is not used to eradicate this toxicity. Hyperhydration appears to reduce the frequency and severity of nephro-toxicity, rather than abolish it altogether. For the purpose of hydration, used parenteral hydration solutions were 0.9% NaCl infusion, 5% dextrose infusion, Ringer lactate solution and mannitol so-lution. The selection of parenteral solution is de-pendent on the patient’s condition as 5% dextrose infusion is avoided in diabetic patients.
Table 7. Nephrotoxicity scores and number of patients in group A and B
Nephrotoxicity Score Remarks
Group A34±9 Years
Group B52.5±8.5 Years
Number Percentage* Number Percentage**0 WNL** 0 0 0 01 Mild 10 37.04 11 33.332 Moderate 15 55.56 17 51.523 Severe 2 7.41 4 12.124 Very Severe 0 00 1 3.03
* Taken out total patients in group A, 27 **Taken out of total patients of group B, 33** Within Normal Limits

Vers
ion fo
r revie
w
1928
HealthMED - Volume 6 / Number 6 / 2012
Journal of Society for development in new net environment in B&H
Cisplatin is actively uptaken by probenecid-in-hibitable organic ion transporters resulting in an en-richment of cisplatin in proximal tubular epithelial cells18, 19, and 20. The kidney accumulates cisplatin to a greater degree than other organs and is the major route for its excretion10 . The cisplatin concentration in proximal tubular epithelial cells is about five ti-mes the serum concentration.10, 21. Unbound cispla-tin is filtered at the glomerulus (80% of a dose is excreted in 24 hours). Renal blood flow can decre-ase within three hours after cisplatin infusion, and glomerular filtration (GFR) falls after the decrease in renal blood flow10. Hyperhydration and mannitol is beneficial in eliminating this accumulated cispla-tin in kidney by creating a condition of diuresis.
Statistical analysis showed that low dose cispla-tin group and high dose group resulted in almost equal degree of nephrotoxicity. This result ruled out the total dose of cisplatin given in different proto-cols but the important factor of inducing toxicity might be the rate of administration. In our study, rate of administration of cisplatin was kept equiva-lent in all types of protocols. Hence, it seems that rate of administration is of more value than the total dose of protocol. Also, the similarity of the result may be due to factors like hydration. But still dif-ference exists in number of individual confronting severe nephrotoxicity as there is only one case of severe nephrotoxicity in low dose group.
Cisplatin causes direct tubular injury through multiple mechanisms10. High concentrations of cisplatin induces necrosis in proximal tubule ce-lls, whereas lower concentrations induce apopto-sis through a caspase-9-dependent pathway10, 22. The severity of necrosis is dose and time-depen-dent21. At least two mechanisms contribute to cell death following cisplatin treatment, inhibition of DNA synthesis and glutathione depletion-induced oxidative stress18, 21, 23. Cisplatin induced nephro-toxicity is more profound in elderly people. Con-sistent with an earlier report, our study showed that patients who developed nephrotoxicity tend to slightly older24, 25. This might be due to impa-irment of renal functions with the passage of age. As the age increases renal functions of the indivi-dual renders less efficient naturally. This results in decreased excretion of drugs from this route and concentrating in the blood causing toxicity. Simi-larly, as GFR decreases, cisplatin accumulates in
epithelial cells of kidney of elder patients creating severe consequences of nephrotoxicity. Urine con-centration/dilution also changes due to imbalan-ced endocrine hormone production17.
Cisplatin also causes disturbances in serum electrolytes by changing the filtration and absorp-tion at nephron level and causing gastrointestinal side effects. Most of the patients waste sodium, potassium, magnesium and calcium in their uri-ne and some have orthostatic hypotension10, 24.
Among these electrolytes, magnesium is of extre-me importance that turns to chronic hypomagne-saemia. This decreased magnesium is the prime reason of tetany. Additional factors for worsening tetany are excretion of calcium (hypocalcaemia) and neurotoxicity because of cisplatin. Hypoma-gnesaemia is controlled by starting magnesium supplementation. This supplementation reduces the episodes of tetany in spite of hypomagnesae-mia or convulsion up to and until the completion of chemotherapy. That is why there was no report of tetany or convulsion during the whole study, although such complications are well documen-ted. Another aspect of considerable importance about hypomagnesaemia is that cisplatin induces magnesium depletion, and magnesium deficien-cy itself may enhance cisplatin nephrotoxicity10. Cisplatin also reduces absorption of magnesium from gastrointestinal tract by disturbing the nor-mal functions of GIT.
Another side of electrolyte depletion due to cisplatin induced nephrotoxicity is depletion of chloride ions along with sodium. Cisplatin is a platinum coordinate complex with two labile chloride groups25. Cisplatin can form monohydra-ted complexes by hydrolytic reactions10. Its toxic effect is augmented when the intracellular chlori-de concentration is low, which favors the conver-sion of cisplatin through the replacement of two chloride ligands by hydroxyl groups to positively charged reactive and toxic aquatic derivative25 . Using hypertonic saline to reconstitute cisplatin can decrease the amount of monohydrated com-plex formed10. This approach attenuates nephro-toxicity but may also compromise its antitumor activity10, 26. This is also a good alternate for the patients who are diabetic.

Vers
ion fo
r revie
w
HealthMED - Volume 6 / Number 6 / 2012
Journal of Society for development in new net environment in B&H 1929
Conclusion
It is concluded from the present study that ci-splatin induced nephrotoxicity is independent of the dose of cisplatin, either low (≤30 mg/m2) or high (≥70mg/ m2), and number of antineoplastic drugs in protocol and the protocol itself. All pro-tocols are almost equally nephrotoxic towards the selected population. Nephrotoxicity is the matter of rate of administration of cisplatin. Preventive measures like hyperhydration can only reduce the degree of nephrotoxicity rather than elimination of it. Age is directly proportional to the percentage of nephrotoxicity. Elder patients are more inclined towards being nephrotoxic.
References
1. Kumar PJ, Clark ML. Kumar and Clark Clinical Me-dicine (5th Edition). W. B. Saunders Publishers, an imprint of Elsevier Science Limited. 2002; 9: 473-10.
2. Rang HP, Dale MM, Ritter JM, Flower RJ. Rang and Dale’s Pharmacology (6th Edition). Churchill Living-stone, Elsevier Publishers. 2007; 51: 718.
3. Katzung BG. Basic and Clinical Pharmacology (10th Edition). McGraw-Hill Companies. 2007; 55: 886.
4. Richard DH, Mary JM. Lippincott’s Illustrated Revi-ews: Pharmacology (3rd Edition). Lippincott Williams and Wilkins Publications. 2006; 39: 479.
5. Amira K,. Chemical feature of inorganic compounds as anticancer agents. healthMed Journal. 2011; 5: 1112—1116.
6. British National Formulary 59. March. BMJ Group and Pharmaceutical Press. 2010; 8.1.5: 523.
7. Filipski K K, Mathijssen R H, Mikkelsen T S, Schinkel A H, Sparreboom A.
8. Contribution of organic cation transporter 2 (oct2) to cisplatin induced nephrotoxicity. Clin Pharmacol Ther. 2009; 86: 396-402.
9. Arany I, Safirstein RL. Cisplatin Nephrotoxicity. Se-min Nephrol. 2003; 23:460-464.
10. MICROMEDEX Thomson Health Care. Cisplatin (systemic). USP DI. Drug Information for the Health Care Professional. Micromedix inc. 2001.
11. Yao X, Panichpisal K, Kurtzman N, Nugent K. Ci-splatin nephrotoxicity: A Review. Am J Med Sci. 2007; 334:115-124.
12. Tripathi KD. Chemotherapy of neoplastic agents. Essentials of Medical Pharmacology (6th Edition). Jitendar P Vij, Jaypee Brothers Medical Publishers (P) Ltd. Mumbai, 2008, pp. 819-836.
13. Pakistan Drug Manual, Medical Channel Publis-hing, 2008; Section 1: 67.
14. Reece PA, Stafford I, Russell J, Khan M, Gill PG. Creatinine clearance as a predictor of ultrafilterable
platinum disposition in cancer patients treated with cisplatin: relationship between peak ultrafilterable platinum plasma levels and nephrotoxicity. J Clini Onicol. 1987; 5: 304-309.
15. Daugaard G, Abildgaard U. Cisplatin nephrotoxicity: a review. Cancer Chemother Pharmacol 1989; 25:1–9.
16. Kollmannsberger C, Kuzcyk M, Mayer F, Hartma-nn JT, Kanz L, Bokemeyer C. Late toxicity following curative treatment of testicular cancer. Semin Surg Oncol 1999; 17:275–81.
17. Kollmannsberger C, Kuzcyk M, Mayer F, et al. Late toxicity following curative treatment of testicular cancer. Semin Surg Oncol 1999; 17:275–81.
18. Berns JS, Ford PA. Renal toxicities of antineopla-stic drugs and bone marrow transplantation. Semin Nephrol. 1997; 17: 54–66.
19. Qihong H, Robert TD, Supriya J, Olimpia D, Fran-klin DP, Spencer BF, Raymond ES, Kerry TB. Asse-ssment of cisplatin induced nephrotoxicity by micro-array technology. Toxicol Sci. 2001;63: 196-207.
20. Ban M, Hettich D, Huguet M. Nephrotoxicity me-chanism of cisplatinum (II) diamine dichloride in mice. Toxicol Lett. 1994; 71:161–168.
21. Safirstein RL, Miller P, Guttenplan JB. Uptake and metabolism of cisplatin by rat kidney. Kidney Int. 1984; 25: 753–758.
22. Kuhlmann MK, Burkhardt G, Kohler H. Insight into potential cellular mechanisms of cisplatin nephro-toxicity and their clinical application. Nephrol Dial Transplant. 1997; 12: 2478-80.
23. Lieberthal W, Triaca V, Levine J. Mechanisms of de-ath induced by cisplatin in proximal tubular epitheli-al cells: Apoptosis Vs necrosis. Am J Physiol. 1996; 270: F700-8.
24. Howle JA, Gale GR. Cis-dichlorodiammineplatinum (II). Persistent and selective inhibition of deoxyribo-nucleic acid synthesis in vivo. Biochem Pharmacol. 1970; 19: 2757–2762.
25. Litterst CL. Alterations in the toxicity of cis-dichlo-rodiammineplatinum II and in tissue localization of platinum as a function of NaCl concentration in the vehicle of administration. Toxicol Appl Pharmacol. 1981; 61:99-108.
26. Lau H. Apoptosis Induced by Cisplatin Nephrotoxic Injury. Kidney International Vol 56. 1999, pp 1295-1298.
27. Kollmannsberger C, Kuzcyk M, Mayer F, Hartma-nn JT, Kanz L, Bokemeyer C. Late toxicity following curative treatment of testicular cancer. Semin Surg Oncol 1999; 17:275–81.
Corresponding author Furqan Khurshid Hashmi, University College of Pharmacy, University of the Punjab, Allama Iqbal Campus, Lahore, Pakistan, E-mail: [email protected]

Vers
ion fo
r revie
w
1930
HealthMED - Volume 6 / Number 6 / 2012
Journal of Society for development in new net environment in B&H
Abstract
Objective: We aimed to demonstrate the exis-tence and intensity of Adult Attention Deficit Hyperactivity (A-ADHD symptoms) in cannabis dependent individiuals and discuss the importance of comorbidity of A-ADHD
Methods: Seventy patients participated with informed consent. The participants were selected from patients who underwent inpatient treatment in the Department for Addiction at Samsun Neu-ropsychiatry Hospital. Diagnostic interviews were conducted for cannabis dependence syndrome (ICD 10; DSM-IV); the earliest interview was after 21 days of detoxification therapy. For assesment, the Adult ADD/ADHD DSM IV based Diagnostic Screening and Rating Scale developed by Prof. Dr.Turgay, former Director of the Toronto ADHD Clinic, Ontario,Canada was used.. Mean ADHD total and subscale scores were compared by using the group variable independent t test. The analyses were conducted using SPSS for Windows 16.00.
Results:. Considerably higher scores were ob-served in cannabis dependent individuals.Twenty-four patients were re-evaluated and interviewed and Adult ADHD was diagnosed.All three subdi-mensions of the Turgay Adult ADHD Scale were found to be statistically higher in the cannabis de-pendent patients.
Conclusions: As this study shows, Adult ADHD is highly represented in cannabis dependent pati-ents.(in our sample 35% of patients were diagnosed with Adult ADHD). The awareness of the ADHD diagnosis in Turkey has rapidly increased over time.
Key words: Adult ADHD, cannabis dependen-cy, substance use
Introduction
Cannabis (marijuana) is obtained from the flower seeds and dried leaves of the Cannabis sativa plant (Kumar, Chambers & Pertwee, 2001). The use of cannabis has increased since ancient societies and this increased consumption has become an inter-national problem throughout years. Beside alcohol and cigarettes, cannabis is the most widely used psychoactive substance in the world. According to 2005 data from the European Monitoring Center for Drugs and Drug Addiction (EMCDDA), cannabis is the main drug among %30 of all individuals seeking treatment for substance related disorder, 12% of the individuals actually undergoing treatment. (EM-CDDA, 2005). In 2008, the United Nations repor-ted that prevalence e of cannabis use was 2.9-4.3% in the world's adult population, and 0.6% of adults reported using cannabis on a daily basis (WHO., 2010). Short- or long-term cannabis use has several effects on the immune system, respiratory system, cardiovascular system and central nervous system, including cognitive effects in attention.
In the 1970s, cannabis use was not thought to lead to tolerance, so the drug was not recognized as causing withdrawal symptoms. However, this perspective relied on a limited definition of drug addiction described with tolerance and withdrawal symptoms. The established views have since evol-ved after a series of follow-up and experimental studies in the mid-1970s (Johns, 2001).
Attention deficit hyperactivity disorder (ADHD) symptoms and Adult ADHD Diagnosis in adult men with cannabis dependence Umut Mert Aksoy1, Sennur Gunay Aksoy2, Abdullah Akpinar3, Fulya Maner4
1 Bakirkoy Prof. Dr. Mazhar Osman Training and Research Hospital for Psychiatric and Neurological Diseases, Istanbul, Turkey,2 Bakirkoy Prof. Dr. Mazhar Osman Training and Research Hospital for Psychiatric and Neurological Diseases, Istanbul, Turkey,3 Isparta Suleyman Demirel University Faculty of Medicine, Department of Psychiatry, Turkey, 4 Bakirkoy Prof. Dr. Mazhar Osman Training and Research Hospital for Psychiatric and Neurological Diseases, Istanbul, Turkey,

Vers
ion fo
r revie
w
HealthMED - Volume 6 / Number 6 / 2012
Journal of Society for development in new net environment in B&H 1931
Morgenstern, Langenbucher and Labouvie (1994) have shown that cannabis dependence is a valid diagnosis for substance dependence. Based on the Epidemiological Catchment Area (ECA) study, Hall and Solowij (1997) found that 17% of indi-viduals who use cannabis more than five times in their lifetimes are diagnosed with dependence. In a birth cohort study in New Zealand, 9% of 21-year-old individuals who had previously used cannabis were diagnosed with dependence (Thomas, 1996).
In the last decade, the frequency of cannabis use for its stimulating effect has increased substantially among young people in Western Europe. In the last decade, cannabis-related disorders have increased two-fold in European Union countries, and a similar increase was reported in the US (EMCDDA, 2005). In a survey of 11,989 primary school students and 12,270 secondary school students in 9 large cities in Turkey, the rate of cannabis use was 1.2% among primary school students and 4.0% among secon-dary school students (Ogel et al., 2004). Cannabis use is an important problem also in adults, however no epidemiologic data exist in adultsin Turkey.
Comorbid psychiatric disorders are common in cannabis dependence (Arendt & Joersen, 2004; Marijuana Treatment Project Research Group, 2004). Of the limited number of additional diagno-ses that were examined, depression and conduct disorder were the most common. These additional diagnoses were not compared with healthy con-trol groups. Other studies show that comorbidity in cannabis dependence complicates treatment, decreases the period of sobriety and increases the frequency of relapse (Dennis, Godley & Diamond, 2004; Moore & Budney, 2003).
Attention deficit hyperactivity disorder (ADHD), which is conceptualized as an attention deficit, hyperactivity and impulsivity, is the most common childhood psychiatric disorder. Studi-es have shown that ADHD affects 2-12% of sc-hool-age children, and the symptoms persist into adulthood in approximately 60% of individuals (Wilens, Faraone, Biederman, et al., 2003; Bieder-man, Mick & Faraone, 2000).
Current epidemiological data suggest a preva-lence rate of 4% in adults (Fayyad, De Graaf & Kessler, 2007; Kessler, Adler & Barkley, 2006). Although there is insufficient data on the preva-lence rate of adult ADHD in Turkey, clinicians are
increasingly aware of the importance of ADHD diagnosis and treatment.
Comorbidity is common in ADHD, and 90% of cases represent with other psychiatric disor-ders. The prevalence of substance use is reported to be 15% in the general population, but as high as 50% in adult adhd (Katusic, Barbaresi & Co-lligan, 2005). No significant difference was obser-ved regarding the substance preferences among individuals with substance use disorders that were comorbid with ADHD, but cannabis is most com-monly abused after alcohol and cigarette. (Schu-biner, Tzelepis& Isaacson1995).
All of the studies indicate that ADHD constitu-tes a significant risk factor for substance use dis-orders.
Objective
The aim of this study is to demonstrate the exi-stence and intensity of ADHD symptoms in ca-nnabis-dependent individuals and compare with adhd symtoms of healthy individiulas in order to discuss the importance od adult adhd diagnosis in cannabis dependent individiuals.
Materials and methods
The study included male patients who un-derwent inpatient treatment at the Research and Treatment Center for Alcohol and Drug Addicti-on clinic (AMATEM) in the Samsun Hospital for Psychiatric Disorders. A total of 70 patients were diagnosed with cannabis dependence according to the ICD-10 and DSM-IV diagnostic criteria. The patient group was diagnosed by a psychiatrist. Pa-tients who used substances in addition to nicoti-ne and cannabis were included and patients with comorbid psychotic disorders, mood disorders or any other psychiatric disorder were excluded from the study. Additionally, 70 healthy volunteers were included as a control group.
At the end of the 21-day detoxification of the patients and psychiatric interview with SCID and ICD, the participants were assessed with the Adult ADD/ADHD DSM IV based Diagnostic Screening and Rating Scale. The scale was developed by Prof. Dr.Turgay, former Director of the Toronto ADHD Clinic, Ontario, Canada. It is a self assessment sca-

Vers
ion fo
r revie
w
1932
HealthMED - Volume 6 / Number 6 / 2012
Journal of Society for development in new net environment in B&H
le. The reliability, validity, and transliteral equiva-lance study had been performed by Günay et.al in 2005 (Günay 2006The scale includes an attention deficit subscale, a hyperactivity subscale, a related problems subscale and the total score.
The analyses were conducted using the software program SPSS for Windows (version 16.00). Chi-square tests were used in the group comparisons to assess the relationships between the categorical variables. Independent t-tests were employed to as-sess the difference between the group means.
Results
The mean age, demographic factors and levels of education for the 70 male patients were not signi-ficantly different from those of the control group.
For the Adult Attention Deficit and Hyperac-tivity Scales, a statistically significant difference was observed between the patient and control gro-up for the attention deficit subscale, hyperactivi-ty subscale, related problems subscale and total scores (p<0.001 for all variables) (Table 1). In all of the assessment scales, the total scores were hi-gher in the patient group than in the control group. Based on the subscale and total scores, the entire patient group was observed to have ADHD symp-toms and to be at a high risk for ADHD.
Twenty-four of the 70 patients were evaluated as having a high risk for ADHD. All of these 24 patients were diagnosed with ADHD after the cli-nical interviews. The differences and the standard deviations of the differences of the mean subscale
and total scores between the patient and control groups are provided in Table 2. Five individuals in the control group received high-risk scores on the attention deficit subscale, and no individuals in the control group received high-risk scores on the hyperactivity or related problem subscales. These individuals were re-interviewed, and none of them were diagnosed with ADHD.
Discussion
The aim of this study was to demonstrate the existence and intensity of Adult ADHD symptoms in cannabis-dependent individuals. In our study, 35% of the patients who were receiving treatment for a diagnosis of cannabis dependence were dia-gnosed with comorbid ADHD.
Although ADHD is well known in childhood and persistence of the diagnosis and duration of adhd symtoms into adulthood have been accep-ted, little is known about cannabis dependence in adult ADHD.
There is no single e etiologic explanation for ADHD, but there is evidence to support several hypotheses. Dopamine (DA) and noradrenaline (NA), which is synthesized from DA, play an im-portant role in cognitive functions, such as atten-tion, concentration, motivation and wakefulness (Arnsten, 2011). Individuals with ADHD respond positively to antidepressants and central nervous system stimulants (methylphenidate, d-amphe-tamine and pemolin) that increase dopamine and noradrenaline levels in the brain, which appears
Table 1. The subscales of the Adult Attention Deficit and Hyperactivity Scales and the total scoresCannabis-dependent group (n=70) Control group (n=70) p Value
Attention deficit subscale 69.09±24.87 45.05±22.52 p<0.001Hyperactivity subscale 71.79±15.26 44.45±21.70 p<0.001Related problems subscale 73.77±14.63 44.89±23.42 p<0.001Total scores 71.75±18.25 44.79±22.54 p<0.001
Table 2. The differences in the mean subscale and total scores between the patient group and the control group according to group variables and standard deviation values of the differences
Mean difference Standard deviation
95% confidence interval (lower-upper limit)
Attention deficit subscale 7.45 1.17 5.09-11.76Hyperactivity subscale 9.15 1.41 6.34-14.33Related problems subscale 24.38 4.11 21.07-74.43Total scores 40.98 5.34 30.39-51.57

Vers
ion fo
r revie
w
HealthMED - Volume 6 / Number 6 / 2012
Journal of Society for development in new net environment in B&H 1933
to support the idea that ADHD is a catecholamine metabolism disorder. Stimulants increase the rele-ase of catecholamines and reduce the withdrawal. In Carrol and Rounsaville’s (1993) study on al-cohol and psychoactive substance use, 34.6% of treatment-seeking cocaine users also met the dia-gnostic criteria for childhood ADHD. This result can be regarded as the attempts of cocaine users with ADHD symptoms in childhood to self-me-dicate, or it can be interpreted as a presynaptic or postsynaptic pathology in the dopaminergic pat-hways of adult ADHD. Because cannabis begins to affect users by increasing their dopamine relea-se, the prevalence of ADHD in cocaine users may be considered to follow a mechanism similar to that of cannabis dependence (Pierce & Kumare-san, 2006). In a meta-analysis of a retrospective study and four prospective studies that were con-ducted among children who were and were not receiving treatment for ADHD, there was nearly a twofold increase in the risk of substance abuse among the children who were receiving no tre-atment (Wilens, Faraone & Biederman, 2003). ADHD is recognized as an independent risk factor for alcohol and substance use. Between 9-30% of ADHD patients also develop patterns of substan-ce abuse and dependence. Research has indicated that alcohol and substance use adversely affect the course of ADHD; compared with individuals wit-hout ADHD, individuals with ADHD begin using substances at earlier age with rapid transformation from substance abuse into the substance depen-dence and substance use becomes more intense and frequent. In this study, 35% of our patients who were treated for cannabis use disorder were diagnosed with ADHD in clinical interviews. This figure shows that cannabis use is approximately eight times more common in patients with ADHD compared with the general population. (4.4%) Diagnosis and proper treatment of ADHD in chil-dhood may prevent substance use disorders in adulthood (Biederman, Wilens & Mick, 1999). In this study, none of the patients had received an earlier diagnosis of ADHD.
Similarly to many other developmental psyc-hiatric disorders, there is no definitive diagnostic test for ADHD. There are several tests and scales that lead to the diagnosis of ADHD. The Adult Attention Deficit and Hyperactivity Scale,which
was demonstrated by Gunay et al. (2006) to be valid and reliable in Turkey, was employed in the present study. There was a statistically significant difference between the patient and control groups in the attention deficit subscale, hyperactivity su-bscale, related problems subscale and total scores. Comorbidity with adult adhd is an important issue in addiction treatment and should not be discarded.
Conclusions
In our study, 35% of patients who received tre-atment for a diagnosis of cannabis use disorder were diagnosed with comorbid ADHD. Effective treatment for cannabis dependence and relapse prevention will be possible with better awareness and treatment of ADHD.
Limitations and restrictions
Because substance use disorders were observed more often and more intensely in men and because institutional structures only accept male patients for inpatient treatment in Samsun, female indivi-duals were not included in this study. This situ-ation prevents the generalization of the findings to female patients. However, the literature shows that 95% of the cases that seek help for cannabis dependence are men, and ADHD is more frequ-ently observed in men. These findings at least par-tially alleviate the weakness of this study. Another limitation is the number of cases. The sample of individuals in one region requires the considerati-on of cultural variables. Future prospective studies that make use of more cases that are sampled from different regions will elucidate the relationship between ADHD and cannabis use.
References
1. Kumar RN, Chambers WA, Pertwee RG. Pharmaco-logical actions and therapeutic uses of cannabis and cannabinoids. Anaesthesia 2001;56:1059-1068.
2. European Monitoring Center for Drugs and Drug Addiction (EMCDDA).(2005). The state of drugs pro-blem in Europe. Annual report (2005).
3. WHO. World Drug Report 2010. New York, NY World Health Organization; 2010.

Vers
ion fo
r revie
w
1934
HealthMED - Volume 6 / Number 6 / 2012
Journal of Society for development in new net environment in B&H
4. Johns A.2001 Psychiatric effects of cannabis British Journal Of Psychiatry 2001 178;116-122
5. Morgenstern J, Langenbucher J, Labouvie EW 1994 The generalizability of the dependence syndrome across substances: an examination of some properties of the proposed DSM-IV dependence criteria Addicti-on. 1994 Sep;89(9): 1105-13
6. Hall W, Solowij N. 1997 ll Long-term cannabis use and mental health. Br J Psychiatry. 1997 Aug;171:107-8
7. Thomas H. 1996 A community survey of adverse ef-fects of cannabis use Drug and Alcohol Dependence. Vol. 42, no. 3, pp. 201-207. Nov 1996
8. Ögel K, Uğuz Ş, Sır A, Yenilmez A, Tamar D , Çorapçıoğlu A, Doğan O, Tot Ş, Bilici M, Tamar D, Evren C, Li-man O. Türkiye’de İlköğretim ve Ortaöğretim gençliği arasında esrar kullanım yaygınlığı. Bağımlılık Dergisi 2003; 4:15-19.
9. Arendt, M., & Munk-Jbrgensen, P. (2004). Cannabis users seeking treatment: Prevalence of psychiatric disorders. Social Psychiatry and Psychiatric Epide-miology, 39, 97– 105.
10. The Marihuana Treatment Project Research Group. (2004). Brief treatmentsfor cannabis dependence: Findings from a randomized multisite trial.Journal of Consulting and Clinical Psychology, 72, 455– 466.
11. Dennis, M., Godley, S. H., Diamond, G., Tims, F. M., Babor, T.,Donaldson, J., et al. (2004). The Cannabis Youth Treatment (CYT study: Main findings from two randomized trials. Journal of Substance Abuse Trea-tment, 27, 197– 213
12. Moore, B. A., & Budney, A. J. (2003). Relapse in out-patient treatment for marijuana dependence. Jour-nal of Substance Abuse Treatment, 25,85– 89.
13. Wilens TE, Faraone SV, Biederman J, Gunawar-dene S. Does stimulant therapy of attention-deficit/hyperactivity disorder beget later substance abuse? A meta-analytic review of the literature. Pediatrics 2003;111(1):179-85.
14. Biederman J, Mick E, Faraone SV. Age-de pendent decline of symptoms of attention deficit hyperactivity disorder: impact of remission defini tion and symp-tom type. Am J Psychiatry 2000;157:816-818.
15. Wilens TE Attention-deficit/hyperactivity disorder and the substance use disorders: the nature of the relationship, subtypes at risk, and treatment issues. Psychiatr Clin North Am 2006;27:283-301.
16. Fayyad J, De Graaf R, Kessler R, Alonso J, Anger-meyer M, Demyttenaere K, De Girolamo G, Haro JM, Karam EG, Lara C, Lépine JP, Ormel J, Posa-da-Villa J, Zaslavsky AM, Jin R. Cross-na tional pre-
valence and correlates of adult attenti on-deficit hy-peractivity disorder. Br J Psychiatry 2007:402-409.
17. Kessler RC, Adler L, Barkley R, Biederman J, Con-ners CK, Demler O, Faraone SV, Greenhill LL, Howes MJ, Secnik K, Spencer T, Ustun TB, Walters EE, Zaslavsky AM. The pre valence and correlates of adult ADHD in the Uni ted States: results from the National Comorbidity Survey Replication. Am J Psychiatry 2006;163:716-723.
18. Katusic SK, Barbaresi WJ, Colligan RC, Weaver AL, Leibson CL, Jacobsen SJ. Psychostimulant treatment and risk for substance abuse among young adults with a history of attention-deficit/hyperactivity disorder: a population-based, birth cohort study. J Child Adolesc Psychopharmacol 2005;15(5):764-76.
19. Schubiner H, Tzelepis A, Isaacson JH, Warbasse LH 3rd, Zacharek M, Musial J. The dual diagnosis of attention-deficit/hyperactivity disorder and substan-ce abuse: case reports and literature review. J Clin Psychiatry 1995;56(4):146-50.
20. Günay Ş, Savran C, Aksoy UM, Maner F, Turgay A, Yargıç İ. Erişkin Dikkat Eksikliği Hiperaktivite Ölçe-ğinin (Adult ADD/ADHD DSM IV- Based Diagnos-tic Screening and Rating Scale) Dilsel Eşdeğerlilik, Geçerlik Güvenirlik ve Norm Çalışması, Türkiye'de Psikiyatri, 2006; 8(2): 98-107.
21. Arnsten A. Catecholamine influences on dorsola-teral prefrontal cortical Networks Biol Psychiatry. 2011 Jun 15;69(12):e89-99. Epub 2011 Apr 13
22. Carrol KM, Rounsaville BJ. History and significan-ce of childhood ADHD in treatment seeking cocaine abusers. Compr Psychiatry 1993;34:75-82.
23. Pierce RC, Kumaresan V. The mesolimbic dopamine system: the final common pathway for the reinfor-cing effect of drugs of abuse. Neurosci Biobehav Rev 2006;30:215-238
24. Biederman J, Wilens T, Mick E, Spencer T, Faraone SV. Pharmacotherapy of Attention-deficit/Hyperac-tivity reduces risk of substance use disorder. Pediat-rics 1999;104-20.
Corresponding Author Umut Mert Aksoy, Bakirkoy Prof. Dr. Mazhar Osman Training and Re-
search Hospital for Psychiatric and Neurological Diseases Bakirkoy,
Istanbul, Turkey, E-mail: [email protected]

Vers
ion fo
r revie
w
HealthMED - Volume 6 / Number 6 / 2012
Journal of Society for development in new net environment in B&H 1935
Abstract
Background: Documentation in the medical record facilitates the diagnosis and treatment of patients. Considering the necessity of documenta-tion the data of diabetic patients and its effect on the treatment, a study designed and conducted in order to determine the condition of documentation of medical records.
Methods: This is a retrospective cross section-al descriptive study and the subjects entering the study were all of the diabetic patients referring to the Imam Khomeini and Bo Ali educational hos-pitals in Sari City, Iran in 2007-2008.
The patient characteristics calculated on a sub-set of 270 diabetic diseases: 5.6% type I Insulin-dependent diabetes mellitus and 5.2% Type II dia-betics, 18.5% was Gestational diabetes.
270 patient records were selected. Then, based on documented data in the admit ion record, sum-mary sheet, history, paramedical tests and checklist were completed. The record data under study in-cluded demographic features, clinical history, labo-ratory examinations, complications and problems, and treatment used. The collected data were ana-lyzed statistically using SPSS software version 17.
Results: The obtained data indicated that 76.95% of the demographic features, 24.3% of clinical history, 6.8% of physical examinations and 30.4% of the examinations documented.
Conclusion: Findings of this study, showed that documentation of process of the patient re-cords in the diabetic patients by the physicians who are the main health care team along with medical students, interns and residents.
Key words: Documentation; diabetes patient re-cords; data collection; Medical records; quality of care
1. Introduction
In order to improve care, information is needed about the characteristics of practices that offer diffe-rent levels of care, and the obstacles faced by prac-tices in improving care. Knowledge of factors that influence quality of care in diabetes may therefore be helpful in implementing quality improvement programmes (1). The key informant technique is a qualitative research method where an expert source of information is asked to provide deeper insight into what is going on around them (2).
Documentation in the medical record facilita-tes diagnosis and treatment, communicates perti-nent information to the other caregivers to ensure patient safety, reduce medical errors, and serves an important medical-legal function in risk mana-gement(3). Quality of documentation may also re-flect the quality of care delivered. Although recent studies have suggested that medical record docu-mentation in the outpatient setting tends to undere-stimate, the actual performance of preventive he-alth care services and other indicators of quality of care (4-6). The core of health information system in the hospital lies in the medical records (7). As a primary means of communication between health care workers, a properly documented medical re-cord is essential to good clinical care. The medical record of today not only reflects care given to the patients, but also has become a communication tool to a wide variety of players (8-11).
The medical record is a document that has traditionally served as a communication tool for members of the health care team. The role of me-dical record documentation has changed noticea-bly over time in response to many factors. The art of communicating concisely and accurately in the
Quality of Care by Good Medical Records Documentation in Educational Hospitals Kobra Aligolbandi1, Azita Bala Ghafari 2, Hasan Siamian3
1 Department of Health Information Technology, School of Allied Health Sciences, Mazandaran University of Medical Sciences, Sari, Mazandaran, Iran,2 Department of Health Information Technology, School of Allied Health Sciences, Mazandaran University of Medical Sciences, Sari, Mazandaran, Iran,3 Department of Health Information Technology, School of Allied Health Sciences, Mazandaran University of Medical Sciences, Sari, Mazandaran, Iran.

Vers
ion fo
r revie
w
1936
HealthMED - Volume 6 / Number 6 / 2012
Journal of Society for development in new net environment in B&H
medical record serves to provide evidence of the effectiveness of the individualized nutrition care plan developed by the dietetics professional (12). Increasing healthcare litigation highlights the me-dical record as a legal document of what was done and what was not done (13).
Medical documentation is important for commu-nication among health care professionals, research, legal defense, and reimbursement (14). Since the medical record is the major source of health infor-mation, it is necessary to maintain accurate, compre-hensive and properly coded patient data (15).
Medical records are commonly used to measu-re quality of care. However, little is known about how accurately they reflect patients' clinical con-dition. Even less is understood about what influen-ces the accuracy of provider's documentation and whether patient characteristics affect documenta-tion habits (16).
The medical record serves many purposes but its primary function is to plan for patient care and provide for continuity in information about the patient's medical treatment. As a permanent record, the patient's medical record informs other health care providers both inside and outside the hospital about the medical history of the patient (17).
The hospital medical record has become in-creasingly exposed to retrospective audits by third party insurers, quality assessment studies, and billing inquiries. As a result, the demand for complete documentation in the record has steadily increased during the past few years. Institutional medical practices are subject to a variety of regu-lations and standards (18).
To improve the quality of treatment, different tools have been utilized for evaluating the way of coding and way of caring in the medical records as they provide data about the disease, the rendered care and treatment procedures. Thus, it is impor-tant in evaluating the quality of care given (19). Problems with medical documentation have arisen from the explosive increase in data-volume, com-plexity and multiplicity in data-management (19). Problems with medical documentation have arisen from the explosive increase in data-volume, com-plexity and multiplicity in data-management (20).
Therefore, the first step to solve problems re-lating to the diabetic patients' records documen-tation is to prepare a list of the basic information
for each diabetic patient. The prevalence of type 2 DM ranges from 1.2% to 14.6% in Asia, 4.6% to 40% in the Middle East, and 1.3% to 14.5 % in Iran (21-23). Considering the necessity for docu-menting the data for diabetic patients and its ef-fect on the treatment, a study was designed and conducted in order to determine the status of do-cumentation diabetes patient records in the educa-tional hospitals of the Mazandaran University of Medical Sciences, Mazandaran in 2006-2007.
2. Material and Methods
This is a retrospective cross-sectional des-criptive study and the subjects entering the study comprised all the diabetic patients referred to the Imam Khomeini and Bo Ali educational hospitals in 2007-2008. In all, 270 patient records were se-lected. Then, based on the documented data in the admission records, summary sheet, and history, the paramedical tests check list was completed. The record data under study, included demograp-hic features (age, sex, and age at onset of disease), clinical history (family history, habit and history of medication, the physical examination, signs, and symptoms of diabetes) laboratory examinati-ons (blood profile, blood chemistry, enzymes, he-matology and urine examination), complications and problems (Diabetic Ketoacidosis), diabetic coma, hyperglycemia, neuropathy, nephropathy, and retinopathy) and treatment (the type of medi-cation) used. The collected data were statistically analyzed using SPSS software version 17.
3. Results
1, 76.95% of data on demographic features (age, sex, type of diabetes, marital status and age at onset of disease) was documented. Also, it was found that of the 270 diabetic patient records un-der study, 70% of them omitted reports on the type of diabetes. On demographic features, 24.3 clinical history, 6.7 % physical examination and 30.4% of examination were documented. Of 270 diabetic diseases, 5.6% type I Insulin-dependent diabetes mellitus (IDDM), 70.7% and 5.2% Type II diabetics, and 18.5% were Gestational diabetes (or gestational diabetes mellitus, GDM). 70.7% Lack of documenting type of diabetes 21.5% wit-

Vers
ion fo
r revie
w
HealthMED - Volume 6 / Number 6 / 2012
Journal of Society for development in new net environment in B&H 1937
hout recording age at onset of disease, and 41.1%, the mediation history 89.2%, the diabetic patients' diseases history were not recorded.
Clinical medical records include the history of diseases in 10.76%, family history 5.67%, addicti-on (smoking, alcohol use etc.).
66.2%, history of medication in 58.19%. The examinations revealed the lowest number reports were on the blood glucose profile in 21.4%, and the highest rate on the urine examination 48.2%. On diabetes complication (diabetes ketoacidosis, diabetic coma, hypoglycemia, neuropathy, nep-hropathy, and retinopathy, no report was given in 72.5%, diabetic coma with 1.5% and neuropathy with 21.9% were the lowest and the highest rate of given report retrospectively. Also during the study from total number of 270 patient records under study, in 72.2% there were no reports on treatment and in 27.8% data about the type of used medica-tion was given. The obtained data indicated that 76.95% of the demographic features, 24.3% of clinical history, 6.8% of physical examinations and 30.4% of the examinations were documen-ted. From the total 270 diabetic records, 5.6% be-longed to the Insulin-dependent diabetes mellitus (IDDM), 18.5% were Gestational diabetes (or ge-stational diabetes mellitus, GDM), 70.7% did not documented the type of diabetes. 21.15% had no record of age at the onset of the disease, 41.1% no history of medication record and 89.2% no history of disease in diabetic patients
4. Discussions
Findings indicated that 5.6% of the medical records belonged to diabetes type I, 5.2% to dia-betes type II and 18.5% gestational diabetes, but in 70.7% of the medical records reports of di-abetes, while study of Liesenfeld and et.al (24), 752 consecutive medical reports of patients with insulin- or no insulin- dependent, were investiga-ted the completeness of documentation of indi-cators of quality of care. The documentation for the IDDM group was more complete compared to the NIDDM group. The comparison of our study with previous work, particularly from Britain, has to keep structural differences in medical care in mind for interpretation, but trends will be similar. These observations underline the need for more
structured documentation for diabetic patients in order to improve quality of care. Liesenfeld et.al research showed that 31.5% of diabetic patients were diabetes I and 58.4% diabetes II but only in 7.6% of the type of diabetes was not documen-ted. 76.95% of the patient records were related to demographic elements, and the lowest number on physical examination was 6.8%. Yudkin et.al (25) reported that the detail of diabetes complication was generally not recorded. Yudkin et al. demon-strated that details of diabetic complications often are not recorded in general practice and hospital notes. Nevertheless, they were more often docu-mented for hospital patients. The study of Masho-ufi et.al (26) on 1500 medical records documenta-tion showed that principles of documentation by physicians and 2.51% by nurses were considered in 52.4% of the cases. In this study, 27.8% of the recorded documents belonged to the patients with high blood pressure and 2% to the biliary disease and regarding the history of disease to the patients with familiar diabetes with 26.3%, 27.8% of the urinary frequency, laming and dystopia each with 14.8% in the diabetic records. HBA1c which is in-dex blood glucose (27) in long-term blood gluco-se control of dependent medical documentation in 92% and of 439 insulin independent case 37.6%. There was report of HbA1c. A study by Aryaee et.al on 18 medical records, in 1988 showed that none of them were documented completely (28). Ahmadzadeh showed that medical documentation in the public hospital was satisfactory (29). Pro-ject like "Diadoq" (Diabetes Mellitus: Optimizing Care by Knowledge-Based Quality Assurance) in Germany and "Staged Diabetes Management" in the United States are currently working on com-puter-assisted documentation in diabetes care that can help the general practitioner and hospital physicians to monitor the quality of care delivered to their patients(30). The improvement of quality of care for diabetic patients is at the core of the St Vincent Declaration (31).
5. Conclusion
Despite efforts in recent years to improve the medical records documentation, and train physici-ans and nurses according to ICD1-10 medical dia-gnosis writing, problems still exist on proper me-

Vers
ion fo
r revie
w
1938
HealthMED - Volume 6 / Number 6 / 2012
Journal of Society for development in new net environment in B&H
dical records documentation, as the special form for diabetes provided by Ministry of Health and medical education in Iran is not used. . Therefore, it is proposed that a committee on medical docu-mentation be developed and the interns, physici-ans and nurses be instructed on the correct method for medical documentation. Also, the distribution and manner of using the special forms on diabetic patient's s is suggested. These observations under-line the need for more structured documentation for diabetic patients, to improve the quality of care and documentation. Medical record documentati-on varies depending on the measure, with room for improvement in most domains. Further study could lead to targeted interventions to improve do-cumentation.
6. Acknowledgements
The authors gratefully acknowledge the vice chancellor for research of Mazandaran University of Medial Sciences for providing research budget and approving the proposal Ms Sayede Shahrba-nou Rashida for data collection and reviewing of the medical records from two hospitals.
References
1. Khunti K. Use of multiple methods to determine fac-tors affecting quality of care of patients with diabetes. Family practice. 1999;16(5):489.
2. Bowie C, Richardson A, Sykes W. Consulting the public about health service priorities. BMJ. 1995;311(7013):1155.
3. Wood DL. Documentation guidelines: evoluti-on, future direction, and compliance. Am J Med. 2001;110(4):332.
4. Dresselhaus TR, Peabody JW, Lee M, Wang MM, Luck J. Measuring compliance with preventive care guidelines. J Gen Intern Med. 2000;15(11):782-8.
5. Luck J, Peabody JW, Dresselhaus TR, Lee M, Gla-ssman P. How well does chart abstraction measure quality? A prospective comparison of standardi-zed patients with the medical record. Am J Med. 2000;108(8):642-9.
6. Peabody JW, Luck J, Glassman P, Dresselhaus TR, Lee M. Comparison of vignettes, standardized patients, and chart abstraction. JAMA. 2000;283(13):1715.
7. Kang S, Kim KA, editors. The Survey on the Com-pleteness of the Medical Records as the Basis for Producing Valuable Health Information1998: IOS Press.
8. Braun P, Hsiao WC, Becker ER, DeNicola M. Eva-luation and management services in the Resour-ce-Based Relative Value Scale. JAMA. 1988 Oct 28;260(16):2409-17.
9. DeParle NA. From the Health Care Financing Admi-nistration. Evaluation and management services gui-deline. JAMA. 2000 Jun 21;283(23):3061.
10. Holzer S, Wachter W, Altmann U, Schweiger R, Du-deck J. Structured clinical documentation for the assessment of medical care. Stud Health Technol In-form. 2000;77:480-3.
11. Murphy BJ. Principles of good medical record documentation. J Med Pract Manage. 2001 Mar-Apr;16(5):258-60.
12. Klein CJ, Bosworth JB, Wiles CE, 3rd. Physicians prefer goal-oriented note format more than three to one over other outcome-focused documentation. J Am Diet Assoc. 1997 Nov;97(11):1306-10.
13. Documenting in the Medical Record. Health Cafe Food Nutr Focus. 2002;Nov;19 3 (1):3-6.
14. Varelas PN, Spanaki MV, Hacein-Bey L. Docu-mentation in medical records improves after a neurointensivist’s appointment. Neurocritical Care. 2005;3(3):234-6.
15. Farhan J, Al-Jummaa S, Al-Rajhi A, Al-Rayes H, Al-Nasser A. Documentation and coding of medical records in a tertiary care center: A pilot study. Ann Saudi Med. 2005;25(1):46.
16. Cradock J, Young AS, Sullivan G. The accuracy of medical record documentation in schizophrenia. The Journal of Behavioral Health Services and Resear-ch( JBHS&R). 2001;28(4):456-65.
17. RISK MANAGEMENT HANDBOOK. Version: Ja-nuary.: Yale-New Haven Hospital and Yale Univer-sity; 1997 [29 August 2011]; Available from: http://www.med.yale.edu/caim/risk/handbook/rmh_medi-cal_record.html.
18. Gannon PM. Documentation of drug interchange in the medical record. Hospital pharmacy. 1991; 26(1):14.
19. Hajavi A. Medical Records. (1-2). Tehran: Ministry of Health; 1997.

Vers
ion fo
r revie
w
HealthMED - Volume 6 / Number 6 / 2012
Journal of Society for development in new net environment in B&H 1939
20. Rossoll M, Pozenel H, Gogl H. Problems of medical documentation in the hospital]. Wiener medizinische Wochenschrift. 1988;138(8):180.
21. Azimi-Nezhad M, Ghayour-Mobarhan M, Pariza-deh M, Safarian M, Esmaeili H, Parizadeh S, et al. Prevalence of type 2 diabetes mellitus in Iran and its relationship with gender, urbanisation, educati-on, marital status and occupation. Singapore Med J. 2008;49(7):571-6.
22. Azizi F, Guoya M, Vazirian P, Dolatshati P, Habbi-bian S. Screening for type 2 diabetes in the Iranian national programme: a preliminary report. East Me-diterr Health J. 2003;9(5-6):1122-7.
23. Azizi F, Gouya M, Vazirian P, Dolatshahi P, Habi-bian S. The diabetes prevention and control progra-mme of the Islamic Republic of Iran. East Mediterr Health J. 2003;9:1114-21.
24. Liesenfeld B, Heekeren H, Schade G, Hepp K. Qua-lity of documentation in medical reports of diabetic patients. Int J Qual Health Care. 1996;8(6):537.
25. Yudkin JS, Boucher BJ, Schopflin KE, Harris BT, Claff HR, Whyte NJ, et al. The quality of diabetic care in a London health district. J Epidemiol Com-munity Health. 1980 Dec;34(4):277-80.
26. Mashofi M, Amani F, Rostami KH, Moradi A. Evalu-ation of medical documentation at the hospitals af-filiated to Ardabil University of Medical Sciences. J Ardabil University of Medical Sci. 2006;6:73-7.
27. Sharifi FAS, Madadi R. The Effect Of Ramadan Fa-sting On Metabolic Control In Type2 Diabetes Me-llitus. Journal Of Zanjan University Of Medical Sci-ences And Health Services 2002;10(41):9-13.
28. Aryaei M. Qualitative study of medical records department at the Kerman University of Medical Sciences affiliated hospitals at the first trimesters, 1998. Quarterly Journal of medical documentati-on management faculty of management and me-dical informatics, Iran University of Medical Sci. 2001;11(1):65-70.
29. Ahmadzadeh F. Study on the rate of completing medical records documentation at the Shiraz Uni-versity of Medical Sciences affiliated hospitals. Tehran: Faculty of Management and medical in-formatics, Iran University of Medical Sciences, Iran.; 1998.
30. Mazze RS, Etzwiler DD, Strock E, Peterson K, McC-lave CR, Meszaros JF, et al. Staged diabetes mana-gement. Diabetes Care. 1994;17(suppl 1):56-66.
31. International Diabetes Federation. Diabetes Care and Research in Europe. The Saint Vincent Declara-tion. Diabet Med. 1990;7:360.
Corresponding Author Azita Bala Ghafari, Department of Health Information Technology, School of Allied Health Sciences, Mazandaran University of Medical Sciences, Sari, Mazandaran, Iran, E-mail: [email protected]

Vers
ion fo
r revie
w
1940
HealthMED - Volume 6 / Number 6 / 2012
Journal of Society for development in new net environment in B&H
Abstract
Purpose: The purpose of this study was to exa-mine the physical activity level of teachers and he-alth professionals and to investigate whether there were differences in physical activity level between two separate groups.
Method: To determine the physical activi-ty levels International Physical Activity Questio-nnaire (IPAQ) was applied to 200 teachers (age; 36.28±6.58) including 92 male and 108 female working in primary schools and 200 health profe-ssionals (age; 33.63±7.55 years) including 62 male and 138 female working in university hospital. The short-form of IPAQ which includes last one week containing the 7 item has been used to determine the physical activity levels. Mann Whitney-U test was used to evaluate the differences between two gro-ups. The relations of parameters, such as profession, age, gender, branch, height, weight, drug alcohol and tobacco use and marital status with Physical Ac-tivity level were analyzed by using Chi-Square test.
Results: The weekly physical activity score of teachers and health professionals were 1544.58 MET-min/week and 1986.59 MET-min/week res-pectively and no statistically difference was found (p>0.05). Health professionals’ walking activity and time of sitting were found higher than tea-chers (p<0.05 and p<0,01). Physical activity sco-res were not found significantly different between male teachers and male health professionals (p>0.05). Total physical activity scores, walking activity scores and sitting times were found signi-ficantly higher in female health professionals than female teachers (p<0.05; p<0.01).
Conclusion: Total physical activity levels of te-achers and health professionals were not different and insufficient. The physical activity level increa-se in teachers and decrease in health professionals
with increasing age and with smoking. Gender di-fference and marriage affects the physical activity level of teachers but does not affect the health pro-fessionals. Physical activity level was not different according to drug, alcohol consumption and BMI in both occupation groups. As a result physical activity levels in terms of some variables diffe-red between two professional groups.
Key words: Physical activity level, teachers, health professionals.
Introduction
As technologies and industrialization continue to progress at a rapid pace, in the 20th century, conditions of life have changed in many countri-es. The sedentary lifestyle which is potential ne-gativity of these changes causes development of diseases such as cardiovascular disease, diabetes, obesity, some types of cancer and muscular-ske-letal problems (1). It has been proven that regular physical activity develops aerobic capacity, musc-le strength, body balance, coordination, metabo-lic function and also provides developing in bone density, lipid profile, insulin levels and immune system functions (2). Balanced diet and regular physical activity are bases of prevention and tre-atment of lipid metabolism disorders, cardio and cerebrovascular diseases and other mass no com-municable diseases caused by high energy-density nutrition and insufficient physical activity (3)
The vast majority of society perceive the term of "sport" as synonymous with physical activity. However physical activity is defined as any bodily movement produced by skeletal muscles that requ-ires energy expenditure, it increases heart and bre-athing rate and results fatigue by different levels of intensity. In this context, in addition to sporting activity, exercises, variety of games and activities
Physical activity levels of teachers and health professionals in TurkeyAtan T1, Tural E2, Imamoglu O1, Cicek G3, Tural S4
1 Ondokuz Mayis University, Yaşar Dogu Physical Education and Sports High School, Samsun, Turkey,2 Ondokuz Mayis University Hospital, Physical Medicine and Rehabilitation, Samsun, Turkey,3 Hitit University, Physical Education and Sports High School, Corum, Turkey,4 Ondokuz Mayis University, Department of Medical Genetics, Turkey.

Vers
ion fo
r revie
w
HealthMED - Volume 6 / Number 6 / 2012
Journal of Society for development in new net environment in B&H 1941
during the day are considered to be a physical ac-tivity (4). The relationship is established between physical activity level and many factors such as heredity, age, gender, socio-economic status, heal-th status, level of education (5).
Measurement of physical activity is important for identifying low physical activity level of per-sons to encourage them to a higher activity (6). It is important to measure physical activity by accurate and reliable methods. For this reason direct and in-direct methods have been developed for measuring. Direct measurement methods are; observation, in-room calorimeter (body heat production), dual-layer water technique, acceleration vectors (acce-lerometer), motion sensors (pedometer) and a met-hod of logging. Indirect measurement methods are; indirect calorimeter, dietary records (daily energy intake), physiological measurements (cardio res-piratory fitness, heart rate, temperature, ventilati-on) and physical activity questionnaires. Selection of the method varies depending on purpose of the study, characteristics of the participants and work plan (1,7). Surveys are easy to use measurement of physical activity and energy consumption. Besides this method is the most convenient and inexpensive method for studying large populations (7).
Although benefits of regular physical activities are known, recent researches show that physical activity levels of individuals were found to be less than the recommended levels (8). American Co-llege of Sports Medicine (ACMS) recommenda-tions for the general population are that all adults accumulate at least 30 min of moderate-intensity physical activity on most, and preferably all days of the week (8). A survey includes 15 European countries reported that physical activity levels were less than 50% of recommended level (9).
This study aimed to detect physical activity level of two separate groups (teachers and heal-th professionals) and also to investigate whether there are any differences in the levels of physical activity between two groups.
Method
Participants
Surveys were applied to 200 teachers (age: 36.28±6.58 years; body height: 1,68±0,08m; body
weight: 70.72±12.41 kg) including 92 male and 108 female working in Samsun Central Primary School and applied to 200 health professionals (age; 33.63±7.55 years stature: 1.66±0.07m; body weight: 67.48±12.26) including 62 male and 138 female working in university hospital. The Body Mass Index (BMI) was grouped in 4 different le-vels as; slim (<19.9kg/m2), normal (20-24.9 kg/m2), overweight (25-25.9 kg/m2) and obese (>30 kg/m2).
Data Source
The data were collected by face-to-face survey method. General Information Form was prepared by researchers in order to obtain information abo-ut occupation, age, gender, industry, size, body weight, alcohol and drug use and marital status of participants.
Physical activity levels were determined by In-ternational Physical Activity Questionnaire (10). The validity and reliability of this survey tested in Turkey by Ozturk in 2005 (1). It is recommended to be applied this survey to adults between ages of 18-69. The short-form of IPAQ was used to deter-mine the physical activity level which includes 7 questions for last week.
Short-form total score was calculated by sum-ming the times (minutes) and frequencies (days) of “walking, moderate and severe” activities. The survey includes questions about physical activity lasting at least 10 minutes in a week. MET-min/week score is obtained by multiplication of mi-nutes, days, and the MET values (multiples of resting oxygen consumption). Under resting con-ditions each person consumes 3.5 ml of oxygen in a minute per kg. Walking score were calculated by multiplication to walking time with 3.3 MET. In calculation, for moderately intense activity 4 MET, for severe activity 8 MET were used.
Physical activity levels were classified as physi-cally “inactive” (<600 MET min / week), “low ac-tive” (600-3000 MET-min / week) and “adequate” level of physical activity (>3000 MET-min / week).
Statistical Analysis
Kolmogorov-Smirnov test was used for whether data is normally distributed or not. It was detec-ted that the data was not normally distributed and

Vers
ion fo
r revie
w
1942
HealthMED - Volume 6 / Number 6 / 2012
Journal of Society for development in new net environment in B&H
Mann Whitney-U test was used to analyze the dif-ferences between two groups. Chi-square test was used to detect the physical activity level according to occupation, age, gender, industry, medicine, al-cohol and tobacco use, marital status. SPSS 19.0. Version was used for the statistical analyses.
Results
Comparisons of Physical Activity Scores of participants are seen in Table 2. The average to-tal physical activity score was for the teachers 1544.58±96.78 MET-min/week and for the health Professionals 1986.59±139.61 MET-min/week and no significant difference was found between the two occupation group (p>0.05). It was determined that walking activity and sitting time were higher in health professionals than teachers (p<0.05; p<0.01).
Physical activity levels were compared separa-tely for males and females. In males, total physical activity scores were higher in health professional group, however there was not any statistically si-gnificant difference between two group of men (p>0.05). In females, total physical activity scores, walking activity scores and sitting time were higher in health professional group (p<0.05; p<0.01).
The teachers physical activity levels were; 27.5% “inactive”, 61.5% “low active”, 11% “adequate” respectively (Table 4). And the health professional’s physical activity levels were; 27% “inactive”, 51.5% “low active”, 21.5% “adequate” respectively. As a result the vast majority of the subjects in our study were at "low active" level.
For teachers, as the age increased, the adequa-te physical activity level increased (p<0.05). The “adequate” physical activity level was found in 22.4% of teachers who are older than 41 years, in 4.9% of teachers who are 20-30years and 8.2% of teachers who are 31-40years. However in he-alth professional group, there was not any sta-tistically significant difference according to the age (p>0.05).
Teachers’ physical activity level was exami-ned by gender. While men’s physical activity le-vels were; 18.5% “inactive”, 64.1% “low active”, 17.4% “adequate”; women’s physical activity levels were; 20.6% “inactive”, 45.4% “low acti-ve”, 34 % “adequate”. The physical activity level were found different between two gender groups (p<0.01). However in health professional group, there was no statistically significant difference according to the gender (p>0.05).
Table 1. An example of physical activity level calculation
Form of physical activityTotal
Walking activity Moderate level activity Severe activityMET 3.3 (constant value) 4.0 (constant value) 8.0 (constant value)
1 day/minute 40 60 20week/day 4 3 3
Total 528 MET-min/week 720 MET-min/week 480 MET- min/week 1728 MET- min/week
Table 2. Comparison of physical activity scores between teachers and health professionalsPhysical Activity Level
(MET-min/week) Occupation n Mean Standard Error
MannWhitney-U p
Severe activity Teacher 200 446.55 56.17 17694.500 ,112Health Professional 200 352.16 53.98
Moderate activity Teacher 200 276.45 32.06 19989.000 ,992Health Professional 200 302.30 43.28
Walking Activity Teacher 200 817.40 56.97 17439.000 ,027*Health Professional 200 1314.49 117.35
Total Activity Teacher 200 1544.58 96.78 18364.000 ,157Health Professional 200 1986.59 139.61
Sitting time Teacher 200 258.93 9.668 17011.000 ,009**Health Professional 200 290.25 9.636 *p<0.05 **p<0.01

Vers
ion fo
r revie
w
HealthMED - Volume 6 / Number 6 / 2012
Journal of Society for development in new net environment in B&H 1943
Table 3. Comparison of physical activity scores between men and womenPhysical Activity Level
(MET-min/week) Gender Occupation n Mean Standard Error
MannWhitney-U p
Severe activityMen Teacher 92 737.83 93,723 2299.000 0.066Health Professional 60 586.67 132,056
Women Teacher 106 193.74 56,035 6636.500 0.240Health Professional 134 247.16 48,886
Moderate ActivityMen Teacher 92 269.02 42,156 2727.500 0.628Health Professional 62 376.13 82,911
Women Teacher 108 282.78 47,454 7416.500 0.945Health Professional 138 269.13 50,430
Walking Activity Men Teacher 92 937.12 91,493 2451.000 0.139Health Professional 62 1487.11 226,684
Women Teacher 108 715.41 70,042 6287.000 0.035*Health Professional 138 1236.93 136,271
Total ActivityMen Teacher 92 1941.68 169,139 2746.000 0.696Health Professional 62 2427.11 302,390
Women Teacher 108 1206.30 95,987 6223.000 0.026*Health Professional 138 1788.67 147,717
Sitting timeMen Teacher 92 271.63 14,287 2777.000 0.780Health Professional 62 284.03 19,252
Women Teacher 108 248.10 13,102 5751.500 0.002**Health Professional 138 293.04 11,006*p<0,05 **P<0.01Table 4. Physical activity levels in teachers and health professionals according to age, gender and branches
Occupation YearsPhysical Activity Level
X2Inactive Low active Adequate Totaln % n % n % n %
AgeGroup
Teacher
20-30 (1) 13 31.7 26 63.4 2 4.9 41 1009.542*3≠1,2*
31-40 (2) 29 26.4 72 65.5 9 8.2 110 10041 and over (3) 13 26.5 25 51* 11 22.4* 49 100
Total 55 27.5 123 61.5 22 11 200 100
Health Professional
20-30 (1) 24 28.9 38 45.8 21 25.3 83 1004.89831-40 (2) 18 23.4 41 53.2 18 23.4 77 100
41 and over (3) 12 30 24 60 4 10 40 100Total 54 27 103 51.5 43 21.5 200 100
GenderTeacher
Men (1) 17 18.5** 59 64.1 16 17.4** 92 100 11.561**1≠2Women (2) 38 35.2** 64 59.3 6 5.6** 108 100
Total 55 27.5 123 61.5 22 11 200 100
Health Professional
Men (1) 16 25.8 30 48.4 16 25.8 62 1000.992Women (2) 38 27.5 73 52.9 27 19.6 138 100
Total 54 27 103 51.5 43 21.5 200 100
Branches
Teacher
Physical Education (1) 1 7.7** 8 61.5 4 30.8** 13 10013.742**
1≠2,3Class (2) 20 31.3 33 51.6 11 17.2 64 100
Other branches (3) 34 27.6 82 66.7 7 5.7 123 100Total 55 27.5 123 61.5 22 11 200 100
Health Professional
Doctor (1) 6 19.4 14 45.2 11 35.5 31 100
9.796Nurse (2) 18 29.5 27 44.3 16 26.2 61 100Biologist (3) 9 23.7 25 65.8 4 10.5 38 100Others (4) 21 30 37 52.9 12 17.1 200 100
Total 54 27 103 51.5 43 21.5 200 100*p<0.05 **p<0.01

Vers
ion fo
r revie
w
1944
HealthMED - Volume 6 / Number 6 / 2012
Journal of Society for development in new net environment in B&H
Significant differences were found between physical activity level and branches for teachers (p<0.01). “Adequate” physical activity level was found in 30.8% of physical education teachers, 17.2% of class teachers and 11% of the other bran-
ch teachers. There was no significant differences in health professional group between physical ac-tivity levels and related branches (p>0.05).
In both groups, there were no significant diffe-rences according to drug, alcohol consumption and
Table 5. Physical activity level in teachers and health professionals according to pharmaceuticals, smoking, alcohol consumption.
OccupationPhysical Activity Level
X2Inactive Low active Adequate Totaln % n % n % n %
Drug use
TeacherYes 8 24.2 21 63.6 4 12.1 33 100
0.227No 47 28.1 102 61.1 18 10.8 167 100Total 55 27.5 123 61.5 22 11 200 100
Health Professional
Yes 6 15.8 24 63.2 8 21.1 38 1003.426No 48 29.6 79 48.8 35 21.6 162 100
Total 54 27 103 51.5 43 21.5 200 100
Smoking
TeacherYes 20 32.8 34 55.7 7 11.5 61 100
1.384No 35 25.2 89 64 15 10.8 139 100Total 55 27.5 123 61.5 22 11 200 100
Health Professional
Yes 47 30.7 78 51 28 18.3 153 1006.469*No 7 14.9 25 53.2 15 31.9 47 100
Total 54 27 103 51.5 43 21.5 200 100
Alcoholconsumption
TeacherYes 5 21.7 15 65.2 3 13 23 100
0.471No 50 28.2 108 61 19 10.7 177 100Total 55 27.5 123 61.5 22 11 200 100
Health Professional
Yes 12 40 14 46.7 4 13.3 30 1003.464No 42 24.7 89 52.4 39 22.9 170 100
Total 54 27 103 51.5 43 21.5 200 100*p<0.05
Table 6. Physical activity level in teachers and health professionals according to BMI and marital status
OccupationPhysical Activity Level
X2Inactive Low active Adequate Totaln % n % n % n %
BMI
Teacher
Slim 0 0 4 80 1 20 5 100
3.792Normal 27 27.3 63 63.6 9 9.1 99 100
Overweight 26 30.2 50 58.1 10 11.6 86 100Obese 2 20 6 60 2 20 10 100Total 55 27.5 123 61.5 22 11 200 100
Health Professional
Slim 2 28.6 3 42.9 2 28.6 7 100
5.312Normal 28 24.8 59 52.2 26 23 113 100
Overweight 17 26.2 35 53.8 13 20 65 100Obese 6 42.9 6 42.9 2 14.3 14 100Total 54 27 103 51.5 43 21.5 200 100
Maritalstatus
Teacher Married 51 30.7 96 57.8 19 11.4 166 10010.048*Single 4 9.1 27 81.8 3 9.1 34 100
Total 55 27.5 123 61.5 22 11 200 100
Health Professional
Married 37 29.1 65 51.2 25 19.7 127 1001.127Single 17 23.3 38 52.1 18 24.7 73 100
Total 54 27 103 51.5 43 21.5 200 100*p<0.05

Vers
ion fo
r revie
w
HealthMED - Volume 6 / Number 6 / 2012
Journal of Society for development in new net environment in B&H 1945
physical activity levels. In health professional gro-up there was a statistically significant differences between activity level and smoking (p<0,05). Users of cigarette (30.7%) were in “inactive” group.
In both groups, there were no significant dif-ferences in physical activity levels according to BMI and (p>0.05). When participant’s physical activity levels examined by marital status, 30.7% of married teachers were in “inactive” group, 9.1% of single teachers were in “inactive” group. It was found that, in teachers physical activity levels was effected by the marital status (p<0.05). However in health professional group, marital status did not affect the physical activity levels (p<0.05).
Discussion
A number of recent studies have shown that re-gular physical activity is beneficial for patients with different health problems and also for more healthy individuals and communities physical activity sho-uld be encouraged. It is clear that for having a long and quality life increased physical activity (PA) le-vel is needed (4). Current physical activity recom-mendations for the general population are that all adults should perform at least 30 min of moderate-intensity physical activity, and preferably in all days of the week (11). A physical activity habit varies according to cultural background, socioeconomic level, individual differences and health status (7).
In this study, physical activity levels of teachers and health professionals were examined by short form of the International Physical Activity Que-stionnaire (IPAQ). Total physical activity scores were found 1544.58±96.78 MET-min/week for teachers and 1986.59±139.61 MET-min/week for health professionals. The mean total physical ac-tivity scores of health professionals were higher than teachers but this difference was not statisti-cally different. While "severe", "moderate" and "total" physical activity showed no significant di-fferences between teachers and health professio-nals, walking activity and sitting time were higher in health professionals than teachers.
In a study that examined university teaching staff, the maximum activity was “walking acti-vity” with 48.3 % (5). In another study, physical education teacher’s physical activity levels were; 41.6 % inactive, 41.6% moderate and 16.8% high
active, respectively (12). These results indica-te that, physical activity levels are generally not adequate in different occupational groups.
In the present study, both groups of teachers and health professionals, the most frequent form of physical activity was “walking activity”, “severe activity”, “moderate level” and lastly “sitting acti-vity” respectively. In a study that examined univer-sity students in health sciences, “walking activity” was determined the most frequent form of physical activity, then “sitting activity” and lastly “high” and “moderate" activity were determined respectively (7). In a recent study, Vural et al. examined desk working persons and reported the frequency of physical activity were; sitting, walking, high physi-cal activity and moderate activity, respectively (4).
In our study, when men and women were evaluated separately, total physical activity sco-re was higher in male health professionals’ (2427.11±302.39 MET-min/week) than male tea-chers (1941.68±169.139 MET- min/week), but this difference was not statistically. Furthermore, fema-le health professionals total physical activity score was (1788.67 ±147.717 MET- min/week) higher than female teachers (1206.30±95.987 MET- min/week). In a different study which examined the physical education teachers, total physical activi-ty score of males were 1607 MET- min/week and females were 999 MET- min/week (12). Our total physical activity scores of teachers were higher than Arabacı and colleagues found (12). In another study which examined the physical activity level of university students, total physical activity score of girls was 1812.30±1569.40 MET- min/week and boys were 2237.74±1589.45 MET- min/week (13). In the study of Savcı et al., total physical activity score of girls and boys were lower than our fema-le health professionals. And total physical activity score of boys were also lower than our male health professionals (13). These results show that health professionals’ physical activity scores were higher than most of the other general population.
It is detected in our study that 61.5% of teachers and 51.5% of health professionals were in “low active” group. As well as Arabacı et al. reported 41.6% of physical education teachers and 68 % of students in health sciences were also in “low acti-ve” group (12). Bas Arslan et al. have studied with 207 university students and they reported for the

Vers
ion fo
r revie
w
1946
HealthMED - Volume 6 / Number 6 / 2012
Journal of Society for development in new net environment in B&H
girls 28.7% was sedentary, 30.7% was “active” and 41% was high active; for the boys, 16.9% was sedentary, 21.7% was active and 65 % was high active (7). In the present study, 27.5% of teachers and %27 of health professionals were inactive and only 11% of teachers and 21.5% of health profe-ssionals were in adequate activity level.
In the current study physical activity levels were examined according to age. The teachers’, whose age is 41 years and over, physical activity level (22.4%) is more adequate than the other age groups. Oppositely the health professional’, who-se age is 41 years and over, physical activity level is less adequate (%10) than the other age groups but the difference was not statistically. This fin-ding shows that, the physical activity level increa-se in teachers and decrease in health professionals with increasing age. It’s surprising that only 4.9% of teachers’ physical activity level is adequate between the 20-29 ages. Similarly, in the study of Vural et al., physical activity level increases with increasing age. Adequate physical activity was fo-und higher in the 40 and upper age group (2). In the previous study, which found positive correla-tion between physical activity and age in physical education teachers, supports our findings (12).
In our study, male teachers had higher level of physical activity than female teachers. There was no significant difference between the sexes among health professionals. In 2006, a study conducted with university students; there were no statistically significant difference in sitting activity scores of male and female students. However, in boys, total physical activity, moderate intense activity, high activity, and walking activity scores were higher than girls (13). Bas Arslan et al. reported that “high physical activity” was higher in boys; “moderate physical activity” was higher in girls (7). In 2010 a study conducted with individuals working at desk, adequate physical activity level was lower in fema-les than males (4). Previous studies show that ma-les have higher physical activity levels than females (14,15,16). In the present study when the physical activity level compared between the branches, physical education teachers’ activity level is more adequate than the other branch teachers.
Physical activity level was not different accor-ding to drug and alcohol consumption in both occupation groups. However a user of cigarette
was higher in health professionals group. Also there was a significant difference between the physical activity level of smoking and non-smo-king group in health professionals. While 30.7% users of cigarette were in “inactive group” , 14.9% of non-users were in “inactive group”. Burton and Turrel reported that physical inactivity is higher among smokers (17). Also in the current study it can be said that, smoking can affect the physical activity level in health professionals.
We examined the level of physical activity according to body mass index (BMI), 63.6% of te-achers who had normal BMI were in “low active group”. Besides 53.8% of health professionals who had high BMI were in “low active group”. In both occupation group there was no significant differen-ces between level of physical activity according to body mass index (p>0.05). Similarly, a study conducted with university students, there was no significant differences in the level of physical ac-tivity according to BMI (12). In a previous study, among the subjects whose BMI were below and above 25kg/m2 the physical activity points were not different (14).
In the current study, marital status was not diffe-rent the physical activity level in health professio-nals. However physical activity levels found diffe-rent between single and married teachers. In terms of physical activity, the rate of married and also non-active teachers (30.7%) found to be higher than sin-gle teachers (9.1%), this finding concluded us that marriage reduces the physical activity. Similarly Burton and Turrel reported that parents have chil-dren do less physical activity than non-married (17).
A 5-year follow-up study showed that a level of physical activity of Turkish society is low and also physical activity level of women decreased with time (18). In a study of faculty members, low level of physical activity was found (5). In consi-stent a study conducted with young adults, simi-larly showed low level physical activity results (6). In another study that examined desk working persons, the physical activity levels were found to be inadequate but this was not related with life quality (4). Different study conducted with 250 physical education teachers showed the level of physical activity inadequate or close to inactivity.
In conclusion, the total physical activity levels of teachers and health professionals were not dif-
Vers
ion fo
r revie
w
HealthMED - Volume 6 / Number 6 / 2012
Journal of Society for development in new net environment in B&H 1947
ferent and insufficient. The physical activity level increase in teachers and decrease in health profe-ssionals with increasing age and with smoking. Gender difference and marriage affects the physi-cal activity level of teachers but does not affect the health professionals. Physical activity level was not different according to drug, alcohol consump-tion and BMI in both occupation groups. As a re-sult physical activity levels in terms of some va-riables differed between two professional groups
References
1. Öztürk MA. Research on reliability and validity of in-ternational physical activity questionnaire and deter-mination of physical activity level in university students. Master Thesis, Hacettepe University. Ankara, 2005.
2. Task force on community preventive services, Recom-mendations to increase physical activity on communi-ties. Am J Prev Med. 2002; 22: 67-72.
3. Novakovic B, Jovicic J, Jusupovic F, Grujicic M, Traj-kovic-Pavlovic L, Bijelovic S. Medical nutrition pre-vention and medical nutrition therapy of lipid meta-bolism disorder. Health MED J. 2009; 3(3): 235-244.
4. Vural Ö, Eler S, Atalay Güzel N. The relation of physi-cal activity level and life quality at sedentary profe-ssion. Spormetre Journal of Physical Education and Sport Science. 2010: VIII(2): 69-75.
5. Arslan C, Koz M, Gür E, Mendeş B. Investigation of the correlation between at physical activity level and health problems in university educational staff. Fırat University Journal of Health Science. 2003; 17(4): 249-258.
6. Vaizoğlu SA, Akça O, Akdağ A, Akpınar A, Omar HA, Coşkun D, Güler Ç. Determination of physical activi-ty among young adults. TSK Koruyucu Hekimlik Bül-teni. 2004; 3(4): 63-71.
7. Baş Aslan Ü, Livanelioğlu A, Aslan Ş. Evaluation of physical activity levels in undergraduate students by two methods. Physical Therapy and Rehabilitation. 2007; 18(1): 11-19.
8. Vuillemin A, Boini S, Bertrais S. et all. Leisure time physical activity and health related quality of life. Preventive Medicine. 2005; 41: 562-569.
9. Eurobarometer, Physical Activity, 2002. Special Euro-barometer 183-6 / Wave 58.2- European Opinion Re-search Group EEIG. Brussels, European Commission.
10. Craig CL, Marshall AL, Sjöström M. et all. Inter-national Physical Activity Questionnaire (IPAQ): 12-country reliability and validity. Med Sci Sports Exerc. 35. 2003. 1381-1395.
11. Driskell JA, Kim YN, Goebel KJ. Few differences fo-und in the typical eating and physical activity habits of lower-level and upper-level university students. J Am Diet Assoc. 2005; 105: 798-801.
12. Arabacı R, Çankaya C. Study on the physical activity level of physical education teachers. Uludağ Univer-sity Faculty of Education Journal. 2007; XX(1): 1-15.
13. Savcı S, Öztürk M, Arıkan H, İnal İnce D, Tokgözoğlu L. Physical activity levels of university students. Arc Tur Soc Cardiol. 2006; 34(3): 166-172.
14. Şanlı E. Relation of the physical activity level-age, gender and body mass index among the teachers. Ma-ster Thesis, Gazi University Education Science Insti-tute Physical Education and Sports. Ankara: 2008.
15. Genç M, Eğri M, Kurçer A, et all. Physical activity of the bank personnel in Malatya city. Inonü University Journal of Medical Faculty, 2007; 9(4): 237-240.
16. Fişne M. Examining the effect of physical activity le-vel of university students on their academic achieve-ment, communication skills and life satisfaction. Ma-ster Thesis. Erciyes University Institute of Social Sci-ences Division of Sport Management. Kayseri: 2009.
17. Burton NW, Turrel G. Occupation, hours worked, and leisure-time physical activity. Preventive Medi-cine. 2000; 31(6): 673-681.
18. Koylan N. On the rising trend of coronary heart di-sease among Turks. Turkish Society of Cardiology Res. 2001; 29(10): 610-11.
Corresponding Author Tülin Atan, Ondokuz Mayıs University, Samsun, Turkey, E-mail: [email protected]

Vers
ion fo
r revie
w
1948
HealthMED - Volume 6 / Number 6 / 2012
Journal of Society for development in new net environment in B&H
Abstract
Objectives: To investigate the role of extracel-lular signal-regulated kinase 1/2 (ERK1/2) signalling pathway in the secretion of human bronchial smooth muscle cells passively sensitized by asthmatic serum.
Methods: Human bronchial smooth muscle cells (HBSMCs) were taken from normal pulmo-nary tissue in surgery and cultured in vitro treated with normal human serum or asthmatic serum. Epidermal growth factor, PD98059 and ERK1/2 antisense oligonucleotide were used to explore the role of ERK1/2 signaling pathway. The expression of Phospho-ERK1/2 in HBSMCs was analyzed by Western blot. Secretion of HBSMCs was detect-ed by enzyme linked immunosorbent assay and Western blot.
Results: The level of Phospho-ERK1/2 in-creased in HBSMCs passive sensitized with asth-matic serum compared with normal serum. HB-SMCs of asthmatic serum group secreted much more growth factors (TGF-β1, VEGF and CTGF), cytokines (RANTES and EOTAXIN) and extra-cellular matrix (Fibronectin and CollangenI) than that of normal controls. Epidermal growth factor stimulated the secretions of both two groups, but the response of chronic asthmatic group was more intense. Both PD98059 and antisense oligonucle-otide were able to suppress the secretions of passive sensitized HBSMCs, but antisense oligonucleotide reduced the level of RANTES nearly to that of nor-mal controls, while PD98059 couldn’t.
Conclusion: Our results suggest that ERK1/2 signalling pathway may play an important role in the increased secretion of passive sensitized HB-SMCs, and ERK1/2 antisense oligonucleotide is capable to slow down the process.
Key words: extracellular signal-regulated ki-nase; asthma; human bronchial smooth muscle cell; secretion
Introduction
Asthma is characterized pathologically by structural changes in the airway, termed airway remodeling1. These changes are associated with worse long-term clinical outcomes and have attri-buted to the poor therapy in some persistent and severe asthmatics2. Several studies demonstrate that human bronchial smooth muscle cells (HB-SMCs) play a critical role in airway remodeling not only because of their contraction function, but more important, through the multiple active medi-ators that they secret in chronic asthmatic status, while the interpretation for the mechanism of this process is still to be identified3.
Extracellular signal-regulated kinase1/2 (ERK1/2) signalling pathway is one of the most important signalling pathways that transmit the in-tracellular signal4. It is identified that ERK1/2 si-gnalling pathway modulate the proliferation of vas-cular smooth muscle cells5. Recent reports showed that the ERK1/2 pathway regulate epithelial cell secretory function and proliferation6, 7. Our previ-ous study showed that ERK1/2 signalling pathway maybe implicate the pathophysiology of chronic asthma8, 9. However few reports address about the role of ERK1/2 signalling pathway in the secreti-on function of HBSMCs in asthma status. The aim of this study is to profile the impact of ERK1/2 si-gnalling pathway on the secretion of HBSMCs pa-ssive sensitized with asthmatic serum.
Extracellular signal-regulated kinase1/2 signalling pathway regulate the secretions of human bronchial smooth muscle cells passively sensitized by asthmatic serumMin Xie, Xian-Sheng Liu, Yong-Jian Xu, Zhen-Xiang Zhang
Department of Respiratory Disease, Tongji Hospital Affiliated to Tongji Medical College, Huazhong University of Science and Technology, Wuhan, China

Vers
ion fo
r revie
w
HealthMED - Volume 6 / Number 6 / 2012
Journal of Society for development in new net environment in B&H 1949
Materials and methods
Serum collectionSeven acute asthma patients and seven healthy
controls were recruited. The asthmatics included three males and four females who were (38±9) years old in average and suffered the disease for (7±2) years. The patients hadn’t taken steroid since ten days before the episode and presented the total IgE levels higher than 2×10⁵IU/L. The healthy controls who never had history of asthma or allergy response constituted of four males and three females and averaged (35±5) years old. All the procedures were approved by the Human Eth-ic Review Committee of Huazhong University of Science and Technology and received the permis-sions from all the cases.
Total blood were taken from the body and incu-bated for two hours in 37℃, and then centrifuged at 3000rpm/min for 10 min. The supernatant was frozen in -80℃ for later use.
Cell culture and identificationHuman bronchial smooth muscle was obtained
from the lobar or main bronchus of 8 patients of ei-ther sex (mean age, 65±6 years old; range, 40 to 78 years old) undergoing lung resection for carcinoma of the bronchus, as previously described in detail10. According the method of Liu11 et al, after removal of the epithelium, portions of the smooth muscle beyond 5cm of the carcinoma were dissected free of adherent connective and parenchymal tissue un-der aseptic conditions in Hanks’ balanced salt so-lution. The smooth muscle layer was minced into 1mm3 fragments and incubated for 20-30 minutes at 37℃ in Ca2+ free PSS containing 2g/l collagenase, 5g/l papain, 2g/l bovine serum albumin. After di-gestion, the separated cells were culture in Dulbec-co's modified eagle's medium (DMEM) containing 20% fetal bovine serum (FBS). For identification of HBSMCs, immunofluorescent cytochemical stain was conducted with first antibody (anti-α-smooth musle actin, Santa Cruz Biotechnology, Santa Cruz, CA; 1:100), and visualized for cytoplasm filament under fluorescence microscope.
HBSMCs of passage 3-7 were use for the experi-ment. The cells were seeded on six- cell plate with 10% FBS-DMEM, and then changed to serum free DMEM for 24 hours synchronization when nearly
70% confluent. After that, HBSMCs were treated respectively with serum free DMEM, 10% healthy control serum, 10% asthmatic serum. The passively sensitized smooth muscle cells were also dealt with 10ng/ml epidermal growth factor (EGF, Accurate chemical&sceintific corpration, Westburg, NY, USA), 30µmol/l PD98059 (Biosourse, USA), both EGF 10ng/ml and PD98059 30umol/l following half hour of pre-incubation with PD98059, transfec-tion of ERK1/2 antisense oligonucleotide or sense oligonucleotide. Twenty-four hours later, all the groups were changed to serum-free medium for next twenty four hours. In the end, supernatant was col-lected and stored at -20℃. The cells were counted and snap frozen at -80℃ for later determination.
ERK1/2 ODN transfectionThe antisense oligonucleotide (ODN) to
ERK1/2 was a 18-mer (5’- -AGC AGA TAT GGT CAT TGC -3’). Sense ODN (5'- GCA ATG ACC ATA TCT GCT--3') was used as a control. The phosphorothioate-modified ODN was synthesized by TaKaRa Biotechnology, Dalian, China, part of which was labelled with FITC. Cells were treated with an ODN-Lipofectin mixture at a ratio of 1:2 (0.5 µM ODN) and incubated for 6 h. The cells were then washed to remove the ODN-Lipofectin mixture and incubated for 18 hours in DMEM con-taining 0.5 µM ODN alone. FITC-labeled ODN turned HBSMCs green when it was taken into the cells under fluorescence microscope, which helped for identification of uptake efficiency.
Western blot analysisProteins were extracted from cells with SDS
sample buffer, then separated in 8% SDS-PAGE and transferred onto a nitrocellulose membrane. Anti-pan ERK1/2 (R﹠D Systems, MN,USA, 1:5000) Ab and anti-phospho-ERK1/2 (R﹠D Systems, MN,USA,1:5000) Ab were used to de-tect expression of ERK1/2. Antibodies against connective tissue growth factor (CTGF, Abcam England, 1:2500), fibronectin (Abcam England, 1:400) and collagen I(Abcam England, 1:500) also were used to measure the secretions of HBSMCs. Antibody of GAPDH (KangChen Biotech, shang-hai, China, 1:1000) was used for protein control.
Immunodetection of first antibodies was per-formed using a horseradish peroxidase-conjugated

Vers
ion fo
r revie
w
1950
HealthMED - Volume 6 / Number 6 / 2012
Journal of Society for development in new net environment in B&H
IgG (Santa Cruz Biotechnology, Santa Cruz, CA; 1:5,000-1:20,000). Signals were visualized using an enhanced chemiluminescence (ECL) detection system (Pierce, USA). Protein band intensity was quantified by scanning densitometry.
RT-PCRTotal RNA was isolated using TRIzol (Invitro-
gen, USA). RT-PCR was performed as described in the RT-PCR kit (TaKaRa, Japan). The primers of ERK1 (233 bp) gene were 5'- CCC TGG CAA GCA CTA CCT - 3' and 5'- CCT CCA CTG TGA TCC GTT- 3'. GAPDH (532 bp) served as en-dogenous control. The primers of GAPDH were 5'- AGG TCG GAG TCA ACG GAT TTG -3' and 5'- GTG ATG GCA TGG ACT GTG GT - 3'. All the PCR primers used in the present study were designed with primer spans on exons by using Prime Expresss 2.0 software (Applied Biosystem, Foster City, CA, USA) and synthesized by Takara Biology (DaLian, China). The cycling parameters were as follows: 94 oC 3 min, 94 oC 30 s, 58 oC 1 min, 72 oC 1min, for 35 cycles and followed by the final step at 72 oC for 10 minutes. The strap of amplified products was analyzed by MUVB-gel analysis system (UltralumCorporation, Clare-mont, USA). Results were determined by density ratio of purposed band to that of GAPDH.
ELISAThe cell culture supernatants were collected.
According to the procedure recommended by the manufacturer, transforming growth factor (TGF-b1) was quantified using ELISA kits (R&D Sys-tems, MN,USA). Also were vascular endothelial growth factor (VEGF) (Biosource, USA), regu-lated upon activation, normal T cell expressed and secreted (RANTES) (Biosource, USA) and Eotaxin(Biosource, USA). The values were nor-malized by the counts of cells.
Statistical analysisData were expressed as mean ± standard devi-
ation (SD) and analyzed by one-way ANOVA and q test using SPSS 19.0. P value less than 0.05 was considered statistically significant.
Results
Identification of cultured human bronchial smooth muscle cellsHuman bronchial smooth muscle cells demon-
strated the typical "peak-valley" shape when grew to confluency at 5-7 days after passage. The cells were identified by fluorescent immunocytochem-istry of α-smooth muscle actin antibody. Under fluorescent microscope, HBSMCs (passage 1 or 2) shaped spindle and was stained green >95% for alpha-actin. (Figure 1)
Figure 1. Identification of human bronchial smooth muscle cells by α-smooth muscle actin antibody (fluorescent immunocytochemistry x200)
Transfection of ERK1/2 oligonucleotide to cultured human bronchial smooth muscle cellsAfter 6 hours of incubation with FITC labeled
ODN, the cytoplasm of the cells which took up the ODN would appear green under fluorescent mi-croscope. In contrast to the image in the same field under reverse phase microscope, the positive cells was nearly 82% of the total HBSMCs. (Figure 2)
Expressions of proteins of ERK1/2 and P-ERK1/2 in HBSMCsWith western blot analysis, the protein levels of
both ERK1/2 and phospho-ERK1/2 of HBSMCs in normal serum group were significantly increa-sed than those in serum free group. Both ERK1/2 and P-ERK1/2 were markedly stronger expressed in asthmatic serum group than that of normal se-rum control (P<0.05). ERK1/2 antisense ODN dramatically inhibited the protein expressions of

Vers
ion fo
r revie
w
HealthMED - Volume 6 / Number 6 / 2012
Journal of Society for development in new net environment in B&H 1951
both ERK1/2 and P-ERK1/2 in passively sensiti-zed HBSMCs (P<0.05), while sense ODN didn’t work. (Figure 3)
Figure 2. The efficiency of the uptake of FITC-labeled ERK1/2 oligonucleotide in human smooth muscle cells. (A: fluorescent microscope x100 B: phase microscope x100)
As shown in the top-right graph of figure 3, the ratio of P-ERK1/2 to ERK1/2 which stood for the phosphorylation of ERK1/2 was little different between serum free group and normal serum gro-up. While the cells sensitized by asthmatic serum presented the higher phosphorylation of ERK1/2. ERK1/2 antisense ODN inhibited the protein phosphorylation of ERK1/2 in passively sensiti-zed HBSMCs, while sense ODN didn’t work.
Figure 3. Protein expressions of ERK1/2 and P-ERK1/2 in human bronchial smooth muscle cells by western blot analysis. (A stands for serum-free group; B for normal serum treated group; C for asthmatic serum sensitized group; D for asthma-tic serum sensitized cells transfected by antisense ERK1/2 ODN; E for asthmatic serum sensitized cells transfected by sense ERK1/2 ODN. ** significantly different from group A; * signi-ficantly different from group B; # significantly different from group C. P<0.05)
Expression of ERK1 mRNA in human bronchial smooth muscle cellsWith RT-PCR analysis, HBSMCs in normal se-
rum presented higher level of mRNA of ERK1 than those treated with serum-free medium. The asthma-tic serum also stimulated the expression of mRNA of ERK1 in HBSMCs. ERK1/2 antisense ODN dra-matically inhibited the expression of ERK1 mRNA in passively sensitized HBSMCs. (Figure 4)
ERK1/2 signaling pathway regulate the secretions of TGF-b1 and VEGF in passively sensitized HBSMCs As showed in figure 5, VEGF was hardly detec-
ted in the cultured medium of HBSMCs in serum free group. Both TGF-b1 and VEGF increased
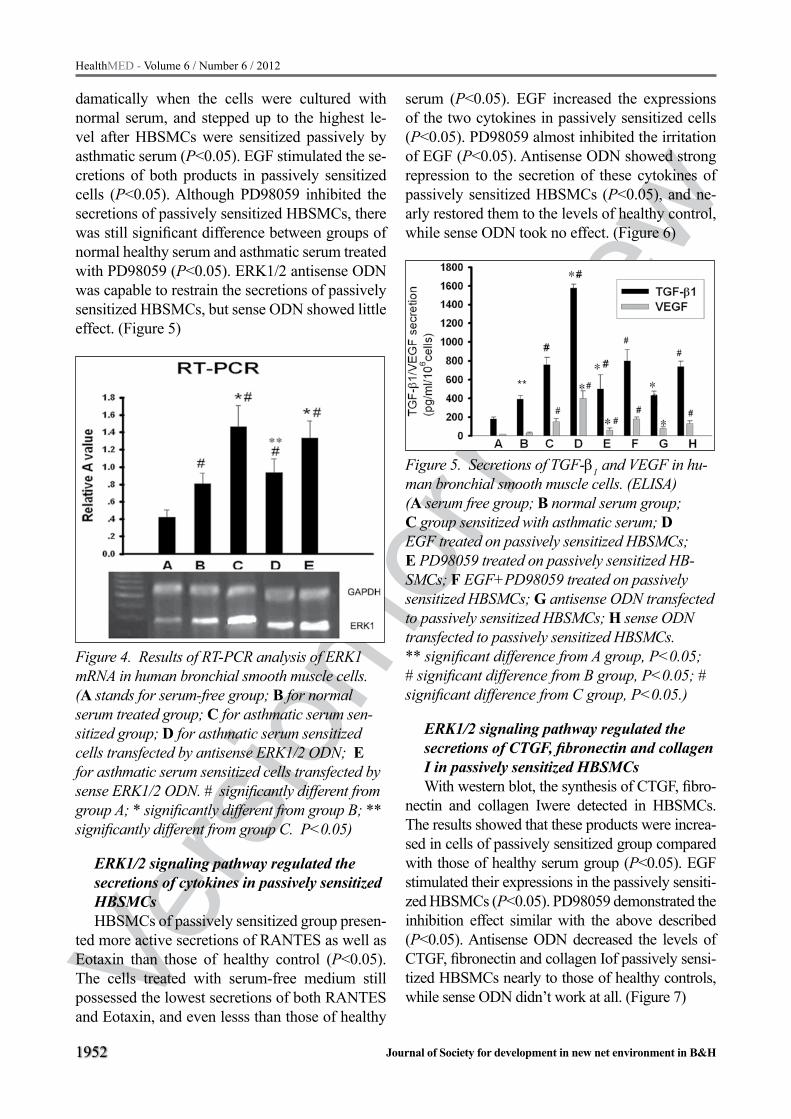
Vers
ion fo
r revie
w
1952
HealthMED - Volume 6 / Number 6 / 2012
Journal of Society for development in new net environment in B&H
damatically when the cells were cultured with normal serum, and stepped up to the highest le-vel after HBSMCs were sensitized passively by asthmatic serum (P<0.05). EGF stimulated the se-cretions of both products in passively sensitized cells (P<0.05). Although PD98059 inhibited the secretions of passively sensitized HBSMCs, there was still significant difference between groups of normal healthy serum and asthmatic serum treated with PD98059 (P<0.05). ERK1/2 antisense ODN was capable to restrain the secretions of passively sensitized HBSMCs, but sense ODN showed little effect. (Figure 5)
Figure 4. Results of RT-PCR analysis of ERK1 mRNA in human bronchial smooth muscle cells. (A stands for serum-free group; B for normal serum treated group; C for asthmatic serum sen-sitized group; D for asthmatic serum sensitized cells transfected by antisense ERK1/2 ODN; E for asthmatic serum sensitized cells transfected by sense ERK1/2 ODN. # significantly different from group A; * significantly different from group B; ** significantly different from group C. P<0.05)
ERK1/2 signaling pathway regulated the secretions of cytokines in passively sensitized HBSMCsHBSMCs of passively sensitized group presen-
ted more active secretions of RANTES as well as Eotaxin than those of healthy control (P<0.05). The cells treated with serum-free medium still possessed the lowest secretions of both RANTES and Eotaxin, and even lesss than those of healthy
serum (P<0.05). EGF increased the expressions of the two cytokines in passively sensitized cells (P<0.05). PD98059 almost inhibited the irritation of EGF (P<0.05). Antisense ODN showed strong repression to the secretion of these cytokines of passively sensitized HBSMCs (P<0.05), and ne-arly restored them to the levels of healthy control, while sense ODN took no effect. (Figure 6)
Figure 5. Secretions of TGF-b1 and VEGF in hu-man bronchial smooth muscle cells. (ELISA) (A serum free group; B normal serum group; C group sensitized with asthmatic serum; D EGF treated on passively sensitized HBSMCs; E PD98059 treated on passively sensitized HB-SMCs; F EGF+PD98059 treated on passively sensitized HBSMCs; G antisense ODN transfected to passively sensitized HBSMCs; H sense ODN transfected to passively sensitized HBSMCs. ** significant difference from A group, P<0.05; # significant difference from B group, P<0.05; # significant difference from C group, P<0.05.)
ERK1/2 signaling pathway regulated the secretions of CTGF, fibronectin and collagen I in passively sensitized HBSMCsWith western blot, the synthesis of CTGF, fibro-
nectin and collagen Iwere detected in HBSMCs. The results showed that these products were increa-sed in cells of passively sensitized group compared with those of healthy serum group (P<0.05). EGF stimulated their expressions in the passively sensiti-zed HBSMCs (P<0.05). PD98059 demonstrated the inhibition effect similar with the above described (P<0.05). Antisense ODN decreased the levels of CTGF, fibronectin and collagen Iof passively sensi-tized HBSMCs nearly to those of healthy controls, while sense ODN didn’t work at all. (Figure 7)

Vers
ion fo
r revie
w
HealthMED - Volume 6 / Number 6 / 2012
Journal of Society for development in new net environment in B&H 1953
Figure 6. Secretions of Eotaxin and RANTES in human bronchial smooth muscle cells. (ELISA) (A serum free group; B normal serum group; C group sensitized with asthmatic serum; D EGF treated on passively sensitized HBSMCs; E PD98059 treated on passively sensitized HB-SMCs; F EGF+PD98059 treated on passively sensitized HBSMCs; G antisense ERK1/2 ODN transfected to passively sensitized HBSMCs; H sense ODN transfected to passively sensitized HBSMCs. ** significant difference from A group, P<0.05; # significant difference from B group, P<0.05; * sig-nificant difference from C group, P<0.05.)
Figure 7. Secretions of Fibronectin, CTGF and Collagen I in human bronchial smooth muscle cells. (Western Blot) (A serum free group; B normal serum group; C group sensitized with asthmatic serum; D EGF tre-ated on passively sensitized HBSMCs; E PD98059 treated on passively sensitized HBSMCs; F EGF+PD98059 treated on passively sensitized
HBSMCs; G antisense ERK1/2 ODN transfected to passively sensitized HBSMCs; H sense ODN transfected to passively sensitized HBSMCs. ** significant difference from A group, P<0.05;# significant difference from B group, P<0.05;* significant difference from C group, P<0.05.)
Discussion
Asthma is characterized by the presence of incre-ased numbers of inflammatory cells in the airway in particular eosinophils and Th2 lymphocytes. In ad-dition to the presence of inflammatory cells, the ai-rways of patients with asthma exhibit varying levels of structural changes termed airway remodeling12. It has been demonstrated that the phenotypic mo-dulation of airway smooth muscle cells (ASMCs) is important to the pathogenesis of airway remodeling in chronic asthma8. Mature airway smooth muscle cells are usually characterized by a low proliferati-ve index and expression of contractile marker pro-teins such as smooth muscle alpha-actin (sm-alpha-actin), calponin, and smooth muscle myosin heavy chain (sm-MHC)10. Emerging evidence shows that airway smooth muscle cells also functions as a rich source of biologically active chemokines and cyto-kines that are capable of perpetuating airway infla-mmation in chronic asthma by promoting recrui-tment, activation, and trafficking of inflammatory cells in the airway milieu3, 13.
Both TGF-β1 and VEGF are the critical factors that mediate the airway inflammation and remo-deling14. The cytokine TGF-β has been shown to have a central role in asthma pathogenesis and in mouse models of allergic airway disease. TGF-β1 is the main TGF-β isoform produced after OVA challenge15. TGF-beta 1 in addition to an extrace-llular matrix regulator also could play a key role in bronchial angiogenesis and vascular remodeling via VEGF pathway in asthma16. Previous studies had showed that human airway smooth muscle secreted TGF-β117, while few results mentioned what happened about the change of secretion of human bronchial smooth muscle cells in asthma status. Our results confirmed that HBSMCs were stimulated to secret more TGF-β1 when passive sensitized by asthma serum than in normal se-rum. The autocrine of TGF-β1 maybe play a very important role in airway remodeling of chronic

Vers
ion fo
r revie
w
1954
HealthMED - Volume 6 / Number 6 / 2012
Journal of Society for development in new net environment in B&H
asthma. Previous study seems to stand for that ai-rway epithelium is the likely source for increased VEGF18, 19. In this study, the secretion of VEGF from HBSMCs was identified to increase in asth-ma status. It’s not known whether the increased VEGF is the downstream of increased TGF-β1 or just due to the stimulation of asthmatic serum.
RANTES as well as Eotaxin are the important chemotactic factors for eosinophil and airway in-flammation in chronic asthma20, 21. However, in sputum analysis of chronic asthma patients, prin-cipal component analysis revealed that RANTES was not the dominant variable in the chronic per-sistent obstruction subjects22. In this study, asth-matic serum induced the RANTES secretion from HBSMCs in vitro. So it is to be further identified that whether asthmatic HBSMCs secret RANTES in vivo. It is confirmed that airway smooth muscle cells in chronic asthmatic rat secrets much more Eotaxin than normal control9. Eotaxin is more than a chemokines for eosinophil. It is said that Eotaxin selectively modulates fibroblast activities by increasing their proliferation, collagen synthe-sis and migration but not their differentiation into myofibroblasts or contractility in collagen gel23. What about Eotaxin modulate the bronchial smo-oth muscle cell migration and collagen synthesis? There is much to be further studied.
It is essential for fibronectin, collagen Iand CTGF to participate the increased extracellular matrix of airway24. According to these proteins, our study demonstrated that HBSMCs passively sensitized by asthmatic serum not only were more productive than controls, but also, they reacted more intense to the stimulator EGF. The results suggested that HBSMCs in asthma status possesed strong ability to secret multiple cytokines, growth factors and components of matrix. Fibronectin is essential for the development of OVA-induced ai-rway fibrosis and airway hyperresponsiveness25. Connective tissue growth factor induces extrace-llular matrix in asthmatic airway smooth muscle26. Extracellular matrix also affects the growth of ai-rway epithelial cells and fibroblasts in vitro and may influence epithelial thickness27. We propose the hypothesis that ECM and HBSMCs maybe establish a mutual vicious circle into the airway remodeling of chronic asthma.
MAPKs are critical for immune cell metabo-
lism, migration, production of pro-inflammatory mediators, survival and differentiation. ERK1/2 signal plays an important role in the pathogenesis of asthma4. The role of ERK is few reported in the secretion of asthmatic HBSMCs. In this study, the results demonstrated that stimulation of ERK1/2 signaling pathway induced the higher secretion level of asthmatic HBSMCs and the inhibition of the pathway suppressed the process. This may su-ggest that ERK1/2 signaling pathway play an im-portant role in secretion function of HBSMCs in asthma status. We also noted that there was a dif-ference between the effect of PD98059 and that of antisense ODN in inhibition of the mRNA level of ERK1/2. The possible explain is that PD98059 is the inhibitor of ERK kinase (MEK), only capable of inhibiting the phosphorylation of ERK1/2, but not the transcription of ERK1/2.
In conclusion, this study demonstrates that ERK1/2 signalling pathway play an important role in regulation of the increased secretion of HBSM-Cs passively sensitized by asthmatic serum, and suggests that ERK1/2 antisense ODN is strong to inhibit the process.
Acknowledgement
This study was supported by a grant from Na-tional Natural Science Foundation of China (No. 30900648).
References
1. Grainge CL, Lau LC, Ward JA, Dulay V, Lahiff G, Wilson S, Holgate S, Davies DE, Howarth PH: Effect of bronchoconstriction on airway remodeling in asth-ma, N Engl J Med 2011, 364:2006-2015
2. Vignola AM, Mirabella F, Costanzo G, Di Giorgi R, Gjomarkaj M, Bellia V, Bonsignore G: Airway remo-deling in asthma, Chest 2003, 123:417S-422S
3. Howarth PH, Knox AJ, Amrani Y, Tliba O, Panetti-eri RA, Jr., Johnson M: Synthetic responses in ai-rway smooth muscle, J Allergy Clin Immunol 2004, 114:S32-50
4. Alam R, Gorska MM: Mitogen-activated protein kina-se signalling and ERK1/2 bistability in asthma, Clin Exp Allergy 2011, 41:149-159
5. Isenovic ER, Soskic S, Trpkovic A, Dobutovic B, Po-povic M, Gluvic Z, Putnikovic B, Marche P: Insu-lin, thrombine, ERK1/2 kinase and vascular smooth muscle cells proliferation, Curr Pharm Des 2010, 16:3895-3902

Vers
ion fo
r revie
w
HealthMED - Volume 6 / Number 6 / 2012
Journal of Society for development in new net environment in B&H 1955
6. Liu W, Liang Q, Balzar S, Wenzel S, Gorska M, Alam R: Cell-specific activation profile of extracellular signal-regulated kinase 1/2, Jun N-terminal kinase, and p38 mitogen-activated protein kinases in asthmatic airways, J Allergy Clin Immunol 2008, 121:893-902 e892
7. Kuo PL, Huang MS, Huang SK, Ni WC, Hung JY, Ko YC, Hung CH, Tsai YM, Duh TH, Hsu YL: Signalling pathway of isophorone diisocyanate-responsive inter-leukin-8 in airway smooth muscle cells, Eur Respir J 2011, 37:1226-1236
8. Xie M, Liu XS, Xu YJ, Zhang ZX, Bai J, Ni W, Chen SX: ERK1/2 signaling pathway modulates the airway smooth muscle cell phenotype in the rat model of chronic asthma, Respiration 2007, 74:680-690
9. Xie M, Liu XS, Xu YJ, Zhang ZX, Bai J, Ni W, Chen SX: Role of the extracellular signal-regulated kinase 1/2 signaling pathway in regulating the secretion of bronchial smooth muscle cells in a rat model of chro-nic asthma, Chin Med J (Engl) 2008, 121:73-77
10. Hirst SJ, Twort CH, Lee TH: Differential effects of extracellular matrix proteins on human airway smo-oth muscle cell proliferation and phenotype, Am J Respir Cell Mol Biol 2000, 23:335-344
11. Liu XS, Xu YJ, Zhang ZX, Ni W: [Effects of pota-ssium channel blockers on the proliferation of rat bronchial smooth muscle cells], Yao Xue Xue Bao 2003, 38:333-336
12. Aceves SS, Broide DH: Airway fibrosis and angioge-nesis due to eosinophil trafficking in chronic asthma, Curr Mol Med 2008, 8:350-358
13. Liu XS, Xu YJ: Potassium channels in airway smo-oth muscle and airway hyperreactivity in asthma, Chin Med J (Engl) 2005, 118:574-580
14. Coutts A, Chen G, Stephens N, Hirst S, Douglas D, Eichholtz T, Khalil N: Release of biologically active TGF-beta from airway smooth muscle cells induces autocrine synthesis of collagen, Am J Physiol Lung Cell Mol Physiol 2001, 280:L999-1008
15. Alcorn JF, Rinaldi LM, Jaffe EF, van Loon M, Bates JH, Janssen-Heininger YM, Irvin CG: Transforming growth factor-beta1 suppresses airway hyperres-ponsiveness in allergic airway disease, Am J Respir Crit Care Med 2007, 176:974-982
16. Willems-Widyastuti A, Alagappan VK, Arulmani U, Vanaudenaerde BM, de Boer WI, Mooi WJ, Verleden GM, Sharma HS: Transforming growth factor-beta 1 induces angiogenesis in vitro via VEGF production in human airway smooth muscle cells, Indian J Bio-chem Biophys 2011, 48:262-269
17. Lee KY, Ho SC, Lin HC, Lin SM, Liu CY, Huang CD, Wang CH, Chung KF, Kuo HP: Neutrophil-derived elastase induces TGF-beta1 secretion in human ai-rway smooth muscle via NF-kappaB pathway, Am J Respir Cell Mol Biol 2006, 35:407-414
18. Avdalovic MV, Putney LF, Schelegle ES, Miller L, Usachenko JL, Tyler NK, Plopper CG, Gershwin LJ, Hyde DM: Vascular remodeling is airway genera-tion-specific in a primate model of chronic asthma, Am J Respir Crit Care Med 2006, 174:1069-1076
19. Hoshino M, Takahashi M, Aoike N: Expression of vascular endothelial growth factor, basic fibroblast growth factor, and angiogenin immunoreactivity in asthmatic airways and its relationship to angiogene-sis, J Allergy Clin Immunol 2001, 107:295-301
20. Pepe C, Foley S, Shannon J, Lemiere C, Olivenstein R, Ernst P, Ludwig MS, Martin JG, Hamid Q: Diffe-rences in airway remodeling between subjects with severe and moderate asthma, J Allergy Clin Immu-nol 2005, 116:544-549
21. Asosingh K, Hanson JD, Cheng G, Aronica MA, Erzurum SC: Allergen-induced, eotaxin-rich, proan-giogenic bone marrow progenitors: a blood-borne cellular envoy for lung eosinophilia, J Allergy Clin Immunol 2010, 125:918-925
22. Kaminska M, Foley S, Maghni K, Storness-Bliss C, Coxson H, Ghezzo H, Lemiere C, Olivenstein R, Ernst P, Hamid Q, Martin J: Airway remodeling in subjects with severe asthma with or without chronic persistent airflow obstruction, J Allergy Clin Immu-nol 2009, 124:45-51 e41-44
23. Puxeddu I, Bader R, Piliponsky AM, Reich R, Levi-Schaffer F, Berkman N: The CC chemokine eotaxin/CCL11 has a selective profibrogenic effect on hu-man lung fibroblasts, J Allergy Clin Immunol 2006, 117:103-110
24. Zhu Z, Lee CG, Zheng T, Chupp G, Wang J, Homer RJ, Noble PW, Hamid Q, Elias JA: Airway inflam-mation and remodeling in asthma. Lessons from in-terleukin 11 and interleukin 13 transgenic mice, Am J Respir Crit Care Med 2001, 164:S67-70
25. Kohan M, Muro AF, Bader R, Berkman N: The extra domain A of fibronectin is essential for allergen-indu-ced airway fibrosis and hyperresponsiveness in mice, J Allergy Clin Immunol 2011, 127:439-446 e431-435
26. Johnson PR, Burgess JK, Ge Q, Poniris M, Bousta-ny S, Twigg SM, Black JL: Connective tissue growth factor induces extracellular matrix in asthmatic ai-rway smooth muscle, Am J Respir Crit Care Med 2006, 173:32-41
27. Royce SG, Tan L, Koek AA, Tang ML: Effect of extra-cellular matrix composition on airway epithelial cell and fibroblast structure: implications for airway re-modeling in asthma, Ann Allergy Asthma Immunol 2009, 102:238-246
Corresponding Author Xian-Sheng LIU, Department of Respiratory Disease, Tongji Hospital Affiliated to Tongji Medical College,
Huazhong University of Science and Technology, Wuhan, P.R.China, E-mail: [email protected]

Vers
ion fo
r revie
w
1956
HealthMED - Volume 6 / Number 6 / 2012
Journal of Society for development in new net environment in B&H
Abstract
Introduction: In line with the view that accepts the patient and the family as a whole; good care of the families shall be taken throughout the recovery period. Meeting the needs of the family members besides the needs of the pediatric patient will im-prove the quality of the care in the nursing services.
Objective: The study is conducted with the ob-jective of determining the needs of the families that have patients in the pediatric intensive care unit.
Material - Method: The universe of this cross-sectional study was composed of the families of patients that were in the Pediatric Intensive Care Unit of Samsun Ondokuz Mayıs University Re-search and Application Hospital on July 01, 2009-November 01, 2009. 200 patient relatives, who will represent 80% of the number of pa-tients that stayed in hospital for the period of three months, were taken into the scope of the study. In data collection, family member description form and Scale for Determining Family Members’ Needs were used. In the evaluation of the data, the data were analyzed in SPSS 10.0 package program and t test and variance analysis were conducted with descriptive statistics.
Result: When the first 3 important needs that the families who have patients in the intense care unit perceive and score averages were analyzed, being sure that the best care is given to their pa-tients (3.99) takes the first place, receiving honest answers to their questions (3.96) takes the second place and receiving information about the state of the patient at least once a day (3.95) takes the third place. Insufficient notification of family members highlights the points about information need and
these needs indicate the anxiety of patients. It was seen that gender, age, degree of relationship and the time spent in the intensive care unit don’t af-fect the need score average of the family mem-bers. Moreover, it was determined that the need score averages of the family members are signifi-cantly different according to the educational back-grounds and intensive care units (p<0.05).
Conclusion: It was determined that seven out of the ten needs perceived as important by fam-ily members are information related needs and the remaining three are trust related needs. Intensive care nurses shall know the needs of the families and shall be able to meet them according to the or-der of priority. Such an approach will support both the patient and family in dealing with the disease.
Key words: Needs of the family, intensive care, family, Pediatric Intensive Care Unit
Introduction
Intensive care units are critical care units that aim to save lives and to discharge the patients by supporting the patients and families physically, mentally and socially (1). These units differentiate from other treatment units both in respect of in-struments-equipments and the states of the patients being treated here. Moreover, the health professi-onals working here are facing more complication patient issues compared to other treatment units (2). Intensive care concept has a scary meaning both for the patients and patients' families (3).
Even though pediatric intensive care unit plays an important role in the treatment of children with critical diseases, it is also one of the medical en-vironments that create crisis and traumatic stress
Determining The Needs Of The Families That Have a Patient İn The Pediatric Intensive Care Unit And Analyzing Characteristics Of These FamiliesBirsen Altay1, Demet Gonener2, Nurse Seher Zengin3, Bilge Bal Ozkaptan1 School of Health, On Dokuz Mayıs University, Samsun, Turkey,2 School of Health, Sinop University, Sinop, Turkey,3 Samsun Ondokuz Mayis University Medical Faculty Hospital, Turkey.

Vers
ion fo
r revie
w
HealthMED - Volume 6 / Number 6 / 2012
Journal of Society for development in new net environment in B&H 1957
risk both in children and their parents (4). Although staying in the intensive care unit is a stress sour-ce both for the patient and the family, the patients experience deep anxieties about the state of health of their patients and the applied treatment (5, 6).
Being in the intensive care unit also causes families to start feeling anxiety as much as the patients (7). Especially in the pediatric intensive care units, there are various factors that may cause anxiety both in the patients and their families. The fact that the children cannot take care of them-selves and need their parents and especially their mother for almost everything is among the main reasons of this anxiety (8-11).
Prioritizing life threatening situation in the intensive care units where critical care service is provided may cause the needs of the patients' fa-milies to be neglected or overlooked (12). Staying in the hospital or hospitalization is an important situation that has important impacts on the lives of the patient's family, not just the patient.
Hospital is a threat against the family integri-ty (8). Being in the hospital or intensive care unit has negative effects on the parents as much as the child, and causes theme to feel intensive stress and anxiety (11, 13 and 14). For their children to stay in the intensive care unit is a tough situation for the parents to handle.
Worrying that their children can die or become permanently disabled, questioning the performed procedures and applied treatments, feeling forei-gn to the hospital environment, seeing scary equi-pments that they don't know their purpose, feeling secondary in the care of their own children com-pared to the health professionals, feeling guilty because of the disease of their children, worrying about the other family members at home and fi-nancial concerns are some of the main problems that the families of the children staying in the in-tensive care unit mostly face (8, 9).
If they don't have solid information about the state of their child, the anxiety level may be much higher. In case of extreme anxiety, the perceptions of the parents may be damaged and there may be changes in the parenthood roles. Parents with high anxiety levels may have hard time participating to the care of their children and cooperating with the health team. And as a result of this, the develo-pment of the parent – children relationship that is
supposed to be developed in the early ages may be delayed (8-11).
Most of the time the problems, concerns and needs of the relatives of the patients staying in the intensive care unit are disregarded (15). Issues such as the change in the parenthood role of the parent whose child is staying in the pediatric in-tensive care unit because of being separated from their child, the uncertainty about the child's future, the fear caused by now knowing how to take of the child at home, the lack of a waiting area in the intensive care unit and the lack of communication between the health care team and family members cause the stress experienced by the family mem-bers to increase even more (14).
In the study conducted by Ünver et al. (2003) to determine the needs of the families of the pa-tients staying in the intensive care unit, the most important needs of the families were determined respectively as being sure that the best care is gi-ven to the patient and receiving honest answers to their questions (3).
Determining and meeting the needs of the fa-mily members or relatives of the patients staying in the intensive care unit positively affect the reco-very period of these patients (6, 12 and 16). Thus it is required to determine and meet the needs of the families besides offering the life saving, high quality care and treatment service to the patient in the intensive care unit. Meeting the needs of the families is especially important in the pediatric in-tensive care units.
Basically the parents who have their children in the intensive care unit need true and reliable infor-mation, a person that will explain their children’s state to them, and emotional, mental and physi-cal support from someone else other than the personnel. Moreover creating the trust that their children are receiving the best possible care and giving them the chance to actively parenting the-ir children are important in respect of the support provided to the family (14).
In supporting other family members in case one of the family members is accepted to stay in the hospital, the nurses are in a key position (8). In line with the view that accepts the patient and the family as a whole; good care of the families shall be taken throughout the recovery period of the patient (3).

Vers
ion fo
r revie
w
1958
HealthMED - Volume 6 / Number 6 / 2012
Journal of Society for development in new net environment in B&H
For family members to be sure that their de-stroyed family balance is safe, they need acceptan-ce, understanding, support and information from the hospital personnel. Intensive care nurses shall know that the families have some needs and shall be able to meet them according to the order of pri-ority (3, 17).
The experience of staying in the pediatric in-tensive care unit that may negatively affect the re-lationship between the family and the child is a si-tuation that needs evaluation also in respect of the family as much as the patient. In Turkey there is no sufficient number of studies about determining the needs of the families of the children staying in the pediatric intensive care unit.
Determining the needs of the families of the children staying in these units and meeting the needs of these families besides the patients' will help patients' relatives to trust the health team and the provided service by increasing the quality of the offered care and ensure the continuity of the relationship between the family and the child. Mo-reover, there will be a data resource about this su-bject in Turkey.
Objective
The goal of this study is to determine the needs of the families of the children staying in the pedia-tric intensive care unit and characteristics of these families.
Material & method
The universe of this cross- sectional study was composed of the families of patients that were in the Pediatric Intensive Care Unit of Samsun On-dokuz Mayıs University Research and Application Hospital on July 01, 2009 – November 01, 2009. 200 patient relatives, who will represent 80% of the number of patients that stayed in hospital for the period of three months, were taken into the scope of the study.
In the collection of the data, “Information Co-llecting Form” composed of 26 questions prepared by the researchers based on the literature to deter-mine the socio-demographic characteristics of the parents that participated to the study, and "Critical Care Family Needs Inventory" were used.
The questionnaire was filled by a researcher and two pollsters by interviewing patients’ famili-es in the hospital. Before the questionnaires were applied, the objective and subject of the research were told to the patients’ relatives that were taken into the scope of the study.
For the study to be conducted in the Univer-sity hospital, a written permit of the hospital ad-ministration was taken before initiating the study. The data was collected between the 48th hour and 10th day following the babies to be accepted to the newborn intensive care unit. Within this period the mothers/fathers/relatives of the children staying in the hospital were informed adequately about the study and their oral consents about accepting to participate to the study were taken.
“Critical Care Family Needs Inventory” used to determine the needs of the family members was prepared by Molter in 1979. The inventory is com-posed of 46 items. Each article in the item is in four-choice Likert scaling type. A ranking from 1 to 4 was requested for each article.
According to this (1) means ‘not important’, (2) means ‘moderately important’, (3) means ‘im-portant’ and (4) means ‘very important’. The in-ventory was translated by two academic member nurses. The inventory was applied to other 50 pati-ent relatives before the study, and the Alpha value for the entire inventory was found as 0.82 in the conducted Cronbach Alpha analyses.
In the evaluation of the data, the descriptive information about the participants was given as fi-gures and percentages. In the scale of determining the needs of the family members, the score were added by giving 1 to ‘not important’, 2 to ‘mode-rately important’, 3 to ‘important’ and 4 to ‘very important’ and the arithmetic means are obtained by dividing these totals to the number of samples.
Each item was ordered by score averages. All the statistical analyses of the study were conduc-ted using the SPSS package program in the com-puter. In the evaluation of the data, the data were analyzed in SPSS 10.0 package program and t test and Variance analysis and Duncan test were con-ducted with descriptive statistics.

Vers
ion fo
r revie
w
HealthMED - Volume 6 / Number 6 / 2012
Journal of Society for development in new net environment in B&H 1959
Results
The age average of the subjects that participated to the study was 32.98±8.41 (Minimum 15, Maxi-mum 60). Table 1 shows the socio-demographic characteristics of the family members. According to Table 1, 44% of the participants were female and 56% were male. 39% of the participants were in the age group of 23-30, 63% of them were pri-mary school graduates, 19% were high school gra-duates and %19 were university graduates. 48% of the family members were living in the city and 83% have social security. Table 1. Socio-Demographic Characteristics of the Family Members
Socio-DemographicCharacteristic Number %
GenderFemale 88 44.0Male 112 56.0Age19-24 33 16.525-30 59 29.531-36 46 23.037-42 39 19.543 ≥ 23 11.5Educational BackgroundLiterate 4 2.0Primary School 126 63.0Secondary School 20 10.0High School 38 19.0University 12 19.0Place of ResidenceCity 96 48.0County 50 25.0Village 54 27.0Social SecurityYes 166 83.0No 34 17.0
67% of the family members that participated to the study were mothers of the child, 26% were the fathers and 7% were the brothers, sisters and gran-dfathers. 74.5% of the patients were in the intensive care unit for 1-10 days, 17.5% were there for 11-20 days, 8.0% were there for 21-30 days or more.
It was determined that 78% of the children were staying in the intensive care unit for the first time and 46% of the families that have their children in the intensive care unit were informed about the intensive care unit (Table 2).
Table 2. Distribution of Some Properties about Family Members and Intensive Care
Properties Number %Degree of RelationshipMother 134 67.0Father 52 26.0Other (Sister, brother, grandfather) 14 7.0Length of Stay in the Intensive Care Unit1-10 days 149 74.511-20 days 35 17.521-30 days or more 16 8.0History of Hospital Stay First stay 156 78.0Second stay or longer history 44 22.0Information about the intensive care unit and the patient Informed 94 47.0Not informed 106 53.0Total 200 100.0
Table 3 shows the average scores of the first ten needs that the family members that participated to the study stated as important. It was found that se-ven out of ten of these needs that the family mem-bers perceive as important were about information. Table 3. The Score Averages of First 10 Needs Defined as Very Important by Family Members
Most Important Needs X±Sd1. Being sure that the patient receives the best care 3.99±9.97
2. Receiving honest answers to our questions 3.96±0.19
3. Receiving information about the state of the patient at least once a day 3.95±0.21
4. Feeling that there is hope 3.94±0.275. Knowing exactly what procedure is applied to the patient 3.92±0.30
6. Feeling that the hospital personnel are caring about the patient 3.91±0.32
7. Knowing how the patient will be treated medically 3.90±0.33
8. Notifying us about the patient transfer beforehand 3.88±0.32
9. Knowing the reasons behind the procedures, treatments, actions 3.86±0.34
10. Knowing the things that indicate improvement in the patient’s condition 3.86±0.37

Vers
ion fo
r revie
w
1960
HealthMED - Volume 6 / Number 6 / 2012
Journal of Society for development in new net environment in B&H
The information needs that family members state as important were respectively “Receiving honest answers to the question (3.96)”, “Rece-iving information about the state of the patient at least once a day (3.95)”, “Knowing exactly what procedure is applied to the patient (3.92)", "Knowing how the patient will be treated medi-cally (3.90)", “Notifying us about the patient tran-sfer beforehand (3.88)”, "Knowing the reasons behind the procedures, treatments, actions (3.86)" and "Knowing the things that indicate improve-ment in the patient's condition (3.86)".
And three of the ten needs that family mem-bers perceive as important were determined to be related with trust. These are “Being sure that the patient receives the best care (3.99)”, “Receiving honest answers to our questions (3.96)” and “Fee-ling that the hospital personnel are caring about the patient (3.91)”.
The first three needs that the family members perceive as the least important were determined as “Being able to bring a clergyman with me (2.06)”, “Having someone encouraging me to cry (2.47)" and "Finding a place that I can be alone in the hos-pital (2.61)". The first ten needs that family mem-bers perceive as least important were the ones re-lated to support or comfort (Table 4).
Table 4. 10 Needs that Family Members Perce-ive as Least Important
Least Important Needs X±Sd1. Being able to bring a clergyman with me 2.06±1.022. Having someone encouraging me to cry 2.47±1.193. Finding a place that I can be alone in the hospital 2.61±1.07
4. Having someone that I can discuss my financial issues 2.62±1.09
5. Finding the foods I want in the hospital 2.72±1.036. Receiving information about the religious services in the hospital 2.73±1.15
7. Receiving information about people who may provide help about family issues in the hospital
2.74±0.97
8. Being able to stay alone when requested 2.82±1.009. Being able to have someone else visiting the patient together with me 2.85±0.92
10. Sharing my feelings with someone 2.94±1.00
The comparison of the score averages based on the socio-demographic characteristics of the fami-
ly members is given in Table 5. The relationship between the need scores and genders of the family members were not found statistically significant (p>0.05).
The relationship between the need score averages and ages of the family members were not found statistically significant (p>0.05). And when the family need score averages were anal-yzed based on educational background, it was seen that as the education level increases the need score average decreases, however this rela-tionship between educational background and fa-mily members' need score averages were not fo-und statistically significant (p>0.05). And when the need score averages were analyzed in terms of their place of residence, it was seen that the need score increases as you go from urban areas toward rural areas (159.7±13.73). This difference between the need score averages based on the fa-milies’ places of residence was found statistically significant (p<0.05) (Table 5).
And when the need score average were exa-mined in terms of families’ degree of relationship with the patient, the need score averages of fathers were found higher than the ones of mothers and other relatives (159.30±10.95).
The needs of the fathers of the children in the intensive care unit are more than the ones of ot-her relatives and this difference in the need score based on degree of relationship was found statisti-cally significant (p<0.05).
Moreover as the time the patient spends in the intensive care unit increases, the need scores of the family members increase, too. This differen-ce between the need score averages of the family members based on the period the patient spends in the intensive care unit was found statistically significant (p<0.05) (Table 6).
The difference between need score averages of the family members according to the information level about the intensive care unit was not found statistically significant (p>0.05). The need score average of the parents whose children stay in the intensive care unit for the first time (157.07±13.96) was found to be higher than the one of the parents whose children stayed in this unit before. The dif-ference between need scores based on the experi-ence in intensive care unit was also found statisti-cally significant (p<0.05) (Table 6).

Vers
ion fo
r revie
w
HealthMED - Volume 6 / Number 6 / 2012
Journal of Society for development in new net environment in B&H 1961
Discussion
It was determined that most of the family mem-bers that participated to the study was mothers (67%). The literature's statement about mothers
being the first one among the family members that provide support to the children in the intensive care unit because of reasons such as the psycho-logical bond between the child and the mother, child’s dependence on the mother for a lot o thin-
Table 5. Comparison of the Need Score Averages Based on Socio-Demographic Characteristics of the Family Members
Properties n Average ± Standard Deviation StatisticsGenderFemale 88 155.65±15.85 *t=0.018
p=0.985Male 112 155.69±12.78Age19-24 33 157.78±11.77
*F=1.838P=0.123
25-30 59 157.35±12.4031-36 46 153.30±14.0937-42 39 151.92±16.3643 ≥ 23 159.47±16.65Educational BackgroundLiterate 4 161.00 ± 3.46
**F=1942P=0.105
Primary School 126 156.90 ± 15.39Secondary School 20 154.10 ± 16.42High School 38 155.00 ± 8.17University 12 145.83 ± 10.62Place of ResidenceCity 96 151.97±15.12
*F=6.759P=0.001County 50 158.44±10.81
Village 54 159.7±13.73Total 200 155.68±14.18
* T= T test **F=One -Way ANOVA
Table 6. Comparison of Need Score Averages Based on Properties of Family Members and Intensive CareIntensive Care Properties n X±SD Statistics
Degree of RelationshipMother 124 154.25±14.72 *F=3.124
P=0.046Father 62 159.30±10.95Other (Sister, brother, grandfather) 14 152.28±19.18Length of Stay in the Intensive Care Unit1-10 days 132 155.92±14.49
*F=3.235P=0.04110-20 days 47 152.34±12.39
21 days or more 21 161.61±14.43Status InformationInformed 94 155.36±15.99 *F=0.089
P=0.766Not informed 106 155.96±12.42History of Intensive Care Unit StayFirst stay 156 157.07±13.96 *F=2.663
P=0.008Second stay or longer history 44 150.72±13.99Total 200 155.68±14.1818
*F= One -Way ANOVA

Vers
ion fo
r revie
w
1962
HealthMED - Volume 6 / Number 6 / 2012
Journal of Society for development in new net environment in B&H
gs, mother's primary role in the child care is in fact in line with this result of the study (18).
It was determined that most of the children of these families (74.5%) were staying in the intensi-ve care unit for 1-10 days, and again this is the first time in intensive care unit for most of them (78%) and only 46% of the families were informed about the intensive care unit and their patients' state.
In a study (2009) that examines the 78 different studies conducted between the years of 1990-2008 about the needs of the families of the children staying in the neonatal intensive care units in di-fferent countries, it was determined that the most important need of the families were information and communication needs (19).
In the study conducted by Roden (2005), it was determined that family members cannot allocate enough time for their own needs and have com-munication problems with the healthcare personnel throughout the period they stay with their children in the hospital (20). And in another study conducted by Bond et al. (2003) on the families of intensive care patients suffering from traumatic brain injury, the information need, the need to receive information continuously and regularly, and the need to be infor-med in the care of the child took the first place (21).
In the study conducted by Ünver on families of the intensive care unit patients (2003) in Turkey, it was determined that the seven of the ten needs fa-milies perceive as most important are information needs. In the same study, the score average of the statements such as "receiving information at least once a day, providing the information in a language I can understand, notifying about the developments in the patient's status by calling home" are in the upper ranks (3).
In the study conducted by Çalışır et al. (2008) abo-ut the needs and anxiety levels of the parents of the babies in the newborn intensive care unit , it was de-termined that receiving information about the chan-ges the state of health, diagnosis and treatment of the baby is the most important need. In the same study, it was determined that the family members mostly need to receive information about the changes and developments in the state of their children (10).
The results of the study are in line with the re-sults of the studies conducted in Turkey and other countries about this subject. In our study, the infor-mation needs that family members state as impor-
tant were respectively “Receiving honest answers to our questions (3.96)”, “Receiving information abo-ut the state of the patient at least once a day (3.95)”, “Knowing exactly what procedure is applied to the patient (3.92)", "Knowing how the patient will be treated medically (3.90)", “Notifying us about the patient transfer beforehand (3.88)”, "Knowing the reasons behind the procedures, treatments, actions (3.86)" and "Knowing the things that indicate im-provement in the patient's condition (3.86)".
Family members to be informed insufficiently are among the reasons why the items about infor-mation need stand out. In the literature informati-on need takes its place as the basic need defined by the patient relatives and it wad stated that the nur-ses have important roles in meeting this need (16).
The information related items to be at the fo-refront and most of the family members to be not informed in our study are in line with this informa-tion in the literature.
In a study conducted with 37 family members and 45 nurses in China, there were needs about the environmental planning among the priorities related with the needs of the families of the patients staying in the intensive unit besides information and trust (22). In the study conducted by Ünver on families of the intensive care unit patients (2003) in Turkey, it was determined that the two of the ten needs fami-lies perceive as most important are related to trust.
These were stated by family members as "be-ing sure that the patient receives the best care" and "receiving honest answers to our questions" (3). And in our research, three of the ten needs that family members perceive as important were de-termined to be related with trust. And these were “Being sure that the patient receives the best care (3.99)”, “Receiving honest answers to our que-stions (an item that is also related with informa-tion need) (3.96)” and “Feeling that there is hope (3.94)” and “Feeling that the hospital personnel are caring about the patient (3.91)”.
These needs indicate the fear, insecurity and anxiety that the families experience. The findings in the other conducted studies also support the fin-dings in our study.
Among the participants of the study, “the need to see the patient frequently” was in the twenty se-cond place with the arithmetic mean of 3.59. The same need to be in the twenty third place in the

Vers
ion fo
r revie
w
HealthMED - Volume 6 / Number 6 / 2012
Journal of Society for development in new net environment in B&H 1963
study of Ünver (2003) with the arithmetic average of 3.20 (3) supports the result of the study.
This result indicates that this need is not per-ceived as very important by the family members. The limited visitation periods in the intensive care unit have positive effects both on the patient and the patient relatives (24). Our study showed that the need to visit the patient frequently has less im-portance compared to the high importance rates of the need of knowing that the patient is good, the need of being sure that the patient receives good care, the need of trust and information.
This shows the importance of healthcare profe-ssional working in the intensive care unit to inform the family members adequately and ensure trust.
While the item of “feeling that there is hope” is in the eleventh place with the average score of 3.46 in the study of Ünver (2003) (3), it is in the first pla-ce among the most important ten needs in Molter’s study (23) and in the fourth place in our study.
This difference may reflect the hopelessness feeling of the family relatives. However insuffici-ently informing the family members may take the items about information need to the top ranks and cause "feeling that there is hope" item to the low ranks. Moreover it may be thought that the con-cept of hope is a concept related with the previous state of health of the patient, the severity of the di-sease or its progress, and it may be related with the attitude and behavior of the healthcare personnel.
In the study, among the first ten needs that the relatives of the patients in the pediatric intensive care unit perceive as very important, "Being sure that the patient receives the best care" is in the first place and "Receiving honest answers to our que-stions" is in the second place.
The fact that “being sure that the patient rece-ives the best care” is in the first place in the study of Uzun et al. (2002) (12) and in the third place in the study of Sucu et al. (2009) on relatives of the patient in the emergency service, support this study result. And Molter’s study (23) to determi-ne that families are worried about whether their patients receive a deliberate medical care or not causes to think that family relatives are insecure about the care given to the patient.
This result can be comprehended as the insu-fficient communication and information transfer between patient relatives and healthcare personnel.
The need of “receiving honest answers to our questions" is in the first place in the study conduc-ted by Özgürsoy et al. (2008) on the relatives of the intensive care unit patients (26), in the second place in the study conducted by Lee et al. (2003) on the relatives of the intensive care unit patients (27), in the third place in the study of Tekinsoy (2005) on the accompanists of the intensive care patients (28) and in the fourth place in the study of Al-Hassan et al. (2004) about the perceived needs of the critical patients' families (29).
The fact that the needs involving the communi-cation are stated as the most important ones in the studies conducted in the intensive care unit may cause to think that the families need to be sure that they receive honest answers to their question be-cause of the fear, sadness and anxiety they expe-rience for their patients in the intensive care unit.
Patients’ families to receive answers to their qu-estions may reduce their fears, stress and anxiety, and finding answer to their questions may cause them to feel safe besides feeling that their patients are at safe hands (16, 30 and 31).
According to the findings of the study, the ten needs that family members perceive as least im-portant were the ones related to support or com-fort. The fact that the family members to state sup-port or comfort related needs as the least important ten needs in the study of Ünver (2003) support the findings of the study.
The obtained study findings are evaluated as while the family members try to reduce their stress and eliminate uncertainty in tough situation about their children, they don't care much about the issu-es about themselves.
In the studies of Özgürsoy et al. (2008) (26) that are in line with the study results of Mendonca et al. (1998) (32) and Freichels (1991), a statistically si-gnificant correlations couldn’t be found between the need score averages of family members and the time spent in the intensive care unit (p>0.05). In the obtai-ned study findings, a statistically significant differen-ce was found when the need score averages of the family members were compared with the period that the patient stays in the intensive care unit (p<0.05). According to the findings, as the length of intensive care stay increases the need score increases, too.
Families perceived need such as being sure that the patient receives the best care (3.99), receiving

Vers
ion fo
r revie
w
1964
HealthMED - Volume 6 / Number 6 / 2012
Journal of Society for development in new net environment in B&H
honest answers to our questions (3.96), and recei-ving information about the sate of the patient at least once a day (3.95) about the as most important in pe-riods of 1-10 days, 11-20 days and 21 or more days.
It was found that families attaches great im-portance to their needs of information and trust, and neglect their needs about support and com-fort in all these three periods. Since staying in the hospital for a longer period and family to be not informed in this period and communication issues will cause the concerns about the health state of the patient to increase incrementally, it may cau-se a significant difference among the need score averages of the family members according to the length of stay in the intensive care unit.
Based on the findings obtained from the study, the difference between the need score averages of the family members according to their degree of relationship was found to be statistically signifi-cant (p<0.05).
The needs of the fathers of the children staying in the intensive care unit are more than the needs of the other relatives. The reason behind the fact that the need score averages of fathers are higher than the mothers' may be the hard time the mot-hers have in defining their needs because of their high degrees of stress and anxiety, or father to feel greater anxiety about protecting his family becau-se of his socially assigned role.
In the study of Özgürsoy et al. (2008), it was seen that age, gender, educational background don't affect the need score averages of the family members (26). And in the study, similarly no diffe-rence was found between the need score averages of the family members based on age, gender or educational background (p>0.05).
This indicates that the needs don't change accor-ding to the age, educational background and gen-der. However based on the findings obtained from the study, the difference between the need score averages of the family members according to their places of residence was found to be statistically si-gnificant (p<0.05). As they get closer to the rural re-gions, the need scores of the parents increase. This indicates the fact that the parents coming from rural areas need to receive more information.
Conclusion
The family members, who have children staying in the intensive care unit, experience stress and anxi-ety as much as the patients, and need support and care. The needs of the family members to be neglec-ted increases this stress and anxiety even more.
It was determined that seven out of the ten needs perceived as important by family members are in-formation related needs and the remaining three are trust related needs. Intensive care nurses shall know the needs of the families and shall be able to meet them according to the order of priority.
The nurse should always see the child and the family as a whole. Such an approach will encou-rage both the patient and family to deal with this health problem.
References
1. Engström A, Söderberg S. The experiences of partners of critically ill persons in an intensive care unit. In-tensive and Critical Care Nursing 2004;20:299-308.
2. Kutlu Y. Problems of the family members of the pa-tients in the intensive care unit. Journal of the Critical Care Nurses Society 2000;4(2):6-8.
3. Ünver V, Öztürk C. Determining the needs of the families of the patients in the intensive care unit and analyzing the level of families' contribution to the patient care, unpublished postgraduate thesis, 1998, Izmir - Turkey: Dokuz Eylül University, The Institute of Health Sciences.
4. Köroğlu TF, Bayrakçı B, Dursun O, Kendirli T, and Yıldızdaş D, Karaböcüoğlu M. Guide for pediat-ric intensive care units: Suggestions of pediatric emergency medicine and intensive care association. Turkish Journal of Intensive Care Medicine 2006; 6(3):123.134.
5. Appleyared ME, Gavaghan SR, Gonzalez C. et al. Nurse-coached intervention for the families of pati-ents in critical care units. Crit Care Nurs 2000;20: 40-49.
6. Holden J, Harrison L, Johnson M. Families, nurses and intensive care patients: a review of the literature. Journal of Clinical Nursing 2002; 11: 140–148.
7. Acaroğlu R, Kaya H, Şendir M, Tosun K, Turan Y. Le-vels of anxiety and ways of coping of family members of patients hospitalized in the Neurosurgery Intensive Care Unit. Neurosciences 2008; 13 (1): 41-45.
8. Çelebioğlu A. The feelings of the parents of newborns staying in the hospital and nursing approach. Inter-national Journal of Human Sciences 2004; 1(1):3-7.

Vers
ion fo
r revie
w
HealthMED - Volume 6 / Number 6 / 2012
Journal of Society for development in new net environment in B&H 1965
9. Kuğuoğlu S, Çövener Ç, Aktaş E, Tanır MK. Use of synergy model in the care of bedridden children, Maltepe University, Nursing Science and Art Journal, 2009 2(1): 60-64.
10. Çalışır H, Eker S, Güler F, Taşçıoğlu Anaç G, Türk-men M (2008). The needs and anxiety levels of the parents whose children are staying in the newborn intensive care unit, Journal of Cumhuriyet Univer-sity School of Nursing 2008, 12(1):31-44.
11. Çavuşoğlu H. (2004) The effects of hospitalization on the children and the parents, The child with a life threatening condition. Children’s health nursing, Volume 1, Extended 8th Edition, Ankara: Sistem of-set Printing House, p.51-70, 91-106.
12. Uzun Ö, Özer N, Çevik Akyıl R. The needs of the families of the patients in some surgical clinics and surgical intensive care unit. The Eurasian Journal of Medicine 2002; 34:39-45.
13. Akşit S, Cimete G. The effect of applied nursing care to the anxiety level of the mothers during their children's acceptance to the pediatric intensive care unit. Journal of Cumhuriyet University School of Nursing 2001; 5(2):25-36.
14. Oflaz F. The pediatric intensive care experience of pediatric patients and their parents, and traumatic stress, Journal of Cumhuriyet University School of Nursing 2008, 12(1):53-59.
15. Kurtulmuş S., Özgün S., Demirkıran F., Erpek G., Eskin M., Cengar H., Kurt I. The needs of the rela-tives of the patients in the intensive care unit. Turk-ish Journal of Intensive Care Medicine Association 2004;2 (Special Issue): 39-40.
16. Kosco M, Warren NA. Critical care nurses' percep-tions of family needs as met. Crit Care Nurs Q 2000; 23: 60-72.
17. Taşdemir N, Özşaker E. Visitation in the intensive care unit: Effects of these visits on the patient, family and nurse, Journal of Cumhuriyet University School of Nursing 2007; 11(1):27-31.
18. Punthmatharith B, Buddharat U, Kamlangdee T. Comparisons of needs, need responses, and need response satisfaction of mothers of infants in neo-natal intensive care units . Journal of Pediatric Nur-sing 2007;22(6):498-506.
19. Rouck SD, Leys M. Information needs of parents of children admitted to a neonatal intensive care unit A review of the literature (1990–2008). Pati-ent Education and Counseling 2009;76:159-173. doi:10.1016/j.pec.2009.01.014.
20. Roden J. The involvement of parents and nurses in the care of acutely-ill children in a non-specialist paediatric setting. Journal of Child Health Care 2005;9(3):222-40.
21. Bond, A, Draieger, C, Mandleco, B, et al Needs of fa-mily members of patients with severe traumatic bra-in injury: implications for evidence-based practice. Crit Care Nurse 2003;23,63-72.
22. Leung, K, Chien, W, Mackenzie, A Needs of Chine-se families of critically ill patients. West J Nurs Res 2000;22:826-840.
23. Molter N. Needs Of The Relatives Of Critically İll Patients: A Descriptive study. Heart Lung. 1983; 8: 332-339.
24. Slota M. Perspectives on family-centered, fleksible visitation in the intensive care unit setting, Critical Care Medicine 2003;31(5):362-366.
25. Sucu G, Cebeci F, Karazeybek E. The needs of the relatives of the patients in the emergency serviced and fulfillment level of these needs, Journal of Turk-ish Association Trauma and Emergency Surgery 2009;15(5):473-481.
26. Özgürsoy B, Akyol A., The needs of the families of the patients staying in the intensive care unit. Journal of the Critical Care Nurses Society 2008; 11(1-2): 33-38
27. Lee LY, Lau YL. Immediate needs of adult family membersof adult intensive care patients in Hong Kong.J Clin Nurs. 2003;12:490-500.
28. Tekinsoy P. Determining the needs of the compan-ions of the patients receiving treatment in the inten-sive care unit. Erciyes University, Institute of Health Sciences, Unpublished Postgraduate Thesis. Kay-seri - Turkey: 2005.
29. Al-Hassan MA, Hweidi IM. The perceived needs of Jordanian families of hospitalized, critically ill pati-ents.Int J Nurs Pract 2004;10:64-71.
30. Redley, B., Le Vasseur, S.A., Peters, G. and Bethune, E. Families’ needs in emergency departments: ins-trument development, Journal of Advanced Nursing 2003;43(6):606–615.
31. Redley B, Beanland C,Botti M.Accompanying cri-tically ill relatives in emergency departments.J Adv Nurs 2003;44:88.
32. Mendonca D., Warren N. A. Perceived and unmet needs of critical care family members. Crit. Care Nurs. Q 1998; 21(1):58-67.
33. Freichels T. Needs of family members of patient in the intensive care unit overtime. Crit. Care Nurs. Q 1991, 14(3):16-29.
Corresponding Author Birsen Altay, On Dokuz Mayıs University, Samsun Health School, Samsun, Turkey, E-mail: [email protected]
Vers
ion fo
r revie
w
1966
HealthMED - Volume 6 / Number 6 / 2012
Journal of Society for development in new net environment in B&H
Abstract
Background: Existing hospitals in an obscure, complex environment with lots of factors affect-ing the manager’s decision making process, and increasing cost of care in recent years confirm the importance of using appropriate techniques to evaluate hospital performance and factors af-fecting this index to increase hospital efficiency. For this reason, the technique used in this study is based on non-parametric data envelopment analy-sis. Increasing interest in using this method is be-cause of the ability to rank efficient hospitals as compared to their inefficient counterparts.
Methods: This study examines the technical, managerial and scale efficiency of public hospitals affiliated to social security organization in Iran, be-tween 2006-2008 by estimating a deterministic frontier production function and the variable return to scale (VRS), and input-oriented DEA model.
Results: The technical efficiency scores from this model showed that overall efficiency im-proved from 0.954 to 0.964, during the period of this study, implying that these hospitals have the potential of reducing 4% of their inputs with no impact on output levels. Also, the efficiency mea-surement derived from this method showed that the average scale efficiency was 95%.
The results from input slacks revealed that the number of personnel was more than the input target.
Conclusion: This study highlights the impor-tance of using an appropriate strategy resource al-location and rationalizes their usage in order to im-prove hospital efficiency. Furthermore, one of the es-sential activities of a hospital manager is continuous evaluation of hospital performance and application of the proper technique for improving efficiency.
Key words: technical efficiency; scale effi-ciency; return to scale; Data Envelopment Analy-sis: DEA
Introduction
One of the important concerns in developing co-untries is the efficiency of using resources in health care sector. Hospitals as one of the important eco-nomic units of health care system, existing a com-plex environment with lots of factors that affect the managers’ decision making and, also the scarcity of resources specially in health systems necessitate the use of scientific techniques in order to evaluate the performance of organization and allocate resources in a way that obtain optimum outputs. (1)
Also, growing cost of care in health systems, en-counter them to a disastrous economical crisis and irreparable financial problems. It seems that becau-se of vulnerable economic basis of the organizati-ons in handling the fluctuations of money market, these problems would become more complex.
Hospitals as one of the most important econo-mic units in health industry are encountered with lots of problems for competing peers and mana-ging the growing pressure of government and social security institutions for decreasing prices and improving quality of services. So applying a proper technique to evaluate the performance of hospitals is inevitable. (2)
Efficiency as one of the most important tech-niques for assessing the performance of hospitals is in the focal point of managers specially health ma-nagers more than before, so efficiency has become an important criteria for hospital achievements. (3) Efficiency shows the success of a hospital in using its resources to produce output – obtaining maximal output for a given set of inputs. This can be asse-ssed in terms of technical efficiency. (4)
Farrell in the year 1957 introduced a simple measure of firm efficiency. The way he defined technical efficiency developed the methods for estimating this type of efficiency. In the year1978, Data Envelopment Analysis (DEA) was introdu-
Factors affecting efficiency of social security hospitals in Iran: Data Envelopment AnalysisNahid Hatam1, Kimia Pourmohammadi1, Ali Keshtkaran1, Mehdi Javanbakht1, Mehrdad Askarian2
1 School of Management and Information Sciences, Shiraz University of Medical Sciences, Shiraz, Iran,2 Shiraz Medical School, Shiraz University of Medical Sciences, Iran.

Vers
ion fo
r revie
w
HealthMED - Volume 6 / Number 6 / 2012
Journal of Society for development in new net environment in B&H 1967
ced as one of the techniques for estimating techni-cal efficiency. (5) DEA is a non-parametric linear programming method, measuring relative effi-ciencies for a group of similar units. It has some advantages over the old methods such as simple ratio and regression analysis. It is useful where there are multiple inputs and outputs in a unit such as hospital. (6-8)
This method was introduced as a superior met-hod in the report by World Health Organization (WHO) in 2003 for measuring efficiency in health systems(9); therefore, the purpose of this project was to estimate technical, managerial and scale ef-ficiency of 64 general hospitals affiliated to social security organization of Iran.
Materials and Methods
This cross sectional study that applied a varia-ble return to scale, Input – oriented DEA model. Data for this research were obtained from the sta-tistical center of social security organization for a total of 64 general hospitals in 2006-2008. Winde-ap software was used to analyze the data.
The input-oriented model, in particular, focuses on the minimization of inputs and calculates the degree to which each production unit can rapidly reduce the quantities of utilized inputs in order to still produce a given amount of outputs. Mathe-matically, the CRS input-oriented DEA model is formulated with the following non-linear fracti-onal programming problem which, when solved, determines the Relative efficiency θ*pp of DMU p:
Subject to the following conditions:
In the above notation it is assumed that the-re are n DMUs and that each one p (p=1,2,…,n) is consuming varying quantities of m inputs (x1p,x2p,…,xmp) to produce varing quantities of s outputs (y1p,y2p,…,ysp). The multipliers ujp and vip are the weights given by DMU p to jth outputs (yjr) and to ith inputs (xir) of itself and every other DMU r (r=1,2,…p,…n). (ε) represents a small po-sitive number defined to be smaller than any posi-tive real number . The corresponding VRS input-oriented DEA model is formulated with following fractional programming problem:
Subject to the following conditions:
Therefore the VRS formulation ensures that each benchmark unit is comparable in size to the DMU being evaluated.
Regarding to other studies and also by the use of expert opinions, a manageable set of input and out-put variables were selected. These variables have the greatest impact on the efficiency of these hos-pitals. Input variables used in this study were the number of physician, nurses, other personnel and the number of fixed hospital beds. Moreover, four output variables including the number of inpatient admissions, the number of outpatient visits, the number of surgical operations, and bed occupan-cy rate were considered. These variables were also used for scale and managerial efficiency. As DEA is a non-parametric approach, it requires neither the use of a pre-specified functional form for technolo-gy nor distributional assumptions about error terms.

Vers
ion fo
r revie
w
1968
HealthMED - Volume 6 / Number 6 / 2012
Journal of Society for development in new net environment in B&H
This study also identified the constant return to scale introduced as a full scale efficient hospital. Hospitals with full technical efficiency score were ranked by the weights they had in the reference set.
Results
Consideration of the efficiency is the most im-portant and proper way of evaluating health sy-stem performance and also hospitals. Therefore, in recent years evaluating performance in this sy-stem and also economical units in the micro-level by the use of efficiency measurement has attracted the specialists’ attention in the field of manage-ment economics and policy making.
The results are presented in Table 1 shows that during all the3 years of this study, 60% of under study hospitals were fully efficient in technical ef-ficiency. This type of efficiency in each year was 0.954, 0.975, 0.964 respectively and the mean ef-ficiency was 0.958. The range of efficiency within the efficient hospitals was from 0.997 to 0.711. In spite of the increasing trend that was shown in the mean technical efficiency of these hospitals dur-ing the period of study, the inputs of these hospi-tals could be used more efficiently by 4 percent during 2006-2008.Table 1. Ranking the hospitals owned by social security organization with regard to technical ef-ficiency with DEA model.
year
hospital2006 2007 2008
Mean technical efficiency
1 1 1 1 12 1 1 1 13 1 1 1 14 1 1 1 15 1 1 1 16 1 1 1 17 1 1 1 18 1 1 1 19 1 1 1 110 1 1 1 111 1 1 1 112 1 1 1 113 1 1 1 114 1 1 1 115 1 1 1 116 1 1 1 1
17 1 1 1 118 1 1 1 119 1 1 1 120 1 1 1 121 1 1 1 122 1 1 1 123 1 1 1 124 1 1 1 125 1 1 1 126 1 1 /992 /99727 1 /989 1 /99628 1 1 /986 /99529 1 /986 1 /99530 1 /995 /998 /99431 /979 1 1 /99332 /977 1 1 /99233 1 1 /966 /99834 /960 1 1 /98635 /949 1 1 /98336 1 1 /939 /97937 1 /940 /992 /97738 1 1 /917 /97239 /914 1 /994 /96940 1 /900 1 /96641 1 1 /893 /96442 1 /925 /950 /95843 1 /956 /920 /95844 1 /915 /944 /95845 /950 /947 /961 /95246 /849 1 /973 /94047 /954 /955 /898 /93548 /956 1 /850 /93549 /921 1 /862 /92750 /772 1 1 /92751 /867 /906 1 /92452 1 /943 /822 /92153 /960 /879 /913 /91754 /855 /926 /968 /91655 /879 /941 /901 /90756 /904 /848 /956 /90257 /880 /900 /913 /89758 /915 /865 /885 /88859 /837 /854 /904 /86560 /813 /785 1 /86661 /798 /814 /8920 /83462 /755 /827 /867 /81663 /705 /605 /984 /76464 /722 /701 /711 /711
mean /954 /957 /964 /958
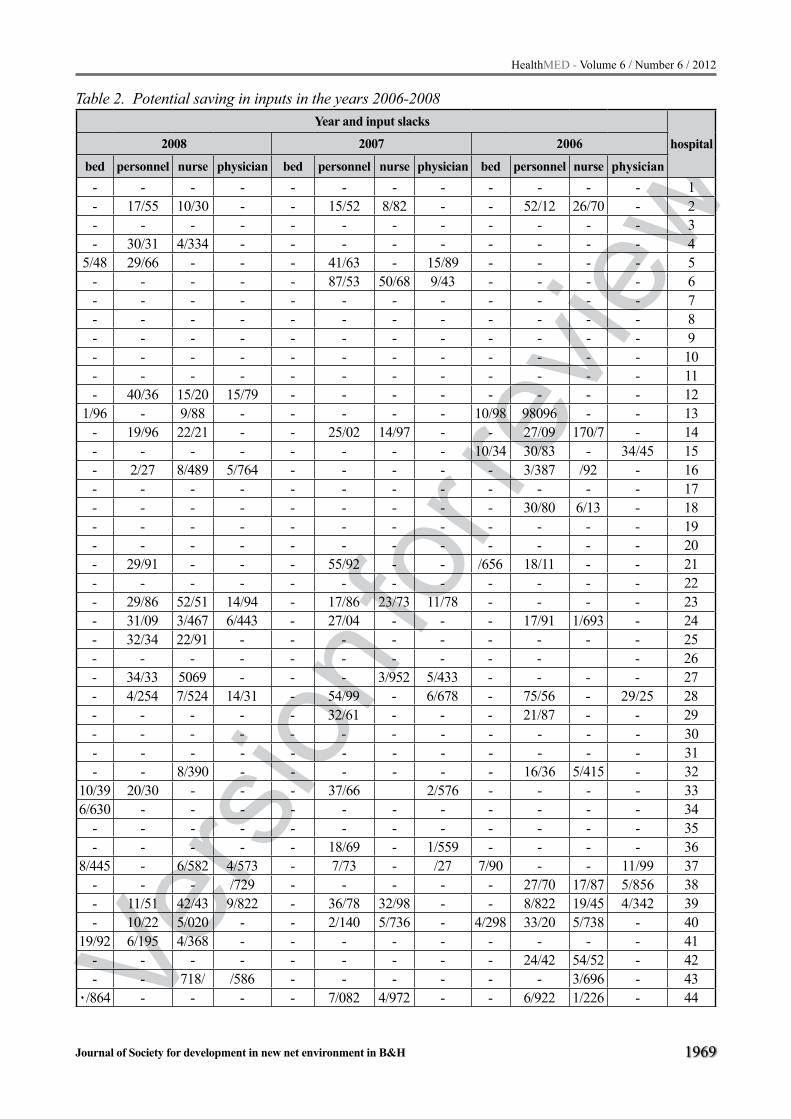
Vers
ion fo
r revie
w
HealthMED - Volume 6 / Number 6 / 2012
Journal of Society for development in new net environment in B&H 1969
Table 2. Potential saving in inputs in the years 2006-2008 Year and input slacks
hospital2008 2007 2006
bed personnel nurse physician bed personnel nurse physician bed personnel nurse physician- - - - - - - - - - - - 1- 17/55 10/30 - - 15/52 8/82 - - 52/12 26/70 - 2- - - - - - - - - - - - 3- 30/31 4/334 - - - - - - - - - 4
5/48 29/66 - - - 41/63 - 15/89 - - - - 5- - - - - 87/53 50/68 9/43 - - - - 6- - - - - - - - - - - - 7- - - - - - - - - - - - 8- - - - - - - - - - - - 9- - - - - - - - - - - - 10- - - - - - - - - - - - 11- 40/36 15/20 15/79 - - - - - - - - 12
1/96 - 9/88 - - - - - 10/98 98096 - - 13- 19/96 22/21 - - 25/02 14/97 - - 27/09 170/7 - 14- - - - - - - - 10/34 30/83 - 34/45 15- 2/27 8/489 5/764 - - - - - 3/387 /92 - 16- - - - - - - - - - - - 17- - - - - - - - - 30/80 6/13 - 18- - - - - - - - - - - - 19- - - - - - - - - - - - 20- 29/91 - - - 55/92 - - /656 18/11 - - 21- - - - - - - - - - - - 22- 29/86 52/51 14/94 - 17/86 23/73 11/78 - - - - 23- 31/09 3/467 6/443 - 27/04 - - - 17/91 1/693 - 24- 32/34 22/91 - - - - - - - - - 25- - - - - - - - - - - 26- 34/33 5069 - - - 3/952 5/433 - - - - 27- 4/254 7/524 14/31 - 54/99 - 6/678 - 75/56 - 29/25 28- - - - - 32/61 - - - 21/87 - - 29- - - - - - - - - - - - 30- - - - - - - - - - - - 31- - 8/390 - - - - - - 16/36 5/415 - 32
10/39 20/30 - - - 37/66 2/576 - - - - 336/630 - - - - - - - - - - - 34
- - - - - - - - - - - - 35- - - - - 18/69 - 1/559 - - - - 36
8/445 - 6/582 4/573 - 7/73 - /27 7/90 - - 11/99 37- - - /729 - - - - - 27/70 17/87 5/856 38- 11/51 42/43 9/822 - 36/78 32/98 - - 8/822 19/45 4/342 39- 10/22 5/020 - - 2/140 5/736 - 4/298 33/20 5/738 - 40
19/92 6/195 4/368 - - - - - - - - - 41- - - - - - - - - 24/42 54/52 - 42- - 718/ /586 - - - - - - 3/696 - 43
0/864 - - - - 7/082 4/972 - - 6/922 1/226 - 44

Vers
ion fo
r revie
w
1970
HealthMED - Volume 6 / Number 6 / 2012
Journal of Society for development in new net environment in B&H
Findings showed that in the first two years of the study, 60% and in last year (2007) 56% of hospitals were fully efficient in managerial efficiency and the average number of hospitals with complete mana-gerial efficiency was reported to be 59%. The mean of pure technical efficiency in all 3 years of study was 0.953, 0.955, and 0.965, respectively which shows the increasing trend of this efficiency in the3 year period of this study. Moreover the total mean of pure technical efficiency score was 0.957.
The results from scale efficiency revealed that in the first year of the study, 30% and in the second and third years, 41% and 38% of the hospitals obtained complete scale efficiency scores (SE=1). Totally, the average number of fully efficient hospitals in this fi-eld was reported to be 36%. The means of scale ef-ficiency in the 3 years were 0.959 , 0.940, and 0.966 respectively. The fluctuation which is seen in the mean scale efficiency did not indicate any trend in the way of improving efficiency in hospitals.
Overall, in the year 2006, 30% and in years 2006 and 2008, 37.5% were fully efficient in all 3 types of efficiency measured in this study. Mo-reover the findings of this study showed that 17% of the hospitals were functioning in the optimum scale (constant return to scale) and 25% of them had a decreasing return to scale (DRS ).
In this study, input slacks are also defined in Table 2. The maximum slacks of the inputs were the number of other personnel in all the three years of this study and the minimum slacks were related to the number of the fixed hospital beds. It should be mentioned that in 36% of the hospitals during all the 3 years of this study, slacks in inputs had not been found.
Discussion
The scarcity of resources in health economics is the most important reason of paying attention to productivity and reasonable usage with maximum output in all units of health system. Hospitals, as one of the major and cost consuming units in heal-th care system with lots of expensive technologies and allocation of 50-80 percent of the total health resources, still have inefficiency. Therefore taking appropriate measures for controlling and decrea-sing of wasting hospital resources for providing better and high qualified services is essential.(9)
As a result, application of a scientific technique in order to evaluate hospital performance and esti-mate efficiency and the factors affecting it, is one of the major affairs of health managers and health policy makers. This can make a major contributi-on to improve health services.(10)
- - - - - - - - 2/527 32/57 - - 45- - - - - 82/58 - 21/72 - - - - 46- - - - - - - - - - - - 47- 3/744 23/55 - - 57/70 14/17 - - 27/04 11/14 - 48- 19/08 42/54 - - 64/54 30/51 6/407 - 68/79 - - 49- - - - - 10/97 - - - - - - 50- - - - - - - - - - - - 51- - - - - - - - - - - - 52
/277 - - - - - - - - - 7/209 - 53- - - - - 108/8 160/2 13/74 - - - - 54- 50/87 19/82 18/43 - - - - - - - - 55- - - - - - - - - - - - 56- - - - 11/511 - 17/30 21/97 0.53 4/757 - - 57- - - - - - - - - - - - 58- - - - - - - - - - - - 59- - - - - - - - /756 6/503 - - 60- - - - - - - - - - - - 61- 13/55 13/14 26/53 - 39/14 3/156 - - 32/91 4/504 - 62- - - - - - - - - - - - 63- - - - - - - - - - - 64
/843 6/835 5/845 1/836 /594 10/41 5/265 1/342 mean
Vers
ion fo
r revie
w
HealthMED - Volume 6 / Number 6 / 2012
Journal of Society for development in new net environment in B&H 1971
Present study showed how one can measure the technical efficiency relative to best practice, using DEA. The results of this study demonstrated that score of technical, scale and pure technical effi-ciency, type of return to scale and input slacks in all general hospitals affiliated to social security orga-nization, providing recommendations for enhance-ment of these efficiencies. Based on the results of measuring technical efficiency, in each year, %60 of these hospitals had full technical efficiency scores. Also, the mean score of this type of efficiency was 0.96. It should be mentioned that this study showed the increasing trend in technical efficiency from 95. in the first year to .96 in the last year.
Mazie in the year 2007 reported that with the same model the mean technical efficiency of Zam-bian hospitals was .67, and only %40 of these hos-pitals got complete score in this type of efficiency (11), compared with other studies, It seems that hospitals affiliated to social security organization have a good condition in this type of efficiency and inputs in these hospitals could be used more efficiently just by %4 during the study period.
Kontodimopoulos (2005) estimated the effi-ciency of 17 hospitals in Greece with DEA model, reporting that only 5 hospitals (/29) obtained the full technical efficiency score (12).Osei in the year 2005 indicated that 53% of 17 hospitals in Ghana had complete technical efficiency (13). In almost all these studies it is implied that inefficiency of organization management, location of hospitals and their unreasonable size had a great impact on the efficiency of hospitals.
Harrison (2004) indicated that, sometimes hospitals are located in an environment where de-mand for health care and hospital services is low; as a result hospitals’ outputs such as inpatient ad-missions and outpatient visits reduce.
Therefore the results of using DEA model showed slacks in inputs and indicated that hos-pitals should reduce their operational costs, the number of personnel and also the number of beds and clinical services in order to reach to complete efficiency (14).
A study of the hospitals affiliated to social se-curity organization in Iran conducted by Hatam (1994) showed that the reason of lacking technical efficiency was inappropriate usage of beds, nurses, physicians and other health care workers in these
hospitals. By using a good strategy and high quali-fied manager, this limitation would be reduced (10).
Comparing these studies with the present one, it should be mentioned that fixed hospital beds in this study, have been used reasonably in compar-ison with other studies, but in the usage of per-sonnel input, there are still some problem. These hospitals should conduct a proper plan for better employment of personnel. Scott (1993) recom-mended that increasing competition in hospitals, continuous fiscal controls by managers, and learn-ing new managerial methods and knowledge in the field of health sciences can make a great con-tribution in hospitals’ efficiency (15).
Copeland and Stone (1988) believe that, hos-pitals need to have a competition in applying the best manager and maintain this competition for increasing technical efficiency (16). Hospitals studied in this project, had a good condition in ob-taining maximum efficiency and they should re-duce their use of inputs just about 4% to reach the optimum efficiency. It seems that implication of appropriate and scientific managerial methods in employing the best inputs with optimum amount and also closing the inefficient wards of the hospi-tals can make a great contribution to an increase in the efficiency of hospitals.
The results of this study showed that 36% of the hospitals had complete scale efficiency and the average score of this type of efficiency was 95%. Ferrier (2005) and Byrnes (1994), reported the scale efficiency as 0.85 and /94, respectively.(17-18). In Osei’s study (2002), 41/2% of the hospitals and 53% of the health care centers were reported to be fully scale efficient (13). The range of this type of efficiency was reported between (1- 0.79) in US in valmanis’ study (1992) (19).
In another study done by Hatam (1999), the causes of scale efficiency were reported. She rec-ommended that inefficiency in using hospitals’ in-puts such as beds as one of the important resources and also management inefficiency in applying fi-nancial resources are the reasons of scale ineffi-ciency (10). Moreover the results obtained from Sherman’s study (1984) were indicated the same reasons for scale inefficiency (20).
In the present study, although the score estimat-ed for scale efficiency was /95(and it is more than the previous studies), the number of hospitals with
Vers
ion fo
r revie
w
1972
HealthMED - Volume 6 / Number 6 / 2012
Journal of Society for development in new net environment in B&H
full scale efficiency score was minimum (36%). It seems that the trend of scale efficiency in general hospitals in this study is upward but to reach the op-timum scale, having an accurate and precise health policy making, effective management, proper con-sumption of fixed hospital beds and reasonable es-tablishment and development of hospitals to meet the public needs of the region are inevitable.
Daliri (2005) in Iran found that the mean pure technical efficiency was 0.95 (21). The obtained results of determining the pure technical efficien-cy of the hospitals under this study showed that 59% of the hospitals were fully efficient as to pure technical efficiency (mean= 0.95). In spite of the upward trend of this efficiency, it is still effective to have a better management and a proper alloca-tion of human resource and other inputs for a bet-ter hospital performance. It should be mentioned that it is potentially possible to save resources using DEA analysis. The possibility of saving by proper utilization of inputs is presented in Table 2.
With regard to the input slacks, this study showed that the maximum potential for reducing inputs in order to increase the efficiency is for the number of other personnel (about 10%). This input slack in Junoy’s study (2000) in Spain was 8/42% (22). The number of human resources slacks in Harrison’s re-search was estimated 9.65. He recommended that human resources should be redistributed due to the potentialities facilities and regional needs, also edu-cation of personnel and prepares incentives in or-der to improve the level of professional personnel’s skills cause better efficiency.
The results of most studies showed that due to the high costs allocated to human resources (60-80%), hospital managers should revise the poli-cies in applying and employment of this expensive input to prevent high expenses.
In regard to the fixed bed slacks, the results were similar to those of the studies such as Junoy (2000) and Harrison (2004) The slacks of this in-put are reported as the least one (22/14). Harrison suggested that although the potential saving of this input is little, sometimes the existence of hospitals in regions with less demand for health care ser-vices and lack of access to hospital facilities by population can increase the slacks in beds (14). As a result, due to the high potential of saving in the number of personnel in the studied hospitals, it
should be mentioned that regarding the confining governmental policy in allocation of resources, using “work study” and “time study” methods for better employment of personnel with regard to the hospital performance volume can contribute to in-crease inefficiency.
According to The results of this study, for im-proving efficiency in hospitals, development of quality and quantity of services, improvement of the financial resource absorption, and permanent evaluation of hospital performance are recom-mended. Also, health policy makers should evalu-ate the optimal allocation of beds and clinical ser-vices precisely. In order to ensure the accessibility of all services to all population. Because of
Using the key and the most important inputs in DEA estimation, this method provides an impor-tant information for managers and policy makers to construct new organizational planning for pro-ducing maximum outputs with the usage of mini-mum resources.
This paper is limited to the estimation of the scale, pure technical and technical efficiency. Al-locative efficiency can be important too. Many factors such as size and type of the hospital, num-ber of researches in hospitals, experience of the manager, etc. can also be significant in determin-ing the efficiency.(23)
Due to uncontrollable factors (or pure statisti-cal noise) that affects the performance of a unit, another limitation of this study is the application of just DEA nonparametric method. The use of parametric methods such as SFA (Stochastic Fron-tier Analysis) in estimating hospital efficiency is recommended.
Acknowledgment
The authors would like to thank Dr.Hosein Zare and Dr. Pouragha for their kind assistance and fri-endly guides. Also, we gratefully acknowledge all the managers in social security organization. This study was funded by Shiraz University of Medical Sciences with the number of 88-4697.

Vers
ion fo
r revie
w
HealthMED - Volume 6 / Number 6 / 2012
Journal of Society for development in new net environment in B&H 1973
References
1. Hatam N. Survey the Factors Affected Efficiency in Hospitals Affiliated to Social Security Organization in Tehran, Iran. PhD thesis . Islamic University of Sci-ences and Researches. 2000. 15-20;
2. Moslehi Sh. Estimating Efficiency in Public-general Hospitals in Iran : Data Envelopment Analysis,MS thesis. Shiraz University of Medical Sciences, school of management . 9-15; 2005.
3. National Corporation of Productivity in Singapore , Estimating Productivity in Health System. Translated by productivity management of Islamic Republic ,Teh-ran, Iran.17: 33;1997 .
4. Gannon B.Technical efficiency of hospital in Ireland, Economic and Social Research Institute, working pa-per, 2004.
5. Giokas D. The use of goal programming ,regression analysis and data envelopment analysis for estimat-ing efficient marginal cost of hospital services . Multi –criteria decision analysis, 11:261-268 ; 2002.
6. Nyhan R, Cruise P, Comparitive performance assess-ment in managed care : Data Envelopment Analysis for health care managers. Managed Care Q, 8 (1):18-27; 2000.
7. Thanassoulis E. Introduction to theory and applica-tion of Data Envelopment Analysis. A Foundation Text With Integrated Software. Kluwer academic pub-lisher , Boston,2001.
8. Cooper W, Seiford M, Tone k. Data Envelopment Analysis, Kluwer academic publisher , Boston,1999.
9. Mehregan M.R. Quantitative Modeling for Evaluat-ing System Performance –DEA., School of Manage-ment, Tehran University : 60-5 ; 2008.
10. Hatam N. the role of Data Envelopment Analysis (DEA) Pattern to Determine the Efficiency in Iran Social Security Organization Hospitals. Iranian Red Crescent Medical Journal (IRCMJ),10 (3):208-211; 2008.
11. Masiye F. Investigation Health System Perfor-mance: An Application of Data Envelopment Analy-sis to Zambian Hospitals. BMC Health Services Re-search,7:58; 2007.
12. Kontodimopoulos N, Moschovakis G, Aletras V.H. The effect of environmental factors on technical and scale efficiency of primary health care providers in Greece. Cost effectiveness and resource allocation, 5 (14):352-84 ; 2007.
13. Osei D, Almeida S, Georrge M. Technical Efficiency of Public District Hospitals and Health Centers in Ghana: a pilot study.Cost Effectiveness and Resour-ce Allocation . 2005; 3:9-22.
14. Harrison J.P, Coppola N, Wakefield M. Efficiency of Federal Hospitals in the United States .journal of medical systems, 25(5): 18-30; 2004.
15. Scott R.W, The organization of medical care servi-ces: Toward an integrated model. Med.CareRev. 50(3):271-301; 2004.
16. Copeland T.E, Weston J.F. Financial Theory and Cor-porate Policy, Addition –Wesley,Reading,MA,1988.
17. Ferrier GD, Valdmanis VG. Peer Effects and Effi-ciency: The influence of competitors’ performance on hospital Efficiency. Cost- Effectiveness and re-source allocation.14(3):7-15; 2005.
18. Bayrnes p, Valdmanis V. Analyzing technical and allocative efficiency of hospitals in DEA theory, Met-hodology and applications, Boston,1994.
19. Valdmanis V, Sensitivity analysis for DEA models- an empirical example using publicvs.NFP hospitals, journal of public Economics. 48(2):185-205 ; 1992.
20. Sherman D. Hospital Efficiency Measurement and Evaluation Empirical Test of a New Technique. Med-ical care. 22 (10) :922-938 ; 1984.
21. Ahmad Kia Daliri A.A. Estimating technical effi-ciency of hospitals affiliated to Tehran university of medical sciences, MS thesis, Tehran university of medical sciences, school of management and infor-matics.20-24 ; 2005.
22. Jounoy J. Partitioning Input Cost Efficiency in to its Allocative and Technical Components: an Empirical DEA Applicationto hospitals. Socio-Economic Plan-ning sciences.34:199-218 ; 2000.
23. Battes G.E, Coelli T.J. A model for technical efficien-cy effects in a stochastic frontier production function for panel data, Empirical Economics. 20:325-332; 1995.
Corresponding Author Nahid Hatam, School of Management and Information Sciences, Shiraz University of Medical Sciences, Shiraz, Iran, E-mail: [email protected]

Vers
ion fo
r revie
w
1974
HealthMED - Volume 6 / Number 6 / 2012
Journal of Society for development in new net environment in B&H
Abstract
Aim: The aim of the study was to establish the relationship between basal metabolic rate (BMR) lean body mass (LBM) and bone mineral density (BMD) of four positions of femurs and total femur in in Indian national level basketball players.
Method: Thirty Indian national level ba-sketball players (mean ± SD, age: 21 ± 1.71ye-ars, height: 182.33 ± 9.2 cm, weight: 75 ± 8.12 kg, BMI: 22.2 ± 3.12) participated in this study. All the participants in this study were Non-vegetarian. They all also were free of any illnesses such as diabetes, hyperthyroidism, hyperparathyroidism, cardiovascular disease and were not taking any medicine. The participants neither did report for using any antiseizure drugs, alcohol and Cortone consumption, nor smoking cigarette. The activity levels and dietary habits of all subjects were no-ted. BMD of the femurs was measured by Dual Energy X-Ray Absorptiometry (DEXA). We used Pearson correlation for measuring the correlati-on between BMD-BMR, BMR-LBM and BMD-LBM in national level basketball players. Signifi-cant level of test was at 0.05.
Results: BMR correlated significantly with BMD of the total femur, neck, troch, and shaft. These correlations were stronger in femur troch position. Also there was significance correlation between BMR- BMD, BMR - lean body mass (LBM), LBM-BMD of these players. But it sho-uld be noted that the relationship between BMD-LBM is more than the relationship of BMD-BMR.
Conclusions: BMR is closely associated with BMD in Indian national level basketball players. Also BMD have correlation with LBM in this group.
Key words: Basal metabolic rate, Bone mine-ral density, Femoral, Lean body mass and Natio-nal level basketball players.
Introduction
The amount of bone gained during youth and the rate of loss later in life are important predictors for the risk of osteoporosis and fractures in life (1). Over the past two decades, there have been many studies which have shown that exercise can incre-ase bone mass or density. The majority of these have relied on DEXA measures (2 and 3). Regular weight-bearing exercise, especially during the pre and after per pubertal years, leads to substantial benefits in BMC, BMD and skeletal structure, en-hancing bone strength at loaded sites (4 and 5). However, few fragility fractures occur in youth, and only if the exercise induced skeletal benefits are retained into older age, a time when the in-cidence of fragility fractures rises exponentially, would these changes be of biological significance for fracture reduction (6 and 7). The limited data available indicate that exercise benefits in BMC and BMD are eroded in the long term. In con-trast, several studies suggest that exercise-induced structural changes may be retained even following the cessation of exercise (3, 5 and 8).
However, it is uncertain what actually happens to the fracture risk of individuals who retire from exercise and reduce their level of activity to that of the average individual. Recent retrospective observational and case-control studies suggest that there could be a reduced fracture risk in for-mer athletes. Each of these traits could be maintai-ned in former athletes after their active career, and may help to reduce the number of fractures later in life. Therefore, based on the current evidence, we recommend a physically active lifestyle youth as a possible preventive strategy against fragility fractures in old age (9, 10 and 11).
BMR is defined as the minimum energy nee-ded to maintain vital functions. In addition to this,
The relationship between basal metabolic rate, lean body mass and femurs bone mineral density of national level basketball players of IndiaBehrooz Imeri, D. K. Dureha
Physical Education Department, Faculty of Art, Banaras Hindu University (BHU), India

Vers
ion fo
r revie
w
HealthMED - Volume 6 / Number 6 / 2012
Journal of Society for development in new net environment in B&H 1975
40 percentage of BMR is used by the central ner-vous system, and 20 to 30 percentage of BMR is used by skeletal muscle (12). A study that included 345 postmenopausal women and 224 elderly men (55–69 years) reported a significant correlation between BMR and BMD. In the SCI population, linear relationship between physical activity and BMD or BMR is known (13).
For some years scientists have been interested in identifying the relationship of BMR to help the BMD. With the public’s increased awareness of the general health benefits of aerobic training, re-search has focused on the relationship of aerobic fitness to Resting Metabolic Rate (RMR), BMR and BMD (14). This relationship can be investiga-ted either longitudinally, by observing the respon-ses of an untrained group of subjects to a period of training, or cross-sectional, by observing the re-lationship between maximal oxygen consumption (VO2max) and RMR, BMR and BMD in subjects (14 and 15). There are also some studies on the re-lationship of body mass index (BMI) and body fat percentage with BMD on postmenopausal women and some papal have a problem in bodies (6, 13, 16 and 17). Few studies have closely examined re-lationships between BMD and BMR in range of 18 to 30 subjects. In the present study, we investi-gated the associations of BMR, LBM and femurs BMD of national level Indian basketball players.
Materials and Methods
In this study, 30 Indian National level basketball players (with mean+/-SD, age 21±1.71years, hei-ght: 182.33 ±9.2 cm, weight: 75±8.12 kg, BMI: 22.2 ± 3.12) participated. All the participants were the members of basketball teams in first league of India. The selections of the participants were done through simple random sampling.
At the first stage the participants were given some information about the goal and different sta-ges of data collection and then they filled a testimo-nial of participation in the research. Participants had no bone tear, bone hollow in family records and di-seases such as diabetes, hyperthyroidism, hyperpa-rathyroidism, cardio-respiratory diseases and they were not using alcohol, cigarette, anti- respiratory medicines and Cortone. Players have regular exer-cise of basketball for more than six years and they
have six session’s trainings in a week regularly. They were members of a team and regularly trained under supervision of the trainer. All the subjects in this study have Non-vegetarian diets. We used one questionnaire in this study. The questionnaire was divided into two parts. The first part consisted of personal information of players (such as age, len-gth, weight, etc.) and the second part evaluated medical information (such as bone tear, not using smoke, alcohol, medicine, etc.). BMD of subjects was calculated by DEXA machine in Sir Sunder-lal hospital of BHU in Varanasi. In this method the base of mass measurement was using two high and low energy sources which make different absorpti-on from soft and bony tissues. For determining the Body Fat Mass and Low Body Fat Mass we used the DEXA machine also. For calculation of the BMR we used the formula. Table 1. Amount of some anthropometric para-meters, BMR and BMD in Indian national level basketball players
Variable MeanAge(years) 21±1.71Weight(kg) 75±8.12Height(cm) 182.33 ±9.2BMI(kg/m2) 22.2 ± 3.12Body Fat(kg) 11.52± 3.2
Body fat percentage 15.27± 3.17Lean body fat(kg) 63.42± 4.21
BMI 22.2±3.12±81BMR 1726.21±72
Femur Neck 1.195Femur Wards 1.091Femur Troch 1.074Femur Shaft 1.247Total Femur 1.1494
Statistical ProceduresSPSS was used to analyze data and data were
analyzed through descriptive and deductive stati-stics. In descriptive statistics, indexes such as ave-rage, standard division, frequency table related to age, length, weight, etc. were used. In deductive statistics, we used Pearson correlation for measu-ring the correlation between BMD-BMR, BMR-LBM and BMD-LBM in national level basketball players. Significant level of test was at 0.05.

Vers
ion fo
r revie
w
1976
HealthMED - Volume 6 / Number 6 / 2012
Journal of Society for development in new net environment in B&H
Results
BMR correlated significantly with BMD of the total femur, neck, troch, and shaft. These correla-tions were stronger in femur troch position. Also there was significance correlation between BMR- BMD and BMR-LBM (Table2). In this study, we investigated the relationship between LBM and four positions of femur BMD values in Indian na-tional level basketball players. Table 2. Pearson correlations among four positi-ons of femur BMD and LBM with BMR (*P≤.05)
Variable NPearson
Correlation with BMR
Sig. (2-tailed)
Femur Neck 30 .408 .048*Femur Wards 30 .438 .032*Femur Troch 30 .504 .012*Femur Shaft 30 .417 .042*Total Femur 30 .434 .033*Lean body
mass 30 .807 .015*
Table 3. Pearson correlations among LBM with four positions of femurs BMD (*P≤.05)
Variable N
Pearson Correlation
with lean body mass
Sig. (2-tailed)
Femur Neck 30 .740 .015*Femur Wards 30 .591 .041*Femur Troch 30 .680 .039*Femur Shaft 30 .830 .009*Total Femur 30 .770 .025* Figure 1. Scatter plots that show the correlation
between BMR and four positions of femur BMD (A, B, C and D).
Discussion
In this study, we investigated the relationship between BMR and total femur, neck, wards, troch, and shaft BMD. These two variables have positive correlation. This finding was consistent with the pre-vious literature (6, 13, 16, 17 and 18). On the other hand, our results show that there is a positive corre-lation between BMR and four positions of femur BMD in Indian national level basketball players.
In this study we found that BMD is more stron-gly correlated with LBM than BMR. Our results are in accordance with previous studies (6, 13, 16,

Vers
ion fo
r revie
w
HealthMED - Volume 6 / Number 6 / 2012
Journal of Society for development in new net environment in B&H 1977
19 and20). They reported that BMD is more close-ly related to LBM, but in some studies BMD have more correlation with BMR than LBM, for exam-ple Ijuin2002 reported that BMD of lumbar spine and pelvis correlated with body fat mass but not with LBM in postmenopausal women (21). Also these studies were done on old men and women. Furthermore, the mean values of lean body mass were significantly lower in old men and women.
Also Subject populations, nutritional status, or anthropometric measurement methods may have differed among the studies.
It is known that resting energy expenditure correlates strongly with spine, total femoral and to-tal body bone mineral content and BMD in postme-nopausal women and old men populations. Accor-ding to our knowledge, this is one of the first studi-es examining the association between femur BMD and BMR in national level athletes (22 and 23).
In some studies it is shown that, in older men and women, the increase in BMR will cause the increase in the BMD and prevent the osteoporosis (13and 20).
Interestingly, the present study describes that BMR and LBM correlate more strongly with bone density in national level basketball players. Mea-surements of BMR might be of value in assessing the impairment of BMD. Because in this study we did not investigate some blood variable whi-ch affect the BMD or metabolic parameters or a long history of dietary habits, we could not ascer-tain why BMR correlated closely with BMD, and whether higher BMR was causative or resultant of elevated BMD. But there are some studies which show the effect of weight bearing activity (i.e. Ba-sketball) on the increase of BMR. These activities have very strong positive relationship on the in-crease of BMD. According to our findings we can confess that increase in BMR and LBM will led to increase of BMD; because both BMR and LBM variable have the positive and significant relati-onship with femurs BMD. But we stress that the findings of the current study can be of limited si-gnificance in respect that some factors might have affected the study’s results.
Conclusion
There is a strong correlation between four po-sitions of femur BMD and BMR in national level basketball players. In this study we also find that LBM and femur BMD have a close correlation with each other.
Reference
1. US Department of Health and Human Services: Bone Health and Osteoporosis: A Report of the Surgeon General. Rockville, US Department of Health and Human Services, Office of the Surgeon General, 2004
2. Jarvinen TL, Kannus P, Sievanen H: Have the DXA-based exercise studies seriously underestimated the effects of mechanical loading on bone? J Bone Miner Res 1999; 14:1634–1635
3. Kannus P, Haapasalo H, Sankelo M, Sievanen H, Pa-sanen M, Heinonen A, Oja P, Vuori I: Effect of star-ting age of physical activity on bone mass in the do-minant arm of tennis and squash players. Ann Intern Med 1995; 123:27–31.
4. Van Langendonck L, Claessens AL, Lefevre J, Tho-mis M, Philippaerts R, Delvaux K, et al. Association between bone mineral density (DXA), body structure, and body composition in middle-aged men, Am J Hu-man Biol 2002; 14:735– 42
5. Young N, Formica C, and Szmukler G, Seeman E: one density at weight-bearing and non-weight bearing si-tes in ballet dancers: the effects of exercise, hypogo-nadism, and body weight. J Clin Endocrinol Metab 1994; 78:449–454
6. Bilge Yilmaz, MD, Evren Yasar, MD, A. Salim Goktepe, MD, M. Erkut Onder, MD, Ridvan Alaca, MD,Kamil Yazicioglu, MD, Haydar Mohur, MD, The Relation-ship Between Basal Metabolic Rate and Femur Bone Mineral Density in Men With Traumatic Spinal Cord Injury. Arch Phys Med Rehabil 2007; 88:758-61.
7. Kanis JA: Diagnosis of osteoporosis and assessment of fracture risk. Lancet 2000; 359: 1929–1936.
8. Forwood MR, Burr DB: Physical activity and bone mass: exercises in futility? Bone Miner 1993; 21:89–112.
9. Jian-Min Liu Æ Hong-Yan Zhao Æ Guang Ning, Yong-Ju Zhao Æ Lian-Zhen Zhang Æ Li-Hao Sun, Man-Yin Xu Æ Jia-Lun Chen. Relationship between body composition and bone mineral density in he-althy young and premenopausal Chinese women, Osteoporos Int (2004) 15: 238–242 DOI 10.1007/s00198-003-1536-7

Vers
ion fo
r revie
w
1978
HealthMED - Volume 6 / Number 6 / 2012
Journal of Society for development in new net environment in B&H
10. Makovey J, Naganathan V, Sambrook P. Gender di-fferences in relationships between body compositi-on components, their distribution and bone mineral density: a cross-sectional opposite sex twin study. Osteoporos Int 2005; 16:1495-505.
11. Wang MC, Bacharach LK, Van Loan M, Hudes M, Flegal KM, Crawford PB. The relative contributions of lean tissue mass and fat tissue mass to bone densi-ty in young women. Bone 2005; 37: 474-81.
12. Berne MR, Levy NM. Physiology, 3rd ed. St Louis: Mosby; 1998.
13. Choi JW, Pai SH. Bone mineral density correlates strongly with basal metabolic rate in postmenopau-sal women. Clin Chim Acta 2003; 333:79-84.
14. Craig E Broeder, Keith A Burrhus, Lars S Svanevik, and Jack H Wilmore. The effects of aerobic fitness on basal and resting metabolic rate, Am J C/in Nutr 1992; 55:795-801
15. Brett A. Dolezal AND Jeffry A. Pottiger, Concurrent resistance and endurance training influence basal metabolic rate in nondieting individuals. J Appl Physiol 85:695-700, 1998.
16. Douchi T, Yamamoto S, Oki T, Maruta K, Kuwahata R, Yamasaki H, et al. Difference in the effect of adi-posity on bone density between pre- and postmeno-pausal women. Maturitas 2000; 34: 261– 6
17. Stewart KJ, Deregis JR, Turner KL, Bacher AC, Sung J, Hees PS, et al. Fitness, fatness and activity as predictors of bone mineral density in older per-sons. J Intern Med 2002; 252:381– 8
18. Chilibeck PD, Davison KS, Whiting SJ, Suzuki Y, Janzen CL, Peloso P. The effect of strength training combined with bisphosphonate (etidronate) therapy on bone mineral, lean tissue, and fat mass in pos-tmenopausal women. Can J Physiol Pharm 2002; 80:941– 50.
19. Chen Z, Lohman TG, Stini WA, Ritenbaugh C, Aic-kin M. Fat or lean tissue mass: which one is the major determinant of bone mineral mass in healthy postmenopausal women? J Bone Miner Res 1997; 12:144–51
20. Reid IR, Evans MC, Ames RW. Volumetric bone den-sity of the lumbar spine is related to fat tissue mass but not lean tissue mass in normal postmenopausal women. Osteoporos Int 1994; 4:362-7
21. Ijuin M, Douchi T, Matsuo T, Yamamoto S, Uto H, Nagata Difference in the effects of body composition on bone mineral density between pre- and postmeno-pausal women. Maturitas 2002; 43:239– 44
22. Afghani A, Barrett-Connor E, Wooten WJ. Resting energy expenditure: a better marker than BMI for BMD in African-American women, Med Sci Sports Exerc 2005; 37:1203-10
23. Shields RK, Schlechte J, Dudley-Javoroski S, et al. Bone mineral density after spinal cord injury: a reli-able method for knee measurement. Arch Phys Med Rehabil 2005; 86:1969-73.
Corresponding Author Behrooz Imeri, Department of Physical Education, Banaras Hindu University, Varanasi, India, E-mail: [email protected]

Vers
ion fo
r revie
w
HealthMED - Volume 6 / Number 6 / 2012
Journal of Society for development in new net environment in B&H 1979
Abstract
Objectives: This study examined accidents at school among 6th, 7th and 8th grade students and their behaviors towards safety measures taken to prevent these accidents.
Methods: The study included a sample of 243 6th, 7th and 8th grade students attending Zafer Pri-mary School, İnönü Primary School, Kurtuluş Pri-mary School, Atatürk Primary School and Tevfik İleri Primary School in Ankara, Turkey. A 40-item survey was used to determine the behaviors of students towards safety measures taken to prevent school accidents.
Results: It was found that 38.7% of students had experienced at least one school accident du-ring the previous year, the great majority of which (79.8%) involved falls. The behaviors of students towards safety measures to prevent school acci-dents vary according to gender and whether the students had previously experienced an accident; behaviors in terms of accident prevention measu-res were more positive among students who had been in an accident during the previous year.
Conclusion: It was necessary that, take adequ-ate precautions to protect primary education stu-dents from school accidents and to regularly check the application of these measures
Key words: Primary education students, scho-ol accident, safety measure
Introduction
Accidents have a considerable impact on children’s health. Accidents upset the balance of children by affecting their health physically, psyc-hologically and socially. Accidents may lead to diseases, disabilities and even deaths, and place a heavy financial burden on family and society. Accidents, which are a result of misbehavior and
neglect, are incidents that people can avoid and protect themselves from1.
In comparison to other injuries, child injuries child injuries are common in countries like Tur-key, which have a young population2. Students in grades 6,7 and 8 are more frequently exposed to accidents during games and sports activities3. Incidents such as abrasion, dislocation, sprain, wound, bruise, ecchymosis, electric shock, poiso-ning, drowning, burns, and even death may occur as a result of such accidents. Following accidents, students may be unable to attend school, or to tem-porarily or permanently fulfill various functions4 .
Lack of student supervision by teachers, failure to control students in corridors and classrooms du-ring breaks, and reckless behaviors while entering or leaving classrooms may cause injuries. In addi-tion, misuse of electrical materials at school and lack of warnings and precautions about the use of these materials may also create certain dangers5.
Most student behaviors during the school day are observable and controllable behaviors. There-fore, information can be collected about accidents occurring within the school environment, and risks can be managed through potential protection mea-sures. In this respect, school accidents differ from other types of childhood injuries6. Prevention of sc-hool accidents that occur as a result of various fac-tors is an important topic. All efforts to prevent sc-hool accidents require collecting information about the space, time and frequency of these accidents3.
Personal protection measures that are imple-mented to prevent school accidents aim to enable children to adopt safe behaviors. To this end, such interventions can be made in every environment where the child is present. As these interventions aim to create a behavioral change, they should be long-term and they should be effective enough to achieve a behavioral change7. Therefore, this
Behaviors of students towards safety measures to prevent school accidents Hande Sahin1, Sibel Erkal2
1 Department of Family and Consumer Sciences Education , Gazi University, Faculty of Industrial Arts Education Sciences, Ankara, Turkey,2 Department of Family and Consumer Sciences, Hacettepe University Faculty of Economics and Administrative Sciences, Ankara, Turkey.
Vers
ion fo
r revie
w
1980
HealthMED - Volume 6 / Number 6 / 2012
Journal of Society for development in new net environment in B&H
study was planned and conducted in order to exa-mine the behaviors of primary education 6th, 7th and 8th grade students concerning safety measures used to prevent school accidents.
Methods
The study examined whether students had been involved in an accident in the previous year, acci-dent characteristics, and their behaviors towards safety measures adopted to prevent these acci-dents. The study universe comprised students attending primary schools in Ankara Province, Turkey. Cluster sampling was employed, taking five primary schools in Ankara as clusters. A total of 243 students attending 6th, 7th and 8th grades for-med the study sample. Participating students atten-ded Zafer Primary School (n=51), İnönü Primary School (n=30), Kurtuluş Primary School (n=52), Atatürk Primary School (n= 46), and Tevfik İleri Primary School (n=64).
A two-part survey was used for data collecti-on. The first part of the survey examined demo-graphic characteristics of students, accident status and accident characteristics (frequency accident, season, day, the space in which the accident occu-rred, cause of the accident, injury status, applicati-on place, accident type and outcome). The second part involves a 40-item questionnaire on students' behaviors towards safety measures implemented to prevent school accidents1.
The 40 questionnaire items used a 5-point Likert-type scale. Accordingly, the 23 positive items in the scale were graded as “Never=1”, “Rarely=2”, “So-metimes/Occasionally=3”, “Mostly/Usually=4” and “Always=5”; and the 17 negative items were graded as “Always=1”, “Mostly/Usually=2”, “Sometimes/Occasionally=3”, “Rarely=4”, and “Never=5”.
Data were analyzed via SPSS 14.01, and stu-dents’ accident status and the distribution of acci-dent characteristics were given by frequency and percentage values. Participants' perceptions of each questionnaire item were described by arithme-tic mean and standard deviation values as well as frequency and percentage distribution. The mean of the items making up the scale was calculated by re-verse-grading the negative items in the above-men-tioned grading system. The t test (for two groups) and analysis of variance (for three or more groups)
were employed for comparison of average scores from the behavior scale, according to students' characteristics. The Tukey test was used for paired comparison of groups in analysis of variance.
In the present study, confirmatory factor analysis was used to analyze questionnaire responses. It was found that the scale was collected under 4 factors with Eigenvalues higher than 1, expressing 72% of the total variance. The Bartlett test indicated that factor analysis is applicable (c2=2724.6; p<0.001). In addition, the calculated Kaiser-Meyer-Olkin va-lue (KMO=0.812) demonstrated that sample size was sufficiently large. Cronbach’s Alpha values of the reliability of the scale were 0.813 for the first factor (unsafe behaviors, comprising 15 items), 0.795 for the second factor (indoor safe behaviors, comprising 13 items), 0.762 for the third factor (outdoor safe behaviors, comprising 9 items), and 0.853 for the fourth factor (behaviors while riding the school shuttle, comprising 3 items). Cronbach’s Alpha value was 0.826 for the whole scale compri-sing a total of 40 items. Gür and Yıldız (2009) also determined 4 factors for this scale they developed, and they found an overall Cronbach’s Alpha value for the scale of 0.810.
Results
Results on Personal and Accident Characteristics of StudentsThe results showed that 54.7 % (f=133) of
study participants are female and 45.3 % (f=110) are male; 11.9 % are in the 6th grade (f=29), 57.2 % (f=139) in the 7th grade, and 30.8 % (f=75) in the 8th grade. Of students' fathers, 26.7 % (f=65) have an educational level of primary school or lower, 24.7 % (f=60) have a secondary school an education, 27.2 % (f=66) have a high school edu-cation, and 21.3 % (f=52) have a university educa-tion. Of students' mothers, 44.9 % (f=109) have an educational level of primary school or lower, 21 % (f=51) have a secondary school education, 23 % (f=56) have a high school education, and 11.1 % (f=27) have a university education. Of students included in the present study, 24.3 % (f=59) have a monthly family income of 750 TL or less, 48.1 % (f=117) have a monthly family income of 751-1500 TL, and 27.6 % (f=67) have a monthly fami-ly income of 1501 TL and higher.

Vers
ion fo
r revie
w
HealthMED - Volume 6 / Number 6 / 2012
Journal of Society for development in new net environment in B&H 1981
Findings about students’ accident status within the previous year and accident characteristics are presented in Table 1.
According to the findings in Table 1, of students forming the sample, 38.7 % (f=94) stated that they had at least one school accident during the previ-ous year, 61.3 % (f=149) stated that they had not had any school accident. Of the students having a school accident, 77.7 % had one accident, 14.9 % had two accidents, and 7.4 % had three accidents.
The distribution in Table 1 shows that there are higher proportions of school accidents during spring and winter seasons and on Tuesday and Wednesday in comparison to other times. Most accidents occu-rred within the classroom (31.9%) and in the garden (29.8%). A considerable proportion of accidents (44.7%) occurred as a result of restlessness.
Examining the distribution of accidents types, it is seen that a great majority of accidents at sc-hool (79.8%) involved a fall, 26.6 % of accidents resulted in an injury, 22.4 % resulted in bruising – swelling, and 55.3 % of students did not seek
assistance or treatment after the accident. It was determined that 90.4 % of students recovered completely, 7.4 % had temporary disabilities, and 2.1 % had permanent disabilities (Table 1).
Student Behaviors Towards Safety Measures to Prevent School AccidentsDescriptive/introductory statistics concerning
the behaviors of students towards safety measures to prevent school accidents are presented in Table 2.
According to the findings in Table 2, the most ne-gative behavior within the unsafe behaviors factor is “skiing in the school garden when it snows" (Χ=3.09). For this item, 25.10 % of students respon-ded ‘Always’, 16.46 % responded ‘Usually’, 16.46 % responded ‘Sometimes’, 8.23 % responded ‘Ra-rely’, and 33.74 % responded ‘Never’. Examining arithmetic mean values, it is seen that other negative behaviors of students within the unsafe behaviors factor are related to “use of the school garden when there is a density of vehicles in the garden" (Χ=3.44) and “going into the school running” (Χ=3.46). The
Table 1. Distribution of students according to accident status and accident characteristics Variable Group f % Variable Group f %
Accident Status Yes 94 38.7
Cause of Accident N:94
Recklessness 42 44.7No 149 61.3 Bantering 14 14.9
Frequency of Having Accident
N:94
Once 73 77.7 Pushing and fighting 15 15.9Twice 14 14.9 Running 8 8.6
3 times and more 7 7.4 Others (stairs, slippery ground etc..) 15 15.9
Season of Accident N:94
Spring 29 30.8
Injury TypeN:94
Fracture 5 5.3Summer 23 24.5 Dislocation 5 5.3Autumn 15 16.0 Injury 25 26.6Winter 27 28.7 Cut - Contusion 19 20.2
Day of Accident N:94
Monday 11 11.7 Bruising - swelling 21 22.4
Tuesday 28 29.8 Others (abrasion, split etc.) 19 20.2
Wednesday 26 27.6Application
PlaceN:94
Nowhere 52 55.3Thursday 17 18.1 Hospital 28 29.8
Friday 12 12.8 School’s doctor 7 7.4
Accident LocationN:94
Classroom 30 31.9 Teacher 7 7.4Garden 28 29.8
Outcome of Accident N:94
Complete recovery 85 90.4Corridor 18 19.1 Temporary disability 7 7.5
Stairs 10 10.6 Permanent disability 2 2.1Other (toilet,
gymnasium etc.) 8 8.6Type of
Accident N:94
Fall 75 79.8Cut 16 17.0
Others (poisoning, burn, drowning etc.) 3 3.2

Vers
ion fo
r revie
w
1982
HealthMED - Volume 6 / Number 6 / 2012
Journal of Society for development in new net environment in B&H
Table 2. Descriptive statistics concerning behaviors of students towards safety measures to prevent school accidents (n=243)
Fact
ors
Item
no.
Items/Expressions/Judgments Alw
ays
Usu
ally
/ Som
etim
es
Rar
ely
Nev
er
Χ s.d.
% % % % %
Uns
afe B
ehav
iors
1 I go into the school running 11.93 10.70 26.34 21.40 29.63 3.46 1.332 I go out of the school running 11.52 11.11 21.81 18.93 36.63 3.58 1.383 I go up the stairs running 9.88 15.64 19.75 21.81 32.92 3.52 1.354 I go down the stairs running 12.35 10.29 20.58 19.75 37.04 3.59 1.39
5 I try to enter locked places such as roof outlets and storage rooms as I get curious about these places 14.40 8.64 13.99 10.29 52.67 3.78 1.51
6 I hang out of open windows 14.81 14.81 6.58 9.47 54.32 3.74 1.577 I turn the corners of the school building fast 18.93 12.76 16.46 14.81 37.04 3.38 1.54
8 When I have sharp-edged materials in my hand (pencil, scissors etc.), I joke with my friends 13.58 7.82 10.29 10.70 57.61 3.91 1.49
9 My friends and I hustle 14.81 10.70 19.34 16.05 39.09 3.54 1.46
10 I deal with plugs and broken electrical devices or those with stripped cables 11.52 10.70 5.35 9.05 63.37 4.02 1.47
11 I enter the laboratory with food and beverage in my hand 16.87 8.23 9.05 11.93 53.91 3.79 1.5612 When it snows, I ski in the school garden 25.10 16.46 16.46 8.23 33.74 3.09 1.6113 I walk on the walls surrounding the school garden 16.05 17.28 9.05 9.05 48.56 3.57 1.5914 I leap over the walls surrounding the school garden 17.28 14.40 5.76 7.41 55.14 3.69 1.63
15 I use the school garden when there are vehicles in the garden (shuttles or other cars) 20.16 12.35 12.35 13.58 41.56 3.44 1.60
Indo
or S
afe B
ehav
iors
16 I take care of materials likely to cause accident in the corridor (Fire equipment, cabinet etc.) 64.20 14.40 7.00 3.70 10.70 4.18 1.34
17 I switch on the light if the area I am in is not well illuminated 60.08 15.23 16.05 4.12 4.53 4.22 1.14
18 I behave more carefully in the classroom area where hangers are situated. 59.67 16.87 13.17 5.76 4.53 4.21 1.15
19 I check the soundness of sharp-edged materials before using them. 62.96 15.64 11.11 4.94 5.35 4.26 1.17
20 I learn the proper usage of sharp-edged materials which I will use for the first time 60.49 17.70 12.35 3.29 6.17 4.23 1.17
21 I prefer to use blunt scissors 40.33 19.34 17.70 6.17 16.46 3.61 1.47
22 When I have sharp-edged materials in my hand (pencil, scissors etc.), I take care for not pricking them 64.61 20.16 6.58 2.88 5.76 4.35 1.11
23When I have sharp-edged materials in my hand (pencil, scissors etc.), I do not turn the point of them towards the
person with me 64.61 11.11 7.82 2.47 13.99 4.10 1.44
24 I read the effects of chemical substances in thelaboratories 48.56 20.16 13.17 3.70 14.40 3.85 1.43
25 I use the chemical substances under the control of a teacher 59.26 16.46 13.58 4.12 6.58 4.18 1.21
26 I work under the control of a teacher in rooms such as laboratory and craft room 60.08 13.58 13.58 6.17 6.58 4.14 1.25
27 I read usage rules and warning signs of craft rooms 62.14 14.40 9.88 5.76 7.82 4.17 1.28
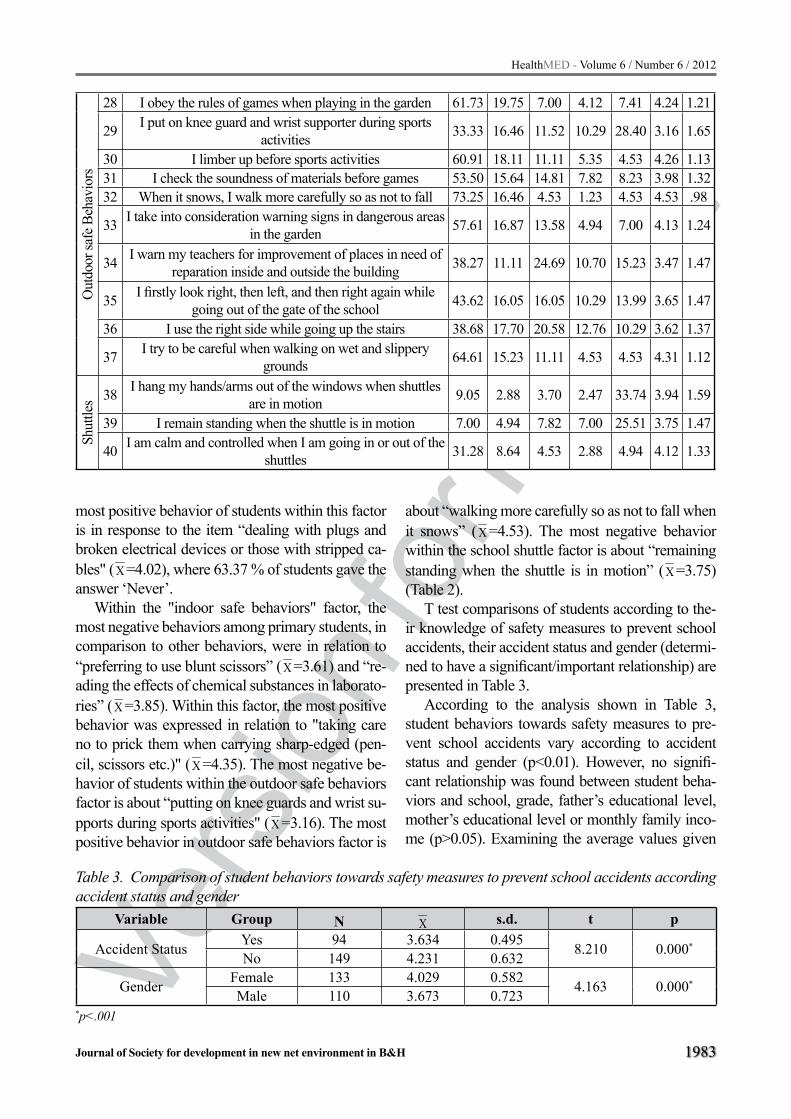
Vers
ion fo
r revie
w
HealthMED - Volume 6 / Number 6 / 2012
Journal of Society for development in new net environment in B&H 1983
most positive behavior of students within this factor is in response to the item “dealing with plugs and broken electrical devices or those with stripped ca-bles" (Χ=4.02), where 63.37 % of students gave the answer ‘Never’.
Within the "indoor safe behaviors" factor, the most negative behaviors among primary students, in comparison to other behaviors, were in relation to “preferring to use blunt scissors” (Χ=3.61) and “re-ading the effects of chemical substances in laborato-ries” (Χ=3.85). Within this factor, the most positive behavior was expressed in relation to "taking care no to prick them when carrying sharp-edged (pen-cil, scissors etc.)" (Χ=4.35). The most negative be-havior of students within the outdoor safe behaviors factor is about “putting on knee guards and wrist su-pports during sports activities" (Χ=3.16). The most positive behavior in outdoor safe behaviors factor is
Out
door
safe
Beh
avio
rs28 I obey the rules of games when playing in the garden 61.73 19.75 7.00 4.12 7.41 4.24 1.21
29 I put on knee guard and wrist supporter during sports activities 33.33 16.46 11.52 10.29 28.40 3.16 1.65
30 I limber up before sports activities 60.91 18.11 11.11 5.35 4.53 4.26 1.1331 I check the soundness of materials before games 53.50 15.64 14.81 7.82 8.23 3.98 1.3232 When it snows, I walk more carefully so as not to fall 73.25 16.46 4.53 1.23 4.53 4.53 .98
33 I take into consideration warning signs in dangerous areas in the garden 57.61 16.87 13.58 4.94 7.00 4.13 1.24
34 I warn my teachers for improvement of places in need of reparation inside and outside the building 38.27 11.11 24.69 10.70 15.23 3.47 1.47
35 I firstly look right, then left, and then right again while going out of the gate of the school 43.62 16.05 16.05 10.29 13.99 3.65 1.47
36 I use the right side while going up the stairs 38.68 17.70 20.58 12.76 10.29 3.62 1.37
37 I try to be careful when walking on wet and slippery grounds 64.61 15.23 11.11 4.53 4.53 4.31 1.12
Shut
tles 38 I hang my hands/arms out of the windows when shuttles
are in motion 9.05 2.88 3.70 2.47 33.74 3.94 1.59
39 I remain standing when the shuttle is in motion 7.00 4.94 7.82 7.00 25.51 3.75 1.47
40 I am calm and controlled when I am going in or out of the shuttles 31.28 8.64 4.53 2.88 4.94 4.12 1.33
about “walking more carefully so as not to fall when it snows” (Χ=4.53). The most negative behavior within the school shuttle factor is about “remaining standing when the shuttle is in motion” (Χ=3.75) (Table 2).
T test comparisons of students according to the-ir knowledge of safety measures to prevent school accidents, their accident status and gender (determi-ned to have a significant/important relationship) are presented in Table 3.
According to the analysis shown in Table 3, student behaviors towards safety measures to pre-vent school accidents vary according to accident status and gender (p<0.01). However, no signifi-cant relationship was found between student beha-viors and school, grade, father’s educational level, mother’s educational level or monthly family inco-me (p>0.05). Examining the average values given
Table 3. Comparison of student behaviors towards safety measures to prevent school accidents according accident status and gender
Variable Group N Χ s.d. t p
Accident Status Yes 94 3.634 0.495 8.210 0.000*
No 149 4.231 0.632
Gender Female 133 4.029 0.582 4.163 0.000*
Male 110 3.673 0.723*p<.001

Vers
ion fo
r revie
w
1984
HealthMED - Volume 6 / Number 6 / 2012
Journal of Society for development in new net environment in B&H
in Table 3, the behaviors of students who had at le-ast one accident within the previous year (Χ=3.634) are more negative in comparison to those of students who did not have any accident during this time pe-riod (Χ=4.231). In addition, the averages in Table 3 demonstrate that behaviors of female students towards accident prevention measures (Χ=4.029) are more positive compared to those of male stu-dents (Χ=3.673).
Discussion
Accidents frequently occur at schools, as stu-dents use these sites intensively and for long peri-ods4. According to the results of the present study, 38.7 % of students experienced at least an accident within the previous year. Ergüder (2004) stated that 59.8 % of students experienced an accident while at school, compared with 41.2 % reported by Eraslan (2007), 3.8% reported by Menchel and Laffamme, and 9.8% reported by Boyce et al. (1984) 3,4,8,9.
Of students having an accident, Erarslan’s study reported that 77.7 % had a school accident once and 14.9 % had school accidents twice. In previous stu-dies, 68.6 % of students in Erarslan’s study and 85.2 % of students in Ergüder’s study had at least one school accident3,4.
The proportion of students having an accident in spring is higher compared to other seasons. This may result from the increase in number of outdoor games and activities when the temperature starts to rise.
According to the present study, school accidents mostly occur within the classroom (31.9 %) and in the school garden (29.8 %). A considerable propor-tion (44.7 %) of accidents occur due to recklessne-ss. In the study by Ergüder (2004), most accidents occurred in the school garden (59.3 %), then in the classroom (26.0 %), and then on stairs (14.9 %).4 In the study by Feldman et al. (1983), the percentage of those who had an accident in the gymnasium is hi-gher.10 However, in Sosnowska and Kostka (2003), Maitra (1997) and Sheps and Evans (1987), most accidents occurred in the playground11-13. Boyce et al. (1984) reported that the lowest proportion of accidents occurred in the classroom.9 These diffe-rences may result from arrangements made to pre-vent accidents in the school surroundings and in the classrooms. In order to prevent accidents, necessary arrangements should be made, particularly in cla-
ssrooms, which is where the highest proportion of accidents is experienced.
A great majority of students in the present study (79.8 %) had an accident as a result of a fall. Di Sca-la et al. (1997) and Maitra (1997) also reported that a large proportion of accidents result from falls12,14.
Examining behaviors of students towards acci-dent prevention measures, the most negative be-havior was related to “skiing in the school garden when it snows”. It is seen that, in comparison to ot-her behaviors, more negative student behaviors are related to “use of the school garden when there is a density of vehicles in the garden" (Χ=3.44) and “go-ing into the school running” (Χ=3.46). This shows the need to prepare and conduct training programs to promote positive behavioral changes in the matter of preventing school accidents. Training about sc-hool accidents should prioritize topics in which stu-dents display most negative behaviors. Within the framework of this factor, the most positive behavior of students is about “dealing with plugs and broken electrical devices or those with stripped cables”.
Within the indoor safe behaviors factor, relatively negative behaviors are related to “preferring to use blunt scissors” (Χ=3.61) and “reading the effects of chemical substances in the laboratories” (Χ=3.85). Within this factor, the most positive behavior of stu-dents is “when they have sharp-edged materials in their hand (pencil, scissors etc.), they take care not to prick them" (Χ=4.35).
Within the outdoor safe behaviors factor, relati-vely negative behaviors were expressed in relation to “putting on knee guards and wrist supports during sports activities” (Χ=3.16). The most positive beha-vior within the outdoor safe behaviors factor was in relation to “walking more carefully so as not to fall when it snows" (Χ=4.53).
Within the school shuttle factor, the most negati-ve behavior is “remaining standing when the shuttle is in motion" (Χ=3.75). This result shows that stu-dents should be informed of the risks of such beha-vior, so as not to experience an accident while riding in the shuttle.
It was determined that student behaviors towar-ds accident prevention measures vary according to accident status and gender (p<0.01). Students who had at least one accident during the previous year (Χ=3.634) showed more negative behaviors than stu-

Vers
ion fo
r revie
w
HealthMED - Volume 6 / Number 6 / 2012
Journal of Society for development in new net environment in B&H 1985
dents who had no accident during this time period (Χ=4.231). This suggests that the tendency of some students towards risky behavior is an important fac-tor in the occurrence of school accidents.
Behaviors among female students towards safety accident prevention measures (Χ=4.029) are more positive than those of male students (Χ=3.673). In studies by Boyce and Sobolewski (1989), Di Scala, Stark et al. (1996), Feldman et al. (1983), Christo-foridis and Kambas (2007), Maitra (1997), Ergüder (2004), and Eraslan (2007), male students experi-enced more accidents compared to female students. These findings verify the judgment given3,4,10,12,14-17.
Conclusion
To sum up, the following results were obtained in this study of accident occurrence among 6th, 7th and 8th grade primary education students’ and their behaviors towards safety measures to prevent scho-ol accidents;
- More than half of the students stated that they have not had any accident at school during the previous year.
- Most accidents were related to falls. - Most accidents occurred in the classroom
and in the school garden. - A considerable proportion of accidents
occurred as a result of restlessness. - More accidents occurred during spring and
winter seasons than other times. - Students' behaviors towards accident
prevention measures vary according to their accident status and gender.
- Students who had at least one accident within the previous year showed more negative behaviors towards accident prevention measure compared to those students who have not had any accident.
In accordance with the findings of the present study; it can be recommended to
- Take adequate precautions to protect primary education students from school accidents and to regularly check the application of these measures,
- To regularly monitor accidents because there is no record of accidents at hospitals or schools; and, accordingly, to determine
the schools at which the largest proportion of accidents is experienced and to make necessary arrangements in these schools to prevent accidents, to ensure that areas such as corridors, classrooms, stairs, gardens, school entrances and laboratories, and objects such as desks, windows and radiator used in the building do not have features likely to cause accidents; and to give priority to safety arrangements within classrooms, as this is where most accidents occur,
- To give primary education students informa-tion about accidents and prevention measures within the scope of a separate course; accordingly, to provide them with positive behaviors about the causes of accidents and related prevention measures,
- To repeat similar studies on different samples throughout Turkey, to identify potential deficiencies and to initiate restructuring in this matter.
References
1. Gür K, Yıldız A. Öğrencilerin okul kazalarında güven-lik önlemlerine yönelik bilgi ve davranış ölçeklerinin geçerlik ve güvenirliği [Development of scales of pupils’ knowledge and attitude towards the security prevention against school accidents]Maltepe Üniver-sitesi Bilim ve Sanatı Dergisi 2009; 2(1):10-21.
2. Bombacı H, Ülkü K, Adıyeke L, Kara S, Görgeç M. Çocuk yaralanmaları, nedenleri ve önlemler [Chilho-od injuries, their etiologies and preventive measures] Acta Orthopedica Traumatologica Turcica 2008;42 (3):166-173.
3. Eraslan R. Bir ilköğretim okulu ikinci kademe öğrencilerinde okul kazası görülme sıklığının incele-nmesi [The incidance of accidents in an secondary school] Gazi Üniversitesi Sağlık Bilimleri Enstitüsü Yüksek Lisans Tezi, Ankara,2007; S12-53
4. Ergüder B. İlköğretim okullarında öğrencilerin uğradıkları kazaların incelenmesi[Investigation of accidents incurred by primary school students] H.Ü. Ev İdaresi ve Aile Ekonomisi Programı, Bilim Uzmanlığı Tezi, Ankara, 2004;S2-50
5. Taşdan M, Memduhoğlu HB. Okul ve öğrenci sağlığının korunmasına ilişkin kavramsal bir çözü-mleme [A conceptual analysis on the protection of the health of school and student] Milli Eğitim Dergisi 2008; 180:175-194.

Vers
ion fo
r revie
w
1986
HealthMED - Volume 6 / Number 6 / 2012
Journal of Society for development in new net environment in B&H
6. Long BAH, Schell K, Corrigan V. Youth safety educa-tion and ınjury prevention program. Pediatric Nur-sing 2001; Mar/ Apr, 27 (2):141-146.
7. Özcebe H. Yaralanma kontrol ve korunma programları ve güvenli toplumlar [Programs of injury control and prevention ve safe communities] Halk Sağlığı Temel Bilgiler, Ankara.2006
8. Menchel E, Laffamme L. Injuries to boys and girls in swedish schools different activities, different results? Scand J Public Health 2000; 28:132-136.
9. Boyce WT, Sprunger LW, Sobolewski S, Schaefer C. Epidemiology of injuries in a large, urban school dis-trict. Pediatrics 1984; 74:342–9
10. Feldman W, Woodward CA, Hodgson C, Harany Z, Milner R, Feldman E. Prospective study of school injuries: incidence, types, related factors and initial management. Can Med Assoc 1983; 129(15): 1279-1283.
11. Sosnowska S, Kostka T. Epidemiology of school accidents during a six school-yeaar period in one region in Poland. European J of Epidemiology 2003;18: 977-982.
12. Maitra A. School accidents to children: Time to Act. J Accid Emerg Med 1997; 14: 240-242.
13. Sheps SB, Evans GD. Epidemiology of school injuri-es. A 2 year experience in a municipal health depar-tmant. Pediatrics 1987; 79; 69-75.
14. Di Scala C, Gallagher S, Schneps SE. Causes and outcomes of pediatric injuries occurring at school. Journal of School Health 1997; 67 (9):384-389.
15. Boyce T, Sobolewski S. Recurrent injuries in scho-ol children. American journal of disease children 1989; 143:338-342.
16. Stark C, Wright J, Lee J. Two years of school injuries in a Scottish education sub-division. Public Health 1996;110:229-235.
17. Christoforidis C, Kambas A. Childhood injuries in Greek school environment. Intentional J of Injury Control and Safety Promotion 2007; 14 (4):262-263.
Corresponding Author Sibel Erkal, Department of Family and Consumer Sciences, Hacettepe University Faculty of Economics and Administrative Sciences, Ankara, Turkey, E-mail: [email protected]

Vers
ion fo
r revie
w
HealthMED - Volume 6 / Number 6 / 2012
Journal of Society for development in new net environment in B&H 1987
Abstract
Visfatin and resistin are highly expressed com-plex proteins with insulin-like functions. They are located predominantly in the visceral adipose tissue and have been linked to obesity and type-2 diabe-tes. The purpose of this study was to examine the effects of 12 weeks of combined exercise on the levels of visfatin, resistin, and metabolism-related hormones in a sample of Korean obese female co-llege students. The subjects were randomly assigned to the exercise (n = 7) and control (n = 9) groups. During the 12 weeks, the subjects in the combined exercise group were trained for 80 minutes per day for 3 days a week. The training regimen comprised the following 3 sessions: warm-up for 10 minutes, combined exercise for 60 minutes, and cool-down for 10 minutes. On the other hand, those in the con-trol group were asked to maintain their daily normal and sedentary activities. The intensity of aerobic exercise was 60–80% of heart rate reserve for 30 minutes and that of the resistance exercise was 10–15 repetition maximum for 30 minutes. Two-way repeated ANOVA was performed. No interaction effects (time Χ group) were observed on the levels of resistin, glucagon, and cortisol and the neurotran-smitter acetylcholine between exercise and control groups (p > 0.05). However, the interaction effects (time X group) on the levels of visfatin (p = 0.017) and insulin (p < 0.001) were observed. We conclude that in our sample of Korean obese female college students, 12 weeks of supervised combined exercise affected the levels of visfatin and insulin; however, it did not affect the levels of resistin and metaboli-sm-related hormones such as glucagon and cortisol and the neurotransmitter acetylcholine.
Key words: Visfatin, Resistin, Glucagon, In-sulin, Neurotransmitter acetylcholine, Cortisol, Obesity, College student
Introduction
Visfatin is a 52 kDa protein that was originally identified as pre-B-cell colony-enhancing factor (PBEF). It is secreted by both T and B lympho-cytes, and can serve as a cytokine in immune regu-latory action (1-3). Furthermore, visfatin is a highly expressed complex protein with insulin receptor-binding activity in visceral fat (4). A previous study indicated that plasma visfatin levels showed a strong positive correlation with fat mass but weak positive correlation with subcutaneous fat mass (4). However, because several other studies have shown that visfatin levels are not correlated to fat mass, these correlations are still controversial (5-7).
Resistin is a 12.5 kDa protein expressed and secreted by white adipose tissue; its expression is regulated by thiazolidinedione (TZD). Resistin is one of the cysteine-rich proteins that are also called resistin-like molecules (RELMs), and the term “resistin” was originally coined because this protein functions as a mediator of insulin resis-tance (8). Plasma resistin expression increases in obese and type-2 diabetes patients (9). Further-more, previous studies have shown that resistin and visfatin play important roles in the pathogen-esis of low-grade inflammation associated with metabolic syndrome, chronic inflammatory dis-eases, and autoimmune diseases (10-13). There-fore, high plasma visfatin and resistin levels are very important risk factors for chronic diseases, including obesity and type-2 diabetes.
Effects of 12 weeks of combined exercise on the levels of visfatin, resistin, and metabolism-related hormones in a sample of Korean obese female college studentsChang-Ho Ha1, Wi-Young So2
1 Department of Human Performance & Leisure Studies, North Carolina A&T State University, United States of America,2 Department of Human Movement Science, Seoul Women’s University, Seoul, Korea.

Vers
ion fo
r revie
w
1988
HealthMED - Volume 6 / Number 6 / 2012
Journal of Society for development in new net environment in B&H
Several studies have examined the changes in the expression levels of visfatin and resistin in response to exercise training (14-17). However, the potential association between exercise train-ing and the changes in visfatin and resistin levels related to obesity, type-2 diabetes, and cardiovas-cular diseases has not yet been established. More-over, only a few studies have examined changes in the levels of adipocytokines such as visfatin and resistin in response to combined exercise training (18). Therefore, the purpose of this study was to examine the effects of 12 weeks of combined ex-ercise, consisting of aerobic and resistance exer-cises, on visfatin and resistin levels in a sample of obese Korean female college students. In addition, to increase the qualitative value of our research, we determined the levels of metabolism-related hormones such as glucagon, insulin, and cortisol and the neurotransmitter acetylcholine, which can be used for indirect evaluation of obesity after 12 weeks of combined exercise training.
Methods
SubjectsThis study was approved and reviewed by the
Institutional Review Board of the Human Care and Use Committee of the Society of Sport Research In-stitute of Dongguk University, and written consent forms were obtained from all subjects. The subjects were scheduled to participate in the combined exer-cise training at the Dongguk University fitness cen-ter in Gyeong-Ju, Gyeongsangbuk-Do, Korea. The subjects were female college students aged 20–26 years, who did not exercise regularly, were not previ-ously diagnosed with abnormal glucose metabolism and other health problems, and had a body fat % of 30% which is more than 30% of the normal value.The subjects were randomly assigned to the control group (n=10) and the exercise group (n=10). How-ever, 3 subjects from the exercise group who did not regularly attend the exercise training and 1 subject from the control group who did not participate in the post-exercise assessment were excluded from the study. Thus, 7 subjects in the exercise group and 9 subjects in the control group completed the pre- and post-exercise assessments. The characteristics of the subjects are shown in Table 1.
Experimental proceduresDuring 12 weeks, the subjects in the combined
exercise group were trained 3 days per week for 80 minutes per day, and the training comprised the fol-lowing 3 sessions: warm-up for 10 minutes, com-bined exercise for 60 minutes, and cool-down for 10 minutes. On the other hand, the subjects in the control group were asked to maintain their daily normal and sedentary activities. All the variables—levels of visfatin, resistin, glucagon, insulin, and cortisol and the neurotransmitter acetylcholine—were measured 2 days before the beginning of this study and 2 days after the end of the study.
Visfatin, resistin, and metabolism-related hormones Visfatin and resistin concentrations were mea-
sured using an EIA reader (E-max precision, Mo-lecular device, USA). Glucagon and cortisol and the neurotransmitter acetylcholine concentrations were measured using a γ-counter (Cobra-5010 Quantum, Packard, USA). Insulin concentration was measured using modular analytics (E170, Roche, Germany).
Human Visfatin ELISA Kit (Biovision, USA), Human Resistin ELISA Kit (KOMED, Korea), double antibody glucagon (Siemens, USA), insulin (Roche, Germany), Coat-A-Count Cortisol Kit (Sie-mens, USA), and ACTH IRMA (Brahms, Germany) were used to determine the concentrations of visfa-tin (ng/mL), resistin (ng/mL), glucagon (pg/mL), insulin (IU/mL), and cortisol (ng/mL) and the neu-rotransmitter acetylcholine (nmol/L), respectively.
Exercise programDuring the 10-minute warm-up and cool-down
sessions of each training regimen, the subjects in the exercise group stretched their whole body. The subjects in the exercise group performed the main exercise for 60 minutes, which consisted of 30 minutes of treadmill running at an intensity of 60–80% of their heart rate reserve (HRR), followed by 30 minutes of resistance training that included 3 sets of 10–15 repetition maximum of leg presses, leg curls, chest presses, lat pull-downs, shoulder presses, bicep curls, and sit-ups. Exercise intensity was monitored during the training sessions using a real-time system (Polar-S610, Finland).

Vers
ion fo
r revie
w
HealthMED - Volume 6 / Number 6 / 2012
Journal of Society for development in new net environment in B&H 1989
Statistical analysisAll the results of this study are presented as av-
erage and standard deviation values. Independent t-tests were performed to examine differences in baseline characteristics of the subjects between the 2 groups. Two-way repeated analysis of vari-ance (ANOVA) was used to evaluate significant changes in the dependent variables after the com-bined exercise training, as compared to before the exercise in the exercise group. Further, these changes were compared to those observed in the control group. Statistical significance was set at p < 0.05, and all analyses were performed using SPSS ver. 18.0 (SPSS, Chicago, IL, USA).
Results
The differences in the characteristics of the sub-jects between the groups at the baseline were insig-nificant (p > 0.05) as shown in Table 1. The changes in the levels of visfatin, resistin, glucagon, insulin,
and cortisol and the neurotransmitter acetylcholine after 12 weeks of combined exercise training are shown in Table 2. Interaction effects (time Χ group) on resistin (p = 0.459), glucagon (p = 0.126), and cortisol (p = 0.377) and the neurotransmitter ace-tylcholine (p = 0.434) were not observed between exercise and control groups. However, interaction effects (time X group) on visfatin (p = 0.017) and insulin (p < 0.001) were observed.
Discussion
This study focused on the effectiveness of 12 weeks of combined aerobic and resistance exerci-se training on potential changes in the levels of vis-fatin, resistin, glucagon, insulin, and cortisol, and the neurotransmitter acetylcholine. A significant decrease was observed in the levels of visfatin and insulin; however, no significant improvement was observed in the levels of resistin, glucagon, and cortisol, and the neurotransmitter acetylcholine.
Table 1. Characteristics of the subjects (Mean ± SD)Variables Exercise group (n = 7) Control group (n = 9) T pAge, years 21.14 ± 1.57 20.78 ± 1.99 0.410 0.688Height, cm 163.43 ± 7.30 160.33 ± 5.45 0.973 0.347Weight, kg 67.07 ± 11.49 62.36 ± 7.60 0.989 0.340BMI, kg/m2 25.97 ± 2.73 25.18 ± 1.63 0.718 0.484
WHR, % 0.82 ± 0.04 0.80 ± 0.04 1.088 0.295Body Fat, % 34.57 ± 2.51 32.76 ± 1.57 1.780 0.097
BMI; Body Mass Index, WHR; Waist Hip RatioTested by independent t-test
Table 2. The changes in the levels of visfatin, resistin, and metabolism-related hormones after 12 weeks of combined exercise training
Categories Exercise Pre-exercise Post-exerciseInteraction (Group X Time)
F p
Visfatin, ng/mL Control 2.05 ± 0.63 2.78 ± 1.66 7.285 0.017*Combined 2.90 ± 1.84 1.51 ± 0.70
Resistin, ng/mL Control 7.73 ± 2.34 5.81 ± 2.33 0.579 0.459Combined 6.30 ± 2.59 3.99 ± 2.03
Glucagon, pg/mL Control 63.81 ± 12.79 67.94 ± 12.32 2.640 0.126Combined 51.74 ± 10.51 46.67 ± 7.12
Insulin, IU/mL Control 6.88 ± 3.75 8.34 ± 1.71 17.834 <0.001***Combined 10.50 ± 3.50 5.23 ± 2.91
Cortisol, ng/mL Control 8.97 ± 2.77 12.52 ± 3.18 0.834 0.377Combined 10.89 ± 2.50 16.17 ± 1.92Neurotransmitter
acetylcholine, nmol/LControl 16.50 ± 8.34 20.79 ± 16.93 0.650 0.434Combined 26.33 ± 15.99 23.19 ± 8.97
* p<0.05; *** p<0.001; Tested by two way repeated analysis of variance

Vers
ion fo
r revie
w
1990
HealthMED - Volume 6 / Number 6 / 2012
Journal of Society for development in new net environment in B&H
Fukuhara et al. (2005) reported that plasma vis-fatin levels were strongly associated with obesity and visceral fat (r = 0.68, p < 0.001) as determined by computed tomography (CT) (4). Furthermore, Lee et al. (2010) reported that exercise training decreased plasma visfatin levels in obese adoles-cents (17). On the other hand, Berndt et al. (2005) reported that they did not observe any significant relationship between visfatin levels and the visce-ral adipose tissue as assessed by CT (10). Further-more, Ghanbari-Niaki et al. (2010) reported that plasma visfatin levels increased after exercise. Whether exercise training increases or decreases plasma visfatin levels remains controversial (19).
The result of our study shows that combined exercise training decreased plasma visfatin levels in obese college students. The precise underlying mechanisms are unclear. However, the mechanism by which combined exercise training brings about a decrease in plasma visfatin levels can be expla-ined. We believe that combined exercise training reduces body weight, percent body fat, and the waist-hip ratio leading to a consequent decrease in plasma visfatin levels (20). Commonly, aerobic exercise training improves insulin resistance and sensitivity (21) and so does resistance exercise tra-ining (22). Furthermore, on the basis of the results of this study, we suggest that combined exercise training also improved insulin concentration. Re-gular exercise training including combined exerci-se might improve the ability of insulin to stimulate translocation of glucose transporter 4 (GLUT 4) to the muscle membrane after exercise (23).
However, in our study, the levels of resistin, the metabolism-related hormones glucagon and corti-sol, and the neurotransmitter acetylcholine were not affected by the combined exercise training. Adoles-cence and youth are periods in which psychological changes and rapid physical growth occur, culmi-nating in sexual maturity (24). We thought that we were unable to detect the affected metabolism-rela-ted hormones, because the rates of metabolism, fat oxidation, and substrate oxidation during youth are higher than those during adulthood (25). However, well-designed studies focusing on the young popu-lation are required for evaluating the effectiveness of combined exercise training.
Our study has 2 major limitations. First, becau-se only female students were recruited from 1 uni-
versity at Gyeong-Ju, Gyeongsangbuk-Do, Korea, this study sample did not represent the entire Kore-an college student population. Second, the sample size of this study was small (n = 16). However, this study has an advantage in that it focused on the yo-ung obese youth population, in contrast to previous studies that focused on middle-aged or older adults.
Conclusions
We conclude that 12 weeks of supervised combined exercise affected the levels of visfatin and insulin. However, it did not affect the levels of resistin and the metabolism-related hormones glucagon and cortisol and the neurotransmitter acetylcholine in our sample of Korean obese fe-male college students.
Acknowledgement
This work was supported by a research grant from Seoul Women's University (2012)
References
1. Rongvaux A, Shea RJ, Mulks MH, Gigot D, Urbain J, Leo O, Andris F (2002). Pre-B-cell colony-enhancing factor, whose expression is up-regulated in activated lymphocytes, is a nicotinamide phosphoribosyltran-sferase, a cytosolic enzyme involved in NAD biosynt-hesis. Eur J Immunol, 32: 3225-3234.
2. Samal B, Sun Y, Stearns G, Xie C, Suggs S, McNie-ce I (1994). Cloning and characterization of cDNA encoding a novel human pre-B-cell colony-enhancing factor. Mol Cell Biol, 14: 1431-1437.
3. Sonoli SS, Shivprasad S, Prasad CV, Patil AB, Desai PB, Somannavar MS (2011). Visfatin--a review. Eur Rev Med Pharmacol Sci, 15 (1): 9-14.
4. Fukuhara A, Matsuda M, Nishizawa M, Segawa K, Tanaka M, Kishimoto K, Matsuki Y, Murakami M, Ic-hisaka T, Murakami H, Watanabe E, Takagi T, Akiyos-hi M, Ohtsubo T, Kihara S, Yamashita S, Makishima M, Funahashi T, Yamanaka S, Hiramatsu R, Matsuza-wa Y, Shimomura I (2005). Visfatin: a protein secreted by visceral fat that mimics the effects of insulin. Scien-ce. 307 (5708): 426-430.
5. Chen MP, Chung FM, Chang DM, Tsai JC, Huang HF, Shin SJ, Lee YJ (2006). Elevated plasma level of visfatin/pre-B cell colony-enhancing factor in patients with type 2 diabetes mellitus. J Clin Endocrinol Me-tab. 91 (1): 295-299.

Vers
ion fo
r revie
w
HealthMED - Volume 6 / Number 6 / 2012
Journal of Society for development in new net environment in B&H 1991
6. Manco M, Fernandez-Real JM, Equitani F, Vendrell J, Valera Mora ME, Nanni G, Tondolo V, Calvani M, Ricart W, Castagneto M, Mingrone G (2007). Effect of massive weight loss on inflammatory adipocytoki-nes and the innate immune system in morbidly obese women. J Clin Endocrinol Metab. 92 (2): 483-490.
7. Pagano C, Pilon C, Olivieri M, Mason P, Fabris R, Serra R, Milan G, Rossato M, Federspil G, Vettor R (2006). Reduced plasma visfatin/pre-B cell colony-enhancing factor in obesity is not related to insulin resistance in humans. J Clin Endocrinol Metab. 91 (8): 3165-3170.
8. Stofkova A (2010). Resistin and visfatin: regulators of insulin sensitivity, inflammation and immunity. Endo-cr Regul, 44 (1): 25-36.
9. Antuna-Puente B, Feve B, Fellahi S, Bastard JP (2008). Adipokines: the missing link between insulin resistance and obesity. Diabetes Metab. 34 (1): 2-11.
10. Berndt J, Klöting N, Kralisch S, Kovacs P, Fassha-uer M, Schön MR, Stumvoll M, Blüher M (2005). Plasma visfatin concentrations and fat depot-speci-fic mRNA expression in humans. Diabetes, 54 (10): 2911-2916.
11. Straburzyńska-Lupa A, Nowak A, Pilaczyńska-Szc-ześniak Ł, Straburzyńska-Migaj E, Romanowski W, Karolkiewicz J, Sliwicka E (2010). Visfatin, resistin, hsCRP and insulin resistance in relation to abdomi-nal obesity in women with rheumatoid arthritis. Clin Exp Rheumatol, 28 (1): 19-24.
12. Varma V, Yao-Borengasser A, Rasouli N, Bodles AM, Phanavanh B, Lee MJ, Starks T, Kern LM, Spencer III HJ, McGehee Jr RE, Fied SK, Kern PA (2007). Human vifatin expression: relationship to insulin sensitivity, intramyocellular lipid and inflammation. J Clin Endoclinol Metab, 92: 666-672.
13. Emina Nakas-Icindic, Amina Valjevac, Asija Zacira-gic (2008). Adipokines and Acute Coronary Syndro-me. HealthMED, 2 (4): 225-233.
14. Choi KM, Kim JH, Cho GJ, Baik SH, Park HS, Kim SM (2007). Effect of exercise training on plasma vis-fatin and eotaxin levels. Eur J Endocrinol, 157 (4): 437-442.
15. Jamurtas AZ, Theocharis V, Koukoulis G, Stakias N, Fatouros IG, Kouretas D, Koutedakis Y (2006). The effects of acute exercise on serum adiponectin and re-sistin levels and their relation to insulin sensitivity in overweight males. Eur J Appl Physiol, 97 (1): 122-126.
16. Kadoglou NP, Perrea D, Iliadis F, Angelopoulou N, Liapis C, Alevizos M (2007). Exercise reduces resi-stin and inflammatory cytokines in patients with type 2 diabetes. Diabetes Care, 30 (3): 719-721.
17. Lee KJ, Shin YA, Lee KY, Jun TW, Song W (2010). Aerobic exercise training-induced decrease in plasma visfatin and insulin resistance in obese female adoles-cents. Int J Sport Nutr Exerc Metab, 20 (4): 275-281.
18. Jorge ML, de Oliveira VN, Resende NM, Paraiso LF, Calixto A, Diniz AL, Resende ES, Ropelle ER, Carvalheira JB, Espindola FS, Jorge PT, Gelone-ze B (2011). The effects of aerobic, resistance, and combined exercise on metabolic control, inflamma-tory markers, adipocytokines, and muscle insulin signaling in patients with type 2 diabetes mellitus. Metabolism, (9): 1244-1252.
19. Ghanbari-Niaki A, Saghebjoo M, Soltani R, Kirwan JP (2010). Plasma visfatin is increased after high-intensity exercise. Ann Nutr Metab. 57 (1): 3-8.
20. Seo DI, So WY, Ha S, Yoo EJ, Kim D, Harshvardhan, Fahs CA, Rossow L, Bemben DA, Bemben MG, Kim E (2011). Effects of 12 weeks of combined exercise training on visfatin and metabolic syndrome factors in obese middle-aged women. Journal of Sports Sci-ence and Medicine. 10 (1): 222-226.
21. van der Heijden GJ, Wang ZJ, Chu ZD, Sauer PJ, Haymond MW, Rodriguez LM, Sunehag AL (2010). A 12-week aerobic exercise program reduces hepa-tic fat accumulation and insulin resistance in obese, Hispanic adolescents. Obesity (Silver Spring). 18 (2): 384-390.
22. Misra A, Alappan NK, Vikram NK, Goel K, Gupta N, Mittal K, Bhatt S, Luthra K (2008). Effect of super-vised progressive resistance-exercise training proto-col on insulin sensitivity, glycemia, lipids, and body composition in Asian Indians with type 2 diabetes. Diabetes Care. 31 (7): 1282-1287.
23. Frøsig C, Richter EA (2009). Improved insulin sen-sitivity after exercise: focus on insulin signaling. Obesity (Silver Spring). 17 (Suppl 3): S15-20.
24. Christie D, Viner R (2005). Adolescent development. BMJ. 330 (7486), 301-304.
25. St-Onge MP, Gallagher D (2010). Body composition changes with aging: the cause or the result of alte-rations in metabolic rate and macronutrient oxidati-on? Nutrition. 26 (2): 152-155.
Corresponding Author Wi-Young So, Department of Human Movement Science, Seoul Women's University, Nowon-Gu, Seoul, Korea, E-mail: [email protected]

Vers
ion fo
r revie
w
1992
HealthMED - Volume 6 / Number 6 / 2012
Journal of Society for development in new net environment in B&H
Abstract
Most developing countries are disaster prone. The history of developing countries shows many fatal disasters which have caused hundreds of tho-usands of deaths and hundreds of billions of dollars economic loss. During and after disasters hospitals play the main role of giving health services to pe-ople, so they should have their own planning and preparedness to present their services on time and without any interruption. This research aims to sur-vey the preparedness scale of 9 hospitals at Shiraz University of Medical Science in disasters in Iran. The research is based on the literature review and questionnaire. These questionnaires were comple-ted by managers and personnel. The data were gat-hered and analyzed by SPSS. The result shows that about 50 percent of hospitals had an education plan for disasters. The majority of hospitals did not have a crisis management committee. Building structu-res, installations and maintenance in fifty percent of hospitals were resistant against disasters.
Key words: Disaster, Preparedness, Hospital, Iran
Introduction
Disaster is a serious disruption of the func-tions of a society, causing widespread human, material, or environmental losses which exceed the ability of the affected society to cope using only its own resources. (Kent Randolph, 2008). The various types of disasters experienced by mankind can be divided into two categories: Natural and Manmade. Natural disasters such as earthquake, Tornado, flood, etc, and Man made disasters include environment pollution; pest in-fection, wars, transport incidents, nuclear weap-on and these days terrorism. During the past cen-tury, natural disasters have dramatically effected
population. Statistics indicate that during the de-cades of the 1990s and 2000s alone, over 4 mil-lion people lost their lives and some 90 million people were affected by the adverse impacts of natural disasters (IDNDR, 2005).
Disaster preparedness involves forecasting and taking precautionary measures prior to an immi-nent threat, when advance warnings are possible. Preparedness planning improves the response to the effects of a disaster by organizing the delivery of timely and effective rescue, relief and assistance. Preparedness involves the development and regu-lar testing of warning systems (which are linked to forecasting systems) and plans for evacuation or other measures to be taken during a disaster alert period to minimize potential loss of life and physical damage. It also involves the education and training of officials, the population at risk, and in-tervention teams, and the establishment of policies, standards, organizational arrangements and opera-tional plans to be applied following a disaster. Ef-fective plans also consider securing resources, pos-sibly including stockpiling supplies and earmarking funds. These plans must be supported by enabling legislation. (Kent, Randolph. 2004). In developing countries, while planning in preparedness increas-es effectiveness and efficiency of response, there are some plans which exist solely on the paper and most of the time there has been no drill.
Disasters in Iran
Statistics reveal that Iran, in comparison with other countries in the world, is severely prone to natural disasters. For example, Iran is ranked fourth in the number of lives lost due to earthquakes in the twentieth century, following China, Japan, and Italy. Historical data suggests the occurrence of a major earthquake every 2-3 years in the country. In the 20th century alone, 20 major earthquakes
Survey of disaster preparedness of hospitals at Shiraz University of Medical science, IranSeyed Habibollah Kavari1, Hossein Mobaraki2
1 Management Rehabilitation Department University of Social Welfare & Rehabilitation (USWR), Iran,2 Rehabilitation Management Department, Tehran University of Medical Sciences (TUMS), Tehran, Iran.

Vers
ion fo
r revie
w
HealthMED - Volume 6 / Number 6 / 2012
Journal of Society for development in new net environment in B&H 1993
claimed more than 140,000 lives, destroyed several villages and cities and caused extensive economic damage to Iran. Prior to the recent Bam earthquake, which killed more than 30,000 people, more than 200 people were killed in the Qazvin earthquake (June 2002), more than 2500 people died in an earthquake in eastern Iran and North-western Iran (1997), about 40,000 persons lost their lives in Iran’s worst recorded earthquake affecting the Cas-pian areas of Gilan and Zanjan in 1990 (UN, 2004).
List of destructive earthquakes in Iran since 1972 is as follow:1972 April 10th - Iran, Southern Region around
Ghir Karzin: 7.1 magnitude earthquake with struck an area within a radius of more than 250 miles; 5,400 people died.
1977 March 22nd - Iran, South-eastern Coastal Region around the town of Bandar Abbas: magnitude 7 earthquake; 167 people died.
1977 April 6th – Iran, Isfahan Province: 6.5 earthquake; more than 350 people died.
1977 December 21st - Iran, Kerman Province, town of Zarand: earthquake Measuring 6.2 on the Richter scale; more than 500 people died.
1978 September 16th - Iran, Tabas: earthquake measuring between 7.5 and 7.9 on the Richter scale destroyed the town and many other villages; 15,000 people died.
1979 January 16th - Iran, Khorasan Province: earthquake measuring 7.0; 200 people died.
1979 November 14th - Iran, Eastern Region, Khorasan Province: 5.6 magnitudes Earth-quake struck a string of villages between Qaen and Khaf; about 400 people died.
1981 June 11th – Iran, town of Golbaf: magnitude 6.8 earthquake 800 km (500 miles) Southeast of Tehran; the town was destroyed; more than 1,000 people died.
1990 June 21st - Iran, Caspian Regions of Gilan and Zanjan: 7.7 earthquakes caused the worst recorded disaster in the country's history: 35,000 people died and up to 100,000 were injured; some 500,000 were left homeless.
1997 February 28th - Iran, North-western Region: magnitude 5.5 earthquake; about 1,000 people died.
1997 May 10th - Iran, Eastern Region near the Afghan border: 7.1 earthquakes hit the rural area; more than 1,500 people died.
2002 June 22nd –Iran, Northern Region, and Qazvin Province: An earthquake measuring 6.3 razed dozens of villages; more than 200 people died.
2003 December 26th – Iran, Bam: An earthquake measuring 6.3 on the Richter scale Struck the historic city 1,000 km (600 miles) southeast of Tehran. Initial estimates suggested up to 10,000 deaths and more than 10,000 injured.
Earthquakes in Iran has claimed many lives and imposed a lot of damages and economical lost. Out of the 153 most catastrophic earthquakes in the world, 17.6% occurred in Iran, 15.7% in China, and 7.1% in Japan. But while economic losses from major earthquakes during 1979–1992 constituted 1.5% and 2.0% of GNP in China (Tang Shang) and the United States (Loma Prieta), re-spectively, losses were 7.2% in the case of Iran (Manjil), which further indicates the vulnerabil-ity of the country to natural disasters, especially earthquakes (Coburn and Spence 2006).
On the other hand human made damages have added to our problem in Iran which can create ma-jor Crisis. For example in the city of Tehran alone, some 7,000 tons of solid waste are produced daily, management of which is by no means efficient. And as far as air pollution is concerned, Tehran is believed to be one of the most polluted cities in the world, and the situation is not very different in other big cities in the country. It is estimated that some two tons of lead enter the air in Tehran daily through fossil fuel consumption by motor vehicles. All these factors have created a critical environmental situation in the country far below accepted standards and sustainable conditions (Bahraini, 2003).
Considering our culture and annual loss bil-lions of dollars due to damage in natural and manmade disasters and claiming many lives, psy-chological and economical problems caused by the aftermath of disasters, we need a very strong disaster management which cover all aspects of mitigation, preparedness, response and recovery (Seyedin, 2005).Based on an old proverb in Iran; prevent better than treatment, mitigation and pre-paredness should be the most important principles in disaster management system of Iran.

Vers
ion fo
r revie
w
1994
HealthMED - Volume 6 / Number 6 / 2012
Journal of Society for development in new net environment in B&H
Health services and hospitals
Every community has some coping resources to deal with accidents and emergencies. Coping resources are individuals and community skills, materials, equipment or services that can be used to meet the demands created by an incident. The health care sector forms an important part of this, from the self-administered treatments available at a pharmacy or a walk-in clinic, through the Emer-gency Medical Services and hospital emergency departments, to the special care provided by burn wards or other tertiary services (Manitoba, 2006).
Hospitals have their own special situation in disasters because;
- Hospitals give emergency services to patients and survivors in disasters and to save their lives quality, quantity and timing services are very important.
- There are many different groups of people in hospitals. Patients in different ages, from babies and children to old patients. All of them are very vulnerable in disasters. On the other hand, the service of some key personnel such as doctors and nurses are vital for casualties and survivors.
- There are many very expensive instruments and equipments such as MRI, CTSCAN and so on.
This information shows the importance and priority of preparedness in hospitals.
Methodology and objectives
This research is a cross-sectional and descriptive study which surveyed the preparedness situation of educational hospitals including Namazi, Faghihi, Chamran, Hafez, Khalili, Dastgheib, Ebne Sina, Zeinabie and Azzahra. These hospitals are depend-ant to Shiraz University of Medical Science. This research addressed 6 fundamental objectives:
1 determine if there is an educational plan against disasters
2 determine if there is a plan and guidelines for help, rescue and facilities regard to emergency services
3 determine if there is a committee of crisis management
4 determine if there is fire fighting system 5 determine if there is an appropriate
evacuation plan 6 determine how resist are building structures
and maintenance against disasters
The research began with a literature review on different subjects relevant to the research. After the literature review a questionnaire was prepared and sent to 27 managers and maintenance person-nel in all of 9 hospitals. The questionnaire had two parts: personal information and a check list to evaluate the preparedness of hospitals. After the collection of questionnaires, all of the information gathered and analysed by SPSS software.
Results and Discussion
Education: the most important thing in disas-ter preparedness is education. It is a major part of reducing vulnerability to different hazards in dif-ferent countries. Education may take the follow-ing forms:
- Public education, include information about actions which should be taken in case of a disaster threat or occurrence. Special training courses,
- Workshops should be designed for an adult population, either specifically or as an extra dimension of on-going programs, such as literacy or cooperative training sites. Public information, although television, radio and the printed media will never replace the impact of direct instruction, sensitively designed and projected messages can provide a useful supplement to the overall process (Kent Randolph, 2004).
In the research society, 44.4 percent of manag-ers e.g. board managers and different executive managers in hospitals had passed crisis manage-ment course and another 55.6 percent did not have such essential information. Personnel in opera-tional level should know how to deal with disas-ters to avoid any disorder. 77.8 percent of person-nel had attended the related education classes, but 22.2 percent did not receive any information about how to manage the crisis. About evacuation of hospitals in disasters, just 50 percent of hospitals

Vers
ion fo
r revie
w
HealthMED - Volume 6 / Number 6 / 2012
Journal of Society for development in new net environment in B&H 1995
educated the nursing staff some skill to evacuate patients properly. To improve public information, 55.6 percent of hospitals prepared some pam-phlets. All personnel knew how to use fire fighting capsules (table 1).
Maintenance, planning and committees
Every hospital needs a major incident com-mittee to decide policies, duties of other parts of hospital and prepare plans against disasters. The responsibility of this committee is based on the disaster management cycle including mitigation, preparedness, response and recovery; also some times there is a safety officer responsible for sa-fety affaires in hospitals. In the research society, just 11.1 percent of hospitals had major incident committees and in 89.9 percent of hospitals this committee was not active. 44.4 percent of hospi-tals had employed safety officer. In the majority of hospitals, staff knew their duty during disaster (72.2) and in 27.9 percent of hospitals, their task in the crisis was not clear (table 2).
When a disaster occurs, personnel, patients and their relatives need to know ways to go out from the hospital very fast, without any confusion. In 38.9 percent of hospitals, there were some signs to show emergency exit, but in 66.1 percent there was no guidance and signs. The majority of per-sonnel knew the emergency exit and just 16.7 per-cent didn’t know anything about the exits.
Evacuation of patients and personnel in disa-sters is a main consideration of hospitals which without preparedness would be a very difficult job, so hospitals need to prepare a comprehensive plan. Although 33.1% had a comprehensive plan, in 66.7 percent of hospitals there were no plan. To clear beds, 61.1 percent of hospitals had a plan to discharge patients during disaster, while 33.3 per-cent had no plan (table 3).
Sometimes in disasters, power, gas and water because another disaster and sometimes horrific explosions, so it is necessary to cut the power, gas and water automatically. In 33.3 percent of hos-pitals, there is a system which automatically cut the utilities.66.6 percent of hospitals do not have this system. The smoker alarm notifies people fire before it causes major problems. Just 22.2 percent of hospitals had the smoker alarm. All of the fire capsules were installed well and in 77.8 percent of hospitals was checked every two months regularly (table 4).
Emergency supplies for use in the A&E depar-tment are kept in the A&E Major Incident storero-om. Also stored in this room are sets of full protec-tive clothing and equipment for use by a Medical Incident Officer and Mobile Medical Team. In research society just 38.9 percent of hospital had provided supplies and equipments (tables 5, 6).
Table 1. Education plan for personnel in disasters at Shiraz university hospital in 2008Response Criteria
No YesTotal
Percent Abundance Percent Abundance Education classes 2/22 4 8/77 14 18Pamphlets and files 4/44 8 6/55 10 18
Education for speed evacuation 50 9 50 9 18 Using capsules 0 0 100 18 18First aids signs 1/61 11 9/38 7 18
Exit signs and tableau 1/61 11 9/38 7 18 Emergency exits 7/16 3 3/83 15 18
Table 2. Major incident committee and safety officer at Shiraz university hospitals in 2008Response
CriteriaNo response No Yes
Total Percent Abundance Percent Abundance Percent Abundance
Safety officer 0 0 6/55 10 4/44 8 18 Major incident committee 6/5 1 3/83 15 1/11 2 18

Vers
ion fo
r revie
w
1996
HealthMED - Volume 6 / Number 6 / 2012
Journal of Society for development in new net environment in B&H
Table 3. Compiled plan of hospital evacuation in disasters at Shiraz university hospitals in 2008 Response
CriteriaNo response No Yes
Total Percent Abundance Percent Abundance Percent Abundance
Evacuation instruction 0 0 66/7 12 33/3 6 18Discharge plan 0 0 38/9 7 61/1 11 18
Free space for evacuation 5/6 1 5/6 1 88/9 16 18Existance of departments for
Rescue 0 0 44 8 56 10 18
Easy access to wards 33/3 6 16/7 3 50 9 18 Expertise physician for
evacuation 0 0 66/7 12 33/3 6 18
Preparedness of related physicians 44/4 8 16/7 3 38/9 7 18
Table 4. Fire fighting systems in Shiraz university hospitals in 2008Response
Criteria No Yes
TotalPercent Abundance Percent Abundance
Automatic fire alarm 77/8 14 22/2 4 18 Appropriate installation and enough fire
fighting capsules 0 0 100 18 18
Capsule using instructions 27/8 5 72/2 13 18 Easy telephone access to fire fighters 16/7 3 83/3 15 18 Regular assessment of equipment and
capsules 0 0 100 18 18
Valid expire date of capsules 0 0 100 18 18
Table 5. Existing compiled instructions, equipment and facilities needed in disasters in Shiraz university hospitals in 2008
ResponseCriteria
No YesTotal
Percent Abundance Percent Abundance Comprehensive major incident plan 27/8 5 72/2 13 18
Defined responsibility of every group in disaster 27/8 5 72/2 13 18
Easy access to necessary Instruments and equipments 11/1 2 88/9 16 18
Initial needs estimation in disaster 61/1 11 38/9 7 18 Fire fighting centres 33/3 6 66/7 12 18
Easy access to drinkable water 16/7 3 83/3 15 18Real bed statistics 0 0 100 18 18
Appropriate care for babies, mothers and pregnant women 33/3 6 66/7 12 18
Vaccination preparedness 16/7 3 83/3 15 18Lift and escalators access 72 13 28 5 18
Automatic power, water and gas cut 66/7 12 33/3 6 18Smoking barring 72 13 28 5 18Free telephones 55/6 10 44/4 8 18

Vers
ion fo
r revie
w
HealthMED - Volume 6 / Number 6 / 2012
Journal of Society for development in new net environment in B&H 1997
Conclusion
Iran is a very disaster prone among countries in the world.The history of Iran shows many fatal disasters which have caused tens of thousands of deaths and tens of billions dollars economic loss. During these disasters medical associations espe-cially hospitals, play the main role of giving health services to people. Giving these vital services on time without preparedness and planning is not so straightforward. Hospitals need to mitigate the hazards threaten by natural and manmade disas-ters (internal or external) and prepare themselves to respond well in these disasters.
Table 6. Building structure and installations in Shiraz university hospitals in 2008Response
CriteriaNo response No Yes
Total Percent Abundance Percent Abundance Percent Abundance
Technical assessment before earthquake 11/1 1 33/3 3 55/6 5 9
Technical assessment before fire 0 0 33/3 3 66/7 6 9Compilation of directions and rules 11/1 1 22/2 2 66/7 6 9
Safety measures 0 0 22/2 2 77/8 7 9Recognition of fire sensitive places 0 0 22/2 2 77/8 7 9
Different types of fire fighting capsules 0 0 0 0 100 9 9
Appropriate installation of capsules 0 0 0 0 100 9 9Automatic equipment 0 0 88/9 8 11/1 1 9
Ert system 0 0 0 0 100 9 9Fire fighting instrument in
rubbish rooms 44/4 4 22/2 2 33/3 3 9
Waste and flammable gases 0 0 0 0 100 9 9Special warehouse for fire
sensitive materials 0 0 66/7 6 33/3 3 9
Appropriate temperature in ware houses 44/4 4 11/1 1 44/4 4 9
Fire resistance walls 33/3 3 55/6 5 11/1 1 9Fire boxes and capsules 0 0 0 0 100 9 9
Regular assessment of fire fighting capsules 0 0 22/2 2 77/8 7 9
Smoker alarm in laboratory 0 0 77/8 7 22/2 2 9Being the standard containers 1/11 1 11/1 1 77/8 7 9
Appropriate ventilation 0 0 11/1 1 88/9 8 9Standard power equipment 0 0 11/1 1 88/9 8 9
Regular assessment of instruments and equipment 0 0 11/1 1 88/9 8 9
References
1. Bahrainy, Hossein. Natural disaster management plan of Iran: A proposed new structure. 2000. Te-hran, Iran (in Persian)., United Nations Develo-pment Programme, and Ministry of Interior of Iran. Ref Type: Report
2. Bahrainy, Hossein and A Akhoundi. Reconstructi-on Management of the Disasteraffected Areas: The Experience of Reconstruction of Housing in the Ear-thquake Affected Areas of the Guilan and Zanjan Pro-vinces. Tehran,Iran: Univ. of Tehran, 2000.
3. Bahrainy, Hossein. "Natural Disaster Management in Iran during the 1990s—Need for a New Structu-re." Urban planning & development 129.3 (2008): 140-60.

Vers
ion fo
r revie
w
1998
HealthMED - Volume 6 / Number 6 / 2012
Journal of Society for development in new net environment in B&H
4. Coburn, A and R Spence. Earthquake Protection. Chichester,UK: Wiley, 2006.
5. Coburn, A, Spence, R. R. J, and Pomonis, A. Disaster Mitigation,Training Programme. 2004. Cambridge, UK, DHA. Ref Type: Report
6. DMTP. Contingency Planning. UN, 2006, 1-59.
7. Ghafory, Ashtiany. "Disaster management." Disaster Prevention and Management 8.1 (2007): 6.
8. Iranian Studies Group at MIT. Earthquake Manage-ment in Iran. 1-6-2007. Ref Type: Unpublished Work
9. Kent, Randolph. Disaster Preparedness. UNDP, DHA, Disaster Management Training Programme, 2004.
10. Manitoba Health. Disaster Management Model For Health Sector. 11-21-2006. Government of Manitoba. Ref Type: Report
11. Ryan.James, et al. Conflict and Catastrophe Medi-cine, a Practical Guide. London: Springer, 2007, 27-45.
12. Seyedin.Seyed Hesam. "Iranian Disaster Manage-ment System--Needs to Eliminate Weakness and Pro-blems"., 2005 Leeds, UK: 13th Multi-disciplinary Iranian Researchers Conference in Europe, 2005.
13. UNITED NATIONS. Bam Earthquake of 26 Decem-ber 2003,Islamic Republic of Iran Relief, Recovery and Immediate Rehabilitation. 7. 2004. Ref Type: Report
14. United Nations Centre for Regional Development. "International Decade for Natural Disaster Relief (IDNDR) ''Disaster Management in Metropolitan Areas for the 21st Century"., November 1, 1993 Na-goya, Japan: 1993.
Corresponding Author Hossein Mobaraki, Rehabilitation Management Department, Faculty member of Rehabilitation, Tehran University of Medical Sciences (TUMS), Consultant of Deputy Minister & General Director
of Human Resources And Supportive Office Project Manager of Setting HRH National Documents,
Tehran, Iran, E-mails: [email protected], [email protected]

Vers
ion fo
r revie
w
HealthMED - Volume 6 / Number 6 / 2012
Journal of Society for development in new net environment in B&H 1999
Abstract
Objective: An earthquake of 6.0 on the Richter Scale hit the village of Başyurt in Elazığ Province, Eastern Turkey on March 8, 2010. The epicenter was between Başyurt and Kovancılar.
Methods: We reviewed retrospectively all the injuries related to the earthquake using the medi-cal records. We recorded patients’ demographic data, their complaints, injury types and outcomes.
Results: During the study period, 74 patients pre-sented to our emergency unit with injuries related to the earthquake. The mean age of these patients was 38.6 years (age range 0-110) and 39 of them were female. The most frequent injury occurrences were observed in the extremities (48.7%). 28 (%38.8) patients were trapped under debris. A total of 137 patients were injured and 42 patients died. Approxi-mately 74 patients were transferred to the hospital within the first 24 hours after the incident. The rate of hospitalization was reported as 55% (74/41 patients).
Conclusion: In conclusion, rescue teams and me-dical teams should be prepared and buildings should be constructed in accordance with earthquake regula-tions. Patients should receive proper fluid treatment.
Key words: Emergency unit, earthquake, epi-demiolgy
Introduction
Earthquakes represent one of the natural disasters resulting in frequent fatalities and disabilities both in the world and in Turkey. Among all other natural di-sasters such as flood, volcanic eruption, avalanche, hurricane, and drought, earthquakes account for the most fatal, damaging and hazardous disasters (1).
In the last century, approximately 100.000 fa-talities occurred due to earthquakes in our country (2). Every year, more than 500.000 earthquakes are witnessed in the world.[3] For the last 30 years, 21 earthquakes on average have been observed per year in which more than 10 fatalities and over 100 injured people resulted. This number is gradu-ally increasing each year. Within the last 25 years, more than 530.000 fatalities related to earthquakes were recorded in the world (3, 4).
A 6.0 magnitude earthquake measured on the Richter Scale had occurred in the village of Başyurt, Elazığ Province, Eastern Turkey on Mar-ch 8, 2010 at 04:32 a.m. The earthquake affected 30.000 people in 343 residential areas, in which 42 died and 137 were injured.
This study is designed to review and present the number of patients presenting to our emergency units, examine injuries related to the earthquake, evaluate the relationship between the injuries and mortality and morbidity rates, and lastly present our data, and thereby to increase the awareness of specific aspects of earthquakes. Moreover, in our study, we also aimed to present scientific data of this particular earthquake.
Methods
The study was conducted in the three hospitals of our region where patients were admitted due to the earthquake injuries. For the study design, an “Earthquake Research Survey” form was prepa-red. After reviewing patient files, all injured pati-ents presenting to the three hospitals in the region due to the earthquake were recorded retrospecti-vely on the related forms.
Elazığ Başyurt Earthquake: Experiences on the EarthquakeMustafa Yildiz1, Mehtap Gurger2, Mustafa Sahan2, Umut Gulacti3, Tamer Gundogdu4, Mehmet Nuri Bozdemir5, Sukru Gurbuz1, Mehmet Ayranci1, Mehmet Cagri Goktekin1
1 Department of Emergency Medicine, School of Medicine, Firat University, Elazig, Turkey, 2 Department of Emergency Medicine, Elazıg Training and Research Hospital, Elazig, Turkey,3 Department of Emergency Medicine, Harput State Hospital, Elazıg, Turkey,4 Department of Emergency Medicine, Kovancılar State Hospital, Elazıg, Turkey,5 Department of Emergency Medicine, Antalya Training and Research Hospital, Antalya, Turkey.

Vers
ion fo
r revie
w
2000
HealthMED - Volume 6 / Number 6 / 2012
Journal of Society for development in new net environment in B&H
Parameters such as patients’ ages, sex, exposure to debris, the duration of being trapped under de-bris, the time when they presented to the hospitals, their complaints, diagnosis and treatment procedu-res, injured parts, the amount of fluid, the existence of crush syndrome, the length of stay in the emer-gency unit, and outcomes (hospitalization, dischar-ge, exitus etc.) were recorded on the forms.
Data were loading to SPSS 15.0 program and frequencies and means were then determinationed.
Results
A total of 74 patients, of whom 39 (52.7%) were female, presented to our emergency unit due to the earthquake injuries. The mean age of the pa-tients was 38.65±24.33 years (age range: 0-110). The average time of presenting to the hospital was 394.36±188.16 minutes (168-978). The score of all patients on the Glascow Coma Scale at the time of their presentation was 15. The number of pati-ents trapped under the debris was 28 (37.8%) and the average length of stay under the debris was 49.29±77.93 (5-250) minutes.
The patients’ complaints on their admission (Fi-gure 1) were most frequently general body pain in 22 (29.7%) of them, followed by head trauma in 11 (14.9%). Extremity trauma was observed in 36 (48.7%) of the patients, soft tissue trauma was seen in 34 (45.9%) and head trauma in 23 (31%) of the pa-tients by physical examination (Table 1). When the number of injured body parts were examined, it was determined that there were 34 (45.9%) patients with one injured part; whereas 21 (28.4%) patients had two injured parts in their bodies. 46 patients received direct radiography, ultrasonography was performed on 38 and a Doppler examination on one patient.
52 (70.3%) patients received fluid treatment between 500 and 1500 ml, with an average amount of 694.23±311.5 ml. Myoglobinuria was observed in five patients. Analgesia was performed on 43.2% of the patients, alkaline diuresis was done in two of them and one received emergency surgical interven-tion. No cases of compartment syndrome, Adult res-piratory distres syndrome, organ loss were observed in this cohort. Fasciotomy, amputation, intubation and chest tube were not performed on any of the pa-tients. Four patients had crush syndrome and, one of them died on the 38th day of hospital stay.
Figure 1. Complaints of patients who presented due to the earthquake
Table 1. Injury causes of patients who presented due to the earthquake
Number of cases (n)
Percentage (%)
Extremity trauma 36 48,7Soft tissue trauma 34 45,9Head trauma 23 31,1Abdominal trauma 9 12,2Pelvic trauma 8 10,8Chest trauma 7 9,5Spinal trauma 6 8,1
Figure 2. Clinics where patients were transferred after their admission due to the earthquake
While three (4.1%) of the patients were tran-sferred to another health care center, 41 (55.4%) patients were hospitalized. Two patients left the emergency unit on their requests. The length of pa-tient stays in emergency units was determined as

Vers
ion fo
r revie
w
HealthMED - Volume 6 / Number 6 / 2012
Journal of Society for development in new net environment in B&H 2001
90.04±68.09 minutes. As a result, 28 (37.8%) pati-ents were discharged. The clinics where most of the hospitalization occurred were orthopedic (18.9%) and general surgery (9.5%) clinics (Figure 2). Only one patient required intensive care treatment after hospitalization. The average length of hospitalizati-on was found to be 6.83±8.59 (1-38) days.
Discussion
Among natural disasters, most commonly earth-quakes lead to fatalities and injuries.[2, 5] In the 14 fatal earthquakes which have struck our country be-tween 1995 and 2004, in total 18644 people died (6).
Crush syndrome is an important medical condi-tion and a common problem that occurs as a result of injuries in earthquakes (7-9). In a study con-ducted on the Marmara earthquake in which there were more than 17.000 fatalities and 43.000 in-jured, crush syndrome was seen in 639 cases. 477 of these patients were treated by renal replacement therapy. 9% of them received dialysis support and 97 of them died. The median duration of the pa-tients being trapped under the debris was found longer in that study (11.7 hours) (10).
During the initial modalities of patients in the emergency unit with a prognosis of crush injuries, in cases where patients can crystalloid solutions, mannitol and alkaline diuresis were used (9, 11). Consequently, mortality rates in crush injuries are found to be high (1, 5, 10, 12). In our study, given that the number of severe injuries was less, only one case resulted in mortality which was associat-ed with crush syndrome since it was immediately intervened with proper treatment protocols.
A well-planned search-and-rescue team serves as an answer in an earthquake in decreasing mor-tality (13). Providing immediate medical support particularly within the first hours following the earthquake acts as one of the factors that increase the possibility of survival. It has long been the case where organized local volunteers and medical staff are incorporated in speeding the interventions in earthquakes. These kinds of organizations have ensured early intervention in various earthquakes, especially for the victims under debris (9, 14-17). In our province, the first intervention following the earthquake was done within the first hours of the earthquake and local volunteers, followed right
away by search-and-rescue teams, saved all the in-jured from the debris within the first few hours.
Fluid treatment should immediately be pro-vided to the patients who are saved from the earthquake. As an initial fluid, hypertonic saline is primarily suggested. Hypertonic saline is sug-gested due to its reliable and effective outcomes, even in traumas including children (9, 14, 18, 19). Analgesia and sedation treatment is recommended in patients with pain and in minor surgical inter-ventions (9, 19). In our case, we used fluid and analgesic treatment in most of the injured patients presented to our emergency unit.
The 6.0-magnitude earthquake which occurred in the center of the Province Sultandağı in 2002 was at the same magnitude with the Elazığ earthquake. In this earthquake, it was reported that 39 people died, 325 were injured in total, the rate of patients’ admission was 9.2% and orthopedic was the most common clinic where admissions were highly seen (2). In our findings, while the mortality number was similar to the one in this earthquake, our admission rate was much higher. Orthopedic clinic was also the most common clinic where patients were admit-ted in our study. In both earthquakes, in a similar way, crush injuries were observed rarely. Hous-ing types in residential areas where earthquakes hit were similarly one-story house designs that were not properly constructed to endure earthquakes.
The most commonly injured organs in earth-quakes are extremities, followed substantially by thoracic and abdominal traumas (1, 3, 5, 8-10, 17, 20). In the literature, there exist some publications where the most frequently observed injuries in earthquakes are listed as crush and abdominal inju-ries (11). The admission rates of patients are high and the most common clinic where patients are ad-mitted is orthopedic (1, 5, 11). The sudden collapse of buildings during an earthquake that leads directly to early trauma generally accounts for fatalities in an earthquake and the fatality rate is measured at around 80%. Being trapped under debris is one of the risk factors for fatality. The severity of injuries observed in patients trapped under debris rather than the duration of staying under debris is very impor-tant in terms of prognosis (10). There are also some publications claiming the opposite (11). Individual, seismic and structural factors are of great importance in severity of injuries and fatalities in earthquakes.

Vers
ion fo
r revie
w
2002
HealthMED - Volume 6 / Number 6 / 2012
Journal of Society for development in new net environment in B&H
Prevention and preparation efforts prior to an earthquake are also significant (14, 21, 22). Mor-talities frequently occur due to crush injuries and abdominal traumas (1, 11). There also exists some studies which indicate that during the long period after the earthquakes, cardiac and other chronic diseases also count for morbidity and mortality reasons (23, 24).
In conclusion, in cases of earthquakes, we should be prepared with medical support, ready for intervention and construct proper buildings according to Earthquake Regulations. We also believe that fluid treatment should be timely and properly provided to the patients who are saved from the earthquake. Moreover, we also aimed to present the data related to the Elazığ Başyurt Earthquake with this particular study.
References
1. Bulut M, Fedakar R, Akkose S et al. Medical experi-ence of a university hospital in Turkey after the 1999 Marmara earthquake. Emerg Med J 2005; 22: 494-498.
2. Akbulut G, Yilmaz S, Polat C et al. [Afyon sultandagi earthquake]. Ulus Travma Acil Cerrahi Derg 2003; 9: 189-193.
3. Sami F, Ali F, Zaidi SH et al. The October 2005 earth-quake in Northern Pakistan: patterns of injuries in victims brought to the Emergency Relief Hospital, Doraha, Mansehra. Prehosp Disaster Med 2009; 24: 535-539.
4. Ramirez M, Peek-Asa C. Epidemiology of traumatic injuries from earthquakes. Epidemiol Rev 2005; 27: 47-55.
5. Bulut M, Turanoglu G, Armagan E et al. [The analy-sis of traumatized patients who were admitted to the Uludag University Medical School Hospital after the Marmara earthquake]. Ulus Travma Derg 2001; 7: 262-266.
6. Bogazici University, Kandilli Observatory and earth-quake Research Institute available from: http://www.koeri.boun.edu.tr/sismo/default.htm. Accessed at 14/08/2011
7. Shimazu T, Yoshioka T, Nakata Y et al. Fluid resusci-tation and systemic complications in crush syndrome: 14 Hanshin-Awaji earthquake patients. J Trauma 1997; 42: 641-646.
8. Oda J, Tanaka H, Yoshioka T et al. Analysis of 372 patients with Crush syndrome caused by the Hanshin-Awaji earthquake. J Trauma 1997; 42: 470-476.
9. Yasin MA, Malik SA, Nasreen G, Safdar CA. Expe-rience with mass casualties in a subcontinent earth-quake. Ulus Travma Derg 2009; 15: 487-492.
10. Sever MS, Erek E, Vanholder R et al. Lessons lear-ned from the Marmara disaster: Time period under the rubble. Crit Care Med 2002; 30: 2443-2449.
11. Kurt N, Kucuk HF, Celik G et al. Evaluation of pati-ents wounded in the 17 August 1999 Marmara ear-thquake. Ulus Travma Derg 2001; 7: 49-51.
12. Kuwagata Y, Oda J, Tanaka H et al. Analysis of 2,702 traumatized patients in the 1995 Hanshin-Awaji ear-thquake. J Trauma 1997; 43: 427-432.
13. Mulvey JM, Awan SU, Qadri AA, Maqsood MA. Profile of injuries arising from the 2005 Kashmir earthquake: the first 72 h. Injury 2008; 39: 554-560.
14. Schultz CH, Koenig KL, Noji EK. A medical disaster response to reduce immediate mortality after an ear-thquake. N Engl J Med 1996; 334: 438-444.
15. Pretto EA, Angus DC, Abrams JI et al. An analysis of prehospital mortality in an earthquake. Disaster Reanimatology Study Group. Prehosp Disaster Med 1994; 9: 107-117.
16. Liang NJ, Shih YT, Shih FY et al. Disaster epidemi-ology and medical response in the Chi-Chi earthqu-ake in Taiwan. Ann Emerg Med 2001; 38: 549-555.
17. Emami MJ, Tavakoli AR, Alemzadeh H et al. Strategi-es in evaluation and management of Bam earthquake victims. Prehosp Disaster Med 2005; 20: 327-330.
18. Younes RN, Aun F, Accioly CQ et al. Hypertonic solutions in the treatment of hypovolemic shock: a prospective, randomized study in patients admitted to the emergency room. Surgery 1992; 111: 380-385.
19. 19. Peleg K, Kreiss Y, Ash N, Lipsky AM. Optimi-zing medical response to large-scale disasters: the ad hoc collaborative health care system. Ann Surg 2011; 253: 421-423.
20. Tanaka H, Oda J, Iwai A et al. Morbidity and mor-tality of hospitalized patients after the 1995 Han-shin-Awaji earthquake. Am J Emerg Med 1999; 17: 186-191.
21. Peek-Asa C, Ramirez M, Seligson H, Shoaf K. Seismic, structural, and individual factors associated with ear-thquake related injury. Inj Prev 2003; 9: 62-66.
22. Chou YJ, Huang N, Lee CH et al. Who is at risk of death in an earthquake? Am J Epidemiol 2004; 160: 688-695.
23. Armenian HK, Melkonian AK, Hovanesian AP. Long term mortality and morbidity related to degree of da-mage following the 1998 earthquake in Armenia. Am J Epidemiol 1998; 148: 1077-1084.
24. Trevisan M, Jossa F, Farinaro E et al. Earthquake and coronary heart disease risk factors: a longitudi-nal study. Am J Epidemiol 1992; 135: 632-637.
Corresponding Author Mustafa Yildiz, Department of Emergency Medicine, School of Medicine Firat University, Elazig, Turkey, E-mail: [email protected]

Vers
ion fo
r revie
w
HealthMED - Volume 6 / Number 6 / 2012
Journal of Society for development in new net environment in B&H 2003
Abstract
The current study used a rat model of asth-ma with depressive-like behaviors to exami-ne the changes of proinflammatory cytokines interleukin-1β (IL-1β) and interleukin-6 (IL-6) in the model and the effects of the combination therapy of dexamethasone and fluoxetine on the cytokines. Asthma increased the expression of IL-1β and IL-6(P < 0.05), their levels got even hi-gher when exposed to chronic unpredictable mild stress (CUMS). Treated with dexamethasone and fluoxetine, levels of IL-1β and IL-6 in the rats with asthma and depressive-like behaviors decreased. These data suggest that IL-1β and IL-6 are in-volved in asthma with depressive-like behaviors; dexamethasone combined with fluoxetine has a therapeutic effect on asthma with depressive-like behaviors by decreasing levels of IL-1β and IL-6.
Key words: effect, asthma, depressive-like be-haviors, interleukin-1β, interleukin-6, dexametha-sone, fluoxetine
Introduction
Asthma is a respiratory disease characteri-zed by increased inflammatory cells infiltration into the airways and poor respiratory function, varying from a very mild disorder to a life-threa-tening condition. A high frequency of depression is found in asthmatic patients in some studies.1,2,3 Asthma and depression have a complex reciprocal relationship, more asthma symptoms can lead to worse psychological outcomes, and more depre-ssive conditions can lead to worse asthma outco-
mes. The mechanism of their relationship remains unknown. Studies show that IL-1β and IL-6 res-pectively play important roles in depression and in asthma.4-7 But to our knowledge, how the levels of IL-1β and IL-6 change in asthma with depression has not been evaluated, and whether the the com-bination therapy of anti-asthma and anti-depressi-on affects the expression of IL-1β and IL-6 has not been reported. The goals of the current study were to evaluate the changes of IL-1β and IL-6 in a rat model of asthma with depressive-like behaviors and the effect of the combination therapy of dexa-methasone and fluoxetine on the cytokines.
Materials and methods
AnimalsThirty-eight male Wistar rats (180-220 g)
(Shandong university, China) were used in this study. Rats were initially housed five per cage and were maintained in a 12 h:12 h light/dark cycle (lights on at 7:30 a.m.). The study was approved by the Ethics Committee for Animal Experimen-tation of Weifang Medical University for and was performed according to international guidelines on the use of laboratory animals.
Animal model
Sensitization and allergen challenge: Rats were randomly divided into four groups:
group 1 (control group, n=9), group 2 (asthma group, n=9), group 3 (asthma with depressive-like behaviors group, n=10), group 4 (treatment
Effects of Combination Therapy of Dexamethasone and Fluoxetine on Levels of Interleukin-1β and Interleukin-6 in a Rat Model of Asthma with Depressive-like BehaviorsChengde Li1, Shumei Mao1, Yuliang Wang2, Hongwei Sun3 1 Department of Pharmacology, Key laboratory of applied Pharmacology of Shandong Province, Weifang Medical University, Weifang, Shandong Province, P.R. China,2 Department of physiology, Weifang Medical University, Weifang, Shandong Province, P.R. China,3 Department of Applied Psychology, Weifang Medical University, Weifang, Shandong Province, P.R. China.
Vers
ion fo
r revie
w
2004
HealthMED - Volume 6 / Number 6 / 2012
Journal of Society for development in new net environment in B&H
group, n=10). Rats in group 2, group 3 and group 4 were sensitized by intraperitoneal injection of 100 mg ovalbumin (OVA) ( Sigma Chemicals) emulsified in 200 mg of aluminium hydroxide in a total volume of 2 ml NS. Two weeks later, they were exposed to an aerosol of 1% OVA in NS for 20 min using an Ultrasonic nebulizer. The acute airway challenge phase consisted of once daily exposure for a total of 28 days followed by the chronic phase, which consisted of once exposure every 5 days till the end of the experiment. Con-trol rats were sensitized and challenged with NS. We used the OVA sensitization and challenge to create asthma in rats.
Chronic unpredictable mild stress (CUMS):CUMS has been reported to provide an effec-
tive equivalent to the precipitation of depression by CUMS, in which the behavior and mood of rats are modeled by the behavior changes during the open field and sucrose consumption tests.8,9 Af-ter the acute OVA challenge phase, rats in group 3 and group 4 were individually housed and un-derwent a CUMS procedure. The CUMS proce-dure was slightly modified from Willner P et al 9 lasted for 28 consecutive days and consisted of one stressor (in random order) per day. Briefly, rats were exposed to different stressors, namely, 48 h food deprivation, 48 h water deprivation, 5 min cold swimming (at 4 oC), 5 min exposure to a hot room (45 oC), 2 h periods of intermittent white noise (75 dB), 1 min tail pinch, physically restraint for 1 h, 24 h of cage tilt, 24 h wet cage, overnight illumination and so on. Rats in group 1 and group 2 were left undisturbed.
TreatmentAfter the generation of the rat model of asthma
with depressive-like behaviors, rats in group 4 were daily given intraperitoneal injection of anti-asthma drug dexamethasone (2 mg/kg) and anti-depression drug fluoxetine (10 mg/kg) orally for 14 consecutive days.
Sucrose solution consumption testThe procedure contained training and testing
courses. During the training course, two bottles of 1% sucrose solution were given to each rat, 24 h later; one bottle was replaced with a bottle of tap
water for 24 h to train the rats to consume 1% su-crose solution. After the training, each animal was presented simultaneously with a bottle of 1% su-crose solution and a bottle of tap water for 1 hour, following a 23 h water deprivation. The sucrose preference test was performed before CUMS, af-ter CUMS and after treatment.
Open-field testOpen-field test was carried out after every su-
crose preference test. A special black wooden arena (100cm×100cm×40 cm) which had 25 same sectors with white lines on the ground was used. Each rat was placed individually into the center of the arena and allowed to explore freely for 5 min, during which period their activity was recorded by a video camera to observe their horizontal move-ments and vertical movements. 8,9 Before each trial, the arena was cleaned thoroughly with 0.1% acetic acid solution.
Differential inflammatory cells counts in BALFTwenty-four hours after the last OVA chal-
lenge, animals were sacrificed under deep chloral hydrate anesthesia, bronchoalveolar lavage fluid (BALF) was obtained from the right lung using 3 ml NS. Lavage was performed 3 times in each rat and the total volume of fluid was collected. The lavage fluid was centrifuged, cells were stained with Wright–Giemsa stain, and numbers of total leukocytes, eosinophils, lymphocytes and mac-rophages were differentially counted under light microscope.
Measurement of levels of IL-β and IL-6Blood was colleted from the carotid artery with
EDTA syringes and centrifuged to get plasma. The levels of IL-1β and IL-6 in plasma and in BALF were measured using ELISA, according to the manufacturer's instructions (the ELISA kits were purchased from R&D Systems, USA).
Statistical analysisSPSS version 11.5 was used. Data were ex-
pressed as mean ± SD. The one-way ANOVA fol-lowed by Students-Newman- Keuls (SNK) test was used to determine significant differences between groups. Statistical significance was set at P < 0.05.

Vers
ion fo
r revie
w
HealthMED - Volume 6 / Number 6 / 2012
Journal of Society for development in new net environment in B&H 2005
Results
Sucrose solution consumption assessmentsTable 1 shows the consumption of total liquid
and sucrose solution on the day before CUMS, the day after CUMS and the day after treatment. Total liquid consumption did not differ between groups on all the three different timepoints (P > 0.05). On the day before CUMS, rats in all groups had similar sucrose solution consumption (P > 0.05). Howe-ver, a significant reduction can be seen in sucrose solution consumption in the CUMS- exposed rats (group 3 and group 4) as compared to group 1 and group 2 after CUMS (P < 0.05). And after the tre-atment, the sucrose solution consumption of group 4 significantly increased as compared to group 3 (P < 0.05). The data demonstrated that depressive behavior got better with the treatment.
Open-field assessmentsTable 2 shows the numbers of horizontal and ver-
tical movements of rats. On the day before CUMS, both the numbers of horizontal and vertical move-ments did not differ between groups (P>0.05). The 4-week CUMS exposure significantly reduced the numbers of horizontal and vertical movements of group 3 and group 4 as compared to group 1 and group 2 (P<0.05). The treatment significantly in-
creased the numbers of horizontal and vertical movements of group 4 as compared to group 3 (P<0.05). The data also demonstrated that depre-ssive behavior got better with the treatment.
BALF cells assessmentsAs shown in table 3, both OVA challenge (gro-
up 2) and OVA challenge plus CUMS exposure (group 3) induced significantly greater numbers of macrophages, eosinophils and lymphocytes than NS challenge (group 1) (P<0.05). What is more, there were more eosinophils in group 3 than group 2 (P<0.05); though there were more total leuko-cytes, macrophages and lymphocytes in group 3 than group 2, the difference was not statistically significant (P>0.05). Treatment of dexametha-sone and fluoxetine (group 4) could significantly reduce the numbers of total leukocytes, macrop-hages, eosinophils and lymphocytes in BALF as compared to group 3 (P<0.05).
Proinflammatory cytokines assessments As shown in table 4, levels of IL-1β both in pla-
sma and BALF in group 2 significantly increased compared to those in group 1 (P<0.05); the level in BALF got even higher in group 3 compared to that in group 2 (P<0.05); However the level in BALF was significantly lower in group 4 than that
Table 1. Consumption of total liquid and sucrose solution of the rats
Group n Before CUMS After CUMS After treatment
Total liquid (ml)
Sucrose solution (ml)
Total liquid (ml)
Sucrose solution (ml)
Total liquid (ml)
Sucrose solution (ml)
Group 1 9 22.9±6.4 17.2±6.5 20.7±5.6 16.2±5.9 24.4±6.1 19.8±5.3Group 2 9 23.3±6.9 18.6±7.1 20.2±4.5 16.4±4.1 22.8±5.3 19.6±4.5Group 3 10 19.4±5.7 15.7±4.2 18.4±7.5 9.7±6.8ab 20.7±5.6 10.7±5.9a
Group 4 10 23.6±5.1 18.2±6.2 20.3±4.5 10.2±6.7ab 21.6±5.2 17.1±5.4c
Data were expressed as mean ± SD.a P < 0.05 versus Group 1; bP < 0.05 versus Group 2; c P < 0.05 versus Group 3.
Table 2. Horizontal movements and vertical movements of the rats
Group n Before CUMS After CUMS After treatment
Horizontal movements
Verticalmovements
Horizontal movements
Verticalmovements
Horizontal movements
Verticalmovements
Group 1 9 67.23±12.67 21.36±4.76 71.54±10.85 23.95±3.68 65.34±9.65 19.87±6.54Group 2 9 71.27±8.69 20.95±3.21 70.16±9.66 21.67±5.63 67.89±8.70 18.90±4.31Group 3 10 70.35±7.82 18.54±5.36 39.64±17.52ab 10.34±6.40ab 42.48±10.59a 12.14±4.32a
Group 4 10 69.68±10.23 19.86±6.13 41.19±14.21ab 9.79±5.54ab 56.73±8.39c 17.49±5.76c
Data were expressed as mean ± SD.a P < 0.05 versus Group 1; bP < 0.05 versus Group 2; c P < 0.05 versus Group 3.

Vers
ion fo
r revie
w
2006
HealthMED - Volume 6 / Number 6 / 2012
Journal of Society for development in new net environment in B&H
in group 3 (P<0.05), which showed the treatment could decrease the level of IL-1β in BALF in rats with asthma and depressive-like behaviors.
Levels of IL-6 both in plasma and BALF in group 2 significantly increased compared to those in group 1 (P<0.05); the level in plasma got even higher in group 3 compared to that in group 2 (P<0.05). The levels both in plasma and BALF were significantly lower in group 4 than those in group 3 (P<0.05), which showed that the treatment could decrease the levels of IL-6 in plasma and BALF in rats with asth-ma and depressive-like behaviors.
Discussion
Asthma, a chronic inflammatory disease of the airways, affects many individuals worldwide10. It is believed that psychological and respiratory symptoms can be interrelated. Several studies well demonstrated the high prevalence of depre-ssion in patients with asthma; Lavoie KL11 found that depressive disorders are associated with low asthma-related quality of life and low levels of asthma control. So we can come to the conclusion that depressive disorders could affect the asthma prevalence, morbidity, and mortality.
In our study, rats got asthma by the OVA sen-sitization and challenge, then had depressive-like behaviors by the CUMS exposure. There were
more inflammation cells in BALF in the group 2 compared to the normal rats; when exposed to CUMS, there were even more BALF inflamma-tion cells, especially eosinophils, in group 3 com-pared to group 2. So we concluded that depression indeed had impact on asthma.
It is believed that some proinflammatory cyto-kines, such as IL-1β and IL-6, are involved in asthma and in depression. And some researchers speculated that proinflammatory cytokines might play important roles in asthmatic patients with de-pression, but what were the levels of the cytokines like in such patients had not been detected; and the effects of the combination therapy of anti-asthma and anti-depression on the cytokines had not been reported. We designed to give dexamethasone and fluoxetine to the rats with asthma and depressive-like behaviors, and to detect the changes of levels of IL-1β and IL-6 before and after the treatment.
IL-1β is a proinflammatory cytokine that is produced by airway epithelial cells and several immune cells. It can induce leukocytosis and also induce the release of many other cytokines such as interleukin -2, -3, -4,-5, -6 -8, and TNF which are involved in asthma. Studies have demonstrated that IL-1β can alter airway function by inducing cellular infiltrate, mucus hyperplasia, airway wall thickening, fibrosis.12,13 The production of IL-1β is usually increased in lungs of patients and animals
Table 3. Inflammatory cells in BALF in rats
Group n Leukocytes(×105)
Macrophages(×105)
Eosinophils(×105)
Lymphocytes(×105)
Group 1 9 40.22±6.95 7.29±0.96 0.11±0.03 13.34±2.44Group 2 9 60.89±9.53a 14.89±2.88a 0.92±0.21a 17.44±3.67a
Group 3 10 78.65±8.41a 16.88±1.65a 1.45±0.27ab 20.71±4.53a
Group 4 10 50.13±6.35c 9.90±1.76c 0.76±0.15c 14.56±2.58c
Data were expressed as mean ± SD.a P < 0.05 versus Group 1; bP < 0.05 versus Group 2; c P < 0.05 versus Group 3.
Table 4. IL-1β and IL-6 concentrations in plasma and BALF in rats
Group nIL-1β IL-6
Plasma(pg/ml) BALF(pg/ ml) Plasma(pg/ml) BALF(pg/ ml)Group 1 9 21.44±5.10 89.26±15.85 25.32±4.95 66.14±8.63Group 2 9 32.60±15.08a 213.03.±25.69a 38.60±6.24a 315.37±32.16a
Group 3 10 33.53±10.57a 337.57±36.29ab 49.36±5.57ab 376.94±43.52a
Group 4 10 26.57±8.02 146.39±18.15c 27.62±8.02c 131.86±29.81c
Data were expressed as mean ± SD.a P < 0.05 versus Group 1; bP < 0.05 versus Group 2; c P < 0.05 versus Group 3.

Vers
ion fo
r revie
w
HealthMED - Volume 6 / Number 6 / 2012
Journal of Society for development in new net environment in B&H 2007
with asthma.14 IL-1β also has various functions in the brain. A growing body of data suggests that IL-1β has a special role in the pathogenesis and somatic consequences of depression. Exogenous administration of IL-1β to rats has been found to produce some depressive-like symptoms. Some of the results showed an increase of IL-1β in the blo-od or cerebrospinal fluid of depressed patients.15,16
Yet, some studies found that the IL-1β level was unchanged in major depressive disorder patients.17
But, how the levels of IL-1β change in patients with both asthma and depression has not been eva-luated. Our study showed that asthma increased the expression of IL-1β in plasma and BALF if compared to control rats, and interestingly the IL-1β level in BALF of group 3 got even higher when exposed to CUMS if compared to group 2. With the medication management of dexamethasone and fluoxetine, the IL-1β level in BALF in group 4 decreased, simultaneously, the depressive-like behaviors and the inflammation in lung tissue got better if compared to group 3. The results sugge-sted that IL-1β played important role in asthma with depressive-like behaviors and the combinati-on management of dexamethasone and fluoxetine could decrease its level.
IL-6 is considered as one of biomarkers of ongoing inflammation and a regulatory cytokine with potential to modulate the immune response, especially promoting T helper 2 (Th2) differenti-ation of CD4+ T cells while suppressing Th1 di-fferentiation, IL-6 also promotes the production of Th2 cytokines interleukin-4 and interleukin-5. These findings suggest that IL-6 has an important role in the development of Th2 mediated disea-ses, such as asthma. Actually in asthma, several studies have shown elevated IL-6 levels in BALF and serum.5 Besides, IL-6 has systemic effects far beyond the inflammation response. It has profo-und effects on the CNS, it is involved in a num-ber of psychiatric disorders, especially in major depressive disorder.6,18,19 Significantly higher level of IL-6 in patients with major depressive disorder was reported by many researchers.19 But some found no significant difference in IL-6 level of depressed patients,17,20 even J. Podlipny21 found that serum level of IL-6 was lower in a population sample with symptoms of depression than in a po-pulation sample without symptoms of depression.
But how the levels of IL-6 change in patients with both asthma and depression has not been evalua-ted. Our study showed that asthma increased the expression of IL-6 in plasma and BALF if compa-red to group 1, and interestingly the IL-6 level in plasma of group 3 got even higher when exposed to CUMS if compared to group 2. With the mana-gement of dexamethasone and fluoxetine, the IL-6 levels in plasma and BALF of group 4 decreased, simultaneously, the depressive-like behaviors and the inflammation in lung tissue got better if com-pared to group 3. The results suggested that IL-6 was involved in asthma with depressive-like beha-viors and the management of dexamethasone and fluoxetine could decrease its level.
We conclude that proinflammatory cytokines IL-1β and IL-6 are involed in asthma with depre-ssive-like behaviors, and the combination trea-tment of dexamethasone and fluoxetine are effec-tive on asthma with depressive-like behaviors by decreasing levels of IL-1β and IL-6.
Acknowledgements
This work was supported by grants from Shan-dong provincial Natural Science Foundation (NO. ZR2009CL045) and from Ministry of Education of China (07JAXLX005)
Refrences
1. Goodwin RD, Jacobi F, Thefeld W. Mental disorders and asthma in the community. Arch Gen Psychiatry 2003; 60:1125-1130.
2. Katon W, Lozano P, Russo J, et al: The prevalence of DSM-IV anxiety and depressive disorders in youth with asthma compared with controls. J Adolesc Heal-th 2007; 41: 455-463.
3. Yuping Song, Hongwei Sun, Yuying Sun, et al: A study on relationship between coping style, social support and bronchial asthma patients with depression. China Journal of Health Psychology 2008; 162: 226-227.
4. Lappalainen U, Whitsett JA, Wert SE, et al: Interle-ukin-1 causes pulmonary inflammation, emphysema, and airway remodeling in the adult murine lung. Am J Respir Cell Mol Biol 2005; 32: 312-318.
5. Neveu WA, Allard JL, Raymond DM, et al: Elevation of IL-6 in the allergic asthmatic airway is independent of inflammation but associates with loss of central ai-rway function. Respir Res 2010 Mar 8; 11: 28.

Vers
ion fo
r revie
w
2008
HealthMED - Volume 6 / Number 6 / 2012
Journal of Society for development in new net environment in B&H
6. Yu YW, Chen TJ, Hong CJ, et al: Association study of the interleukin-1 beta (C-511T) genetic polymorphism with major depressive disorder, associated symptoma-tology, and antidepressant response. Neuropsychop-harmacology 2003; 28: 1182-1185.
7. Prather AA, Rabinovitz M, Pollock BG, et al: Cyto-kine-induced depression during IFN-α treatment: the role of IL-6 and sleep quality. Brain Behav Immun. 2009; 23: 1109-1116.
8. Willner P, Towell A, Sampson D, et al: Reduction of sucrose preference by chronic unpredictable mild stress, and its restoration by a tricyclic antidepres-sant. Psychopharmacology (Berl) 1987; 93: 358-64.
9. Rayen I, van den Hove DL, Prickaerts J, et al: Fluoxe-tine during development reverses the effects of prena-tal stress on depressive-like behavior and hippocam-pal neurogenesis in adolescence. PLoS One 2011; 6: e24003.
10. Wei B, Zhang H, Li L, et al: T helper 17 cells and re-gulatory T-cell imbalance in paediatric patients with asthma. J Int Med Res. 2011; 4:1293-1305.
11. Lavoie KL, Bacon SL, Barone S, et al: What is wor-se for asthma control and quality of life: depressive disorders, anxiety disorders, or both? Chest 2006; 130: 1039-1047.
12. Johnson VJ, Yucesoy B, Luster MI. Prevention of IL-1 signaling attenuates airway hyperresponsive-ness and inflammation in a murine model of toluene diisocyanate-
13. Induced asthma. J Allergy Clin Immunol 2005; 116: 851-858.
14. Lappalainen U, Whitsett JA, Wert SE, et al: Inter-leukin-1beta causes pulmonary inflammation, emp-hysema, and airway remodeling in the adult murine lung. Am J Respir Cell Mol Biol 2005; 32: 311-318.
15. Wanderer AA. Interleukin-1β targeted therapy in se-vere persistent asthma (SPA) and chronic obstruc-tive pulmonary disease (COPD): proposed simila-rities between biphasic pathobiology of SPA/COPD and ischemia-reperfusion injury. IMAJ 2008, 10: 837-842.
16. Levine J, Barak Y, Chengappa KN, et al: Cerebros-pinal cytokine levels in patients with acute depressi-on. Neuropsychobiology 1999; 40: 171-176.
17. Owen BM, Eccleston D, Ferrier IN, et al: Raised levels of plasma interleukin-1beta in major and po-stviral depression. Acta Psychiatr Scand 2001; 103: 226-228.
18. Kagaya A, Kugaya A, Takebayashi M, et al: Plasma concentrations of interleukin-1beta, interleukin-6, soluble interleukin-2 receptor and tumor necrosis factor alpha of depressed patients in Japan. Neurop-sychobiology 2001; 43: 59-62.
19. Groer MW, Morgan K. Immune, health and endocri-ne characteristics of depressed postpartum mothers. Psychoneuroendocrinology 2007; 32: 133-139.
20. Penninx BW, Kritchevsky SB, Yaffe K, et al: Inflam-matory markers and depressed mood in older per-sons: results from the Health, Aging and Body Com-position study. Biol Psychiatry 2003; 54: 566-572.
21. Marques-deak AH, Neto FL, Dominguez WV, et al: Cytokine profiles in women with different subtypes of major depressive disorder. J Psychiatr Res 2007, 41: 152-159.
22. J. Podlipný, Z. Hess, J. Vrzalová, H. , et al: Lower Serum levels of interleukin-6 in a population sample with symptoms of depression than in a population sample without symptoms of depression. Physiol Res 2010; 59: 121-126.
Corresponding Author Hongwei Sun, Weifang Medical University, Weifang, Shandong Province, P.R. China, E-mails: [email protected], [email protected]

Vers
ion fo
r revie
w
HealthMED - Volume 6 / Number 6 / 2012
Journal of Society for development in new net environment in B&H 2009
Abstract
Heart rate and blood lactate responses on the court enable a detailed estimation of the working regime (metabolic zone) in which an athlete is tra-ined, which is not possible to estimate only on the basis of the heart rate. These parameters are mea-sured at rest, during exercise (lactates are measu-red after each work interval), and in recovery. In the end one gets curves which represent a metabo-lic profile of each individual. Our sample compri-sed 10 active female football players and 8 active female handball players who gave their written consent to take part in this research. To determine statistical significance of differences between the researched groups a method of multivariate anal-ysis of variance (MANOVA), on a multivariate level, and a univariate analysis of variance (ANO-VA), on a univariate level, were used. Research results obtained lead us to conclude that between the subjects of the first and the second group there is no difference in numeric values of the heart rate at rest and different levels of workload, nor the-re is any difference in the lactate level at rest, in workload and in recovery, except for the values of heart rate in the first workload of 50W. Generally speaking, research results show that both group subjects display the same functional abilities.
Key words: herat rate, lactat, conconi test, fe-male, handball, football
Introduction
Many physiologists report that there is a linear heart rate relationship during an incremental max-imum exercise test and workload. This linearity is lost with the high intensity of exercises. Breaking
point is on the level of anaerobic threshold. (ANP). The moment when the heart rate does not follow the increasing workload, and the curve turns to the right, is called a deflection point. Having in mind that workloads below the threshold (dominant aerobic), on the threshold (aerobic-anaerobic) and above the threshold (dominant anaerobic) stimu-late different metabolic processes. Heart rate val-ues in certain zones of intensity are extremely im-portant in determining the training intensity. Heart rate enables precise determination of the workload intensity only up to the anaerobic threshold. Such workloads have reversible effects on the heart thus strengthening the myocardium by decreasing the heart rate at rest, and increasing the efficiency on a submaximal workload (greater workload-lower values of HR) (Đurašković, 2002). This is the ba-sis of the Conconi test. Heart rate and blood lactate responses on the court enable a detailed estimation of the working regime (metabolic zone) in which an athlete is trained, which is not possible to es-timate only on the basis of the heart rate. These parameters are measured at rest, during exercise (lactates are measured after each work interval) and in recovery. In the end one gets curves as a metabolic profile of each individual. These curves are varied and heavily depend on the type of work-load. Actually, the workload determines which pa-rameter is to be observed and monitored as an in-dicator of the improvement rate. (Fratrić F., 2006).
In prolonged continuous work that engages sev-eral muscle groups (running, cycling) besides lactate it is important to monitor heart rate and consump-tion of V02 max. In endurance sports heart rate and the level of blood lactate should be checked every 4 weeks. There were attempts to quantify the point where the curve of heart rate bends to the right. Nu-
Difference in the heart rate and the blood lactate level in football and hanball female players during the Conconi testIvana Mladenovic Ciric1, Slobodan Stojiljkovic1, Ljiljana Bjelakovic1, Maja Nikolic2, Slavisa Djurdjevic³, Danica Pirsl1
1 Faculty of sport and physical education, University of Nis, Serbia,2 Medical faculty, University of Nis, Serbia,³ Military-medical academy, Belgrade, Serbia.

Vers
ion fo
r revie
w
2010
HealthMED - Volume 6 / Number 6 / 2012
Journal of Society for development in new net environment in B&H
merous studies have shown that quantification of this point is far more exact when determined on the basis of the lactate curve. (Fratrić F., 2006).
John A. Vachon et al (John A. Vachon, 1999) investigated the validity of the heart rate deflec-tion as a predictor of the lactate threshold during various Conconi test running protocols. In the conclusion of this study it is found that HR de-flection point is not an adequate predictor of the lactate threshold.
Grazzi et al. 2005 confirmed the validity of the Conconi test and HR deflection for the determina-tion of the anerobic threshold. The authors compa-red two versions of the Conconi test, of Conconi I., 1996 and Grazzi et al. 1999, on the one hand, and Ozcelik O. and Kelestimur H., 2004, on the other hand, by monitoring three important para-meters (method used for the increased workload, warm-up procedure, method used for HR deflec-tion point determination) . Ozcelik test protocol (Ozcelik O, Kelestimur H., 2004) was performed on cycle ergometer in costant rhythm while the Conconi test regulates the workload increment by the increased pedalling frequence. Conconi et al. 1996 and Grazzi et al .1999 have pointed out that this test follows the physiological demands appe-aring during the incremented repetitive activities (running, walking, cycling, swimming).
Adequte warm up increases body temperature and thus speeds up metabolic processes and meta-bolic adaptation to testing procedure (Bishop D., 2000, Amann M., 2004). Four minute low inten-sity warm up method (20 W) was used by Conconi F, 1996 , Grazzi G, 1999. It turned out it failed to introduce the testing subject into the adequa-te warm up, so the subject could not show his/her full aerobic work in the test. The third point, considered by the authors, is the method used to identify the heart rate break point (the heart rate deflection point). Objective mathematical meth-ods avoid subjective interpretations during this test (Conconi F, 1996, Grazzi G, 1999,Rosic G 2007). In the study of Ozcelik et al, the heart rate deflection point was detected in 6 out of 16 tests on which their study is based.
Reliability and validity of the modified Conconi test was the research focus of the group of authors led by Celik O. et al., 2005. On a sample of twenty-eight oarsmen they administered three tests in three
separate days. The third test was a Conconi test with the incremented workload on ergometer when the level of blood lactate was measured. The results show that the mean power output (PO) scores for the CT, CTR and ILT were 234.2 ± 40.3 W. CRT- 232.-i.39.7W and ILT= 229.7±39.6 W, respectively. The mean HR values at the AT for the CT, CTR and ILT were 165.4±11.2b.min. 160.4:tl0.8b.min., and 158.3±8.8b.min., respectively. Interclass correlati-on coefficient (ICC) analysis indicated a significant correlation between all three tests.
Validity of HR deflection point was investigated by the Conconi test in cycling (Borgois, 2004) on a sample of eleven cyclists. A correlation between HRDP and the level of lactate was investigated. It was found that the lactate threshold appeared earli-er than HRDP and it was concluded that determina-tion of HRDP in the Conconi test was not valid for the determination of the anaerobic threshold.
Reliability of the Conconi test in determina-tion of the anaerobic threshold (Carev D., 2002) was investigated on 22 cyclists (l1 men and 11 women). Mean values for heart rate at AT were 157.3 b.min for the Conconi test and 163.3 b.min. for V-slope method. Although there was no sig-nificant difference in the two methods the author recommends the Conconi test as a practical tool for AT determination.
G. Grazzi., F. Conconi (Grazzi G et al, 2005) have confirmed the validity of the Conconi test and HR deflection point for the estimation of the anaerobic threshold. They have compared two versions of the Conconi test, Conconi I., 1996 and Grazzi I. et al., 1999, on the one hand and Ozcelic O. and Kelestimur H., 2004, on the other hand, by considering three important points (method used to increase power output, the warm-up procedure, method used to identify the heart rate break point).
Bodner et al, 2000 reviewed previous resear-ch on the heart rate deflection point determinati-on. They have compared the Conconi test to other similar tests only to determine that the heart rate deflection point is highly dependent on the type of the protocol used, but not all studies report repro-ducibility of HRDP and the lactate anaerobic thre-shold. The HRDP has a potential to be used not only for the training regulation purposes but also clinically, as a parameter of the workload intensity for cardiac rehabilitation.

Vers
ion fo
r revie
w
HealthMED - Volume 6 / Number 6 / 2012
Journal of Society for development in new net environment in B&H 2011
The research problem of this study is to deter-mine the heart rate frequency and the level of the blood lactate during the Conconi test on cycle er-gometer in football and handball female players of the federal competition level.
Methods
Subject sample The research sample comprised 10 top-rated,
regular federal level competition, active, female fo-otball players and 8 female handball players who gave their consent prior to the onset of this study.
Variable sampleFor the purpose of this research 13 variables
were measured. The variables were designated as follows: (FPUMI) heart rate at rest in min., (FPUOP1) heart rate in the first minute of the test , (FPUOP2) heart rate in the second minute of the test, (FPUOP3) heart rate in the third minute of the test, (FPUOP4) heart rate in the fourth minute of the test, (FPUOP5) heart rate in the fifth minute of the test, (FPUOP6) heart rate in the sixth minute of the test, (FPUOP7) heart rate in the seventh mi-nute of the test, (FPUOP8) heart rate in the eighth minute of the test, (FPUOP9) heart rate in the nin-th minute of the test, (FPUOP10) heart rate in the tenth minute of the test. (FLAKMI) blood lactate at rest, (FLAKTE) blood lactate in the workload, (FLAKOP) blood lactate in recovery.
Blood lactate was measured in zero minute, be-fore the test, at the end of the workload, and 10 minutes after the test. The heart rate was measured at every lap time during each change of workload. The workload was dosed in Watts. The heart rates were measured by pulsmeter "Polar". The durati-on of the test was measured by the pulsmeter.
The Conconi test is a very comfortable noninva-sive method for measuring the anaerobic threshold (AT) (Conconi F. et al. 1984, 1996). According to the Conconi's protocol subjects undergo a 10 minu-te warm-up at 50% of the HR reserve, then the load is increased by 15 W every minute. Then, subjects perform a continuous ride on a bicycle ergometer for 12 minutes, starting at the load of 25W and fi-nishing when the subject stops cycling because of the pain. HR was recorded continuously at 5 second intervals with the use of the Polar watch; the data
were later downloaded to a computer for further analyses. The Polar technology needs minimum ei-ght lap times for the software analysis, graphs dis-play and AT point determination.
Blood samples were taken from subjects’ fin-ger, first at rest, then at the moment of test finish, and the third measurement was performed ten mi-nutes after the rest. Blood lactate concentrations were determined using the automated lactate anal-yzer (Accutrend Laktate Mnanhame).
Data processingTo determine differences adequate statistical
procedures were used to commensurate with the set research problem.
The data were processed and analyzed by me-ans of the software program "Statistica 6". Basic statistical parameters were calculated: MV-mean value, SD-standard deviation, MIN-minimal valu-es and MAX-maximal values, and R – range. To determine statistical significance of differences between the groups a method of multivariate anal-ysis of variance (MANOVA), on a multivariate le-vel, and univariate analysis of variance (ANOVA), on a univariate level were used.
Results
The results are shown in Tables displayed in the logical order (Tables 1-4). Values of the heart rate and lactate at rest, in workload and at recovery in football female players (first group) and han-dball female players (second group) are shown in Tables 1 and 2.
The values of the heart rate at rest, under wor-kload and in recovery in female football players (the first group) are shown in Table 1. The results show that the average values of the heart rate at rest in female football players were 73.70 beats/min (the values ranged from 60 b/min to 82b/min, which is the range of 22 b/min. The values of the heart rate at the end of the test were 170.80 b/min (ranging from160 b/min to 182 b/min). Calcula-ted maximal values of heart rate for the given age were (220-g.s) out of 200. The average values of the lactate at rest in female football players were 1.20mmol/l (from 1-1.30 mmol/1), average values of the lactate in the end of the Conconi test were 5.02 mmol/l (ranging from 1,20-10.20 mmol/l).

Vers
ion fo
r revie
w
2012
HealthMED - Volume 6 / Number 6 / 2012
Journal of Society for development in new net environment in B&H
Table 1. Basic statistical parameters of heart rate at rest, in different workloads and in recovery in female football players
N Mean Min Max Range STFPUMI 10 73.70 60.00 82.00 22.00 7.83FPUOPl 10 95.60 79.00 115.00 36.00 9.68FPUOP2 10 109.50 96.00 135.00 39.00 11.67FPUOP3 10 119.00 100.00 143.00 43.00 11.44FPUOP4 10 124.60 108.00 146.00 38.00 10.72FPUOP5 10 132.30 115.00 157.00 42.00 11.82FPUOP6 10 141.20 121.00 161.00 40.00 11.04FPUOP7 10 148.40 126.00 170.00 44.00 11.80TPUOP8 10 157.00 137.00 174.00 37.00 10.29FPUOP9 10 164.80 150.00 181.00 31.00 9.88FPUOP10 10 170.80 160.00 182.00 22.00 8.51FLAKMI 10 1.20 1.00 2.30 1.30 0.40FLAKTE 10 5.02 1.20 10.20 9.00 2.54FLAKOP 10 3.22 1.30 8.20 6.90 1.98
Table 2. Basic statistical parameters of heart rate at rest, in different workloads and in recovery in female handball players
N Mean Min Max Range STFPUMI 8 68.25 66.00 72.00 6.00 2.25FPUOPl 8 106.25 96.00 117.00 21.00 7.01FPUOP2 8 116.50 107.00 127.00 20.00 6.41FPUOP3 8 125.13 109.00 140.00 31.00 9.86FPUOP4 8 134.50 120.00 150.00 30.00 9.59FPUOP5 8 141.63 122.00 158.00 36.00 11.73FPUOP6 8 151.00 130.00 170.00 40.00 13.48FPUOP7 8 158.88 134.00 177.00 43.00 14.21TPUOP8 8 164.63 140.00 181.00 41.00 13.86FPUOP9 8 172.75 156.00 188.00 32.00 12.07FPUOP10 8 173.75 158.00 184.00 26.00 9.71FLAKMI 8 1.36 1.00 2.10 1.10 0.42FLAKTE 8 7.61 3.50 12.50 9.00 3.09FLAKOP 8 4.80 1.90 7.20 5.30 1.86
The values of the heart rate at rest, under diffe-rent workload and in recovery in female handball players (the second group) are shown in Table 2. The results show that the average values of the heart rate at rest in female handball players were 68.25±2.25 beats/min (the values ranged from 66 b/min to 72b/min 60 b/min, which is the range of 6 b/min. The values of the heart rate at the end of the test were 173.75±9.71b/min (ranging from 158 b/min to 184 b/min 160 b/min). The average values of the lactate at rest in female football players were
1.20mmol/l (from 1-1.30 mmol/1), average value of the lactate in the end of the Conconi test were 4.80 mmol/1(from 1.90mmol/l to 7.20mmol/l.Table 3. Multivariate analysis of variance between female football players and female handball players (MANOVA)
Wilks Lambda F Effect Error P0.007 89.68 16 1 0.083
The results of the multivariate analysis of vari-ance (Table 3) between the female football players subjects and female handball players subjects show that there is no statistically significant difference between the groups in the researched area (p .083). Due to this fact there is no need to use other sta-tistical methods. However, we give the difference between the groups defined by the ANOVA method.Table 4. ANOVA
Group IMean
Std. Dev.
Group IIMean
Std. Dev. JF D
FPUMI 73.70 7.832 68.25 2.252 3.595 0.076FPUOP1 95.60 9.675 106.25 7.005 6.801 0.019FPUOP2 109.50 11.674 116.50 6414 2.301 0.149FPUOP3 119.00 11.441 125.13 9.862 1.435 0.248FPUOP4 124.60 10.721 134.50 9.592 4.153 0.058FPUOP5 132.30 11.823 141.62 11.734 2.783 0.115FPUOP6 141.20 11.043 151.00 13.480 2.882 0.109FPUOP7 148.40 11.796 158.87 14.207 2.928 0.106FPUOP8 157.00 10.296 164 63 13.866 1.798 0.199FPUOP9 164.80 9.875 172.75 12.068 2.369 0.143FPUOP10 170.80 8.509 173.75 9.706 0.472 0.502FLAKMI 1.20 0.400 6 0.437 0.676 0.423FLAKTE 5.02 2.540 7.61 3.094 3.820 0.068FLAKOP 3.22 1.98 4 80 1.863 2.978 0.104
On an univariate level the obtained results in the researched area of the heart rate at rest and un-der workload and the level of lactate at rest, and under workload, and in recovery show that the-re is statistically significant difference only in the variable FPUOPI (heart rate on the first level of workload) p=0.01.
Discusion and conclusion
The values of the heart rate and the lactate at rest, under workload and in recovery in female football players (the first group) and female handball players (the second group) are shown in Tables 1 and 2. The

Vers
ion fo
r revie
w
HealthMED - Volume 6 / Number 6 / 2012
Journal of Society for development in new net environment in B&H 2013
results show the presence of great range between the minimal and maximal heart rate which in turn points to the inhomogeneity of the female football players group whose standard deviation was 7.83 beats/min. In female handball players small range between the minimal and maximal heart rate points to the homogeneity of this group whose standard deviation was 2.25 beats/min. Workload through this test was between 80% to 91%, so with this workload range the subjects were expected to enter the anaerobic threshold, and in most subjects it did happen with the deflection point.
The female football players group that displayed in the end of the test value of 1.20 mmol/1 did not reach the anaerobic threshold, thus for them this test was not anaerobic sensitive. In contrast, those subjects whose lactate values were 10.20mmol/l have already entered the anaerobic threshold so the Conconi test was sensible enough for them. Taking in consideration that the anaerobic threshold is rea-ched on the blood lactate level of 4 mmol its values should be monitored every three minutes so as to avod too small or too big workload in the test, due to the fact that the anaerobic threshold in the Con-coni test is reached earlier with the values of the lactate than with the heart rate deflection point.
In the light of all aforementioned one can con-clude that between the first and the second group subjects there is no difference between the heart rate at rest and in different levels of workload, nor there is any difference in the level of the blood lac-tate at rest, in workload, in recovery, except for the values of heart rate in the first workload of 50 W. This evidently leads to a conclusion that both gro-ups subjects are of the same functional abilities.
By the analysis of the obtained results we can conclude that the numeric values of the heart rate at rest are statistically significantly lower in female handball players; this can be explained by the fact that this group has a longer sports training expe-rience and the higher rank of competition in the Challenge cup. Heart rates during workload have on average lower values on all levels of workload in female football players. This can be accounted for by better adaptation of the cardio-vascular sy-stem to rapid increase of workload and later reac-hing of the anaerobic threshold.
Heart rate values in the end of the test in female football players were lower compared to the valu-
es found in female handball players. This does not mean that the female handball players have shown better results because the essence of the test is to reach the anaerobic threshold on as much higher heart rate and at the same time to reach the lactate values of 4mmol/l as late as possible, that is, in the end of the test. Female handball players finished their test with high heart rates and with signifi-cantly higher values of the blood lactate.
The average values of the level of lactate at rest, under workload and in recovery are lower in female football players. The statistically signifi-cant differences were not found in any of the anal-yzed level. Normal lactate values range from 1 to 1.7 mmol/1. Minimal values of the blood lactate in both samples were within the referential values but maximal values were higher than the average ones. Lower values of the blood lactate at rest point to the fact that an athlete is fully recovered from the previous workload. On the contrary, if the athlete takes up next training with the increased values of the blood lactate there is a chance of sustaining sports injuries. Therefore, the results obtained in this research can help shape the training process so that by one noninvasive method one can determi-ne the anaerobic threshold and thus individualize the training process. In sports such as football and basketball this method can help in correcting the functional abilities of the players and thus avoid the overloading and enhance reaching the optimal conditioning.
Tables 3 and 4 show the results of the multiva-riate and univariate analyses of variance between the female football players and female handball players. On the univariate level the researched va-riables heart rate at rest, and in workload and the blood lactate in rest, in workload and in recovery, show statistically significant difference only in FPUOP1 variable (heart rate on the first level of workload). Namely, female football players have statistically lower heart rates with the workload of 50 Watts in comparison to the female handball players. This single variable cannot individually influence the existence of the differences in the researched area.

Vers
ion fo
r revie
w
2014
HealthMED - Volume 6 / Number 6 / 2012
Journal of Society for development in new net environment in B&H
Conclusion
On the basis of the research conducted on a sample of 10 female football players and 8 female handball players the following conclusions can be drawn:1. Research results of heart rate at rest and in
different workloads during the Conconi test performed on cycle ergometer show that the numerical values of the heart rate in workload and in recovery are lower in female football players when compared to female handball players. The obtained differences are not statistically significant. Statistically significant difference was determined only in the values of the heart rate at rest.
2. Average values of the blood lactate at rest, in workload and in recovery are lower in female football players when compared to the female handball players. This is not a statistically significant difference.
3. On the basis of the obtained results we can draw a conclusion that the researched samples of the female football players and female handball players are of the same functional abilities.
Acknowledgments
We would like to express our gratitude to the Ministry of Education and Science for their sup-port in the project OI 179019 – Biomechanic ef-ficiency in elite Serbian athletes“, and also to the athletes who participated in this research.
References
1. I. Bodner. M, Rhodes. E. (2000) A review of the con-cept of the heart rate deflection point. Sports Med., 30(\):31 -46.
2. Borgois, J. Coorevits. P. Danneels. L. Cambier. D. & Vrijens, J. (2004).Validity of the heart rate deflection as a predictor of lactate threshold concept during cy-cling. J Strength CondRes., 18(3):498-503.
3. Carev. D. (2002) Assessment of the accuracy of the Conconi test in determining gas analysis anaerobic threshold. JStrenght Cond Res. 16(4):641-644.
4. Čelik, O.. Kosar. S.. N., Korkusuz. F.. & Bozkurt. M. (2005). Reliability and validity of the modified Con-coni test on concept II rowing ergometers. Strength CondRes. 19 (4): 871-877.
5. Conconi, F.. Grazzi. G.. Casoni. I., Guglielmini, C, Borsetto, C. Ballarin. E., Mazzoni. G., Ptracchini, M. & Manfredini F. (1996) The Conconi test: methodol-ogy after 12 years of application. Int J Sports Med., (17): 509-519.
6. Đurašković, R.(2002). Sports medicine. Niš: SVEN.
7. Fratrić, F. (2006). Theory and methodics of sports training. Novi Sad: Province institute of sport.
8. Grazzi. G.. Casoni, I., Mazzoni. G.. Uliari. S. & Con-coni. F. (2005). Protocol for the Conconi test and de-termination of the heart rate deflection point. PhisioL-Res., (54): 473-475.
9. Grazzi. G.. Alfieri, N.. Borsetto. C. Casoni. I.. Man-fredini. F.. Mazzoni, G., & Conconi. F. (1999) The power output/heart rate relationship in cycling: test standardization and repeatability. Med Sci Sport Ex-erc. (31): 1478-1483.
10. Ozcelik. O. Kelestimur. H.(2004) Effects of acute hy-poxia on the determination of anaerobic threshold using the heart rate-work rate relationship during incremental exercise tests. Physiol Res.( 53):45-51.
11. Rosić G, Pantović S, Mladenović I and Rosić M. Va-lidity of the Conconi Test in Estimation of Anaerobic Threshold during Cycling. Medicus 2007; 8(3): 93 – 6. (in Serbian).
12. Vachon. J., A., Bassett, D., R., Jr., & Clarke, (1999). Validity of the heart rate deflection point as a predic-tor of lactate threshold during running. JAppI Phi-siol, 87: 452-459.
Corresponding Author Ivana Mladenovic Ciric, Faculty of sport and physical education, University of Nis, Serbia, E-mail: [email protected]

Vers
ion fo
r revie
w
HealthMED - Volume 6 / Number 6 / 2012
Journal of Society for development in new net environment in B&H 2015
Abstract
Background; Cancer is a third cause of death in Iran. In this regard, breast cancer is the first neopla-sm of women in this country. Although our infor-mation about the etiology of breast cancer has im-proved, many associated risk factors are not well-described. So in this study, we tried to find probable risk factors of breast cancer and identify the clinical and pathological characteristics of breast malignan-cy to improve our future preventive programs.
Methods and patients; sixty-six patients with breast cancer between March 1, 2008 and Decem-ber 31, 2012 were enrolled in the study.
Results; participants aged from 40 to 65ye-ars old. most of the patients were diagnosed with lobular invasive carcinoma (89.39%).Twel-ve (18.18%) patients had positive family history of breast cancer and pregnancy was reported in 63(95.45%) subjects and 61 patients (92.42%) had history of lactation, 7 patients (10.60%) had history of oral contraceptive (OCP). Presence of mass was observed in 57 patients (86.36%). 19 patients (28.78%) had history of pain and breast secretion was identified in 9 subjects (13.63%).
Conclusion; Based on present study, presence of breast masses were the most common compla-int of patients and lobular invasive carcinoma was the most common type of breast cancer.
Key words; breast, cancer, risk factor
Introduction
According to reports from Ministry of Health and Medical Education (1,2) malignancy is a third cause of death in Iran.The incidence and mortality rates of breast tumors differ across the various co-untries, with a four to fivefold differentiation in in-cidence. The highest rates are seen in Europe and North America and Asian show the lowest amount
(3).Breast cancer is the first malignancy of women in Iran (4) including 24.4% of all neoplasm with a crude incidence rate and ASR ( age-standardi-zed incidence rate )of 17.4 and 23.1 (23.65 in a Mousavi report) per 100,000, respectively (5).Al-though our findings about the etiology of breast cancer have progressed, many risk factors are not well-defined and we cannot do the best preventi-ve and therapeutic procedures in order to decrease the incidence of this malignancy. Therefore in this investigation we explored the probable risk fac-tors and clinicopathologic characteristics of breast cancer in Sari, north of Iran.
Methods and patients
Study population included patients pathologi-cally proved with breast malignancy. Approvals for our study were obtained from the ethics com-mittee of the university.
All cases of breast cancer were retrieved from the files of the university hospitals from March 1, 2008 and December 31, 2012.
Statistics
For statistical analysis, data were entered to MS-excel spread sheets. The procedures included were transcription, preliminary data inspection, content analysis and finally interpretation. Investigators used percentages (SPSS software, Version 17, Chi-cago, IL, USA) to clarify epidemiological variables.
Results
There were 66 patients aged from 40 to 65years old (mean ± SD; 56± 15). twelve (18.18%) patients had positive family history of breast cancer and pregnancy was observed in 63(95.45%) subjects and 61 patients (92.42%) had history of lactation,
Clinicopathologic Features and Risk Factors for Breast Cancer in Northern Iran DecentNasrin Rahmani1, Seyyed Abbas Hashemi2, Mohammad Raisian2
1 Department of general surgery, Faculty of medicine, Mazandaran university of medical sciences, Sari, Iran,2 Faculty of medicine, Student research committee, Mazandaran university of medical sciences, Sari, Iran,

Vers
ion fo
r revie
w
2016
HealthMED - Volume 6 / Number 6 / 2012
Journal of Society for development in new net environment in B&H
7 patients (10.60%) had history of oral contracepti-ve (OCP) (table1). presence of mass in 57 patients (86.36%) was the most common clinical modes of presentation. 19 patients (28.78%) had history of pain and secretion from breast was identified in 9 subjects (13.63%) (table2). Lobular invasive carci-noma were the commonest histological type of can-cer in our series (89.39%) (table 3).Table 1. Distribution of risk factors for breast cancer in this study
Risk factor Negative PositiveFamily History 54(81.81%) 12(18.18%)Pregnancy 3(4.54%) 63(95.45%)Lactation 5(7.57%) 61(92.42%)OCP 59(89.39%) 7(10.60%)alcohol 63(95.45%) 3(4.54%)smoke 61(92.42%) 5(7.57%)
Table 2. Clinical characteristics of the study po-pulation
Symptom Negative PositivePain 47(71.21%) 19(28.78%)Mass 9(13.63%) 57(86.36%)
Secretion 57(86.36%) 9(13.63%)
Table 3. Histological type of breast cancer in this series
Percent Number Pathology89.39% 59 Lobular Invasive Carcinoma10.60% 7 Ductal Invasive Carcinoma
Discussion
Despite recent progresses in our knowledge about risk factors and serological changes of vari-ous cancers, the regional risk factors for breast can-cer and the fast implementation of multimodal con-cepts in neoplasm treatment associated with risk factors, breast cancer predisposal factors remains an indispensable component of potentially curative remedy( 6,7). In this study, we investigated regional risk factors and different clinical modes of presen-tation of breast cancer and their association with fi-nal histopathological diagnosis in north of Iran.
Much knowledge gained from Western coun-tries has revealed different risk factors and genes for breast cancer (8,9,10,11). One of them is
menstrual and reproductive factors which play
a crucial role for progression of breast cancer. A meta-analysis research of eight case–control in-vestigations in Japan indicated that nulliparity and low parity were related with increased risk. (12)
In year 2007 statement by the World Cancer Re-search Fund (WCRF) and American Institute for Cancer Research (AICR) reported that lactation protects women against breast malignancy (13). In the present study, twelve (18.18%) patients had history of breast malignancy in their family and pregnancy was reported in 63(95.45%) subjects and 61 patients (92.42%) had history of lactation, 7 patients (10.60%) had history of OCP.
In consistent with the WCRF/AICR report (13) this study results didn’t prove the potency of alcohol usage in development of breast cancer. Suzuki R et al (14) found a significant positive relation between alcohol usage and development of breast cancer in the Japan Public Health Center-based Prospective (JPHC) study. But in our study, alcohol consump-tion was reported in 3 subjects (4.54%).
The International Agency for Research on Can-cer (IARC) reported the “lack of carcinogenicity of tobacco smoking in humans for cancers of the female breast”. (15) But recent investigations have reported an increased risk associated with a long period and/or high number of pack-years of smoking (16). In the current study, 5 patients (7.57%) had history of smoking and most part of the participants were non-smokers.
Mahboobi A et al (17) reported invasive ductal carcinoma was the first pathologic type of breast cancer in their study. But in contrast with our study, lobular invasive carcinoma was the commonest his-tological type of cancer in our series (89.39%).
Preece PE et al (18) and Donegan (19) reported 15 % and 8% (respectively) of the patients with final diagnose of breast cancer had pain (major symptom) in breast. In consistent with our work, 19 patients (28.78%) had history of pain, secretion from breast was identified in 9 subjects (13.63%) and presence of mass in 57 patients (86.36%) was the most common symptom.
In conclusion, according to current research, presence of breast mass was identified as major complaint of patients and lobular invasive carci-noma reported in majority of subjects.

Vers
ion fo
r revie
w
HealthMED - Volume 6 / Number 6 / 2012
Journal of Society for development in new net environment in B&H 2017
Acknowledgment
We thank Mrs. Nooshafarin Dargahi for great assistance.
References
1. Goya M. Iranian Annual Cancer Registration Report 2005/2006. Ministry of Health and Medical Educa-tion, Health Deputy, Center for Disease Control and Prevention [In Persian]; 2007.
2. Naghavi M, Abolhassani F, Pourmalek F, Lakeh M, Jafari N, Vaseghi S, et al. The burden of disease and injury in Iran 2003. Popul Health Metr. 2009; 7: 9.
3. Ferlay J, Shin HR, Bray F, Forman D, Mathers C, Parkin DM. GLOBOCAN 2008, Cancer Incidence and Mortality Worldwide: IARC CancerBase No. 10. Lyon: International Agency for Research on Cancer, 2010
4. Sadjadi A, Nouraie M, Mohagheghi MA, Mousavi-Jarrahi A, Malekezadeh R, Parkin DM. Cancer occu-rrence in Iran in 2002, an international perspective. Asian Pac J Cancer Prev. 2005; 6: 359 – 363.
5. Mousavi SM, Gouya MM, Ramazani R, Davanlou M, Hajsadeghi N, Seddighi Z. Cancer incidence and mortality in Iran. Ann Oncol. 2009; 20: 556 – 563.
6. SHEIKH N., Masood M. and Naz N. Hematological and serological changes in the pre- and post treatment breast cancer patients. 2011, HealthMed Journal 5(6); 1449-57
7. SHEIKH N., Naz N. and Qureshi A.W. Impact of the workplace environment on the hematology and sero-logy of the steel industry workers. HealthMed (2011), 5(1): 35-40
8. Key TJ, Verkasalo PK, Banks E. Epidemiology of bre-ast cancer. Lancet Oncol 2001; 2: 133–40.
9. Adami HO, HunterDJ, TrichopolosD (eds). Textbook of Cancer Epidemiology, 2nd edn. New York: Oxford University Press, 2008.
10. Schottenfeld D, Fraumeni JF (eds). Cancer Epide-miology and Prevention, 3rd edn. New York: Oxford University Press, 2006
11. Ammar Imad Hazim, Gurjeet Kaur.Set HER-2/neu protein expression and gene amplification in bre-ast cancer: immunohistochemistry and chromo-genic in situ hybridization study using tissue mi-croarray. Healthmed journal, 2011, 5(5); 1065-71 Nagata C, Hu YH, Shimizu H. Effects of menstrual and reproductive factors on the risk of breast can-cer: meta-analysis of the case–control studies in Ja-pan. Jpn J Cancer Res 1995; 86: 910–15.
12. World Cancer Research Fund and American Insti-tute for Cancer Research. Food, Nutrition, Physical Activity and the Prevention of Cancer: A Global Perspective. Washington, DC: American Institute for Cancer Research, 2007.
13. Suzuki R, Iwasaki M, Inoue M et al. Alcohol con-sumption-associated breast cancer incidence and potential effect modifiers: the Japan public health center-based prospective study. Int J Cancer 2010; 127: 685–95.
14. International Agency for Research on Cancer. IARC Monographs on the Evaluation of the Car-cinogenic Risk of Chemicals to Humans, vol. 83: Tobacco Smoke and Involuntary Smoking. Lyon: IARC Press, 2004.
15. Collishaw NE, Boyd NF, Cantor KP et al. Canadian Expert Panel on Tobacco Smoke and Breast Cancer Risk. Toronto, Canada: Ontario Tobacco Research Unit, OTRU Special Report Series, 2009.
16. Mahboobi A, Alvandi Sh, Alizadeh Navaei R. An analytical survey on breast lesions in mammograp-hy. Journal of Babol university of medical sciences 1383; 22(6): 55-52.
17. Preece PE, Baum M, Mansel RE, et al. Importan-ce of mastalgia in operable breast cancer. Br Med J (Clin Res Ed) 1982; 284: 1299.
18. Donegan, WL. Diagnosis. In: Cancer of the Breast, Donegan WL, Spratt JS (Eds), WB Saunders, Phila-delphia 1995. p. 157.
Corresponding Author Seyyed Abbas Hashemi, Faculty of medicine, Student research committee, Mazandaran university of medical sciences, Sari, Iran, E-mail: [email protected]

Vers
ion fo
r revie
w
2018
HealthMED - Volume 6 / Number 6 / 2012
Journal of Society for development in new net environment in B&H
Abstract
Background and purpose: Malnutrition, weight loss and low body mass in COPD (Chro-nic obstructive pulmonary disease) are independent and negative risk factors regarding the survival of these patients. Malnutrition may lead to the deterio-ration of skeletal and respiratory muscles, causing respiratory failure. Parameters used for nutritional status evaluation include anthropometry, biochemi-cal measurements and subjective global assess-ment. The number of studies investigating the nu-tritional status using subjective global assessment in COPD patients were was limited. The aim of this study was to determine the utility of SGA for nutri-tional status in COPD patients and to determine the relationships between SGA, respiratory function tests, and some nutritional parameters.
Methods: The sample of the study consisted of 79 patients who were referred to Luleburgaz State Hospital, Chest Diseases Outpatient Clinic betwe-en October 2010 - February 2011 and who met the inclusion criteria as well as accepting to participate in the study. Pulmonary function tests were perfor-med of the patients. All patients underwent subje-ctive assessment of nutrition status using the SGA questionnaire and objective assessment through an-thropometric and biochemical measurements.
Results: According to the GOLD classifica-tion, 45.4% of the patients had moderate COPD and 38% had severe COPD. It was observed that the average BMI decreased with increasing COPD severity. The FEV1 % and FEV1/FVC (%) values in the malnutrition group were significantly lower than the well nourished group (p<0.05). It was determined that the albumine and transferin lev-els significantly decreased with the worsening of nutritional status (p<0.05). There were significant and negative correlations between the SGA scores
and respiratory parameters, albumine, hemoglo-bin, transferin and BMI.
Conclusion: SGA is a convenient instrument for evaluating the nutritional status in COPD patients and is correlated to other nutritional parameters.
Key words: chronic obstructive pulmonary di-sease, Subjective global assessment, nutrition.
Introduction
Chronic obstructive pulmonary disease (COPD) is an important cause of death and disability in both developed and developing countries.1 COPD is a preventable and treatable disease and usually prog-ressive, airway obstruction.2 Malnutrition has been shown to enhance dyspnoea severity; reduce exerci-se tolerance, skeletal muscle strength and enduran-ce; and significantly affect quality of life. Optimal nutritional status should help to improve the COPD patient’s general condition and respiratory muscle function.3 Various methods can be used in the eva-luation of the nutritional state. Such methods inclu-de subjective global nutritional evaluation, evalua-tion of dietary intake, anthropometry, determinati-on of body composition, and biochemical testing.2 Subjective Global Assessment (SGA) is an easy to use, fast and cost effective method which has been developed for determining patients who exhibit malnutrition or have a risk of developing malnutri-tion. There are many studies using anthropometric measurements and biochemical analyses for evalu-ating the nutritional status of COPD patients but the number of studies investigating the nutritional status using subjective global assessment in COPD patients are limited.4 The aim of this study was to determine the utility of SGA for nutritional status in COPD patients and to determine the relationships between SGA, respiratory function tests, and some nutritional parameters.
The relationship of subjective global assessment with respiratory function and other nutrition parameters in COPDNalan Hakime Nogay
Kirklareli University College of Health, Department of Nutrition and Dietetics, Kirklareli, Turkey

Vers
ion fo
r revie
w
HealthMED - Volume 6 / Number 6 / 2012
Journal of Society for development in new net environment in B&H 2019
Methods
Study PopulationThe sample of the study consisted of 79 patients
who were referred to Luleburgaz State Hospital, Chest Diseases Outpatient Clinic between Octo-ber 2010 - February 2011 and who met the inclu-sion criteria as well as accepting to participate in the study. Having a COPD diagnosis according to the Global Initiative for Chronic Obstructive Lung Disease (GOLD) criteria, not having a history of acute exacerbation that requires outpatient or in-patient intervention. Patients with concomitant di-sease that might alter nutritional status (heart dise-ase, cirrhosis, uncontrolled diabetes, chronic renal failure) were excluded from the study.
The data were collected in the Chest Diseases Outpatient Clinic. Firstly pulmonary function tests were performed of the patients. All patients un-derwent subjective assessment of nutrition
status using the SGA questionnaire and objec-tive assessment through anthropometric and bio-chemical measurements. Data were collected by a trained nutritionist, and those items of the SGA questionnaire related to metabolic stress and oede-ma were evaluated by a clinician.
Subjective global assessmentThe questionnaire used for applying SGA.5 On
the basis of the SGA findings, patients were cate-gorised as well nourished (Category A, SGA-A), mild/moderately undernourished (Category B, SGAB) or severely undernourished (Category C, SGA-C).
Anthropometric measurements and Biochemical parametersAnthropometric and biochemical assessments
were performed as soon as the subject was admi-tted to the hospital. Anthropometric parameters height, weight and body mass index (BMI) were assessed in all patients. Biochemical assays, in-cluding serum albumin, transferin, hemotocrit and haemoglobin were performed at the Laboratory of the Luleburgaz State Hospital
Pulmonary Function TestPulmonary function tests were performed with
a spirometer (ZAN 100 handy) according to the
criteria set by the American Thoracic Society. FEV1 % predicted value and FEV1/Forced Vital Capacity (FVC) ratio were measured in these tests.
Ethical Issues: Because of the absence of the ethical committee at Kirklareli city, related per-missions received from the Kirklareli Health Di-rectorate and study was arranged according to the Helsinki Declaration.6 All patients were informed about the procedures of the proposed study and written consents are taken.
Statistical analysisThe statistical analysis was performed by using
the Statistical Package for the Social Sciences (SPSS) for Windows version 15.0. 7 During this analysis of the data, descriptive statistics were computed according to the patients’ characteri-stics. Relationship between SGA and pulmonary function tests, BMI, serum albumin, transferin and haemoglobin were evaluated using pearson correlation analysis. Anova was used to test the difference among more than two groups. For all analysis, statistical significance was determined at the 5% level with 95% confidence intervals.
Results
The characteristics of the patients are shown in Table 1. Among the participants, 86.1% was male, mean age was 66.8 years, and mean disease dura-tion was 9.1 years (Table 1). According to the GOLD classification, 45.4% of the patients had moderate COPD and 38% had severe COPD (Table 1). Mean BMI values according to COPD severity are shown in Table 2. Mild COPD patients had the highest mean BMI, whereas severe COPD patients had the lowest mean BMI. The FEV1 % and FEV1/FVC (%) values in the malnutrition group were significantly lower than the well nourished group (Table 3). Table 4 shows the biochemical analysis results of the par-ticipants according to SGA groups. The hemoglobin values of participants in the SGA-C group were sig-nificantly lower than those in the SGA-A and SGA-B groups (p<0.05). It was determined that the albumin and transferin levels significantly decreased with the worsening of nutritional status (Table 4). There were significant and negative correlations between the SGA scores and respiratory parameters, albumine, hemoglobin, transferin and BMI (Table 5).

Vers
ion fo
r revie
w
2020
HealthMED - Volume 6 / Number 6 / 2012
Journal of Society for development in new net environment in B&H
Table 1. Characteristics of the participantsVariables n % Mean ± SD
Age (Year) Disease Duration(year)
66.8±10.0 9.1± 8.5
Sex : Female MaleSmokingUserQuitNever usedSeverity of COPDMildModerateSevere Very Severe
11 13.968 86.1
13 16.559 74.7 7 8.9
7 8.936 45.530 38.0 6 7.6
Table 2. Mean BMI according to COPD severity
Severity of COPD BMI(kg/m2) n Mean ± SD
MildModerateSevere Very Severe
7 28.68 ± 4.6936 27.86 ± 5.9130 25.39 ± 4.86 6 23.96 ± 5.55
Discussion
Malnutrition is an important problem and indi-cator of bad prognosis in chronic obstructive pul-monary disease (COPD).8,9,10,11 Malnutrition leads to the depletion of muscle proteins and as a result, a decrease in respiratory performance occurs.12 In addition, it increases susceptibility to pulmonary infections. Various studies suggest that its etiology is multifactorial, and that the two principal mecha-nisms involved in its genesis are inadequate inges-tion of food and increased energy expenditure.2 In a study evaluating the energy and protein intake of COPD patients, it has been found that in every COPD stage the energy and protein intake of pa-tients is below average.13
Various methods can be used in the evaluation of the nutritional state, Such methods include su-bjective global nutritional evaluation, evaluation of dietary intake, anthropometry, determination of body composition, and biochemical testing.2
Nutritional triage is a method of evaluating the nutritional state of hospitalized patients and can
Table 3. Mean respiratory function test results according to SGA
Respiratory function parameters SGA-An=40
Mean ± SD
SGA-Bn=22
Mean ± SD
SGA-Cn=17
Mean ± SD pFEV1 % FEV1/FVC (%)
54.5 ±16.266.0± 6.74
51.6 ±15.062.7 ±10.4
44.0±15.857.9 10.8
0.024*0.002*
†One-Way ANOVA * p< 0.05
Table 4. Mean biochemical values according to SGA
Biochemical parametersSGA-An=40
ortalama ± SD
SGA-Bn=22
ortalama ± SD
SGA-Cn=17
ortalama ± SD pHemoglobin (g/dl)Hemotokrit (%)Albumin (g/dl)Transferin (mg/dl)
13.58±1.5740.76±3.994.20±0.32
337.38±21.35
13.72±1.4242.11±3.503.49±0.32
256.51±17.32
11.08±1.0439.20±3.642.74±0.78
194.78±21.11
0.000*0.2840.000*0.000*
†One-Way ANOVA * p< 0.05
Table 5. The relationship between the SGA scores and some parameters Parameters n r pFEV 1 (%)
FEV1/FVC (%)Albumin (g/dl)
Hemoglobin(g/dl)Transferrin(mg/dl)
BMI(kg/m2)
79 - 0.261 0.020*79 - 0.328 0.003**79 - 0.775 0.000**79 - 0.617 0.000** 79 - 0.910 0.000**79 - 0.744 0.000**
**p<0.01, *p<0.05

Vers
ion fo
r revie
w
HealthMED - Volume 6 / Number 6 / 2012
Journal of Society for development in new net environment in B&H 2021
be performed through the protocol of the subje-ctive global nutritional evaluation. The objective of the subjective global nutritional evaluation is to identify the patients who are at nutritional risk and to then establish what level of nutrition assistance should be used (primary, secondary, or tertiary).2
Its simplicity, reliability and reproducibility are some of the traits that argue for its application in clinical practice for the nutritional assessment of COPD patients, and it correlates with the objecti-ve measures of malnutrition assessment.3
The BMI is a simple measurement which is used to determine the relationship between health status and weight. The BMI is one of the best valid pa-rameters and correlates with other nutritional pa-rameters.14 Low BMI is an independent indicator of increased mortality in COPD patients. In one study, it has been found that every 1 kg/m2 increase in the BMI is associated with a 5% decrease in death risk.15,16 Similarly, our results indicate that COPD severity increased with the decrease in the BMI.
Malnourished subjects have more severe im-pairment of pulmonary function based on FEV1% predicted. It is not clear whether poor lung function is a cause of poor nutritional status or if poor nutri-tional status precipitates a decline in lung function. In one study, it has been determined that there is a positive correlation between SGA scores and respi-ratory function parameters.3 However, in our study, there was a weak negative correlation between the SGA scores and respiratory function parameters.
Plasma proteins are transport proteins synthesi-zed by the liver and are known indicators of visce-ral protein status. Such proteins include albumin, pre-albumin, transferrin, and the retinol transport protein. Determining serum protein levels, used in conjunction with other methods of evaluating the nutritional state, is quite useful in the evaluation of patients with COPD to monitoring the nutrition therapy.2 Although in one study it has been report-ed that there was no correlation between the SGA scores and biochemical parameters3, our results indicate that there is a strong negative correlation between the SGA scores and albumin, hemoglo-bin and transferin proteins.
In conclusion, SGA is correlated to respiratory function tests and nutritional parameters in COPD patients. Therefore, SGA is a convenient and non-invasive method which can be used for evaluating
the nutritional status of COPD patients. Further studies are needed to determine the association of SGA with respiratory function tests and biochemi-cal and anthropometric measurements in the Tur-kish population.
References
1. ED Bateman, C Feldman, JO’Brien, M Plit, JR Jou-bert, GM Ainslie et al. Guideline for the Management of Chronic Obstructive Pulmonary Disease (COPD): 2004 Revision. S Afr Med J. 2004; 94: 559-575.
2. Fernandes AC, Alves Bezerra OMP. Nutrition the-rapy for chronic obstructive pulmonary disease and related nutritional complications. J Bras Pneumol. 2006;32(5):461-71.
3. B Gupta, S Kant, R Mishra. Subjective global asses-sment of nutritional status of chronic obstructive pul-monary disease patients on admission. Int J Tuberc Lung Dis. 2010;14(4):500-505.
4. Ulubay G, Görek A, Ulaşli SS, Akçay Ş, Eyüboğlu FÖ. Subjektif Global Değerlendirmenin KOAH’da Hastalik Evresi, Solunum Fonksiyon Testleri ve An-tropometrik Ölçümler ile ilişkisi. Toraks Dergisi. 2007;8(1):26-30
5. Waitzberg D L, Ferrini M T. Physical examination and anthropometry. In: Waitzberg D L. Oral nutrition and enteral vs parenteral in practical clinics. 3rd ed. Sao Paulo, Brazil: Atheneu, 2000: 255–278.
6. World Medical Association Declaration of Helsinki Ethical Principles For Medical Research Involving Human Subjects Avaible from URL: http://www.wma.net/en/30publications/10policies/b3/17c.pdf, acce-ssed 12 June 2011.
7. SPSS Inc. SPSS for windows-release 15. Chicago: SPSS Inc, 2008.
8. Dilektaşli AG, Ulubay G, Bayraktar N, Eminsoy İ, Eyuboğlu FO. KOAH’li hastalarda kaşeksi ve bi-leşenlerinin solunum fonksiyonlari üzerindeki etkisi. Tüberküloz ve Toraks Dergisi. 2009; 57(3): 298-305.
9. King DA, Cordova F, Scharf SM. Nutritional aspects of chronic obstructive pulmonary disease. Proc Am Thorac Soc. 2008; 5: 519–523.
10. Kuźnar-Kamińska B, Batura-Gabryel H, Brajer B, Kamiński J. Analysis of nutritional status distur-bances in patients with chronic obstructive pulmo-nary disease. Pol Pneumonol Allergol. 2008; 76: 327–333.

Vers
ion fo
r revie
w
2022
HealthMED - Volume 6 / Number 6 / 2012
Journal of Society for development in new net environment in B&H
11. Posłuszna D, Doboszyńska A. Assessment of nu-tritional status of patients with chronic obstructive pulmonary disease (COPD) and the impact of diet on COPD risk. Pneumonol. Alergol Pol 2011; 79, 2: 109–115.
12. Ferreira IM, Brooks D, Laçasse Y, Goldstein RS. Nutritional support for individuals with COPD: a meta-analysis. Chest. 2000;117(3):672-8.
13. Yazdanpanah L, Shidfar F, Moosavi AJ, Heidarna-zhad H, Haghani H. Energy and protein intake and its relationship with pulmonary function in chronic obstructive pulmonary disease (COPD) patients. Acta Med Iran. 2010;48(6):374-379.
14. Coşkun Ö, Uğurman F, Akkalyoncu B, Gözü A, Önde G, Samurkaşoğlu B. KOAH’da Nutrisyonel Du-rumun Belirlenmesi ve Solunum Parametreleri ile İlişkisinin Değerlendirilmesi. Solunum Hastaliklari. 2005; 16: 153-160.
15. Lainscak M, Haehling S, Doehner W, Sarc I, Jeric T, Ziherl K et al. Body mass index and prognosis in patients hospitalized with acute exacerbation of chronic obstructive pulmonary disease. J Cachexia Sarcopenia Muscle . 2011; 2:81–86.
16. Scarlata S. A correct nutritional approach as a pri-mary goal in the management of chronic obstructive pulmonary disease. Clin Ter. 2007; 158(2): 163-4.
orresponding Author Nalan Hakime Nogay, Kirklareli University College of Health, Department of Nutrition and Dietetics, Kirklareli, Turkey, E-mail: [email protected]

Vers
ion fo
r revie
w
HealthMED - Volume 6 / Number 6 / 2012
Journal of Society for development in new net environment in B&H 2023
Abstract
Objective: to establish a community based information system from comprehensive geriat-ric assessment of community dwelling elderly in a developing country, to predict an early identifi-cation of frailty, to risk stratification of future ad-verse outcomes in order to prevent and intervene diseases and disabilities of target population in home care health service schedule.
Design: Cross sectional study in districts of Karaj (North of Iran)
Participants: 195 older people living in the com-munity already receiving traditional care services.
Method: A standard CGA form that accounts for impairment, disability, and comorbidity bur-den was scored and summed as a frailty index (FI-CGA). The FI-CGA was stratified to describe three levels of frailty by 2 multidisciplinary teams.
Results: The three levels of frailty were mild (FI-CGA 0–7), moderate (FI-CGA 7–13), and se-vere (FI-CGA>13).Demographic and social traits were similar across groups. Comparing patient characteristics, so that 6 patients (10.2%) were classified as mildly frail, 48(81.4%) as moderately frail, and 5 (8.4%) as severely frail.
Conclusion: Care of the elderly is a complex process and health profesionals need to be creative and capble of working in challenging situations and the FI-CGA is a valid, reliable, and sensible clinical measure of frailty that permits risk stratifi-cation of future adverse outcomes.
Key words: Disability, Frailty, Comprehensive geriatric assessment, developing country, home health care
Introduction
In 2006, the number of persons in the world aged 60 years and older was 650 million. In 2025, the number will be almost doubled and 1.2 billion people will be 60 years and older.
By 2050, this figure will have reached 2 billion people. The population of persons older than 65 years has doubled in Iran since 1987. According to the latest population study, in 2005 in Iran 7.3% of the population were older than 60 years of age (5 million).this population is estimated to increase 10 % of total population by 2020. These changes will lead to an increase in the old-age dependency ratio which will increase the total dependency ratio by the year 2020.
The elderly populations of Iran like other de-veloping countries are increasing rapidly. These demographic changes are a direct result of the success of socio-economic development that has led to declines in mortality rates of all ages and re-ductions in fertility. However, an aged population might be expected to suffer from the problems of dependency and disability leading to an increased burden of disease. Adequate disability and life ex-pectancy data are essential for planning health and social policy but these data are currently insuffi-cient. In this regard making best use of the limited resources available for health care and integration of health care for elderly people with established health services, particularly the existing primary health care systems will be a great success.
The PHC orientation and network needs to be evaluated in terms of the health transition and In-creasing non-communicable disease burden fac-ing the country.
In this regard, Community based home care services have been developed all over the world in response to the growing elderly population and their multiple needs in health care.1. In general, a multidimensional comprehensive geriatric as-sessment to evaluate these patients is used, which includes functional, cognitive and mood scales as well as a social and environment assessment .stu-dies conducted in geriatrics units seem to agree that based on multidimensional assessments pre-vent deterioration in functional status, and so pre-
FI-CGA Score of old people by community based Information systemF. Teymoori, D. Mousavi, J. Demongeot, A Biglarian, M. Sarmadi, M. Shirazikhah
Tehran, Iran

Vers
ion fo
r revie
w
2024
HealthMED - Volume 6 / Number 6 / 2012
Journal of Society for development in new net environment in B&H
serve autonomy, and secondly lead to a reduction of admissions in general hospitals or long-term care services.2
In Iran, there isn’t any special care for elderly in our national health system. There is special at-tention to children and mother’s care as vulnerable groups but no intention to our old people.
As the heart of geriatric medicine is compre-hensive geriatric assessment (CGA). The goal, in a secondary analysis of data from the Mobile Ge-riatric Assessment Team (MGAT) trial, 3,4 was to construct an FI, investigate its construct validity, assay its predictive validity, test its interrater relia-bility, and consider its sensibility. These objectives allowed the matter of whether the frailty status of older adults can be summarized in a way that is sen-sible and practical for geriatricians to apply to be addressed.
The construct of frailty appears to have a firm biological basis,1 and frailty is easily recognized clinically.
Frailty has been measured by constructing a frailty index(FI), based on the accumulation of a variety of functional deficits (such as comorbid il-lness, poor health attitudes, signs of disease, and self-reported disabilities).5,6,7
In this pilot study we implanted CGA for eval-uation of functional status, mental & cognitive status, affection and mood ,medications, extent of social supports of community-dwelling elderly in districts of Karaj city.
We used from FI-CGA Score which have con-structed and validated by Dr.David M. Jones, MSc, MD & al)8 in their study.. The merit of the approach is that it can be done readily from data that a geri-atrician would need to gather to decide on interven-tions. As such, it requires no special instrumentation, beyond the clinical skills needed to do a CGA.3)
Methods and material
This study has been done in KAHRIZAK CHARITY FOUNDATION Clinic which has been established since 2007 in order to provide Home care and day care services for elderly popu-lation dwelling around the clinic in Karaj city. Our study is based on 195 persons who are admitted in the clinic for geriatric assessment and related service provision.
Because of no reliable statistic data’s about el-derly in developing countries who ageing is not priority for policy making ,we obtained necessary information about elderly are living in the com-munity of Karaj in 2007. (Council of Karaj and Social Welfare Organization). The intervention and management organized by two multidisci-plinary teams consist of general physician, nurses, physiotherapists, Ergo therapist, social workers, psychologists and 1 geriatrician for two teams. Each of raters completed the CGA separately. and each rater was blind to the other ratings.
Duration of our study was14 months from April 2007 to June 2008.
We could evaluate 195 old people who lived at 12 districts of Karaj at their homes. (Mohammad shahr, Mehrshahr, ect…) near to KCFDE.
All of these persons signed their consent for this pilot study. We explained the objectives of our study that is to distinguish of frail elderly who needs home care.
CGA consists of MMSE for evaluation of cognition,MNA for nutrition,GDS for depression, ADL and IADL for autonomy and tinetti for balance evaluation. Before CGA a physical exam and medi-cal history of these personnes had done. So some socio-demographic information of subjects collect-ed by social workers as Age, Education, economic satisfaction, Salary per month, familial situation.
Of 195 older patients refer to the study ,136 re-fused or withdrew before ending the assessment, leaving 59 patients with complete data for the eva-luation.
Constructing the FI-CGA
Following the method used in population-based samples, 1, 6–8 the baseline FI-CGA was calcula-ted as a count of the impairments identified at the baseline CGA. The standardized CGA used to cal-culate the FI comprises assessments in 10 standard domains: cognitive status, mood and motivation, communication, mobility, balance ,bowel func-tion, bladder function, IADLs and,nutrition, and social resources 24 Problems in each domain were scored as 0 (no problem), 1 (a minor problem),or 2 (a major problem). For evaluating the contribu-tion of each domain, the mode of the three ratings determined the value for each subject.

Vers
ion fo
r revie
w
HealthMED - Volume 6 / Number 6 / 2012
Journal of Society for development in new net environment in B&H 2025
The mean _ standard deviation value of the FI was 7.2 ± 3.0 (median 6.7, range 1–19.2). Obser-ving the frequency distribution of FI-CGA scores suggested three intervals corresponding to degrees of frailty: mild (FI-GCA 0–7),moderate (FI-CGA 7–13), frailty (FI-CGA≥13).
Results
Comparing patient characteristics, so that 6 patients (10.2%) were classified as mildly frail, 48 (81.4%) as moderately frail, and 5 (8.4%) as severely frail.
Table 1 shows the percentage of each catagory of elderly frailtyaccording FI-CGA and table 2 shows the characteristics of patients by grade of frailty.and table 3 indicates the Characteristic of Patients by Degree of Frailty Patients with diffe-rent levels of frailty are comparable in their social and demographic characteristics.
We performed two way analysis of variants to review the effect of social variants like education, total income, general hygiene, sex in assessing the frailty (Table 4).
Different age group has been considered as block factors and other social variant effects which as follows assessed as second factors for calculat-ing frailty index.
In our survey these factors of general hygiene , education and total income in different age groups of below and over 70 years old is considered ef-fective factor I variants. Table 1. FI-CGA
MildModerate
SevereTotal
Frequency648560
Percent10/281/48/4 100
Table 2. Characteristics of 59 Patients from Ka-hrizak Charity Foundation Program for ElderlyApril 2007- August 2008 Iran-Karaj
Characteristic N (percent)AGE <70 > 70
20(33.9)39(66.1)
SEX Male Female
31(51.7)29(48.3)
Education, years0-1 49(83.1)Living Status Alone With spouse With family With relatives
2(3.3)22(37.3)31(51.7)4(6.8)
Children 1 2-4 >4
1(1.7)18(30)
41(69.3)Social Security
NonNational social security ServicesWelfare organization Supportive services
21(35)27(46)
12(20)Economic Satisfaction YES no
21(35)39
Total Household Income Non <50 50-100 100-150 150-200 >200
5(8.3)8(13.3)7(11.7)
3(5)20(33.3)17(28.3)
Supportive Organisation Has Hasn’t
46(76.3)14(23.3)
Hygiene of life + -
26(43.3)34(57.7)
ADLsActivities of daily living Independent Moderately Dependent Severe Dependent Completely Dependent
18(30)22(36.7)7(11.7)12(20)
IADLsInstrumental ADL Moderately Dependent Severe Dependent Completely Dependent
15(25)17(28.3)27(45)
GDSMood Evaluation Normal Moderate severe
31(51.7)19(31.7)2(3.3)

Vers
ion fo
r revie
w
2026
HealthMED - Volume 6 / Number 6 / 2012
Journal of Society for development in new net environment in B&H
MNANutritional Evaluation >23 <=
23(38.3)37(61.7)
TinettiBalance Evaluation Normal Low risk fall High risk very High risk
7(11.7)16(26.7)7(11.7)30(50)
MMSE Cognitive Evaluation Mild cognitive impairment Moderate cognitive impairment Severe cognitive impairment
21(35)32(53.3)2(3.3)
Vision 0 1 2Hearing 0 1 2
47(78.3)7(11.7)6(6.7)
48(80)1(1.7)
11(18.3)
Medication 0 1 2
3(5)27(45)27(45)
Incontinence urine Has Hasn’tIncontinence Fecal Has Hasn’t
8(13.3)51(85)
7(11.7)52(86.7)
Table 4. Analysis of variantes to review the effect of social variants FI = Age +Factor i + age * factor i
Factor i DescriptionSex Non significantLiving alone Non significantHousing Non significant
General hygieneSignificant both in age groups and related factor I
Education Only significant in education
Children Non significantSocial security Non significantEconomic satisfaction Non significantTotal income significantSupporting organization Non significant
Disscussion
Routinely collected data from a standardized CGAwas used to construct an FI in a secondary analysis from a controlled trial of a specialized ge-riatric intervention.
The merit of the FI-CGA approach offered is that it can be done readily from data that a geriatrician would need to gather to decide on interventions. As such, it requires no special instrumentation,beyond the clinical skills needed to do a CGA. In this context, whether the FI-CGA is a sensible measure can also be addressed. There is no easy numeric test for the assessmentof sensibility, but the FI-CGA is self-evidently a sensible measure by virtue of its complete account of factors theorized to influence
Table 3. Characteristic of Patients by Degree of Frailty
Characteristic Mild Frailty ( h= 6)
Moderate Frailty (h= 48)
Severe Frailty ( h= 5)
FemaleLiving aloneAge >= 70Age: mean I SD Poor self rated hygieneEducation (1-3)Total household Income (1-4-6)ADLIADLMMSEGDSTinetti MNA
83/3-5067.17+-9.78 05033/392/5+-12/540/83+-29/421/4+-2/65/4+-3/122/2+-10/525/2+-1/1
47/910064/672.29+-9.8560/485/472/967/98+-33/9337/02+-32/1618/2+-4/55/3t3/215/5+-11/122/1+-3/6
60-10080+-9.1410010010034+-4615+-22/418/2+-5/55/3+-3/27/4+-10/318/4+-4/3

Vers
ion fo
r revie
w
HealthMED - Volume 6 / Number 6 / 2012
Journal of Society for development in new net environment in B&H 2027
frailty. It is easy to use in the setting of specialized geriatric assessment, is readily calculated, and pro-vides a means of risk stratification.. Recalling that frailty is an age-associated, nonspecific vulnerabil-ity, we consider symptoms, signs, diseases, and dis-abilities as deficits, which are combined in a frailty index. An individual's frailty index score reflects the proportion of potential deficits present in that per-son, and indicates the likelihood that frailty is pres-ent. Although based on a simple count, the frailty index shows several interesting properties, includ-ing a characteristic rate of accumulation, a sub max-imal limit, and characteristic changes with age in its distribution. The frailty index, as a state variable, is able to quantitatively summarize vulnerability and in this article we have summrized the data collec-ted from eldely population accroding to FI-CGA assessment tool.
As the provision of affordable and quality healthcare for older people is a major concern for health system in most countris, We think the detection of frail elderly people is a crucial point in planning health care services and organizing Home care services for target population.
References
1. Stuck AE, 1993#31,Van Hasstreegt JC, 2003#34, Elkan R, 2001#11, Stuck AE, 2002#4, Fried TR, 1998#17, Fletcher AE, 2004#15, Seematter-Bagnoud L, 2006@27).
2. Cohen HJ, 2002#10, Stuck AE ,2002#4, Stuck AE, 1993#31, Engelhardt JG, 1996#12,Silverman M, 1995#29).
3. Rockwood K, Stadnyk K, Carver D et al. A clinime-tric evaluation of specialized geriatric care for rural dwelling, frail older people. J Am Geriatr Soc 2000; 48: 1080–1085.
4. Rockwood K, Howlett SE, Stadnyk K et al. Respon-siveness of goal attainment Scaling in a randomized controlled trial of comprehensive geriatric asses-sment. J Clin Epidemiol 2003; 56: 736–743.
5. Rockwood K, Mitnitski AB, MacKnight C. Some ma-thematical models of Frailty and their clinical impli-cations. Rev Clin Gerontol 2002; 12: 109–117
6. Mitnitski AB, Song X, Rockwood K. The estimation of relative fitness and Frailty in community dwelling ol-der adults using self-report. Data. J Gerontol A Biol Sci Med Sci 2004; 59A:M627–M632.
7. Mitnitski AB, Graham JE, Mogilner AJ et al. Frailty, fitness and late-life Mortality in relation to chronolo-gical and biological age. BMC Geriatr 2002;2:1.
8. David M. Jones, MSc, MD,_ Xiaowei Song, PhD,w and Kenneth Rockwood, MDw Operationalizing a Frailty Index from a Standardized Comprehensive Geriatric Assessment, JAGS 52:1929–1933, 2004 by the American Geriatrics Society
Correspending Author M. Shirazikhah, Tehran, Iran, E-mail: [email protected]

Vers
ion fo
r revie
w
2028
HealthMED - Volume 6 / Number 6 / 2012
Journal of Society for development in new net environment in B&H
Abstract
Background: The aim of the present study was to establish the nutrition knowledge and behaviors of adults and determine the effects of knowledge on behavior.
Methods: A descriptive study was conducted in Ankara, the capital city of Turkey. Data was co-llected through a survey questionnaire. The Likert type scale was used to determine their nutrition behavior. Gender, marital status, education, age, university major, professions were considered as variables in the study. The “independent t test” was used for the variable of gender and “One-Way Anova” for education. The source of the differen-ce among groups was identified by using the LSD Test. Nutrition knowledge and behavior questions were asked and compared to each other. The study included 400 volunteering adults who were held a minimum of a university degree.
Results: The knowledge level of individuals were observed to vary by gender, education, age, university major and profession, while behavior scores varied only by age.
Conclusion: The current study found that indi-viduals with a high knowledge score had low be-havior scores, thus showing that they failed to turn their theoretical knowledge into behavior.
Key words: Nutrition, knowledge, behavior, adult, Turkey
Introduction
Factors influencing individuals’ food intake are divided into four groups: income level, price of food, price of other products, and individuals’ food choices and nutrition and health knowledge. A change in consumption requires a change in at le-ast one of these factors. Individuals’ home lives and personal characteristics such as family size or edu-
cational background are also known to influence their food consumption. As it is easier for educated individuals to absorb, process and use information, they may be more knowledgeable about nutrition and reflect this in their food choices (1).
Nutrition education involves learned experien-ces which lead to the voluntary adoption of posi-tive eating behaviors that assist good health. The efficiency of such education may be appropriately assessed by the resulting behavioral change (2).
In contrast to common thought, nutrition edu-cation is a challenging task as it is not easy to change the nutrition habits of people (3). Research indicates that behavioral change is directly related to the amount of nutrition education received (4).
Although knowledge is an obvious factor that is expected to bring behavioral change, the results of the studies cited in the literature are not conclusive with respect to the effects of nutrition knowledge on dietary behavior (5). While many of the studi-es which have analyzed the association between knowledge and dietary behavior found a positive association between the two (2, 6-11), the strength of this relationship seems to vary among studies and is generally weak (9). Comparative studies concer-ning the predictors of healthy nutrition habits, i.e. age, gender and education level, found that the un-derstanding of healthy nutrition was most signifi-cantly affected by educational background (12). On the other hand, various previous studies reported that dietary behavior is influenced by demographic characteristics (13), lifestyle, health factors (14), nutrition knowledge (13, 15-18) and socio-psycho-logical factors (13, 15, 18-20). Another study con-cluded that the most prevalent reason for dietary behavior change was a health-related problem (9).
In sum, previous studies showed that women had more dietary knowledge than men (7, 21-26); a higher socioeconomic (1, 24, 25) and educatio-nal level (22, 23, 25, 27, 28) indicated more ad-
Does Nutrition Knowledge Change Nutrition Behavior?Asli Ucar1, Yahya Ozdogan2, Ayse Ozfer Ozcelık1
1 Department of Nutrition and Dietetics, Faculty of Health Sciences, Ankara University, Ankara, Turkey,2 School of Home Economics, Department of Nutrition Sciences, Ankara University, Ankara, Turkey.

Vers
ion fo
r revie
w
HealthMED - Volume 6 / Number 6 / 2012
Journal of Society for development in new net environment in B&H 2029
vanced dietary knowledge; and middle-aged indi-viduals were generally more knowledgeable than youngsters or elders (1, 27 ,28).
The aim of the present study was to establish the nutrition knowledge and behaviors of adults, and determine the effects of nutrition knowledge on their behavior. Our hypothesis was that nutriti-on knowledge is necessary for nutrition behavior change.
Materials & Methods
Participants were 400 volunteering adults re-siding in Ankara who were aged between 22 and 69 (247 female, 153 male). All participants were chosen randomly and held a minimum of a univer-sity degree. Data were gathered by using a questi-onnaire consisting of items under three headings: “General Information about Adults”, “Nutrition Knowledge of Adults”, and “Nutrition Behavior of Adults”. The questionnaire was adapted from a study by Turrel (1997) (26).
Each correct response about nutrition knowled-ge was assigned 1 point, and each incorrect or un-decided response was given 0. In order to identify adults’ nutrition behavior, a 14-item Likert type sca-le was used. The responses were “always, mostly, sometimes, rarely and never” and they were allo-cated scores ranging between 1 and 5, with 1 indi-cating never and 5 indicating always. Negative sta-tements were reverse scored. The maximum score for completing the entire knowledge questionnaire correctly was 20, while the maximum score for the behavior questionnaire was 70.
Data obtained at the end of the study were eva-luated by the SPSS software. For statistical anal-yses, tables showing mean values, standard devia-tions ( X S D± ) and percentages (%) were prepa-red. When identifying the nutrition knowledge of participants, “independent t test” was used for the variable of gender and “One-Way Anova” for edu-cation. The source of the difference among groups was identified by using the LSD Test, and the Pe-arson product-moment correlation coefficient was used to study the relationships between nutrition knowledge and behavior. Institutional Review Bo-ard approval was not required for this study.
Results
Table 1 shows the sociodemographic charac-teristics of participants, 61.8% of whom were females and 38.2% males. The majority were aged between 26 and 35 (44.5%) with the mean age being 35.65+8.6 (females 34.63+7.71, males 37.29+9.69). A total of 68.7% were university gra-duates and 48.7% had a degree in social sciences. Sixty-four percent were married, and 32.1% were working in the health sector.Table 1. Socio-demographic characteristics (n=400)
Gender n %Female 247 61.8Male 153 38.2Age≥25 44 11.026-35 178 44.536-45 120 30.0<46 58 14.5EducationUniversity 275 68.7Msc. 70 17.5PhD 55 13.8University majorScience 122 30.5Social science 195 48.7Health 83 20.8Marital StatusMarried 256 64.0Single 144 36.0Profession Civil cervant 84 21.0Military personnel 4 1.0Self-employment 43 10.8Health 129 32.1Retired 5 1.3House wife 6 1.5Private sector 15 3.8Education 114 28.5
The responses given to the items about nutriti-on knowledge are presented in Table 2. Statements that were answered correctly by more than 90% of participants included the following: “Calcium is necessary for bone and teeth formation” (98.8%), “Oranges and other citrus fruits are the best so-urces of vitamin C” (98.3%), “Dairy products are the best sources of calcium” (95.0%), “Everybody has the same daily energy need” (94.0%), “Fiber

Vers
ion fo
r revie
w
2030
HealthMED - Volume 6 / Number 6 / 2012
Journal of Society for development in new net environment in B&H
Table 2. The responses given to the items about nutrition knowledge (%) (n=400)Items Female Male Total
1. Calcium is used for building bones and teeth. 99.6 97.4 98.82. Oranges and other citrus fruits are good sources of vitamin C. 97.6 99.3 98.33. Milk and dairy products are good sources of calcium. 95.1 94.8 95.04. Everybody has the same daily energy need.(-) 94.7 92.8 94.05. Fibre helps to regulate bowel motions. 94.3 88.2 92.06. Fruit and vegetables are a good sources of fibre. 93.5 87.6 91.37. It is recommended that adults have some milk, cheese or yoghurt everyday. 95.1 84.3 91.08. Iron is used for making red blood cells. 89.1 81.0 86.09. Chicken, fish and eggs are a good source of fibre.(-) 88.7 80.4 85.510. Protein is used for tissue building and repair. 83.4 84.3 83.811. Foods containing carbohydrate are a good source of energy. 81.8 83.7 82.512. Vitamin-mineral tablets are needed even in the presence of an adequate and balanced diet. (-) 79.4 77.1 78.5
13. Fats fulfill important tasks in the body. 78.1 73.2 76.314. Milk and dairy products are good sources of iron.(-) 77.3 62.1 71.515. Meat, kidney and liver are good sources of iron. 74.9 62.1 70.016. Animal foods contain cholesterol, phyto foods do not. 71.3 66.7 69.517. In a healthy diet, unsaturated fats should exceed saturated ones. 72.1 62.1 68.318. Bread, cereal, fruit and vegetables should make up the largest part of our diet. 54.7 55.6 55.019. Meat, fish, chicken and eggs should make up the largest part of our diet. (-) 60.3 67.3 63.020. Dark green vegetables such as spinach are good sources of vitamin A. 38.1 35.3 37.0
Table 3. Nutrition behaviors of adults (%) (n=400)Statements Always Mostly Sometimes Rarely Never
1. I eat two portions of fruit daily. 1 16.2 28.3 29.6 21.5 4.52 11.8 21.6 37.3 20.9 8.5
2. I eat fruit and vegetables when I crave sweets. 1 3.2 18.2 30.8 31.6 16.22 3.9 17.6 24.8 28.1 25.5
3. I add sugar to my drinks. (-) 1 16.2 19.4 15.0 14.2 35.22 21.6 29.4 12.4 16.3 20.3
4. I spread butter or margarine as thinly as possible on bread. (-)
1 19.8 11.7 12.1 24.7 31.62 9.2 19.6 17.6 22.9 30.7
5. I remove the skin from the chicken before I eat. 1 72.1 16.2 6.9 3.2 1.62 46.4 19.6 15.7 5.2 13.1
6. I add sugar to breakfast cereals. (-) 1 4.5 5.7 13.0 11.3 65.62 9.2 11.1 9.2 9.2 61.4
7. I drink 8 glasses of water everyday. 1 23.5 23.9 26.3 17.4 8.92 21.6 34.6 22.2 13.7 7.8
8. My daily diet contains fruit and vegetables. 1 9.7 42.5 30.0 14.2 3.62 7.8 25.5 34.0 26.1 6.5
9. I take the skin off before I eat fruit such as apples. (-) 1 7.3 10.1 26.7 21.1 34.82 8.5 11.8 22.2 20.9 36.6
10. I eat fruit and vegetables as snacks. 1 6.5 29.6 41.7 18.6 3.62 6.5 29.4 32.7 25.5 5.5
11. I eat crisps as snacks. (-) 1 1.2 3.6 15.8 31.2 48.22 0.7 3.3 11.8 25.5 58.8
12. I add salt to meals after they are cooked. (-) 1 3.6 8.1 15.0 13.0 60.32 3.3 15.7 11.1 19.6 50.3
13. I eat the outer leaves of vegetables such as lettuce or cabbage.
1 12.6 21.7 18.6 16.2 27.92 13.1 21.6 17.6 15.0 32.7
14. I season my food with lemon juice and greens instead of salt.
1 10.9 32.0 30.4 15.8 10.92 9.2 26.1 33.3 20.9 10.5
1.Female 2. Male

Vers
ion fo
r revie
w
HealthMED - Volume 6 / Number 6 / 2012
Journal of Society for development in new net environment in B&H 2031
helps regulate bowel movement” (92.0%), “Fru-it and vegetables are the best resources of fiber” (91.3%), and “Adults are recommended to inclu-
de milk, cheese and yoghurt in their daily diets” (91.0%). More women responded correctly to all statements but five (2, 10, 11, 18, 19) than men.
Table 4. The knowledge and behavior mean scores of adults according to certain variables (n=400)The knowledge mean scores The behavior mean scores
X S t p X S t pGenderFemale 16.21 2.27 3.349 0.001 a 34.65 6.87 -3.357 0.001 a
Male 15.35 2.82 37.04 6.98Marital statusMarried 15.98 2.45 3.520 0.061 35.12 7.10 0.002 0.968Single 15.70 2.65 36.35 6.78Education F p F pUniversity 15.56 2.54
9.369 0.000 a 1-3,2-3
35.88 6.782.736 0.066Msc. 16.20 2.55 35.95 7.26
PhD. 17.09 2.03 33.52 7.53Age <25 15.31 2.93
4.005 0.008 a 1-3, 2-3
37.34 6.93
12.815 0.000 a
1-3,1-4,2-3,2-4
26-35 15.61 2.65 37.36 6.7436-45 16.51 2.03 33.94 6.76>46 15.84 2.53 32.08 6.34University majorScience 16.40 2.16
17.338 0.000 a 1-2,2-3
36.05 6.581.965 0.142Social science 15.16 2.65 35.83 7.37
Health 16.80 2.27 34.22 6.62Profession Civil cervant 14.71 2.74
6.884 0.000 a
1-4,1-83-44-74-8
35.82 7.07
0.667 0.700
Military personnel 15.00 3.55 37.50 7.04Self-employment 15.41 2.55 35.76 7.37Health 16.88 1.88 35.86 6.74Retired 15.20 3.63 30.60 5.17House wife 16.00 2.44 33.83 7.41Private sector 14.73 2.25 33.66 7.40Education 16.00 2.54 35.46 7.16Total 15.88 2.53 35.57 7.00
a It is significant at 0.01 level
Table 5. Pearson correlation matrix of certain variables used in the study (n=400)1 2 3 4 5 6 7 8
1.Knowledge score 1.02.Behavior score -.181a 1.03.Gender -.166a .166 a 1.04.Education .212a -.098 -.070 1.05.Age .109 b -.278 a .127 b .018 1.06.Marital Status -.052 .084 -.087 -.114 b -.395 1.07. University major .017 -.086 -.073 -.027 -.009 -.014 1.08.Profession .0122 b -.037 -.199 a .246 a .033 -.141 a .022 1.0
a Correlation is significant at 0.01 level b Correlation is significant at 0.05 level
Vers
ion fo
r revie
w
2032
HealthMED - Volume 6 / Number 6 / 2012
Journal of Society for development in new net environment in B&H
Table 3 presents data about participants’ nutri-tion behaviors. It can be seen that 62.3% repor-ted to “always” remove the skin of chicken. More than half the participants responded “never” to the statements “I add sugar to cereal” (64.0%), “I eat crisps as snacks” (52.3%), “I add salt to my food before I even taste it” (56.5%). Responses to other items were “sometimes” and “rarely”.
In Table 4, mean knowledge and behavior sco-res of adults are shown by considering certain va-riables. In the overall sample, mean knowledge score was 15.83+2.53, and mean behavior score was 35.57+7.00. While women’s mean knowled-ge score (16.21+2.27) was higher than that of men (15.35+2.82), their mean behavior score was lower (F:34.65+6.87, M:37.04+6.98). The mean knowledge scores of married individuals were hi-gher but their mean behavior scores were lower. As participants’ educational level increased, so did the-ir knowledge score; however, the same trend was not observed in their behavior scores. The mean knowledge scores of middle-aged participants were the highest, and behavior scores dropped with age. The knowledge scores of individuals educated in social sciences were the lowest, as was the behavi-or scores of individuals educated in health sciences. Considering fields of work, the knowledge scores of civil servants and the behavior scores of retirees were the lowest. It was noteworthy that while the knowledge scores of health sector workers were the highest, it was military workers whose beha-vior scores were the highest. Participants’ mean knowledge scores varied with gender, education, age, university major and profession (p<0.01), whi-le behavior scores varied only with age (p<0.01). Even though the knowledge scores of individuals with a PhD degree were the highest, their behavior scores were the lowest. While the knowledge sco-res of people with a degree or who were employed in the health sector were high, their behavior sco-res were not. Having low behavior scores despite a high level of knowledge shows that theoretical knowledge was not always put into practice.
According to the Pearson correlation analysis, a significant negative association existed between adults’ knowledge and behavior scores and their gender (respectively r=-.181, -.166), while a si-gnificant positive association existed between the-ir knowledge and behavior scores and their edu-
cational level (r=.21) and age (r=.109) (Table 5). Behavior scores were positively related to gender (r=.166), and negatively to age group (r=-.278).
Discussion
Perhaps the most serious problem related to nu-trition is that individuals cannot easily transfer the-ir theoretical knowledge into practice. This study was conducted to identify adults’ nutrition-related knowledge and behaviors, and determine whether they could put their knowledge into practice. Of the 20 statements aiming to test knowledge, 17 were answered correctly by more than 70% of the participants. None of the participants were able to obtain the maximum score (20) in the knowled-ge part (15.88+2.53). The number of participants who exhibited positive behaviors related to the 14 statements aiming to identify nutrition behaviors was very small. The mean behavior score was 35.57+7.00 (out of a total of 70 points).
The knowledge level of individuals were obser-ved to vary by gender, education, age, university major and profession, while behavior scores varied only by age (p<0.05). It was a noteworthy finding that individuals with a high knowledge score con-sistently obtained the lowest behavior scores regar-dless of the variable. Thus, even though individuals may have knowledge, it is possible that they do not put it into use. Likewise, Buttriss (1997) concluded that individuals failed to successfully use their the-oretical knowledge in healthy food selection (24). Another study also found that knowledge of nutriti-on only minimally affects dietary behavior (5).
In the present study, it was seen that women, married individuals and those with a PhD degree had the highest knowledge scores. Another previ-ous study found that women’s knowledge scores varied by their educational level, and that a higher educational level meant higher knowledge scores. The same study also found that living with a par-tner brought higher knowledge scores than living alone (29). Özcelik and Ucar (2008) reported that women had more nutrition knowledge than men (30). Yet another study found that women’s dietary knowledge scores were higher than those of men; those of middle-aged individuals were higher than younger and older people; the lowest knowledge scores belonged to the oldest age group; and a hi-

Vers
ion fo
r revie
w
HealthMED - Volume 6 / Number 6 / 2012
Journal of Society for development in new net environment in B&H 2033
gher level of education meant a higher knowledge score (7). Stanek and Sempek (1991) associated nutrition knowledge with educational level, not nu-trition knowledge scores (31). Another study found that women, individuals with a high educational level and middle-aged persons had better nutrition knowledge (1). Sapp and Jensen (1997) also reached similar conclusions (25). A study showed that men, young people and people with a high educational le-vel had a more positive attitude towards general nu-trition issues (27). The same study also identified a meaningful relationship between nutrition knowled-ge and health-related attitudes, general nutrition atti-tudes, and foods with a high fat and cholesterol con-tent. Larzelere et al. (2005) also found that women and well-educated people had a better knowledge level, but failed to establish a link between indivi-duals’ nutrition knowledge and age (22). Parmenter et al. (2000) concluded that women, people with a high educational status, married people and midd-le-aged individuals had better nutrition knowledge (23). Variyam and Bloylock (1998) stated that better educated persons displayed fewer healthy eating be-haviors; however, there was no difference between women and men (1). Sharma et al. (2008) found that although women were more knowledgeable than men, the nutrition behaviors of the two were similar (21). They also observed that nutrition knowledge affected nutrition behavior regarding all food groups other than fruit and vegetables.
The answers obtained in the present study regar-ding the fruit and vegetable consumption of indivi-duals showed that they did not consume sufficient fruit and vegetables (statements 1,10,14,2,8 and 13). However, in other studies, it was found that pe-ople with a high daily consumption of fruit and ve-getables had more advanced nutrition knowledge.
There may be various reasons why individuals do not practice their nutrition knowledge. A major reason may be the insufficiency of motivating fac-tors (diseases, the media, family pressure and envi-ronmental pressure). In a study it was found that in-dividuals’ nutrition behaviors were determined not only by their knowledge but also by their beliefs and values (5). Another study showed that a major reason for a change in eating behaviors was the ill-ness of a family member (24). Another reason may be a mere lack of interest in nutrition. On the other hand, correct messages about nutrition dissemina-
ted by the media may positively influence individu-als’ food preferences. In a study people were shown to be more interested in learning about issues such as weight loss, cancer protection, foods that impro-ve skin condition, food safety and preservatives rat-her than the nutritional content of foods. The author attributed this to the fact that individuals only seek knowledge in issues that interest them (5). While Buttriss (1997) identified the biggest obstacle for individuals as absence of knowledge, this study showed that even in the presence of knowledge, people did not always put it into practice (24). It was particularly noteworthy that health sector in-dividuals had rather low nutiriton behavior scores. This may have been due to their hectic schedule and short lunch breaks.
Conclusions
This study found that individuals with high nu-trition knowledge scores had low behavior scores, thus showing that they failed to put their theoretical knowledge into practice. It is obvious that passive knowledge will not have any positive effects on hu-man health. Although the importance and positive effects of education cannot be denied, it should be remembered that behaviors are shaped by people’s life conditions. Nutrition education programs sho-uld consider the difficulty of changing existing ha-bits, and inform individuals about how their health would be positively affected by putting their nutriti-on knowledge into practice. In this way, individuals would be led to healthy nutrition habits.
Acknowledgements
We wish to thank the all adults that participated in our study.
References
1. Variyam JN, Blaylock J. Unlocking the mystery between nutrition knowledge and diet quality. The Diet Quality Balancing Act 1998; 694: 5402-57.
2. Contento IR, Randell JS, Basch CE. Review and anal-ysis of evaluation measures used in nutrition educati-on intervention research. Journal of Nutrition Educa-tion and Behavior 2002; 34: 2-25.
3. WHO: Preparation and use of food-based dietary gu-idelines. Report of a joint FAO/WHO Expert Consul-

Vers
ion fo
r revie
w
2034
HealthMED - Volume 6 / Number 6 / 2012
Journal of Society for development in new net environment in B&H
tation, Nicosia, Cyprus. Geneva, Switzerland: WHO/NUT/96.6. 1996.
4. Martin C. Nutrition education. [cit. 26 November 2011]. Available from: http://www.faqs.org/nutrition/Met-Obe/Nutrition-Education.html.
5. Worsley A. Nutrition knowledge and food consump-tion: can nutrition knowledge change food behav-ior? Asia Pacific Journal of Clinical Nutrition 2002; 11(Supply): 579-85.
6. Obayashi S, Bianchi LJ, Song WO. Reliability and validity of nutrition knowledge, social-psychological factors, and food label use scales from the 1995 diet and health knowledge survey. Journal of Nutrition Education and Behavior 2003; 35: 83-92.
7. Wardle J, Parmenter K, Waller J. Nutrition knowledge and food intake. Appetite 2000; 34: 269-75.
8. Weaver M, Poehlitz M, Hutchison S. 5 a day for low-income families: evaluation of an advertising cam-paign and cooking events. Journal of Nutrition Edu-cation 1999; 31: 161-69.
9. Harnack L, Block G, Subar A, Lane A, Brand R. Association of cancer prevention-related nutrition knowledge, beliefs, and attitudes to cancer preventi-on dietary behavior. Journal of the American Dietetic Association 1997; 97: 957-65.
10. Stafleu A, Van Staveren WA, De Graaf C, Burema J, Hautvast JG. Nutrition knowledge and attitudes towards high-fat foods and low-fat alternatives in three generations of women. Europan Journal of Clinical Nutrition 1996; 50: 33-41.
11. Axelson MI, Fedeline TL, Brinberg D. A meta-anal-ysis of food and nutrition-related research. Journal of Nutrition Education 1985; 17: 51-54.
12. Margetts BM, Martinez JA, Saba A, Holm L, Kear-ney M, Moles A. Definitions of 'healthy' eating: A Pan-EU survey of consumer attitudes to food, nutri-tion and health. Europan Journal of Clinical Nutriti-on 1997; 51(2): 23-9.
13. 13 Morton JF, Guthrie JF. Diet-related knowledge, attitudes, and practices, of low-income individuals with children in the household. Family Economics and Nutrition Review 1997; 10: 2-15.
14. Smith MJ, Johnson RK, Wang MQ. The association between smoking and the diet and health attitudes, awareness, and knowledge of low income parents. Fa-mily Economics and Nutrition Review 1997; 10: 16-25.
15. Shepherd R, Stockley L. Nutrition knowledge, attitu-des, and fat consumption. Journal of the American Dietetic Association 1987; 87: 615-19.
16. Jensen HH, Kesavan T, Johnson SR. Measuring the impact of health awareness on food demand. Review of Agricultural Economics 1992; 14: 299-312.
17. Frazao B, Cleveland L. Diet-health awareness about fat and cholesterol-only a start. Food Review 1994; 17: 15-22.
18. Variyam JN, Blaylock J, Smallwood DM. Modeling nutrition knowledge, attitudes, and diet-disease awareness: the case of dietary fiber. Statistics in Me-dicine 1996; 15: 23-35.
19. Glanz K, Kristal AR, Sorensen G, Palombo R, Hei-mendinger J, Probart C. Development and validati-on of measures of psychological factors influencing fat-and fiber-related dietary behavior. Preventive Medicine 1993; 22: 373-87.
20. Stafleu A, Graaf C, Staveren W. Attitudes towards high-fat foods and their low fat alternatives: reliability and relationship with fat intake. Appetite 1994; 22: 183-96.
21. Sharma SV, Gernand AD, Day RS. Nutrition knowled-ge predicts eating behavior of all food groups except fruits and vegetables among adults in the Paso del Norte Region:Qué Sabrosa Vida. Journal of Nutrition Education and Behavior 2008; 40: 361-68.
22. Larzelere M, Marchand S, Chen H, Tillery B, Zoorob R. Basic nutrition:what patients know and don’t know. Middle East Journal of Family Medicine 2005; 3:2.
23. Parmenter K, Waller J, Wardle J. Demographic va-riation in nutrition knowledge in England. Health Education Research 2000; 15: 163-74.
24. Buttriss JL. Food and nutrition: attitudes, beliefs, and knowledge in the United Kingdom. American Journal of Clinical Nutrition 1997; 65: 1985-95.
25. Sapp AG, Jensen HH. Reliability and validity of nutri-tion knowledge and diet-health awareness tests develo-ped from the 1989-1991 diet and health knowledge sur-veys. Journal of Nutrition Education 1997; 29: 63-72.
26. Turrell G. Determinants of gender differences in die-tary behavior. Nutrition Research 1997; 17: 1105-20.
27. Lin W, Lee YW. Nutrition knowledge, attitudes, and die-tary restriction behavior of the Taiwanese elderly. Asia Pacific Journal of Clinical Nutrition 2005; 14: 221-29.
28. Levy AS, Fein SB, Stephenson M. Nutrition knowled-ge levels about dietary fats and cholesterol: 1983-1988. Journal of Nutrition Education 1993; 25: 60-6.
29. Vriendt TD, Matthys C, Verbeke W, Pynaert I, Henauw SD. Determinants of nutrition knowledge in young and middle-aged Belgian women and the association with their dietary behavior. Appetite 2009; 52: 788-92.
30. Özcelik AO, Ucar A. Gender differences in adult’s knowledge about dietary fats, cholesterol, fiber and energy. Pakistan Journal of Nutrition 2008; 7: 234-39.
31. Stanek K, Sempek D. Food supplement use as related to nutrition knowledge and dietary quality of the elderly. Journal of Nutrition For The Elderly 1991; 10: 33-44.
Correspondening Author Yahya Ozdogan, School of Home Economics, Department of Nutrition Sciences, Ankara University, Turkey, E-mail: [email protected]
Vers
ion fo
r revie
w
HealthMED - Volume 6 / Number 6 / 2012
Journal of Society for development in new net environment in B&H 2035
Abstract
Background: Premature infants fungal infecti-ons are common cause of morbidity and mortality in the NICU. Few studies have been done on clini-cal features of premature infants fungal infection. This paper focuses on the clinical characteristics.
Methods: A retrospective study was conduc-ted to describe 37 cases of fungal bloodstream infection in premature infants, compared with the laboratory data (Complete blood count, CRP, Li-ver function, Biochemical, Electrolytes, Blood gas analysis) at 3 different time points that was hospi-tal admission, suspected fungal infections and an-ti-fungal treatment for 2 weeks. One-way ANOVA was used for analysis. If equal variances assumed, LSD was performed for multiple comparisons. Equal variances not assumed, with Tamhane's T2 method for multiple comparisons.
Results: The mean time 17 days after preterm infants birth were predisposed to fungal infections. The most common species isolated from these pre-mature infants was Candida albicans (35.1%), fo-llowed by Candida parapsilosis (29.7%), Candida famata (10.8%). The clinical manifestations of fun-gal bloodstream infection in premature infants were platelet reduction, poor response, poor perfusion, respiratory rhythm and heart rate change, hypother-mia, weight not increase, feeding intolerance, more sputum in mechanical ventilation, difficult to with-drawal ventilator, unexplained deterioration and so on. One-way ANOVA analysis results: Plat, HCT, MCV, MCH, PDW, MPV, CRP had significant diffe-rence, F values were: 18.008, 4.018, 44.619, 47.265, 8.834, 4.681, 8.151. Liver function: ALT, TBIL, CK, CKMB, ALB, LDH had significant difference, F values were: 8.937, 6.401, 13.446, 16.699, 3.331, 77.475. Only Ca2 + had significant difference in blo-od gas and electrolyte analysis, F = 6.292, p <0.05.
Drug susceptibility results showed only 3 cases of fluconazole-resistant.
Conclusion: This study emphasizes that it hig-hly suspect of fungal bloodstream infection to pre-term infants who occurs non-specific manifestati-ons of infectious illness, platelet reduction, CRP, PDW, MPV increase.
Key words: preterm infants; fungi; sepsis; pla-telets; CRP
Introduction
Abundant literatures reported: the deep fungal infection had become an important cause of noso-comial infection in the neonatal intensive care unit (NICU), prematurity, extremely low birth weight (ELBW) or very low birth weight (VLBW), cen-tral venous catheter, total parenteral nutrition, pro-longed duration of antibiotics treatment were the high risk factors of fungal infections, mortality up to 20-40%[1].Fungal infections accounted for 9% in late-onset neonatal infections [2]. Neonatal fungal sepsis incidence was 0.04-0.2% in NICU, whi-ch VLBW was 3.8-12.9%, the incidence of deep fungal infections in the past 30-year had increased about 36-times [3].For example, with systemic can-didiasis, 2.6% to 3.1% of VLBW infants (birth we-ight < 1500 g), and 5.5% to 10% of ELBW infants (birth weight < 1000 g) developed candidemia[4].Early lack of specific clinical manifestations of fun-gal bloodstream infection, especially in premature infants, little data have been done on clinical featu-res of preterm infants suffering from fungal infec-tions. This study retrospectively analyzed clinical and laboratory data about fungal sepsis in preterm children 37 cases, including clinical manifestations, compared with laboratory test (complete blood co-unt, CRP, liver function, biochemistry, electrolytes and blood gas analysis) at 3 different time points
The clinical characteristics of fungal bloodstream infection in premature infants 37 cases Shaodong Hua1, Zhixin Wu1, Xiuxiang Liu2, Zhichun Feng1
1 Department of Pediatrics, BaYi Children’s Hospital of The General Military Hospital of Beijing PLA, Beijing, P. R. China,2 The hospital affilicated Binzhou Medical University, Binzhou, Shanddong Province, P. R. China,

Vers
ion fo
r revie
w
2036
HealthMED - Volume 6 / Number 6 / 2012
Journal of Society for development in new net environment in B&H
that was hospital admission, suspected fungal in-fection and anti-fungal treatment for 2 weeks. The report was as follows.
This article was retrospective research on cli-nical characteristics of fungal bloodstream infec-tion in preterm infant. Procedures was performed according to the Helsinki Declaration and appro-ved by institutional Review Board (Institutional Review Board of The General Military Hospital of Beijing PLA).The blood sampling of preterm infants were collected according to patient condi-tion after approval was obtained from their famili-es during hospitalization period.
Materials and Methods
The clinical conditions of Preterm infantsThere were 12 female and 25 male preterm in-
fants. The hospital day ranged from 18 days to 129 days, with an average of hospital stay 57.44 ± 24.8 days. There were natural delivery 19 cases, cesarean section 18 cases; fetal distress 7 cases. Two and three degree amniotic fluid contamination was 5 and 2 ca-ses; bloody amniotic fluid 2 cases. The preterm in-fants ranged in gestational age from 27 to 36 weeks, 27 to 30 weeks 21 cases, 31 to 33 weeks 13 cases, 35 weeks 1 case, 36 weeks 2 cases. The lowest birth weight was 800g, maximum 2815g, <1500g 24 ca-ses, 1500 to 2500g 9 cases,> 2500g 4 cases.
The clinical conditions of MotherThe clinical conditions of mother were normal
7 cases. There were pregnancy diabetes 5 cases, pregnancy-induced hypertension 4 cases, pre-ec-lampsia 3 cases, kidney failure 1 case, hypothyro-idism 1 case, syphilis infection 2 cases, flu in pre-gnancy 3 cases, double uterus pregnancy 1 case. 4 cases were treated by antibiotic during pregnancy, pregnancy fever 2 cases, amniotic membrane cho-rioamnionitis 7 cases. There were 19 cases of pre-mature rupture of membrane (PROM) which ran-ged in time from 2 hours to 288 hours, less than 24 hours 9 cases, 31 to 100 hours 7 cases, more than 100 hours 3 cases. There were Placenta previa 1 case and oligohydramnios 2 cases.
Clinical manifestationsThere were platelet reduction 22 cases, poor
response 26 cases, peripheral skin cold and cya-
nosis 16 cases, the skin dull marble-like change 15 cases, low body temperature 15 cases, difficult to withdrawal ventilator 14 cases, frequent apnea 12 cases, bradycardia 12 cases, unable to maintain oxygen saturation without oxygen 12 cases, wei-ght not increased 11 cases, feeding intolerance 11 cases, tachypnea 10 cases, abdominal distension 9 cases, heart rate increase 8 cases, excessive phle-gm ropiness 6 cases, body temperature increase 3 cases, unexplained deterioration 4 cases.
Supplementary examination
Laboratory methodsORION Company for the semi-automatic de-
vice TURBOXPLUS, immune turbidimetry CRP Assay kit were purchased from ORION Compa-ny, SYSMEX Corporation production XT-2000i of automated blood cell Analyzer, Germany pro-duced by Roche COBAS INTEGRA 400 plus automatic biochemical analyzer. U.S. GEM3000 Analyzer was used for blood gas analysis.
Fungal culture and antifungal susceptibility testing Sabouraud culture medium, CHROMagar
chromogenic medium were provided by the Gu-angzhou Science and Technology Co. Ltd. Jing Di; API20CAUX yeast identification strip and ATBFUNGUS 3 fungal susceptibility strip were provided by France bioMerieux.
Clinical diagnosis of diseaseDiagnostic criteria adopted “Practical Neona-
tology” the Fourth Edition. There were neonatal res-piratory distress syndrome(NRDS)22 cases, neona-tal pneumonia 25 cases, retinopathy of prematurity (ROP)21 cases, neonatal jaundice 18 cases, neonatal anemia 12 cases, cranial hemorrhage 7 cases, neo-natal necrotizing enterocolitis (NEC)5 cases, disse-minated intravascular coagulopathy (DIC)4 cases, pneumothorax 4 cases, patent ductus arteriosus bed-side ligation 3 cases, congestive heart failure 1 case, renal function failure 1 case, intestinal perforation 1 case, hypoxic-ischemic encephalopathy (HIE)1 case, periventricular leukomalacia 1 case, fungal encephalitis 1 case, pulmonary hemorrhage 1 case, bronchopulmonary dysplasia 1 case, binoculus fun-gal choroiditis 1 case, congenital cataract 1 case.
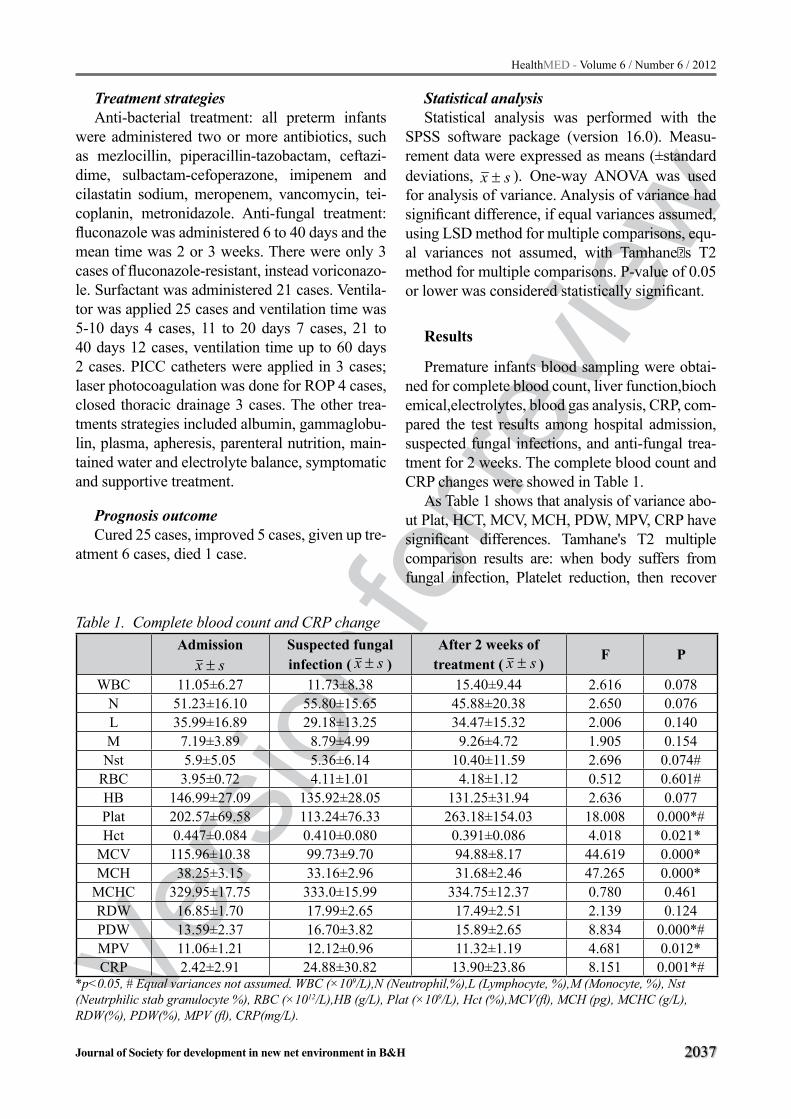
Vers
ion fo
r revie
w
HealthMED - Volume 6 / Number 6 / 2012
Journal of Society for development in new net environment in B&H 2037
Treatment strategiesAnti-bacterial treatment: all preterm infants
were administered two or more antibiotics, such as mezlocillin, piperacillin-tazobactam, ceftazi-dime, sulbactam-cefoperazone, imipenem and cilastatin sodium, meropenem, vancomycin, tei-coplanin, metronidazole. Anti-fungal treatment: fluconazole was administered 6 to 40 days and the mean time was 2 or 3 weeks. There were only 3 cases of fluconazole-resistant, instead voriconazo-le. Surfactant was administered 21 cases. Ventila-tor was applied 25 cases and ventilation time was 5-10 days 4 cases, 11 to 20 days 7 cases, 21 to 40 days 12 cases, ventilation time up to 60 days 2 cases. PICC catheters were applied in 3 cases; laser photocoagulation was done for ROP 4 cases, closed thoracic drainage 3 cases. The other trea-tments strategies included albumin, gammaglobu-lin, plasma, apheresis, parenteral nutrition, main-tained water and electrolyte balance, symptomatic and supportive treatment.
Prognosis outcomeCured 25 cases, improved 5 cases, given up tre-
atment 6 cases, died 1 case.
Statistical analysis Statistical analysis was performed with the
SPSS software package (version 16.0). Measu-rement data were expressed as means (±standard deviations, sx ± ). One-way ANOVA was used for analysis of variance. Analysis of variance had significant difference, if equal variances assumed, using LSD method for multiple comparisons, equ-al variances not assumed, with Tamhaneˈs T2 method for multiple comparisons. P-value of 0.05 or lower was considered statistically significant.
Results
Premature infants blood sampling were obtai-ned for complete blood count, liver function,biochemical,electrolytes, blood gas analysis, CRP, com-pared the test results among hospital admission, suspected fungal infections, and anti-fungal trea-tment for 2 weeks. The complete blood count and CRP changes were showed in Table 1.
As Table 1 shows that analysis of variance abo-ut Plat, HCT, MCV, MCH, PDW, MPV, CRP have significant differences. Tamhane's T2 multiple comparison results are: when body suffers from fungal infection, Platelet reduction, then recover
Table 1. Complete blood count and CRP change Admission
sx ±Suspected fungal infection ( sx ± )
After 2 weeks of treatment ( sx ± )
F P
WBC 11.05±6.27 11.73±8.38 15.40±9.44 2.616 0.078N 51.23±16.10 55.80±15.65 45.88±20.38 2.650 0.076L 35.99±16.89 29.18±13.25 34.47±15.32 2.006 0.140M 7.19±3.89 8.79±4.99 9.26±4.72 1.905 0.154Nst 5.9±5.05 5.36±6.14 10.40±11.59 2.696 0.074#
RBC 3.95±0.72 4.11±1.01 4.18±1.12 0.512 0.601#HB 146.99±27.09 135.92±28.05 131.25±31.94 2.636 0.077Plat 202.57±69.58 113.24±76.33 263.18±154.03 18.008 0.000*#Hct 0.447±0.084 0.410±0.080 0.391±0.086 4.018 0.021*
MCV 115.96±10.38 99.73±9.70 94.88±8.17 44.619 0.000*MCH 38.25±3.15 33.16±2.96 31.68±2.46 47.265 0.000*
MCHC 329.95±17.75 333.0±15.99 334.75±12.37 0.780 0.461RDW 16.85±1.70 17.99±2.65 17.49±2.51 2.139 0.124PDW 13.59±2.37 16.70±3.82 15.89±2.65 8.834 0.000*#MPV 11.06±1.21 12.12±0.96 11.32±1.19 4.681 0.012*CRP 2.42±2.91 24.88±30.82 13.90±23.86 8.151 0.001*#
*p<0.05, # Equal variances not assumed. WBC (×109/L),N (Neutrophil,%),L (Lymphocyte, %),M (Monocyte, %), Nst (Neutrphilic stab granulocyte %), RBC (×1012/L),HB (g/L), Plat (×109/L), Hct (%),MCV(fl), MCH (pg), MCHC (g/L), RDW(%), PDW(%), MPV (fl), CRP(mg/L).

Vers
ion fo
r revie
w
2038
HealthMED - Volume 6 / Number 6 / 2012
Journal of Society for development in new net environment in B&H
after 2 weeks anti-fungal treatment, but the results between hospital admission and anti-fungal trea-tment 2 weeks are no difference. PDW is the lowest on admission, difference significant, when body suffers from fungal infection,the values of PDW in-crease, compared with hospital admission, differen-ce is significant, but no difference with anti-fungal treatment 2 weeks.Inflammatory index CRP is mi-nimum on admission, increase when body suffers from fungal infections, the values have difference between hospital admission and fungal infection, but no difference between fungal infection and anti-fungal treatment 2 weeks.LSD multiple comparati-ve about HCT, MCV, MCH, MPV four indicators show: HCT, MCV, MCH statistical analysis results are similar: the maximum on hospital admission, difference are significance among 3 groups and the difference are also significance between hospital admission and anti-fungal treatment 2 weeks. The reason may be physiological anemia in preterm in-fants, iatrogenic blood loss and other factors. MPV increase in the fungal infection, then descend with the improvement of the anti-fungal treatment, diffe-rence are significance.
Liver function and biochemical changes were showed in Table 2.
Table 2 shows that One-way ANOVA about ALT, TBIL, CK, CKMB, ALB, and LDH has si-gnificance difference. Tamhane's T2 method mul-tiple comparison: ALT gradually increase in fungal infection and after anti-fungal treatment 2 weeks, the values are significant among the three groups,
indicating that fungal infection and anti-fungal tre-atment may be damage liver function, so clinician must be attention. CK, CKMB, LDH increase in fungal infection, but no difference compare with hospital admission, decrease significantly after an-ti-fungal treatment and the difference are signifi-cant. One-way ANOVA indicated that myocardial damage of fungal infection was reversible and it improved after anti-fungal treatment. LSD method multiple comparisons for TBIL, ALB, the results of TBIL are no difference between fungal infection and hospital admission, but decrease after anti-fun-gal treatment and have statistically significant. The value of ALB increases in fungal infection, diffe-rence significant compare with hospital admission, the reason for this may be to use iatrogenic albumin or plasma and other blood-related products, after anti-fungal treatment the results change little.
Blood gas analysis and electrolytes change were showed in Table 3.
One-way ANOVA about blood gas analysis and electrolytes changes (Table 3) shows that only calcium change has significance, minimum on hospital admission, increase in fungal infections. There are differences between two groups, but no differences compare with anti-fungal treatment. One-way ANOVA indicated that the concentrati-on of calcium ion had an increasing trend when the body suffered from fungal infection, but not met the standards of hypercalcemia. The reason for this may be not excluded prematurity, vitamins A/D application and serum albumin increase.
Table 2. Liver function and biochemical changesAdmission
sx ±Suspected fungal infection ( sx ± )
After 2 weeks of treatment( sx ± )
F P
ALT 7.95±5.26 13.95±14.02 32.5±42.52 8.937 0.000*#AST 68.70±36.74 61.57±20.21 57.58±22.75 1.527 0.222#TBIL 115.50±70.49 98.65±55.72 58.47±56.07 6.401 0.003*DBIL 17.56±7.14 27.36±19.44 31.92±39.30 2.830 0.065#CK 358.7±487.51 570.7±475.73 82.69±137.96 13.446 0.000*#
CKMB 86.73±140.89 162.14±98.76 27.31±9.50 16.699 0.000*#BUN 6.64±3.09 11.78±9.71 9.09±5.87 2.048 0.148#CR 72.58±31.97 83.14±63.49 49.0±21.87 1.421 0.258
ALB 29.94±4.61 32.66±4.41 31.92±3.15 3.331 0.041*LDH 758.70±351.80 940.00±247.68 219.21±80.16 77.475 0.000*#
*p<0.05, # Equal variances not assumed. ALT (U/L), AST (U/L), TBIL (μmol/L), DBIL (μmol/L),CK (nmol/L),CKMB (nmol/L), BUN(mmol/L), CR (μmol/L), ALB (g/L), LDH (μmol/L).

Vers
ion fo
r revie
w
HealthMED - Volume 6 / Number 6 / 2012
Journal of Society for development in new net environment in B&H 2039
Culture strainsThe time that blood culture made a definite di-
agnosis fungus infection ranged from 6 days to 48 days after hospital admission, with a median time of 17.35 ± 9.43 days. The most common culture strains was Candida albicans(13 cases), followed by Candida parapsilosis (11 cases), Candida fama-ta (4 cases), Candida tropicalis (2 cases), Monilia guilliermondii (2 cases), Cryptococcus laurentii (2 cases), Candida krusei (1 case), Candida glabrata (1 case), Aspergillus fumigates(1case). Simulta-neous bacteria culture of blood samples showed: acinetobacter baumannii 4 cases, staphylococcus haemolyticus 2 cases, Klebsiella pneumonia 2 ca-ses and Escherichia coli 1 case.
Antifungal susceptibility testingExcept 3 cases of resistance to fluconazole,
sensitive to voriconazole, the rest were sensitive to fluconazole.
Discussion
There were 34 cases that gestational age was less than 33 weeks, accounting for 91.9%.Wei-ght less than 1500g were 24 cases, accounting for 64.9%. The average of hospital stay was 57 days, while VLBW infants sepsis with an average of hos-pital stay was 74 days and cost nearing $75,000 per case in the United States [5]. Premature rupture of membranes was still the major problem of preterm infants birth, accounting for 51.4%.As the pathop-
hysiological characteristics of preterm infants, so-metimes mechanical ventilation was unavoidable, and ventilation lasted for a long time. The venti-lation preterm infants accounted for 67.6% in this group; There were 21 cases to use pulmonary sur-factant; PICC catheterization 3 cases, the catheter was removed after fungus were found in blood cultures and catheter tips culture strains were consi-stent with the blood cultures strains. Therefore, me-chanical ventilation resulted in deprived the barrier function of respiratory tract; broad-spectrum antibi-otic selection pressure led flora imbalance; venous catheter increased infection and pulmonary surfac-tant might be a good medium for fungi. All of these eventually induced nosocomial fungus infection.
There were many foundation diseases in pre-term infants and the clinical manifestation were complex, diverse and easily combined with other bacterial infections. Multiple signs and symptoms such as respiratory, intracranial, gastrointestinal and infectious illness were overlapped, all with high associated mortality. so clinical manifesta-tion of fungal infection were easily masked by foundation diseases, also non-specific, and some even similar to the characteristic of bacterial sep-sis, therefore it was at times difficult to diagnose fungus infection.The clinical manifestation of fun-gal sepsis in this group were as follows: the mean time of nosocomial fungal infections was 17.35 ± 9.43 days, in agreement with other studies [6,7].The most common clinical manifestation were platelet reduction, poor response, poor perfusion, respira-
Table 3. Blood gas analysis and electrolytes changeAdmission
sx ±Suspected fungal infection ( sx ± )
After 2 weeks of treatment ( sx ± )
F P
K+ 4.94±1.24 4.54±0.45 4.72±1.11 0.751 0.476#Na+ 140.16±6.89 139.93±6.11 138.40±4.64 0.420 0.659CL- 101.92±7.58 100.53±3.72 102.47±5.44 0.384 0.683Ca2+ 1.70±0.37 1.98±0.34 2.06±0.28 6.292 0.004*PH 7.33±0.11 7.33±0.09 7.36±0.21 0.147 0.864
HCO3- 21.55±5.93 22.36±3.80 19.73±5.92 0.470 0.628
BE -5.27±5.81 -3.42±3.94 -4.10±7.55 0.447 0.642PCO2 41.59±13.39 42.70±10.25 37.14±9.15 0.466 0.631PO2 97.65±59.66 97.10±43.34 76.29±15.11 0.482 0.620GLU 3.42±2.52 5.08±1.93 4.44±0.79 1.694 0.196LAC 2.69±0.85 2.33±2.12 4.34±6.15 0.519 0.606#
*p<0.05, # Equal variances not assumed. K+(mmol/L), Na+(mmol/L), CL-(mmol/L), Ca2+(mmol/L), HCO3-(mmol/L), BE(mmol/L), PCO2(mmHg), PO2(mmHg), GLU(mmol/L), LAC(mmol/L).

Vers
ion fo
r revie
w
2040
HealthMED - Volume 6 / Number 6 / 2012
Journal of Society for development in new net environment in B&H
tory rhythm and heart rate change, hypothermia, weight not increase, feeding intolerance, more sputum in mechanical ventilation, difficult to wit-hdrawal ventilator and unexplained deterioration . These manifestation were non-specific, moreover, in laboratory test respects, MPV and PDW increa-se in fungal infection were consistent with platelet reduction due to increase both platelet destruction and platelet consumption, as well as abnormal pla-telet distribution led to prothrombotic state .These results were consistent with the literature report of Warris A et.al. CRP levels increase and platelet reduction might be considered as a marker of fun-gal infection, and also assessed the effectiveness of antifungal therapy [8].When body suffered from fungal infections, the changes of erythroid and granulocyte were not significance, but platelet re-duction, CRP, PDW and MPV increase had clini-cal significance. The changes of ALT, TBIL, CK, CKMB, LDH, ALB, Ca2 + only showed that the liver and myocardium suffered from damage in fungal infection, then recovered after anti-fungal treatment. It was non-specific to diagnose fungal sepsis, therefore, the possibility of complicating fungal infection should be considered when pre-mature infants occurred infectious illness.
The highest detection rate of fungal infection was Candida albicans (13 cases, 35.1%) in the group, followed by Candida parapsilosis (11 cases, 29.7%). There were many types of Candida, inclu-ding Candida albicans, Candida tropicalis, Candi-da krusei, Candida parapsilosis and other Candida pseudo-tropical. Candida albicans was the most common opportunistic pathogen and pathogenic virulence was also the strongest in many kinds of Candida. Most newborns in the oral cavity and ga-strointestinal tract have original colonization whi-ch can be transformed into the dominant species and pathogenic in flora imbalance. Its strong adhe-sion capacity, very easy colonization in the catheter surface formed biofilm in glucosilated solutions to evade the host immune response and antimicro-bial agents.At present, Candida albicans infecti-on had become a serious clinical problem, blood culture positive rate followed by the E. coli and Staphylococcus aureus [9].The incidence of blood-stream infection caused by Candida progressively increase every year. Population-based data from Finland during 1995-1999, the average annual
incidence of candidemia had increased markedly from 1.9 to 2.86 per 100,000 population[10],while incidences was higher elsewhere in Europeand considerable higher (10.4 per 100,000 population) in Denmark [11].Once Candida sepsis was found, PICC catheter should be removed, otherwise, it prolonged duration of bacteremia and might lead the mortality increase. Candida parapsilosis was easy to form mucus in the glucose solution and successfully attach on plastic catheter. The infecti-on mainly was found in epidermal barrier integri-ty damage of preterm children caused by received invasive treatment and instruments monitor. It was the most common types of fungal colonization on catheter. PICC catheter tips culture 3 cases were found Candida parapsilosis in the group and it was closely related to total parenteral nutrition and also easy to spread by health care workers with hand contacting preterm infants.
Neonatal fungal infection often disseminated and made end- organ involvement, such as cen-tral nervous system, urinary system, joints, eye and endocardium, etc. Although the treatment was timely in this group, it still occurred fungal endophthalmitis 1 case, fungal meningitis 1 case, congestive heart failure 1 case, renal function fai-lure 1 case, intestinal perforation 1 case, periven-tricular leukomalacia 1 case, NEC 5 cases, DIC4 cases. About the treatment, advocator tried to pro-long the time for anti-fungal treatment which sho-uld continue at least 2 weeks to prevent recurrence of fungal infection after the blood culture, body fluid culture were negative or local lesions disa-ppeared [12]. Antifungal therapy strategies in this group were: the amount of cure fluconazole 6 mg / kg, the amount of prevention 3 mg / kg, gestatio-nal age30-36 weeks, within 14 days of birth, once administration every other day, more than 14 days of birth, 1 time / day; gestational age ≤ 29 weeks, within 14 days of birth, once administration every two day, more than 14 days of birth, once admini-stration every other day. The longest time of fluco-nazole administration was 40 days in this group, the majority time of application fluconazole were 2 weeks or 3 weeks. Liver and kidney functions are no significant damage in the Table 2.
As the fungal diagnostic reasons, blood culture, albeit a gold standard test, can possibly identify only a small fraction of the total number of candi-

Vers
ion fo
r revie
w
HealthMED - Volume 6 / Number 6 / 2012
Journal of Society for development in new net environment in B&H 2041
demia. Fungal infection incidence might be even higher than the reports currently. Preterm infants were easy to fungal infection, and were predispo-sed to occurring serious sequelae of central ner-vous system. Prevention was the optimal strategy [13].There were a large number of evidence concer-ning application fluconazole on the prevention of fungal infections in preterm infant [14-17], preterm infant (weight<1000g), twice weekly intraveno-us administration of fluconazole was more effecti-ve than oral nystatin in prevent fungal infections, but the attendant problem was fluconazole drug resistance, reported on the rate of fluconazole re-sistance was 5.5% [18]. There were 3 cases flucona-zole-resistant, but sensitive to voriconazole in this group. Frankenbusch.K though that 4mg/kg daily dose with two weeks could achieve clinical trea-tment effect. Loading dose was 3mg/kg once, then modified 2mg/kg·time after12 hours [19].Our met-hods are that voriconazole (4mg/kg q12h) with 2 weeks can control the infection. With beneficial bacteria and lactoferrin and other measures had been reported to enhance the innate immune and to prevent fungal infections[20,21].
Acknowledgment
We acknowledge the exceptional work of Me-dical Record Administrators and the Laboratory colleagues in The General Military Hospital of Beijing PLA
References
1. Chapman RL. Candida infections in the neonate. Curr Opin Pediatr. 2003;15(1):97-102.
2. Vergnano S, Menson E, Kennea N, Embleton N, Rus-sell AB, Watts T, et al. Neonatal infections in Eng-land: the NeonIN surveillance network. Arch Dis Child Fetal Neonatal Ed. 2011;96(1):F9-F14.
3. Long SS, Stevenson DK. Reducing Candida infections during neonatal intensive care: management choices, infection control, and fluconazole prophylaxis. J Pedi-atr. 2005;147(2):135-41.
4. Feja KN, Wu F, Roberts K, Loughrey M, Nesin M, Larson E, et al. Risk factors for candidemia in criti-cally ill infants: a matched case-control study. J Pedi-atr. 2005;147(2):156-61.
5. Melvan JN, Bagby GJ, Welsh DA, Nelson S, Zhang P. Neonatal sepsis and neutrophil insufficiencies. Int Rev Immunol. 2010;29(3):315-48.
6. LI Qiu-ping, GAO Xin, HUANG Jie-ting. Clinical characteristics of fungal sepsis in premature infants in premature neonatal intensive care unit, J Clin Pediatr, 2010,(28) 6 :531-534.
7. Dong Qing-yi, CHEN Ping-yang, XIE Zong-de. Clinical analysis of 22 cases of neonatal fungal sep-ticemia. Chinese Journal of Practical Pediatrics, 2010,25(5):379-382.
8. Warris A, Semmekrot BA, Voss A. Candidal and bac-terial bloodstream infections in premature neonates: a case-control study. Med Mycol. 2001;39(1):75-9.
9. Montagna MT, Lovero G, De Giglio O, Iatta R, Cag-giano G, Montagna O,et al. Invasive fungal infections in neonatal intensive care units of Southern Italy: a multicentre regional active surveillance (AURORA project). J Prev Med Hyg. 2010;51(3):125-30.
10. Poikonen E, Lyytikäinen O, Anttila VJ, Koivula I, Lumio J, Kotilainen P, et al. Secular trend in candi-demia and the use of fluconazole in Finland, 2004-2007. BMC Infect Dis. 2010 28(10):312-7.
11. Arendrup MC, Fuursted K, Gahrn-Hansen B, Schønheyder HC, Knudsen JD, Jensen IM, et al. Se-mi-national surveillance of fungaemia in Denmark 2004-2006: increasing incidence of fungaemia and numbers of isolates with reduced azole susceptibili-ty. Clin Microbiol Infect. 2008;14(5):487-94.
12. Benjamin DK Jr, Poole C, Steinbach WJ, Rowen JL, Walsh TJ. Neonatal candidemia and end-organ damage: a critical appraisal of the literature using meta-analytic techniques. Pediatrics. 2003;112(3 Pt 1):634-40.
13. Manzoni P, Jacqz-Aigrain E, Rizzollo S, Franco C, Stronati M, Mostert M,et al. Antifungal prophylaxis in neonates. Early Hum Dev. 2011 ;87 Suppl 1:S59-60.
14. Manzoni P, Rizzollo S, Decembrino L, Ruffinazzi G, Rossi Ricci A, Gallo E,et al. Recent advances in pre-vention of sepsis in the premature neonates in NICU. Early Hum Dev. 2011;87 Suppl 1:S31-3.
15. Kaufman DA, Manzoni P. Strategies to prevent inva-sive candidal infection in extremely preterm infants. Clin Perinatol. 2010;37(3):611-28.
16. Wilkerson J, McPherson C, Donze A. Flucona-zole to prevent systemic fungal infections in in-fants: reviewing the evidence. Neonatal Netw. 2010;29(5):323-33.

Vers
ion fo
r revie
w
2042
HealthMED - Volume 6 / Number 6 / 2012
Journal of Society for development in new net environment in B&H
17. Manzoni P, Mostert M, Jacqz-Aigrain E, Farina D.The use of fluconazole in neonatal intensive care units. Arch Dis Child. 2009;94(12):983-7.
18. Altuncu E, Bilgen H, Cerikçioğlu N. Neonatal Candida infections and the antifungal susceptibili-ties of the related Candida species. Mikrobiyol Bul. 2010;44(4):593-603.
19. Frankenbusch K, Eifinger F, Kribs A, Rengelshauseu J, Roth B.Severe primary cutaneous aspergillosis re-fractory to amphotericin B and the successful trea-tment with systemic voriconazole in two premature infants with extremely low birth weight. J Perinatol. 2006;26(8):511-4.
20. Manzoni P, Tarnow-Mordi W, Franco C, Gallo E, Spera AM, Rizzollo S,et al. Clinical use of lacto-ferrin in preterm neonates: an update. Minerva Pe-diatr. 2010;62(3 Suppl 1):101-4.
21. Manzoni P, Decembrino L, Stolfi I, Pugni L, Rinaldi M, Cattani S,et al. Lactoferrin and prevention of la-te-onset sepsis in the pre-term neonates. Early Hum Dev. 2010; 86 Suppl 1:59-61.
Corresponding Author Zhichun Feng, Department of Pediatrics, BaYi Children’s Hospital of The General Military
Hospital of Beijing PLA, Dongcheng District, Bijing, P.R.China, E-mail: [email protected]

Vers
ion fo
r revie
w
HealthMED - Volume 6 / Number 6 / 2012
Journal of Society for development in new net environment in B&H 2043
Abstract
Purpose: In the current study we aimed: (1) to report the prevalence of postpartum depression (PPD) among Turkish women in Denizli province; (2) description of the association of PPD with risk factors among working and non-working women.
Methods: A descriptive and cross-sectional study conducted at the Maternal and Child Health and Family Planning Center in Denizli State Hos-pital. The research sample consisted of 250 women who came for follow-up between August-October 2008, and voluntarily agreed to participate. Socio-demographic and obstetric variables were collected through a socio-demographic and obstetric questio-nnaire. To achieve the goals of the current study, we employed the Beck Depression Inventory (BDI).
Results: Working women’s mean depressi-on score was 27.35 ± 17.52 while non-working women’s mean depression score was 21.32 ± 16.54. The BDI-based prevalence of PPD (to the cut off score of, 17) was 60.8%. As a result of the multiple regression analysis, it was determined that working women’s age, delivery mode, satisfaction with the baby’s sex, baby’s nutritional style and health status increased the depression scores in a linear fashion. Fifty one percent of the working women’s mean depression scores could be explained by these in-dependent variables (R2 =0.51). As a result of the multiple regression analysis, it was determined that non-working mothers’ educational level, satisfacti-on with the baby’s sex, family support, health status, relations with the spouse increased the depression scores linearly. Fifty eight percent of the variation in working mothers’ mean depression scores can be explained by these independent variables (R2 =0.58).
Conclusion: The findings of the current study revealed high BDI -based PPD prevalence in a sample of Turkish women and described a num-ber of risk factors associated with PPD. The high
prevalence found in this study indicated a need for developing new interventions for early detection and treatment of PPD.
Key words: Postpartum Depression, Risk Factors, Working Women, Non-working Women, Turkey
Introduction
The postpartum period is a unique period of time in a woman’s life. It represents a major role change and appears with numerous transforma-tions which are social, psychological as well as physical. A significant decrease in gonadal hormo-nes is observed during this period (1). In addition, childbirth is a major social and psychological dis-rupter of the lives of an infant’s parents (2).
Postpartum depression (PPD) is a non-psycho-tic depressive episode of mild to moderate severi-ty, beginning in or extending into the first postna-tal year (3). PPD is an important public health pro-blem, having a significant impact on the mother, the family, her partner, mother–baby interaction and on the long-term emotional and cognitive de-velopment of the baby (3,4,5). Research from We-stern countries shows that maternal depression is related to poor bonding between mother and child, missing pediatrics appointments, missing required vaccinations, and more frequent use of emergency department services (6,7,8,9).
PPD, which typically occurs from 2 weeks to 1 year after the birth of a child, may manifest with symptoms that may not be very apparent to untra-ined health care workers (10,11). Depending upon how it is defined, the assessment criteria used and the geographical and cultural dimension of the study conducted, PPD prevalence is seen over a wide range of 3.5–40% (12). Cultural backgrounds were found to greatly influence prevalence and the assessment and management of PPD (13). A recent systematic
Postpartum Depression Among Working and Non-working Women in Denizli, TurkeyGonul Ozgur1, Senay Unsal Atan2, Melek Ardahan3
1 Department of Psychiatric Nursing, Ege University School of Nursing, Bornova, Izmir, Turkey,2 Department of Gynaecological and Obstetric Nursing, Ege University School of Nursing, Bornova, Izmir, Turkey,3 Department of Public Health Nursing, Ege University School of Nursing, Bornova, Izmir, Turkey.

Vers
ion fo
r revie
w
2044
HealthMED - Volume 6 / Number 6 / 2012
Journal of Society for development in new net environment in B&H
review revealed low PPD prevalence in Western Eu-rope and Australia (13%), medium PPD prevalen-ce in the US (29%), whereas high PPD prevalence was reported in India (32%) and South Korea (36%) (14). A meta-analysis of 59 studies (n=12810) found an average prevalence rate of non-psychotic PPD of 13% (95% CI 12.3–13.4)(15). A few studies from Turkey have found the prevalence of PPD to be high and in the range of 21.8–36.9% (16).
Midwives and nurses who provide postnatal care have significant roles in determining a postpar-tum woman’s risk factors for psychological illness. They offer preventive care, screening to ensure ear-ly diagnosis, and direct mother with psychological problems to appropriate treatment and care. Po-stpartum women seek more care in this period than during other periods of their lives, and spend more time with health-care personnel (17). For this rea-son, postpartum is a unique opportunity to screen for depression in women, to provide preventive care, to priorities women in risk groups, and to en-sure that they are sent for consultation and receive care and treatment for diagnosed illnesses.
Midwives and nurses can help prevent the de-velopment of depression in postnatal period, and mild signs of depression from worsening and illness recurring. They can also implement inter-ventions such as stress reduction, ensuring adequ-ate nutrition, preventing the consumption of ciga-rettes, nicotine and caffeine, encouraging exercise and adequate hygiene, educating women about measures that may help with adaptation (such as taking a warm sitz bath and drinking warm milk), developing coping skills and putting into action current social support systems (particularly for women who are separated or divorced) (18,19).
In the current study we aimed: (1) to report the rate of postpartum depression among Turkish women in Denizli province; (2) description of the association of PPD with risk factors. Being aware of risk factors for depression during postpartum and cultural characteristics are important in pla-nning and implementing postnatal care.
Materials and Methods
This descriptive and cross-sectional study was conducted between August-October 2008. The population for the study included postpartum wo-
men who came to Maternal and Child Health and Family Planning Center in Denizli State Hospital, to postpartum women who came for follow-up during this period. This study was undertaken in the city of Denizli which has a geographical area of 11.868 km2 and a total population of approxi-mately 926.362 people. Denizli, where the source of income is agriculture and industry is located in the western part of Turkey. The research sample consisted of 250 women chosen with a conveni-ence sampling technique. In social sciences it was stated that the ideal size has to be around 250-300 samples for a normal distribution (20). For this re-ason, it was seen sufficient to have 250 women to join this survey.
The socio-demographic and obstetric questionnaireA 24-item questionnaire was specifically desi-
gned for the purpose of this study. It was formula-ted after a thorough review of the relevant litera-ture. Socio-demographic and obstetric variables, such as age, education, employment, place of resi-dence, migration, family type, economical status, conscious pregnancy, type of delivery, the period after birth (month), sex of the newborn, the baby’s nutrition, the baby’s health status, perception of one’s own and the baby’s health, family, relative and friend support for the mother’s and the baby’s care after the birth, self-evaluation of psychology, evaluation of the relations with the spouse were assessed through a specially designed socio-de-mographic and obstetric questionnaire.
After the questionnaire was prepared, it was shown to five members of the teaching staff for expert opinions regarding its validity. The majori-ty of the questionnaire was found to have reasona-ble validity based on the expert reviews. Then the questionnaire was tested for understandability by giving it to 30 women who were not included in the study, and changes were made based on their recommendations.
All women who were in their 2nd–24th weeks postpartum were invited to participate in the study. Participation was on a voluntary basis. All the wo-men participating in the study gave their informed consent. All data were collected during face-to-face interviews. Interviews including completing all measures with each woman lasted about 15–20

Vers
ion fo
r revie
w
HealthMED - Volume 6 / Number 6 / 2012
Journal of Society for development in new net environment in B&H 2045
min. Women with twin pregnancies and those who had babies with chronic health problems were not included.
The Beck Depression Inventory (BDI)We employed the BDI, which is a 21-item self-
reporting questionnaire. The BDI was developed by Beck et al. (1979). The BDI is a specially de-signed and most commonly used tool to assess a woman’s self-report of depressive symptomato-logy during the postpartum period. For each ca-tegory there are 4-5 statements of increasing se-verity. The women reads the scale and marks the statement most applicable to herself. The score for each item ranges from 0-3; the total score falls between 0-62 (21). The BDI has been translated into many languages and has also been validated in many cultures. It is recommended in primary care. Hisli et al.(1987) translated and adopted the BDI into Turkish. The Turkish version of the BDI has been validated. Hisli et al. (1987) found a cut-off point of 17 with a sensitivity of 0.84 and specificity of 0.88 and Cronbach’s alpha (internal consistency reliability) was 0.79 (22). The BDI is an easily administered, objective, reliable and va-lid instrument. The cut-off point of 17 was used in the study and women with the BDI scores of ≥ 17 were regarded to be at risk. The internal reliability of the BDI in our study demonstrated very good internal scale reliability with Cronbach’s alpha coefficients (0.97). It is important to remember at this point that BDI is only a screening tool, even though it has high specificity and sensitivity. The actual prevalence of PPD which is diagnosed by psychiatric consultation may differ slightly.
EthicsThe approval of the institutional review board
was obtained from the Regional Health Directo-rate and permissions to conduct the study were also obtained from administrators of Maternal and Child Health and Family Planning Center in Deni-zli State Hospital.
Data analysisStatistical analysis was performed using the
Statistical Package for Social Sciences (SPSS Inc., Chicago, IL, USA), version 13.0. Descrip-tive characteristics, such as frequency and sum-
mary were calculated for variables of interest. A bivariate analysis was performed with the poten-tial risk factors for PPD. Multiple logistic regre-ssion analysis was then performed with the risk factors with statistical significance in bivariate analysis. A level of p<0.05 was considered stati-stically significant.
Results
Socio-Demographic Characteristics of Working and Non-working Women Among the working women, 43% were in the
20-25 age range, 38.7% had high school degree, 66.7% had not migrated, 67.7% had equivalent income and expenditure and 90.3% had a nuclear family structure.
Among the non-working women, 43.3% were in the 18-24 age range, 45.9% had graduated from the primary school, 68.2% had not migrated, 50.3% had equivalent income and expenditure and 84.7% had a nuclear family structure (Table 1).
Bio-Psychosocial Characteristics of Working and Non-working WomenIt was determined that 86% of the working wo-
men got pregnant consciously, 55.9% had Cesa-rean section, 60.2% had delivery in a state hospi-tal, 81.7% were “pleased” with their baby’s sex, 74.2% received family support, 34.4% received support from relatives, 50.5% reported having a “fair” relationship with their husband, and 49.5% stated that their general health condition was “good” (Table 2).
It was determined that 84.1% of the non-wor-king women had conscious pregnancy, 56.1% had normal delivery, 75.8% had delivery in a state hospital, 91.7% were “pleased” with their baby’s sex, 78.3% received family support, 24.2% recei-ved support from the relatives, 44.6% had a “fair” relationship with their spouse, and 63.1% had a “good” general health status (Table 2).
Bio-Psychosocial Characteristics of Working and Non-working Women’s Babies Among the working women, 55.9% had a da-
ughter and 51.6% breastfed their babies. Among the non-working women, 57.3% had a son and 70.1% breastfed their baby (Table 3).

Vers
ion fo
r revie
w
2046
HealthMED - Volume 6 / Number 6 / 2012
Journal of Society for development in new net environment in B&H
Table 1. The Distribution of the Postpartum Working and Non-working Women’s Characteristics Working Women Non-working Womenn % n %
Age Group18-24 years 25-29 years30-34 years
294024
31.243.025.8
684940
43.331.225.5
Educational Level Elementary schoolMiddle SchoolHigh SchoolCollege / University
16143627
17.215.138.729.0
72334111
45.921.026.17.0
Migration StatusImmigrants Non-immigrants
3162
33.366.7
50107
31.868.2
Perception of Income Income Lower than ExpenditureIncome equals to the Expenditure
3063
32.367.7
7879
49.750.3
Family TypeNuclear FamilyLarge Family
849
90.39.7
13324
84.715.3
TOTAL 93 100.0 157 100.0
Table 2. Bio-Psychosocial Characteristics of Working and Non-working Women Working Women Non-working Women n % n %
Pregnancy TypeConscious Pregnancy Non-conscious Pregnancy
8013
86.014.0
13225
84.115.9
Mode of DeliveryNormal DeliveryCesarean Section
4152
44.155.9
8869
56.143.9
Delivery PlaceState HospitalPrivate Hospital
5637
60.239.8
11938
75.824.2
Satisfaction with SexSatisfied Dissatisfied
7617
81.718.3 144
1391.78.3
Family supportReceives supportDoes not receive support
6924
74.225.8
12334
78.321.7
Support from the RelativesReceives supportDoes not receive support
3261
34.465.6
38119
24.275.8
Relations with the SpouseGood Fair Bad
324714
34.450.515.1
667021
42.044.613.4
General Health StatusGood Moderate Bad
463116
49.533.317.2
993226
63.120.416.6
TOTAL 93 100.0 157 100.0

Vers
ion fo
r revie
w
HealthMED - Volume 6 / Number 6 / 2012
Journal of Society for development in new net environment in B&H 2047
Working and Non-working Women’s Mean Depression Scores Working women’s mean depression score was
27.35 ± 17.52 while non-working women’s mean depression score was 21.32 ± 16.54. A “mode-rately” significant positive relationship was fo-und between postpartum working and non-wor-king women’s mean depression scores (r=0.33 p=0.001) (Table 4).
Considering postpartum working and non-wor-king mothers’ distribution of depressive symptom levels according to the cut off score of 17, it was found that 73.1% of the working mothers were depressive, 26.9% were not depressive whereas 53.5% of the non-working mothers were depressi-ve and 46.5% were not depressive.
The Relationship Between Working and Non-working Women’s Mean Depression Scores and Socio-demographic and Bio-psychosocial Features
Working Women As a result of the correlation analysis, it was fo-
und that there was a significant positive relationship between working women’s mean depression scores and age (r=0.40 p<0.01), conscious/non-consci-ous pregnancy (r= 0.26 p<0.05), delivery mode (r= 0.22 p<0.05), satisfaction with the baby’s sex (r=0.31 p<0.01), the baby’s nutritional style ( r= 0.24 p<0.05), health status (r=0.56 p<0.01), and re-lations with the spouse (r=0.45 p<0.01) (Table 5).
The independent variables which indicated a significant relationship with the working women’s mean depression scores were analyzed by means of multiple regression analysis. It was determined that working women’s age, delivery mode, satis-faction with the baby’s sex, baby’s nutritional style and health status increased the depression scores in a linear fashion (Table 6). The Durbin-Watson (DW) value (1.545) demonstrated that the regre-ssion model was well-constructed. The correlati-on between working mothers’ depression scores and independent variables was (R) 0.72. Fifty one percent of the working women’s mean depression scores could be explained by these independent variables (R2 =0.51). Considering the linearity of this relationship’s linearity, it was found to be si-gnificant and linear (F= 12.737 p<0.01).
Non-working Women As a result of the correlation analysis, a signifi-
cant positive relationship was found between non-working women’s mean depression scores and educational level ( r=0.23 p<0.01), family type (r=0.19 p<0.05), conscious/non-conscious pre-gnancy (r= 0.24 p<0.01), delivery mode (r= 0.22 p<0.01), satisfaction with the baby’s sex (r=0.40 p<0.01), health status (r=0.65 p<0.01), and rela-tions with the spouse (r=0.57 p<0.01) (Table 5).
The independent variables which pointed to a significant relationship with the non-working women’s mean depression scores were analyzed by means of multiple regression analysis. It was determined that non-working mothers’ educatio-
Table 3. Bio-Psychosocial Characteristics of Working and Non-working Women’s Babies Working Women
n %Non-working Women
n %Baby’s SexFemaleMale
5241
55.944.1
6790
42.757.3
Nutritional StyleMother’s milkMother’s milk and baby foodAdditional food
483015
51.632.316.1
1102522
70.115.914.0
TOTAL 93 100.0 157 100.0
Table 4. Working and Non-working Women’s Mean Depression Scores n Min Max MeanWorking Mothers’ Depression Scores 93 0.0 63.0 27.35 ± 17.52Non-working Mothers’ Depression Scores 157 0.0 63.0 21.32 ± 16.54

Vers
ion fo
r revie
w
2048
HealthMED - Volume 6 / Number 6 / 2012
Journal of Society for development in new net environment in B&H
nal level, satisfaction with the baby’s sex, family support, health status, relations with the spouse increased the depression scores linearly (Table 6). The Durbin-Watson (DW) value (1.551) demon-strated that the regression model was well-con-structed. The correlation between working mot-hers’ depression scores and independent variables was (R) 0.76. Fifty eight percent of the variation in working mothers’ mean depression scores can be explained by these independent variables (R2 =0.58). Considering the linearity of this relati-onship, it was found to be significant and linear (F=25.505 p<0.01). It is observed that satisfaction with the baby’s health and women’s health status influenced both working and non-working mot-hers’ depression scores (Table 5, Table 6). Table 6. Regression model for working and non-working mothers’ mean depression scores and in-dependent variables
Working Women Beta t pAge Group 0.248 2.992 0.004Pregnancy Type 0.033 0.378 0.706Mode of Delivery 0.234 3.038 0.003Satisfaction with the baby’s sex 0.173 2.158 0.034Baby’s nutrition style 0.185 2.313 0.023Health status 0.322 3.217 0.002Relations with the spouse 0.153 1.634 0.106R=0.72 R2 =0.51 Durbin Watson= 1.545 F=12.737 p=0.000Non-working Women Beta t pEducational Level 0.145 2.595 0.010Family Type 0.073 1.301 0.195Pregnancy Type -0.042 -0.710 0.479Mode of Delivery -0.007 -0.116 0.908Satisfaction with the baby’s sex 0.130 2.163 0.032Family support 0.111 1.973 0.050Health status 0.429 6.595 0.000Relations with the spouse 0.319 5.211 0.000R=0.76 R2 =0.58 Durbin Watson= 1.551 F=25.505 p=0.000
Discussion
In the present research, it was documented that 60.8% of women had PPD at a level that required professional help according to the cut off point (17) accepted for Turkey. Depending upon how it is defi-ned, the assessment criteria used and the geographi-cal and cultural dimension of the study conducted, Ta
ble
5. T
he re
latio
nshi
p be
twee
n wo
rkin
g an
d no
n-wo
rkin
g m
othe
rs’ m
ean
depr
essio
n sc
ores
and
inde
pend
ent v
aria
bles
Age
G
roup
Educ
atio
nal
Leve
l M
igra
tion
Stat
usPe
rcep
tion
of In
com
eFa
mily
Ty
pePr
egna
ncy
Type
Mod
e of
Del
iver
yD
eliv
ery
Plac
e Ba
by’s
Sex
Satis
fact
ion
with
Sex
N
utri
tiona
l St
yle
Fam
ily
supp
ort
Supp
ort
from
the
Rel
ativ
es
Hea
lth
Stat
us
Rel
atio
ns
with
the
Spou
se
Wor
king
Wom
en’s
r0.
40*
0.02
-0.1
4-0
.12
-0.1
40.
26**
0.22
**0.
15-0
.09
0.31
*0.
24**
0.17
-0.1
60.
56*
0.45
*p
0.00
0.83
0.89
0.25
0.17
0.01
0.03
0.15
0.41
0.00
0.02
0.10
0.11
0.00
0.00
Non
-wor
king
Wom
en’s
r-0
.04
0.23
*-0
.11
-0.1
40.
19**
0.24
*0.
22*
0.08
0.02
0.40
*0.
070.
29*
-0.1
20.
65*
0.57
*p
0.66
0.00
0.18
0.08
0.02
0.00
0.00
0.31
0.76
0.00
0.39
0.00
0.13
0.00
0.00
*p<
0.01
**p
<0.
05
Vers
ion fo
r revie
w
HealthMED - Volume 6 / Number 6 / 2012
Journal of Society for development in new net environment in B&H 2049
PPD prevalence is seen over a wide range of 3.5–40% (12). In this study BDI-based PPD prevalence for Turkey was found to be higher than previous studies (16,23,24). For this reason, it is important to know the risk factors associated with PPD.
According to BDI’s cut-off point (17) for Tur-key 73.1% of the working women and 53.5% of the non-working women had PPD at a level which ne-cessitated professional help. Furthermore, working women’s mean PPD scores (27.35 ± 17.52) were found to be higher than that of non-working wo-men (21.32±16.54) (r=0.33 p=0.001). Despite the egalitarian structure of the laws in Turkey, women face various problems in terms of showing their full potential in employment, continuing their professi-on or getting promotion. Since professions were classified and socially accepted as “female jobs” and “male jobs”, women can only focus on tradi-tional female occupations and consent to working at lower status and salary jobs. These jobs bring about the issues of seasonal and temporary work and social insecurity. Those women who can enter professional life cannot work to their full potential due to their responsibility for children, the elderly and patients and have to leave the work life. Social support institutions, such as nursery and kindergar-ten which are needed for solving the problems of family-work life integration, have not reached a sa-tisfactory number in Turkey (25). The fact that wo-men continue their mother and spouse roles as well as starting the work life leads them to experience more role conflicts. It is thought that these factors lead to more PPD among working women.
In the present research, the multiple regression results revealed a significant relationship between working women’s age, delivery mode, satisfaction with the baby’s sex, feeding the baby, health sta-tus and PPD scores. The multiple regression sco-res also revealed a significant relationship between non-working women’s educational level, satisfacti-on with the baby’s sex, family support, health sta-tus, relations with the spouse and PPD scores. It has been observed that satisfaction with the baby’s sex and women’s health status influence PPD scores among both working and non-working mothers.
In the studies on explaining the etiology of de-pression, a certain risk factor is not singled out for the emergence of the disorder; the negative interac-tion between the genetic structure and environment
as well its timing is found to be significant. Familial responsibility, depressive personal characteristics, being female, low educational level, negative life events, lack of close relationships, physical disor-ders and their treatment, psychiatric disorders lea-ding to loss of ability are considered as basic risk factors for depression (26,27,28).
Three major meta-analytic studies have been conducted revealing a number of risk factors stron-gly associated with PPD: a history of depression, antenatal depression, antenatal anxiety, stressful life events, negative cognitive attributional style, low self-esteem, childcare stress, low social support and low income (29,30,31). Other risk factors for PPD cited in the literature include young age (32), fewer years of education (33), a history of miscarriage and pregnancy termination, (34) a history of childhood sexual abuse (35), birth experience, prenatal and postnatal care (36) and conscious or non-conscious pregnancy (37). Several researchers have demon-strated an association between quality and/or satis-faction with the marital or equivalent relationship and PPD(31,38, 39,40,41). A few researchers have specifically assessed the relationship between par-tner conflict and PPD. In an Australian study, where 490 women completed questionnaires postnatally, ‘arguments with a partner’ was a significant risk fac-tor for PPD at 8 weeks (42). Similarly, in a prospec-tive study, following a community-based cohort of 288 Israeli women, ‘marital disharmony’ was signi-ficantly related to PPD(43). In the present study, it was found that working and non-working mothers’ PPD levels were influenced by the woman’s age, educational level, delivery mode, health status, fa-mily support, and relations with the spouse. These results are compatible with the previous literature.
The hormonal changes in the postpartum breas-tfeeding period were found to be significant in the emergence of psychiatric disorders, especially in PPD (44). In this study, the fact that the mother’s feeding style is influential over PPD levels is one of the most important indicators of the importance traditionally allotted to breastfeeding in motherho-od. Work life does not allow breastfeeding whene-ver the mother needs and thereby creates problems for mothers. Mothers may view their work life as a hindrance concerning their babies’ nutrition. Misri et al. (2006) determined that in 83% of the women with PPD who stopped producing milk, PPD star-

Vers
ion fo
r revie
w
2050
HealthMED - Volume 6 / Number 6 / 2012
Journal of Society for development in new net environment in B&H
ted after the milk ran out. The findings of Misri lend support to this view (45).
In contrast to the previous literature, the multiple regression results in the present study pointed to the fact that satisfaction with the baby’s sex influenced PPD rates. According to a study by Kağıtçıbaşı (2003) the preference for male babies, which was 84% in the 1970s dropped to 41% in the 2000s (46). Howe-ver, the preference for male babies is still dominant in Turkey due to viewing the child as a security for old age and other financial benefits, and traditionally the male child is valued more. Studies conducted in the east demonstrated a relationship between having a female baby and dissatisfaction with the baby’s sex (47, 48, 49). Due to the traditionally attached value to the baby’s sex, it is natural that a woman’s psyc-hology may be influenced when she does not give birth to a baby of the desired sex. This result could be interpreted as a negative outcome of the pressure to give birth to a male child in Turkish society.
Conclusion
The findings of the current study revealed BDI –based PPD prevalence in a sample of Turkish women and described a number of risk factors associated with PPD. The prevalence found in this study indicated a national need for developing new interventions for early detection and trea-tment of PPD. Health care workers are in key po-sition. Health care professionals should be skilled in monitoring risk factors associated with PPD and in identifying women with increased risk for PPD, such as women’s age, educational level, em-ployment status, delivery mode, satisfaction with the baby’s sex, feeding the baby, health status, fa-mily support and relations with the spouse.
Limitations
Since the participants were not asked whether they had depression before or not, a limitation emer-ged in interpreting the PPD result. At the same time, due to the fact that it was carried out in only one city center and the sample size was small, the result cannot be generalized. However, the results will in-form future studies since it is a follow-up study on PPD among working and non-working women in Turkey.
References
1. Bloch M, Daly RC, Rubinow DR. Endocrine factors in the etiology of postpartum depression. Compr Psychi-atry 2003; 44:234–46.
2. Uguz F, Akman C, Sahingoz M, Kaya N, Kucur R. One year follow-up of post-partum-onset depression: the role of depressive symptom severity and personality disor-ders. J Psychosom Obstet Gynaecol 2009; 30(2): 141–5.
3. Gibson J, McKenzie-McHarg K, Shakespeare J, Price J, Gray R. A systematic review of studies validating the Edinburgh Postnatal Depression Scale in ante-partum and postpartum women. Acta Psychiatr Scand 2009; 119: 350–64.
4. Tomlinson M, Cooper PJ, Stein A, Swartz L, Molteno C. Post-partum depression and infant growth in a So-uth African peri-urban settlement. Child Care Health Dev 2006;32(1):81–6.
5. Puckering C, McIntosh E, Hickey A, Longford J. Mellow Babies: A group intervention for infants and mothers experiencing postnatal depression. Counsell Psychol Rev 2010;25(1): 28-40.
6. Stein A, Gath DH, Bucher J, Bond A, Day A, Cooper PJ. The relationship between post-natal depression and motherchild interaction. Br J Psychiatry 1991; 158: 46–52.
7. Flynn HA, Davis M, Marcus SM, Cunningham R, Blow FC. Rates of maternal depression in pediatric emergency department and relationship to child servi-ce utilization. Gen Hosp Psychiatry 2004; 26:316–22.
8. Patel V, Rahman A, Jacob KS, Hughes M. Effect of maternal mental health on infant growth in low in-come countries: new evidence from South Asia. BMJ 2004; 328:820–3.
9. Black MM, Baqui AH, Zaman K, McNary SW, Le K, Arifeen SE, et al. Depressive symptoms among rural Bangladeshi mothers: implications for infant develo-pment. J Child Psychol Psychiatry 2007;48:764–72.
10. Pariser SF, Nasrallah HA, Gardner DK. Postpartum mood disorders: clinical perspectives. J Womens Health 1997;6(4): 421–34.
11. Boyd RC, Amsterdam JD. Mood disorders in women from adolescence to late life: an overview. Clin Ob-stet Gynecol 2004;47(3):515–26.
12. Ege E, Timur S, Zincir H, Geçkil E, Sunar-Reeder B. Social support and symptoms of postpartum de-pression among new mothers in Eastern Turkey. J Obstet Gynaecol Res 2008;34(4):585–93.
13. Amankwaa LC. Postpartum depression, culture and African–American women. J Cult Divers 2003; 10(1): 23–9.
14. Affonso DD, De AK, Horowitz JA, Mayberry LJ. An international study exploring levels of postpar-tum depressive symptomatology. J Psychosom Res 2000;49(3):207–16.
15. O’hara MW, Swain AM. Rates and risk of postpar-tum depression – a meta-analysis. Int Rev Psychia-try 1996;8:37–54.

Vers
ion fo
r revie
w
HealthMED - Volume 6 / Number 6 / 2012
Journal of Society for development in new net environment in B&H 2051
16. Golbasi Z, Kelleci M, Kisacik G, Cetin A. Prevalence and correlates of depression in pregnancy among Turkish wo-men. Matern Child Health J 2010; 14(4): 485-91.
17. Cantwell R, Cox JL. Psychiatric disorders in pre-gnancy and the puerperium. Curr Obstet Gynaecol 2003; 13: 7–13.
18. Hayes M J, Roberts S, Davare A. Transactional con-flict between psychobiology and culture in etiology of postpartum depression. Med Hypotheses 2000; 55: 266–76.
19. Gennaro S, Hennessy MD. Psychological and physi-olo- gical stress: impact on preterm birth. J Obstet Gynecol Neonatal Nurs 2003;32(5):668-75.
20. Sumbuloglu K, Sumbuloglu V. Biostatistics. 8th edn. Hatipoglu Press, Ankara Turkey 1998.
21. Beck AT, Rushs AJ, Shaw BF, Emery G. Cognitive the-rapy of depression. Guilford Press, New York, 1979.
22. Hisli N. One study on Beck Depression Inventory. J Psychol 1988;6:118–122.
23. Bjerke SE, Vangen S, Nordhagen R, Ytterdahl T, Magnus P, Stray-Pedersen B. Postpartum depression among Pa-kistani women in Norway: prevalence and risk factors. J Matern Fetal Neonatal Med 2008; 21(12): 889–94
24. Koyun A, Taşkın L, Terzioğlu F. Women health and psychological functioning in different periods of life: evaluation of nursing approach. Current Approa-ches in Psychiatry 2011; 3(1):67-99.
25. Çubukçu N. Women’s education and the operational status in Turkey. Accessed August, 12, 2010 from: http://www.toprakisveren.org.tr/2006-69-nimetcu-bukcu.pdf.
26. Bruce ML, Hoff RA. Social and health risk factors for first-onset major depressive disorder in a com-munity sample. Soc Psychiatry Psychiatr Epidemiol 1994; 29:165-70.
27. Swindle RW Jr, Cronkite RC, Moos RH. Risk factors for sustained nonremission of depressive symptoms: a 4-year follow-up. J Nerv Ment Dis 1998; 186(8): 462-9.
28. Ünal S, Özcan E. Precipitating, predisposing and protective factors in depression. Anatolian Journal of Psychiatry 2000; 1(1): 41-7.
29. O’Hara M, Swain A. Rates and risk of postpartum depression –a meta-analysis. Int Rev Psychiatr 1996; 8: 37-54.
30. Beck CT. A meta-analysis of predictors of postpar-tum depression. Nurs Res 1996; 45(5):297-303.
31. Beck CT. Predictors of postpartum depression, an update. Nurs Res 2001;50(5):275-85.
32. Rubertsson C, Waldenstrom U, Wickberg B. Depre-ssive mood in early pregnancy: prevalence and wo-men at risk in a national Swedish sample. J Reprod Infant Psychol 2003; 21:113-23.
33. Davis L, Edwards H, Mohay H, Wollin J. The impact of very premature birth on the psychological health of mothers. Early Hum Dev 2003;73:61-70.
34. Cryan E, Keogh F, Connolly E. Depression among postnatal women in an urban Irish community. Ir J Psychol Med 2001;18:5-10.
35. Buist A, Barnett B. Childhood sexual abuse: a risk factor for postpartum depression? Aust New Zeal J Psychiatr 1995;29(4):604-8.
36. Stewart D, Robertson E, Dennis C, Grace S. An evi-dence-based approach to post-partum depression. World Psychiatr 2004; 3:97–8.
37. Özbaşaran F, Çoban A, Kucuk M. Prevalence and risk factors concerning postpartum depression among women within early postnatal periods in Tur-key. Arch Gynecol Obstet 2011;283(3):483-90.
38. Eberhard-Gran M, Eskild A, Tambs K, Samuelsen SO, Opjordsmoen S. Depression in postpartum and non-postpartum women: prevalence and risk fac-tors. Acta Psychiatr Scand 2002;106:426–33.
39. Matthey S, Barnett B, Ungerer J, Waters B. Paternal and maternal depressed mood during the transition to parenthood. J Affect Disord 2000;60:75–85.
40. Danaci AE, Dinc G, Deveci A, Sen FS, Icelli I. Po-stnatal depression in turkey: epidemiological and cultural aspects. Soc Psychiatr Psychiatr Epidemiol 2002; 37: 125–9.
41. Nur N, Çetinkaya S, Bakır DA, Demirel Y. Prevalence of postnatal depression and risk factors in women in Si-vas city. Cumhuriyet Medical Journal 2004; 26: 55–9.
42. Johnstone SJ, Boyce PM, Hickey AR, Morris-Yatees AD, Harris MG. Obstetric risk factors for postnatal depression in urban and rural community samples. Aust New Zeal J Psychiatr 2001;35:69–74.
43. Glasser S, Barell V, Boyko V, Ziv A, Lusky A, Shoham A. et al. Postpartum depression in an Israeli cohort: demographic, psychosocial and medical risk factors. J Psychosom Obstet Gynaecol 2000;21:99–108.
44. Yıldırım SG, Kısa C, Aydemir Ç. Postpartum depre-ssion. Journal of Psychiatry Psychology Psychop-harmacology 2004;12 (Appendix 4):0-0.
45. Misri S, Corral M, Wardrop AA, Kendrick K. Que-tiapine augmentation in lactation: a series of case reports. J Clin Pyschopharmacol 2006;26:508-11.
46. Kağıtcıbaşı Ç. Autonomy and relatedness in cultural context: Implications for self and family. J Cross-Cultural Psychol 2005;36(4): 403-22.
47. Patel V, Rodrigues M, DeSouza N. Gender, Pover-ty, and Postnatal Depression: A Study of Mothers in Goa, India. Am J Psychiatry 2002;159:43-7.
48. Chandran M, Tharyan P, Mulıyıl J. Postpartum de-pression in a cohort of women from a rural area of Ta-mil Nadu, İndia. Br J Psychiatry 2002;181:499-504.
49. Robertson E, Grace S, Wallington T, Stewart DE. Antenatal risk factors for postpartum depression: a synthesis of recent literature. Gen Hosp Psychiatry 2004;26:289-95.
Corresponding Author Senay Unsal Atan, Ege University School of Nursing, Izmir, Turkey, E-mails: [email protected], [email protected]

Vers
ion fo
r revie
w
2052
HealthMED - Volume 6 / Number 6 / 2012
Journal of Society for development in new net environment in B&H
Abstract
Background: Iron deficiency without anemia is highly prevalent among female university students.
Objective: Considering the intense competition for future educational opportunities and the possible impacts of iron deficiency on brain activities, we tried to investigate the effects of supplemental iron on educational achievements of students with iron deficiency without anemia entering universities.
Methods: The iron status was evaluated in 209 female students at Faculty of Science, University of Isfahan. Iron deficiency without anemia was detected in 40.46% of the cases of which 72 indi-viduals entered the clinical trial. The subjects were divided into two groups of 36 and treated with iron supplements or placebo. Afterwards, their educa-tional progress was assessed.
Results: Students who received supplemental iron showed more improved educational rankings (p = 0.05) and average scores (p = 0.009) com-pared to the control group.
Conclusion: The findings of this study indicat-ed the positive effects of iron supplementation on the educational achievements of female students suffering iron deficiency without anemia.
Key words: Iron Deficiency without Anemia, Adult Female, Academic Achievements, Supple-mental Iron.
Introduction
Iron deficiency is the most common nutritional disorder worldwide which is particularly prevalent
among adult females (1). While 8.7% of Iranian young female students (including university stu-dents) were reported to suffer from iron deficiency anemia(IDA)(2), less severe cases ,iron deficiency without anemia( IDWA) , were found to be three times more prevalent, with some studies even re-porting it as 40%(3-5). Available evidences indicate that IDA affects brain activities such as concentra-tion and learning ability, not only during infancy but also throughout the life course(1, 6-8). The ef-fects of IDWA during reproductive ages have re-cently attracted vast attention(4). In communities of low economic status, nutritional problems make iron deficiency more common(9). On the other hand, academic achievements and level of educa-tion influence a family's economic level resulting in a vicious circle.
Although there is no doubt about the impor-tance of IDA and the necessity of treating this defi-ciency, IDWA, with no specific clinical symptoms may remain underestimated. Considering the high prevalence of iron deficiency (with and without anemia) among female university students, and the possible effect of iron levels on brain activity, the current study is designed to evaluate the efficacy and beneficial effect of supplemental iron on the educational progress of students with IDWA. This project might be the first step for a comprehensive plan regarding the diagnosis and treatment of stu-dents with IDWA who enter the universities.
The Effects of Supplemental Iron on Educational Achievements of Students with “Iron Deficiency without Anemia”: A Randomized, Double-Blind, Placebo-Controlled Trial Alireza Moafi1, Soheila Rahgozar2, Maryam Hajian3, Majid Ghias4, Fatemen Ghorbani3, Akbar Hassanzadeh5
1 Department of Pediatric Haematology, School of Medicine, Isfahan University of Medical Sciences, Isfahan, Iran,2 Department of Biology, Faculty of Science, University of Isfahan , Isfahan, Iran,3 Department of Biology, Faculty of Science, University of Isfahan, Isfahan, Iran,4 Isfahan University Health Center, University of Isfahan, Isfahan, Iran,5 Department of Epidemiology, School of Health, Isfahan University of Medical Sciences, Isfahan, Iran.

Vers
ion fo
r revie
w
HealthMED - Volume 6 / Number 6 / 2012
Journal of Society for development in new net environment in B&H 2053
Methods
Randomized double-blind clinical trial was per-formed on all female students in Faculty of Science, University of Isfahan, at the beginning of the sec-ond semester of 2009-2010. This research was per-mitted and approved by ethic committee of Isfahan University of medical sciences (protocol number 189073). After the students signed written informed consents, they were tested for anemia and iron defi-ciency. Minimum normal levels of hemoglobin and ferritin were considered as 12 g/dl and 20 ng/dl, re-spectively(3, 10). The participants were examined and asked about having a history of any acute or chronic disease. Then, a 3 cc ethylene diamine tet-raacetic acid (EDTA) and a 2 cc coagulated blood sample were taken to determine hemoglobin and ferritin concentrations based on which the students were divided into three groups. Hemoglobin and serum ferritin levels were determined by Sysmex XE 2100 analyzer and Liaison chemiluminescent immunoassay (DiaSorin, Italy), respectively. The first group included healthy subjects with normal hemoglobin and ferritin levels. Students with low hemoglobin (< 12 g/dl) were considered as pa-tients, directly were referred to a hematologist and were excluded from the study. Individuals suffering IDWA, i.e. having normal hemoglobin but low fer-ritin (< 20 ng/dl), were included and divided into two groups of control and case after obtaining a second informed consent.
While the case group was treated with iron sul-fate pills containing 50 mg of elemental iron twice a day for 6 weeks, the control group received placebo (prepared at School of Pharmacy, Isfahan Univer-sity of Medical Sciences) with the same schedule. All the researchers, except the principle investiga-tors, were blinded to the grouping. The participants were provided with 28-pill packs labeled with their names. Every two weeks, the amount of medicine consumed was asked and side effects, complicati-ons and special events such as marriage, pregnancy,
loss of a loved person and other physical or mental problems were evaluated. After recording this in-formation, next packs were supplied to each parti-cipant. The study was started on April 9, 2011 and continued for 6 weeks. Individuals who could not take the medicine or who had particular problems were excluded. Following the final exams, stu-dents’ scores and rankings were extracted in 2 se-mesters, before and after intervention, by the Uni-versity of Isfahan School of Education. Data were analyzed using GraphPad Prism software, version 3.03 (GraphPad Software, San Diego, CA).
Statistical analysisData were expressed as the mean±SD . Diffe-
rences between groups were evaluated by using Student’s t-test and one-way unpaired analysis of variance (Mann-Whitney comparison test).
Results
The study population included 209 female university students majoring Biology (Genetics, Microbiology, and Botany) at Faculty of Science, University of Isfahan, during the educational year of 2010-2011. IDWA, i.e. hemoglobin > 12 g/dl and ferritin < 20 ng/dl, was observed in 85 (40.6%) individuals. Of which 72 accepted and signed in-formed consents forms. Computerized randomiza-tion was used to allocate these students into the two groups of 36. The case and control groups were not significantly different in terms of age or level of fer-ritin (Table 1).Twenty eight students were referred to a hematologist due to anemia.
One student in the case group was excluded due to iron intolerance. Gastrointestinal complaints in-cluding nausea (n=5), constipation (n=2), stomach-ache (n=1), diarrhea (n=1), and increased appetite (n=1) were reported by 8 subjects in the case group and 2 in the control group. Three 6-week treatment courses (with 86 iron pills or placebo) were com-pleted by 32 subjects in the case and 33 in the con-
Table 1. The age and ferritin levels in two groups before the intervention
P-valueControl Case
(Min, Max) Mean (SD) (Min, Max) Mean (SD)0.84 (18, 26) 20.7 (1.68) (18, 23) 20 (1.18) Age (years)
0.13 (5, 17.30) 12.1 (4.02) (4.70, 17.40) 10.61 (4.11) Ferritin level (ng/dl)

Vers
ion fo
r revie
w
2054
HealthMED - Volume 6 / Number 6 / 2012
Journal of Society for development in new net environment in B&H
trol group. Two weeks following the last pill, ferri-tin levels were 22.39±15.10 and 15.39±1.57 for the case and control groups, respectively.
Average scores of the case group increased af-ter intervention (table 2). In the case group, mean average scores before and after intervention were 14.49±1.6 and 15.55±1.7, respectively (Mean±SD, p=0.009).However, in the control group, mean av-erage scores didn’t show significant changes be-fore and after intervention (15.44±1.6 vs. 15.57± 1.7) (Mean±SD, p=0.880). The Mann Whitney test showed that the ranks of participants in the case group were increased after the intervention (p=0.05) compared with those in control group which did not show significant variations in ranks (p>0.05) (table 3).
Discussion
Iron is an essential element in human body, the lack of which is not limited to anemia. Permanent effects of IDA on brain activities and IQs of in-fants and children remain uncured even after the disorder is treated(11-13). However; these com-plications are not limited to the infancy. Based on available evidences, IDA may lead to neuropsy-chological problems (although treatable) in older ages (14, 15). Cognitive performance, emotions, and behavior May be affected in this regard. How-ever, controversy exists regarding the effects of
IDWA on mental activities. Some researchers did not find any iron deficiency-related symptoms in patients suffering from IDWA(16), while others reported improved brain activities or physical sta-tus as a result of supplemental iron intake (4, 17, 18). Our results showed a significant difference between the case and control groups in terms of ranking improvement and the increased average scores. These data confirm the effect of IDWA in mental activities. On the other hand, the current study evaluated, for the first time, the effect of iron intervention on the “educational achievements” as an indicator of brain activities. This variant may be directly or indirectly associated with cognitive performance including concentration and atten-tion, or behavior and emotions, respectively.
The current study showed that the effect of iron storage depletion on educational achievements is transient and may be reversed. However, if treat-ment is initiated late in life, the deficiency may cause long lasting consequences. The important message of this study is to show that iron interven-tion may easily promote students’ academic scores and rankings; an important factor which may even-tually affect their social, economical and interper-sonal quality of life. Authors want to highlight the importance of early diagnosis and treatment of iron deficiency, the strategy which may effectively im-prove the life style of the young generation and subsequently the whole nation. This issue is more
Table 2. Comparison between the number of credits and average scores of case (32 people) and control (33people) groups before and after the intervention
P-valueAfter intervention Before intervention
(Min, Max) Mean (SD) (Min, Max) Mean (SD)0.049 (12, 13) 17.9 (2.2) (12, 21) 17.1 (2.4) Case Number of
credits0.770 (13, 20) 17.4 (1.9) (12, 20) 17.3 (2.1) Placebo0.009 (12.28, 18.57) 15.55(1.7) (11.76, 18.10) 14.99 (1.6) Case Average
scores0.880 (12.52, 18.80) 15.57(1.5) (12.58, 17.91) 15.44 (1.6) Placebo
Table 3. Comparison of rank variation between the case and placebo groups after the interventionCasen(%)
Placebon(%)
Totaln(%)
Decrease in ranks 12(37.5) 14(42.4) 26(40)No change 2(6.3) 6(18.8) 8(12.3)1 rank increased 2(6.3) 4(12.1) 6(9.2)2-4 ranks increased 5(15.6) 5(15.1) 10(15.3)≥ 5 ranks increased 11(34.4) 4(12.1) 15(23)Total 32(100.0) 33(100.0) 65(100.0)

Vers
ion fo
r revie
w
HealthMED - Volume 6 / Number 6 / 2012
Journal of Society for development in new net environment in B&H 2055
important in developing countries, where iron de-ficiency ( with and without anemia) is more preva-lent(19). As a supportive program for low income people, we recommend that health strategies focus on early identification and treatment of this disorder in families which nutritional problem is frequent.
The serum ferritin cut off point used for initiat-ing interventions addressing iron deficiency is not clearly indicated among different studies. In this project the students with ferritin concentrations lower than 20 ng/ dl (and hemoglobin > 12 g/dl) were considered IDWA, and a particular academic improvement is proved as a result of correcting the disorder. Krayenbuehl et al considered serum ferritin of < 15 ng/dl more indicative than >15 ng/dl for initiating the treatment of fatigue in non-anemic, premenopausal women(20). In this study, only 6 out of 32 participants who completed the iron supplement course had ferritin levels equal to or higher than 15 ng/dl from which 50% got higher scores after taking iron supplements. On the other hand, 66% of students with ferritin < 15 ng/dl showed improved educational achieve-ments after intervention. However, the difference between the aforementioned two groups was not significant, suggesting a ferritin concentration of 20 ng/dl as appropriate cut-off to initiate an inter-vention as mentioned in text books references(3).
Considering the high prevalence of iron de-ficiency in women, we studied a population of female adult students. Different figures were re-ported for the prevalence of iron deficiency (with or without anemia) in various parts of the world depending on economic status, culture, and social habits(3). Our findings on the prevalence of IDWA (40.6%) among the studied population were not far from our expectations. Moreover, since in this study, iron supplementation has been proved to be effective in promoting students' academic status, identification and treatment of the disorder (may-be as a health program when the students enter the university) are of utmost importance.
Although 56% of the participants achieved better rankings after intervention, 37.5% ranked worse. Changes in ranking could result from dif-ferent factors such as probable personal and social problems, environmental issues, interest in the studied subject, and emotional concerns. There-fore, despite the fact that we included pleasant or
unpleasant events (e.g. marriage, pregnancy, loss of a loved one, etc.) in our study, the abovemen-tioned underlying factors (possibly with lower severity) could still influence rankings, especially due to our lack of knowledge about each individ-ual's private life. However, designing the study as a randomized double blind clinical trial with two identical groups minimized the effects of underly-ing factors, making the result more reliable.
Conclusion
Supplemental iron led to improved academic achievements in university students suffering IDWA. Iron deficiency is highly prevalent, and negatively influences the educational achieve-ments and future opportunities of students. Hence, iron deficiency among university students, espe-cially those of low economic status, needs to be prevented and early treated in order to provide better educational circumstances for economically troubled students.
Acknowledgments
This study was registered in Isfahan University of Medical Sciences (Number 189073) and Ira-nian Registry of Clinical Trials (a primary registry of the World Health Organization) (Project No. IRCT201008254630N1). The authors sincerely thank all the authorities and students of the Uni-versity of Isfahan for their kind cooperation.
Authors' Contributions
Study design. Drs Moafi and RahgozarAcquisition of data. Dr Moafi, Dr. Rahgozar,
Dr. Ghias, Mrs Hajian and Ghorbani.Analysis and interpretation of data. Drs
Moafi and Rahgozar.Manuscript preparation. Drs Moafi and
Rahgozar.Statistical analysis. Dr Moafi and Mr Has-
sanzadeh.
Vers
ion fo
r revie
w
2056
HealthMED - Volume 6 / Number 6 / 2012
Journal of Society for development in new net environment in B&H
References
1. Clark SF. Iron deficiency anemia. Nutr Clin Pract 2008;23(2):128-41.
2. Moafi A, Rahgozar S, Ghias M, Vahdat ahar E, Bo-rumand A, Sabbaghi A, et al. A Study on Body Mass Index, Blood Pressure, and Red Blood Cell Indices in New Entering Students of the University of Isfa-han. International Journal of preventive Medicine 2011;2(4):280-285.
3. Beutler E. Disorders of Iron Metabolism. In: Mars-hall A. Lichtman TJK, Uri Seligsohn, Kenneth Kaus-hansky, Josef T. Prchal, editor. Williams Hematology. Eighth Edition ed: McGraw-Hill Companies; 2010. p. 565-606.
4. Murray-Kolb LE. Iron status and neuropsycholo-gical consequences in women of reproductive age: what do we know and where are we headed? J Nutr 2011;141(4):747S-755S.
5. Christofides A, Schauer C, Zlotkin SH. Iron deficien-cy and anemia prevalence and associated etiologic risk factors in First Nations and Inuit communities in Northern Ontario and Nunavut. Can J Public Health 2005;96(4):304-7.
6. Nelson M. Anaemia in adolescent girls: effects on cognitive function and activity. Proc Nutr Soc 1996;55(1B):359-67.
7. Halterman JS, Kaczorowski JM, Aligne CA, Auinger P, Szilagyi PG. Iron deficiency and cognitive achie-vement among school-aged children and adolescents in the United States. Pediatrics 2001;107(6):1381-6.
8. Brownlie Tt, Utermohlen V, Hinton PS, Haas JD. Tissue iron deficiency without anemia impairs adap-tation in endurance capacity after aerobic training in previously untrained women. Am J Clin Nutr 2004;79(3):437-43.
9. Kotecha PV. Nutritional anemia in young children with focus on Asia and India. Indian J Community Med 2011;36(1):8-16.
10. Wakeman L, Al-Ismail S, Benton A, Beddall A, Gibbs A, Hartnell S, et al. Robust, routine haematology re-ference ranges for healthy adults. Int J Lab Hematol 2007;29(4):279-83.
11. Lozoff B, Beard J, Connor J, Barbara F, Georgie-ff M, Schallert T. Long-lasting neural and behavi-oral effects of iron deficiency in infancy. Nutr Rev 2006;64(5 Pt 2):S34-43; discussion S72-91.
12. Madan N, Rusia U, Sikka M, Sharma S, Shan-kar N. Developmental and neurophysiologic defi-cits in iron deficiency in children. Indian J Pediatr 2011;78(1):58-64.
13. Chang S, Wang L, Wang Y, Brouwer ID, Kok FJ, Lo-zoff B, et al. Iron-deficiency anemia in infancy and social emotional development in preschool-aged Chinese children. Pediatrics 2011;127(4):e927-33.
14. Lozoff B, Corapci F, Burden MJ, Kaciroti N, Angu-lo-Barroso R, Sazawal S, et al. Preschool-aged chil-dren with iron deficiency anemia show altered affect and behavior. J Nutr 2007;137(3):683-9.
15. Haas JD, Brownlie Tt. Iron deficiency and reduced work capacity: a critical review of the research to de-termine a causal relationship. J Nutr 2001;131(2S-2):676S-688S; discussion 688S-690S.
16. Friedmann B, Weller E, Mairbaurl H, Bartsch P. Effects of iron repletion on blood volume and per-formance capacity in young athletes. Med Sci Sports Exerc 2001;33(5):741-6.
17. Murray-Kolb LE, Beard JL. Iron treatment normali-zes cognitive functioning in young women. Am J Clin Nutr 2007;85(3):778-87.
18. McClung JP, Karl JP, Cable SJ, Williams KW, Nin-dl BC, Young AJ, et al. Randomized, double-blind, placebo-controlled trial of iron supplementation in female soldiers during military training: effects on iron status, physical performance, and mood. Am J Clin Nutr 2009;90(1):124-31.
19. Cotta RM, Oliveira Fde C, Magalhaes KA, Ribeiro AQ, Sant'Ana LF, Priore SE, et al. Social and bio-logical determinants of iron deficiency anemia. Cad Saude Publica 2011;27 Suppl 2:S309-20.
20. Krayenbuehl PA, Battegay E, Breymann C, Furrer J, Schulthess G. Intravenous iron for the treatment of fatigue in nonanemic, premenopausal women with low serum ferritin concentration. Blood 2011; 118(12):3222-7.
Corresponding Author Soheila Rahgozar, Division of Cell, Molecular and Developmental Biology, Department of Biology, Faculty of Science, University of Isfahan, Esfahan, Iran, E-mail: [email protected]

Vers
ion fo
r revie
w
HealthMED - Volume 6 / Number 6 / 2012
Journal of Society for development in new net environment in B&H 2057
Abstract
Objective: We aimed to compare the effects of radiofrequency, local anesthetic and steroid injec-tion and combination of them for facet syndrome that is a reason of low back pain.
Summary of Background Data: Basically, ra-diofrequency thermocoagulation is a procedure that causes tissue damage like nerves by exposing the tissue to heated electrode tip. Nerve blocking has been used as an effective pain therapy method. So we tried to compare and combine these two met-hods in the treatment of lumbar facet syndrome.
Methods: Patients were randomly divided into 3 groups (n=40) each consisted of 40 individuals. Local anesthesia was applied after determining the injection area by c-arm scope device. Radio-frequency was applied in Group R, a mixture of 20 mg metilprednisolone and 5 mg bupivacain was administered in Group B and combination of all these was applied in Group RB. VAS, activity and satisfaction scores were recorded before and after the procedure.
Results: In Group R and Group RB, VAS and activity scores were similar except day 1, day 2 and week 1 and better than group B. Satisfaction scores of Group B were lower when compared to Group R and RB. However, satisfaction scores of Group RB were higher than those of Group R in day 1, day 2 and week 1 but there was no differen-ce at later time points.
Conclusion: In conclusion, we suggest that su-ccessful results can be obtained with radiofrequ-ency thermocoagulation plus facet nerve block combination therapy in patients having lumbar facet syndrome.
Key words: low back pain, radiofrequency, nerve block, zygoapophyseal joint
Introduction
Low back pain is one of the most important disorders affecting human life. Approximately 70-90% of people have low back pain at some point of their lives. In recent years, although the impor-tance given to low back pain has increased, etiolo-gy of most of the low back pain cases still remains unclear. It has been reported that 80% of the cases having low back pain have idiopathic low back pain (1). Facet joints are one of the most important sources of low back pain and leg pain. In contrast to sciatalgia occurring due to disc hernia, resting does not have any help in facet joint syndrome. If it is not accompanied by discopathy, there is ge-nerally no neurologic finding. Radiological eva-luation is usually not helpful in the diagnosis of the said disorder (1-3). Many studies have stated the inadequacy in diagnosing facet joint pain with the help of history, physical examination and ra-diologic findings and concluded that an analgesic response to intraarticular medial branch or facet nerve block is the only certain method to identify facet joint pain. These studies have also concluded that this could be a treatment method to reduce pain (4-6). In many studies, it has been shown that radiofrequency applications are effective in the treatment of facet syndrome (7-10). The principle of radiofrequency thermocoagulation application is to damage the facet nerve by the heat delivered through an electrode. In the first studies carried out on this issue, it was suggested that a lesion created by this method had a selective effect on C and A-delta fibers. However, later, it was shown that the said application affected both thin and thick fibers equally and provided analgesia (11).
In the present study, our aim was to compare efficiencies of pulse radiofrequency thermocoagu-lation, facet nerve block and their combination in the treatment of facet syndrome which is a com-mon reason of low back pain.
Effects of facet joint nerve block addition to radiofrequency in the treatment of low back painCevdet Duger, Iclal Ozdemir Kol, Kenan Kaygusuz, Sinan Gursoy, Caner Mimaroglu
Department of Anesthesiology, Cumhuriyet University School of Medicine, Sivas, Turkey,

Vers
ion fo
r revie
w
2058
HealthMED - Volume 6 / Number 6 / 2012
Journal of Society for development in new net environment in B&H
Materials and method
After getting informed consent from patients and local ethical committee, our study was con-ducted on individuals having single sided low back pain arising from facet joint, lasting more than 6 months and limiting functions and daily life. 120 patients divided into 3 groups each containing 40 individuals were included in this randomized do-uble blinded study with an α value of 0,05, 1-β of 0,83 and power value of 0,83585. After obtaining history for all the patients and conducting clinical, neurological and radiological evaluations, patients aged between 18-60 and diagnosed with single si-ded facet syndrome and having no prior interven-tional treatments were included in the study. The patients troubling at least 2 of the 4 symptoms of facet syndrome, which are; back pain aggravation by hyperextension and rotation, morning stiffness or pain increasing in the morning, local tenderness over one or more facet joints and hip and buttock pain of a nonradicular distribution were enrolled in our study. Informed consent was obtained prior to the procedure. Patients not accepting the procedure, not giving their consent, having coagu-lation defect, major depression and uncontrolled psychiatric disorder, being pregnant or at lactati-on, having respiratory or cardiac problems in pro-ne position, receiving opioid treatment during the previous 1 month, undergoing surgical procedure at the same site, having infection at the procedure site and having disc-related radicular symptoms were excluded from the study.
Using envelope technique, patients were divi-ded into 3 groups each composed of 40 individu-als (n=40). All the patients were taken to the sur-gery room, monitorization was done and injecti-on area was cleaned by antiseptic solution. After C-arm scope guided detection of injection point, 2% Prilocaine (Priloc 2%, Astra Zeneca, Turkey) was injected for cutaneous and subcutaneous ane-sthesia. In Group R (radiofrequency), localization of radiofrequency electrode in the facet joint ca-using pain was determined by sensorial stimulus and C-armed scope device. Pulse radiofrequency thermocoagulation was applied for 6 minutes at 40° C with radiofrequency lesion generator (Ne-uroTherm NT1000, Morgan Automation Ltd, Hampshire, UK). In Group B (block) patients, af-
ter C-arm scope guided determination of injection point, a 1.5 ml mixture of 20 mg methylpredniso-lone acetate (Depo-Medrol 40 mg flk, Eczacibasi, Turkey) and 5 mg bupivacaine (Marcaine 5 mg flk, Astra Zeneca, Turkey) was injected to the fa-cet joint. In Group RB (radiofrequency and block) patients, localization of electrode in the facet joint causing pain was determined by sensorial stimulus and scope device. Pulse radiofrequency thermoco-agulation was applied for 6 minutes at 40°C and a 1.5 ml mixture of 20 mg methylprednisolone ace-tate and 5 mg bupivacaine was injected to the facet joint at the same localization. All procedure was taken by the same physician.
Data on age, height, weight, gender and dura-tion of pain, systolic arterial pressure (SAP) be-fore and after procedure, diastolic arterial pressu-re (DAP) and heart rates (HR) were recorded for all the patients. Visual analogue scale (VAS) pain scores, daily activities (1: poor, to 4: very good) and satisfaction scores (1:poor, to 4:excellent) was recorded before the procedure and at the day 1, day 2, week 1, week 2, month 1, month, 6 and month 12 following the procedure.
Data obtained in our study were loaded on SPSS (version 14.0) and oneway Anova, Kruskal-Wallis and Mann-Whitney U tests were used for the analysis. Variance analysis (intergroup varian-ces), Tukey test and Chi-square test were used for repeated measures.
Results
No complications were observed in the pati-ents. There was no difference among the groups in terms of demographic data such as age, height, weight, gender and duration of pain (Table 1). When the groups were compared for SAP, DAP and HR values, there was no statistical difference.
When the groups were evaluated in terms of baseline VAS values recorded before treatment, all the measures in Group R and Group RB were fo-und to be lower than the baseline values (p<0.05). In Group B, values, except those obtained at a la-ter stage namely at month 6 and 12, were found to be lower compared to those at baseline (p<0.05).
When the groups were compared two by two in terms of VAS pain scores, all VAS pain scores were significantly lower in Group R and Group
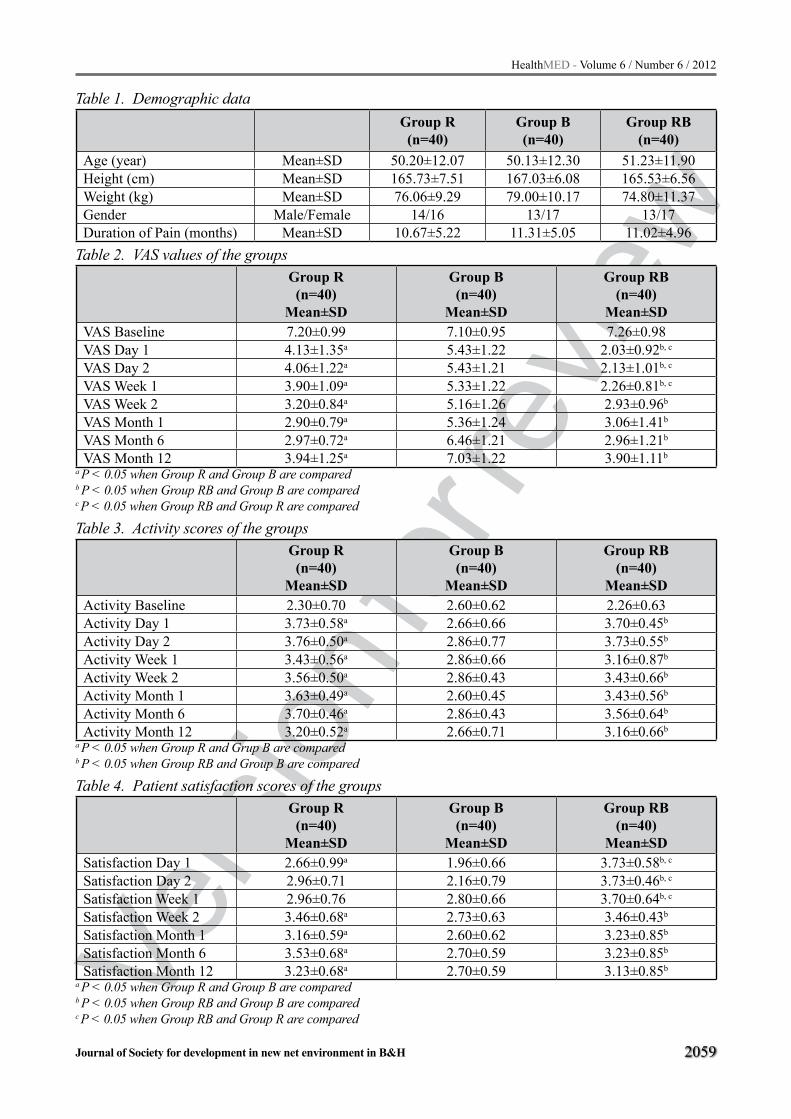
Vers
ion fo
r revie
w
HealthMED - Volume 6 / Number 6 / 2012
Journal of Society for development in new net environment in B&H 2059
Table 1. Demographic dataGroup R(n=40)
Group B(n=40)
Group RB(n=40)
Age (year) Mean±SD 50.20±12.07 50.13±12.30 51.23±11.90Height (cm) Mean±SD 165.73±7.51 167.03±6.08 165.53±6.56Weight (kg) Mean±SD 76.06±9.29 79.00±10.17 74.80±11.37Gender Male/Female 14/16 13/17 13/17Duration of Pain (months) Mean±SD 10.67±5.22 11.31±5.05 11.02±4.96
Table 2. VAS values of the groups Group R(n=40)
Mean±SD
Group B(n=40)
Mean±SD
Group RB(n=40)
Mean±SDVAS Baseline 7.20±0.99 7.10±0.95 7.26±0.98VAS Day 1 4.13±1.35a 5.43±1.22 2.03±0.92b, c
VAS Day 2 4.06±1.22a 5.43±1.21 2.13±1.01b, c
VAS Week 1 3.90±1.09a 5.33±1.22 2.26±0.81b, c
VAS Week 2 3.20±0.84a 5.16±1.26 2.93±0.96b
VAS Month 1 2.90±0.79a 5.36±1.24 3.06±1.41b
VAS Month 6 2.97±0.72a 6.46±1.21 2.96±1.21b
VAS Month 12 3.94±1.25a 7.03±1.22 3.90±1.11b
a P < 0.05 when Group R and Group B are compared b P < 0.05 when Group RB and Group B are comparedc P < 0.05 when Group RB and Group R are compared
Table 3. Activity scores of the groups Group R(n=40)
Mean±SD
Group B(n=40)
Mean±SD
Group RB(n=40)
Mean±SDActivity Baseline 2.30±0.70 2.60±0.62 2.26±0.63Activity Day 1 3.73±0.58a 2.66±0.66 3.70±0.45b
Activity Day 2 3.76±0.50a 2.86±0.77 3.73±0.55b
Activity Week 1 3.43±0.56a 2.86±0.66 3.16±0.87b
Activity Week 2 3.56±0.50a 2.86±0.43 3.43±0.66b
Activity Month 1 3.63±0.49a 2.60±0.45 3.43±0.56b
Activity Month 6 3.70±0.46a 2.86±0.43 3.56±0.64b
Activity Month 12 3.20±0.52a 2.66±0.71 3.16±0.66b
a P < 0.05 when Group R and Grup B are compared b P < 0.05 when Group RB and Group B are compared
Table 4. Patient satisfaction scores of the groupsGroup R(n=40)
Mean±SD
Group B(n=40)
Mean±SD
Group RB(n=40)
Mean±SDSatisfaction Day 1 2.66±0.99a 1.96±0.66 3.73±0.58b, c
Satisfaction Day 2 2.96±0.71 2.16±0.79 3.73±0.46b, c
Satisfaction Week 1 2.96±0.76 2.80±0.66 3.70±0.64b, c
Satisfaction Week 2 3.46±0.68a 2.73±0.63 3.46±0.43b
Satisfaction Month 1 3.16±0.59a 2.60±0.62 3.23±0.85b
Satisfaction Month 6 3.53±0.68a 2.70±0.59 3.23±0.85b
Satisfaction Month 12 3.23±0.68a 2.70±0.59 3.13±0.85b
a P < 0.05 when Group R and Group B are comparedb P < 0.05 when Group RB and Group B are comparedc P < 0.05 when Group RB and Group R are compared

Vers
ion fo
r revie
w
2060
HealthMED - Volume 6 / Number 6 / 2012
Journal of Society for development in new net environment in B&H
RB when compared to Group B (p<0.05). In Gro-up RB, early VAS values, obtained at day 1, day 2 and week 1, were higher compared to Group R (p<0.05) (Table 2).
When groups were compared in terms of activi-ty values, all the values were higher in Group R and Group RB when compared to Group B (p<0.05). There was no difference between Group R and Group RB in terms of activity score (Table 3).
In terms of patient satisfaction values, all the values except those obtained at day 2 and week 1 were higher in Group R when compared to Group B (p<0.05). In Group RB, early satisfaction valu-es, namely those obtained at day 1, day 2 and week 1 were higher compared to Group R (p<0.05). In Group RB, all satisfaction values except at day 2 and week 1 were higher compared to Group B (p<0.05) (Table 4).
Discussion
This randomized, double-blind, controlled tri-al enrolled 120 patients with chronic low back pain due to facet syndrome and differs from other studies as it is a study comparing radiofrequency technique, local anesthetic-steroid injection and combination of two in the treatment of lumbar fa-cet syndromes.
Intra-articular injections and medial branch blocks were reported to be equally effective in di-agnosing facet joint pain and the second one in-volves anesthetization of the nerves to be lesioned (12). Due to sedation, superficial local anesthesia, the spread of anesthetic to other pain generating structures such as muscle, fascia, ligaments, and sacroiliac joints, diagnostic blocks are reported to have an unacceptable high false positive rate unaf-fected by the type of block used (6). Diagnostic blocks are not safer and less invasive than medi-al branch neurotomy. Therefore, we thought that using multiple blocks would increase the compli-cation risk and distress our patients and unfortuna-tely would not give any supplemental information. The patients troubling at least 2 of the 4 symptoms of facet syndrome, which are; back pain increa-sing with hyperextension and rotation, morning stiffness or pain increasing in the morning, local tenderness over one or more facet joints and hip and buttock pain of a nonradicular distribution
were enrolled in our study. Similarly, Yilmaz et al. (13) did not prefer diagnostic blocks in their study and they include the patients who had facet syndrome clinical symptoms as mentioned above.
Although a decrease was observed in pain sco-res compared to baseline in all groups, we obtained similar and the best results in the groups where only radiofrequency was performed and injection plus radiography was performed. In a study of Dreyfuss et al. (7), results obtained up to 12 months in lum-bar facet syndrome treatment with radiofrequency technique were studied, and, similar to our study, it was shown that pain scores and patient satisfaction in long term were better than the values obtained prior to the treatment. Yilmaz et al. (13) studied ra-diofrequency facet joint neurotomy in treatment of facet syndrome and found lower VAS values than baseline values after treatment. In a placebo-con-trolled study, Leclaire et al. (8) reported that VAS values obtained by radiofrequency technique after 4 weeks had been below those obtained at baseli-ne and values obtained at week 12 had been below baseline values even if they were not as low as tho-se obtained at week 4. Cho et al. (9) applied radio-frequency technique in 324 patients some of whom had undergone spinal surgery and stated that a de-crease had been observed in low back pain in all the patients after treatment. Similarly, in a study on 60 patients having low back pain, Gallagher et al. (10) reported that radiofrequency treatment had reduced pain scores in long term.
Daily activities of patients were scored between 1 (poor) and 4 (very good) in our study. Results obtained in radiofrequency group and radiofrequ-ency and injection combination group were simi-lar and activity scores up to 12 weeks were similar when compared to only injection group (7). Ac-tivities were observed to improve in the studies conducted by Cho et al (9) too. Unlike in other studies, no difference was observed in terms of activity scores between radiofrequency group and placebo group the study of Leclaire et al. (8).
In our study, patients satisfaction was scored between 1 (poor) and 4 (excellent) and satisfacti-on scores of the group treated with radiofrequency and injection in combination were found to be hi-gher than those of other groups in the first 2 days and week 1. We obtained better scores especially in the radiofrequency plus injection group, which

Vers
ion fo
r revie
w
HealthMED - Volume 6 / Number 6 / 2012
Journal of Society for development in new net environment in B&H 2061
could be associated with the potentialization of lo-cal anesthetic and steroid injection. In contrast to our study, no change was observed in patient satis-faction values in the study of Dreyfuss (7).
No complications were observed in our pati-ents, and Dreyfuss (7), Cho (9) and Yilmaz (13) similarly stated that no complications had been observed.
In conclusion, we believe that radiofrequency thermocoagulation technique is superior to facet nerve block in the treatment of lumbar facet syn-drome if performed under good imaging conditi-ons at the right areas. Facet nerve block with local anesthetic and steroid couldn’t be an alternative to the radiofrequency for lumbar facet syndrome. We think that adding facet nerve block to radio-frequency thermocoagulation process in the trea-tment of facet syndrome would yield more rapid and effective results in terms of patient pain and satisfaction scores.
References
1. Long DM, et al. Persistent back pain and sciatica in the United States: Patient characteristics. J Spinal Disorders 1996; 9: 40-58.
2. Manchikanti L, Manchikanti KN, Manchukonda R, et al. Evaluation of lumbar facet joint nerve blocks in the management of chronic low back pain: preliminary report of a randomized, double-blind controlled trial: clinical trial NCT00355914. Pain Physician. 2007; 10: 425–440.
3. Manchikanti L, Cash KA, Pampati V, et al. Influence of psychological variables on the diagnosis of facet joint involvement in chronic spinal pain. Pain Physi-cian. 2008; 11: 145– 160.
4. Sowa G: Facet-mediated pain. Dis Mon 2005; 51:18–33
5. Dreyer SJ, Dreyfuss PH: Low back pain and the zyga-pophysial (facet) joints. Arch Phys Med Rehabil 1996; 17:290–300.
6. Dreyfuss PH, Dreyer SJ: Lumbar zygapophysial joint (facet) injections. Spine J 2003; 3: 50–59.
7. Dreyfuss P, Halbrook B, Pauza K, Joshi A, McLarty j, Bogduk N. Efficacy and Validity of Radiofrequency Neurotomy for Chronic Lumbar Zygapophysial Joint Pain. Spine; 2000; 25: 1270-1277.
8. Leclaire R, Fortin L, Lambert R, Bergeron YM, Rossi-gnol M. Radiofrequency facet joint denervation in the treatment of low back pain. Spine, 2001; 26: 1411-1417.
9. Cho J, Park YG, Chung SS. Percutaneous Radio-frequency Lumbar Facet Rhizotomy in Mechanical Low Back Pain Syndrome. Stereotact Funct Neuro-surg 1997; 68: 212-217.
10. Gallagher J et al. Radiofrequency facet joint dener-vation in the treatment of low back pain: a prospec-tive controlled double-blind study to assess its effica-cy. The Pain Clinic 1994; 7: 193-198.
11. Uematsu S, Udvarhelyi GB, Benson DW, Siebens AA: Percutaneous radiofrequency rhizotomy. Surg Neurol Sep; 1974; 2: 319-325.
12. Cohen SP, Raja SN: Pathogenesis, Diagnosis, and Treatment of Lumbar Zygapophysial (Facet) Joint Pain. Anesthesiology 2007; 106: 591-614.
13. Yilmaz C, Kabatas S, Cansever T, Gulsen S, Coven I, Caner H, Altinors N. Radiofrequency facet joint neurotomy in treatment of facet syndrome. J Spinal Disord Tech. 2010; 23: 480-485
Correspponding Author Cevdet Duger, Department of Anesthesiology, Cumhuriyet University, School of Medicine, Sivas, Turkey, E-mail: [email protected]

Vers
ion fo
r revie
w
2062
HealthMED - Volume 6 / Number 6 / 2012
Journal of Society for development in new net environment in B&H
Abstract
Introduction: Coping is related to health out-comes such as distress, survival and cancer recu-rrence. Physical problems are increased with cancer diagnosis and despite of insurance support, patients and their family burden high costs of treatment.
Objective: The purpose of this study was to in-vestigate the physical and financial unmet needs associated with coping strategies in cancer patients.
Method: 146 patients with cancer were non- randomly selected from patients admitted for can-cer treatment in Imam Khomeini Institute Cancer in 2009. Two questionnaires (physical & financial unmet need, 54-item Coping questionnaires) were completed.
Result: the most frequent of subjects were wo-men (75.5%), married (72.3%), Muslim (95.5%) and up to 36.6% subjects had cancer with grade II. Regression analysis revealed that there wasn’t any association between financial unmet need and co-ping, physical unmet need was associated with “Dis-tance” coping strategy (p<0.043). Chi2 analysis re-vealed that there was association between financial unmet need and chemotherapy (p<0.031), physical unmet need was associated with surgery (p<0.027).
Conclusion: The findings suggest that Heal-th care professional should be aware of patient’s physical and financial unmet needs during their care. Further research is recommended to identify family member of cancer patient’s financial need and concerns about out- of- pocket costs.
Key words: financial unmet need, physical unmet need, coping, cancer
Introduction
Disease is process that can make needs and in-crease some previous needs, because of its influence
on body and psyche.1,2 Newest statistics of cancer’s patient death is available to following progress can-cer, but there are a few clinical givens. It is clear that adequate following need to attend to psycho-social outcomes that experienced patient after ma-lady, because malady terms and methods of trea-tment can influence on all personal life’s dimension for a noticeable amount of times.3 If we want to give complete care to cancer’s patient, it’s important to investigate surveillance-supportive and hygienic needs.4 Cancer make noticeable effect on different patient’s needs for instance emotion needs, physi-cal needs(because of disability and infirmity) and financial needs(because of expensive treatment).1,2 Unmet needs means there are some essential, useful and desirous acts or sources for reach to serendi-pity.5 Previous studies in course of cancer patient’s needs explain that cancer patients have great unmet needs and concept of these needs related with emo-tional and psychological status4,5,6,7.
Previous studies on cancer patients unmet needs show that cancer patients experience high levels of unmet needs about hygienic information particular-ly related to methods of diagnosis and treatment, su-pportive psycho-social anxiety and physical needs and daily life.8 Unmet needs can have negative in-fluence on different personal psycho-social dimen-sion that one of them is coping. Coping is a process that person tries to solve personal and intrapersonal problems so get eminency and decrease stresses and conflictions or can be patient. In two recent decades, increasing consideration to the physical problems related to cancer diagnosis. Coping was studied in patient with different kind of cancer, almost in pati-ent with breast cancer, and coping related to stress, survival, reversion and further return.1.2
It’s necessary and useful to reach psychologi-cal, physical and positive coping for coming back to the prior activity.9 Drugest et al in 2005 acce-
Physical, financial unmet need and coping in cancer patientsFathollahbeigy F.1, Zamanian H.2, Karbasi Motlagh M.1, Anjedani E.3, Dastan M.1, Beheshtee M.1, Nochamani Zare M.1, Safaeefar M.1
1 Student Scientific Research Center of Tehran University of Medical Science, Tehran, Iran,2 Qom University of Medical Science, Qom, Iran,3 Tehran University, Tehran, Iran.

Vers
ion fo
r revie
w
HealthMED - Volume 6 / Number 6 / 2012
Journal of Society for development in new net environment in B&H 2063
ssing about relationship between demographic scales, social support, anxiety and coping in bre-ast cancer patient, and consequence social support and demographic scales influence on coping and recovery and so coping related to education and personalcoherency.10 Non-employment, educatio-nal stage, be single or married or divorced is re-lated with decreasing coping and anxiety.10 Other basic problem to unmet primary needs is because of increasing in physical problems and because of relationship between (financial, physical and …)needs and coping,11so if needs don’t compliance maybe influence on coping and with attention to didn’t have any study about physical and finan-cial unmet needs and coping in cancer patient in Iran and universe until now, accomplishment this study, firstly redound to identity financial and physical unmet needs in Iran, and secondly iden-tity these needs give useful information to heal-th executors and politics to avoiding these needs, third by discover relationship between these needs and coping, by solving special needs can expect better and more positive coping. Goal of this study is responding to these questions:
1. Are there any correlation between financial unmet needs and coping?
2. Are there any correlation between physical unmet needs and coping?
Material and Method
This is a cross sectional study that 146 cancer patient admitted in Imam Khomeini Institute Can-cer correlated with Tehran University Of Medicine in 2009, were selected by non-randomly sampling. These were scales of study: 1.Diagnosed cancer’s pathology. 2.Doesn’t have previous psychological history. 3.Doesn’t have guilty and addiction history. 4.Doesn’t have disability and maim. 5. Homeless 6.Does not be unconscious. Patients who was in other study or cannot speak Persian go out of study. At first researcher explained goals of study and then if patient like to participate in study, after getting written testimonial, researcher complete demograp-hic information form, financial and physical unmet needs questionnaire- that is created by researchers- and Ways Of Coping questionnaire12 by interview. Information collected base on says of patients, fi-les or pathological reports. Major questionnaire of
study is unmet needs form that it’s items provided from reviewing articles that evaluate cancer pati-ents needs and library’s studies by executors study, that access financial and physical needs and include 14 close questions by two sectional, multiple secti-onal scales and likert scale. Validity and reliability of this tool calculated by Cronbach’s α coefficients that was equal 0/7904.To evaluate coping use co-ping questionnaire that contains 53 questions with 6 subcategories based on patient coping method with disease, contain: dropped due to low loadings, behavioral allusion-avoidance, centralization social aspect, subject avoiding, recognizable allusion-avo-idance, research and catch social support. Questio-nnaire scale contain likert scale from 0-5(strongly disagree, disagree, neutral, agree, strongly agree). For coping interview take average. Cronbach’s α coefficients for Persian questionnaire was 0/6974. Information collected by patients says, files or pa-thological report. Information were analyzed after completing informational forms and questionnai-res. SPSS for Windows version 11.5 was performed for statistical analysis. data analyzed by chi squa-re for quality variables and chi2 and point biserial correlation coefficient for quantity variables.
This research was accepted to research admini-ster of Tehran University Of Medicine.
And researchers promise to protect secret in-formation of patient.
Results
The most sample of this study were Iranian married women( 75/5 percent) that just 24/5 per-cent of them had family background of cancer. The religion of sample group were Muslim and Shiite (95/5 percent). Also colon cancer (4 percent), bre-ast cancer (1/3 percent) and stomach cancer were prevalent cancer in the sample group.
The grade of disease was 2 in 36/6 percent of patients and then it was 3 in 33/1 percent of pati-ents. (table 1)
Correlation coefficient showed there was not significant relationship between financial unmet needs and coping strategies with cancer in this re-search. (table 2)

Vers
ion fo
r revie
w
2064
HealthMED - Volume 6 / Number 6 / 2012
Journal of Society for development in new net environment in B&H
Table 1. Characteristics of the study participantsCharacteristic Types Percent
Gender Male 27.7Female 72.3
Marital status Married 72.3Single 15.5
Divorced 3.9Other 7.1
Education Elementary School 24.3School 36.9
High school 23.5BA and higher than 15.3
Cancer type Breast 21.3Colon 20.7
Stomach 5.3Other 43.7
Malignancy degree 1 18.32 36.63 33.14 11.3
missing 0.7
Table 2. Relationship between financial unmet needs and coping strategies
Coping strategies r PSeek and use social support 0.01 0.9Cognitive escape-avoidance 0.06 0.5Distancing 0.06 0.6Focus on the positive 0.20 0.06
Behavioral escape-avoidance 0.08 0.5Dropped due to low loadings 0.16 0.11
Investigating the relationship between physi-cal unmet needs and coping strategies with cancer shown there was a significant negative relationship between one of coping strategies (distancing) and physical unmet needs (p<0.043, r=-0.21). These results is shown in table 3 also among treatment procedures chemotherapy was in relationship with financial unmet needs (chi2=4.65, p<0.031) and there was a significant relationship between surge-ry and physical unmet needs (rpbs= 0.22 p<0.027). (table 4 & 5)
Table 3. Relationship between physical unmet needs and coping strategies
Coping strategies r PSeek and use social support -0.04 0.7Cognitive escape-avoidance 0.16 0.1
Distancing -0.2 0.04Focus on the positive -0.14 0.2
Behavioral escape-avoidance 0.03 0.7Dropped due to low loadings -0.09 0.3
Table 4. Relationship between finantial unmet needs and treatment procedure
Chi2 df PChemotherapy 4.65 1 0.031
Surgery 0.359 1 0.549Radiation therapy 0.106 1 0.745
Table 5. Relationship between physical unmet needs and treatment procedure:
rpbs PChemotherapy -0.046 0.648
Surgery 0.220 0.027Radiation therapy 0.008 0.937
Discussion
According to results we didn’t find any signi-ficant relationship between financial unmet needs and coping strategies with cancer. In the previous studies, there wasn’t any study about association between financial unmet needs and coping strate-gies with cancer. However, Drageset et al. (2005) examined the relationship between demographic characteristics, social support, anxiety and coping in the breast cancer patients. The results of his study revealed that social support and demograp-hic characteristics has positive effect on coping strategy and to recovery from cancer. 10 Mathews (2009) in a study that describes barriers cancer care providers face in identifying patients who have financial concerns found family members rather than patients may have better awareness of financial concerns, 13 then perhaps the patients had less awareness about their own financial problems.
In addition, the most sample of this study were women that probably support from their husban-ds, so they had low awareness about financial pro-blems.

Vers
ion fo
r revie
w
HealthMED - Volume 6 / Number 6 / 2012
Journal of Society for development in new net environment in B&H 2065
We found a significant negative relationship between physical unmet needs and “distancing” as a coping strategy with illness. In other words less physical unmet needs in patient is correlate with more distancing from illness and more physi-cal unmet needs in patient is correlate with less distancing from illness. It’s clear that less physical unmet needs had affect on patient’s perception of intensity and existence of illness and so provide possibility of distancing from illness.
The relationship between chemotherapy and unmet financial needs may result from high costs of drugs used in chemotherapy and the long du-ration of chemotherapy treatment and the relati-onship between surgery and physical unmet needs may be caused by physical disabilities resulting from surgery. These are more than disabilities re-sulting from other methods of treatment, Akechi et al. conducted a study on examining relationship of needs felt by patients and quality of life, stress and patients characteristics with intensity of needs felt. This study showed that there is a significant relevance between the employment positions of a patient, period since the cancer was diagnosed, and intensity of cancer and poor performance of the patient against needs felt by him/her (inclu-ding unmet physical needs).14
Patients whose illness is more advanced, many aspects of their needs, specially physical and men-tal needs, or more unmet.5,15,16
Conclusion
If we wish to provide comprehensive care for cancer patients, the care, support and medical tre-atment of patients’ assessment is significant.4 Rea-ching mental, physical and positivistic conformi-ty is essential for enabling the patient to resume his activities before the diagnosing with cancer.9
During the past two decades, attention to physi-cal problems associated to diagnosing cancer has increased. Many researches are dedicated to un-derstanding how patients cope with their illness. Coping with illness in various cancers, specially breast cancer, was examined and studied, establis-hing the relationship between stress, survival and cancer relapse and return to cancer.1,2
This study, explains various methods of with cancer in cancer patients. Although, the hypothe-
sizes on the relationship of unmet financial needs and coping with cancer were not proved, but it proves the relationship between unmet physical and financial needs with methods of treatment. Pursuant to the confirmed hypothesis, we reco-mmend the policy makers of the country to draft plans for financial and physical protection, with due consideration of various stages of the illne-ss (from the beginning until advanced stages) for cancer patients. It is also recommended that futu-re researches examine the financial problems and unmet financial needs of families who are taking care of cancer patients.
References
1. Stanton AL. Danioff –Burg S. Cameron CL. Bishop M. Colinca CA. Kirk SB. Sworowski LA. Twillman R. Emotionally expensive coping predicts psychological and physical adjustment to breast cancer. J Consult Clin psycho. 2002 68:875-882.
2. Pettcrew M. Bell R. Hunter D. Infulence of psycho-logical coping on survival and recurrence in people with cancer: systematic review. Br Med J. 2002,325: 1066-1069.
3. Wen K.Y. & Gustafson D.H. Need assessment for can-cer patients and their families. Health and Life Quali-ty Outcomes. 2004, 2, 11.
4. Sutherland G, Hill D, Morand M, Pruden M, Mclac-hlan SA. Assessing the unmet supportive care needs of newly diagnosed patients with cancer. European Journal of Cancer Care. 2009,18, 577–584
5. Sanson – Fisher R. Girigis A. Boyes A. Bonevski B. Bur-ton l. & Cool P. The unmet need supportive care needs of patients with cancer. Cancer.2002, 88, 226-237.
6. Clavarino A.M., Lowe J.B., Carmont S. & Balanda K. The needs of cancer patients and their families from rural and remote areas of Queensland. Australian Jo-urnal of Rural Health. 2002,10, 188–195.
7. Lintz K., Moynihan C., Steginga S.K., Norman A., Ee-les R., Huddart R., Dearnaley D. & Watson M. Pro-state cancer patient’s support and psychological care needs: Survey from a non-surgical oncology clinic. Psycho-Oncology. 2003, 12, 769–783.
8. Aranda S, Schofield P, Weih l, Yates P, Milne D, Faul-kner R, Voudouris N. Mapping the quality of life and unmet needs of urban women with metastatic breast cancer. European Journal of Cancer Care. 2005,14, 211–222

Vers
ion fo
r revie
w
2066
HealthMED - Volume 6 / Number 6 / 2012
Journal of Society for development in new net environment in B&H
9. Roesch SC, Admos L, Hines A, et al, Coping with pro-state cancer: a meta-analytic review, J Behav Med. 2005, Jun:281-93.
10. Draqeset S, Lindstorm TC, Coping with appasible breast cancer diagnosis: demographic factors and social support, J Adv Nurs. 2005, Aug, 217-26.
11. Ericsson N, et al, Preception of unmet basic need as a predictor of physical functioning among communi-ty-dwelling older adult, J Aqinq Health. 2006, Dec, 18(6): 852-68.
12. Mathews M, Park AD. Identifying patients in Fi-nancial need: Cancer care provider’s perceptions of Barriers, Clinical Journal of Oncology Nursing. 2009, Vol.13. No.15. PP. 501-505.
13. Akechi T, Okuyama T, Endo C, Sagawa R, Uchida M, Nakaguchi T, Akazawa T, Yamashita H, Toyama T, Furukawa T A. Patient’s perceived need and psyc-hological distress and/or quality of life in ambula-tory breast cancer patients in Japan. Psycho-Onco-logy. 2010, DOI: 10.1002/pon.1757
14. Foot G & Sanson – Fisher R.(1995) Meaning the unmet needs of people living with cancer. Cancer Forum19, 131-135.
15. Cosshich T. Schofield PE. & Maclachlan S.A. (2004) Validation in an ambulatory cancer setting. Quality of life Research. 13. 1225 – 1233.
Corresponding Author Zamanian H., Qom University of Medical Science, Qom, Iran, E-mail: [email protected]

Vers
ion fo
r revie
w
HealthMED - Volume 6 / Number 6 / 2012
Journal of Society for development in new net environment in B&H 2067
Abstract
Objective: To measure the peripheral serum levels of fgl2 in patients with acute coronary syn-drome (ACS), analyze the relationship between ACS and the severity of coronary artery lesions .
Methods: 73 patients with coronary heart disease and 15 persons without coronary heart disease were studied. There were 21 patients with acute myocar-dial infarction(AMI), 32 patients with unstable an-gina pectoris(UAP), 20 patients with stable angina pectoris (SAP). All patients with coronary heart dis-ease inspected by coronary angiography were divid-ed into three vessel lesions group, two vessel lesions group and single vessel lesion group by the lesions severity of coronary artery.The serum concentra-tions of soluble fgl2 were measured in all patients with coronary heart disease and controls.The ex-tent of coronary arteriostenosis was evaluated with Gensini Scores. The levels of serum fgl2 and the ex-tent of coronary arteriostenosis were analyzed.
Results: Serum fgl2 levels were remarkably higher in patients with AMI group and UAP group than those in SAP and NCHD group(p<0.05), there was no significant difference in the level of fgl2 be-tween SA group and NCHD group(p>0.05). Gensini Scores were no significant difference in patients with different types of coronary heart disease (p>0.05).
Conclusion: Level of serum fgl2 increased in patients with ACS and it may be maker of unstale plaque in acute coronary syndromes.Levels of se-rum fgl2 had no relation with the severity extent of coronary stenosis among patients with coronary heart disease.
Key words: fgl2; ACS
Introduction
fgl2 prothrombinase, a member of the fibrino-gen superfamily, which was primarily reported to be produced by activated macrophages, T cells, and endothelial cells. Fgl2 functions as a strong
prothrombinase which directly cleaves prothrom-bin to thrombin leading to fibrin deposition in the absence of factor VII or factor X[1].The direct prot-hrombinase activity of fgl2 is implicated in the pathogenesis of several inflammatory disorders including fulminant hepatitis and severe hepatitis, alloand xeno-graft rejection[2, 3, 4]. As we all know, inflammatory and thrombosis is closely asssosia-ted with acute coronary syndrome (ACS), whether Fgl2 is associated with acute coronary syndrome (ACS) is still unknown.
In this study, we observe the serum fgl2 level in acute coronary syndrome patients and the the relationship with the extent of coronary stenosis among patients with coronary heart disease.
Subjects and Methods
Between July 2010 and December 2010, 73 patients with coronary heart disease and 15 per-sons without coronary heart disease at the first afficiated Hospital of Nanchang University were studied. Among patients with coronary heart dis-ease, there were 21 patients with acute myocardial infarction(AMI), 32 patients with unstable angina pectoris(UAP), 20 patients with stable angina pec-toris (SAP).There were 58 male and 30 female patients enrolled, our institutional review commit-tee approved this study. Patients were informed of the investigative nature of the study.
Definition of acute coronary syndromePatients with ACS were classified into the fo-
llowing standard subtypes: AMI and UAP. The GRACE diagnostic criteria of inclusion for AMI, according to the rationale and design of the GRA-CE investigators, was met if patients had a car-diac ischemic symptom and at least one of the following increases in cardiac enzymes: 1) crea-tine kinase MB fraction (CK-MB) >2 times upper limit of the hospital's normal range, and/or 2) po-sitive Troponin T result.[5] NSTEMI was defined
Serum fgl2 levels elevated in patients with acute coronary syndrome (ACS)Zhenzhong Zheng, Junfeng Zhan, Yanglong Zhang, Yunfeng Wei, Menghong Wang, Zeqi Zheng, Jintian Peng
Department of cardiology, The first afficiated Hospital of Nanchang University, Nanchang, Jiangxi, China

Vers
ion fo
r revie
w
2068
HealthMED - Volume 6 / Number 6 / 2012
Journal of Society for development in new net environment in B&H
as occurrence of acute MI with positive cardiac enzyme results, with or without accompanying electrocardiographic changes other than ST se-gment elevation. STEMI was defined as persistent ST segment elevation of ≥1 mm in 2 contiguous electrocardiographic leads or the presence of a new left bundle branch block with positive cardiac enzyme results. [5] The diagnostic inclusion criteria for UAP, according to the rationale and design of the GRACE investigators, was met if patients had a cardiac ischemic symptom with serial enzymes and ST segment elevation negative for MI. [5] Pati-ents were excluded if they had
1) Cardiomyopathy, 2) Cancer, 3) Valvular heart disease, 4) Obstructive pulmonary disease, 5) Trauma Burns, 6) blood diseases, 7) severe liver and kidney dysfunction, 8) history of stroke and cardiovascular surgical
history in the past six months, 9) Patients who had Serious infectious diseases
and taken Immune inhibitors in a month, 10) Rheumatic heart disease, 11) Aortic Dissection.
Angiographic assessmentCoronary angiography was performed by the
Judkins technique through femoral artery access. The angiographic characteristics, which inclu-ded lesion location and percentage stenosis, of all coronary lesions in the index coronary angio-gram were obtained by thoroughly reviewing the angiogram. CAD was defined as > 50% luminal diameter stenosis of at least one major epicardi-al coronary artery. The Gensini scoring system was used to calculate coronary disease severity.
[6] This method defines narrowing of the lumen of the coronary arteries as 1 for 1-25% stenosis, 2 for 26-50% stenosis, 4 for 51-75% stenosis, 8 for 76-90% stenosis, 16 for 91-99%, and 32 for total occlusion. The score is then multiplied by a factor that represents the importance of the lesion's loca-tion in the coronary artery system. For the location scores, 5 points were given for the left main lesi-on; 2.5 for the proximal left anterior descending (LAD) or left circumflex (LCX) artery; 1.5 for the mid segment LAD and LCX; 1 for the distal
segment of LAD and LCX, first diagonal branch, first obtuse marginal branch, right coronary artery, posterior descending artery, and intermediate ar-tery; and 0.5 for the second diagonal and second obtuse marginal branches. The grades of luminal narrowing were determined according to the con-sensus opinion of two experienced interventional cardiologists.
Fgl2 level AssaysDuring the procedure, blood was drawn into et-
hylenediaminetetraacetic acid vacuum containers. Fgl2 was assayed with a noncommercial enzyme linked immuno sorbent assay (ELISA), ELISA Kit for Human Fibrinogen Like Protein 2(FGL2) was purchased from Huamei Bioscience Techno-logy Ltd(China, E0512Hu).We used the GRACE risk scores and compared it with serum Fgl2 con-centrations.
Statistical analysisBaseline demographic and laboratory data are
presented as mean ± SD for continuous variables and frequencies for discrete variables. Compa-risons among groups were calculated with an analysis of variance for continuous variables and Pearson's chi-square test for discrete variables. Correlations between the Fgl2 level and Gensini score were examined by linear regression anal-ysis. All data were analyzed using statistical sof-tware SPSS for windows version 11.0.
Results
Characteristics of patients73 patients with coronary heart disease and
15 persons without coronary heart disease were studied. Among patients with coronary heart dis-ease, there were 21 patients with acute myocardial infarction(AMI), 32 patients with unstable angina pectoris(UAP), 20 patients with stable angina pec-toris (SAP). The baseline clinical and laboratory findings of the three groups were summarized in Table 1. There were no significant differences in age, sex, total cholesterol, TG, LDL-C, and HDL-C among these groups.

Vers
ion fo
r revie
w
HealthMED - Volume 6 / Number 6 / 2012
Journal of Society for development in new net environment in B&H 2069
Table 1. Characteristics of patients
Serum Fgl2 level and coronary artery lesionAs shown in Table 2, Fgl2 level elevated in AMI
and UAP groups as compared with SAP and con-trol groups(P<0.01).There were no significance between SAP group and control group(P﹥0.05). As shown in Table 3, there were no significance among single vessel, double vessel , three vessel groups(P﹥0.05).We also found that there were no Correlations between serum Fgl2 level and coro-nary gensini scores, (r=-0.044;p=0.460) (Fig.1)Table 2. Fgl2 levels in different groups
Table 3. The relationship between numbers of co-ronary artery lesion and fgl2 level
Table 4. Gensini scores in coronary artery disease patients
Figure 1. Correlations between serum Fgl2 level and coronarhy gensini score
Discussion
Acute coronary syndrome (ACS) refers to the array of clinical signs and symptoms produced by acute myocardial ischemia, including unstable an-gina (UA), non-ST-segment-elevation myocardial infarction (NSTEMI), and ST-segment-elevation myocardial infarction (STEMI). [7] Each condition shares common pathophysiologic origins related to the instability and rupture of atherosclerotic vulnerable plaques. [8] Unstable angina and NSTE-MI are differentiated one from the other primarily by their severity—whether the ischemia is pro-longed enough to lead to structural myocardial damage and to the release of detectable markers of myocardial injury, most commonly troponin I, troponin T, or creatine kinase MB. [9]
In this study, we found that serum Fgl2 level in-creased AMI and UAP groups, but it did not incre-ase in SAP group, which indicated that Fgl2 may be involved in instability and rupture of atherosc-lerotic vulnerable plaques.In addition, we obser-ve the Fgl2 level in single vessel, double vessel , three vessel lesion groups, there were no signi-ficance. We also found that there were no corre-lations between serum Fgl2 level and coronary gensini scores.In summary, Fgl2 elvelated only seen in AMI and UAP groups, which suggested that Fgl2 is involved in the process of AMI and UAP.There were no significance of Fgl2 levels in patients with coronary complex or simple and No correlation of Fgl2 with Gensini score suggest that

Vers
ion fo
r revie
w
2070
HealthMED - Volume 6 / Number 6 / 2012
Journal of Society for development in new net environment in B&H
serum Fgl2 does not reflects the severity of coro-nary atherosclerotic stenosis.
From our analysis with the CHD subgroup of patients, it is clear that Fgl2 levels were much hi-gher in those with acute coronary syndrome than in those with stable angina pectoris and without CHD, suggesting that Fgl2 is a hallmark of unstable athe-rosclerotic plaque and myocardial ischemic injury. The mechanism likely due to active matrix dege-neration, plaque destabilization, and consequent thrombosis during pathogenesis of AMI.
As we known, Fgl2 functions as a strong prot-hrombinase which directly cleaves prothrombin to thrombin leading to fibrin deposition in the absen-ce of factor Ⅶ or factor Ⅹ.So we think that Fgl2-induced thrombosis may be involved in ACS pro-cess.In conclusion, the present study revealed that Fgl2 may be powerful predictors of prethrombosis in the coronary circulation indicative of plaque destabilization, which ultimately precedes myo-cardial injury. However, the case number is very small in this study, future prospective studies are warranted to confirm these results.
Acknowledgements
This work was supported by a grant from the National Nature Science Foundation of China (No. 30960119) and the Department of Health Science and Technology Plan of Jiangxi province (NO. 20081198).
Reference
1. Schwartz BS, Levy GA, Fair DS, Edgington TS. Murine lymphoid procoagulant activity induced by bacterial li-popolysaccharide and immune complexes is a monocyte prothrombinase. J Exp Med. 1982;155:1464–1479.
2. Zhu CL, Yan WM, Zhu F, Zhu YF, Xi D, Tian DY, Levy G, Luo XP, Ning Q. Fibrinogen-like protein 2 fibrole-ukin expression and its correlation with disease pro-gression in murine hepatitis virus type 3-induced ful-minant hepatitis and in patients with severe viral he-patitis B. World J Gastroenterol. 2005;11:6936–6940.
3. Ghanekar A, Mendicino M, Liu H, He W, Liu M, Zhong R, Phillips MJ, Levy GA, Grant DR. Endothe-lial induction of fgl2 contributes to thrombosis during acute vascular xenograft rejection. J Immunol. 2004; 172: 5693–5701.
4. Mendicino M, Liu M, Ghanekar A, He W, Koscik C, Shalev I, Javadi M, Turnbull J, Chen W, Fung L, et al. Targeted deletion of Fgl-2/fibroleukin in the donor modulates immunologic response and acute vascular rejection in cardiac xenografts. Circulation. 2005; 112: 248–256.
5. Doo YC, Park WJ, Park SH, et al. The optimal ti-ming to measure C-reactive protein to predict cardiac events in patients with unstable angina. Korean Circ J. 2001; 31:290–296.
6. Gensini GG. A more meaningful scoring system for determining the severity of coronary heart disease.Am J Cardiol. 1983;51(3):606.
7. Alpert JS, Thygesen K, Antman E, Bassand JP. Myo-cardial infarction redefined–a consensus document of The Joint European Society of Cardiology/American College of Cardiology Committee for the redefinition of myocardial infarction [published erratum appears in J Am Coll Cardiol 2001;37(3): 973]. J Am Coll Cardiol 2000; 36(3):959–69.
8. Naghavi M, Libby P, Falk E, Casscells SW, Litovsky S, Rumberger J, et al. From vulnerable plaque to vulne-rable patient: a call for new definitions and risk asse-ssment strategies: Part I. Circulation 2003; 108(14): 1664–72.
9. Apple FS, Jesse RL, Newby LK, Wu AH, Christen-son RH; National Academy of Clinical Biochemistry; IFCC Committee for Standardization of Markers of Cardiac Damage. National Academy of Clinical Bi-ochemistry and IFCC Committee for Standardization of Markers of Cardiac Damage Laboratory Medicine Practice Guidelines: Analytical issues for biochemi-cal markers of acute coronary syndromes. Circulation 2007; 115(13): e352-5.
Corresponding Author Zhenzhong Zheng, Department of cardiology, The first afficiated Hospital of Nanchang University, Nanchang, Jiangxi, China, E-mail: [email protected]

Vers
ion fo
r revie
w
HealthMED - Volume 6 / Number 6 / 2012
Journal of Society for development in new net environment in B&H 2071
Abstract
Background: Reference lists serve as a reso-urce for the author’s ideas. Inaccurate references hinder retrieval of documents, may prevent rese-archers from examining all of the work by an aut-hor and may result in authors not getting credit for their work. The aim of this study was to determine the number and types of errors in nursing research journal reference lists.
Methods: Randomly selected eight hundred references collected from the Public Health Nur-sing, Community Health Nursing, Journal of Clinical Nursing, Journal of Wound Ostomy and Continence Nursing, European Journal of Cancer Nursing, Cancer Nursing, Nephrology Nursing Journal, Journal of Neuroscience Nursing in 2008 were evaluated for citation errors.
There were 2785 citations of these journals during the study period. One hundred references from each journal were selected randomly and analyzed for accuracy.
Results: The overall error rate was 34.8% (342), 92.7% (317) of references error were major and 7.3% (25) of references error were minor.
Conclusion: The results of this study are impor-tant in that they attract attention towards reference errors in the nursing literature. Researchers should also exercise caution with offering references and should definitely write their references in accordan-ce with original sources. They should check their articles in terms of accuracy in references before sending them for publication. Authors should avoid unnecessary use of references and write references in accordance with instructions to authors required by journals. Reviewers should also make sure that references in the articles they reviewed are accurate.
Key words: Research; Reference error; Nur-sing journal.
Introduction
Articles available in scientific journals conclu-de with a list of references cited in the article [1]. According to the Publication Manual of the Ame-rican Psychological Association (5th ed.), “Refe-rence data must be correct and complete” (p. 216) [2]. Reference lists are an important part of scien-tific publication and serve several important fun-ctions [3-4]. Accurate references in research stu-dies are essential for the transmission of scientific knowledge [5]. Readers make use of references to access to the available relevant literature, i.e. both previous and current studies conducted and beco-me aware of his/her own deficient knowledge and different points of views [1].
Inaccurate references may prevent the retrieval of the original publication and propagate misin-formation [6]. Additionally, incorrectly cited re-ferences devalue the credibility of the article, the authors and the journal [7]. In electronic databases, the author’s name and article title are important be-cause the computer will not recognise an error or a misspelling when the search is done [1]. Therefore, it is imperative that they should be written properly to make searching easy. Authors have a responsibi-lity for preparing accurate and relevant references [8]. However, it has been reported that authors and readers do not usually show much care about refe-rences; they show interest in the issue only when it hinders their studies [9]. Therefore, educators sho-uld increase students’ awareness of accurate refe-rences [10]. Reference errors could be objectively classified as major or minor [11]. Major errors such as errors in the publishing year, volume, name of the journal, authors' name, title of the article, vo-lume number, year of publication, and first page make immediate access to references particularly difficult. Minor errors include misspellings, minor
Accuracy Of References In Eight Nursing JournalZuhal Bahar1, Ayse Beser1, Ayfer Elcigil2, Ozgul Karayurt3, Fatma Vural3, Ozlem Ugur2, Ozlem Kucukguclu4
1 Dokuz Eylul University, Nursing Faculty at Community, Health Nursing Department, Izmir, Turkey,2 Dokuz Eylul University, Nursing Faculty at Oncology, Nursing Department, Izmir, Turkey,3 Dokuz Eylul University, Nursing Faculty at Surgical, Nursing Department, Izmir, Turkey,4 Dokuz Eylul University, Nursing Faculty at Medical, Nursing Department, Izmir, Turkey.

Vers
ion fo
r revie
w
2072
HealthMED - Volume 6 / Number 6 / 2012
Journal of Society for development in new net environment in B&H
omissions (not preventing identification) and sub-stitutions, and incorrect author initial or page num-ber errors other than the first page [1,11-12].
There have been studies on reference errors in the medical and nursing literature. Over the years various studies have shown a high rate of referen-ce errors in articles published in general medical journals and in journals of medical specialties. Previous studies of journals of biomedical scien-ces have revealed the overall rates of reference errors of 13.7%-45% [1,5-6,11,13-16].
Some of these studies are as follows: Aronsky et al. in a study of five biomedical informatics jo-urnals, found a total error rate of 34.3% [14]. The reference error rates by journal ranged from 22.1% to 40.7%. Most errors (39.0%) occurred in the aut-hor element, followed by the journal (31.2%), title (17.7%), page (7.4%), year (3.5%), and volume (1.3%) information. Siebers, examined three aller-gy journals and found errors in 17.7%-28.2% of the references [15]. Author errors were the most common, occurring in more than half of all the erroneous references. Title errors were the second most common, followed by page errors, journal errors, volume errors, and year errors.
The error rates of nursing journals have ran-ged between 22.9% and 54% [4,7,9,12,17-18].
Some of these studies are as follows: Suk et al. reviewed four hundred and sixty-six references in eight nursing journals in Korea and found errors in 28.6% to 58.7% of the references [18]. Most errors occurred in the author element (37.9%), followed by title (20.9%), journal (19.0%), page (13.9%), volume (5.9%), and year (2.4%). Oermann and Zi-olkowski, examined three critical care nursing jour-nals and reported an error rate of 22.9% [4]. Major errors, such as misspelled or omitted author names and initials, occurred in 19.6% of the references. Minor errors, including non–first page discrepan-cies, occurred in 4.5% of the references. Errors in author names combined with incorrect or missing volume or issue numbers were the two most com-mon errors, accounting for 61% of errors.
Reference error rates have been studied exten-sively in the medical literature. There are few studies in nursing that have looked at reference errors. Studies on reference errors in the nursing literature have been conducted on fewer journals and references.
The purpose of this study was to determine cu-rrent number and types of errors in eight peer revi-ewed, widely read nursing journals: Journal of Co-mmunity Health Nursing, Public Health Nursing, Cancer Nursing, European Journal of Oncology Nursing, Journal of Clinical Nursing, Journal of Wo-und Ostomy and Continence Nursing, Nephrology Nursing Journal, Journal of Neuroscience Nursing.
Methods
Randomly selected eight hundred references collected from the Public Health Nursing, Com-munity Health Nursing, Journal of Clinical Nur-sing, Journal of Wound Ostomy and Continence Nursing, European Journal of Cancer Nursing, Cancer Nursing, Nephrology Nursing Journal, Journal of Neuroscience Nursing in 2008 were evaluated for reference errors. One issue of each journal published in 2008 was randomly selected. When we failed to reach a sufficient number of references, another issue of that journal was ran-domly selected. The study included only the refe-rences of research articles.
A total of 2785 references in 10 issues were in-cluded. The Public Health Nursing had 408 refe-rences in 11 articles. Community Health Nursing had 217 references in 8 articles. Journal of Clinical Nursing had 490 references in 12 articles. Journal of Wound Ostomy and Continence Nursing had 248 references in 5 articles. European Journal of Cancer Nursing had 465 references in 13 articles. Cancer Nursing had 506 references in 13 articles. Nephrology Nursing Journal had 180 references in 6 articles. Journal of Neuroscience Nursing had 271 references in 6 articles. One hundred references from each journal, 800 references in total, were se-lected randomly and analyzed for accuracy.
We excluded references to books, abstracts, technical reports, dissertations, web sites, manu-als or other types of reports for which the original publication may not be easily accessible for ve-rifying the accuracy of the references. The refe-rences were assessed for accuracy by comparing them with PUBMED. To achieve inter-assessor reliability, all the investigators involved in the study were offered training. During this training, the investigators were given references of resear-ch articles and asked to assess these references for
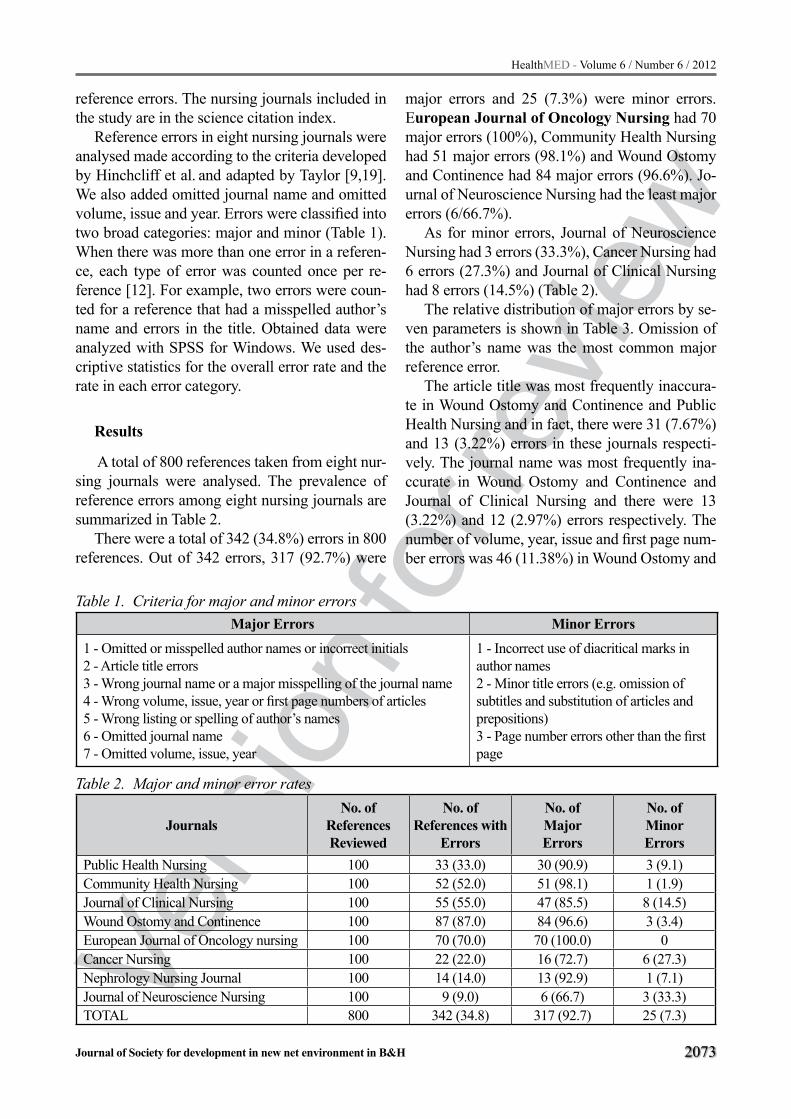
Vers
ion fo
r revie
w
HealthMED - Volume 6 / Number 6 / 2012
Journal of Society for development in new net environment in B&H 2073
reference errors. The nursing journals included in the study are in the science citation index.
Reference errors in eight nursing journals were analysed made according to the criteria developed by Hinchcliff et al. and adapted by Taylor [9,19].
We also added omitted journal name and omitted volume, issue and year. Errors were classified into two broad categories: major and minor (Table 1). When there was more than one error in a referen-ce, each type of error was counted once per re-ference [12]. For example, two errors were coun-ted for a reference that had a misspelled author’s name and errors in the title. Obtained data were analyzed with SPSS for Windows. We used des-criptive statistics for the overall error rate and the rate in each error category.
Results
A total of 800 references taken from eight nur-sing journals were analysed. The prevalence of reference errors among eight nursing journals are summarized in Table 2.
There were a total of 342 (34.8%) errors in 800 references. Out of 342 errors, 317 (92.7%) were
major errors and 25 (7.3%) were minor errors. European Journal of Oncology Nursing had 70 major errors (100%), Community Health Nursing had 51 major errors (98.1%) and Wound Ostomy and Continence had 84 major errors (96.6%). Jo-urnal of Neuroscience Nursing had the least major errors (6/66.7%).
As for minor errors, Journal of Neuroscience Nursing had 3 errors (33.3%), Cancer Nursing had 6 errors (27.3%) and Journal of Clinical Nursing had 8 errors (14.5%) (Table 2).
The relative distribution of major errors by se-ven parameters is shown in Table 3. Omission of the author’s name was the most common major reference error.
The article title was most frequently inaccura-te in Wound Ostomy and Continence and Public Health Nursing and in fact, there were 31 (7.67%) and 13 (3.22%) errors in these journals respecti-vely. The journal name was most frequently ina-ccurate in Wound Ostomy and Continence and Journal of Clinical Nursing and there were 13 (3.22%) and 12 (2.97%) errors respectively. The number of volume, year, issue and first page num-ber errors was 46 (11.38%) in Wound Ostomy and
Table 1. Criteria for major and minor errorsMajor Errors Minor Errors
1 - Omitted or misspelled author names or incorrect initials2 - Article title errors3 - Wrong journal name or a major misspelling of the journal name4 - Wrong volume, issue, year or first page numbers of articles5 - Wrong listing or spelling of author’s names6 - Omitted journal name7 - Omitted volume, issue, year
1 - Incorrect use of diacritical marks in author names 2 - Minor title errors (e.g. omission of subtitles and substitution of articles and prepositions)3 - Page number errors other than the first page
Table 2. Major and minor error rates
JournalsNo. of
References Reviewed
No. of References with
Errors
No. of MajorErrors
No. of MinorErrors
Public Health Nursing 100 33 (33.0) 30 (90.9) 3 (9.1)Community Health Nursing 100 52 (52.0) 51 (98.1) 1 (1.9)Journal of Clinical Nursing 100 55 (55.0) 47 (85.5) 8 (14.5)Wound Ostomy and Continence 100 87 (87.0) 84 (96.6) 3 (3.4)European Journal of Oncology nursing 100 70 (70.0) 70 (100.0) 0Cancer Nursing 100 22 (22.0) 16 (72.7) 6 (27.3)Nephrology Nursing Journal 100 14 (14.0) 13 (92.9) 1 (7.1)Journal of Neuroscience Nursing 100 9 (9.0) 6 (66.7) 3 (33.3)TOTAL 800 342 (34.8) 317 (92.7) 25 (7.3)

Vers
ion fo
r revie
w
2074
HealthMED - Volume 6 / Number 6 / 2012
Journal of Society for development in new net environment in B&H
Continence and 13 (3.22%) in Community Health Nursing. Omission of volume, year and issue was most frequent in European Journal of Oncology nursing (58/14.35%) (Table 3) (Figure 1).
Figure 1. Distribution of major citation errors
The relative distribution of minor errors by three parameters is shown in Table 4. Misuse of
the punctuation marks separating author names was the least frequent. Only Cancer Nursing had only 1 error (4.0%). The number of minor title errors was 6 (24.0%) in Journal of Clinical Nur-sing and 5 (20.0%) in Cancer Nursing. The num-ber of errors in other pages was 2 (8.0%) in Jour-nal of Clinical Nursing and 1(4.0%) in Public He-alth Nursing, Wound Ostomy and Continence and Nephrology Nursing Journal (Table 4) (Figure 2).
Figure 2. Distribution of minor errors
Table 3. Distribution of major reference errors by seven parameters
Journals
Omitted or misspelled
author names or incorrect
initials
Article title
errors
Wrong journal name
or a major misspelling
of the journal name
Wrong volume,
issue, year or first page numbers of
articles
Wrong listing or
spelling of author’s Names
Omitted journal name
Omitted volume,
issue, year
Total
Public Health Nursing
16(3.96)
13(3.22)
5(1.24)
8(1.98) 0 1
(0.25)1
(0.25)44
(10.89)Community
Health Nursing33
(8.17)7
(1.73)1
(0.25)13
(3.22)1
(0.25)1
(0.25)1
(0.25)57
(14.10)Journal of
Clinical Nursing30
(7.43)6
(1.49)12
(2.97)6
(1.49) 0 0 0 54(13.36)
Wound Ostomy and Continence
35(8.66)
31(7.67)
13(3.22)
46(11.38)
1(0.25) 0 0 126
(31.18)European Journal
of Oncology Nursing
24(5.94)
1(0.25)
2(0.49)
1(0.25) 0 0
58(14.35)
86(21.28)
CancerNursing
11(2.72)
2(0.49) 0 2
(0.49) 0 1(0.25)
1(0.25)
17(4.21)
Nephrology Nursing Journal
4(0.99)
2(0.49)
3(0.74)
5(1.24) 0 0 0 14
(3.46)Journal of
Neuroscience Nursing
1(0.25) 0 0 5
(1.24) 0 0 0 6(1.48)
TOTAL 154 (38.12)
62(15.34)
36(8.91)
86(21.,28)
2(0.49)
3(0.74)
61(15.10) 404

Vers
ion fo
r revie
w
HealthMED - Volume 6 / Number 6 / 2012
Journal of Society for development in new net environment in B&H 2075
Discussion
General Reference ErrorsReference errors both in nursing and non-nur-
sing journals have frequently been reported. The rate of one or more reference errors in non-nur-sing journals has ranged between 22% and 66% [1,5,20-22].
We found that the rate of reference errors in ei-ght nursing journals was 34.8% and that Wound Ostomy and Continence (87%) and European Jo-urnal of Oncology Nursing (70%) had the highest rate of errors and Journal of Neuroscience Nursing (9%) and Nephrology Nursing Journal (14%) had the lowest rate of errors.
A total of 120 references had at least one error for an overall error rate of 45.8% of nursing rese-arch journals [9]. Suk et al. in their study on re-ference errors in eight nursing journals in Korea showed a general error rate of 47.9% [18].
Oermann reported error rates of 25% in general nursing journals, 41.6% in pediatric nursing journals and 22.9% in intensive care nursing journals [12].
The reference error rate was higher in eight jo-urnals in this study than that reported in general nursing journals but lower than in pediatric nur-sing journals. When journals publish articles that contain poorly documented references, they also increase the likelihood that SCIE will omit tho-se references. Eight nursing journals examined in this study are within SCI and SCIE indices and those within SCIE had higher error rates. These higher error rates can be due to an underestimati-on of the issue in undergraduate and graduate nur-sing education. Nurse authors should be careful with writing references to reduce reference errors
in nursing journals. Authors should use primary or original sources in their writing. The author always should verify the accuracy of each referen-ce against the original document.
Major reference errorsMajor reference error rates in medical journals
have been reported to range between 2% and 4% [5,11,20,23].
In the present study, 92.72% (317) of the refe-rence errors were considered major errors. There was more than one major error in each reference and the total number of major errors was 404.
As in medical journals, major reference errors in nursing journals varied. Oermann et al. found that the major reference error rate was 19% in general nursing journals and 28.9% in pediatric nursing jo-urnals [4,12]. Taylor examined a total of 120 refe-rences taken from three nursing research journals and found that the major reference error rate was 38.3% and that the rate of more than one major re-ference error was 8.4% [9]. The major reference error rate was quite higher in this study than that fo-und in non-nursing journals. Although rates of ma-jor reference errors were higher in nursing journals, they were lower than the major reference error rate found in the present study. The higher rate of major reference errors in this study can be explained by the presence of errors fulfilling more than one crite-rion for major reference errors.
The most frequently encountered author-crea-ted error was in the names of cited articles’ au-thors. This accounted for 40-60% of all author errors [24]. It has been reported that the names of cited articles’ authors were misspelled or omitted [4,9,12]. The rates of major reference errors in
Table 4. Distribution of minor reference errors Misuse of punctuation marks
separating author namesMinor title
errorsErrors in
other pages Total
Public Health Nursing 0 2 (8.0) 1(4.0) 3(12.0)Community Health Nursing 0 1(4.0) 0 1(4.0)Journal of Clinical Nursing 0 6 (24.0) 2(8.0) 8 (32.0)
Wound Ostomy and Continence 0 2(8.0) 1(4.0) 3(12.0)European Journal of Oncology nursing 0 0 0 0
Cancer Nursing 1 (4.0) 5 (20.0) 0 6 (24.0)Nephrology Nursing Journal 0 0 1(4.0) 1(4.0)
Journal of Neuroscience Nursing 0 3 (12.0) 0 3(12.0)TOTAL 1(4.0) 19 (76.0) 5(20) 25

Vers
ion fo
r revie
w
2076
HealthMED - Volume 6 / Number 6 / 2012
Journal of Society for development in new net environment in B&H
authors’ names in general medical journals range from 34.8% to 48% [1,22,25].
In the present study, the most frequent major reference error was misspelling of the cited aut-hors’ names at the rate of 38.12%. Oerman et al. noted that 60% of the reference errors in medical and nursing literature were in authors’ names and titles. Among these errors were misspelled names of the authors, which were attributed to the use of secondary sources and writing references under hurried conditions [4,12]. Taylor, in a study on nursing research journals noted that misspelling or omission of the first letter of authors’ names acco-unted for 56 out of 62 major reference errors [9]. Oerman et al. reported that the rate of misspelled authors’ names was 36% in intensive care nursing journals and 23.3% in pediatric nursing journals [4,12]. Taylor ascribed these misspellings to long names of authors [9]. Such errors prevent other re-searchers from accessing sources used.
In studies on all reference errors, the wrong or missing volume, issue or first page number was the second most common error.
Ashman showed that SCIE corrected a much higher percentage of these types of mistakes than did the SFS citation index [24]. In studies on gene-ral medical journals, errors were concerned with page numbers in 5.7% -12.1% of the references, year of publication in 3%-4.1% and volume in 1.3%-6.1% [14,22,25].
In the present study, out of 404 major reference errors, 21.28% (86) were wrong volume, issue and first page and 15.10% (61) were omitted volume, issue and year of publication.
Oermann et al. in their study on general nursing journals reported that the most frequent reference errors was wrong volume, issue and first page at the rate of 48.3% [4]. In the present study we fo-und a higher rate of wrong volume, issue, year of publication and first page than in the studies on the medical literature. The second most frequent error detected in this study was wrong volume, year of publication and first page, which is consistent with the results of the studies on nursing journals.
The issue number is essential to find an artic-le in a particular volume. Authors should check the page proofs carefully because some of these errors may occur during production when referen-ce formats are altered to fit the journal’s style [4].
Accurate references enable the reader to locate documents easily, gather further information on the topic, and trace the work of a particular author. They also ensure that the author receives credit for the work. Considering that most journals do not have information specialists to verify references, authors should realize the importance of verifying the accuracy of their references [5].
Another type of major reference errors is con-cerned with article titles. Rates of errors in article titles in the medical literature range from 31.7% to 58.1% [22,25].
In the present study, the rate of errors in article titles was 15.34% (62), which is consistent with the nursing literature, but lower than in the non-nursing literature. Oerman et al. reported that the rate of ar-ticle title errors was 12.5% in intensive care nursing journals and 17.7% in pediatric nursing journals [4,12]. Suk et al. found the rate of article title errors to be 20.9% in eight nursing journals [18].
Major errors are a problem for other researchers because they prevent the rapid retrieval of informa-tion. Errors decrease the value and usefulness of the article and journal in which it is published because they prevent the dissemination of scientific infor-mation. Inaccurate references also decrease the cre-dibility of the author and journal [8].
Minor reference errorsMinor errors might be considered as a sign
of disrespect or lack of courtesy to the author or authors, and may impact negatively on their aca-demic records by excluding the name(s) from the citation index [5].
It has been reported that minor reference error rates are 2%-62% in non-nursing journals [5,22-23].
The minor reference error rate in this study was 7.3% (25). Of all the minor errors, 76% were mi-nor title errors and 20% were page number errors. Journal of Clinical Nursing and Cancer Nursing had the most frequent minor title errors at the rates of 24% and 20% respectively.
It has been reported in the nursing literature that minor reference error rates range from 4.5% to 13.8%. Oerman et al. found minor reference errors to be 4.5% in intensive care nursing jour-nals and 13.7% in pediatric nursing journals [12]. The minor reference errors found in the present

Vers
ion fo
r revie
w
HealthMED - Volume 6 / Number 6 / 2012
Journal of Society for development in new net environment in B&H 2077
study were consistent with those reported from the nursing and non-nursing literature.
It is desirable that reference errors, major or mi-nor, should never occur. We found that eight nur-sing journals in SCIE had higher reference error rates. Lower rates of reference errors increase the credibility of journals and make articles easily available to readers. Errors in reference use can be avoided only by careful reading of each original reference in its entirety and considered placement of references relative to statements they are inten-ded to support [23].
Conclusion
The results of this study are important in that they attract attention towards reference errors in the nursing literature. Such major errors as mi-ssing author initials, or a wrong spelling, do not devalue the reference greatly, but they do reflect a lack of attention to detail [8]. Accurate references allow readers to access to relevant literature easi-ly and help them to gather information they need. They also help readers to become aware of diffe-rent viewpoints [1]. Therefore, it is of great impor-tance to reduce reference errors. Emphasis should be placed on accuracy in reference during nursing education. Researchers should also exercise cauti-on with offering references and should definitely write their references in accordance with original sources. They should check their articles in terms of accuracy in references before sending them for publication. Authors should avoid unnecessary use of references and write references in accordance with instructions to authors required by journals. Reviewers should also make sure that references in the articles they reviewed are accurate.
Authors' contributions
ZB,AB,OK,FV,AA, OK, and OU collec-ted all data, generated the database, designed. ZB,AB,OK,FV,AA, OK, and OU contribu-ted to the development of the study design and ZB,AB,OK advised on statistical analysis. The analysis and results were discussed by all authors together. ZB and AB contributed to interpreting the results and drafting the manuscript. All authors read and approved the final manuscript.
References
1. Al-Benna S, Rajgarhia P, Ahmed, S, Sheikh Z, Accu-racy of references in burns journals. Burns 2009; 677-680.
2. American Psychological Association: Publication Manual of the American Psychological Association. 5nd ed.. Washington DC Pres, 2001.
3. Sharp D. Kipling’s guide to writing a scientific paper. Croatian Medical Journal 43 2002;43:262–7.
4. Oermann MH, Ziolkowski LD. Accuracy of references in three critical care nursing journals. Journal of Pe-riAnesthesia Nursing 2002; 78-83.
5. Vargas-Origel A, Gómez-Martínez G, Vargas-Nie-to, MA. The accuracy of references in peadiatric jo-urnals. Archives of Disease in Childhood 2001;85: 497–498.
6. Buchan JC, Norris J, Kuper H. Accuracy of referen-cing in the ophthalmic literature. American Journal of Ophthalmology 2005;140: 1146-8.
7. Lok CKW, Chan MTV, Martinson IM. Risk factors for citation errors in peer-reviewed nursing journals. Jo-urnal of Advanced Nursing 2001; 34:223-229.
8. Sutherland AG, Craig N, Maffulli N, Brooksbank A, Moir JS. Accuracy of references in the orthopaedic literature. Journal of Bone and Joint Surgery 2000; 82: 9-10.
9. Taylor MK. The practical effects of errors in reference lists in nursing research journals. Nurs Res 1998; 47: 300-3.
10. Spivey CA, Wilks SE. Reference list accuracy so-cial journals. Research on Social Work Practice 2004;14:281-286
11. Eichorn P, Yankauer A. Do authors check their refe-rences? A survey of accuracy of references in three public health journals. American Journal of Public Health 1987; 77:1011-1012.
12. Oermann MH, Cummings SL, Wilmes NA. Accuracy of references in four pediatric nursing journals. Jo-urnal of Pediatric Nursing 2001;16: 263-268.
13. O’Connor AE. A review of the accuracy of referen-ces in the journal Emergency Medicine. Emergency Medicine 2002;14: 139-141.
14. Aronsky D, Ransom J, Robinson K. Accuracy of references in five biomedical informatics journals. Journal of the American Informatics Association

Vers
ion fo
r revie
w
2078
HealthMED - Volume 6 / Number 6 / 2012
Journal of Society for development in new net environment in B&H
2005;12: 225-228.
15. Siebers R. The accuracy of references of three aller-gy journals. Journal of Allergy and Clinical Immu-nology 2000;105: 837-838.
16. Oren G, Watson M. Accuracy of references in the Ophthalmic Literature. Journal of the Medical Li-brary Association 2009;97: 142-5.
17. Schulmeister L. Quotation and reference accuracy of three nursing journals. The Journal of Nursing Scholarship 1998; 30: 143-4.
18. Suk MH, Jang HJ, Park JS, Kim HW, Suh YO, Shin HS, Yang JH, Jung MS, Chung MS.Accuracy of refe-rences in eight nursing journals in Korea. J Korean Acad Nurs 2008 ;38: 180-185.
19. Hinchcliff KW, Bruce NJ, Powers JD, Kipp ML. Accuracy of references and quotations in veterinary journals. JAWMA 1993;202:397-400.
20. Reddy MS, Sirinivas S, Sabanayagam N, Balasubra-manian SP. Accurcy of references in general surgical journals and old problem revisied. Surgeon 2008; 6: 71-75.
21. Lukić IK, Lukić A, Glunčić V, Katavić V, Vučenik V, Marušić A. Citation and quotation accuracy in three anatomy journals. Clinical Anatomy 2004;17: 534–9.
22. Unver B, Senduran, M, Kocak UF, Gunal I, Kara-tosun V. Reference accuracy in four rehabilitation journals. Clin Rehabil 2009: 1-5.
23. Hansen ME, Mclntire DD. Reference Citations in Radiology: Accuracy and appropriateness of use in two major journals. AJR 1994;163: 719-723.
24. Ashman AB. An examination of the research objec-tives of recent citation analysis studies. Collection Management 2009;34: 112–128.
25. Nishina K, Asano M, Mikawa K, Maekawa, J, Oba-ra, H. The accuracy of reference lists in Acta Anae-sthesiologica Scandinavica. Acta Anaesthesiologica Scandinavica 1995; 39:577-578.
Corresponding Author Ayfer Elcigil, Dokuz Eylul University, Nursing Faculty at Oncology, Nursing Department, Izmir, Turkey, E-mail: [email protected]
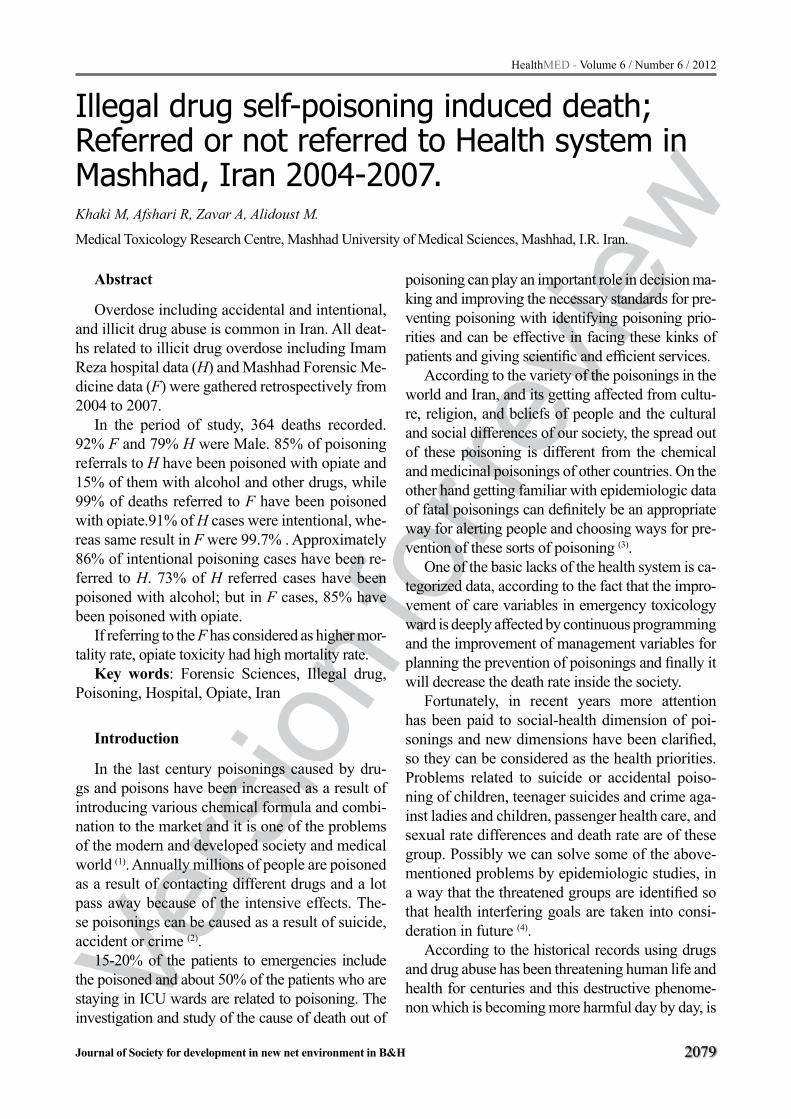
Vers
ion fo
r revie
w
HealthMED - Volume 6 / Number 6 / 2012
Journal of Society for development in new net environment in B&H 2079
Abstract
Overdose including accidental and intentional, and illicit drug abuse is common in Iran. All deat-hs related to illicit drug overdose including Imam Reza hospital data (H) and Mashhad Forensic Me-dicine data (F) were gathered retrospectively from 2004 to 2007.
In the period of study, 364 deaths recorded. 92% F and 79% H were Male. 85% of poisoning referrals to H have been poisoned with opiate and 15% of them with alcohol and other drugs, while 99% of deaths referred to F have been poisoned with opiate.91% of H cases were intentional, whe-reas same result in F were 99.7% . Approximately 86% of intentional poisoning cases have been re-ferred to H. 73% of H referred cases have been poisoned with alcohol; but in F cases, 85% have been poisoned with opiate.
If referring to the F has considered as higher mor-tality rate, opiate toxicity had high mortality rate.
Key words: Forensic Sciences, Illegal drug, Poisoning, Hospital, Opiate, Iran
Introduction
In the last century poisonings caused by dru-gs and poisons have been increased as a result of introducing various chemical formula and combi-nation to the market and it is one of the problems of the modern and developed society and medical world (1). Annually millions of people are poisoned as a result of contacting different drugs and a lot pass away because of the intensive effects. The-se poisonings can be caused as a result of suicide, accident or crime (2).
15-20% of the patients to emergencies include the poisoned and about 50% of the patients who are staying in ICU wards are related to poisoning. The investigation and study of the cause of death out of
poisoning can play an important role in decision ma-king and improving the necessary standards for pre-venting poisoning with identifying poisoning prio-rities and can be effective in facing these kinks of patients and giving scientific and efficient services.
According to the variety of the poisonings in the world and Iran, and its getting affected from cultu-re, religion, and beliefs of people and the cultural and social differences of our society, the spread out of these poisoning is different from the chemical and medicinal poisonings of other countries. On the other hand getting familiar with epidemiologic data of fatal poisonings can definitely be an appropriate way for alerting people and choosing ways for pre-vention of these sorts of poisoning (3).
One of the basic lacks of the health system is ca-tegorized data, according to the fact that the impro-vement of care variables in emergency toxicology ward is deeply affected by continuous programming and the improvement of management variables for planning the prevention of poisonings and finally it will decrease the death rate inside the society.
Fortunately, in recent years more attention has been paid to social-health dimension of poi-sonings and new dimensions have been clarified, so they can be considered as the health priorities. Problems related to suicide or accidental poiso-ning of children, teenager suicides and crime aga-inst ladies and children, passenger health care, and sexual rate differences and death rate are of these group. Possibly we can solve some of the above-mentioned problems by epidemiologic studies, in a way that the threatened groups are identified so that health interfering goals are taken into consi-deration in future (4).
According to the historical records using drugs and drug abuse has been threatening human life and health for centuries and this destructive phenome-non which is becoming more harmful day by day, is
Illegal drug self-poisoning induced death; Referred or not referred to Health system in Mashhad, Iran 2004-2007.Khaki M, Afshari R, Zavar A, Alidoust M.
Medical Toxicology Research Centre, Mashhad University of Medical Sciences, Mashhad, I.R. Iran.

Vers
ion fo
r revie
w
2080
HealthMED - Volume 6 / Number 6 / 2012
Journal of Society for development in new net environment in B&H
the major concern of the governors, and is the most common social disadvantage of the developing co-untries and industrialized communities. Drug abuse is common in Iran (5). Iran has the highest average of drudge abuse in the world (7)(8)(9)(10) and using illegal drugs is moving in the direction of risky combinati-ons and methods (10)(11). Poisonings of drug abuse or accidental use of illegal drugs have allocated a high percent of the referred to health centers.
Although the rate of death out of drug abuse has been decreased in the past 2 years in our country (12)(13), according to the high rate of poisoning and death as a result of drug abuse, research and study in different dimensions and various geographical areas will help in the control of this event.
Unfortunately there is no national data and stati-stics for the rate of the distribution of poisoning in illegal drug addicts. The studies which have been published out of the results of the referred to Foren-sic Medicine or poisoning wards of the hospitals in different provinces, show that using opioid drugs is the major reason of acute poisoning. For instance, in a study of 93 cases of death in Mashhad in 1995, opium has been reported as the main reason (32.8%) (14). In a study of 178 of death cases of above 12 year olds of chemical and medicinal poisoning in 1996 in Loghman Hospital in Tehran, the most common used drug was opium (26%) (15). The study of 88 de-ath cases because of poisoning in Toxicology center of Isfahan, stated that the most common reason of death, has been opium use (11.9%) (16). Even some studies have showed that poisoned with opioid dru-gs in children has been the most common reason of poisoning. 34 cases of poisoning with opium between 1991 and 1998 in children under 3 years old in pediatric medical center hospital has been re-ported (17). Also in a study of the referred to pediatric emergency in Namazi Hospital in Shiraz because of poisoning, opium have been reported as the most common reason of poisoning (18).
This study has been done on the basis of a va-ster research and for examining poisonings lead to death because of illegal drugs usage from diffe-
rent epidemiologic aspects. In this study the epide-miologic factors of dead patients who referred to poisoning ward of Imam Reza Hospital and dead poisoned patients in Forensic Medicine of Mash-had in a 3-year period from 2004 to 2007 has been examined in a descriptive-retrospective method.
Method
This study has been done on the basis of the data of existing files in Imam Reza Hospital and Forensic Medicine center. 240 patient’s files from the poiso-ning ward were chosen and data collection forms were filled for them. Also about 3000 death records because of poisoning were extracted from Forensic Medicine center of Mashhad. In the end by exami-ning all files and applying exclusion criteria (Incom-plete information about toxic substances, poisoning route and clinical symptoms), 69 death cases in Imam Reza Hospital and 295 death cases because of illegal drug abuse in Forensic Medicine had been chosen for the final examination in this study.
According to this fact that the statistical data in Forensic Medicine center is confidential and clear statistical data was not accessible, it was not possi-ble to estimate the sample volume at the beginning of the study, but at the end of data collection, 364 files which were according to the criteria of study were chosen and examined.
Results
The result of this study represent that the age average of death as a result of poisoning with ille-gal drugs which referred to Imam Reza Hospital (H) has been 48 and in Forensic Medicine center (F) 34. Also the most distribution of death cases as a result of poisoning in F is in the age range of 30-40 but in H it has been 40-50.
Comparison of some demographic characteri-stics and method of opium usage between Imam Reza Hospital referred and Forensic Medicine Center referred were illustrated in Tables 1 - 4.
Table 1. Comparison of Age groups between Imam Reza Hospital referred and Forensic Medicine Center referred
Age Groups <10 y 10-19 y 20-29 y 30-39 y 40-49 y 50-59 y 60-69 y 70-79 y >80 y SUMImam Reza Hospital 0 1.5 15.2 18.2 21.2 13.6 15.2 10.6 4.5 100%
Forensic Medicine Center 0.3 3.4 32.4 36.4 21.4 4.4 1.4 0.3 0 100%

Vers
ion fo
r revie
w
HealthMED - Volume 6 / Number 6 / 2012
Journal of Society for development in new net environment in B&H 2081
Table 2. Comparison of Sexual status between Imam Reza Hospital referred and Forensic Medi-cine Center referred
Sex Male Female SUMImam Reza Hospital 21 79 100%
Forensic Medicine Center 8 92 100%
Table 3. Comparison of Marital status between Imam Reza Hospital referred and Forensic Medi-cine Center referred
Marital status Married Single SUMImam Reza Hospital 26 74 100%
Forensic Medicine Center 60 40 100%
Table 4. Comparison of method of opium usage between Imam Reza Hospital referred and Foren-sic Medicine Center referred
Method of usage Ingestion Smoked Injection SUM
Imam Reza Hospital 41 34 25 100%
Forensic Medicine
Center17 26 57 100%
About 82% of poisoning cases because of illegal drugs which led to death were referred directly to F and only 18% were referred to H. In this study, among the poisoned patients who were taken in to H, 85% were referred as a result of using opium, 15% as a result of alcohol and psychotropic pills. In a similar comparison, among the poisoned patients referred to F, 99% referred because of poisoning with opium, 1% alcohol and psychotropic pills.
Among the referred to H as a result of poiso-ning with illegal drugs, 91% were intentional, 9% unintentional; however this rate was 99.7% inten-tional and 0.03% unintentional in F.
There has been a significant relationship between the place the poisoned referred and their gender according to Chi-Square Test ( P<0.001), in a way that nearly 38% of females which died were referred H and 62% directly to F, and this rate for males has been 16% and 84% accordingly. On the other hand, 92% of the cases of poisoning referred to F include males, however in cases re-ferred to hospital 79% were males.
In studying the marital status of the poisoned, according to Chi-Square Test, we found a signi-
ficant relationship (P<0.001), in a way that about 26% of the referred to H are married, on the other hand among the poisoned referred to F nearly 60% include the married. Also only 9% of the married people which referred to H and the remaining whi-ch is 91% were referred to F, however the same data in single group are 29% and 71% accordingly.
This study found that relationship is significant between kind of poisoned illegal drugs and the place the poisoned referred (P<0.001). According to crosstab tables, only 16% of opium poisoned referred to H and the rest referred directly to F, while in other poisoned patients (non-opium) 71% referred to H and 29% referred to F.
The relationship between the method of poiso-ning and the place patients referred is significant (P<0.001). About 86% of intentional poisonings refer to H, however 83% of the unintentional poi-sonings referred to F.
There is a significant relationship between the method of poisoning and the place the poisoned refer, according to Chi-Square Test (P<0.001). More than 57% of referred cases to F were poi-soned by injection, 26% by smoked, and 17% by ingestion, while in the case of referred to the H about 42% were poisoned by ingestion, 34% by smoked and 25% by injection.
According to Fisher's Exact Test there is a si-gnificant relationship between the age range and the referral centers (P<0.001). When the age in-creases, the number of the dead who were referred straight forward to F decrease and the number of referrals to the H increase.
In this study it is identified that in unintentional poisonings about 85% of males are referred to F as a result of poisoning with illegal drugs, while in the case of females only 68% are referred to F and the remaining 32% refer to H. There is no significant relationship in the case of intentional poisonings.
In our study of the existing relationship between marital status and the referred center of the poiso-ned according to there poisoning method (interna-tional or unintentional), in the case of intentional poisonings there is not a considerable relationship between the marital status and the place the poiso-ned were referred to.
In the case of unintentional poisonings, accor-ding to Fisher's Exact Test, the relationship between the above mentioned variables became

Vers
ion fo
r revie
w
2082
HealthMED - Volume 6 / Number 6 / 2012
Journal of Society for development in new net environment in B&H
significant (P<0.001), in a way that 78% of the re-ferred to H include singles and among those who referred to F 60% include the married.
There is a significant relationship between the type of the illegal drug and the center of referral in unintentional poisonings (P<0.001). Nearly 73% of the cases poisoned by alcohol referred to H, while 85% of the cases poisoned by opium were directly referred to F.
According to Fisher's Exact Test, there is a re-lationship between the method of using the illegal drug and the place people referred in the case of unintentional poisonings (P<0.001). In a way that the method of injection to smoked use and smoked use to ingestion use strongly affects the place of referrals. 91% of the cases poisoned with injection were referred to F, on the other hand 69% of the poisonings which were caused by ingestion were directly referred to F. (Maybe this result can be considered as the fatality rate).
On the basis of Fisher’s Exact Test, in the case of unintentional poisonings there is a significant relationship between the age range and the place patients were referred (P<0.001); about 72% of di-rect referrals to F were under 40 years old which means that the average age of referrals to H was higher than the average age of referrals to F.
According to the regression analysis, it is shown that the effect of the variable “the type of illegal drug” in model (in level a=0.05) has not become significant so it is omitted from the model. In this study according to the above model there is a rela-tionship between gender, marital status, the poiso-ning substance, average age of the poisoned, and the method of poisoning with the place of referral (or in other words the fatality rate of poisoning), in a way that the fatality rate in married people is four times as the single. In female poisonings, dea-th chance decreases to 0.3 times compare to male. The fatality rate decreases to 0.6 times by alcohol and psychotropic pills in comparison to opium. The fatality rate with illegal drugs in age upper than 37 decreases 0.3 times in comparison to 37 or less. In the case of unintentional poisonings the chance of referring the poisoned with illegal drugs to F is 20 times more than intentional poisonings.
Discussion and conclusion
The age of the dead as result of poisoning with illegal drugs which were referred to H is higher than the age of the referred to F, which are harmonies with the result of the Liu (2009) study in China (22).
The rate of the referrals of the poisoned as a result of illegal drug use to F is much higher than referrals to H (82% to 18% which is about 4.5 ti-mes) which can be considered as the fatality rate of illegal drugs.
The rate of referrals to F in poisonings with ille-gal drugs in males is more than females (92% to 8% which means about 11.7 times), this statistics is harmonious with the result of the study done by Jalali in Tehran (1998) (27), Liu in China (2009) (22), Wells in England (2009) (24) and Zador (2007) (28).
The rate of referrals to F to H in the case of married is about 5 times by the single. This result is in contrast with the result of the study done by Zador (2007) (28). Opiate drugs include the most illegal drug used in both centers which is similar to the results of Muhuri (2011) (19) and Wunsch (2009)
(25) in the U.S, Karlovesk (2004) (20) in Slovenia, Zwingenberger (2010) (21) in Germany, Hosseinnian Moghadam in Tehran (2004) (23), wells (2009) (24) in England, Izadi Mood (2003) (26) in Isfahan and Jalali in Tehran (1998) (27). The percent of referrals to F in poisoning with opium is more than H and this rate is much higher in poisoning with alcohol or EX (in order 84% to 16% opium, 29% to 71% in alco-hol and EX); the result of the study done by Maag (2003) (32) is against these results.
In unintentional poisonings a high percent are referred to F, while in the case of intentional po-isoning a high percent of referrals relate to H (in order 83% to 85%). These results are similar to the study done by Liu (2009) (22) and in contrast with Moghadam’s study (2004) (23) in Tehran.
Most of the referrals to F are unintentional po-isoning while referrals to H are often intentional poisoning, this result is similar to the result of Jalali’s study in Tehran (1998) (27).
Referrals to F in poisoning by injection are 10 times as referrals to H. This in smoked poisoning is four times and in ingestion is two times. This issue represents the high rate of referrals to F in compari-son with H in other poisoning methods, this data is in contrast with the result of Liu’s study (2009) (22).

Vers
ion fo
r revie
w
HealthMED - Volume 6 / Number 6 / 2012
Journal of Society for development in new net environment in B&H 2083
Like the results of the studies of Stenhous et al (2003) (29) and Brugal (2004) (31) the percent of referrals to F in comparison with referrals to H in the case of poisoning with illegal drugs in lower ages, without considering the method of poisoning (intentional/unintentional) is higher than poiso-nings in higher ages (about 72.4% of referrals to F under 40 while 65% of the referred to H include ages higher than 40).
In the case of unintentional poisoning with ille-gal drugs; the rate of the referred to F in comparison to H is higher among married, while among singles this rate is much lower (93% to 7% among married in comparison with 72% to 28% among singles), the results are similar to De Preux (2004) (30) study.
The referrals to F in the case of unintentional po-isoning with opium are higher than the referrals to H in comparison with unintentional poisoning with alcohol (85% to 15% in unintentional poisoning with opium in comparison with that, 27% o 73% in the case of unintentional poisoning with alcohol).
In unintentional poisonings with the method of injection in comparison with illegal drug swallow, the rate of referrals to F is higher (in injection met-hod this rate is 91% to 9% while in ingestion it is 69% to 31%).
In unintentional poisonings with illegal drugs in lower ages the referrals to F are more than re-ferrals to H.
On the basis of data fitness the rate of the poi-soned referred to F to H among married is 4 times more than the single. Among female poisoning this rate decreases by 0.3 time to male. The mentioned rate in poisoning with alcohol and psychotropic pi-lls is 0.6 times less in comparison with opium. Re-ferrals to F to referrals to the H in ages higher than 37, is 0.3 times less than ages below 37 and less. The chance of referring the poisoned with illegal drugs to F in the case of unintentional poisoning is 20 times more than intentional poisoning.
Acknowledgment
The authors thank Elmira Jafari for her assi-stance in article editing.
References
1. Pajomand A, Shariat T.A. Poisoning Diagnosis and Treatment. (Persian) Tehran: Nashr Daneshgahi pu-blishing; 1377.
2. Viccellio P. Emergency toxicology. Philadelphia: Lip-pincott-Raven; 1998.
3. Najjari F, Afshar M. Report of fatal poisoning in re-ferred Forensic medicine 2001. Iran University of Medical Sciences Journal (Persian) 2004; 11(40): 309-318.
4. Khaki M, Afshari R, Kazemian M. Self-poisoning in-duced deaths; Referred or not referred to health sy-stem. MD Thesis. Azad University Mashhad; 2008.
5. Afshari R, Majdzadeh SR, Balali-Mood M. Pattern of acute poisoning in Mashhad, Iran 1993-2000. Clinical Toxicology 2004; 42(7): 965-75.
6. Jafari S, Rahimi-Movaghar A, Craib K, Baharlou S, Mathias R. A follow-up study of drug users in Sout-hern Iran. Addiction Research & Theory 2010; 18(1); 59-70.
7. Razzaghi EM, Rahimi-Movaghar A, Hosseini M, Ma-danei S. A Rapid Situation Assessment of Drug Abuse in Iran 2001. UNDCP & Welfare Organization. http://www.unodc.org/pdf/iran/publications/RSA2000SUM-MARY.pdf (accessed 11 Feb 2010).
8. Trace M, Roberts M. The rise of harm reduction in the Islamic Republic of Iran. Briefing report, The Berkley Foundation Drug Policy Program 2007, http://www.beckleyfoundation.org/pdf/paper_08.pdf (accessed 11 Feb 2010).
9. Availability of needle and syringe exchange programs and opioid substitution therapy, Regional Overvi-ew Middle East and North Africa. http://www.ihra.net/Assets/584/1/ GSHRMiddleEastNorthAfrica.pdf. (Accessed 11 Feb 2010).
10. Afshari R, Shafaeeyan H. An epidemiologic study of opioid dependent subjects who were volunteered for opioid detoxification in IRAN, 2005. Clinical Toxi-cology 2005; 44(4): 581-82.
11. Kevin J, Patricia S, Jafari S, Rahimi-Movaghar A, Baharlou S. Trends of Substance Use in Southern Iran: A qualitative study. Internet Journal of Epide-miology 2008; 6: no.1.
12. The official mortality statistics of the Drug Abu-se. http://khabarnekar.blogfa.com/post-7287.aspx, (accessed 20 Apr 2011).

Vers
ion fo
r revie
w
2084
HealthMED - Volume 6 / Number 6 / 2012
Journal of Society for development in new net environment in B&H
13. Reduce drug abuse deaths. IRNA. http://www.irna.ir/NewsShow.aspx?NID2, (accessed 20 Apr 2011).
14. Ataran H, Shariat M. Epidemiology of acute poiso-ning caused the death in Mashhad, 1995. Iranian Forensic Medicine Journal (Persian) 1996; 10(3): 16-25.
15. Jalali N, Pajomand A, Farhang A, Kahani A. Epi-demiology of deaths from drug and chemical poiso-ning. Iranian Forensic Medicine Journal (Persian) 1999; 17(5): 16-25.
16. Izadi M.N, Ghashlaghi F. Toxicology of poisoning deaths in the toxicology ward in Noor medical cen-ter in Isfahan. Iranian Forensic Medicine Journal (Persian) 2003; 31(9): 122-126.
17. Kadivar M, Javadinia N, Nemati N. Cases of poiso-ning with opium and its derivatives. IRAN Medical Council Journal (Persian) 2000. 18(2): 100-106.
18. Kashef S, Harati H. Acute poisoning in children re-ferred to the emergency ward of Namazi Hospital in Shiraz. Shaeed Sdoughi University of Medical Sci-ences Journal (Persian) 2002. 10(2): 42-46.
19. Muhuri PK, Gfroerer JC. Mortality associated with illegal drug use among adults in the United States. Am J Drug Alcohol Abuse 2011 May; 37(3):155-64.
20. Karlovsek MZ. Illegal drugs-related fatalities in Slo-venia. Forensic Sci Int 2004 Dec 2;146 Suppl:S71-5.
21. Zwingenberger S, Pietsch J, Hommola A, Dressler J. Illegal drug-related deaths in East Germany between 1995 and 2004. Forensic Sci Int 2010 Jun 15; 199(1-3):58-62.
22. Liu Q, Zhou L, Zheng N, Zhuo L, Liu Y, Liu L. Poiso-ning deaths in China: type and prevalence detected at the Tongji Forensic Medical Center in Hubei. Fo-rensic Sci Int 2009 Dec 15;193(1-3):88-94.
23. Hoseynian M.H, Pajomand A. Sarjamee S. Study of poisoning in Luqman hospital in Tehran 2004. Ira-nian Forensic Medicine Journal (Persian) 2007; 13(4): 235-240.
24. Wells C. Deaths related to drug poisoning in En-gland and Wales, 2008. Health Stat Q 2009 autumn; (43):48-55.
25. Wunsch MJ, Nakamoto K, Behonick G, Massello W. Opioid deaths in rural Virginia: a description of the high prevalence of accidental fatalities involving prescribed medications. Am J Addict 2009 Jan-Feb; 18(1):5-14.
26. Izadi M.N, Ghshlaghi F, Sharafi E. Toxicology of poisoning deaths in the toxicology ward in Noor me-dical center in Isfahan. Iranian Forensic Medicine Journal (Persian) 2003; 31(9): 108-122.
27. Jalali N, Pajomand A, Abdolahi M. Status and mor-tality from chemical and pharmaceutical acute poi-soning in Tehran, 1997-8. Babol University of Me-dical Sciences Journal (Persian) 2000. 1(3): 31-41.
28. Zador D, Sunjic S, Darke S. Heroin-related deaths in New South Wales, 1992: toxicological findings and circumstances. The Medical Journal of Australia 1997. https://www.mja.com.au/public/issues/feb19/zador/zador.html . (accessed 27 April 2011).
29. Stenhouse G, Grieve JH. Drug-related deaths in Grampian, Scotland. Scott Med J 2003 Nov; 48(4): 111-3.
30. De Preux E, Dubois-Arber F, Zobel F. Current tren-ds in illegal drug use and drug related health pro-blems in Switzerland. Swiss Med Wkly 2004 May 29;134(21-22):313-21.
31. Brugal MT, Barrio G, Royuela L, Bravo MJ, de la Fuente L, Regidor E. Estimating mortality attributed to illegal drug use in Spain. Med Clin (Barc) 2004 Dec 4;123(20):775-7.
32. Maag V. Epidemiology of use and abuse of illegal drugs and medicinal drugs-Switzerland in the Euro-pean context. Ther Umsch 2003 Jun;60(6):309-12.
33. M. Balai Mood. Pattern of Acute Poisonings in Mas-hhad, Iran 1993–2000. Clinical Toxicology 2004; 42(7): 965-975
34. Stewart MJ, Moar JJ, Mwesigwa J, Kokot M. Foren-sic toxicology in urban South Africa. J Toxicol Clin Toxicol 2000;38(4):415-9.
Corresponding Author Abbas Zavar, Medical Toxicology Centre, Imam Reza Hospital, Mashhad, Iran, E-mail: [email protected]

Vers
ion fo
r revie
w
HealthMED - Volume 6 / Number 6 / 2012
Journal of Society for development in new net environment in B&H 2085
Abstract
Aim: The present study was conducted to evalu-ate the alexithymic features of rheumatoid arthritis patients based on certain variables in Turkey.
Methods: One hundred twenty-four patients who applied to Physical Medicine and Rehabili-tation Policlinic of Yavuz Selim Bone Diseases Hospital successively, were diagnosed as rheuma-toid arthritis, no known psychiatric or neurological disorders that would interfere with the completion of the measurements, were aged ≥ 35, were able to communicate and agreed to participate were in-cluded in the study. Data were designed by the re-searchers and collected using questionnaire forms that identified the patients’ socio-demographic and disease-related characteristics. The Toronto Alexithymia Scale, which assesses alexithymic features, was also used to assemble the data.
Results: There was not any statistically si-gnificant difference between the alexithymic fe-atures, difficulty identifying feelings, difficulty describing feelings, and externally-oriented thin-king scores and patients’ gender, marital status, educational status, social security coverage, em-ployment status, age groups and place of resi-dence (p>0.05). When the patients were grouped together according to the people with whom they lived (p=0.036), there was a significant difference between the groups in their capacity to describe feelings. There was also a significant difference between the groups in terms of alexithymic featu-res when they were grouped according to disease duration (p=0.020).
Conclusion: The patients with rheumatoid ar-thritis who lived together with their spouses and whose disease duration was less than one year pre-sented higher alexithymic features. When patients are able to identify and to describe their physical and psychological symptoms of rheumatoid ar-
thritis, their chances for receiving treatment in a timely manner greatly improve.
Key words: Alexithymia, rheumatoid arthritis, Toronto Alexithymia Scale
Introduction
Clinical pain, morning stiffness, deformity, and inability to function in their daily lives are the com-plaints reported most often by rheumatoid arthritis (RA) patients (1). It is also known that some arthri-tis symptoms may be psychological, and these fac-tors may contribute to the clinical presentation of the disease (2). RA is a prevalent chronic disease which greatly alters the daily life of those affected, threatens their self-worth, causes severe pain, and creates physical, social and emotional problems (1).
Although research has been conducted regar-ding the psychiatric aspect of rheumatic diseases, research on the alexithymic features of arthritis pa-tients is limited. The Vadacca et al. study suggested that alexithymic features do manifest themselves during the disease progression of arthritis (2).
Alexithymia is a problem with difficulties in interpersonal relations and emotional functions and is characterized as difficulty in identifying and distinguishing between emotions (3). The word “alexithymia” means “without words for emoti-ons” and manifests itself as an inability to identi-fy and express feelings, a lack of fantasy, and an externally-oriented cognitive style (4).
These features appear more often in RA pa-tients who have functioning disorders, and RA patients have been found to exhibit significantly higher alexithymia scores (2,5). The Vadacco et al. study revealed a prevalence of alexithymia of 54 % in RA patients and a 42% rate for those suffe-ring from systemic lupus erythematosus (2).
Alexithymic patients have difficulty in identi-fying feelings and manifest these emotions with bo-
Evaluation of alexithymic features of rheumatoid arthritis patients based on certain variables in TurkeySevilay Hintistan, Nesrin Nural, İlknur Kahriman, Dilek Cilingir
Faculty of Health Science Karadeniz Technical University, Nursing Department, Trabzon, Turkey

Vers
ion fo
r revie
w
2086
HealthMED - Volume 6 / Number 6 / 2012
Journal of Society for development in new net environment in B&H
dily reactions instead of expressing them verbally (3,6). Since these patients seem unable to experien-ce feelings in a normal way and to verbalize them as others do, this seems to be the impetus for some bodily symptoms when they have emotional diffi-culties. A decrease in patients’ capacity to rely on their emotions to guide their behavior reduces their resistance to stress and limits their adaptation (7). Individuals with difficulty identifying emotions are inclined to misinterpret the physical and psycholo-gical symptoms of their bodies (8).
Suggestions have been made that alexithymia may be an important factor in the pathogenesis of unexplained physical symptoms (3). Pain is the most common complaint of RA patients. Reports indicate a high prevalence of alexithymia among the patients with chronic pains, and 22% of the patients with chronic pains are alexithymic (9). Alexithymia, seen more in old age, causes patients to have difficulty in identifying and describing their physical and psychological symptoms (8).
Patients with alexithymic features are affected by socio-demographic and disease-related va-riables. Studies on alexithymia emphasize vari-ables such as gender, age and educational status (2,8,10,11). Alexithymic features are associated with the female gender, advanced age, low edu-cational status, poor health perception and depre-ssion (10).
RA patients may have alexithymic features and may be affected by some of these variables beca-use many individuals with an RA-diagnosis have difficulty in verbally expressing their emotions. These problems can develop when patients expe-rience pain, issues related to aging, movement restriction and emotional challenges such as fear, anger, and worry (2,5).
Turkish studies evaluating the alexithymic fe-atures of patients with rheumatoid arthritis are limited. Therefore, the findings of this study will contribute to the literature currently available to health care professionals who provide services re-lated to this issue.
The aim of this study was to evaluate the alexi-thymic features of patients with rheumatoid arthri-tis in terms of socio-demographic and disease-re-lated variables.
Materials and methods
This study included 124 patients with RA who presented to the outpatient at the Physical Medicine and Rehabilitation Policlinic of Yavuz Selim Bone Diseases Hospital to receive outpatient treatment between January 2006 and April 2006. The study was conducted in a large hospital in Northeastern Turkey and almost all the patients with arthritis in this region, particularly those living in the vicinity of Trabzon, received arthritis treatment in that hospital.
SampleThe present study design involved cross-secti-
onal and descriptive. The inclusion criteria were:1. A diagnosis of RA.2. No known psychiatric or neurological
disorders that would interfere with the completion of the measurements.
3. Able to communicate.4. Age ≥ 35. (Patients ≥aged 35 were selected
because the age of onset of RA is between 35 and 40) (1,5).
5. Agreed to participate in the research.
We had hoped to include all patients who met the inclusion criteria, but 36 patients with impai-red consciousness disorders, difficulty understan-ding the scale, or who had refused to participate were excluded from the research. Thus, only 124 cases were used for the final data analysis.
Procedure and data collectionA two part survey was used to collect the data.
The questionnaire form included socio-demograp-hic and disease-related characteristics and the To-ronto Alexithymia Scale (TAS-20).
Questionnaire FormAfter a review of the current literature, the re-
searchers designed a two-part questionnaire form. The first part targeted socio-demographic characte-ristics, and the second part focused on disease-rela-ted characteristics. Part one included such socio-de-mographic data as gender, marital status, educatio-nal status, social security status, employment status, age, people with whom the patients lived together and place of residence. Part two covered illness-re-lated data such as presence of other chronic illne-sses, deformity, medicine use and disease duration.

Vers
ion fo
r revie
w
HealthMED - Volume 6 / Number 6 / 2012
Journal of Society for development in new net environment in B&H 2087
Toronto Alexithymia Scale (TAS-20)Alexithymic features of the patients were de-
termined using the TAS-20. The TAS-20 was de-veloped by Bagby et al. (12). Turkish reliability and validity studies were performed by Sayar et al. (13). It is a self-administered and Likert type scale with 20 items rated between 1 and 5. The scale measures alexithymia described as a person’s ina-bility to identify and describe their emotions. The total possible score was between 20 and 100. Hi-gher scores meant a higher level of alexithymia. A cut-off point was used and those who got a score ≥ 61 were considered to be alexithymic (14).
The TAS-20 has 3 subscales: the first subscale is Difficulty Identifying Feelings (DIF): “I cannot exactly identify my emotions” (1,3,6,7,9,13,14); the second subscale is Difficulty Describing Fee-lings (DDF): “It is very difficult for me to find the right words for my emotions” (2,4,11,12,17), and the third subscale is Externally-Oriented Thin-king (EOT): “I prefer talking about people’s da-ily living activities rather than their emotions” (5,8,10,15,16,18,19,20). The Cronbach alpha va-lue was 0.80 for the TAS-20 in this study.
ProcedureEach patients was contacted by a research assi-
stant and provided with a detailed explanation of the aim and conduct of the study. The questionna-ire form and TAS-20 used for the data collection were filled in by the researchers using face-to-fa-ce interviews with the patients in a separate quiet room of the policlinic. If the patients were unable to complete the questionnaire form on their own, the researchers read the questionnaire items to the patient and recorded the answers. The questionna-ires took 20-30 mins to complete.
EthicsThe researchers obtained an approval from the
Physical Medicine and Rehabilitation Policlinic of Yavuz Selim Bone Diseases Hospital, and infor-med consent was obtained from each patient. The aim of the research was explained to the patients and they were informed that if they preferred not to continue, they could withdraw from the study any time they wished. After these explanations, 124 patients consented to participate in the study voluntarily.
Data analysis The statistical analysis was performed with
the SPSS for Windows 11.0 program. In additi-on to using descriptive statistical methods (means, standard deviation, minimum, maximum, number, percentage), the Kruskal Wallis Variance Analysis and Mann Whitney U tests were used for the in-ter-group comparisons of parameters that did not follow a normal distribution. The results were assessed with a 95% confidence interval and a si-gnificance of p<0.05.
Results
A majority of the participating RA patients were women (81.5%); 98.4% were married; 64.5% had graduated from primary school and no formal education, and 91.9 % had social securi-ty coverage. Patients who did not work compri-sed 76.6% of participants; 59.7% were aged ≥65; 36.3% were living with their spouses and 42.7% lived in counties. It was noted that 29.8% of the patients had been coping with RA for 1-5 years; 76.6% had another chronic disease apart from ar-thritis; 23.4% had deformities caused by RA; and 78.2% used pain killers and nonsteroidal anti-in-flammatory drugs (NSAIDs).
There was not any statistically significant dif-ference between the TAS-20, DIF, DDF and EOT scores and patients’ gender, marital status, educati-onal status, social security coverage, employment status, age groups and place of residence (p>0.05). However, there was a statistically significant dif-ference between the groups in terms of difficulty describing feelings when the patients were grou-ped according to the people with whom they lived (p=0.036) (Table 1).
We could not find any statistically significant difference between the presence or absence of another chronic disease, deformity, drug-use, and the TAS-20, DIF, DDF and EOT scores (p>0.05). Nevertheless, we found a significant difference between the groups in terms of alexithymic featu-res when they were grouped according to disease duration (p=0.020) (Table 2).

Vers
ion fo
r revie
w
2088
HealthMED - Volume 6 / Number 6 / 2012
Journal of Society for development in new net environment in B&H
Table 1. Socio-demographic features of the patients and mean TAS-20, DIF, DDF, EOT scores
Variables n %TAS-20 DIF DDF EOT
Mean rank
Sum of ranks
Mean rank
Sum of ranks
Mean rank
Sum of ranks
Mean rank
Sum of ranks
GenderWomen Men
10123
81.518.5
60.073.0
6069.01681.0
60.1 71.8
6074.01676.0
61.2 67.9
6187.51562.5
60.1 72.8
6075.01675.0
U=918.000p=0.117
923.0000.125
1036.5000.420
924.0000.124
Marital statusMarriedUnmarried
1222
98.41.6
62.264.9
7101.0649.0
63.550.5
7245.0505.0
61.177.5
6975.0775.0
61.573.5
7015.0735.0
U=546.000 p=0.826
450.0000.270
420.0000.167
460.0000.310
Educational statusPrimary school and ↓ Primary school ↑
8044
64.535.5
65.5 56.9
5245.02505.0
65.4 57.0
5238.52511.5
61.0 65.1
4884.52865.5
66.2 55.7
5297.02453.0
U=0.118 p=0.200
1521.500.212
1644.500.545
1463.000.118
Social security Having Not having
11410
91.98.1
62.264.9
7101.0649.0
63.550.5
7245.0505.0
61.177.5
6975.0775.0
61.573.5
7015.0735.0
U=546.000p=0.826
450.0000.270
420.0000.167
460.0000.310
Occupational statusUnoccupied Occupied
9529
76.623.4
60.867.9
5781.01969.0
61.565.5
5850.01900.0
61.0 67.4
5795.01955.0
60.2 69.7
5727.02023.0
U=1221.000 p=0.355
1290.0000.605
1235.0000.398
1167.0000.211
Variables n % Mean rank Mean rank Mean rank Mean rank Age groups35-49 50-64 65 years and ↑
133774
10.529.859.7
52.960.765.0
54.961.664.2
49.365.363.4
59.656.166.1
χ² KW=1.387 p=0.500
0.7650.682
2.0290.363
2.0530.358
People with whom patients lived togetherAloneSpouse Spouse and childrens Other family persons
23453521
18.536.328.216.9
59.370.150.269.9
58.168.154.169.1
65.569.447.669.0
55.567.358.865.8
χ² KW=7.164 p=0.067
4.0890.252
8.5570.036
2.2250.527
Living placeProvinceCountyVıllage
305341
24.242.733.1
58.8 67.958.2
56.468.259.5
57.868.358.3
64.866.056.1
χ² KW=2.117p=0.347
2.4770.290
2.4910.288
1.9540.376

Vers
ion fo
r revie
w
HealthMED - Volume 6 / Number 6 / 2012
Journal of Society for development in new net environment in B&H 2089
Discussion
Today’s average life expectancy has been in-creasing, and arthritis has become a leading health problem affecting people’s lives as they experien-ce the physical changes of aging. When patients are able to accurately identify and describe their problems, they will be more likely to receive a ti-mely diagnosis and proper treatment (15).
Our research found no significant difference between men and women in terms of alexithymic features. Although the alexithymic scores of the men were higher, this was not statistically signi-ficant. Other studies have demonstrated no signi-ficant difference regarding the DIF according to gender, however, the DDF and EOT scores of men were higher than the women’s scores (16,17). Men
are generally more inclined to EOT and those with higher alexithymic scores are less able to verbalize emotions. On the other hand, women experience fewer difficulties expressing emotions, and their thoughts are less externally oriented (16-19). Matti-la et al. reported that alexithymic features were fo-und in 11.9% of men whereas the rate was 8.1% in women (10). Similar to our study, two other studies with the elderly did not find gender an important factor in terms of alexithymic features (20,21).
Furthermore, patients’ marital status did not affect alexithymic features. As in our study, the Joukamaa et al. study did not reveal a significant correlation between marital status and alexithymia (20). This contradicted the findings of the Matti-la et al. study (8) in which a correlation between alexithymia and marital status was found when
Table 2. Illness-related features of the patients and mean TAS-20, DIF, DDF, EOT scores
Variables n %TAS-20 DIF DDF EOT
Mean rank
Sum of ranks
Mean rank
Sum of ranks
Mean rank
Sum of ranks
Mean rank
Sum of ranks
Presence of a chronic diseaseHaving Not having
9529
76.623.4
65.5 52.6
6224.51525.5
65.652.1
6237.01513.0
63.858.1
6063.0687.0
63.060.5
5994.01756.0
U=1090.000p=0.090
1078.0000.077
1252.0000.457
1321.0000.737
DeformityHaving Not having
2995
23.476.6
61.562.7
1785.55964.5
64.3 61.9
1867.03883.0
62.0 62.6
1798.05952.0
57.6 63.9
1672.56077.5
U=1350.500p=0.877
1323.0000.747
1363.0000.932
1237.5000.406
DrugsPain killer+NSAİDs Pain killer+Anxiolytic +Antibiotic
9727
78.221.8
63.558.9
6159.51590.5
63.359.4
6145.51604.5
62.662.1
6072.51677.5
64.953.8 297.5
1452.5
U=1212.500 p=0.557
1226.5000.615
1299.5000.952
1074.5000.152
Variables n % TAS-20 Mean rank
DIFMean rank
DDFMean rank
EOTMean rank
Disease durationLess than 1 year 1-5 years6-10 years 11-15 years16 years and ↑
1137302125
8.929.824.216.920.2
90.456.770.049.660.4
80.956.572.450.161.6
79.457.168.559.058.7
84.565.560.547.263.4
χ² KW=11.696p=0.020
8.7760.067
4.61140.329
8.4110.078
Vers
ion fo
r revie
w
2090
HealthMED - Volume 6 / Number 6 / 2012
Journal of Society for development in new net environment in B&H
alexithymic features were discovered to be more common in unmarried or widowed patients (10). The Kauhanen et al. study revealed that men who had decreased ability to verbalize feelings also showed more alexithymic features than unmarried men (18). But it should be noted that only 1.6% of participants in our study were unmarried.
The education level of RA patients may contri-bute to developing alternative ways and solutions for coping with the difficulties created by the di-sease (22). Mattila et al. indicated that educational level was negatively correlated with alexithymia. Individuals with a higher education showed alexi-thymic features at a rate of 3.3% while the rate for those with less education was 16.5% (10). Anot-her study also reported a correlation between low educational status and alexithymia (23). However, our research findings do not support the idea that a low level of education plays a role in the formati-on of the alexithymic features.
Our research further revealed that patients with social security coverage are more apt to apply for health care in a timely manner, thus ensuring that patients with arthritis receive the appropriate treatment and care they need. This is particularly true when patients require many hospitalizations. When individuals with chronic diseases already face certain restrictions in many parts of their li-ves, if they also need financial support for their care and treatment, this only contributes to incre-ased anxiety, and negative emotions arise to cause further distress (23,24). Yet, we could not find any correlation between social security coverage and alexithymia in our study.
The study found that employment status did not affect alexithymic features although the TAS-20 scores of people who worked showed higher general alexithymic features. Unlike our study, Kokkonen et al. reported a correlation between employment status and alexithymia. For young working adults the alexithymia prevalence was 9-17% in men and 5-10% in women (23).
We also discovered that the TAS-20, DIF and EOT scores of the arthritis patients aged ≥ 65 were higher. Yet, this finding was not statistically signi-ficant. However, Mattila et al. found a correlation between age and alexithymia and reported that alexithymic features were higher in elderly peo-ple. The alexithymic features were found to be at
a rate of 4.7% in young people, whereas it was 29.3% in the elderly (10).
Every family has its own communication style and each family member’s communication, beha-vior, and thinking styles are shaped in this socio-cultural structure (6). It is well known and under-stood that the ability to express one’s feelings is important to a person’s psychological health. In our study groups arranged according to the people with whom our patients lived, we found a statistically si-gnificant difference between the groups in terms of DDF. The DDF scores appeared the highest among those who lived together with their spouses. Simi-larly, Yurt pointed out that alexithymic individuals generally continued to live in a nuclear family, and their rate of living alone was very low (25).
Various studies have demonstrated that alexit-hymic people did not behave in a natural manner. Although they generally liked company and see-med open to sharing, they somehow perceived they were different and preferred to conceal this from others (18,25-27). Palner and Mittelmark po-inted out that married couples had a higher level of wellness and a lower level of depression and anxiety (26). Kauhanen et al. determined that men who demonstrated a low capacity for verbalizing feelings and had higher alexithymic features also developed a weakened social communication with wives, friends and acquaintances (18).
It is worth noting that the physical and psyc-hological symptoms of arthritic patients with dif-ficulty in describing feelings will likely increase. This may then begin a vicious circle which also triggers an increase in the patient’s alexithymic feelings. Place of residence did not affect alexit-hymic features in our study. Similarly, the study of Joukamaa et al. did not present any correlation between place of residence and alexithymia (20).
In terms of alexithymic features our study re-sults show no significant correlation between pa-tients coping with both arthritis and another chro-nic disease. Unlike our study results, other studi-es have found a correlation among alexithymia, chronic diseases, and psychological disorders (10) between alexithymia and depression (11) and among alexithymia and such diseases as inflam-matory bowel disease, essential hypertension, mi-graine and diabetes mellitus (28). The prevailing thought is that a new disease diagnosis will com-

Vers
ion fo
r revie
w
HealthMED - Volume 6 / Number 6 / 2012
Journal of Society for development in new net environment in B&H 2091
plicate the patient’s disease adaptation, and the identification and description of the body’s physi-cal and emotional symptoms.
The alexithymic features of the patients in our study were not affected by whether or not patients had a deformity. One study reported that people with RA who had more functional disorders also had higher alexithymia scores (5). Severe pain, fati-gue and joint deformation may occur with the pro-gression of RA and osteoarthritis, all of which may cause disabilities and emotional disorders (29). Hyphantis et al. reported that RA patients were in-clined to be devoted, tough, highly self-controlled and perfectionists who also showed a low capaci-ty in the ability to identify and describe feelings (30). Still another study revealed that RA patients showed a higher rate of emotional disorders (31).
The chronic course of the disease, functional li-mitations caused by the disease over time, and the continual need to use medicines may cause hard-ships for many patients whereby they eventually develop some physical and psychological compla-ints (22). The study of Turk observed that alexi-thymic features were significantly higher among those who had physical health problems or habitu-ally used addictive medicines or other substances (32). However, our study findings indicated that medicines used by the patients were not a determi-ning factor in terms of alexithymic features.
Our study also showed that general alexit-hymic features were affected by disease duration. Patients whose illness duration was less than one year showed higher alexithymic features. Another study demonstrated that RA patients who had the disease for less than one year experienced a higher level of anxiety and depression. Furthermore, for patients diagnosed within the last two years, the rate of possible psychological problems ranged from 13.3% to 33% (30).
Conclusion
Alexithymic features of the RA patients were affected by “illness duration” and “people with whom they lived together”. Based on the results of our study data, additional clinical studies should be conducted on RA patients focusing on the different aspects of alexithymia. In addition, in order to incre-ase the well-being of RA patients, health care wor-
kers should be thoroughly trained in identifying and assessing the alexithymic features of RA patients. This would help ensure that they receive appropriate and timely treatment with the goal of helping them learn to identify and describe their emotions.
Limitation
This study was conducted in only one city in Turkey. The results of this study may be genera-lized to the sample group in this study. The sam-ple in this study reflects only one area of Turkey. The findings therefore cannot be generalized to all patients with RA in Turkey. Thus, further stu-dies with larger Turkish sample sizes are needed. However we believe that because our study is the first to investigate the alexithymic features of pati-ents with RA in Turkey, it will provide a foundati-on for future studies.
Acknowledgments
The authors are grateful to the outpatients for their participation in this study. We would also like to thank the director of the college for her support and cooperation and Paula Maria Knauer for the editorial support.
References
1. Reginster JY. The prevalence and burden of arthritis. Rheumatology 2002;41:3-6.
2. Vadacca M, Bruni R, Cacciapaglia F, Serino F, Arca-rese L, Buzzulini F, et al. Alexithymia and immuno-endocrine parameters in patients affected by systemic lupus erythematosus and rheumatoid arthritis. Reu-matismo 2008;60:50-56.
3. Kooiman CG, Bolk JH, Brand R, Trijburg RW, Rooij-mans HG. Is alexithymia a risk factor for unexplained physical symptoms in general medical outpatients? Psychosom Med 2000;62:768-778.
4. Gil FD, Weigl M, Wessels T, Irnich D, Baumüller E, Win-kelmann A. Parental bonding and alexithymia in adults with fibromyalgia. Psychosomatics 2008; 49: 115-122.
5. Fernandez A, Sriram TG, Rajkumar S, Chandrase-kar AN. Alexithymic characteristics in rheumatoid arthritis: a controlled study. Psychother Psychosom 1989;51:45-50.
6. Kocak R. Aleksitimi: The theoretical framework tre-atment approaches and related researchs. Anka-ra Universitesi Egitim Bilimleri Fakultesi Dergisi 2002;35:183-212 (in Turkish)

Vers
ion fo
r revie
w
2092
HealthMED - Volume 6 / Number 6 / 2012
Journal of Society for development in new net environment in B&H
7. Parker JDA, Taylor GJ, Bagby RM. The relationship between emotional intelligence and alexithymia. Pers Indiv Diff 2001;30:107-115.
8. Mattila AK, Saarni SI, Salminen JK, Huhtala H, Sin-tonen H, Joukamaa M. Alexithymia and health-rela-ted quality of life in a general population. Psychoso-matics 2009;50:59-68.
9. Kosturek A, Gregory RJ, Sousou AJ, Trief P. Alexit-hymia and somatic amplification in chronic pain. Psychosomatics 1998;39:399-404.
10. Mattila AK, Salminen JK, Nummi T, Joukamaa M. Age is strongly associated with alexithymia in the ge-neral population. J Psychosom Res 2006;61:629-635.
11. Mattila AK, Poutanen O, Koıvısto AM, Salokangas RKR, Joukamaa M. Alexithymia and life satisfacti-on in primary healthcare patients. Psychosomatics 2007; 48: 523-529.
12. Bagby RM, Parker JDA, Taylor GJ. The Twenty-Item Toronto Alexithymia Scale-I; Item selection and cross-validation of the factor structure. J Psychosom Res 1994;38:23-32.
13. Sayar K, Gulec H, Ak I. The reliability and validity of twenty-item Toronto Alexithymia Scale. 37. Ulu-sal Psikiyatri Kongresi, Tam Metin Kitabı, Istanbul. 2001. s.130 (in Turkish)
14. Taylor GJ, Bagby RM, Parker JDA (eds.). Construct validation, in disorders of affect regulation: alexit-hymia in medical and psychiatric illness. Cambridge University Press, Cambridge, UK, 1997. pp.46-66.
15. Pehlivan S, Ovayolu O, Ovayolu N, Pehlivan Y, Onat AM. Quality of patients with rheumatologic problems and its correlates with some symptoms. Gaziantep Tıp Dergisi 2010;16:10-14 (in Turkish).
16. Salminen JK, Saarijarvi S, Aarela E, Toikka T, Kau-hanen J. Prevalence of alexithymia and its associ-ation with sociodemograghic variables in the gene-ral population of Finland. J Psychosom Res 1999; 46: 75-82.
17. Parker JD, Taylor GJ, Bagby RM. The 20-item To-ronto Alexithymia Scale: IV. Reliability and factorial validity in a community population. J Psychosom Res 2003; 55:269-275.
18. Kauhanen J, Kaplan GA, Julkunen J, Wilson TW, Salonen JT. Social factors in alexithymia. Compr Psychiatry 1993;34:330-335.
19. Hexel M. Alexithymia and attachment style in relation to locus of control. Pers Indiv Diff 2003;35:1261-1270.
20. Joukamaa M, Saarijarvi S, Muuriaisniemi ML, Salo-kangas RK. Alexithymia in a normal elderly popula-tion. Compr Psychiatry 1996;37:144-147.
21. Gunzelmann T, Kupfer J, Brahler E. Alexithymia in the elderly general population. Compr Psychiatry 2002;43:74-80.
22. Eren I, Sahin M, Cure E, Inanlı IC, Tunc SE, Kucuk A. Interactions between psychiatric symptoms and disa-
bility and quality of life in ankylosing spondylitis pa-tients. Noropsikiyatri Arsivi 2007;44:1-9 (in Turkish).
23. Kokkonen P, Karvonen JT, Veijola J, Laksyk K, Jarvelin MR, Joukamaa M. Prevalence and socio-demographic correlates of alexithymia in a popu-lation sample of young adults. Compr Psychiatry 2001;42:471-476.
24. Middendorp H, Geenen R, Sorbi MJ, Hox JJ, Vinge-rhoets AJJM, Doornen LJP, et al. Styles of emotion regulation and their associations with perceived he-alth in patients with rheumatoid arthritis. Ann Beha-ve Med 2005;30:44-53.
25. Yurt E. Alexithymia in patients with schizophre-nia; negative symptoms, side effects of medication, the relationship between depression and insight. Uzmanlık Tezi, T.C. Saglık Bakanlıgı, Istanbul. 2006 (in Turkish).
26. Palner J, Mittelmark MB. Differences between marri-ed and unmarried men and women in the relationship between perceived physical health and perceived mental health. Norsk Epidemiologi 2002 12: 55-61.
27. Kojima M, Senda Y, Nagaya T, Tokudome S, Furu-kawa TA. Alexithymia, depression and social sup-port among Japonese workers. Psychother Psycho-som 2003;72:307-314.
28. Topsever P, Filiz TM, Salman S, Sengul A, Sarac E, Topallı R, et al. Alexithymia in diabetes mellitus. Scott Med J 2006; 51:15-20.
29. Chiou AF, Lin HY, Huang HY. Disability and pain management methods of Taiwanese arthritic older patients. J Clin Nurs 2009;18:2206-2216.
30. Hyphantis TN, Bai M, Siafaka V, Georgiadis AN, Vo-ulgari PV, Mavreas V, et al. Psychological distress and personality traits in early rheumatoid arthritis: a preliminary survey. Rheumatol Int 2006;26:828-836.
31. Dirik G, Karanci AN. Psychological distress in rhe-umatoid arthritis patients: An evaluation within the conservation of resources theory. Psychol Health 2010; 25:617-632.
32. Turk M. The relationship between the characteristics of alexithymia and mental health in university stu-dents. Yuksek Lisans Tezi, Ege Universitesi Sosyal Bilimler Enstitusu, Izmir. 1992 (in Turkish).
Corresponding Author Sevilay Hintistan Faculty of Health Science, Karadeniz Technical University, Nursing Department, Pharmacy Faculty Building, Trabzon, Turkey, E-mail: [email protected]

Vers
ion fo
r revie
w
HealthMED - Volume 6 / Number 6 / 2012
Journal of Society for development in new net environment in B&H 2093
Abstract
Background: Oxidative stress is implicated in the pathogenesis of many diseases. It has been confirmed by various studies that free radicals are involved in the progression of pulmonary tuber-culosis (PT), as well as in the damage caused to the lung tissue. The aim of this study was to in-vestigate the serum lipid peroxidant products and important free radical scavenging enzymes i.e. su-peroxide dismutase (SOD), catalase and glutathio-ne peroxidase (GPx) levels in tuberculosis patients before and during therapy.
Methodology: Total 120 patients with active PT and 60 healthy people as the control group were included in our study. For subjects with PT, the levels of antioxidative enzymes and products of lipid peroxidation were determined twice – first prior to the treatment with anti-tuberculosis drugs and again, three weeks after the initiation of the treatment. The control group had the aforementio-ned parameters measured only once.
Results: The levels of lipid peroxidation incre-ased significantly in PT patient (p<0.05), while the levels of the antioxidants (SOD and GPx) were found to be decreased significantly in PT patients (p<0.05 and p<0.001) as compared to the control group. The values of antioxidant enzymes increased during the treatment with anti-tuberculosis drugs.
Conclusion: The study showed that the free ra-dical activity is high and antioxidant levels are low in PT patients. The application of the anti-tubercu-losis treatment increased the levels of antioxidants.
Key words: Pulmonary Tuberculosis, Oxidati-ve stress, Oxidants, Antioxidants
Introduction
Tuberculosis is a leading health problem worl-dwide and remains one of the leading causes of de-
ath of infectious disease. According to the World Health Organization, tuberculosis is an infectious disease caused by Mycobacterium tuberculosis (M. tuberculosis) which commonly affects the lungs. This disease is characterized by a produc-tive cough, night sweats, fever, chills, chest pain, weight loss, fatigue and anorexia (1). Nearly one third of the global populations is infected with M. tuberculosis. It is estimated that 8.5 million people develop active tuberculosis each year resulting in approximately 2 million deaths. Factors contribu-ting to the resurgence of tuberculosis in develo-ping countries and problems of its control include the co-infection with HIV, the emergence of multi drug-resistant strains of tuberculosis, inadequate treatment, malnutrition, armed conflict and incre-ased number of displaced persons (2).
During cellular metabolism in normal conditi-ons, the lungs are exposed to basal oxidative stress, due to the production of reactive oxygen species (ROS) such as superoxide anion and hydrogen pe-roxide (H2O2). Human tissues are protected from oxidative damage by a variety of mechanisms in-cluding antioxidants like vitamins C and E. If the antioxidant system is inadequate and the free radi-cal level happens to be greater than the antioxidant capacity of the organism, free radical reactions be-come very toxic and may harm the lungs (3,4).
The increased production of reactive oxygen spe-cies (ROS) is a consequence of phagocyte respira-tory burst during an infection with M. tuberculosis. The generation of lipid peroxides indicates the extent of oxidative modification of lipids and serves as a marker of lipid-rich particles damage (cell membra-ne structures or blood lipoprotein particles). Lipid peroxidation is a final step of free radical mediated chain reaction. In lipid peroxidation, a primary reac-tive free radical interacts with polyunsaturated fatty acids to initiate a complex series of reactions that
The Anti-oxidants status and lipid peroxidation product of newly diagnosed and three-weeks follow up patients with pulmonary tuberculosisIvana Stankovic, Slavica Golubovic, Tatjana Pejcic, Milan Radovic, Zorica Ciric
Clinic for lung disease, Clinical Center Nis, Serbia

Vers
ion fo
r revie
w
2094
HealthMED - Volume 6 / Number 6 / 2012
Journal of Society for development in new net environment in B&H
result in a variety of degradation products. The un-controlled peroxidation of biomembranes can thus lead to profound effects on the membrane structure disruption and their functional alteration, being very often sufficient to cause cell death (5). Oxidative stress plays an important role in the pathogenesis of tuberculosis besides other chronic ailments; which can be a result from tissue inflammation, poor di-etary intake, free radicals burst from activated ma-crophages and impaired immunity.
The objective of the present study was to deter-mine the pro-oxidative products (tiobarbituric acid reactive substance - TBARS) and anti-oxidant sta-tus: the levels of superoxide dismutase (SOD), ca-talase (CAT) and glutathione peroxidase (GPx) in PT patients and the corresponding healthy control group.
Patients and methods
Total of 120 patients with active pulmonary tu-berculosis (PT) and 60 healthy people, as the con-trol group, were included in our study. Among the tuberculosis cases, 46 were female and 74 were male. The average age of tuberculosis patients was 52.77±17.07 years. In the healthy control group there were 27 females and 33 males with average age 60.00±6.11 years.
After a detailed history and physical examina-tion, a chest X-ray and routine biochemical and hematological analyses of all cases were perfor-med. Mycobacterium tuberculosis was looked for in sputum smears and submitted for tuberculosis culture in Lowenstein-Jensen media at least 3 ti-mes. About 5ml venous blood was collected from each subject after obtaining informed consent. The samples were then analyzed for lipid peroxidation products, superoxide dismutase, catalase and glu-tathion peroxidase.
For subjects with PT, antioxidative enzymes and lipid peroxidation products were first deter-mined prior to the treatment with anti-tuberculosis drugs, and then again 3 weeks after the treatment had begun. Subjects belonging to the control gro-up had their parameters measured only once.
Estimation of TBARSThe concentration of thiobarbituric acid-reactive
substance (TBARS) was determined in blood plas-
ma, by the thiobarbituric acid method (18). Lipid peroxidation products react with thiobarbituric acid in buffer of 1 % orthophosporic acid solution, pH 2.0, and the addition of 1 µmol of iron sulphate. The absorbance was measured at 535 nm (7).
Estimation of Glutathion peroxidase and Superoxide dismutaseActivities of glutathione peroxidase (GPx) (EC
1.11.1.9) and superoxide dismutase (SOD) (EC 1.15.1.1) were determined in erythrocytes with the Ransel and Ransod commercial kit (Randox Lab, UK). These parameters were measured on the Olympus AU 680 analyser (8).
Estimation of CatalaseCatalase (EC 1.11.1.6) activity was determined
in erythrocyte with the Beutler method based on the decomposition of H2O2 followed directly by the de-crease in absorbance at 230 nm (20). Both TBARS concentration and catalase activity were determined by Beckman DU-650 spectrophotometer (8).
Statistical analysisIn order to compare the analyses of data
between the experimental and control groups, the Student’s t-test for independent samples was used. All the statistical analyses have been carried out using the statistical software SPSS 10-0 version.
Results
There were 46 women (38%) and 74 men (61%) in the study group, while there were 27 women (45%) and 33 men (55%) in the con-trol group. There was no significant difference according to gender between the two estimated groups (p=0.5). The average age of the disea-sed was statistically significantly lower than that of the subjects belonging to the control group (52.77±17.07vs.60.00±6.11; and p<0.001).
Table 1 illustrates the results of the determined levels of antioxidative enzymes and lipid peroxi-dation products.
The activity of SOD±SD was 1172.62±313.52 U/g Hb in the TBC group before the treatment was commenced, whereas it was 1283.32±128.83 U/g

Vers
ion fo
r revie
w
HealthMED - Volume 6 / Number 6 / 2012
Journal of Society for development in new net environment in B&H 2095
Hb in the control group, which is a significantly lower value, compared to the values of control group (p<0.05). During treatment, the level of SOD increased to 1183±286.78 U/g Hb; however, it still remained significantly lower, compared to values in the control group (p<0.05).
The GPx activity of control group was 42.44±8.96 U/g Hb, what was significantly hi-gher compared to the basal activity of group of patients before the treatment 34.78±11.70 U/g Hb (p<0.001), as well as compared to the values of GPx activity after treatment 36.58±10 U/g Hb (p<0.01). During the treatment, there was an in-crease in the values of GPx; however, that rise is of little statistic importance.
The values of the catalase activity in pati-ents suffering from TB prior to treatment were 7.83±3.05 U/g Hbx104. During the treatment, an increase to 8.48±2.89 U/g Hbx104, was registe-red, but this rise was not statistically significant. The lowest activity was registered in the control group (7.37±0.95 U/g Hbx104), which was signi-ficantly lower in relation to the values of the same enzyme in the group of PT patients after treatment 8.48±2.89 U/g Hbx104 (p<0.001).
The average values of TBARS reactive pro-ducts in PT patients were 5.24±1.32 µmol/L du-ring the first test, 5.21±1.14 µmol/L during the se-cond test and 4.79±1.22 µmol/L in the control gro-up. The statistical significance was observed both, in comparison of control values with the basal (the first) value of PT patients (p<0.05) and after the initiation of treatment (p<0.05).
Discussion
Free oxygen radicals, known as the reactive oxygen species (ROS) are involved in initiation and/or progression in a number of inflammatory,
immune or chronic degenerative diseases. The an-tioxidant defense system acts as a defender aga-inst the ROS for their inactivation and removal. Enzymatic and non-enzymatic antioxidants such as superoxide dismutase, catalase and glutathi-one peroxidase, uric acid, bilirubin and albumin may act against the ROS and minimize damage to biomolecules (9). The imbalance between the production of ROS and the antioxidant capacity leads to the oxidative stress, which contributes to the pathogenesis of human diseases. The increa-sed production of ROS was documented to occur in pulmonary tuberculosis, taking an active part in the pathogenesis of active pulmonary tuberculosis and in resultant fibrosis (10,11).
A significant reduction in enzymatic anti-oxi-dants (SOD) and non-enzymatic anti-oxidant (glutathione) was found in our study. Similar re-sults were obtained by Reddy et al.and Mohod et al. (10,11). Our results showed that SOD exerted significantly lower activity in TB patients when compared to its levels in healthy population. Mo-reover, the study has shown that the time neces-sary for SOD levels to recover balance was more than 3 weeks, since its activity started to rise three weeks after treatment. However, the activities were still significantly lower than those in healthy subjects, inadequate to counteract increased oxi-dative stress, manifested by increased generation of lipid peroxidation products (10,11).
Due to extreme exposition of lungs to oxygen, numerous enzyme and non-enzymatic systems par-ticipate in the degradation of H2O2. The most impor-tant of them are catalase and glutathion peroxidase. The main feature of the antioxidative defense of the human lungs is the high level of reduced glutathi-one system in the fluid which covers the epitheli-um, almost 140 times higher than in the circulating blood (12). The results of our research have shown
Table 1. Comparison between antioxidant level and TBARS in pulmonary tuberculosis patients
ParametersTuberculosis patients
Control groupPre- treatment After-treatment
x SD x SD x SD SigGPX 34.78 11.70 36.58 10.78 42.44 8.96 * †CAT 7.83 3.05 8.48 2.89 7.37 0.95 ‡
TBARS 5.24 1.32 5.21 1.14 4.79 1.12 * ‡SOD 1172.62 313.52 1183.39 286.78 1283.32 128.83 * ‡
Values are means ±SD *control vs. pre-treatment ; † pre-treatment vs. after-treatment; ‡ control vs. after-treatment

Vers
ion fo
r revie
w
2096
HealthMED - Volume 6 / Number 6 / 2012
Journal of Society for development in new net environment in B&H
that the level of Gpx was recovered faster during treatment, compared to SOD, but it was still consi-derably lower than in healthy individuals. Reduced glutathione level indicate the potential oxidative damage to erythrocyte and erythrocyte membrane of pulmonary tuberculosis patients (13).
Alveolar macrophages possess a great ability to produce catalase and use it mostly to neutralize the exogenous H2O2 (3). In our research, the catalase activity prior to treatment did not differ signifi-cantly, compared to the control group. Nonetheless, catalase activity increased during the treatment and was significantly higher than in the control group.
In the present study it was observed that the total anti-oxidants status was low in TB patients, irres-pective of treatment status. The decrease was more pronounced in the untreated TB patients, indicating that the anti-oxidants were nearly completely utili-zed to scavenge the superoxide free radicals. The results of our study are completely in line with tho-se obtained by Reddy et al.(10) Beside this, several factors, such as low food intake, nutrient malabsor-ption and inadequate nutrient release from the liver, as well as acute infections and an inadequate availa-bility of carrier molecules may have an influence on antioxidative state in tuberculosis (14,15).
Indeed, free radicals released from M. tubercu-losis patients initiate lipid peroxidation by attacking polyunsaturated fatty acids in cell membranes, con-verting them to lipid peroxides and to variety of secondary metabolites (15). The uncontrolled pe-roxidation alters membrane fluidity and permeabi-lity. Hence, the lipid peroxides and their secondary metabolities such as thiobarbituric acid-reactive substances (TBARS) are then transported through the circulation by lipoproteins causing damage at distant tissues (16,17,18,19). In our study, it was documented that there was a higher level of lipid peroxidation products in TB patients both in the first and the second screening when compared to the control group. However, the level of TBARS decreased after 3 weeks’ treatment, but remained considerably higher than that of the control gro-up. Hence, the extent of lipid peroxidation may be decreased due to chemotherapeutic destruction of mycobacteria. This is in line with the results obta-ined by Johnkennedy et al. and Madhab et al. who found considerably higher values of lipid peroxida-tion products in TB patients (17,20). Makinski et al.
showed that the high pretreatment levels of ROS had decreased to the normal at the end of treatment in active pulmonary tuberculosis patients (6).
In conclusion, the findings from our study further support a substantial pathogenetic link between oxidative stress and tuberculosis infecti-on and me be a useful marker of the disease seve-rity. The recovery of antioxidative enzyme defen-se system after the initiation of anti-tuberculosis treatment, means they can be reliable markers of the course of long-term disease regression.
References
1. World Health Organization.Global tuberculosis con-trol report. Geneva, Switzerland: WHO; 2006
2. Cheesbrough M, District Laboratory practices in Tro-pical countries.Part 2.Cambrige Low price Edittions.cambrige University Press 2000. pp:207-266
3. Guteridge JMC. Lipid peroxidation and antioxidants as biomarkers of tissue damage.Clin Chem 1995; 41: 1819-1828
4. Madhavi M, Samudruam P, Hemanth A, Lalitha V. Ef-fect of antioxidant vitamin C and E supplementation its plasma levels and on lipid profile in pulmonary tuber-culosis patients. Am J Inf Dis 2009; 53(3): 263-272
5. Stater F. Lipid peroxidation. Biochem Soc Trans 1983; 10: 70-71
6. Makinskii AI, Baikeev RF, Zalialiev RA. Markers of alteration of tissue structures as indicators of pulmo-nary tuberculosis activity (in Russian).Probl Tuberk 2002; (7): 39-42
7. Andreeva IL, Kozhemyakin AL, Kishkun AA. A modi-fied thiobarbituric acid test for measuring lipid per-oxidation. Labor Delo 1988; 11:41-3.
8. Beutler E. Catalase; Manual of biochemical method. Grune and Stratton, New York 1982: 105-6.
9. Perez JR, Osoriio ES, Ortiz R, Mendoza-Nunez VM. Moderate physical activity diminishes oxidative stress and the inflammatory process in elderly.HealthMed 2011; 5(1): 173-178
10. Mohod K, Dhok A, Kumar S. Status of Oxidants and Antioxidants in Pulmonary Tuberculosis with varying Bacillary Load. Journal of Experimental Science 2011; 2(6): 35-37
11. Reddy Y. N, Murthy S. V, Krishna D. R, Prabhakar M. C. Role of free radicals and antioxidants in tuber-culosis patients. Indian J Tuberc 2004; 51: 213-218

Vers
ion fo
r revie
w
HealthMED - Volume 6 / Number 6 / 2012
Journal of Society for development in new net environment in B&H 2097
12. Ramesh R, Sudha K, Amareshwara M, Sameer, Ra-kesh M. Study of protein oxidation and antioxidant status in pulmonary tuberculosis patients.Int J of Pharma and Bio Sciences 2011; 2 (3): 104-108
13. Vijayamalini M, Monoharan S. Lipid peroxidation, vitamin C, E and reduced glutathione levels in pati-ents with pulmonary tuberculosis. Wiley Inter Scien-ce Journal 2003; 22: 19-22
14. Nwanjo HU, Oze GO. Oxidative imbalance and non-enzymic antioxidant status in pulmonary tu-berculosis infected subjects: carcinogenic potential. Pakistan Journal of Nutrition 6(6): 590-592
15. Ceylan E, Gulsun A, Gencer M, Aksoy N.A New para-meter in the detection of tuberculosis activity:reactive oxygen metabolites Respiration 2005; 72: 156-159
16. Akiibinu MO, Arinola OG, Ogunlewe JO, Onih EA. Non-enzymatic antioxidants and nutritional profiles in newly diagnosed pulmonary tuberculosis patients in Nigeria.African Journal of Biomedical Resear-ch.2007;10:223-228
17. Madhab L, Narayan G, Narendra B, Bishamber D, Shymal K, Nirmal B. Evaluation of lipid peroxida-tion product,nitrite and antioxidant level in newly diagnosed and two months follow-up patients with pulmonary tuberculosis.South East Asian J Trop Med Public health 2007;4(38):695-70
18. Singhahi R, Arora D, Singh R. Oxidative stress and ascorbic acid levels in cavitary pulmonary tuber-culosis.Journal of Clinical and Diagnostic Resear-ch.2010;4:3437-3441
19. Madebo T, Lindtjorn B, Aukrust P, Berge RK. Circu-lating antioxidants and lipid peroxidation products un untreated tuberculosis patients in Ethiopia.Am J Clin Nul 2003;78:117-122
20. Johnkennedy N, Onyinyechi AS, Chukwunyere NE. The antioxidant status and lipid peroxidation pro-duct of newly diagnosed and 6 weeks follow-up pa-tients with pulmonary tuberculosis in Owerri,Imo state,Nigeria. Asian Pacific Journal of Tropical Di-sease 2011;292-294
Corresponding Author Ivana Stankovic, Clinic for lung disease, Clinical Center Nis, Nis, Serbia, E-mail: [email protected]

Vers
ion fo
r revie
w
2098
HealthMED - Volume 6 / Number 6 / 2012
Journal of Society for development in new net environment in B&H
Abstract
Intoduction: This research was conducted to determine the effects of oral fluid foods intake du-ring labor on duration of labor and perception of labor pains.
Methods: The study included 110 low risk nulli-parous labouring women (55 intervention, 55 con-trol group) who were matched by age and educati-on. Women in the intervention group were allowed to drink fruit juice "as much as they want, whene-ver they want" during labor. Data were collected by using data collection form about demographic characteristics of women, evaluation and diagnosis form of labor and Visual Analog Scale (VAS).
Results: Mean of duration of labour was 489 mi-nutes in the intervention group, 604 minutes in the control group (p=0.016). The mean of VAS score in the first stage of labor was found 4.1 in the interven-tion group, 3.3 in the control group (p=0.468). The mean of VAS score in the second stage of labor was 9.8 in the intervention group, 9.7 in the control gro-up (p=0.696). The mean of VAS score in the fourth stage of labor were 4.1 in the intervention group, 3.3 in the control group (p=0.109).
Discussion: In our study, It was found that oral fluid foods intake during labor was shortened durati-on of labor and was not influence perception of pain.
Key Words: Drinking, Labor Duration, Labor, Labor pain.
Introductıon
Birth is a physiological process in which women need as much power as an athlete needs in a race. Glucose and oxygen consumption of a mother rises during labor. Accordingly, it is also important to provide mother with enough energy besides prepa-ring her to the labor and adapting her to it. Hodnett1
offers that modalities such as providing the need of food & beverage can be as effective as oxyto-
cin when a reinforcement is needed in labor. There is very little information in the literature about the need of food intake during labor (2-4).
Restricting oral intake or nil by mouth it is a way of nursing care which has been applied sin-ce 1940 and advantage or disadvantage of which hasn’t been proved yet (5-7). Restricting or fasting of it is based on the theory of Mendelson, 1946, which suggests that the delay of emptying out the stomach contents in labor causes aspiration pne-umonia and also acidity of the stomach contents dermines the risk of mortality and rate of maternal complications (8).
It is known that fasting during labor doesn’t qu-arantee an empty stomach and some contents will still remain. For this reason, during anaesthetiza-tion, techniques such as cricoid pressure is appli-ed to prevent inhalation of acid during intubation, even though women are fasting (9-12). Analysis of aspiration incidences shows that whole cases are caused by malpractice. Besides, in recent ye-ars, general anesthesia is preferred instead of epi-dural anesthesia (6,13-14).
Arguements about whether women should eat during labor or not still continue. Two different su-bjects are at center of discussion (15). The first one is, as mentioned rather by anesthetists, the possi-bility of complications as a result of the aspiration of the stomach content when general anesthesia is performed. Especially, in case of emergency, when general anesthesia is a must, it is stated that the risk of regurgitation and aspiration rises in wo-men who eats during labor. The second one is the belief that drinking and eating during labor causes damage to women, fetus and the labor. This opini-on is argued by some midwifes and some obstetri-cians (7, 16-18).
In different centers of United States of Ame-rica, Canada, England, Australia and quite a few European Countries, eating things like biscu-
The effect of oral fluid food support during labor on labor duration and perception of labor painsSule Ergol1, Kafiye Eroglu2, Lale Taskin2
1 Zonguldak Karaelmas University, Zonguldak Health School, Turkey,2 Hacettepe University, Faculty of Health Sciences, Department of Nursing, Turkey.

Vers
ion fo
r revie
w
HealthMED - Volume 6 / Number 6 / 2012
Journal of Society for development in new net environment in B&H 2099
its, honey, yogurt and drinking weak tea, water, etc. are allowed during labor (18-20). According to written policies and clinical practice guides, allowing pregnant women to eat ice chips and take sips of water during labor are the applied practi-ces (21-24). But most of the hospitals lack those written policies and clinical practice quides or the-se quides are not given the proper consideration. Applications differ according to whether the pre-gnancy is low-risk or high-risk and whether the act is latent or active phased (18). American Anesthe-siologists suggest that clear liquids can be given to very low-risk pregnant women during labor but giving solid food is not recommended (21). Cana-da Society of Obstetricians and Gynecologists has the view that light diet or liquid diet can be offered during the labor so, women can choose one (23). Despite the moderate views of recent years about food and fluid intake, in some countries, women are still prohibited from eating and drinking in labor (19-20,22,24). In these countries food and fluid intake is prohibited or restricted or limited to ice chips and sips of water (22,24).
Restriction of food and fluid intake of women during labor may cause ketosis, prolonged labor, dehydration, need of assistance during labor and postnatal drips allied to ketosis, Reduction in blood glucose level negatively effects the respi-ration and activity of fetus (25-28). It is known that intravenous(IV) treatments done in order to prevent ketosis causes: Hyponatremia, hypergl-ycemia in mother, iatrogenic hyperinsulinemia in fetus due to hypoglycemia in newborn baby, re-duction in serum pH in fetus and increase in fetal lactate level. Increase in the stress level of women due to fasting also increases the depth of ketosis. At the same time, fasting affects pain perceptions so women suffer headache, nausea, limitation of movement ability and local pain in catheter place. All these negative situations make it difficult for women to adapt to labor (25,28-29).
In our country, Turkey, it can be observed that the common practice is nil by mouth and there is also no research study about the subject. This study was done in an attempt to share the view that light drinking during labor prevents potential complications of pregnant women. The aim is to determine the effects of drink intake on labor and early post-partum period.
Materıal and method
The study is a comparative researh including intervention group and control group. Population of the study was pregnant women who applied to a Women’s Health Training and Research Hospital at the center of the city Ankara between February 2007 and September 2007. The study was com-prised of two groups [ intervention group(I): the group that was supported by liquid intake during labor and control group(C): the group treated by relying on the policies and practices of the mentio-ned hospital]. These two groups both consist of 55 women who undergo pregnancy without compli-cations, who were with single pregnancy, without abnormal presentation, women for whom cesare-an section is not a planned and low risk nullipa-rous women with servical dilatation of not more than 4 centimeters.
According to Turkish Population and Heal-th Research Analysis Results, prevalence rate of prolonged labor is 36% (30). The sample size was measured by using NCSS - Statistical and Power Analysis Software -PASS one-to-one match, Mc. Neamer test method. Longer labor occurence rate of the control group was 0.365 and longer labor rate of the intervention group was 0.165. Accor-ding to Mc. Neamer test, it was found out that to test the hypothesis of reducing time of labor to normal level, 55 people were needed in α=0.01, for a test strenght of 1- β=0.70. Accordingly, 55 women for intervention group and 55 women for control group were within the scope of the resear-ch. These 110 women were one to one matched on age and education.
Preperation of the liquid: Researches that in the relevant literature were investigated especially by giving importance to these subjects: food inta-ke during labor, how often this support was given and how many calories this support have (2,6,19-20,26,31). A specialist in the field of nutrition and dietetics was consulted to tell opinions. In direc-tion of the suggestions, usage of grape juice was chosen to be used as it was a high calorie and low volume drink (64kcal/100mL).
Data collectione: Data collection forms, labor evaluation forms and diagnosis forms were deve-loped by the present researchers after evalution of the relevant literature (18,20,26-27,31). These

Vers
ion fo
r revie
w
2100
HealthMED - Volume 6 / Number 6 / 2012
Journal of Society for development in new net environment in B&H
forms’ content validity was investigated by three experts for general appropriateness and applicabi-lity before the study was conducted. In addition, to define the perception of pain during labor, Visual Analog Scale (VAS) was used. VAS consists of an ungraduated, straight 100 mm line marked at one end with the term " no pain" and at the other end "the worst possible pain". The patient marks on the line the point that they feel represents their perception of their current state. The VAS score is determined by measuring in millimetres from the end of the line to the point that the patient marks. This measures the intenseness of pain (32). Kilo-calories were calculated according to the amounts of total intravenous fluids and fruit juice which gi-ven to women during labor. The first researcher was present with both the intervention and control groups during labor.
Intervention: Pregnant women who applied to the hospital were analyzed in accordance with sample selection criterias. The pregnant women who match the criteria were informed and their written permissions were received. Grape Juice was given to pregnant women in the interventi-on group “as much as they want, whenever they want”. It was stated that they could drink grape juice and the amount of juice they intake was con-stantly evaluated.
Ethical Approach: The study was started following the approval of the institutional re-view board of Hacettepe University’s Medical Faculty. The participating women also provided written consent after the aim and method of the study had been explained.
Analysis of the Data: The SPSS 11.0 software package was used for statistical analysis. The chi-square test, t test, were used for statistical analysis, as appropriate. The distribution of the data was expressed as counts and percentages. A P-value of less than. 05 was accepted as statistically significant.
Results
Fifty five women from intervention group and fifty five women from control group (Total 110 women) were included in the research. They were one to one matched on age and education. 14.6% of them were between age of 18-19, 61.8% of them were between 20-24 and 23.6% of them were between age of 25-29. 18.2% of the women were primary school graduates, 32.8% of the wo-men were middle school graduates, 38.2% of them were high school graduates and 11% were faculty or college graduates.3.7% of the women in the in-tervention group were at 38th week of gestation, 30.9% of them were at 39th week of gestation, 30.9% of them were at 40th week of gestation and 34.5% of the pregnant women in the intervention group were at 41th week of gestation. 98.2% of the women and their spouses, in both intervention and control groups, wanted to have the baby. The two sample groups are similar in respect of age (X2=0.309; p=0.857), education status (X2=0.00; p=1.000) and gestational age (p=0.974).
When distribution of the mean of liquid and ca-lorie intake was analyzed in both groups, it was seen that calorie intake of women in the intervention gro-up was 291.9 kcal. and this number was 154.4 kcal. in the control group. The difference between mean calorie intakes was statistically significant(p=0.001). But the total liquid intake in the intervention group on mean was 968.1mL, in the control group this amount was 966.9 mL (Table 1).
In the intervention group, labor duration was approximately 489 minutes (8:15 hours). While for the control group, labor duration was 604 minutes (10:06 hours). Labor duration difference between the groups was found statistically significant on be-half of the intervention group (p=0.016) (Table 2).
In the first stage of the labor, the mean score of pain perception was 6.7 in the intervention group and 6.3 in the control group. It was found out that
Table 1. Fluid & Calorie Intake of Women During Labor Distribution of Means According to Interven-tion and Control Groups
Liquid and CalorieAmounts
Intervention Control StatisticalValuesn X ± SS n X ± SS
Calorie Amount (kcal) 55 291.9 194.3 55 154.4 146.3 t=4.191 p=0.001IV Fluid Amount (mL) 55 714.0 474.1 55 966.9 693.8 t=2.232 p=0.028
Oral Intake of Liquid (mL) 55 254.1 180.9 - - -

Vers
ion fo
r revie
w
HealthMED - Volume 6 / Number 6 / 2012
Journal of Society for development in new net environment in B&H 2101
in the second stage of the labor the mean score of pain perception were 9.8 in the intervention group and 9.7 in the control group. In the fourth stage of the labor, the mean score of pain perception were 4.1 in the intervention group and 3.3 in the con-trol group. In all stages, the difference between the groups in terms of the mean score of pain per-ception was found non-significant (The first stage: p=0.468; the second stage: p=0.696; the fourth stage: p=0.109) (Table 3).
Discussion
The forces that enable labor are uterus contrac-tions. For those contractions to be effective, it need to be strong, regular and periodical. When uterus contractions don’t fit this criteria, fetus can not descend into the pelvis and cervical effacement and cervical dilatation and the labor takes longer than expected or dystocia occurs (7,16).
With the help of contractions, head of fetus re-aches vaginal aperture and pregnant woman gives birth to her baby. In order for all these things, for contractions, for adaptation labor, for breathing exercises and for propellant force needed, wo-men need energy (16). Despite there is no updated information about the energy need during labor, recommended calorie intake is 50-100 calories/per hour (2). Because it is thought that not having enough energy causes prolonged labor.
The mean duration of labor was 489 min. ±235 for the intervention group and 604 min. ±205 for the control group in the study, with statistically si-gnificant difference between the groups (p:0.016). In various studies researching effects of food intake on duration of the labor, various results are found. Some studies identified that there was no effect of food intake on duration of the labor (26,33-34).
Whereas some studies said that it prolonged the labor (4,35-36) and one of them states that it shor-tened the labor (37). In a research conducted by Al Olaimat (37) in the Hashemite Kingdom of Jordan, 390 women were allowed to intake light beverages or food during the birth process and 1950 women who were in control group were recommended to fast in accordance with the hospital practices. The research stated that the second stage of the labor was shorter in intervention group when compared to control group. Our study also showed that the la-bor was shorter for women in intervention group who were allowed to drink fluid.
Contrary to our study, Scheepers et al.(4), Par-sons et al.(35), Parsons et al.(36) found out in their researches that women who were allowed to eat and drink had experienced longer labor when compared to the control group. Studies of O’Sullivan et al.(34) and Scrutton et al.(33), Tra-nmer et al.(20) Kubli et al. (26) didn’t state any difference between the group of women who oral intake and the control group.
Table 2. Distribution of the Labor Duration MeanGroups
Min. Max. Statistical ValuesInterventionn X ± SS
Controln X ± SS
Labor Duration (minutes) 46* 489±235 44** 604±205 105 1118 t=-2.46 p=0.016* Delivery by caesarean section is performed for 9 women in the intervention group.** Delivery by caesarean section is performed for 11 women in the control group.
Table 3. Distribution of Mean Scoreof Pain Perception in Stage first, second and fourth stage of the Labor
Stages ofthe labor
Pain ScoreStatistical ValuesIntervention
n X ± SSControl
n X ± SSThe first stage 55 6.70 2.12 55 6.37 2.56 t=0.729 p=0.468
The second stage 47 9.82 0.52 46 9.73 1.49 t=0.391 p=0.696The fourth stage 46a 4.11 2.20 44b 3.30 2.55 t=1.618 p=0.109
a Delivery by caesarean section is performed for 9 women in the intervention group.b Delivery by caesarean section is performed for 11 women in the control group.
Vers
ion fo
r revie
w
2102
HealthMED - Volume 6 / Number 6 / 2012
Journal of Society for development in new net environment in B&H
As it is seen, effects of food intake on labor duration varies in different studies. The fact that there are lots of different findings on the subject is thought to be due to different quantities of the samples and the fact that they are found by using different methods as it is explained above.
Labor is one of best known and identified so-urce of pain in our day. It is identified that 60% of the primiparous women and 40% of the multiparo-us women experience high level of pain. However, pain is not a simple result of the physiological pro-cess of labor. Pain in labor is a complex result whi-ch is affected by various factors in accordance with physical and emotional stimulatives that is experi-enced by every women (38). For this reason, some women experience high level of pain during uterus contradictions while others feel less pain. Various factors such as cultural differences of women, the-ir religious beliefs, previous pain experiences, the methods they use to cope with pain, loneliness, un-solved psychological and physiological problems, undamped stress affect our perception of pain (39).
In our study, pain level experienced by women increased as the stage of labor progressed. In all stages of the labor, the women in the intervention group (the first stage: 6.70±2.12; the second stage: 9.82±0.52; the fourth stage: 4.11±2.20) experienced more pain than the women in the control group (the first stage: 6.37±2.56; the second stage: 9.73±1.49; the fourth stage: 3.30±2.55). It is accepted that wo-men with high energy relax physically and psyc-hologically and they are more likely to adapt to the labor. Adaptation to the process is expected to help especially control breathing and it enhances oxyge-nation of uterine tissues so perception of pain de-creases. However, this differences between the in-tervention and control groups are found statistically nonsignificant (for the first stage p:0.468, for the second stage p:0.696, for the fourth stage p:0.109). Klassen (40) analyzed the pain after cervical dila-tation in his study that observed restricting liquid intake/ effect of the pain and control perception in multiparous women and found that, similar to our study, pain level increased as the labor progresses and there was no difference between intervention and control groups. The fact that there is no finding about the difference between groups in terms of pain perception score mean is thought to arise from the effects of some other factors.
Conclusıon
In our research it was found that liquid fo-ods intake shortened duration of labor but there was no effect of it on pain perception. However, in these studies was done by allowing oral intake in labor it could be seen that there were conflicting results about the duration of the labor. For this re-ason, these are suggested to be done; Studies that observe wide-ranging groups and studies done in order to observe the effects of liquid intake on mother and newborns,
In the study, women in the control group sta-ted that they reported higher score of pain than the control group during the fourth stage of the labor. Therefore this situation, although it is found sta-tistically nonsignificant, should be studied using wide-range of groups as sample,
Women in the intervention group intake approximately 292 kilocalories while women in the control group intake 155 kcal. There are some studies in the literature done in order to determine the energy need of women in labor. Some studies that aim to determine the need of energy during the process should be planned and those studies should be supported by laboratory findings.
References
1. Hodnett F. Nursing support of the laboring women. Journal of Obstetric, Gynecologic, and Neonatal Nur-sing. 1996; 25: 258–264.
2. American College of Nurse- Midwives.Intrapartum Nutrition. American College of Nurse-Midwives Cli-nical Bulletin No:3, Washington, DC: Author;2000.
3. Maheux, PC, Bonin, B, Dizazo, A, et al. Glucose He-moestasis During Supontaneus Labor in Normal Hu-man Pregnancy. Journal of Clinical Endocrinology and Metabolism. 1996; 81: 209–211.
4. Scheepers HCJ, de Jong PA, Essed GGM, Kanhai HHH Fetal and Maternal Energy Metabolism During Labor in Relation to the Available Caloric Substrate. Journal of Perinatal Medicine. 2001; 29: 457- 464.
5. Gennaro S, Mayberry LJ, Kafulafula U. The eviden-ce supportimg nursing management of labor. Journal of Obstetric, Gynecologic, and Neonatal Nursing. 2007; 36: 598–604

Vers
ion fo
r revie
w
HealthMED - Volume 6 / Number 6 / 2012
Journal of Society for development in new net environment in B&H 2103
6. Hofmeyr GJ. Evidence-based intrapartum care. Best Practice & Research Clinical Obstetrics and Gynae-cology. 2005; 19: 103–115.
7. Kendrick JM, Simpson KRLabor And Birth, In: Simp-son KR, Creehan PA, Perinatal Nursing. Second Edi-tion. Lippincot, Baltimore, 2001; pp 312 – 313.
8. Mendelson CLThe Aspiration of Stomach Contents into Lungs During Obstetrics Anesthesia. American Journal of Obstetrics and Gynecology. 1946; 52: 191–205.
9. Brady M, Kinn S, Stuart P, Ness V. Preoperative Fa-sting for Adults to Prevent Perioperative Complica-tions. Cochrane Database of Systematic Reviews. 2003; 4. Art. No.: CD004423.
10. Carp H, Jayaram A, Stoll M. Ultrasound examinati-on of the stomach contents of parturients. Anesthe-sia-Analgesia.1992;74: 683–7.
11. Frca D. Pre-operative fasting— 60 years on from Mendelson, continuing education in anaesthesia. Critical Care & Pain. 2006; 6: 215–218.
12. Gyte GML, Richens Y. Routine prophylactic drugs in normal labour for reducing gastric aspiration and ıts effects. Cochrane Database of Systematic Revi-ews.2006;3. Art. No.: CD005298.
13. Cooper GM, Mc Clure JH. Maternal Deaths From Anaesthesia, An Extract from Why Mothers Die 2000–2002, The Confidential Enquiries into Mater-nal Deaths in The United Kingdom. British Journal of Anaesthesia.2005; 94: 417–23.
14. Green MS, Krauss B. Pulmonary aspiration risk du-ring emergency department procedural sedation an examination of the role of fasting and sedation dep-th. Academic Emergency Medicine.2002; 9: 35–42.
15. Parsons M Midwifery Dilemma: to Fast or Feed the Labouring Woman Part I: The Case for Restricting Oral Intake in Labour. Australian Midwifery. 2003; 16: 7–13.
16. Olds SB, London ML, Ladewig PA, Davidson MR The Family in Childbirth: Needs and Care In: Olds SB, London ML, Ladewig PA, Davidson MR. Mater-nal-Newborn Nursing & Women’s Health Care, 7.th Edition, New Jersey: Pearson Education, 2000; pp 624–663.
17. Parsons M Midwifery Dilemma: to Fast or Feed the Labouring Woman Part 2: The Case Supporting Oral Intake in Labour. The Australıan Journal of Mıdwıfery. 2004; 17: 5–9.
18. Parsons MPolicy or Tradition: Oral Intake in Labo-ur. The Australian Journal of Midwifery. 2001; 14: 6–12.
19. Micheal S, Reilly CPolicies for Oral Intake During Labour: A Survey of Maternity, Units in England and Walles. Anesthesia. 1991; 46: 1071–1073.
20. Tranmer JE, Hodnett ED, Hamah ME, Stevens BJ-The Effect of Unrestricted Oral Sarbonhydrate Inta-ke on Labor Progress. Journal of Obstetric, Gyneco-logic, & Neonatal Nursing. 2005; 34: 319 – 28.
21. American Society of Anesthesiologists. Task For-ce on Obstetric Anesthesia. Practice Guidelines for Obstetric Anesthesia: An Updated Report by The American Society of Anesthesiologists Task Force on Obstetric Anesthesia. Anesthesiology. 2007;106:843– 63.
22. National Collaborating Centre for Women’s and Children’s Health Intrapartum Care: Care of Heal-thy Women and Their Babies During Childbirth, Cli-nical Guideline. London National Institute Clinical Excellence (NICE). 2007; pp 83–87.
23. Society of Obstetricians and Gynecologists of Ca-nada (SOGC) Healthy Beginnings: Guidelines for Care During Pregnancy and Childbirth, SOGC Po-licy Statement, Clinical Practice Guidelines. Toron-to, Ontario. 1998; pp 85.
24. World Health Organization Maternal and Newborn Health/Safe Motherhood Unit. Care in Normal Bir-th: A Practical Guide. Report of a Technical Working Group. Publication no. WHO/FRH/MSM/96.24. Ge-neva: Author. 1996; pp 9–10.
25. Foulkes J, Dumoulin JG. The Effects of Ketonu-ria in Labour. British Journal of Clinical Practice. 1985;39: 59–62.
26. Kubli M, Scrutton MJ, Seed PT, O'Sullivan GAn Evaluation of Isotonic \Sports Drinks During Labor. Obstetric Anesthesia. 2002; 94: 404–8.
27. Singata M, Tranmer JE Restricting Oral fuid and Food İntake During Labour Cochrane Database of Systematic Reviews. 2009; 2. Art. No.:CD003930.
28. Toohill J, Soong B, Flenady VInterventions for Keto-sis During Labour, Cochrane Database of Systema-tic Reviews. 2008; 3. Art. No.: CD004230.
29. Tourangeau A, Carter N, Tansil N, McLean A, Downer V. Intravenöz Therapy for Women in Labor: Implementation of a Practice Change. Birth. 1999; 26: 31–35.

Vers
ion fo
r revie
w
2104
HealthMED - Volume 6 / Number 6 / 2012
Journal of Society for development in new net environment in B&H
30. Akın A, Özvarış ŞB. Utilization of natal and post-na-tal services in Turkey. In: A. Akın, Eds. Contraception, abortion, and maternal health services in Turkey: Re-sults of further analysis of the 1998 Turkish demograp-hic and health survey. Ankara: Hacettepe University, TFHP Foundation, and UNFPA; 2002: 262–263.
31. Scheepers HCJ, Thans MCJ, De Jong PA, et al. A Do-uble-Blind, Randomised, Placebo Controlled Study On The İnfluence Of Carbohydrate Solution Intake During Labour. BJOG: an International Journal of Obstetrics and Gynaecology. 2002; 109:178–181.
32. Huskisson E. Visual analogue scales. in: Melzack R Ed. Pain measurement and assesment. New York: Raven Pres; 1983:pp.33-37.
33. Scrutton MJ, Metcalfe GA, Lowy C, Seed PT, O'Sullivan G. Eating in Labour a Randomised Con-trolled Trial Assessing The Risks And Benefits. Ana-esthesia. 1999; 54: 329–334.
34. O’Sullivan G, Liu B, Hart D, Seed P, Shennan A. Effect of Food İntake During Labour on Obstetric Outcome: Randomised Controlled Trial. British Me-dical Journal. 2009; 338:b784.
35. Parsons M, Bidewell J, Nagy S. Natural Eating Be-havior in Latent Labor and Its Effect on Outcomes in Active Labor. Journal Midwifery Womens Health. 2006; 51:e1– e6.
36. Parsons M, Bidewell J, Griffiths R. A Comparative Study of the Effect of Food Consumption on Labour and Birth Outcomes in Australia. Midwifery. 2007; 23: 131–8.
37. Al Olaimat HH. Maternal energy during labor ıntrapartum nutrition and nourishment: A clinical study. Jordan Medical Journal.2007; 41: 75–79 (Abstract).
38. Barragán Loayza IM, Gonzales F. Biofeedback for Pain During Labour (Protocol).Cochrane Database of Systematic Reviews. 2006; 4. Art. No.:CD006168.
39. Taşcı E, Sevil Ü. Nonpharmacological approaches to labor pain. Genel Tıp Dergisi. 2007; 17: 181–186.
40. Klassen FE. The Effect of Unrestricted Fluid Intake During Labour on the Multiparous Woman and Her Perception of Control and Pain During Childbirth. A Thesis For Degree of Master of Nursing, Univer-sity of Manitoba, Winnpeg, Canada. 1999.
Corresponding Author Sule Ergol, Zonguldak Karaelmas University, Zonguldak Health School, Zonguldak, Turkey, E-mail : [email protected]

Vers
ion fo
r revie
w
HealthMED - Volume 6 / Number 6 / 2012
Journal of Society for development in new net environment in B&H 2105
Abstract
Health care institutions are coping with growing demands coming from the fast changes of the envi-ronment related to technology, costs, personnel etc. Therefore they are seeking for a new management approaches day to day. Various attempts all over the world have been made in order to enhance mana-gement in healthcare. However, there are no proper solutions yet. Project management was originally applied in the areas of construction, engineering etc. Academic research in the UK and other coun-tries points out increasing numbers of new develo-pments and new initiatives being pursued through projects and programmes. Project management is no longer just a sub-discipline of engineering, the management of projects – including programme management and portfolio management – is now the dominant model in many organisations for strategy implementation, business transformation, continuous improvement and new product develo-pment. Project management has extensive current opportunities and a bright future. One of the very important areas where it starts to find its application is certainly healthcare. There were some attempts both practical and theoretical to apply Project ma-nagement in a healthcare (also published in Journal of Evaluation in Clinical Practice). This paper is trying to go deeper and to apply project manage-ment methods in every aspect of clinical practice. The pilot project was conducted on inguinal hernia surgery that was organized as a project and showed substantial results in terms of organizational enhan-cement. Therefore, one may conclude that the dis-cipline of project management is emerging in he-althcare institutions and it could significantly help improving efficiency of medical organizations.
Key words: project management, healthcare, efficiency
1. Introduction
Project management is not a new discipline any more. However it is still mainly connected with the traditional areas of application such as civil engineering, IT etc. When someone says project, one usually thinks of a building, bridge, industrial plant, damn or other big infrastructure endeavour. But this approach is way behind modern manage-ment.
Health care institutions are coping with grow-ing demands coming from the fast changes of the environment related to technology, costs, person-nel etc. Improvement in the technical efficiency of hospitals may result in large savings in healthcare expenditures, which might, in turn, be devoted to other services such as prevention and education (Munkhsaikhan, Sodnom; Tsai, Alan C; Chang, Ming-Cheng;, 2011). Therefore they are seeking for a new management approaches day to day. Various attempts all over the world have been made in order to enhance management in health-care. However, there are no proper solutions yet.
This paper advocates a new managerial ap-proach: application of a project management in a healthcare systems and creating a new specialized discipline: medical project management.
2. Project management: from infrastructure to healthcare
2.1 History
Projects can exist in every sector, including re-tail, insurance, banking and transport. The vision of a project oriented organization is increasingly widespread in all sectors. Non-profit organiza-tions such as institutions in the health care and public sectors have now also discovered project
Using Project Management as a Way to Excellence in HealthcareVladimir Obradovic1, Petar Jovanovic2, Nenad Djordjevic3, Ivana Beric2, Filip Jovanovic2
1 University of Belgrade, Faculty of Organizational Sciences, Serbia,2 Project Management College, Belgrade, Serbia,3 Health Centre “Sveti Luka” Smederevo, Serbia.

Vers
ion fo
r revie
w
2106
HealthMED - Volume 6 / Number 6 / 2012
Journal of Society for development in new net environment in B&H
management. However, they seldom apply it due to the constraints imposed by their operating en-vironments, such as the prevalence of legalistic attitudes and the lack of a business – oriented ap-proach. This especially applies in the public sector (Schelle H., Ottmann R., Pfeiffer A., 2006).
Project management has become institutional-ized in the past decades. Originally applied in the area of construction, engineering and data process-ing project management (Schelle H., Ottmann R., Pfeiffer A., 2006) has penetrated rapidly in R&D environments, manufacturing, administration, etc. Gareis point out that in addition to construction and R&D projects, strategic planning, marketing and organizational developments are also increas-ingly carried out using a project approach (Platje A., Seidel H., Wadman S. 1994).
Kloppenberg and Opfer(Kloppenberg, T.; Op-fer, W.A. 2002) identified project management re-search published in articles, papers, dissertations, and government research reports since 1960. They found that emphasis moved from develop-ment and use of automated project management software and tools to risk management and earned value management and then to human resource aspects. They also determined that research focus moved from large government defence projects to commercial applications in construction, informa-tion systems, and new product development. They concluded that project management has extensive current opportunities and a bright future (Kwak, Y. H.; Anbari, F. T. 2009).
The world is undergoing increasingly more rapid changes, and this storm of change affects all countries in significant ways. Rapid develop-ments in technology, ever growing competition, high quality turning into a standard feature for all organizations, and the changing and increasing expectations require organizations to make a pro-duction “that is fast, high-quality, and that makes a difference” (Yılmaz , Kürşad; Altınkurt, Yahya;, 2011). One of the most important organisational developments in recent years has been the signifi-cant growth in project work across different sec-tors and industries (Winter, M.; Smith, C.; Morris, P.; Cicmil, S. 2006). Academic research in the UK (Whittington R. 1999) confirms this trend, which looks set to continue with increasing numbers of new developments and new initiatives being pur-
sued through projects and programmes. Recent in-dustry reports, e.g. (KPMG 2002) also highlight the growing adoption of project management stan-dards and practices across large numbers of or-ganisations, including the creation of project man-agement centres of excellence within UK govern-ment departments (OPSR 2003). No longer just a sub-discipline of engineering, the management of projects – including programme management and portfolio management – is now the dominant model in many organisations for strategy imple-mentation, business transformation, continuous improvement and new product development.
2.2 Problem
The management of health care organizations is becoming a more and more demanding and complicated task (Kouria, Karjalainen-Jurvelinb and Kinnunenb 2005). Traditionally, European public hospitals were funded and directed by gov-ernment institutions (Kemenade YW van 1997). The spending for health sector exceeds 4,7 tril-lion USD and managing of organizations within this sector is certainly a challenge (Pijalovic and Kudumovic 2010). There was no need for these organizations to compete for funds and to develop a detailed accounting information system since costs were hardly ever an issue.
As a part of the health sector reform in devel-oping countries, Ministries of Health have been urged to enhance health care through greater com-munity governance and improved management effectiveness in their public hospitals (McPake, 1996; Mills et al., 1997; Collins and Green, 1999; Collins et al., 1999). Some Canadian studies found similar limited integration between care providers and facilities (Chapman 1998) that had resulted in late referrals, unnecessary delays for treatment or transfer to an appropriate setting of care, and un-necessary suffering and cost (Johnston, Gibbons and Burge 1998), (Chapman 1998).
The most commonly reported management problems include lack of financial resources, medi-cal equipment, supplies, and drugs; lack of staff motivation; absence of trained personnel; lack of community participation; and lack of a national policy on hospital management. Resources, such as money and personnel, are limited (Loo R. 2003),

Vers
ion fo
r revie
w
HealthMED - Volume 6 / Number 6 / 2012
Journal of Society for development in new net environment in B&H 2107
(Lodder and Bakker 2000), (Aroian, et al. 1997), (Özkahraman , Şükran; Özsoy, Süheyla Altuğ;, 2011). Medical directors further noted that the most difficult areas to manage were human resources, ad-ministration, and budgeting (Hartwig, et al. 2008).
Various activities and health research are available to assist public health policy and clini-cal decision making with the purpose to organise and provide health services more effectively and efficiently. Many studies have been carried out to assist health system managers in making deci-sions, enabling them to evaluate the consequences produced by their choices in the efficacy and the efficiency of the system (Flessa 2000), (van Zon, A. H.; Kommer, G. J.; 1999). Health system man-agers are in charge of making the best possible de-cisions, despite the restrictions––characterised by budget limitations––imposed by the environments in which they operate (De Angelis, V.; Felici, G.; Impelluso, P. 2003). Starting from different per-spectives, the main objective is to improve the health care systems’ performance measured by criteria related to for example safety, efficacy, ef-fectiveness, costs, cost effectiveness and appro-priateness of health care interventions as well as the quality of health care and the perception of the public (Perleth, Jakubowski and Busse 2001).
There were many various attempts across coun-tries and continents to enhance management of the healthcare organizations. In countries like USA, UK, New Zealand, Canada, Afghanistan, India, and China there have been several attempts to implement different business-proven management models into healthcare from Balanced Scorecard, through benchmarking and best practises to various ICT support systems (Krakauer, et al. 1998), (Pe-ters, et al. 2007), (Perleth, Jakubowski and Busse 2001), (Hartwig, et al. 2008), (Sinha, et al. 2007), (Kouria, Karjalainen-Jurvelinb and Kinnunenb 2005), (Edwards, N.; Roelofs, S. 2006). There are few studies from developing countries reporting efforts to improve quality of care through hospital management efforts (Mills et al., 1997; Collins et al., 1999; Smits et al., 2002; Berwick, 2004; Garcia-Prado and Chawla, 2006), although small-scale in-terventions have reported positive effects from pub-lic reporting of quality indicators (Bouchet et al., 2002), voluntary hospital accreditation processes (Bukonda et al., 2002), and hospital-specific qual-
ity improvement efforts (Mills et al., 1997; Collins et al., 1999; McNamara, 2006).
From the healthcare manager’s standpoint, ef-ficiency is often measured by the cost of providing a given level of service. Users of health services, on the other hand, in addition to requiring a good quality of service, desire prompt attention; i.e., not having to wait in queues on the health service premises, or at home (waiting for admission to a hospital to undergo treatment). The satisfaction of this expectation is even more important for users who are not patients but, rather, volunteers donat-ing blood at transfusion centres, taking time out of their everyday activities (De Angelis, V.; Felici, G.; Impelluso, P. 2003). Therefore a new more widely oriented managerial approache needs to be introduced.
2.3 Hypothesis
There has been a long debate in the manage-ment education community as to whether ‘‘project management” is a practice or an academic disci-pline. In the R&D field, tools and techniques of project management are applied and implemented to complete complex projects successfully. In the construction engineering and management disci-pline, people learn and implement planning, man-aging, and controlling of engineering construction projects to meet the time, budget, and specifica-tions. In the engineering field, production plan-ning, scheduling and quantitative methods are ap-plied to manufacturing systems to achieve higher productivity. However, when it comes to the busi-ness and management field, scholars often appear puzzled and unconvinced of the notion ‘‘project management”. The origin, history, and evolution of project management, and its academic back-ground, foundations, and underlying theory, have been debated and studied only to a limited extent from the management field’s academic perspec-tive, and supporting literature is limited. As a re-sult, previous research had limitations to transfer the message outside of the project management field to the broader business and management aca-demic audience (Kwak, Y. H.; Anbari, F. T. 2009).
During the last decade, as a response to the need for inter- as well as intra-organizational in-tegration, management models initially developed

Vers
ion fo
r revie
w
2108
HealthMED - Volume 6 / Number 6 / 2012
Journal of Society for development in new net environment in B&H
for industry have been spread to healthcare organi-zations ( Fa ltholm, Y.; Jansson, A. 2008), mainly because of the increased demands for health care services and the need to cut costs (Fotaki, 1999; Brown et al., 2003; Olsson et al., 2003; Tra¨ga˚rdh and Lindberg, 2004; Berkeley and Springett, 2006) and it is shown that project management methodology can help in cost cutting in various industries (Semolic, et al. 2008) and especially in healthcare (Sa Couto 2008).
During the last decades, as a response to these needs, management models, such as Total Quality Management (TQM) and Business Process Re-engineering (BPR), which initially were devel-oped for industry, have been spread to and adopt-ed and implemented by health care organizations (Ska˚leˊn 2004).
Health care organizations have become more professionalized, specialized, and differentiated. This is of course a development that in many ways has favoured both patients and the medical profe-ssion (Freidson 1970), but with the introduction of management models, comes the need for intra-organizational integration, coordination and co-llaboration, and the need for a system not only to built upon functions and medical specialties, but also upon processes and multi-professional colla-boration in teams.
The main aim of various management appro-aches in healthcare is improvement of population health resulting from the use of effective and cost-effective health care interventions. This could be divided into immediate objectives (e.g. improving safety, efficacy, appropriateness) and on long-term outcomes, such as life-expectancy (Perleth, M.; Jakubowski, E.; Busse, R. 2001).
Having in mind all previously stated: the incre-asing need for management enhancement in heal-thcare and rapid spread of project management as a widely practise-proved approach, one may state that: application of project management approa-ch can improve efficiency of health care systems, which would be the main hypothesis of this paper.
Every good project addresses a practical problem or a recognized need (Lodder and Bakker 2000). Project management and leadership are very impor-tant in order to keep all human activities directed toward the implementation of the project (Trish J.; Tanner L., 2004), (Dienemann J.; Van de Castle,
2003), (Loo R. 2003), (Perala 1998), (Aroian, et al. 1997), (Keillor A.; Nutten S.; 2000). Project mana-gement is also a critical element of successful do-nor-funded health projects ( Edwards, N.; Roelofs, S. 2006). Therefore it could be widely applied in the health sector as well.
3. The case of inguinal hernia surgery project
Health services providers mostly have traditio-nal and as previously mentioned not very efficient way of organizing their operations. Based on the-oretical research and hypothesis that project ma-nagement could improve operations of healthcare organizations, a pilot project was conducted. Pro-ject in healthcare can be divided into three major groups: infrastructure projects, business projects and medical projects.
Infrastructure projects are related to big en-deavours like building a hospital, new wing of a hospital, roof repair, renovation, or something si-milar. Business projects are projects like introdu-cing quality system, implementing new software, organizing some special event, implementing va-rious changes etc. It is obvious that project mana-gement as a discipline could (and must) be easily applied on such projects. However, what is more challenging and in the focus of this paper is pro-ject management application on medical projects. Medical projects are operations directly connected to the medical activity i.e. surgery, various exami-nations, recovery etc.
Therefore, a pilot project was conducted in or-der to test the effects of project management con-cept in medical projects. The project was related to inguinal hernia surgery. This operation presents a standard and not especially demanding interven-tion, and thus was recognized as a good choice for the pilot project. Starting from the standard project management approaches, the objective was first to be defined: to carry out the intervention in the best interest of the patient’s health in the shortest possi-ble time, with minimal use of hospital resources. The project team was created, that consisted of:
1. Specialist in general surgery,2. Specialist in medical biochemistry,3. Internal medicine specialist,4. Specialist pneumophysiologist,

Vers
ion fo
r revie
w
HealthMED - Volume 6 / Number 6 / 2012
Journal of Society for development in new net environment in B&H 2109
5. Specialist anaesthesiologist,6. Nurse,7. X-ray technician,8. Instrumental technician and9. Laboratory technician.
The project manager and project team together compiled a list of activities to be undertaken in or-der to achieve the goal of the project. Estimated du-rations were assigned to activities and interdepen-dences were determined based on empirical data and standards. Resources were assigned to each of the activities and actions. Then, the specific respon-sibilities of team members for each activity were determined and allocation of equipment to be used for certain activities and assessment supplies and medications was conducted. Based on all this, the project plan was developed as shown in Figure 1.
In addition to the given project plan, a number of other planning documents that are used to make better management decisions was developed. In addition to that, in planning and implementation stages, a large number of systematic and reada-ble reports could be defined that display the most
important information on the status of the project parts or project as a whole. Special attention needs to be paid to cross cultural aspects of the project’s stakeholders in order to optimize project efficien-cy (Jovanovic, et al. 2009).
Based on a detailed plan, an intervention was carried out and several benefits of project oriented approach were determined:
- Time and resources were used more efficiently which resulted in lower costs;
- Better communication among the personnel involved in the project;
- The basis for better allocation of resources (human and material) was created.
- The basis for further improvement of future operations of this kind.
From the fore mentioned benefits one may say that the improvements could be both hard (time, money, resources) and soft (communication, lear-ning). It is very important to emphasize soft skills improvement such as communication since the-se were recognized as drawbacks of medical stuff (Karaoglu and Seker 2011). Although during the
Figure 1. Inguinal Hernia Surgery Project Gant Chart

Vers
ion fo
r revie
w
2110
HealthMED - Volume 6 / Number 6 / 2012
Journal of Society for development in new net environment in B&H
preparation and implementation of the project there were some challenges, primarily related to resistan-ce to change due to the lack of project knowledge, tradition and lack of preparedness for this change, one can freely say that the pilot project was succe-ssful and fully justified the expectations.
4. Discussion
Management in the health sector is dyed with double complexity. First of all, there is a significant complexity that comes from complex medical cla-ims. In addition, because of all the intense changes and growth of competitive pressure both locally and globally, at health facilities are put a growing management challenges in the context of increasing productivity, reducing costs, optimizing resources and so on. That is why modern managers in the he-alth care need a new approach for the new era that will offer solutions to the above requirements.
This paper advocates the application of project management in the health and stands for develo-pment of a new and a highly specialized discipline - medical project management. Areas of applicati-on of this approach in healthcare institutions can be grouped into three major segments:
- Infrastructure projects in healthcare, - Business projects in healthcare, and - Medical projects in healthcare.
The benefits realized by applying the metho-dology of project management in health care have a double effect: better services for users of health services and effective management of health insti-tutions. Based on the theoretical research on project management and completion of the pilot project, the following main features and benefits of appl-ying this approach in health care could be drawn:
- Better time planning and monitoring, - Better resource (personnel, material etc.)
planning and monitoring, - Better cost planning and monitoring, - Resource usage optimisation, especially the
expensive ones: specialists and equipment, - Risk management, - Knowledge management, - Learning for individuals and the organisation - Team work, - Basis for commissioning and procurement,
- Communication enhancement, - Better monitoring, reporting and evaluation, - Basis for motivation system, - Basis for better stakeholder management, - Reduced probability of management
omissions and mistakes.
In order to implement the project approach in health care institutions, specific challenges iden-tified in this phase of the project which are to be expected in most projects and organizations need to be overcome. These challenges can be classifi-ed into several basic segments:
- Lack of systematized historical data on the time and resources usage allocated to specific activities,
- Insufficient knowledge of project methodology by the medical staff,
- Tradition as a source of resistance to change, - Inadequate software support.
On the basis of identified uses, it is clear that this approach can be applied in the health sector very successfully. Accordingly, it is necessary, in an organization that is committed to increase of its efficiency which is one of the main challenges in an ever deeper competitive environment, to imple-ment the following steps:
- Decide to start using the project management approach,
- Opt for the approach or methodology to be used,
- Train people in relation to project management,
- Identify a groups of projects undertaken, - Develop templates for each group or type of
projects, - Provide adequate software support for the
implementation of the new approach, - Incrementally start applying the project
approach, - Based on lessons learned, constantly
improve procedures, templates, and people.
The actual steps may certainly go beyond ones mentioned here, but this should represent the main path to successful medical project management, that would eventually bring medical institutions to a new efficiency and hence competitiveness level.
Vers
ion fo
r revie
w
HealthMED - Volume 6 / Number 6 / 2012
Journal of Society for development in new net environment in B&H 2111
5. Conclussion
Project management has found applications in many areas of modern society. Application area is growing from day to day. The projects are not any more only spoken about in the context of lar-ge construction or military projects but also in the context of the IT sector, pharmaceuticals, non-go-vernmental sector and so on. There is some evi-dence that the project management has found his modest but successful implementation in healthcare establishments. However, this application is related primarily to the conventional concept of projects. If one wants to keep up with the environment and the development of science, it is necessary constantly to explore new fields of application of this so many times proven managerial discipline.
This paper elaborates the hypothesis that pro-ject management can improve management in the health sector. Based on in-depth research literature on project management and governance in health, a confirmation of such theoretical possibilities has been reached. The pilot project was implemented showed that the initial assumptions were justified and that the hypothesis is confirmed.
Features and benefits of applying this concept are numerous and are listed in the paper. However, although at the global level this approach could save billions of dollars that will result in better qu-ality or higher volume of provided health services, one should not foster unrealistic expectations that this concept can be applied overnight. A strong understanding of the local health care system, the underlying determinants of health, and existing capacity and training needs of health care workers to implement project activities is fundamental to appropriate project design ( Edwards, N.; Roelofs, S. 2006). On the project road there are many chall-enges that require a great determination, work and training. But a thousand miles journey begins with one step, so it’s time that health care organizations decide to make the first step.
Acknowledgements
This paper has been developed under Project No. 179081 named „Researching contemporary tendencies of strategic management using spe-cialized management disciplines in function of
competitiveness of Serbian economy“, financed by Ministry of education and science of Republic of Serbia.
References
1. Edwards, N.; Roelofs, S. „ Developing management systems with cross-cultural fit: assessing internatio-nal differences in operational systems.“ The Interna-tional Journal of Health Planning and Management , 2006: 55–73.
2. Fa ltholm, Y.; Jansson, A. . „The implementation of process orientation at a Swedish hospital.“ The In-ternational Journal of Health Planning and Manage-ment, 2008: 219-233.
3. Aroian, J, et al. “Vision for a treasure resorce, Part 1. Nurse manager role implementation.” Journal of Nursing Administration, 1997: 36-41.
4. Chapman, C.,. „Percieved barriers to delivery of palliative care: Guide to program planning.“ Onta-rio: Southeastern Ontario Palliative Pain and Symp-tom Management Program, 1998.
5. De Angelis, V.; Felici, G.; Impelluso, P. . „Integrating simulation and optimisation in health care centre ma-nagement.“ European Journal of Operational Rese-arch , 2003: 101-114.
6. Dienemann J.; Van de Castle,. „The impact of health informatics on the organization.“ Journal of Nursing Administration, 2003: 557-562.
7. Flessa, S. „Where efficiency saves lives: a linear pro-gramme for the optimal allocation of health care re-sources in developing countries.“ Health Care Mana-gement Science 3 (3), 2000: 249-267.
8. Freidson, E. Profession of Medicine: A Study of the Sociology of Applied Knowledge. Chicago: The Uni-versity of Chicago Press, 1970.
9. Hartwig, K, et al. “Hospital management in the con-text of health sector reform: a planning model in Ethi-opia.” The International Journal of Health Planning and Management, 2008: 203-218.
10. Johnston, G.M., L. Gibbons, and F.I., et al. Burge. “Identifying potential need for cancer palliation in Nova Scotia.” Canadian Medical Association Jour-nal, 1998: 1691-1698.
11. Jovanovic, P, V Obradovic, D Petrovic, M Mihic, and A Jovanovic. “Cross-cultural aspects of project management: Serbia goes to Iraq for Jordan pro-ject.” International Journal of Industrial Enginee-ring 16, no. 4 (2009): 318-330.
12. Karaoglu, Nazan, and Muzaffer Seker. “Looking for winds of change with a.” HealthMED 5, no. 3 (2011): 515-521.

Vers
ion fo
r revie
w
2112
HealthMED - Volume 6 / Number 6 / 2012
Journal of Society for development in new net environment in B&H
13. Keillor A.; Nutten S.;. „A vision of e-Health: case management online.“ Lippincotts Case Mangement, 2000: 107-111.
14. Kemenade YW van. Health Care in Europe. The fi-nance and reimbursement systems of 18 European countries. Maarssen: Elsevier/De Tijdstroom, 1997.
15. Kouria, P., R. Karjalainen-Jurvelinb, and J. Kin-nunenb. “Commitment of project participants to de-veloping health care services based on the Internet technology.” International Journal of Medical In-formatics, 2005: 1000-1011.
16. KPMG. Programme management survey. UK: KPMG, 2002.
17. Krakauer, H., et al. “Best clinical practice: assess-ment of processes of care and of outcomes in the US M.H.S.S.” Journal of Evaluation in Clinical Prac-tice, 1998: 11-29.
18. Kwak, Y. H.; Anbari, F. T. „Analyzing project ma-nagement research: Perspectives from top mana-gement journals.“ International Journal of Project Management, 2009: 435-446.
19. Lodder, H, / A.R Bakker. „Project management.“ U Handbook of Medical Informatics, autor Van Be-mmel / Musen M.A., 527-534. Germany: Springer-Verlag, 2000.
20. Loo R. „Project management: a core competency for professional nurses and nurse managers.“ Jour-nal for Nurses in Staff Development, 2003: 187-193.
21. Munkhsaikhan, Sodnom; Tsai, Alan C; Chang, Ming-Cheng;. „Technical Efficiency of Public Hos-pitals in Mongolia.“ HealthMED, 2011: 344-349.
22. OPSR. Improving Programme and Project Delivery. UK Civil Service Report, . London: Office of Public Services Reform, Whitehall, 2003.
23. Özkahraman, Şükran; Özsoy, Süheyla Altuğ;. „Assessing Core Competencies for Public Heal-th Professionals in Turkey.“ HealthMED, 2011: 1170-1176.
24. Perala, M.L. The direction of nursing. A strategy for quality and effectiveness. Project group of nursing. Helsinki: National Research and Development Cen-tre for Welfare and Health (STAKES), Ministry of Social Affairs and Health, 1998.
25. Perleth, M., E. Jakubowski, and R. Busse. “What is ‘best practice’ in health care? State of the art and perspectives in improving the effectiveness and effi-ciency of the European health care systems.” Health Policy, 2001: 235–250.
26. Peters, D.H., A.A Noor, L.P Singh, F.K. Kakar, P.M. Hansen, and G. Burnham. “A Balanced Scorecard for health services in Afghanistan.” Bulletin of the World Health Organization, 2007: 146–151.
27. Pijalovic, Velma, and Mensura Kudumovic. “Analy-sis of Health Expenditures in the EU8 Countries and Bosna and Herzegovina.” HealthMED 4, no. 4 (2010): 819-828.
28. Sa Couto, Joaquim. „Project management can help to reduce costs and improve quality in health care services.“ Journal of Evaluation in Clinical Practi-ce 14, br. 1 (2008): 48-52.
29. Semolic, B, P Jovanovic, S Kovacev, and V Obra-dovic. “Improving Repair Management of Bucket Wheel Excavator SRs1200 by Application of Project Management Concept.” Journal of Mechanical En-gineering 54, no. 7-8 (2008): 565-573.
30. Sinha, T., M.K. Ranson, M. Chatterjee, and A. Mills. “Management initiatives in a community-based he-alth insurance scheme.” The International Journal of Health Planning and Management, 2007: 289-300.
31. Ska˚leˊn, P. „New public management reform and the construction of organizational identities.“ The International Journal of Public Sector Management 17, 2004: 251-263.
32. Trish J.; Tanner L.,. „Implementing agenda for change in a primary care trust.“ Nursing Manage-ment: The Journal of Excellence in Nursing Leader-ship, 2004: 24-27.
33. van Zon, A. H.; Kommer, G. J.;. „Patient flows and optimal health-care resource alloaction at the ma-cro-level: A dynamic linear programming approa-ch.“ Health Care Management Science 2 (2), 1999: 87-96.
34. Whittington R., et al. „Change and complementari-ties in the new competitive landscape: an European panel study.“ Organization Science, 1999: 583-600.
35. Winter, M.; Smith, C.; Morris, P.; Cicmil, S. . „ Di-rections for future research in project management: The main findings of a UK government-funded re-search network.“ International Journal of Project Management , 2006: 638-649.
36. Yılmaz , Kürşad; Altınkurt, Yahya;. „Relationship between Management by Values, Organizational Trust and Organizational Citizenship.“ TTEM - Te-chnics Technologies Education Management, 2011: 957-966.
Corresponding Author Vladimir Obradovic, Faculty of Organizational Sciences, Belgrade, Serbia, E-mail: [email protected]

Vers
ion fo
r revie
w
HealthMED - Volume 6 / Number 6 / 2012
Journal of Society for development in new net environment in B&H 2113
Abstract
Aim: The entomoeba coli which is an inte-stinal parasite is known as apatojen. However in some studies it has also been reported that it may be pathogenic. The Adenosine deaminase (ADA) is the key enzyme of purine metabolizm and con-trols the levels of adenosine and deoxy adenosine in the cell. The researchers have found that ADA is a marker of cellular immunity and the increased ADA serum in different diseases. In the study the comparison of ADA levels between the serums of the patients with detected Entamoeba coli (E. coli) and the control group is purposed.
Methods: In this study the levels of ADA in the serums of 40 control groups and 35 patients who have E.coli are measured. When comparing the averages of the patients and control groups, the independent sample T test was also used. The mean age of the group is 37.97 ± 5.06, 31 (89%) male and 4 (11%) of them are women. The mean age of healthy 40 people is 40.23 ± 7.01, 31 (77%) males and 9 (23%) of them are women.
Results: In the study according to the controls a significant increase is observed in ADA activity of the patient group.
Conclusions: The findings seem to support the parasite’s pathojen. In the studies which will be planned to determine whether the parasite is pa-thogenic or not, the detection of ADA values of Entemoeba coli diagnosed patients’ before and after treatment will be guiding. In addition, the de-termination of ADA levels can give information about the immune mechanisms and we also can reach a conclusion that it can support the criterias for diagnosis and treatment of patients with positi-ve Entemoeba coli.
Key words: Entemoeba coli, Adenosine dea-minase, Intestinal parasite, Pathogen,
Introduction
It was found that the prevalance of intestinal parasites could be risen up to 100 % in the socie-ties living in tropical and subtropical regions and don’t pay attention to general hygiene rules. The entomoeba coli which is an intestinal parasite is known as apatojen. But it has been reported that it may be pathogenic parasite, because in some studies E. Coli was found in the tests of patients admitted to health facilities with symptoms of the digestive system but the known pathogenic bacte-ria wasn’t detected in them.[1-4]
The defense of the host immune system against the parasites (adult and larval form) is made throu-gh the cells. In this mechanism different cytotoxic agents produced by the fagositer cells that has been activated, reactive oxygen and nitrogen in-termediate products are involved. These products are oxidant molecules in the nature of free radical and they affect negatively the parasite viability. Antioxidans are molecules that can neutralize free radicals by accepting or donating an electron to eliminate the unpaired condition. [5-8]
It has been reported that the tissue injury for-med in the parasitic infections occurred with the effect of the toxin secreted by the organisms. It has also determined that the parasites contain the enzymes producing free oxygen radicals such as süperoksid and hydrogen peroxide.[5]
The Adenosine deaminase (ADA) is the key en-zyme of purine metabolizm and controls the levels of adenosine and deoxy adenosine in the cell. The adenosine deaminase is an amino hydrolase en-zyme that catalyzes only the adenosine, the deoxya-denosine and the known ribozids in mammals and it is in multiple molecular forms in human tissue and its structural gene is located 20th chromosome.[9-12] The ADA activity in the Lymphocytic cells are
The level of adenosine deaminase in the serum of patients who have positive Entamoeba coliTugba Raika Kiran1, Ulku Karaman2, Cemil Colak3, Ali Ozer4
1 Continuing Education Research and Application Center Inonu University, Malatya, Turkey,2 Ordu University, High School Health, Ordu, Turkey,3 Department of Biostatistics, Inonu University, Malatya, Turkey,4 Department of Public Health Inonu University, Malatya, Turkey.

Vers
ion fo
r revie
w
2114
HealthMED - Volume 6 / Number 6 / 2012
Journal of Society for development in new net environment in B&H
10 times more than in erythrocytes.[9-12] The T lymp-hocyte ADA activities are higher than the B lymp-hocytes and during the T- cell differentiation there is a significant increase in the activity of the ADA, especially in the oimmature and undifferentiated stages. The researchers thought that the ADA is the marker of cellular immunity and they have found the ADA serum levels of different diseases. The increased serum ADA activity is shown in the acti-vation period of the autoimmune diseases which the cellular immunity was stimulated, such as typhoid fever, infectious mononucleosis, brucellosis, acute pneumonia, tuberculosis, sarkodioz, liver disease, acute leukemia, various malignancies and rheuma-toid arthritis, systemic lupus erythematosus (SLE), Behcet's disease.[13-15] The adenosine deaminase en-zyme deficiency is the single enzimopati showing an autosomal dominant inheritance between the defects of red blood cell enzyme deficiency. As a result of ADA enzyme deficiency the B and T lymp-hocytes lose their functional properties. Due to the large number of nucleoside kinase and recovery path enzymes in lymphocytes, the dATP concentra-tion increases. With this increase the ribonucleotide reductase is inhibited and thus the formation of dN-TPs is stopped. As a result, DNA synthesis can not be done. Because of the DNA synthesis deficiency, the lymphocytes are unable to fulfill their task and immune insufficiency occurs. As a result of these assessments, it has been found that the ADA acti-vity is important for normal lymphocyte function.[13,15,16] In the study, the comparison of ADA levels between the serums of the patients with detected E. coli and the control group is aimed.
Material and method
The research has ethics committee report and was conducted between 2007-2008 at the Univer-sity of Inonu. The study included only voluntary patients’ samples. The intestinal parasites native-lugol were examined with the multiplication met-hods trichrome stain and cellophane tape method by taking perianal region material and only the pa-
tients with E. coli were consisted of these experi-ments. The patients who had different interference and any hormone medication, smokers and alco-hol users were excluded from the ADA because of the thought that they would lead to differences in levels. In the control group, some volunteers were evaluated and they were non-smokers, not hormo-nal medication and alcohol users and they didn’t have a parasitic infection. In the study, the parasi-te-positive patients were called back and after they had the necessary explanation for the work 5ml blood sample was taken from the wishing patients, then their serums were separated and stored at -20 until being worked on.
In this study the levels of ADA in the serums of 40 control groups and 35 patients who have E. coli are measured. In the serum ADA levels the methods developed by Ellis and Goldberg[17] were used. The ammonium ion, released from the ade-nosine with the effect of the adenosine deamina-se enzyme, creates the green and blue indofenol complex as a result of Boertholet reaction. The intensity of occurred color has been increasing in proportion with the concentration of enzyme in the environment. This complex was read spectrop-hotometrically at a wavelength of 632 nm.
The data are expressed as mean ± standard de-viation. The normality test, Shapiro-Wilk test was used. When comparing the averages of the pati-ents and control groups, the independent sample T test was used. Statistically, it was considered that p <0.05 was significant.
Results
In the study, Table 1 shows the descriptive statistics for the ADA activity. The mean age is 37.97±5.06, 31 (89%) male and 4 (11%) of them are women. The mean age of healthy 40 people 40.23±7.01 is 31 (77%) males and 9 (23%) of them are women. Statistically, any significant dif-ference was detected between the mean age of the patients and control groups (p = 0.17).
Table 1. The adenosine deaminase activities of Entemoeba coli and the control group (U / L)Variable Groups n Statistics P
Entamoeba coli (Mean ± SD)Patient 35 29.06 ± 11.57
0.009Control 40 21.11 ± 14.08

Vers
ion fo
r revie
w
HealthMED - Volume 6 / Number 6 / 2012
Journal of Society for development in new net environment in B&H 2115
A significant difference was found between the control and Entemoeba coli (p=0.009). According to the controls, a significant increase was observed in the ADA activities of the patient group.
Discussion
The proliferating cells in tissues contain higher ADA activity. the ADA ratio in the cytoplasm is higher than the nucleus. But it has the highest concentrations rate in the lymphoid tissues.[18] Due to its physiological activity, it is an enzyme connected to the lymphocyte differentiation and proliferation.[13,15] The activity of the lymphocytes increase during the mitogenic and antigenic res-ponse of them. The ADA activity in T lympho-cytes is slightly higher than in B lymphocytes.[19] The enzyme of adenosine deaminase accepted as the T-cell marker, increases in the plasma or in the body fluid for diseases in which the cell-mediated immunity stimulation occurs.[16]
The absence of ADA in the erythrocytes and lymphocytes leads to severe combined immune deficiency. Inhibition of this enzyme weakens the function and maturation of lymphocytes and the other immune cells, besides, when the monocytes and macrophages are infected with the intracellu-lar parasites, they show increase in the activity of ADA. Because of the absence of ADA which is in all cells, the immune system damage occurs and recurrent chronic viral, fungal, protozoal, bacterial infections and lymphopenia are seen.[13]
In an increased ADA serum insufficiency, both the cellular and humoral immunity is in the condition of impaired.[13,15] The ADA activity in-creases with the autoimmune diseases which the cellular immunity was stimulated, such as typho-id fever, infectious mononucleosis, brucellosis, acute pneumonia, tuberculosis, sarkodioz, liver disease, acute leukemia, various malignancies and rheumatoid arthritis, systemic lupus eryt-hematosus (SLE) and Behcet's disease.[14,15,20,21]
In addition, it has been proposed that the ADA levels also increase in the patients who have pri-mary immune deficiency (Leucocyte adhesion deficiency, hyper-IgM and Wiscott-Aldrich Syn-drome, Chronic granulomatous disease).[22]
In the source Informations which have been re-ached before, it has not been encountered a study
about the determination of the ADA level in the of E. coli infection.However, Tripathi and et al.[23]
have found the ADA level was high in patients with visceral leishmaniasis. And also Hitoglou and et al.[24] have reported that the Ada level increased in mice infected with Trichinella spiralis. Again it is stated that ADA levels increase in malaria[25] and Gakis[26] acute toxoplasmosis. Also in the study, si-gnificant differences between the control group and E. coli were identified, according to the controls a remarkable increase has beenobserved at the level of the ADA (p = 0.009). As the ADA activity is in-creasing when the immune system is activated, it is decreasing when being suppressed. It has been tho-ught that the high detected serum ADA activity in the in serum of patients with E. coli is probably an indicator of the induced cellular immune response.
Conclusions
The findings seem to support that the parasite is pathojenic. In the studies which will be planned to determine whether the parasite is pathogenic or not, the determination of the ADA levels between the patients diagnosed with E. coli, before and after treatment, will be guiding. In addition, the determination of ADA levels can give knowledge about the patients’ immune mechanisms and also it has been concluded that it can support the cri-teria for diagnosis and treatment of patients with positive E. coli.
Acknowledgements
The authors would like to thank Prof. Nilgün Daldal and Assist. Prof. Metin Atambay for their contributions to the study.
References
1. Karaman U, Calik S, Gecit I, Colak C, Karaca Z. Evaluation of the rates of ıntestinal parasites in pati-ents with digestive system complaints admitted to sta-te hospital. Fırat Health Services J. 2010; 5:143-151.
2. Kaya S, Sesli CE, Akcam Z, Kesbic H, Demirci M. Cli-nical symptoms in cases caused by Entamoeba coli and Blastocystis hominis. Türkiye Parazitol Derg. 2005; 29: 229-231.
3. Karaman U, Kıran T, Colak C, Iraz M, Celik T, Bay Karabulut A. Serum Malondialdehyde, glutathione

Vers
ion fo
r revie
w
2116
HealthMED - Volume 6 / Number 6 / 2012
Journal of Society for development in new net environment in B&H
and nitric oxide levels in patients infected with En-tamoeba coli. International journal of Medicine and Medical Sciences, 2009; 5: 235-237.
4. Kuman A, Altıntas N. Protozoan Diseases 1. Edition. Ege University Publisher Izmir, Turkey, 1996:36-39
5. Kurt O, Ok UZ, Ertan P, Yuksel H. Antioxidant agent and malaria. Türkiye Parazitol Derg 2002;26:108-112.
6. Akkus I. Effects of free radicals and pathophysiolo-gical. Konya, Turkey: Mimoza Publisher, 1995;32:1–76. ISBN 975-543-038-5.
7. Amanvermez R, Celik C. Superoxide dismutasis, gluta-tion, vitamin C, total antioxidant, and total tiyol levels in hydatic cysts. T Klin J Med Sci. 2004;24:213-18.
8. Trivic T, Drid P, Drapsin M, Ostojic S, Obadov S, Ra-djo I. Strength and endurance training does not lead to changes in majör markers of oxidative stress. Heal-thMED. 2011;Volume 5, 3:616-620
9. Ozvaran MK, Okur H, Ozgel M, Ertugrul M, Baran R. Diagnostic value of adenosine deaminase and ıts ısoenzym in tuberculous pleural effusions. Turkish Thoracic J. 2004;5:166-170.
10. Kartaloglu Z, Okutan O, Bozkanat E, Ugan MH, Ilvan A. The course of serum adenosine deaminase levels in patients with pulmonary tuberculosis. Turkish Thora-cic J. 2005;6:127-131.
11. Ormen B, Ormen M, Turker N, Coskun NA, Onvu-ral B, Kaptan F, El S, Ural S, Vardar I. Adenosıne deamınase actıvıty ın cerebrospınal fluıd ın tuber-culous menıngıtıs. Turkish Journal of Infection. 2005;19:415-418.
12. Ates Y, Ergun H, Tuzun A, Bagcı S, Kurt I, Inal A, Polat Z, Karaeren N, Dagalp K. Serum adenosine deaminase levels and lymphocyte subgroups in fami-lial mediterranean fever. Ankara Acedemic gastro-enterology J. 2005;4:112-116.
13. Cenesiz S, Nisbet C, Yarim GF, Arslan HH, Ciftci A. Serum adenosine diaminase activity and nitric oxide level in cows with trichophytosis. Ankara Univ Vet Fac J. 2007;54:155-158.
14. Hatipoglu K, Yuksekol I, Ozkan M, Balkan A, Kopa-ran EZ, Bedirhan İ, Bilgiç H, Demirci N. The impor-tance of measuring serum adenosine deaminase ın tuberculosis. Gülhane Medical J. 2003;45:165–168.
15. Ozgen G, Yasa H, Bektas A, Beyler AR, Büyükko-cak S, Canpolat O. Adenosine deaminase activity in patients with carcinoma of rectum. J Med Sci. 1998;18:369-371.
16. Kose K, Utas S, Yazici C, Akdas A, Kelestimur F. Effect of propylthiouracil on adenosine deaminase activity and thyroid function in patients with psoria-sis. British Journal of Dermatology. 2001;114:1121-1126.
17. Ellis G, Goldberg DM. A reduced nicotinamide adenine dinucleotide-linked kinetic assay for ade-nosine deaminase activity. J Lab Clin Med. 1970; 76: 507-517.
18. Carson DA, Seegmiller JE. Effect of adenosine dea-minase inhibition upon lymphocyte blastogenesis. J Clin Invest. 1976;54: 274.
19. Tung A, Silber B, Quagliata C. 1976: Adenosine de-aminase activity in chronic lymhocytic leukemia: re-lationship to B cell and T cell subpopulation. J Clin Invest. 1976; 57:756-61.
20. Burgess LJ, Maritz FJ, Le Roux I, Taljaard JJF. Use of adenosine deaminase as a diagnostic tool for tu-berculosis pleurisy. Thorax. 1995;50:672-674.
21. Dalar L, Karasulu L, Ozkan P, Kalkan N, Sokucu S, Simsek N, Altin S. Diagnostic value of CA 125 in the diagnosis of tuberculosis pleurisy. Turkish Thoracic J. 2008;9:27-33.
22. Poursharifi P, Saghiri R, Ebrahimi Red M, Nazem H, Pourpak Z, Moin M, Shams S. Adenosine deaminase in patients with primary immunodefiency syndro-mes: The analysis of serum ADA1 and ADA 2 actvi-ties. Clinical Biochemistry. 2009;42:1438-1443.
23. Tripathi K, Kumar R, Bharti K, Kumar P, Shrivastav R, Sundar S, Pai K. Adenosine deaminase activity in sera of patients with visceral leishmaniasis in India Clin Chim Acta. 2008;388:135-8.
24. Hitoglou S, Frydas S, Hatzistilianou M, Pappa S, Gougoustamou D, Kotsis A. Response of ADA and its isoenzymes in mice infected by Trichinella spira-lis and treated with mimosine. Int J Immunopathol Pharmacol. 2004;17:191-200.
25. Daddona PE, Wiesmann WP, Lambros C, Kelley WN, Webster HK. Human malaria parasite adeno-sine deaminase. Characterization in host enzyme-deficient erythrocyte culture. J Biol Chem. 1984; 259: 1472-1475.
26. Gakis C. Adenosine deaminase (ADA) isoenzymes ADA1 and ADA2: diagnostic and biological role. Eur. Respir. J. 1996;9:632-633.
Corresponding Author Tugba Raika Kiran, Continuing Education Research and Application
Center, Inonu University, Malatya, Turkey, E-mail: [email protected]

Vers
ion fo
r revie
w
HealthMED - Volume 6 / Number 6 / 2012
Journal of Society for development in new net environment in B&H 2117
Abstract
There has recently been one hundred years sin-ce George Crile demonstrated systematic cervical lymph nodes excision for treatment of patients with head and neck cancer. Due to morbidity of the radical surgical approach, the emphasis was made on surgically conservative approach, in ca-ses where it does not have adverse effects on di-sease control and still offers preservation of fun-ctional and cosmetic status. Modified radical neck dissection (MRND) removes “en block” the same lymph nodes and vessels as radical dissection, but by preserving one or more non-lymphatic struc-tures that are being entirely removed by radical dissection, it decreases postoperative morbidity. Selective neck dissections, which are being pre-ferred by American head and neck surgeons, went even further. The research was performed at Insti-tute for Otolaryngology and Maxillofacial Surge-ry of Clinical Center of Serbia in Belgrade. The study included 319 patients treated period, from January 1, 1997 to December 31, 2001, who have been followed up for at least 5 years after trea-tment. Having in mind that this was retrospective clinical study, i.e. longitudinal study, the choice of patients and variables was made based on patient records. Of 302 patients with determined category, the most were in T2 category (40.44%), while T1 tumors were four times less frequent. It has been observed that metastases recurrences have occurred in 57/319 (17.86%) subjects at various time intervals. By analyzing recurrent metastases according to N categories, it has been determined that the most of them were in N1 and N2 category. This was expected, as N1 category was the most represented in the entire group of patients with 137/319 (42.94%) cases, and the largest number of neck dissections – 137/291 (47.08%), primarily SND, were performed within this category. Patient
five-year survival in our study has been analyzed according to N category, type of neck dissection, and recurrence of metastases (Figure 2). Over the first two years of follow-up, there has been larger survival tendency in MRND group compared to SND. The difference became comparable in the third year, and increased in favor of SND by the end of follow-up period. Although arithmetic mean value was almost the same, and median va-lue was higher in patients with MRND, there is no significant difference in five-year survival among patients with N1 category (0.43; df=1; p>0.05).
Key words: selective neck dissection, metasta-ses recurrence.
Introduction
There has recently been one hundred years sin-ce George Crile demonstrated systematic cervical lymph nodes excision for treatment of patients with head and neck carcinoma1. In 1906, George Crile has described surgical operation he called “radical neck dissection”, based on his previous experience and a study of impressive group of 4.500 patients with head and neck carcinoma.
George Crile believed that it might be possible to obtain higher cure rate if lymph structures were removed radically, as a whole1. He argued that the key to the surgical method was excision of internal jugular vein and its adjacent tissues, knowing that the highest frequency of involvement with meta-static deposits is present in the region of jugular chain of lymph nodes.
In fifties and sixties of the past century, Pietran-toni L. and Bocca E. in Italy, Tapia G. and Rodri-gez S. in Spain, Stell P.M. in Great Britain, Le-roux-Robert J. and Guerrier Y. in France, as well as Denecke and Mündnich K. in Germany popu-larized surgery aimed at cervical metastases2,3. In the mid 20th century, Alonso J. from Uruguay, and
The estimation of oncological value of selective neck dissection in cervicofacial region tumorsAleksandar Trivic, Sanja Krejovic Trivic, Anton Mikic, Vojko Djukic, Jovica Milovanovic, Zeljko Petrovic
Clinic for Otorhinolaryngology and Maxillofacial Surgery, Clinical Center of Serbia, Belgrade School of Medicine, Serbia
Vers
ion fo
r revie
w
2118
HealthMED - Volume 6 / Number 6 / 2012
Journal of Society for development in new net environment in B&H
especially Osvaldo Suarez in Argentina were the most prominent protagonists of radical neck dis-section development.
Over time, radical neck dissection has became almost standard procedure for patients who requi-red surgical treatment of metastatic deposits com-bined with primary tumor removal1,4. In the meanti-me, everyone involved in treatment of patients with head and neck carcinoma began to understand that the radical neck dissection was adequate for treating large palpable lymph nodes, but that it was excessi-vely aggressive in both patients with small palpable lymph nodes, and especially those without palpable lymph nodes or with high risk of metastases.
In the beginning of sixties of the past century, establishing concept of conservative, i.e. functio-nal surgery of primary and metastatic cervical de-posits was initiated5. The concept has all features of oncological radicalism, and relatively precisely established indications and contraindications. The functional neck dissection is based on using ad-vantages of its specific anatomy, i.e. its fascial sur-faces and compartments, in order to remove entire lymphatic system or its portions, with preservati-on of adjacent non-lymphatic structures. The key terms in this definition are “complete” and “por-tion”, and they refer to lymphatic tissue. When American head and neck surgeons accepted this operation in the end of seventies, these two im-portant terms vanished and the concept and spirit of functional dissection was seriously jeopardized.
According to many authors, cervical lymph nodes metastases lead to a decrease in survival of patients with squamous cell carcinoma of upper airway and upper digestive tract by approxima-tely 50%. Due to morbidity of the radical surgical approach, the emphasis was put on surgically con-servative approach, in cases where it does not have adverse effect on disease control, and still offers preservation of functional and cosmetic status.
Modified radical neck dissection (MRND) re-moves “en block” the same lymph nodes and ve-ssels as radical dissection, but by preserving one or more non-lymphatic structures that are being radi-cally removed by radical dissection it decreases postoperative morbidity. Selective neck dissecti-ons, which are being preferred by American head and neck surgeons, went even further. Operations include selective removal of individual groups of
lymph nodes with risk of metastases and preserva-tion of all non-lymphatic structures and remaining groups of lymph nodes in cases of node-negative neck. It use in cases of node-positive neck is being advocated as well. There are large controversies in this area, especially in patients with evident meta-static neck deposits.
Material and methods
The research was performed at Clinic for Oto-laryngology and Maxillofacial Surgery of Clinical Center of Serbia in Belgrade. The study included 319 patients treated over a five year period, from January 1, 1997 to December 31, 2001, who have been followed up for at least 5 years after admi-nistered treatment. Having in mind that this was retrospective clinical study, i.e. longitudinal study, the choice of patients and variables was made ba-sed on patient records.
Two groups of patients have been established within the study. In first group were the patients with clinically node-negative neck (N0) in which primary tumor surgery and SND have been per-formed in one act. In the second group were the patients with clinically node-positive neck (N+) in which primary tumor surgery and SND have been performed in one act. Two control groups of pati-ents have been established. In the first group were the patients with clinically node-negative neck (N0) in which primary tumor surgery and MRND have not been performed in one act. In the second group were the patients with clinically node-positive neck (N+) in which primary tumor surgery and one of MRND’s have been performed in one act.
The decision on treatment modality was made by the Council for Malignant Diseases of Oto-laryngological and Maxillofacial Region. For each subject, the following variables have been recorded: demographics (sex, age); clinical (loca-lization of primary tumor, T category, N category, histopathological features, grade, course of dise-ase, regional relapse, time of follow up, five year survival). Values have been recorded for quanti-tative variables, while categorical variables have been ranked in the appropriate established cate-gories. The research results were processed using descriptive and inferential statistical methods. The special emphasis was made on methods for eva-

Vers
ion fo
r revie
w
HealthMED - Volume 6 / Number 6 / 2012
Journal of Society for development in new net environment in B&H 2119
luating development of the event over time – sur-vival (Kaplan-Meier test, LogRank test), as well as multivariate statistical methods (discrimination analysis, logistic regression analysis, and Cox pro-portional hazard regression method).
Results
The majority of patients included in this study were male - 209 (90.91%), while 29 (9.09%) were female. Mean age of all subjects was 56.36 years (x=56.36; sd=8.58; cv=15.22%). The de-velopment of cervical malignancy was followed and analyzed in primary tumors and metastatic deposits according to TNM clinical classification of malignant tumors, separately for each localiza-tion. Of 302 patients with determined category, the majority were in T2 category (40.44%), whi-le T1 tumors were four times less frequent. This proportion relationship of T1 category compared to categories T2 and T3 suggests loss of time and difficulties in discovery of primary tumors at men-tioned localizations. In 5.33% of patients, the lo-cation of primary tumor was not determined, even after complete diagnostic work-up (Table 1).
As a rule, the distribution of nodes by neck levels corresponded to node distribution by node groups, according to location of primary tumor. This was difficult to determine, due to non-obser-vable boundaries of neck levels determined during surgical procedure, presence of node conglome-rates, and of nodes merged with non-lymphatic structures. Subjects' nodes were predominately distributed within II, III and IV neck level, and according to primary localization, they correspon-ded to laryngeal carcinoma (Table 2). The groups of nodes at these levels are positioned along inter-nal jugular vein and most commonly represent the site of metastases of cervicofacial carcinoma.
Among 319 patients (638 sides of neck), 347 si-des have been subjected to surgery. Among those, 291 one-sided and 56 two-sided dissections have been performed. From total number of unilateral and bilateral surgeries, SND and MRND have been represented in approximately equal propor-tions. Among patients with III stage disease, most commonly performed procedure was SND acco-unting for more than half of total number of dis-sections performed at this stage of disease, while at IVA stage, the most commonly performed pro-cedure was MRND (Table 3).
Table 1. Distribution of patients by primary tumor localization in relation to T caetgory
TCaT.
LoCaLizaTion of primary TumorToTaL
Larynx pharynx oraL CaviTy neCk upT
number % number % number % number % number % number %Tx 0 0 0 0 0 0 0 0 17 100 17 5.33T1 5 3.05 13 12.62 7 23.33 3 60 0 0 28 8.78T2 58 35.37 50 48.54 19 63.33 2 40 0 0 129 40.44T3 52 31.71 18 17.48 4 13.34 0 0 0 0 74 23.20T4 49 29.88 22 21.36 0 0 0 0 0 0 71 22.26
ToTal 164 100 103 100 30 100 5 100 17 100 319 100
Table 2. The frequency of cervical metastases by neck levels compared to primary localization of tumor
LeveL
LoCaLizaTion of primary TumorToTaL
Larynx pharynx oraL CaviTy neCk upT
number % number % number % number % number % number %I 1 0.75 4 4.26 12 42.86 0 0 1 5.88 18 6.47II 24 18.05 19 20.21 12 42.86 3 60 6 35.29 64 23.02III 61 45.86 38 39.36 4 14.26 2 40 7 41.18 112 40.29IV 41 30.83 31 32.98 0 0 0 0 3 17.65 75 26.98V 5 3.76 3 3.19 0 0 0 0 0 0 8 2.88VI 1 0.75 0 0 0 0 0 0 0 0 1 0.36
ToTal 133 100 95 100 28 100 5 100 17 100 278 100

Vers
ion fo
r revie
w
2120
HealthMED - Volume 6 / Number 6 / 2012
Journal of Society for development in new net environment in B&H
Clinical evaluation of cervical lymph nodes is necessary, but unreliable in estimation of N0 neck status. Within the group of patients with clinically node-negative neck, approximately equal number of SND and MRND was performed. Each neck dissection sample has been histopathologically examined separately in order to identify occult metastases. Postoperative histopathological eva-luation of neck dissection samples from patients with N0 necks has shown the presence of occult metastases in one fifth of patients. In our study, we found that the percentage of discovered occult metastases among MRND cases was somewhat higher compared to SND.
The occurrence of metastases recurrence has been analyzed in 319 patients who underwent one type of neck dissection in order to remove histopa-thologically verified and non-verified lymph no-des. It has been observed that recurrent metastases have occurred in 57/319 (17.86%) subjects at va-rious time intervals. The frequency of recurrence was followed in relation to time of occurrence. The frequency of metastases recurrence observed by quarters was significantly different (χ2=44.942; df=12; p<0.01). This highly significant differen-ce is contributed by large differences in frequency in the second (m 4-6) and fourth (m 10-12) qu-arter and significantly high frequency in the first (m 0-3) and no occurrences in ninth (m 25-27) and eleventh (m 31-33) quarter. The frequency of metastases recurrence observed by yearly follow-up was significantly different (χ2=52.825; df=3; p<0.01). This high level of significance of diffe-rence among frequencies is influenced by high frequency of metastasis recurrence in the first year
of follow-up and low frequency of metastasis re-currence in the third and later years of follow-up. It has been noticed that the probability of meta-stasis recurrence in the first year of follow-up was above 80% and that it decreased every successive year, reaching above 70% during the last period. The follow-up of decrease in number of recurren-ces does not have such significance as follow-up of their occurrences during the first months after dissection. The decrease in number of recurrences after several months indirectly suggests the evo-lution of disease and patient survival with clinical presence of malignancy, that is relatively short and without five-year survival.
We continued to follow and analyze the frequ-ency of recurrence in dissections compared to time of occurrence according to N categories. It has been found that the metastases recurrences in different time periods occurred among all N categories, re-gardless the category of node involvement.
N0 category showed one recurrence case wit-hin the initial three months after surgery. During the initial three months, recurrence cases occu-rred in all N categories. With the increase in N category value, the frequency of recurrence in-creased compared to total number in each N ca-tegory. This largely confirms the significance of malignancy stage in evolution of regional invol-vement. The frequency of metastases recurrence in the first and second year of follow-up is not si-gnificantly different in any combination of N ca-tegories (p1=0.583; p2=0.792; p3=0.833; p4=0.075; p5=0.446; p6=0.266; p>0.05).
The frequency of N1 and N2 category is hig-hly significantly higher, N0 i highly significantly
Table 3. Distribution of neck dissections by clinical stage of disease
CSD
one-sided disseCTionsone-sided
boTh-sided
disseCTionsToTaL
mrnd rnd snd prnd
number % number % number % number % number % number % number %S 0 0 0 0 0 0 0 0 0 0 0 0 0 0 0S I 0 0 0 0 2 4.76 0 0 2 0.73 0 0 2 0.66S II 11 9.24 0 0 11 26.19 0 0 22 8.00 0 0 22 7.28S III 61 51.26 31 28.97 22 52.38 3 42.86 117 42.55 2 7.41 119 39.40S IVa 47 39.50 51 47.67 7 16.67 3 42.86 108 39.27 25 92.59 133 44.04S IVb 0 0 25 23.36 0 100 1 14.28 26 9.45 0 0 26 8.61S IVc 0 0 0 0 0 0 0 0 0 0 0 0 0 0ToTal 119 100 107 100 42 100 7 100 275 100 27 100 302

Vers
ion fo
r revie
w
HealthMED - Volume 6 / Number 6 / 2012
Journal of Society for development in new net environment in B&H 2121
lower, while N3 is significantly lower than expec-ted (χ2=36.122; df=1; p<0.01). In this study, recu-rrences occurred most frequently between six and 24 months in N1 category, and between nine and 24 months in N2 category (Table 4). In patients with N1 category, the arithmetic mean was higher compared to patients with N2 category. In patients with N2 category, metastases recurrence occurred with significantly higher frequency.
By analyzing metastases recurrence according to N category, it has been determined that the most of them were in N1 and N2 category. This was expec-ted, as N1 category was the most frequent over the entire group of patients with 137/319 (42.94%) cases, and the largest number of neck dissections – 137/291 (47.08%), primarily SND, were perfor-med within this category. This refers to N2 category as well, in which MRND’s were performed in the first place. The proportions of subjects with meta-stases recurrence significantly differed by N cate-gory gradations (Fp=3.45; dfx=3; dfz=315; p=0.016; p<0.05). The proportion of metastases recurrence in N0 category was significantly smaller compared to the proportion of N1 category (d=-0.158; Fd=5.482; p=0.018; p<0.05) and highly significantly smaller compared to the proportion in N2 category (d=-0.221; Fd=10.026; p=0.002; p<0.01).
The frequencies of metastases recurrence are highly significantly different compared to both hypotheses that it is not expected. In general, their
occurrence (χ2=60.415; df=1; p<0.01), as well as compared to hypothesis that it is not expected in half subjects (χ2=130.458; df=1; p<0.01). In the first analysis, the frequency of occurrence of meta-stases is highly significantly higher then expected, while it is highly significantly lower then expected in the second one.
The frequency of metastases recurrence by N categories was significantly different (χ2=93.676; df=3; p<0.01). The frequency in N3 and N0 cate-gory was highly significantly lower, while in N1 and N2 categories it was highly significantly hi-gher compared to the expected equal frequency.
The occurrence of metastases recurrence has been followed in SND group in which 122 unilate-ral dissections have been performed, and there has been 15/122 (12.30%) cases of recurrence registe-red. This was compared to recurrence in MRND group, where there were 31/119 (26.05%) of cases, or two times more. The proportions (0.123 - 0.260 - 0.119 - 0.250) of subjects with metastases recu-rrence differ significantly by proportion of unilate-ral dissection (Fp=3.104; dfx=3; dfz=287; p=0.026; p<0.05). Subgroup of patients with metastases re-currence who underwent MRND was significantly larger compared to the proportion of subjects with metastases recurrence who underwent SND (d=-0.137; Fd=7.792; p=0.005; p<0.01).
It has been observed that the probability of non-occurrence of metastases recurrence in SND
Table 4. Frequency of metastases recurrence by N category
Time in monThs
n CaTegoriesToTaL
n0 n1 n2 n3number number number number number %
≤3 1 2 4 2 9 15.794-6 0 2 9 0 11 19.307-9 0 5 0 0 5 8.77
10-12 0 4 5 2 11 19.3013-15 0 3 3 1 7 12.2816-18 0 2 0 0 2 3.5119-21 0 5 1 0 6 10.5322-24 0 0 1 0 1 1.7525-27 0 0 0 0 0 028-30 0 2 0 0 2 3.5131-33 0 0 0 0 0 034-36 0 0 0 0 0 0≥37 0 0 3 0 3 5.26
ToTal 1 25 26 5 57 100

Vers
ion fo
r revie
w
2122
HealthMED - Volume 6 / Number 6 / 2012
Journal of Society for development in new net environment in B&H
group was higher for each year of follow-up com-pared to MRND (Figure 1). At the end of follow-up period, the probability of metastases recurrence was twice as high in MRND compared to SND group. Subjects with N1 category who underwent SND and MRND have approximately similar ari-thmetical mean values. The level of significance was not reached for metastases recurrence in su-bjects with N1 category, when compared by type of neck dissection.
Figure 1. Comparison of probabilities for meta-stases recurrence by modality of dissection
Figure 2. Five-year survival in patients with N1 category
Patient five-year survival in our study has been analyzed according to N category, type of neck dissection, and recurrence of metastases (Figure 2). During the first two years of follow-up, there has been larger survival tendency in MRND group compared to SND. The difference became com-parable in the third year, and increased in favor of SND by the end of follow-up period. Although
mean value was almost the same, and median value was higher in patients with MRND, there was no significant difference in five-year survival among patients with N1 category (0.43;df=1;p>0.05).
Discussion
Over the past years, there have been so many papers on neck dissections published that it is hard to believe there is anything new and interesting to add. At the same time, several controversial points of view have been presented regarding important questions, such as oncological safety, associated surgery and radiotherapy, preservation of non-lymphatic structures, approach to clinically node-negative neck, and surgical morbidity and survival of patients with MRND and SND6,7.
In the first place, this refers to selective dis-section that has several advantages over MRND. SND reduces morbidity and cosmetic defect, pro-vides carotid preservation, and most importantly, confirms almost identical incidence of recurrence in the neck lymph nodes compared to MRND8.
The principal question in the discussion on va-lue of SND refers to control of metastatic disea-se in regional neck lymph nodes. Does selective dissection provides control of metastatic disease in cervical lymph nodes as efficiently as modified radical dissection?
The question whether localization of primary tumor should influence the choice of modality of neck dissection is being asked from the be-ginning of development of dissection surgery. It was during the time when radical dissection was preferred to MRND and SND and when it was considered to provide better therapeutic results. It is well known that cervicofacial carcinoma of cer-tain locations has worse prognosis compared to ot-her locations. Carcinoma of hypopharynx has the worst prognosis, but this prognosis will not be al-tered by aggressive surgical dissection techniques. In other words, in patients with N0 neck and pyri-form sinus carcinoma, modified radical dissection will not provide much better results compared to selective dissection7,9.
The approach that is accepted today when de-ciding on type of dissection is to separate primary tumor from secondary neck tumor. In patients with primary carcinoma of cevico-facial region,

Vers
ion fo
r revie
w
HealthMED - Volume 6 / Number 6 / 2012
Journal of Society for development in new net environment in B&H 2123
neck should be treated according to its status. Pri-mary tumor should not be used as a criterion for making choice about type of dissection. The deci-sion on type of dissection that will be used should be based on characteristics of malignancy within neck nodes.
Contemporary approaches to clinically node-negative neck (N0) in cervicofacial carcinoma are much controversial from diagnostic and therapeu-tic aspect. Clinical estimate of node-negative neck (N0) is difficult and often leading to incorrect con-clusion. It is being considered that the conclusi-on about N0 category of neck based on palpation is incorrect in 20% to even 50% of cases, much depreciating the estimate10. The advances in ima-ging techniques have reduced the rate of error of staging neck disease in cases when small nodes are not accessible for palpation11. One of the large dilemmas in oncological surgery of cervicofacial carcinoma is therapeutic approach to clinically no-de-negative neck (N0) with verified primary squ-amous cell carcinoma, due to the fact that occult metastases are often not detectable in N0 neck12.
Over the recent years, other methods are being included in sample evaluation after dissection due to significance of occult metastases in relation to therapeutic alternatives and controversies with elective dissections of N0 necks. Apart from stan-dard examinations, these methods include histo-chemical, immunological and molecular techniqu-es aimed at detection of micrometastases10. Vari-able incidences of occult metastases have been reported, varying from 4-21%, depending on met-hod being used. These results suggest that occult metastases are more common in primary tumors located in hypopharynx, supraglottis, oropharynx, and oral cavity. They refer to protocol develo-ped by UICC that includes micrometastases N0 (mi)-metastases smaller that 2-3 mm, which wo-uld, according to authors, improve clarification of occult metastases.
The question that is being asked is how and whether clinical node-negative neck should be tre-ated, or whether it should be subject to expectant approach. The other question is whether elective neck dissection should be method of choice as an individual treatment, or accompanied with posto-perative radiotherapy. The answers to these questi-ons are inconsistent and conflicting.
The value of SND must be evaluated through its ability to provide regional control of malignant disease. The principal question that should be an-swered when discussing value of SND is whether it provides control of metastatic disease in cervical nodes that is as efficient as in MRND, accompani-ed with decrease in surgical morbidity.
There are controversies regarding number of no-des that would influence choice of selective neck dis-sections. Doubts originate from time when non-ra-dical dissections have been considered insufficiently oncologically radical. Many studies use number of lymph nodes in N+ neck in order to determine the prognosis. Conversely, other studies do not consider number of lymph nodes to be significant prognostic factor7. The choice of type of dissection should not be based on number of nodes, but on clinical and histopathological features of each discovered node. SND can be performed in patients with non-palpa-ble nodes, or with small nodes that are palpable but not bigger that 3 cm, the size being only approxima-te factor. Surgeries on patients with multiple nodes are completely oncological safe while nodes meet the above mentioned criteria. In these cases, MRND will not be more certain compared to SND.
Recently, nine retrospective studies have been identified that have been thought to be suitable for analysis13. However, seven of these studies have been published before standardized classification of neck dissections that we accepted ourselves have been established; at the point of publication, modifi-ed dissections included both MRND and SND. The-se studies differed by indications for radiotherapy, by follow-up interval, etc. Therefore, any compari-son among series have limited value. They retros-pectively analyzed medical records of patients who underwent neck dissection at Oregon Health Scien-ces University from 1989 to 1998, as well as pati-ents from Memorial Sloan-Kettering Cancer Center from 1995 to 1998, after standardization of neck dis-sections has been accepted and established14. Distri-bution of dissections in these analyses is comparable to our data, with observation that they had signifi-cantly higher number of SND.
Therefore, it is necessary to remove large num-ber of nodes, from which any one may represent the location of metastatic deposit15.
There is a consensus that SND is a method of choice for N1 category of nodes (without extracap-

Vers
ion fo
r revie
w
2124
HealthMED - Volume 6 / Number 6 / 2012
Journal of Society for development in new net environment in B&H
sular spread), that were predominate among patients in our study. This indirectly confirms the appropri-ate approach in establishing indications for selective neck dissections performed on our subjects.
According to number of dissections compa-red to other types of dissections, it may be argu-ed that in our settings, SND has been accepted as an adequate procedure for patients with N1 neck. This attitude is accepted by majority of cancer surgeons. SND is adequate procedure for patients with N0 and N1 category, in cases where there is no extracapsular expansion and involvement of non-lymphatic structures of neck16,17.
The indications for SND have not yet been firmly established and universally accepted, due to lack of consensus regarding the approach to N2 nodes. It is entirely certain that the majority of surgeons who specialize in head and neck region have accepted selective neck dissection as an adequate procedure for approaching clinically positive N1 neck.
Some argue that SND is acceptable for patients with N2 nodes, in cases where there is no invol-vement of any non-lymphatic structures. Many of them believe that SND is indicated as an adequate procedure for N2 nodes as well14. Value of selec-tive dissection still remains undefined for N2 ca-tegory, and especially for N categories with extra-capsular spread.
In our study, we observed 57/319 (11.86%) ca-ses of metastases recurrence. It has been determi-ned that with increase in N category, the frequency of occurrence of metastases recurrence raised, com-pared to total number for each N category, confir-ming the attitude about the significance of grade of malignancy for evolution of local disease. Some-times, it is not possible to determine the statistical difference in rate of occurrence of recurrence in cervical lymph nodes in overall patient population, as well as among patients with N2 and N3 catego-ries17. The presence of recurrence in N0 category was small in our series, while the largest number of recurrences occurred in N1 category (43.24%) and in N2 category (45.61%). This was expected, as N1 category was the most numerous in the entire seri-es of patients, and the largest number of modified radical neck dissections has been performed in this category. This partially refers to N2 category.
Only few studies have compared metastases recurrence rates for SND and MRND. Metastases
recurrence rates have been analyzed in nine retros-pective studies that were considered to be appro-priate for evaluation13. The mean combined recu-rrence rate after MRDV was found to be 13.6% (95% CI, range l2.0-15.2%), while mean combi-ned recurrence rate after SDV was 6.9% (95% CI, range 5.4-8.4%). These studies were not homoge-nous and suitable for evaluation; they differed in indications for neck dissection, application of pre-operative and postoperative radiotherapy, as well as follow-up interval. Therefore, comparison of outcomes between SND and MRND in these stu-dies has limited value. We analyzed the proportion of metastases recurrence by type of neck dissecti-on, as well as by occurrence in relation to the side of neck that was operated, in order to estimate the value of SND in control of regional nodal disease. This analysis is essential and has the largest im-portance for the estimation of SND value.
The occurrence of metastases recurrence has been followed in SND group in which 122 unilate-ral dissections have been performed, and there have been 15 cases of recurrence, or 12.30%. Among 119 MRND, there were 31 cases of recurrence (26.05%) which is twice more. From statistical perspective, SND is oncologically more efficient in control of node-negative and node-positive neck, as occurren-ce of recurrence is two times less frequent compared to MRND. The arithmetical mean value among pa-tients with SND is higher compared to patients who underwent MRND. Occurrence of metastases recu-rrence is significantly more frequent among patients who underwent MRND. Apart from statistical eva-luation, from clinical perspective, this relationship is explained by indications that have been established for SND. Selective dissection has been performed in lower N categories (N0 and N1 nodes), and rarely in N2 category, while radical dissections have been performed in N2 and N3 node categories. As a rule, the rates of control of regional malignant disease with SND are comparable to rates of control with MRND, with adherence to indications for MRND.
In our study, the estimate of patient survival with purpose of validation of SND was not in focus, as survival is more complex issue, as previously menti-oned. In our study, as well as in numerous other stu-dies, the validation of SND was based on recurrence of metastases that occur after surgery, as occurrence of metastatic recurrence is a confirmation of uncon-

Vers
ion fo
r revie
w
HealthMED - Volume 6 / Number 6 / 2012
Journal of Society for development in new net environment in B&H 2125
trolled local/regional disease. Therefore, there are few studies that evaluate treatment results, but are more based on evaluation of recurrence of metasta-ses. Many authors compared outcomes of SND and MRND and found three-year survival rate of 74% for SND compared to 63% for MRND group18,19,20,21.
We went further in evaluation of SND value by analyzing five-year survival of patients by several parameters, and opposed to MRND. The probabi-lity of survival has been analyzed for all patients, with regards to type of surgery that was performed. It has been observed that the probability of survival for each one-year period was higher for SND, com-pared to MRND. The survival was significantly higher among patients who underwent SND. In pa-tients with N0 neck and selective neck dissection, probability of five-year survival was 49%.
All these parameters favor SND over MRND, but the fact that window of indications for selective dissections is limited to N0 and N1 node category cannot be overlooked. From statistical perspective, SND is more efficient in control of node-negative and node-positive neck, as recurrence is two ti-mes less frequent compared to MRND. However, clinical judgment is required apart from statistical analysis, as it is known that SND is performed in lower N categories (N0 and N1), and rarely in N2 category, while MRND are predominately reserved for N2, and possibly N3 node categories.
References
1. Crile G. Excision of cancer of the head and neck. JAMA 1906;47:1780-1786.
2. Bocca E. Functional problems connected with bilateral radical neck dissection.Laryngol. Otol. 1953; 67:567.
3. Pietrantoni L, Lenardelli G, Batezzatti M. i sar. La lymphadenographie du cou dans neoplasies du larynx. J Franc ORL 1960;9:60-68.
4. Martin H. Treatment of cervical metastatic cancer. Ann. Surg. 1941;114: 985.
5. Bocca E, Pignataro O, Oldini C,Cappa C. Functional neck dissection: an evaluation and review of 843 ca-ses. Laryngoscope 1984;94:942-945.
6. Byers RM.Neck dissection: concepts, controversies, and technique. Semin Surg Oncol 1991;7:9-13.
7. Gavilan J, Herranz J, DeSanto LW, Gavilan C. Fun-ctional and Selective Neck Dissection. Thieme, New York, 2002
8. Cheng PT,Hao SP,Lin YH,Yeh AR.Objective comparison of shoulder dysfunction after three neck dissection tech-niques.Ann Otol Rhinol Laryngol 2000;109:761-766.
9. Shah JP. Patterns of cervical lymph node metastasis from squamous carcinomas of the upper aerocligesti-ve tract. Am J Surg 1990;160:405-409.
10. Ferlito A, Devaney KO, Devaney SL, Rinaldo A.What is the incidence of occult metastases in pa-tients with stage N0 cancers of the head and neck?. ORL 2001;63:1-5.
11. Friedman M,Lim JW,Dickey W,Tanyeri H, Kirshe-nbaum GL, Phadke DM, Caldarel HD. Quantifi-cation of lymph nodes in selective neck dissection. Laryngoscope 1999;09:368-370.
12. Kumar AP, Ashok KD, Ritu A, at al. Selective neck dissection (I-III) for node negative and positive necks. Oral oncology 2006;42:837-841.
13. Buckley JG, Feber T. Surgical treatment of cervical node metastases from squamous carcinoma of the upper aerodigestive tract:evaluation of the eviden-ce for modifications of neck dissection. Head Neck 2001;23:907-915.
14. Andersen PE, Warren F, Spiro J, Burningham A, Wong R, Wax MK, Shah JP, Cohen JI.Results of Se-lective Neck Dissection in Management of the Node - Positive Neck, Arch.Otolaryngol. Head and Neck Surg. 2002;Vol 128.
15. Kowalski LP,Medina JE. Nodal metastases; predictive factors. Otolaryngol Clin North Am 1998;31:621-637.
16. Byers RM. Modified neck dissection. A study of 967 ca-ses from 1970 to 1980. Am J Surg 1985;150:414-421.
17. Lodder WL, Sewnaik A, den Baker MA, Meeuwis CA,Kerrebijin JDF.Selective neck dissection for N0 and N1 oral cavity and oropharyngeal cancer:are skip metastases a real denger?Clin Otolaryngol 2008;33:450-457.
18. Khafif RA, Gelbifsh GA,Asase DK,Tepper P,Attie JN.Modified radical neck dissection in cancer of the mouth,pharynx,and larynx.Head Neck 1990; 12: 476-482.
19. Muzaffar K.Therapeutic selective neck dissection:a 25-year review. Laryngoscope 2003;113:1460-5.
20. Peter JFM, Lohuis W, Martin C Klop, Bing Tan,at al. Effectivness of therapeutic (N1,N2) selective neck dissection (levels II to V) in patients with laryngeal anf hypopharyngeal squamous cell carcinoma.The American Journal of Surgery 2004;187:295-299.
21. Simental A, Duvvuri U,Johnson J, Myers E.Selective neck dissection in patients with upper aerodigestive tract cancer with clinically positive nodal disease. Annals of Otology, Rhinology&Laryngology 2006; 115: 846-849.
Corresponding Author Aleksandar Trivic, Clinic for Otorhinolaryngology and Maxillofacial
Surgery, Clinical Center of Serbia, Belgrade School of Medicine, Serbia, E-mail: [email protected]

Vers
ion fo
r revie
w
2126
HealthMED - Volume 6 / Number 6 / 2012
Journal of Society for development in new net environment in B&H
Abstract
Introduction: Lung Cancer has a great impact on different aspects of quality of life of patients who are diagnosed with such cancer; therefore, conducting research on such patient’s quality of life is essential. In this study we will examine the effects of lung cancer on quality of life of patients who are diagnosed with this cancer and propose a suitable questionnaire for the purpose of determining vario-us scopes of quality of life of patients as well as the validity and reliability of such questionnaire.
Objective: The aim of this study is to investi-gation of validity and reliability of lung cancer quality of life from European Organization for Research and Treatment of Cancer (EORTC QLQ – LC13) in Iran.
Method: 75 lung cancer patients admitted to hospitals in Iran cancer Institute of Tehran Uni-versity of medical science and Masih daneshvari hospital were chosen by nonrandom sampling. Demographic questionnaire EORTC QLQ – LC13 and EORTC QLQ – C30 were completed by the questioner. Descriptive data by frequency tables were analyzed and content validity we used tran-slation for translating and internal consistencies were measured by the Cranach’s α coefficient.
Results: total Cranach’s α coefficient (The re-liability or internal consistency) was 0.720. spe-arman correlation coefficient of symptom and side effect subscale was 0.0601 not showed any overlap between questions of these subscales and the high measure of spearman rank correlation between symptom subscale and its questions was in the range of357/0 -0 754/and side effect subsca-
le and its questions was0.366 0.708, that indicated subscales of LC13 have significant correlation.
Conclusion: In general, the findings of this study indicated that the Iranian version of the EORTC QLQ-LC13 is a reliable and valid supple-mentary measure of the quality of life in lung can-cer patients and can be used in clinical trials and studies of outcome research in oncology.
Key words: validity, reliability, lung cancer, qu-ality of life, (EORTC QLQ LC13) questionnaire
Introduction
Lung cancer is one of the most frequent cancers among Iranian men and women patients1. There is a debate around the treatment of lung cancer as to which treatment modality should be administered and until what point in the evolution of the disease2. One of treatment approach for these patients is palli-ative treatment. quality of life is a major considera-tion in this context and the adequate evaluation of the quality of life is therefore an essential endpoint3.
Different purposes for assessing quality of life have led to the development and use of much di-fferent generic and disease-specific measures4. More than 50 instruments measuring quality of life (QOL) for patients suffering from lung cancer emerged from 1970 to 1995 [3]. The Lung Cancer Symptom Scale (LCSS), Functional Assessment of Cancer Therapy-Lung (FACT-L) and the Eu-ropean Organization for Research and Treatment of Cancer Quality of Life Questionnaire Core-30 (EORTC QLQ-C30) with Quality of Life Questi-onnaire Lung Cancer-13 (QLQ-LC13) have good reliability and validity5.
Investigation of validity and reliability of lung cancer quality of life from European Organization for Research and Treatment of Cancer (EORTC QLQ – LC13) in IranKarbasi Motlagh M.1, Anjedani E.3, Zamanian H.2, Fathollahbeigy F.1, Kiayee N.3, Aghaei Meibodi F.3, Beheshtee M.1
1 Student Scientific Research Center of Tehran University of Medical Science, Tehran, Iran,2 Qom University of Medical Science, Qom, Iran,3 Tehran University, Tehran, Iran.

Vers
ion fo
r revie
w
HealthMED - Volume 6 / Number 6 / 2012
Journal of Society for development in new net environment in B&H 2127
The European Organization for Research and Treatment of Cancer (EORTC) is one of the largest clinical trial groups in Europe that has developed a core cancer-specific quality of life questionnaire (known as the EORTC QLQ-C30) and a number of supplementary questionnaire modules to evalu-ate the quality of life in cancer patients in general and specific cancer patient populations in particular. This modules are include: breast, head and neck, lung and others. the EORTC QLQ-C306 and the EORTC QLQ-BR234 are translated in to Persian and validated in Iranian population. We decided to translate in to Persian the lung cancer supplemen-tary (QLQ-LC13) of EORTC QLQ-C30 and vali-date this instrument in Iranian patients population.
The QLQ-LC13 is contains 13 questions to measure one symptom scale (dyspnea) and nine single symptom items. A previous study demon-strated good internal consistency for the dyspnea scale and good clinical validity for most scores7.
Under the guidance of the EORTC Quality of Life Group, and following their written guidelines8, we have performed the translation and cross-cultural adaptation of the lung cancer module (QLQ-LC13). The forward/backward translation process was pro-vided by the EORTC and the cross-cultural adaptati-on was performed by pilot-testing and by structured interviews. The purpose of this study was the vali-dation of the Persian version of the QLQLC13, in order to allow Iranian investigators to use this tool both in clinical trials and in clinical practice.
Material and Method
75 lung cancer Patients were recruited from the hospitals of medical science university of Tehran. Patients were included if they had a pathologic di-agnosis of lung cancer and were candidate for ra-diotherapy or chemotherapy. They were excluded if they have psychological or physical diseases. Patients completed written consent, the EORTC core questionnaire QLQ-C30 (version 2.0) and the lung cancer module QLQ-LC13 in an interview that was performed by one of the authors.
The QLQ-LC13 questionnaire consists of 13 items assessing lung cancer-associated symptoms (cough, haemoptysis, dyspnoea and site specific pain), treatment-related side effects (sore mouth, dysphagia, peripheral neuropathy and alopecia) and
pain medication. All items employed a 1-week time frame and were scored on a 4-point categorical scale ranging from1 to 4. All responses are linearly tran-sformed to a 0 to 100 scale, according to the scoring manual provided by the EORTC, with higher scores representing increasing symptom levels9.
According to EORTC guidelines, two native spe-akers of the language of translation (Persian) who have a high level of fluency in English indepen-dently translated the questionnaire into the required language. The person responsible for coordinating the translation process compared the translations. This process resulted in a single provisional forward translation. In back translation phase two translators, native English speakers with a high level of fluency in language Persian independently translated the re-levant sections from the provisional forward transla-tion back into English without reference to the En-glish original. The person coordinating the translati-on process compared the English translations with the original questionnaire. Then Pilot-testing consist of Administering the translated questionnaire was carried out on 10 patients belonging to the target po-pulation, and afterwards structured interviews with each patient individually was conducted.
Reports of the translation process and pilot-te-sting of EORTC QLQ-C30 were sent to Transla-tion Coordinator, QL Unit, to be reviewed. Where the Translation Coordinator has concerns about the translations these may be discussed with the Chair of the Module Development Committee. The final Persian version of the EORTC QLQ-C30 and QLQ-LC13 was administered on 65 lung cancer patients.
Statistical analysisA range of analyses has been performed. We
have studied the frequencies of the demographic and clinical variables, and the Quality of Life sco-res. The reliability or internal consistency of The QLQ-LC13 questionnaire was measured by the Cronbach’s a coefficient. Correlation analysis was performed to evaluate the construct validity.
Results
Patients (n= 65) averaged 53.09 years of age (SD = 15.33 years), included more men (73.3 %) than women (26.7 %), more married (90.7 %) than single (9.3 %), had the more number with

Vers
ion fo
r revie
w
2128
HealthMED - Volume 6 / Number 6 / 2012
Journal of Society for development in new net environment in B&H
less than a high school education (74.6 %) and with a high school education or better (25.4), spo-ke mostly Persian (44 %) or Turkish (33 %), had tobacco use (56 %), had squamous cell carcinoma or Hodgkin's Disease and Non-Hodgkin's Lymp-homa, and had chemotherapy (89.3 %) or surgery (10.7), degree of malignancy was more 2 (46.6%) than 3(25.9%), 1(15.5%) or 4(12.1).
The reliability, or internal consistency, of side effects and symptom scales is presented in Table 1. The Cronbach’s a coefficient of scales was accep-table. Correlation analysis result is performed to show convergent validity. As table 2 shows two scales and their items are correlated. The result of discriminate validity is presented in table 3. The discriminate validity of side effects and symptom scales is acceptable. Table 1. Reliability the EORTC QLQ-LC13
Internal consistency(All patients, N = 65)
Number of items
qlq-lc13 0.720 12Symptom scale 0.823 8
Side effects 0.701 4
Table 2. Convergent validity of the EORTC QLQ-LC13
Symptom scales Symptom scales Side effects1 .385(**) -.2072 .357(**) -.1333 .530(**) 0.0484 .754(**) 0.1095 .635(**) 0.15510 .654(**) 0.6811 .405(**) 0.233(*)12 .459(**) 0.004
Side effects6 -.202 .366(**)7 0.269(*) .563(**)8 0.249(*) .407(**)9 -0.205 .708(**)
Table 3. Discriminate validity of the EORTC QLQ-LC13
Symptom scales Side effects Symptom scales 1 0.061
Side effects 0.061 1
Discussion
Montazeri and his colleagues9 for the first time have introduced a quality of life instrument to he-alth professionals in Iran.
In this paper we present the results of a quality of life study carried out with a sample of Iranian lung cancer patients at different stages of disease. The demographic and clinical data of the sample are representative of lung cancer patients in our study. Despite the fact that this questionnaire ori-ginally was developed in Europe and our sample was culturally different population, The Iranian version of QLQ-LC13 was translated successfully and it was well accepted. The application was qu-ick and easy to perform, confirming the usefulness of the scale.
The data were collected by interview and it took 10 min to perform each interview. There were not any incomplete questionnaires or missing in-formation.
The internal consistency as assessed by Cronbach's a coefficient was found to be reliable. Correlation analysis result showed convergent va-lidity and the discriminate validity of subscales was acceptable.
The reliability and validity of the Iranian ver-sion of QLQ-LC13 could be demonstrated in this study, but additional work is needed to assess the self-administered approach and t its psychometric properties.
The validation of this important instrument will allow Iranian investigators to perform research projects, and to assess the quality of life of patients with lung cancer in clinical practice.
Conclusion
This study showed that the QOL-lc13 is a valid and reliable instrument that may be of potential re-search use as a specific questionnaire for assessing the QOL of Iranian patients with lung cancer.

Vers
ion fo
r revie
w
HealthMED - Volume 6 / Number 6 / 2012
Journal of Society for development in new net environment in B&H 2129
References
1. Masoompour SM, Yarmohammadi H, Rezaianzadeh A, Lankarani KB: Cancer incidence in southern Iran, 1998-2002: Results of population-based cancer regi-stry. Cancer Epidemiol, 2011, 35: e42-e47.
2. Arraras Urdaniz JA, Martinez Aguillo M, Manterola burgaleta A, et al. Quality of life assessment in Spa-nish lung cancer patients by the EORTC questionnai-res, 2005. Oncología, 28 (4):174-182
3. Barbo EP, Paschoal MEM, Biasoli I, et al. Brazilian version of the QLQ-LC13 lung cancer module of the European Organization for Research and Treatment of Cancer: preliminary reliability and validity report, 2006. Quality of Life Research 15:1519–1524
4. Montazeri A, Harirchi I, Vahdani M, et al. The EORTC breast cancer-specific quality of life questio-nnaire (EORTC QLQ-BR23): Translation and valida-tion study of the Iranian version, 2000. Quality of Life Research 9: 177-184
5. Chie W, Yang C, Hsu C & Yang P. Quality of life of lung cancer patients: Validation of the Taiwan Chine-se version of the EORTC QLQ-C30 and QLQ-LC13, Quality of Life Research 13: 257–262.
6. Montazeri A, Harirchi I, Vahdani M, et al. The Eu-ropean Organization for research and Treatment of Cancer Quality of Life Questionnaire (EORTC QLQ-C30): translation and validation study of the Iranian version, 1999. Support Care Cancer. 7: 400-406.
7. Bergman B, Aaronson NK, Ahmedzai S, et al. The EORTC QLQ-C13: A modular supplement to the EORTC Core Quality of Life Questionnaire (QLQ-C30) for use in lung cancer clinical trials, 1994. Eur J Cancer, 30A: 635–642.
8. Dewolf L, Koller M, Velikova G, et al. EORTC Quality of Life Group Translation Procedure, 2009. 3rd edition.
9. Lung Cancer Module: QLQ-LC13. In EORTC Quali-ty of Life Group. EORTC QLQ-C30 Scoring Manual, 1999. 2rd edition.
Corresponding Author Fateme Aghaei Meibodi, Tehran University, Tehran, Iran, E-mail: [email protected]

Vers
ion fo
r revie
w
2130
HealthMED - Volume 6 / Number 6 / 2012
Journal of Society for development in new net environment in B&H
Abstract
This article presents the preliminary experi-ences from an ongoing study aiming to develop multidisciplinary rehabilitation programme for women who undergo surgery, radiotherapy and systemic therapy for breast carcinoma.
The role of health care in oncological rehabili-tation is to improve the outcomes, identifying the patients at risk, by implemantation of interventi-ons with provision of monitoring and evaluation.
Principles of modern health care during onco-logical rehabilitation of patients are: directivity towards the users-patient, safety, efficacy, timely activities and efficiency.
Key words: health care, breast carcinoma, on-cological rehabilitation
Introduction
Tendency to provide good quality treatment and care of patients and to achieve the most favo-rable outcome and a high quality of life is as the medicine itself. The first law regarding oncologi-cal patient’s rehabilitation was passed by the USA Congress in 1965, which emphasized the necessity of rehabilitation in oncology due to risk of functi-onal complications. However, organized efforts in establishing implementation and improvement of helath care and oncological rehabilitation system in our country are of a later date.
Oncological rehabilitation is a process of establis-hing of maximally possible physical, psychosocial, professional, economic, recreational and nutritive functions within the frameworks which are conditio-ned by the malignant disease and/or its therapy (1,2).
The basic idea of oncological rehabilitation is a complete or maximally possible independence in everyday life activities, which implies the highest possible quality of life. Health care in oncologi-
cal rehabilitation is focused to prevention and/or reduction of the damage and handicap levels, re-gardless etiology or the anticipated survival (1,2).
Basic request, which is presented by imple-mentation of four principles: - Academic education- the changes in educational
system of medical nurses and the foundation of academic studies of health care at the Faculty of Medicine in Novi Sad, enabled academic level of education for medical nurses in our country as well;
- Partnership-establishing of mutually useful relationships within the multidisciplinary team with respect to basic communication principles;
- Orientation towards the goals of health care-all processes, activities and interventiones are directed towards the improvement of functionaly capability of the patient;
- Holistic approach- trinity of the body, mind and the surroundings (3).
Health care principles in oncological patientsHealth care in rehabilitation of oncological pa-
tients provides knowledge and skills which have a goal to prevent or support the restitution of a fun-ction and independence when oncological patients experience problems caused by any of the disorders related to the primary disease and/or therapy, which impact the locomotor system and/or incapability, which is the consequence of such disorder.
Principles of modern health care during onco-logical rehabilitation of patients are: 1. Directivity towards the users-patient: a health
care plan is created in accordance with specific needs of oncological patient who participates in planning, analysis and implementation of her rehabilitation treatment;
2. Safety: all health care activities and interventions are planned and realized within the system, where the patient’s safety is of primary importance, and
Health care and rehabilitation in breast cancer patientsSanja Tomic¹, ², Svetlana Popovic-Petrovic¹, ², Dragana Milutinovic², Vasa Petrovic³
¹ Oncology Institute of Vojvodina- Rehabilitation Department, Sremska Kamenica, Serbia,² Faculty of Medicine Novi Sad, Serbia,³ Healt Center “Dr Milorad Mika Pavlović“ Indjija, Serbia.

Vers
ion fo
r revie
w
HealthMED - Volume 6 / Number 6 / 2012
Journal of Society for development in new net environment in B&H 2131
a potential danger to hurt the patient during the health care process is reduced to minimum;
3. Efficacy: defines the organized, individu-alized and goal oriented way to help the patient to solve or reduce functional problems, to maintain or improve health and prevent any possible new health problem in accordance with the remained potential;
4. Timely activities: an appropriate health care was rendered when the need for its rendering was recognized;
5. Efficiency: implies that the resources are used in a way and in the environment, which provide strategy selection with the aim of minimization and/or correction of patient’s functional limitations (3-5).
Identification of risks for occurence of functional complications in breast carcinomaAs the breast carcinoma is not a single trau-
ma, but a long-term multiple trauma with stressor, varying in its intensity and nature, health care, du-ring the process of rehabilitation, is divided into several phases:
- From the moment of malignant breast neoplasm diagnosis;
- During the therapy: surgery, radiotherapy, systemic therapy (chemotherapy, immuno-therapy and hormonotherapy);
- During the post-therapeutic period; - During the patients’ follow-up.
From the aspect of health care, as a consequence of complexity of medical therapy and its invasive-ness, each of therapy modalities bears the risk for possible functional damages and/ or limitations, psychological, social and professional problems, which leads to reduced independence in performan-ce of everyday life activities, i.e. impacts the quality of life of breast carcinoma patients (6-9).
Health care algorithm in breast carcinoma pati-ents implemented at the Rehabilitation Department of the Oncology Institute of Vojvodina is based on applicability of five basic health process elements. From the moment of diagnosis, during the therapy and after the completion of the breast carcinoma therapy, the role of health care is to discover the ri-sks, which may directly or indirectly influence the functional status of the patients (Table 1).
Recognized risks in various treatment phases of breast carcinoma patients are directed or indi-rected contributory factors for occurrence of fun-ctional complications. Prevention includes prethe-rapeutic patient’s status evaluation, while therape-utic approach during rehabilitation has preventive, restitutive, supportive and palliative character by diagnostics and grading of possible risks, using a specifically designed scoring system and imple-menting appropriate health care interventions.
The role of health care in oncological rehabili-tation is to improve the outcomes, identifying the patients at risk, by implementation of interventi-ons with provision of monitoring and evaluation. The results of oncological rehabilitation activities in breast carcinoma are visible during the therapy, and the success of introduced health care measu-res is characterized by the preserved quality of life and working capability of the individual and re-duction of health protection costs (10-14).
More than 2000 years ago, a Greek physician Herophilus wrote: “Without health, art is worthless, force is weak, fortune useless and eloquence feeble”.
References1. Popović- Petrović S. Oncological rehabilitation. In.
Jovanović D. Editor. Bases of oncology and palliative care of oncologic patients.(in Serbian). Novi Sad, Fa-culty of Medicine, 2008; p.376-82.
2. Popović-Petrović S. Risk factors for development of the secondary lymphedema of the arm in malignant breast tumors.( Dissertation). Novi Sad, Faculty of Medicine 2008 (in Serbian).
3. Joyce P, Cowman S. Continuing professional deve-lopment: investment or expectation ? J Nurs Manag 2007; 15:626-33.
4. Hallin K, Danielsone E. Registered Nurses’perceptions of their work and professional development. J Adv Nurs 2008;61(1):62-70.
5. Bartels J. Educating nurses for the 21st centry. Nurs Health Sci 2005;7:221-5.
6. Moradi T, Adami HO,Ekbom A, Wedren S, Terry P, Floderus B, Lichtenstein P. Physical activity and risk for breast cancer a prospective cohort study among Swedish twins. Int J Cancer 2002 1;100(1):76-81.
7. Breslow RA, Ballard- Barbash R, Munoz K, Graubard BI. Long –term recreational physical activity and bre-ast cancer in the National Healt and Nutrition Exa-mination Survey and epidemiologic follow- up study. Cancer Epidemiol Biomarkers Prev 2001;10(7):805-8.
8. Borg T. Conduct of life in everyday during rehabilita-tion-a social-psyhological study.. (Dissertation). The University of Aarhus, Denmark 2002

Vers
ion fo
r revie
w
2132
HealthMED - Volume 6 / Number 6 / 2012
Journal of Society for development in new net environment in B&H
Table 1. Possible risks for occurence of functional complications in breast carcinoma in certain phases of the disease regarding health care - our experiencesDIAGNOSIS 1. Problem of facing the diagnosis.
2. Problem of available resources/potentials of a person: - physical: lung and heart function, muscle mass, mobility, etc. - psycho-social: inadequate adaptation, social interaction and communication disorder, avilable time, family relations, friends’support, financial conditions, etc. - person’s characteristics: age, personal goals, self-perception, etc.3. Existing functional damages/limitations-reduced independence in performance of everyday life activities, deficit in selfcare.
SURGERY 1. Type of surgical intervention and the spread of the malignant neoplasm.2. Possible functional damages during the surgery and during the postoperative period: rigidity and fibrosis of the chest wall as a consequence of the disturbed lymphatic and venous drainage, infection, edema, etc.3. Reduced mobility, comfort disorder.4. Awareness of the planned intervention by the patient and the members of her family.5. Expected end result.6. Pain.7. Problem of patient’s and family’s readiness for education.
CHEMOTHERAPY 1. High risk for skin integrity damage.2. Inadequate drug administration.3. Extravasation, inflitration, phlebitis during peripheral antineoplastic cannulation.4. Accompanying side effects in antineoplastic administration: weakness, nausea, skin and mucous membrane changes, exhaustion, etc.5. Sensor perception disorder (visual, tactile, kinesthetic).6. Polyneuropathy, ataxia.7. Insufficient knowledge on chemotherapy by the patient and her family members.
RADIOTHERAPY 1. Skin integrity damage (dry/wet desquamation).2. Reduced effort tolerance.3. High risk of late complications: brachial plexus damage, limited mobility, secondary lymphedema of the arm, etc.
POST-THERAPYPERIOD
1. Absence of regular physiatrist’s examination. 2. Non-abidance of recommendations at home, non-cooperation of the patient and family.3. Insufficient education at the primary and the secondary health protection levels.4. Problem of rehabilitation organization at home.5. Accompanying diseases.6. Disease progression.
9. Kopanski Z, Wojewoda T, Wojewoda A, Schlegel- Zawad-zka M, Wozniacka R, Suder A, Kosciuk T. Influence of some anthropometric parameters on the risk of development of distal complications after mastectomy carried out because of breast carcinoma. Am J Hum Biol 2003;15(3):433-9.
10. Husic S, Ljuca F, Hasukic S, Mesic D. Quality of life after mastectomy of the breast cancer. HealthMED 2009;3(3);254-61.
11. Tunkel SR, Lachmann E, Boland JP,HO LM. Physi-cal Rehabilitation. In: de Vita W, Hellman S, Rose-nberg S. Cancer: Principles and Practices of Onco-logy.VI ed. Baltimore, Lippincot, Williams and Will-kins 2000;2191-224.
12. Cerhan JR,Chiu BC-H,Wallace RB, Lemke JH, Lyn-ch CF, Torner JC, Rubenstein LM..Physical activity, physical function, and the risk of breast cancer in a
prospective study among elderly women.. J Gerontol A Biol Sci Med Sci 1998;53(4):m251-m256.
13. Herd-Smith A,Russo A,Muraca MG, Del Turco MR, Cardona G.. Prognostic factors for lymphedema after primary treatment of breast carcinoma. Cancer 2001; 92: 1783-7.
14. Tomić S. Health care in rehabilitation of malignant breast tumor patiens.(Master paper). Novi Sad, Fa-culty of Medicine, 2009 (in Serbian).
Corresponding Author Sanja Tomic, Oncology Institute of Vojvodina, Rehabilitation Department, Sremska Kamenica, Serbia, E-mail: [email protected]

Vers
ion fo
r revie
w
HealthMED - Volume 6 / Number 6 / 2012
Journal of Society for development in new net environment in B&H 2133
Abstract
Epithelial ovarian cancer (EOC) is a heterogene-ous disease. It has been shown that the expression of Wilms tumor gene (WT1) protein was different among the various EOC subtypes. The aims of this study were to determine the expression of WT1 pro-tein in EOCs and to compare WT1 protein expre-ssion with EOC subtype, histological grade, and the International Federation of Gynecology and Obstetrics (FIGO) stage. This retrospective study was conducted in 102 patients with EOCs who underwent debulking surgery. The standard histo-logical sections were used to assess pathologic pa-rameters. Expression of WT1 protein in the tumor specimens was immunohistochemically analyzed by using monoclonal anti-WT1 antibody. The mean age of EOC patients was 61.2 ± 12.5 years (range 23-74 years). The most EOC patients had serous carcinomas (76,47%), histological grade 3 tumors (70,59%) and FIGO stage III disease (78,43%). Expression of WT1 protein was found in 80,39% of EOC specimens. The predominant expression pattern was homogenous, which was observed in 66,67% of WT1 positive EOC specimens. Expressi-on of WT1 protein was significantly associated with serous subtype (p<0.001), higher histological gra-de (p<0.001) and advanced EOC stage (p<0.001). In conclusion, results of this study suggest that the expression of WT1 protein may be a marker of bio-logical aggressiveness of EOCs.
Key words: Epithelial ovarian cancer, immu-nohistochemistry, Wilms tumor gene
Introduction
Epithelial ovarian cancer (EOC) behaves more aggressively than any other cancer involving the fe-male genital tract and is the leading cause of death from gynecological malignancies in Western co-untries (1-4). The main prognostic factor for EOC
patients is the International Federation of Gyneco-logy and Obstetrics (FIGO) stage (3). Patients with FIGO stage I EOCs have a 5-year survival of more than 80%, while patients with FIGO stage IV EOCs have a 5-year survival of 18,6% (5). Unfortunately, approximately 70-75% of patients with EOCs have tumors spread beyond the pelvis (FIGO stage III or IV) at the time of diagnosis (2).
EOC is a heterogeneous disease. Currently, it is classified into eight distinct histological subtypes: serous, endometrioid, mucinous, clear cell, transi-tional cell, squamous cell, mixed epithelial and un-differentiated (2). It is a generally accepted opinion that the expression of a single or multiple oncoge-nes and subsequent activation of cell proliferation contribute to neoplastic transformation, tumorige-nicity, and tumor progression. Such oncogenes and oncogene products may be of a clinical utility as prognostic factors or as therapeutic targets.
Wilms tumor gene (WT1) is mapped to chro-mosome 11p13 (6). WT1 was initially defined as a tumor suppressor gene, but today it is considered capable of performing oncogenic functions (7, 8). In the studies describing WT1 expression in ovarian cancer, there seem to be differences in expression pa-tterns among different histological subtypes (9-13). A positive expression of WT1 has mainly been asso-ciated with ovarian serous carcinoma (9-16). Several studies have shown that WT1 plays an important role in the progression of the disease and prognosis of human malignancy (17-21). Recently, a study from Thailand examining the correlation between WT1 tumor tissue expression and survival has found WT1 to be indicative of an unfavorable prognosis in pati-ents with advanced ovarian serous carcinoma (22).
Aims
The aims of this study were to determine the expression of WT1 protein in EOCs and to com-
Wilms tumor gene (WT1) protein expression in epithelial ovarian cancerBiljana Djordjevic1, Predrag Vukomanovic2, Simonida Stojanovic1, Ljubinka Jankovic Velickovic1
1 University of Nis, Faculty of Medicine, Institute of Pathology, Serbia,2 University of Nis, Faculty of Medicine, Clinic of Gynecology and Obstetrics, Serbia.

Vers
ion fo
r revie
w
2134
HealthMED - Volume 6 / Number 6 / 2012
Journal of Society for development in new net environment in B&H
pare WT1 protein expression with EOC subtype, histological grade, and FIGO stage.
Patients and methods
A retrospective study was conducted in 102 pa-tients with EOCs who underwent debulking sur-gery at the Clinic of Gynecology and Obstetrics in Nis between January 2005 and December 2010.
Histopathological analysis of routinely proce-ssed tumor specimens stained with standard hema-toxylin-eosin method and immunohistochemical analysis of WT1 were done at the Institute of Patho-logy, Faculty of Medicine, University of Nis. All the cases of EOCs were classified according to WHO criteria (2). Histological grade and stage of EOCs were determined according to FIGO criteria (5).
For WT1 protein detection, a monoclonal anti-WT1 antibody (clone 6F-H2, Dako) at a dilution of 1:100 and a standard avidin-biotin immunope-roxidase complexes detection system according to the manufacturer's protocol (Dako LSAB2R system-HRP) were used. The chromogen was 3,3'-diaminobenzidine (DAB), and the slides were lightly counterstained with Mayer hematoxylin (Merck, Germany).
Evaluation of WT1 protein expression was ba-sed on the proportion of cells in a given tumor tissue sample exhibiting distinct nuclear immunopositivi-ty. The extent of immunohistochemical reactivity was scored as follows: 0 (<5% of the nuclei were stained), 1+ (5-25% of the nuclei were stained), 2+ (>25-50% of the nuclei were stained), 3+ (>50-75% of the nuclei were stained), and 4+ (>75% of the nuclei were stained). Two observers (BD and LJV) assessed WT1 staining pattern of each sam-ple. Standardization of scoring was achieved by comparing the scores between observers, and any discrepancies were resolved by consensus.
The statistical analysis was performed by using Excel 2000 and Statcal. The results were presen-ted as average, standard deviation, interval of va-riation (minimum-maximum) and index of struc-ture (%). Chi-square test was used for the evalua-tion of significance of determined differences for attributive features. Differences were considered statistically significant at p < 0,05.
Results
The characteristics of study population are shown in Table 1. A total of 102 patients with EOCs were examined. The mean age of EOC patients was 61,2 ± 12,5 years (range 23-74 years). Histopatho-logical analysis showed that the vast majority of pa-tients (76,47%, 78/102) had ovarian serous carcino-mas, while 23,53% (24/102) of patients had other EOC subtypes (6,86% clear cell, 5,88% endometri-oid, 4,91% mucinous, 2,94% mixed and 2,94% un-differentiated). Also, the majority of EOC patients (70,59%, 72/102) had histological grade 3 tumors. Six (5,88%) cases were classified as histological grade 1 and 24 (23,53%) cases as histological grade 2 tumors. Advanced EOCs (FIGO stage III) were found in 78,43% (80/102) of patients. From a total of 102 patients with EOCs, 8 (7,84%) patients had FIGO stage I and 14 (13,73%) patients had FIGO stage II desase.
Immunohistochemical analysis showed positi-ve nuclear expression of WT1 protein in 80,39% (82/102) of EOC specimens (Table 2). Heteroge-nous (1+ and 2+) expression of WT1 protein was found in 13,72% (14/102), and homogenous (3+ and 4+) in 66,67% (68/102) of EOC specimens (Figures 1a-d, Table 2).Table 1. Characteristics of study population
Characteristics N (%)Number of patients 102Age
Mean age (SD), years 61.2 (12.5)Range, years 23-74
Tumor subtypeSerous 78 (76.47)Clear cell 7 (6.86)Endometrioid 6 (5.88)Mucinous 5 (4.91)Mixed 3 (2.94)Undifferentiated 3 (2.94)
Histological gradeGrade 1 6 (5.88)Grade 2 24 (23.53)Grade 3 72 (70.59)
FIGO stageStage I 8 (7.84)Stage II 14 (13.73)Stage III 80 (78.43)

Vers
ion fo
r revie
w
HealthMED - Volume 6 / Number 6 / 2012
Journal of Society for development in new net environment in B&H 2135
a)1+
b)2+
c)3+
d)4+Figures 1a-c. WT1 expression in ovarian serous carcinomas showing heterogenous (a, 1+ and b, 2+) or homogenous (c, 3+ and d, 4+) nuclear immunoreactivity patterns (IH, x40)
Table 3 shows the results of comparisons of WT1 expression with tumor subtype, histological grade and FIGO stage in EOC patients. Positive WT1 protein immunoreactivity was determined in 94,87% of patients with ovarian serous carcino-mas and was significantly more frequent in pati-ents with ovarian serous carcinomas than in those with other EOC subtypes (clear cell, endometrioid, mucinous, mixed and undifferentiated) (p<0,001). WT1 positive EOC specimens had a higher histo-logical grade of tumors then WT1 negative EOC specimens (p<0,001). In addition, there was in-creased frequency of WT1 expressing tumors in patients with advanced EOC stage (FIGO stage III) compared with patients with early EOC stages (FIGO stage I or II) (p<0,001).
Discussion
Nonspecific symptoms, frequent diagnosis of advanced disease, and the presence of drug-resi-stant histological subtypes limit the long-term cure rates and prognosis for EOC, thereby making this cancer the most lethal gynecologic malignancy.
In contrast to the most of other solid tumors, about 70-75% of EOC patients reveal in the ad-vanced stages of disease (FIGO stage III or IV) (2) According to the data, approximately 50% of all ovarian carcinomas and 90% of advanced ova-

Vers
ion fo
r revie
w
2136
HealthMED - Volume 6 / Number 6 / 2012
Journal of Society for development in new net environment in B&H
rian carcinomas (FIGO stage III or IV) are serous carcinomas (3, 23, 24).
In this study, the most EOC patients had serous carcinomas (76,47%), histological grade 3 tumors (70,59%) and FIGO stage III disease (78,43%).
Also, positive nuclear expression of WT1 pro-tein was determined in 80,39% of EOC speci-mens. The predominant WT1 protein expression pattern was homogenous, occurring in 66,67% of WT1 positive tumor specimens, while 13,72% demonstrated heterogenous staining. Frequent expression of WT1 protein in epithelial ovarian tumors was reported in several studies (7, 11-15).
In current study, positive expression of WT1 protein was observed in 94,87% of ovarian serous carcinomas. Hwang et al. (14) reported positive WT1 expression in 93% of ovarian serous car-cinomas, but not in mucinous, endometrioid and clear cell ovarian carcinomas. This led the authors to conclude that WT1 is a highly sensitive marker of ovarian serous carcinoma and to recommend the inclusion of WT1 in the immunohistochemical
panel for analysis of unknown origin cancer in fe-male patients. In contrast to Hwang et al. (14), we observed positive expression of WT1 protein in a small percentage of ovarian clear cell, endometri-oid, mucinous, mixed and undifferetiated carcino-mas, which is in agreement with several published studies (9, 10, 16, 25).
In this study, WT1 positive EOCs had a hi-gher histological grade and FIGO stage compared to WT1 negative EOCs. Hylander et al. (9) also demonstrated positive correlation between WT1 expression and higher tumor grade and stage, and the lack of a significant correlation with overall survival. The impact of WT1 gene expression on the clinical outcome of ovarian cancer was not de-monstrated by Danish "MALOVA" ovarian can-cer study (25).
Netinatsunthorn et al. (22) divided WT1 posi-tive ovarian serous adenocarcinomas into subgro-ups by the intensity of their immunostaining, and demonstrated that a high intensity of WT1 immu-noreactivity had an independent prognostic value.
Table 2. Pattern of WT1 expression in EOCsHeterogenous (1+ and 2+) Homogenous (3+ and 4+) Total
N (%) N (%) N (%)WT1 negative __ __ 20 (19.61)WT1 positive 14 (13.72) 68 (66.67) 82 (80.39)
Table 3. WT1 protein expression depending on tumor subtype, histological grade and FIGO stage
Parameter TotalN
WT1 expressionChi-square pNegative
N (%)PositiveN (%)
Tumor subtypeSerous 78 4 (5.13) 74 (94.87)Clear cell 7 5 (71.43) 2 (28.57)Endometrioid 6 5 (83.33) 1 (16.67) <0.001Mucinous 5 4 (80.00) 1 (20.00)Mixed 3 1 (33.33) 2 (66.67)Undifferentiated 3 1 (33.33) 2 (66.67)
Histological gradeGrade 1 6 5 (83.33) 1 (16.67)Grade 2 24 6 (25.00) 18 (75.00) <0.001Grade 3 72 9 (12.50) 63 (87.50)
FIGO stageStage I 8 7 (87.50) 1 (12.50)Stage II 14 4 (28.57) 10 (71.43) <0.001Stage III 80 13 (11.25) 71 (88.75)
Total 102 20 (19.61) 82 (80.39)

Vers
ion fo
r revie
w
HealthMED - Volume 6 / Number 6 / 2012
Journal of Society for development in new net environment in B&H 2137
In one multivariate analysis, the prognostic value of the high-level WT1 immunoreactivity was also nearly significant (26). A high level of WT1 im-munoreactivity in high-grade and advanced stage ovarian serous adenocarcinomas may have not only a diagnostic and prognostic value but also a potential for application of antigen-specific immu-notherapy against this highly lethal malignancy.
Conclusion
In conclusion, positive expression of WT1 protein was significantly associated with serous subtype, higher histological grade and advanced EOC stage (FIGO stage III) Expression of WT1 protein may be a marker of biological aggressive-ness of EOCs.
Acknowledgements
This work was supported by a Grant, No 175092, from the Ministry of Science and Techni-cal Development of Serbia.
References
1. Jemal A, Siegel R, Xu J, Ward E. Cancer Statistics, 2010. CA Cancer J Clin 2010; 60(5):277-300.
2. Lee KR, Tavassol FA, Prat J, et al. Tumours of the ovary and peritoneum. In: Tavassol FA, Devilee P, (eds). World Health Organisation classification of tu-mours, Pathology and genetics of the tumours of the breast and female genital organs. Lyon: IARC Press; 2003. pp. 113-203.
3. Seidman JD, Russell P, Kurman RJ. Surface epithelial tumors of the ovary. In: Kurman RJ, (ed). Blaustein's pathology of the female genital tract. 5th edn. New York: Springer-Verlag; 2002. pp. 791-904.
4. Prat J. Pathology of the ovary. Philadelphia: Saun-ders; 2004.
5. Heintz APM, Odicino F, Maisonneuve P, et al. Carci-noma of the ovary. 26th Annual Report on the results of Treatment in Gynecological Cancer. Int J Gynecol Obstet 2006; 95 (Suppl 1):29-42.
6. Bruening W, Gros P, Sato T, et al. Analysis of the 11p13 Wilms' tumor suppressor gene (WT1) in ovar-ian tumors. Cancer Invest 1993; 11(4):393–399.
7. Hastie ND. Wilms' tumour gene and function. Curr Opin Genet Dev 1993; 3(3):408–413.
8. Sugiyama H. Wilms’ tumor gene WT1: its oncogenic function and clinical application. Int J Hematol 2001; 73(2):177–187.
9. Waldstrøm M, Grove A. Immunohistochemical ex-pression of Wilms tumor gene protein in different his-tologic subtypes of ovarian carcinomas. Arch Pathol Lab Med 2005; 129(1):85–88.
10. Hylander B, Repasky E, Shrikant P, et al. Expressi-on of Wilms tumor gene (WT1) in epithelial ovarian cancer. Gynecol Oncol 2006; 101(1):12–17.
11. Shimizu M, Toki T, Takagi Y, Konishi I, Fujii S. Im-munohistochemical detection of the Wilms' tumor gene (WT1) in epithelial ovarian tumors. Int J Gyne-col Pathol 2000; 19(2):158–163.
12. Al-Hussaini M, Stockman A, Foster H, McCluggage WG. WT-1 assists in distinguishing ovarian from uterine serous carcinoma and in distinguishing be-tween serous and endometrioid ovarian carcinoma. Histopathology 2004; 44(2):109–115.
13. Goldstein NS, Bassi D, Uzieblo A. WT1 is an inte-gral component of an antibody panel to distinguish pancreaticobiliary and some ovarian epithelial neo-plasms. Am J Clin Pathol 2001; 116(2):246–252.
14. Hwang H, Quenneville L, Yaziji H, Gown AM. Wilms tumor gene product: sensitive and contextually spe-cific marker of serous carcinomas of ovarian surface epithelial origin. Appl Immunohistochem Mol Mor-phol 2004; 12(2):122–126.
15. Acs G, Pasha T, Zhang PJ. WT1 is differentially ex-pressed in serous, endometrioid, clear cell, and mu-cinous carcinomas of the peritoneum, fallopian tube, ovary, and endometrium. Int J Gynecol Pathol 2004; 23(2):110–118.
16. Madore J, Ren F, Filali-Mouhim A, Sanchez L, Kö-bel M, Tonin PN, et al. Characterization of the mo-lecular differences between ovarian endometrioid carcinoma and ovarian serous carcinoma. J Pathol 2010; 220(3):392-400.
17. Cathro HP, Stoler MH. The utility of calretinin, in-hibin, and WT1 immunohistochemical staining in the differential diagnosis of ovarian tumors. Hum Pathol 2005; 36(2):195–201.
18. Inoue K, Sugiyama H, Ogawa H, et al. WT1 as a new prognostic factor and a new marker for the detection of minimal residual disease in acute leukemia. Blood 1994; 84(9):3071–3079.
19. Bergmann L, Miething C, Maurer U, et al. High lev-els of Wilms' tumor gene (wt1) mRNA in acute my-eloid leukemias are associated with a worse long-term outcome. Blood 1997; 90(3):1217–1225.

Vers
ion fo
r revie
w
2138
HealthMED - Volume 6 / Number 6 / 2012
Journal of Society for development in new net environment in B&H
20. Ghanem MA, Van der Kwast TH, Den Hollan-der JC, et al. Expression and prognostic value of Wilms' tumor 1 and early growth response 1 pro-teins in nephroblastoma. Clin Cancer Res 2000; 6(11):4265–4271.
21. Miyoshi Y, Ando A, Egawa C, et al. High expres-sion of Wilms' tumor suppressor gene predicts poor prognosis in breast cancer patients. Clin Cancer Res 2002; 8(5):1167–1171.
22. Netinatsunthorn W, Hanprasertpong J, Dechsukhum C, Leetanaporn R, Geater A. WT1 gene expression as a prognostic marker in advanced serous epithe-lial ovarian carcinoma: an immunohistochemical study. BMC Cancer 2006; 6: 90.
23. Seidman JD, Horkayne-Szakaly I, Haiba M, Boice CR, Kurman RJ, Ronnett BM. The histologic type and stage distribution of ovarian carcinomas of sur-face epithelial origin. Int J Gynecol Pathol 2004; 23(1):41–44.
24. McCluggage WG. My thoughts on and approach to the typing of ovarian carcinomas. J Clin Pathol 2008; 61(2):152–163.
25. Høgdall EV, Christensen L, Kjaer SK, et al. Expres-sion level of Wilms tumor 1 (WT1) protein has lim-ited prognostic value in epithelial ovarian cancer: from the Danish "MALOVA" ovarian cancer study. Gynecol Oncol. 2007; 106(2):318-324.
26. Yamamoto S, Tsuda H, Kita T, et al. Clinicopatho-logical significance of WT1 expression in ovarian cancer: a possible accelerator of tumor progression in serous adenocarcinoma. Virchows Arch 2007; 451(1):27-35.
Corresponding Author Biljana Djordjevic, University of Nis, Faculty of Medicine, Institute of Pathology, Nis, Serbia, E-mail: [email protected]

Vers
ion fo
r revie
w
HealthMED - Volume 6 / Number 6 / 2012
Journal of Society for development in new net environment in B&H 2139
Abstract
Introduction. Clinician must always solve a problem of the first time ocurring hyperkalaemia in a patient. Detrimental effects off raised blood potassium on heart rhythm are well known and described. Hyperkalaemia is the most frequent electrolyte disorder which potentially causes se-vere arrhythmia and even cardiac arrest. Hyperka-laemia is defined as being mild when serum pota-ssium is in range 5,0-5,9 mmol/l, moderate 6,0-6,4 mmol/l and severe >=6,5 mmol/l.
Case outline. We are presenting a case of a tra-uma patient with nephrectomy who developed ra-ised serum potassium fourteen days after the sur-gery. During his hospitalization there were several factors that could predispose to hyperkalaemia such as possible renal failure, nephrotoxic medi-cation and drugs that could elicit hyperkalaemia. At the end a benign state of pseudohyperkalaemia was diagnosed, which could sometimes be the re-ason for unnecessary treatment.
Conclusion. The purpose of this case investiga-tion is short and concise review of literature concer-ning hyperkalaemia, its ethiology and influence on patient' s condition. At the end it offers an algorithm for a clinician to follow whenever raised serum po-tassium levels occur in a patient for the first time. Algorithm incorporates ethiology and pathogenesis of hyperkalaemia explaining the most important points in a succinct but sufficient manner.
Key words: hyperkalaemia, ethiology, diffe-rential diagnosis
Introduction
We present a case of a 35 year old man who underwent emergency nephrectomy after car acci-dent and presented with raised potassium levels
fourteen days later. We discuss possible explanati-ons and present a differential diagnosis algorithm in case of raised serum potassium levels.
Case report
A 35-year old man was admitted to Emergen-cy Department of a University hospital after a car crash accident. Initially, brief diagnostic procedu-res were undertaken in a regional hospital centre, and it was decided that the patient should be re-ferred to a tertiary hospital centre due to serious injuries of the thorax and abdomen. On admission the patient, otherwise healthy, with no previous diseases, and taking no medication, was somno-lent, hypotensive 90/50 mmHg, tachycardic 130/min and tachypnoic with respiratory rate of 30/min. Haemopneumothorax was diagnosed on the right side and a drainage of pleural cavity was per-formed. At admittance it was clear that the patient had abdominal injury due to abdomen tenderne-ss and haemodynamic instability. After brief dia-gnostic procedures a rupture of right kidney was diagnozed and the patient underwent emergency explorative laparatomy and right nephrectomy. Intraoperative blood loss was about 4000 ml and aside cristalloids and colloids the patient was gi-ven 1600 ml of red blood cell concentrates. Po-stoperatively he was admitted to surgical intensive care unit (ICU) for a period of artificial ventilation and further fluid and blood products substitution. The patient stabilized hemodynamically, having a mean arterial pressure 70 mmHg, and hourly uri-ne output between 0,75 and 1 ml/kg/h. It became clear that he needed high inspiratory oxygen con-centrations (FiO2=0,6) to maintain adequate arte-rial blood oxygenation although initial chest ra-diograms revealed only few opacities parahillary
True hyperkalaemia or pseudohyperkalaemia in a trauma patient after nephrectomy-differential diagnosis algorithmArsen Uvelin1, Radmila Kolak1, Vladimir Vrsajkov1, Danica Hajdukovic1, Ivanka Percic2
1 Clinical centre of Vojvodina, Department of Anaesthesia and Intensive therapy, Novi Sad, Serbia,2 Clinical centre of Vojvodina, Department of Haemathology, Novi Sad, Serbia.

Vers
ion fo
r revie
w
2140
HealthMED - Volume 6 / Number 6 / 2012
Journal of Society for development in new net environment in B&H
and basally on the right. Lung contusion was sus-pected and confirmed by the third day when chest radiograms and CT of the thorax showed conden-sation opacities in the middle and lower parts of the lungs predominantly in the right hemithorax. Subsequently the patient met the criteria for acute respiratory distress syndrome (ARDS) by the day 4 and was accordingly treated. On the 6th day sur-gical tracheotomy was performed. During ICU hospitalization haemocultures identified Staphy-lococcus spp. and the patient received imipenem and teicoplanin for 14 days. The patient’s condi-tion gradually improved and he was weaned from the ventilator. It was noticed in the beginning of the third week (day 14) that his serum potassium levels raised above 5 mmol/l. The peak serum po-tassium levels were on the day 17-5,90 mmol/l. Since the patient underwent nephrectomy the first impression was that he is developing renal failure although his urine output was satisfactory (more than 1 ml/kg/h, he was even poliuric, having an hourly urine output 2 ml/kg/h). Further testing showed that blood urea nitrogen and creatinine remained in the reference ranges, so soon after-wards renal failure was excluded. It was assumed that raised serum potassium levels were of “in vi-
tro” origin and correlating to concomitant throm-bocytosis (table 1). On the day 20 the patient was transferred to Urology department in a satisfactory condition. On the day 27, the patient checked out of the hospital in satisfactory condition.
Discussion
The incidence of high blood potassium levels in unselected hospital patients ranges between 1,1 and 10 % [1]. Perkins and colleagues in their obser-vational study showed that as much as 29 % of non-crush trauma patients develop hyperkalaemia in the first 12 hours after admission. They also showed that hyperkalaemia is an independent risk factor for higher mortality [2]. In crush injuries such as occur during earthquake, reported incidence of hyperka-laemia can be as high as 42 % [3]. It seems that hyperkalaemia is the most frequent electrolyte dis-order which potentially causes severe arrhythmia and even cardiac arrest [4]. The highest potassium measurement in our patient was 5,9 mmol/l which can be defined as mild hyperkalaemia (mild hyper-kalaemia 5,0-5,9 mmol/l, moderate 6,0-6,4 mmol/l and severe >=6,5 mmol/l) [4]. Raised plasma pota-ssium remains always a concerns to a physician due
Table 1. Platelate count and potassium levels corresponding to possible nehrotoxic stimuliDay of hospitaliazation Platelate count [x 109 /l] K+ [mmol/l] Nephrotoxic stimuli
1. 76 4,70 Nephrectomy, hypovolaemia2. 89 4,903. 37 3,784. 63 3,675. 102 3,63
vancomicyn therapy
6. 126 3,737. 211 3,738. 319 4,289. 314 4,1910. 370 4,1811. 516 4,4112. - -13. 591 4,3614. 661 5,1515. 710 5,5116. 704 5,3117. 680 5,9018. - 5,5919. - -20. - -

Vers
ion fo
r revie
w
HealthMED - Volume 6 / Number 6 / 2012
Journal of Society for development in new net environment in B&H 2141
to detrimental effects of hyperkalaemia on heart muscle excitability [4,5]. EKG changes involving hyperkalaemia are shown in the table 2. It is impor-tant to stress that relationship between the degree of hyperkalaemia and EKG changes is variable; in rare cases of severe hyperkalaemia, EKG can be normal or near normal [6]. Montague and collea-gues showed that EKG is insensitive for diagnosing hyperkalaemia and that the probability of specific EKG changes increases as the potassium increases. At lower concentrations of serum potassium, spe-cific EKG changes are rare and the incidence of complications is low [1]. On the other hand, Weiner and Wingo stated that progression from benign to lethal arrhythmias is unpredictable and the presence of any EKG findings of hyperkalaemia should be considered a medical emergency [7].
Our patient was at risk of acute renal failure (ARF). Due to massive haemorrhage and a period of transport from the regional centre the patient was hypovolemic and hypotensive. ARF is a sudden su-stained decline in glomerular filtration rate usually associated with uraemia and a fall in urine output [8]. In 1996. Madrid study group found an inciden-ce of ARF to be 209 patients per million populati-on and that one in 267 admitted patients had renal function deterioriation [9]. ARF was considered when a sudden rise in serum creatinine concentra-tion (Scr) to more than 177 μmol/liter was found in patients with previously normal renal function, or when the sudden rise (50% or more) was observed in patients with previous mild-to-moderate chronic renal failure (Scr<264 μmol/liter). In the same study mortality attributable to ARF was 26,7 % [9]. Apart from ARF, the patient can be in a chronic renal fai-lure which can decompensate after an event such as hypovolemic shock and nephrectomy: acutisation of chronic renal failure. When having a patient that un-derwent nephrectomy one should always take into account that remaining kidney could be insufficient due to a chronic preexisting condition. Nephrotoxic drugs can lead to acute renal failure especially in the setting of hypovolaemia. Our patient was receiving teicoplanin from 5th to 18th day due to a staphyloco-ccal infection; at that time he was not hypovolemic. Low molecular heparin (LMWH), which our pati-ent received, can lead to hyperkalaemia. Varughe-se and coworkers reported a case of a patient with type 2 diabetes who developed hyperkalaemia after
three days of LMWH therapy [10]. Diabetes pati-ents seem to be susceptible to heparine-induced hyperkalaemia since many of them use other drugs that can raise serum potassium (such as ACE inhibi-tors and potassium sparing diuretics) [10]. The list of drugs that can cause hyperkalaemia is vast; the mechanisms of hyperkalaemia induction are various [11,12]. Lastly, we noticed that thrombocytosis was a concomitant finding in our patient. Thrombocyt-hosis on the seventeenth day was 680 x 109/l and correlating potassium levels were 5,90 mmol/l. Re-peated testing which used plasma instead of serum showed that potassium was within reference valu-es and was 4,1 mmol/l. In fact, thrombocytosis can be associated with pseudohyperkalaemia which is defined as a difference between serum and plasma potassium higher than 0,4 mmol/l [4,13]. Interestin-gly, pseudohyperkalaemia can lead to unnecessary therapeutical interventions. There have been reports of unnecessery glucose and insulin administration and even dyalisis in setting of spurious hyperkalae-mia [14-16]. In our patient, before the nature of the elevated potassium blood levels were explained, he was given normal saline, in order not to raise serum potassium levels. Finally we are proposing an algo-rithm that deals with de novo hyperkalaemia labora-tory finding in a patient. Following this algorithm a clinician will be able to distinguish whether a state of true hyperkalaemia exists and consider the possi-ble etiology and act immediately if indicated.
The first step in EUMaP algorithm for hyperka-laemia (EKG signs of hyperkalaemia, Underlying conditions that cause hyperkalaemia, Medications that induce hyperkalaemia and states that can ca-use Pseudohyperkalaemia) is to determine if there are any EKG signs of hyperkalaemia since these arrhythmias can be life threatening. The next step is answering a question are there any possible Under-lying conditions that can cause hyperkalaemia. It is important to stress, once again, that potassium is the most abundant intracellular kation. Potassium inta-ke can be per os or intravenous; this kation is mainly excreted by kidneys. Medication-induced hyper-kalaemia (MIH) is a type of iatrogenic hyperkala-emia. Circumstances in which MIH occurs usually include administration of a medication in setting of impaired potassium excretion or concomitant admi-nistration of more than one hyperkalaemia-inducing drugs. Pseudohyperkalaemia is, finally, considered.

Vers
ion fo
r revie
w
2142
HealthMED - Volume 6 / Number 6 / 2012
Journal of Society for development in new net environment in B&H
Table 2. EUMaP algorithm for first time laboratory high potassium findingI EKG signs of hyperkalaemia: Exclude high potassium dysrhythmia-is the patient at risk for cardiac complications?[4,5,11]
- Peaked narrow T waves, shortened QT interval - Widening of the QRS complex, decreased amplitude - Ocassionally ST-segment elevation in V1 and V2 can be seen mimicking acute myocardial infarction (due to
nonhomogenous depolarization in different portions of the myocardium) - PR prolongation, loss of P wave, second or third degree A-V block - Sine-wave pattern (with widened QRS complex merging into T wave), ventricular fibrillation - Bradycardia
*Alfonzo and coworkers: high risk of cardiac arrest when there is widened QRS, sine wave pattern, bradycardia or ventricular tachycardia.[4]II Is there an UNDERLYING CONDITION that can be the cause of hyperkalaemia [3,4,7-9,11,19] A. Renal failure-is there a possibility that the patient is experiencing some kind of renal function deterioriation? (blood-urea nitrogen, creatinine, urine output less than 0,5 ml/kg/min in the absence of dehydration)
- chronic failure-usually there is history of chronic failure, the problem could be first time presentation
- acute failure-hypovolaemia and severe dehydration, nephrotoxic drugs (aminoglycosides, vancomycin, radiocontrast solutions), postrenal obstruction (calculi, prostate hypertrophy, urine bladder infiltrative tumor, gynecological malignancy). Diganosis of acute renal failure: sudden creatinine rise to more than 177 μmol/l.[9]
*Hypovolaemia and dehydration should be corrected if nephrotoxic medication are to be administered to the patient. - acutisation of chronic renal failure (grades I, II or III) in setting of nephrotoxic stimuli-sudden rise of
creatinine (50% or more) observed in patients with previous mild-to-moderate chronic renal failure [9] - non oliguric renal failure
B. Metabolic disorder - Acidosis-K+ shift-potassium exits the cells as H+ kations become abundant in extracellular space and they
tend to enter the cells in order to compensate and maintain pH balance (K+/H+ contratransport) - Adrenal insufficiency
C. Excess potassium intake - Transfusion of blood - Excess intravenous administration during impaired excretion - Oral intake (sodium-restricted diet which is inherently high in potassium, fruit juices and beverages can be
high in potassium)17
D. Cell lysis - intense tissue destruction - Excessive burns, high voltage electrical injuries - Crush syndrome (rhabdomyolysis, hypovolaemia, acidosis-several mechanisms apart from cell lysis account
for hyperkalaemia development) - Haemolytic toxins - Rhabdomyolysis-traumatic (e.g. crush syndrome) or drug-induced (statins, fibrates, isoniazid, valproic
acid, tricyclic antidepressants, pentamidine, amphetamines, cocaine and many other)[19]. Myoglobin clogs glomerules and can cause acute renal insufficiency which aggravates hyperkalaemia

Vers
ion fo
r revie
w
HealthMED - Volume 6 / Number 6 / 2012
Journal of Society for development in new net environment in B&H 2143
III Does the patient take or is given any MEDICATION that can cause hyperkalaemia?
The mechanisms of potassium elevation are various![10-12,18,19] - ACE inhibitors and angiotensin receptor blockers-these medication cause hypoaldosteronism; the risk of
hyperkalaemia increases with dose escalation, use of concurrent hyperkalaemia-inducing medications and use in patient with diabetes, chronic kidney disease and chronic heart failure.
- Heparine and low molecular weight heparin-inhibit aldosterone synthesis - Succinylcholine (muscle relaxant used for crush induction, increased potassium release from the cells. This
effect is pronounced in renal failure, burns and different neurological diseases which affect neuromuscular junction)
- β-blockers-reduce renin secretion thus causing hypoaldosteronism, other mechanism is by decreasing intracellular potassium shift
- Trimethoprim-impairs potassium secretion - Potassium-sparing diuretics -spironolactone (aldosteron antagonist- spironolactone dose should never exceed
50 mg daily, special intention should be given if patient’ s creatinine level is higher than 220 μmol/l as these patients are at risk of hyperkalaemia occurence), amiloride and triamterene inhibit potassium secretion
- Potassium supplements in excess and during decreased urine output - Medications in form of potassium salts-benzylpenicillin (when given in high dose it carries a substantial
potassium load) - Nonsteroidal anti-inflammatory drugs-reduce renin secretion and decrease glomerular filtration rate by
constriction of afferent arteriole. - Digoxin overdose-increased potassium release from the cells - Pentamidine, cyclosporin A, tacrolimus-inhibition of potassium secretion
*The patient is at risk for medication-induced hyperkaliaemia (MIH) if he is given a drug that can raise serum potassium in setting of impaired potassium excretion or excessive intake. Risk of MIH exists, also, when two or more hyperkaliaemia inducing drugs are administrated to the patient concomitantly.
IV Exclude PSEUDOHYPERKALAEMIA [13-16]
Conditions associated to pseudohyperkalaemia (“in vitro” hyperkalaemia, spurious hyperkalaemia) which is defined as difference in serum and plasma potassium concentrations of more than 0,4 mmol/l.
- In vitro haemolysis, inadequate sampling and long sample storage, use of tourniquets, fist clenching during phlebotomy, mechanical trauma during shaking or centrifugation of the blood sample
- Increased number of blood cells: thrombocytosis, leukocytosis (acute leukemia, chronic myeloid leukemia, chronic lymphocytic leukemia, polycythemia rubra vera, essential thrombocytosis, reactive thrombocytosis in chronic infection or postsplenectomy)

Vers
ion fo
r revie
w
2144
HealthMED - Volume 6 / Number 6 / 2012
Journal of Society for development in new net environment in B&H
References
1. Montague BT, Ouellette JR, Buller GK. Retrospective review of the frequency of ECG changes in hyperkale-mia. Clin J Am Soc Nephrol 2008;3:324-30.
2. Perkins RM, Aboudara MC, Abbott KC, Holcomb JB. Resuscitative hyperkalemia in noncrush trauma: a prospective, observational study. Clin J Am Soc Nep-hrol 2007;2:313-9.
3. Erek E, Sever MS, Serdengecti K, Vanholder R, Akoglu E,Yavuz M, Ergin H, Tekce M, Duman N, Lameire N; Turkish study group of disaster: an overview of mor-bidity and mortality in patients with acute renal failu-re due to crush syndrome: the Marmara earthquake experience. Nephrol Dial Transplant 2002;17:33-40.
4. Alfonzo AVM, Isles C, Geddes C, Deighan C. Potassi-um disorders-clinical spectrum and emergency mana-gement. Resuscitation 2006;70:10-25.
5. Van Mieghem C, Sabbe M, Knockaert D. The Clini-cal value of the ECG in noncardiac conditions. Chest 2004;125:1561-76.
6. Szerlip HM, Weiss J, Singer I. Profound hyperkalemia without electrocardiographic manifestations. Am J Kidney Dis 1986;7:461-5.
7. Weiner ID, Wingo CS. Hyperkalemia: a potential si-lent killer. J Am Soc Nephr 1998;9:1535-43.
8. Nissenson AR. Acute renal failure: definition and pa-thogenesis. Kidney Int 1998; 53[Suppl. 66]: S7–S10.
9. Liano F, Pascual J. The Madrid acute renal failure study group.Epidemiology of acute renal failure: a prospective multicentre,community based study. Kid-ney Int 1996; 50: 811–8.
10. Varughese GI, Robson GE, Aldcroft J, Barton DM, Warner DP. Heparin therapy and hyperkalaemia in a patient with type 2 diabetes. Br J Diabetes Vasc Dis 2004;4:351-2.
11. Sood MM, Sood AR, Richardson R. Emergency ma-nagement and commonly encountered outpatient scenarios in patients with hyperkalemia. Mayo Clin Proc 2007;82:1553-61.
12. Luckey AE, Parsa CJ. Fluid and electrolytes in the aged. Arch Surg 2003;138:1055-60.
13. Sevastos N, Theodossiades G, Archimandritas AJ. Pseudohyperkalemia in serum:a new insight into an old phenomenon. Clinical Medicine and Research 2008; 6:30-2.
14. Fitzgerald JEF, White MJ, Parfitt SJ, Littler Y, Waxwell-Armstrong CA. Postoperative pseudohy-perkalaemia:innocent but dangerous. ANZ Journal of Surgery 2008;78:418-9.
15. Ho AMH, Woo JCH, Chiu L. Spurious hyperkalae-mia associated with severe thrombocytosis and leu-kocytosis. Can J Anaesth 1991;38:613-5.
16. Balal BI, Brigden ML. Factitious Biochemical Mea-surements Resulting From Hematologic Conditions. Am J Clin Pathol 2009;131:195-204.
17. Williams E, Fulop M. A puzzling case of hyperkalae-mia. Lancet 2001;357:1176.
18. ur Rehman H. Benzylpenicillin potassium. BMJ 2009;339:b4822.
19. Siamopoulos KC, Elisaf M, Katopodis K. Iatro-genic hyperkalaemia-points to consider in dia-gnosis and management. Nephrol Dial Transplant 1997;13:2402-6.
Corresponding Author Arsen Uvelin, Clinical centre of Vojvodina, Department of Anaesthesia and Intensive therapy, Novi Sad, Serbia, E-mail: [email protected]

Vers
ion fo
r revie
w
HealthMED - Volume 6 / Number 6 / 2012
Journal of Society for development in new net environment in B&H 2145
Abstract
Objective. Developmental verbal apraxia (DVA), or developmental apraxia of speech is a motor speech disorder of motor programming and planning. Children with DVA have problems with saying sounds, syllables, and words. The aim of the study was to determine the characteristics fun-damental of laryngeal voice in developmental ver-bal apraxia. Two parameters are observed: height and tension of voice. The research was conducted at the Institute for Experimental Phonetics and Speech Pathology and in the Institute of psycho-physiological disorders and speech in Belgrade.
Methods. The sample consisted of 45 chil-dren ages 4-5 years. The first group (N=15) were children with diagnosed developmental verbal apraxia, the second group (N=15) children with diagnosed developmental dysphasia, and the third group (N=15) included children with diagnosed developmental phonological disorders. Groups were equalized in relation to age. The study was carried out individually.
Results. Qualitative analysis of the results showed that: for 20% of group with phonological disorders it is present low voice in the normal ten-sion, and in 80% of children it is present normal height in a normal voice tension. In group with dysphasia 13.4% of children have a low voice in the normal tension, 66.6% of children have normal height and normal tension, and 20% of children have raised voice in a normal tension. In the group of children with developmental verbal apraxia, 26.6% of children have a low voice in the hypo-tension of the first degree, 6.6% of children have a low voice in normal tension, three children have low voice in hypertension of the second degree, 20% of children have elevated voice in hypoten-sion of the second degree, 6.6% have increased voice in a normal tension, and 20% have elevated voice in the first degree of hypertension.
Conclusion. Results show that disturbances in height and tension of fundamental laryngeal voice are present in children with developmental verbal apraxia in a greater degree than in children with developmental dysphasia and developmental pho-nological disorders.
Key words: verbal apraxia, laryngeal voice, developmental dysphasia, developmental phono-logical disorders.
Introduction
Childhood apraxia of speech (CAS), or devel-opmental verbal apraxia (DVA), or developmen-tal apraxia of speech is a motor speech disorder caused by damage on areas of the brain that con-trol the voice. It is caused by stroke, injuries during labour, and genetic disorders. Apraxia of speech is a disorder of motor programming and planning. Children with CAS have problems with saying sounds, syllables, and words. Reason for this is not muscle weakness or paralysis. The brain has problems in planning to move the body parts (e.g., lips, jaw, tongue) which are needed for speech. The child knows what he/she wants to say, but his/her brain has difficulty in coordination of the muscle movements which are necessary for saying those words. The severity of the voice fluency problem varies with the type of the brain damage. Patients have troubles with sequencing sounds and words. This is frustrating, as the patient knows what he/she wants to say, but is unable to coordinate his/her muscles to say the correct words. Replacement of words (house instead of hair), or non-words (her can) may come out instead. (http://www.livestrong.com/article/254867-about-voice-fluen-cy-disorders/# ixzz1X8R5Izdr)
Apraxia of speech is a neurological condition affecting the development of a child‘s speech. Apraxia is a neurological impairment in which are involved planning, executing, and motor sequenc-
Characteristics of fundamental laryngeal voice (f0) in developmental verbal apraxiaVivien Djordjevic1 & Slavica Golubovic2
1 Institute for Experimental Phonetics and Speech Pathology, Belgrade, Serbia,2 University of Belgrade, Faculty of Special Education and Rehabilitation, Belgrade, Serbia.

Vers
ion fo
r revie
w
2146
HealthMED - Volume 6 / Number 6 / 2012
Journal of Society for development in new net environment in B&H
ing movements. The National Institute of Health (USA) defines apraxia as a disorder of the nervous system. Apraxia is perhaps the most misunderstood of all the speech disorders. Verbal apraxia is a neu-rological motor speech impairment that involves a breakdown in the transmission of messages from the brain to the muscles in the jaw, cheeks, lips, tongue and palate that facilitate speech. There is no obvious weakness in these muscles, and a child may as well be able to move them quite normaly when not trying to speak. Apraxic children, who are usu-ally seen as “just late talkers” when young, are able to comprehend language at appropriate age level. However, they have difficulty in expressing them-selves while speakig. With apraxia, a child knows what he/wants to say but there is a block in a path-way which is obstructing the signal from the brain to the mouth. For any child with a speech disorder, but especially with apraxia, the earlier therapy be-gins, results are better for the child and his/her so-cial-emotional development. Verbal apraxia (VA) is a motor speech disorder that interferes with an individuals’ ability to correctly pronounce sounds, syllables, and words. It is a neurologically-based motor planning disorder of unknown cause. Verbal apraxia may occur as part of many neurological conditions, or may occur separately. Although the specific causes are unknown, possibilities include: direct result of neurological damage, as a complex neurobehavioral disorder (genetic, metabolic) and neurological speech sound disorder (speech delay, verbal apraxia).
Since the human voice is the only one that can simultaneously produce a word and tone, it is of particular importance in communication because it gives us a lot of information’s about a particu-lar person, or of person’s sex, age, health, tempera-ment, thoughts, feelings, moods, etc. The funda-mental frequency / fundamental laryngeal voice (Fo) is an essential component of spoken voice, or the frequency with which the vocal cords vibrate. Pitch is a perceptual phenomenon, and depends on the fundamental frequency, which is a physical parameter. The fundamental frequency (Fo) is the number of vibrations that vocal cords make in one second, expressed in hertz (Hz) and is determined with the activity of internal laryngeal muscles, with subglotic pressure and tension, weight and length of the vocal cords, which is partly a consequence
of cricoid, thyroid and arytenoid cartilages. Value of Fo is influenced with age, sex, physical constitu-tion, social environment, emotional, intellectual sta-tus, laryngeal pathology, mental disorders, hearing impairment, neurological and endocrine disorders and general health. The voice is not monotonous and is not constant, depends on the emotions, pace, intonation and volume, which means that affectiv-ity follows our vocal and general behavior.
The main characteristics of voice are height, intensity and timbre. Subjectively, voice is esti-mated as: high, low, tight, rough, hoarse, beep, etc. This subjectivity can be verified by objective testing methods.
Voice changes are manifested in three basic features: the tone, intensity and timbre. In addi-tion to basic, there are two more features of voice, amount of noise in the voice and the way to start a voice (of attacks).
Material side of each voice, according to Belic, represent the volume of voice and it’s tone: pitch or tone of voice, strength or tone of voice, timbre or tone, loudness and duration of voice or tones [2]. The main task of the vocal cords is to produce sound waves that interlocutor can hear. Vocal cords make clear high tones, and their height and intensity depend on the shape of the larynx, vocal cord length, tension, and speed of their flickering. All these features are changeable, and differ from person to person.
The sound obtained by relaxation vibration of the vocal cords, in whose rhythm the air current modulates, is called primary laryngeal voice. That sound is too weak and not audible. Final strength, audibility, volume and timbre are obtained by passing through the vocal tract, and resonant cav-ity when the voice occurs [2].
The main laryngeal voice occurs by vibration of vocal cords in the horizontal plane (by which is expiratory rhythmically interrupted). It is ampli-fied with resonant processes and articulation (in resonant and articulation cavities), and modeled in the speech sounds. The phenomenon of resonance in the physical sense represents the increase of in-tensity of vibration when the frequency of external force that causes vibration, coincides with vibra-tion frequency of their own systems [3]
In the acoustic image appear upper tones, i.e. harmonics, in addition to the basic tone. In humans, as a resonant cavity, are operating mainly oral and
Vers
ion fo
r revie
w
HealthMED - Volume 6 / Number 6 / 2012
Journal of Society for development in new net environment in B&H 2147
nasal cavities, in the some parts pharynx and larynx, and in the wider sense, the whole head and chest. With movements of articulation organs (tongue, palate, lips, cheeks, laryngeal and pharyngeal anal sphincters), shape and size of the resonant space are changing, by which to some extent they enhance or suppress the basic laryngeal voice, thus giving the specificity of acoustic impression and image of generated voice/voices. The absence or occurrence of pathological resonant frequencies substantially changes the structure of speech, and by auditory perception are revealed advances in timbre, sonor-ity and nasality of voice [4]
Insonation of the fundamental laryngeal voice in the higher harmonic tones, with vowels and conso-nants modulation, is performed by supraglotic struc-tures of the larynx, pharynx, oral and nasal cavity; structures that represent the voice resonator [5].
Pitch is a perceptual phenomenon, and depends on the fundamental frequency, which is a physical parameter. The fundamental frequency (F0) is the number of vibrations that the vocal cords make in one second [6].
Modulation with vocal cord creates the sound which has features of the harmonious sound, by which are produced all vowels in the speech, and it has low intensity and is almost inaudible. Basic laryngeal voice when going through the resonant cavity increases and creates the harmonic tones that mark the voice [7].
Pitch depends on the speed of vibration of the vocal cords, or the fundamental frequency. Faster vibration creates a higher tone of voice, or a hi-gher frequency. A speed of the vocal vibration de-pends on the thickness, length and tension of the vocal cords and air pressure that passes between the vocal cords. It is determined by the activity of internal laryngeal muscles, subglotic pressure and tension, weight and length of the vocal cords, which is also partly a consequence of the positi-on of cricoids, thyroid arytenoid and cartilage [8]. One of the fundamental meanings of phonation is contained in this thought: “phonics is in the hu-man development process, the result of an inge-nious use of breathing mechanism for meaningful communication” [9].
Phonation or voice performance in the pharynx is part of the complex voice features, but at the same time its important element. The activity of
the larynx is not equal in the performance of all voices. All vowels and consonants are created by vibration of adduced vocal cords, thus producing a basic laryngeal tone, while in unvoiced conso-nants role of the larynx is minimal, because vocal cords are and are not vibrating [10].
Generally when speaking about the phonation, it is meant of vocalization - the vocal performan-ce in the pharynx. Phonics is defined as expira-tory modified by laryngeal vibration and it occurs, according to recent findings in the following way: after prefonatory, willingly inspiration started, followed by prefonatory expiratory, vocal cords take the paramedial position which is triggered with nerve impulses which come in the laryngeal muscles with the upper and lower laryngeal nerve. With the same nerves are coming impulses, and with their action is changed the weight, length and tension of the vocal cord.
Partial obstruction of expiratory air currents is caused with Bernoulli effect: constant volume flow on the place where sudden narrowing appe-ared is achieved by increasing velocity, thus re-ducing pressure at the narrowing. Because of that pressure drops in the subglotic region, and vocal cords are inserted to the center line followed by complete obstruction of air flow. With this is in-creased the subglotic pressure which suddenly linger the vocal cords to paramedial position [11].
Such a process of horizontal vibration of the vocal cords lasts as long as the pressure is reduced below critical subglotic limits, which requires new prefonatory inspiration. Phonation only begins willingly. Later during phonation frequency of vi-brations, or mass, vocal cord tension and length depend on the reflex control mechanisms, especi-ally the kinesthetic mechanism [12].
Receptors located in the mucosa, muscles and joints of pharynx play an important role in contro-lling kinesthetic, as medulla oblongata is informed of any physiological and pathological irritation which appeared during phonation.
In normal phonation both vocal cords vibrate with the same frequency, amplitude and phase, i.e. at the same time are approaching the center line and moving away from it. Except horizontal vi-brations [6], wave like motion of the vocal cords mucosa is an important part of the vibrating mec-hanism, as it is an expression of its structural cha-

Vers
ion fo
r revie
w
2148
HealthMED - Volume 6 / Number 6 / 2012
Journal of Society for development in new net environment in B&H
racteristics, which provides the necessary features of a normal voice and ensures normal phonation. Value of Fo s affected with age, sex, physical con-stitution, social environment, intellectual status, and laryngeal pathology, mental disorders, hearing impairment, neurological and endocrine disorders and general health. The voice is not monotone and not constant. Depends on the emotion in speech, pace, tone and strength. Our vocal and general be-havior was followed with affectively.
Voice of the one person is not the same every day. Voice variations of one person, from day to day, can change in the range up to 18%. Faster vi-bration creates a higher tone of voice, or a higher frequency. Increased air pressure causes an increa-se in both intensity and a higher tone of voice. The average height of fundamental laryngeal voice is: the male 120-150 Hz, in women 180-220 Hz, in children around 300 Hz. [6].
Changing the basic laryngeal voice makes po-ssible national prosody and speech. When liste-ning to vocals, fundamental laryngeal voice is not heard. It is heard a complex acoustic wave which consists of a series of frequencies which develop with modulation of basic laryngeal voice in the pharynx, hypo pharynx, oral and nasal cavity.
The tension of the voice is a muscle tension of vocal tract. They differ in two groups: laryngeal and supra laryngeal tensions that occur during phonation or articulation.
Aim
The aim of this study was to determine the ba-sic characteristics of fundamental laryngeal voice (F0) with developmental verbal apraxia.
Methodology
The research was conducted at the Institute for Experimental Phonetics and Speech Pathology and in the Department of psycho physiological disorders and speech in Belgrade.
The sampleWith adequate diagnosis conducted by an
expert team: speech therapist, clinical psycho-logist, neurologist, it is performed a selection of children whose disorders in speech and language
are diagnosed as a developmental verbal apraxia, developmental dysphasia and developmental pho-nological disorders. The sample consisted of 45 children, age between 4 and 5 years. The first gro-up (N = 15) were children with diagnosed deve-lopmental verbal apraxia, the second group (N = 15) children with diagnosed developmental dysp-hasia, and a third group (N = 15) included the chil-dren with diagnosed developmental phonological disorders. The groups were equalized in relation to the age. The survey was conducted individually.
Measuring Instruments
Test for assessment of basic laryngeal voice-laryngogramWith laryngogram were observed properties of
the voice in the correlation relation. This test co-vers four main fields and two scales that determine the tension and pitch. The tension has six level of possible deviations from normal, three indicating elevated (plus), and three reduced tension (minus).
Pitch also has six marks for deviation: three for the increased (plus), and three for a reduced height (minus). The first field in the central part of the laryngogram is a normal voice. At the first level of deviation, field labeled with number 1 is the first level of deviation from normal voice, and that field surrounds field of normal voice.
Deviation moves to the increase of the voice - plus position (1), or decrease of the voice - minus position (-1). Increased voice (1) is the result of the first degree (1) tension of the vocal cords, and low voice of minus position (-1). Thus, the high voice of the first degree (1) occurs in correlation with the tension of the first degree (1), and low voice of the first degree (-1) is correlated with first degree (-1) looseness.
At the second level of deviation, the second field of the laryngogram, which surrounds the first, imply second degree deviation such as: par-ticularly increased voice in the plus position (2), or half whisper in minus position (-2). Particu-larly high voice (2) is the result of the tension of the second degree (2), and half whisper (-2) re-sults from looseness in the second degree (-2). In the third degree of deviation, the third field is the largest; external field of the laryngogram. Third level of deviation is marked in it, i.e. highest

Vers
ion fo
r revie
w
HealthMED - Volume 6 / Number 6 / 2012
Journal of Society for development in new net environment in B&H 2149
degree of dysphonic. Its correlates are in the plus position: tension of third level (3) leads to whistle voice (3), and minus position of the third level (-3) leads to a whisper (-3).
Marked voice features are on the left and bot-tom of the laryngogram. On the left are levels of intensity and on bottom are levels of height. Lev-els of intensity are entered in the squares observed by its vertical. Each of these analytical evaluations is crossed with its correlation, and gives a com-plete picture of fundamental voice.
In the corresponding squares are therefore en-tered as many labels as there are objections, and la-beling is done by entering mark “x”, or hatching ap-propriate square field. Analysis of the primary voice by laryngogram is the roadmap for its correction.
Results and discussion
Childhood Apraxia of Speech (CAS) is present in children who have no evidence of difficulty with strength, or range of motion of the articulators, but are unable to execute speech movements becau-se of motor planning and coordination disorders. This should not to be confused with phonological impairments in children with normal coordination of the articulators during speech.
In Table 1. are shown the results of tests ob-tained on the basis of fundamental laryngeal voice. Qualitative analysis of the results showed that:
1. group with phonological disorders - in 3 children (20%) in is present a low voice in the normal tension, and in 12 children (80%) normal pitch in normal tension,
2. group with dysphasia - 2 children (13.4%) have low voice in the normal tension, 10 children (66.6%) have normal height and normal tension, and 3 children (20%) increased tension in a normal voice,
3. group with developmental verbal apraxia – 4 children (26.6%) have a low voice in the first level hypotension, 1 child (6.6%) has a low voice in the normal tension, 3 children have low voice in the hypertension of second level, 3 children (20%) have raised a voice in the hypotension of second degree, 1 child (6.6%) has increased tension in normal voice, and 3 children (20%) have raised voice in the hypertension of first degree.
Many studies describe the disorders in the hei-ght of fundamental laryngeal voice in developmen-tal verbal apraxia (a neurological disorder which is characterized by the inability of the execution of coordinated articulator movements, with the absence of muscle weakness and movement dis-order of speech programming). From the etiologi-cal factors are singled out: genetic predisposition to motor coordination disorder, prenatal and natal causes, differences in speed or quality of myelina-tion, neurological disorders, and later development of speech and language [13,14,15,16], but is not determined yet whether this is compensatory me-chanism created as response to motor processing disorder [17]. It was found that dysphonic, noisy or hipper nasal voices are predominant. Disorders of height and tension of fundamental laryngeal voice are, in our study, present in children with verbal apraxia in a greater level than in children with developmental dysphasia and phonological disorders. This differs from the description of fundamental laryngeal voice in research dealing with differential diagnosis and phonological dis-orders verbal apraxia, where children with verbal apraxia have adequate voice quality, in compa-rison with children with phonological disorders, which, depending on the type of disorder have a hoarse, harsh voice and hipper nasal voice [13,14]
Conclusion
The results show that disorders of the hei-ght and tension of fundamental laryngeal voice present in children with developmental verbal apraxia are in a greater level than in children with developmental dysphasia and developmental pho-nological disorders.
Childhood Apraxia of Speech (CAS) is the term used most widely to describe difficulty in planning and programming speech movements in children. CAS is considered to be a neurological speech disorder that can occur by itself, along with other neuro-developmental disorders (such as au-tism), or due to accident or illness. CAS can range from mild to very severe. Children with apraxia of speech, in early stages of speech development, are likely to need intensive, individual, and frequ-ent speech therapy in order to become intelligible speakers. According to the Childhood Apraxia of

Vers
ion fo
r revie
w
2150
HealthMED - Volume 6 / Number 6 / 2012
Journal of Society for development in new net environment in B&H
Speech Association of North America, with proper help, children with apraxia of speech can make great strides in speech, language and communica-tion with appropriate help, and in many cases they can achieve progress to the point that no one could tell that they had a severe speech disorder. Howe-ver, often, other speech, language, and learning difficulties co-occur with this speech disorder.
Childhood Apraxia of Speech (CAS) is present in children who have no evidence of difficulty with strength, or range of motion of the articulators, but are unable to execute speech movements becau-se of motor planning and coordination problems. This is not to be confused with phonological im-pairments in children with normal coordination of the articulators during speech.
Table 1. Survey results obtained by interviewing fundamental laryngeal voice in children with develo-pmental verbal apraxia, developmental dysphasia and developmental phonological disorder
Tension of voice WhisperPitch of voice
Half whisper Low Normal ElevatedDevelop. Phonological Disorders
Hypotension 2 level
No. 0 0 0 0 0% 0 0 0 0 0
Hypotension 1 level
No. 0 0 0 0 0% 0 0 0 0 0
Normal tensionNo. 0 0 3 12 0% 0 0 20 80 0
Hypertension 1 level
No. 0 0 0 0 0% 0 0 0 0 0
Tension of voice WhisperPitch of voice
Half whisper Low Normal ElevatedDevelopmental dysphasia
Hypotension 2 level
No. 0 0 0 0 0% 0 0 0 0 0
Hypotension 1 level
No. 0 0 0 0 0% 0 0 0 0 0
Normal tensionNo. 0 0 2 10 3% 0 0 13.4 66.6 20
Hypertension 1 level
No. 0 0 0 0 0% 0 0 0 0 0
Tension of voice WhisperPitch of voice
Half whisper Low Normal ElevatedDevelopmental verbal apraxia
Hypotension 2 level
No. 0 0 0 0 3% 0 0 0 0 20
Hypotension 1 level
No. 0 0 4 0 0% 0 0 26.6 0 0
Normal tensionNo. 0 0 1 0 1% 0 0 6.6 0 6.6
Hypertension 1 level
No. 0 0 0 0 3% 0 0 0 0 20
Hypertension 2 level
No. 0 0 3 0 0% 0 0 20 0 0

Vers
ion fo
r revie
w
HealthMED - Volume 6 / Number 6 / 2012
Journal of Society for development in new net environment in B&H 2151
References
1. Matic R. Methods of speech development in children. Belgrade, 1982.
2. Baker S, Weinrich B, M Bevington, Schroth P, Schroe-der E. The effect of task type on fundamental frequen-cy in children. Int J Pediatr Otorhinolaryngol., 2008, 72:885-889.
3. Crary MA, Tallman VL. Production of linguistic pro-sody by normal and speech-disordered children. J Co-mmun Disord. 1993, 26:245-262.
4. Eguchi S, Hirsh IJ. Development of speech sounds in children. Acta Otolaryngol Suppl.; 1969, 257:1-51.
5. Stankovic, S., Djukic, V., Janošević, Lj., Arsović, N. (2004): Analysis of quality of life of patients laryngec-tomic. Acta clinica Iugoslavica, 2004., 1, 43-49.
6. Hedjever, M. Fundamentals of physiology and speech acoustics, University of Zagreb, Faculty of Education and Rehabilitation-internal material, 2010.
7. Kent R. Anatomical and neuromuscular maturation of the speech mechanism: Evidence from acoustic studies. J Speech Hear Res. 1976, 19:421-447.
8. Munson B, Bjorum EM, Windsor J. Acoustic and perceptual correlates of stress in nonwords produced by children with suspected developmental apraxia of speech and children with phonological disorder. J Speech Lang Hear Res, 2003, 46:189-202.
9. www.foni.met.hr/Manual/Fonijatrija.htm (Wallace Fenn, 1968).
10. Robb MP, Saxman JH. (1985.) Developmental trends in vocal fundamental frequency of young children. J Speech Hear Res.; 28:421-427.
11. Sun X. Pitch determination and voice quality analysis using subharmonic-to-harmonic ratio. IPASSP2002, Orlando, Florida, 2002.
12. Wertzner HF, Schreiber S, Amaro L. Analysis of fun-damental frequency, jitter, shimmer and vocal in-tensity in children with phonological disorders. Rev Bras Otorrinolaringol (Engl Ed), 2005, 71:582-588.
13. Golubovic S. Diferencijalna dijagnoza razvojne govorne apraksije, dizartrije i fonoloskih poreme-caja/ Differential diagnosis developmental speech apraxia, dysarthria and phonological disorders. Be-ogradska defektoloska skola/ Belgrade Defectology School, 2003, 1-2: 111-121 (In Serbian).
14. Golubovic S. Razvojna govorna apraksija: teorija i dokazi/ Developmental apraxia speech: theory and evidence, Beogradska defektoloska skola/ Belgrade Defectology School, 2003 1-2 : 70-79. (In Serbian).
15. Golubovic, S. Razvojni jezicki poremecaji/Develo-pmental language disorders. Drustvo defektologa Srbije/Association of Defectology,, Mercur, Belgra-de, 2006. ( In Serbian)
16. Golubovic, S. Motoricki poremecaji govora/Motho-ric Speech Disorder. Fakultet za specijalnu edukaci-ju i rehabilitaciju, Univerzitet u Beogradu/Faculty of Special Education and Rehabilitation, University of Belgrade, Merkur/Mercur, Beograd/Belgrade, 2011.(In Serbian).
17. Marquardt, T. P., Sussman, H. M., Davis, B. L. De-velopmental apraxia of speech. Advances in Theory and Practice. In: Vogel, D., Cannito, M. P.: Treating disordered Speech Motor Control (pp. 413-473) Se-cond Editio. Pro-ed. USA. 2001.
Corresponding Author Slavica Golubovic, Faculty of Special Education and Rehabilitation, University of Belgrade, Serbia, E-mail: [email protected]

Vers
ion fo
r revie
w
2152
HealthMED - Volume 6 / Number 6 / 2012
Journal of Society for development in new net environment in B&H
Abstract
This research aimed at pointing out the determi-nation of the anaerobic threshold by the direct blood lactate measurement with and without prior admini-stration of the warm up protocol in female athletes.
Resesearch sample was drawn from 50 female athletes subjects divided into four groups: 15 non-trained subjects, prior subjected to the warm up protocol, 15 well- trained subjects prior subjected to the warm up protocol, 10 non-trained subjects, who were not prior subjected to the warm up pro-tocol, 10 well- trained subjects who were not prior subjected to the warm up protocol.
Results obtained and presented in this paper show that AT, determined by the direct blood lac-tate measurement, is statistically significant (p < 0,001) in higher values of the heart rate in well- tra-ined subjects compared to the non-trained subjects, equally for those subjected and not subjected to the warm up protocol before the workload test.
Key words: anaerobic threshold, blood lactate, female, athlets, conconi test
Introduction and Aim
Results obtained and presented in this paper show the importance of the AT, determined by the direct blood lactate measurement, during the trai-ning test with the aim to estimate the training status of the female athletes. Physiological principles re-ferring to the physical activity pertain both to men and women but there are quantitative differences in the values of some parameters. Most quantitati-ve parameters related to muscles and activities are smaller in women than those measured in men (1). Muscle capacity is defined by three basic consepts: power, strength, and endurance (2, 3), and it greatly
depends on the supply of the nutrients to the musc-les, that is, on the glycogene deposited in the musc-les prior to the exerted work (4) and the adequate function of the cardiovascular system.
In order to contract a muscle needs energy whi-ch is generated by ATP which releases PO3 group and transforms into ADP thus generating energy, and by releasing one more PO3 group it tranforms into AMP, generating energy as well (4, 5). To re-plenish ATP, which is lacking in muscles, energy is needed and it is generated from the three metabolic systems: phosphocreatinin – crearinin and glyco-gen –lactic acid, which are anaerobic systems, and the aerobic system. The first two anaerobic systems are used by a muscle in short term activity and for a longer activity aerobic system of energy generation is utilized (by means of the oxygen derived from the nutrients whereby great quantity of energy is released (4, 5, 1). For exsessive power muscles use phosphate system, and in prolonged physical aciti-vities they use aerobic system. In between there is a glycogen –lactic acid system that is a specially im-portant supply of energy. Muscles use aerobic way of energy supply but with the increase of physical activities oxygen lacks and the anaerobic system is activated. That breaking point when the aerebic sy-stem of energy supply is transformed into the ana-erobic system is called the anaerobic threshold – AT (6, 7, 8). Anaerobic sytem increasingly gene-rates lactic acid which is accumulated in muscles and then in blood. When the anaerobic threshold is surpassed it is not possible to endure long in this in-tensity regime. Anaerobic threshold is reached be-fore the maximal oxygen consumption, VO2 max so it is expressed in % of VO2 max (6, 7, 8, 9).
The recovery of energy systems in muscles af-ter training load is a complex chemical process that implies the elimination of excessive lactic
Anaerobic threshold determination by direct blood lactate measurement with and without warm up protocol in female athletesIvana Mladenovic Ciric1, Slobodan Stojiljkovic1, Natalija Stefanovic1, Slavisa Djurdjevic2, Ljiljana Bjelakovic1, Danica Pirsl1
1 Faculty of sport and physical education, University of Nis, Serbia,2 Military-medical academy, Belgrade, Serbia.

Vers
ion fo
r revie
w
HealthMED - Volume 6 / Number 6 / 2012
Journal of Society for development in new net environment in B&H 2153
acid and replenishing of the used oxygen (’oxy-gen debit’ ), and the replenishment of the glyco-gen reserve. The replenishment of glycogen lasts for days and not just minutes or hours, which is enough for the replenishment of the phosphagen system and lactic acid system (4, 10).
Oxygen consumption and overall pulmonary ventilation can be increased 20 times in well trai-ned athletes, but the respiratory system is not a de-cisive factor for the oxygen transport in maximal activity. Restriction comes from the cardiovascu-lar system and depends on the tidal and minute volume of blood and heart rate (4, 9, 10).
Concept of Anaeroboc Threshold – AT was in-troduced for the first time in the 60 –ties of the last century, first in the clinical practice and then in sport (11, 12). Lactate system (glycogen – lac-tic acid) is next to the phosphogen system, a se-cond system independent from the oxygen supply into the cells. In the glycogen – lactic acid system energy needed for the resynthesis of ATP is drawn from the carbohydrate breakdown, but only to the pyruvic acid which is then converted into the lactic acid (acidum lacticum) (13). Nowadays, it is well known that the blood lactate concentration in trai-ning and competition workload is extremely high so that the change in lactate concentration serves as an estimation of the training condition of the athlete (14). Workload intensity, when a sudden increase in blood lactate concentration is noticed, increased creation and elimination of CO2, incre-ase in respiratory coefficient and the exponential increase of pulmonary ventilation is designated as the anaerobic threshold (15). Anaerobic threshold is the load where the concentration of the lactic acid reaches a critical value of 4 mmol/l, which is called lactate threshold - LT and denotes the start of its accumulation in the blood (16).
The aim of our research was to determine AT in an adequate administered test of load and he-art rate monitoring, by direct method of the blood lactate measuring in female subjects (well trained and untrained ones) of the federal rank of com-petition in collective sports (basketball, handball, volleyball and football ) and to determine the in-fluence of the prior warm up procedure on the va-lues of the subjects’ anaerobic threshold.
Subjects and methods
Research encompassed 50 female subjects di-vided into four groups:
I group – 15 non-trained subjects, prior subjected to the the warm up protocol,
II group – 15 well- trained subjects prior subjected to the warm up protocol,
III group – 10 non-trained subjects, who were not prior subjected to the warm up protocol,
IV group – 10 well- trained subjects who were not prior subjected to the warm up protocol.
Non-trained subjects complied to the following demands: that they are healthy, they are over 18, and they have given prior written consent to parti-cipate in the research.
Well- trained subjects complied to the fo-llowing demands: that they are healthy, that they are capable of training and competing, are on the senior team in the federal rank of competition, are older than 18, are competing in basketball, han-dball, volleyball and football, and have at least three trainings a week, and have at least three ye-ars sports experience in their respective sports.
All subjects were measured for body weight, body height and age.
Preparation of subjects
Subjects were instructed not to take up any physical activity 48 hours prior to the onset of the test in an adequate sportsware, always the same one, in the morning hours, at the temperature of 21 ± 2Co and relative humidity of 50 ± 5%. All the subjects were informed about the test administra-tion and the protocol.
First group of subjects (non-trained and well- trained) started the test without warm up, with the initial workload of 20W, and each minute the load was increased by 20W . After each minute heart rate and blood lactate were measured.
Second group of subjects (non-trained and well- trained) started the test with the warm up protocole. The warm up protocole envisaged riding a cycle er-gometar with the workload of 20W and the increa-se of the workload by 20W each minute until heart rate (HR) reached 50% of the maximal heart rate for the given age. Only then did they start the test.

Vers
ion fo
r revie
w
2154
HealthMED - Volume 6 / Number 6 / 2012
Journal of Society for development in new net environment in B&H
Sample of variables
Following variables were observed: - Heart rate (HR) by pulse measuring, - Concentration of blood lactate and - Current workload expressed in power unit
(W) in each lap time (in each susequent minute of the workload).
All variables were determined before the test, in any change of the workload, and in the end of the test.
Measuring equipment
A cycle ergometar “Kettler ergometer AX1“ was used, pedalling speed was monitored by its constituent watch mechanism, and the individual workload was defined in power unit (W). Pulsmeter Polar 610i was used for the pulse measurement in a sitting position, after 15 minute rest of the subjects on the cycle ergometar. Time during the test was measured by the stop watch which is the constituent part of the cycle ergometar and pulsemeter.
Blood lactate determination
Concentration of the blood lactate was determi-ned at the onset of the test and after each minute of the test (immediately before the next workload in-crease). Test was abrupted the moment measured blood lactate concentration was equal or bigger than 4 mmol/l. Blood samples were taken from the fingertips by capilet and then transferred to lactate – test strips that were then inserted into the lactate analyzer - Accutrend Menheim and the values of lactates were read in 60 sec. Lactate analyzer was
calibrated according to the known and set lactate standards (0,5 and 15mM).
Statistical data processing
All quantification values obtained were re-gistered as mean values and standard error, and statistical significance was tested by the Student test whereby the value of p< 0,05 was considered statistically significant. The obtained results were shown in Tables and Graphs.
Research results
Age, body weight and body height of the su-bjects were determined before the start of the te-sting, they were statistically processed and shown in Table 1.
The table shows homogeneity of the subjects groups, without statistical differences in age (22 -23), weight (61 – 62 kg) and height (162 – 164 cm), which makes possible the confirmation of the results validity.
Table 2 shows that there is a statistically si-gnificant difference between the well-trained and non-trained subjects who were, prior to the test administration, subjected to the warm up protocol, that is, the anaerobic treshold was determined by the direct measurement of blood lactate which is significantly bigger than (p<0,01) in well-trained when compared to the non-trained subjects.
Table 2 shows that there is a statistically signi-ficant difference between the well-trained and non-trained subjects who were not, prior to the test administration, subjected to the warm up protocol, that is, the anaerobic treshold was determined by the direct measurement of blood lactate which is
Table 1. Age, body characteristics (weight and height) of the subjects tested on blood lactate and heart rate in workload protocol
Subjects N Age Weight (in kg) Height (in cm)Non-trained 25 22, 75±3,42 61,88±5,29 162,52±4,91Well-trained 25 23, 18±4,37 62,87±4,67 164,42±5.07
Table 2. Value of the anaerobic threshold determined by the direct blood lactate measurement (4 mmol/l) in non-trained and well-trained subjects of the federal rank of competition
Groups of subjects Without prior warm up With prior warm upNon-trained (A) 138±5,91 (N=10) (B) 141±4,14 (N=15)Well-trained (C) 154±4,17* (N= 10) (D) 156±3,64* (N=15)
P<0,01(C to A; D to B)

Vers
ion fo
r revie
w
HealthMED - Volume 6 / Number 6 / 2012
Journal of Society for development in new net environment in B&H 2155
significantly bigger than (p<0,01) in well-trained when compared to the non-trained subjects.
Discussion
Results presented in this paper show that AT, which was determined by the direct measurements of the blood lactate is statistically significantly for-med (p < 0,01) at higher values of the heart rate in well trained subjects when compared to the non-trained subjects, equally so in those subjected and those not subjected to the warm up protocol prior to the workload test. This complies with the results of some other authors, that is, organism is capable of reaching the maximal increase of power in a short period of time, whereby later on this power drastically decreases. Endurance mostly depends on the supply of the nutrients to the muscles, that is on the quantity of the glycogen deposited in the muscles before the exerted effort (4, 17). In active muscles aerobic and anaerobic abilities are increa-sed by totally 45% (1,10).
During the intensive work as is the case in elite athletes, glycolisis is so increased that mytochon-driae cannot use pyruvat fast enough to prevent its accumulation in the muscle citosole. Therefore, the process of lactate creation from the pyruvat is increased and the lactic acid is accumulated during high intensity workload, which in turns enables the accumulation of the hydrogen ions in interior area, thus allowing for the occurance of acidosis (12). Grazzi et al. (18,19) state that the indicators of the exerted work that ensue from the energy metabolism during graded workload follow this scheme: aerobic threshold in on 2mmol/l lactate, aerobic – anaerobic threshold is on 2 – 4 mmol/l lactate and anaerobic threshold is on 4mmol/l of the blood lactate of the subjects. Zone of 4 trai-nings (81% - 90%) is the zone where the anae-robic threshold occurs, therefore it is denoted as the zone of the anaerobic threshold. Training in this zone, below the anaerobic threshold, results in the capability of the muscles to breakdown the lactic acid so longer period occurs before the onset of the muscle fatigue. This training intensity deve-lops a high level of the aerobic – anaerobic capa-city, such as the one in the elite athletes (1, 9, 10).
Nowadays, it is well known that the concentra-tion of the blood lactate in competitive or training
workload is attributed a vital role. On the basis of the blood lactate change one estimates the trai-ning capacity of the athletes (18, 19), especially in the cyclic type of activities, and the results of this research undoubtedly point out to this fact.
The application of the functional diagnostics in the athletes represents one of the preconditions of the successful training process implementation. Determination of the blood lactate concentration as a metabolic information is nowadays, due to the advance of the technology, easy and conveni-ent procedure to administer in the labaratory but in the field as well (20). Contemporary trends in the physiology of sport tend to favour simpler and less traumatic methods, so the focus of attention is directed towards the non-invasive methods of AT determination, although one can say that they do not have real verification of the scientific public. Most famous non-invasive method of AT deter-mination is the Conconi test, whose validity is still not adequatelly evaluated.
Special issue in sport is the procedure of warm up before the exertion of any sports activities or wor-kload test administration. A warm up procedure is composed of sport – specific activities with graded incremental of the intensity which aims at prepa-ring the athletes and the subjects for the oncoming activities (testings). Adequate warm up procedure before the sports activities inluences the increase of the body temperature, speeds up metabolic pro-cesses and optimizes the status of the muscle and cardiovascular system (20). If we take into account that warm up influences the value of the anaerobic threshold (21, 22), it is quite clear that it is not real to expect the concordance of the results in the stu-dies where the test was administered after the warm up, with the low workload intensity (20W duration of 4 min) with the studies where the test was admi-nistered after the warm up, with the graded incre-mental workload intensity lasting 15 to 20 minutes (23). Results of this paper do not show statistically significant difference in AT in the subjects that have and have not undergone prior warm up procedure protocol but both groups of subjects, well trained and non trained ones exhibit AT development on a higher level of heart rate frequency.
Direct method of AT determination by means of the blood lactate measurement is a reliable and accurate method but it requires special preconditi-
Vers
ion fo
r revie
w
2156
HealthMED - Volume 6 / Number 6 / 2012
Journal of Society for development in new net environment in B&H
ons because it represents the case of so called “blo-ody method” so it is more appropriate in the rou-tine work in sport to administer the indirect, non- invasive methods such as the Conconi test. Rosić et al (24) have shown that the values of the heart rate where the AT occurs, are statistically higher (p<0,05) when compared to the values when AT is determined by the blood lactate measurement. According to the aforementioned authors the Con-coni test can be used nonetheless because of its easy administration with the precondition to provide the adequate interpretation in the assessment of the tra-ining capability in all sports activities.
Conclusion
Direct method of AT determination by means of the blood lactate measurement is the most re-liable and most accurate method. It can be, and should be used, in the training process in order to estimate the training capability of the athletes. Prior warm up procedure changes AT and conditi-ons its occurance in the higher values of the heart rate when compared to the absence of the warm up procedure administration.
Acknowledgments
We would like to express our gratitude to the Ministry of Education and Science for their sup-port in the project OI 179019 – Biomechanic ef-ficiency in elite Serbian athletes“, and also to the athletes who participated in this research.
Reference
1. Rosić M, Rosić G, Anđelković I. Physiological princi-ples of recreation, in Principles of nutrition and re-creation. Belgrade: University of Singidunum, 2006. (in Serbian).
2. Berne RM and Levy MN. Physiology. Mosby, 4 ed, St. Louis, 1998.
3. Costil L. and Wilmore H. Exercise Physiology. Hu-man Kinetics Publisher, 1994.
4. Guyton Ac and Hall JE. Textbook of medical physiolo-gy. 10 ed, Philadelphia: WB Saunders, 2000.
5. Martin DW, Mayes PA, Rodwell VW, Granner DK. Harpers review of biochemistry, 20 ed, Belgrade: Contemporary administration, 1989.
6. Conconi F, Ferrrari M, Ziglio P G, Droghetti P, and Codeca L. Determination of the anaerobic threshold by a noninvasive field test in runners. J Appl Physiol 1982; 52: 862-873.
7. Conconi F, Grazze G, Casoni I, Guglielmini C, Bor-setto C, Ballarin E, et al. The Conconi test: methodo-logy after 12 years of application. Int J Sports Med. 17: 509-519, 1996.
8. Yeh MP, Gardner RM, Adams TD, Yanowitz FG, Cra-po RO. “Anaerobic threshold”: problems of determi-nation and validation. J Appl Physiol 1983; 55(4): 1178-86.
9. Wilmore JH and Costill DL. Physiology of Sport and Exercise: 3rd Edition. Champaign, IL: Human Kine-tics, 2005.
10. McArdle WD, Katch FI and Katch VL. Essentials of Exercise Physiology: 2nd Edition Philadelphia, PA: Lippincott Williams & Wilkins, 2000.
11. Ozcelik O, Kelestimur H. Effects of acute hypoxia on the determination of anaerobic threshold using the heart rate-work rate relationships during incremen-tal exercise tests. Physiol Res 2004; 53: 45-51.
12. Wasserman K, Beaver WL, Whipp BJ. Gas exchange theory and the lactic acidosis (anaerobic) threshold. Circulation 1990; 81(2): 14 -30.
13. Koraćević D, Bjelaković G, Đorđević V, Nikolić J, Pavlović D, Kocić G. Biochemistry. Belgrade : Con-temporary administration, II edition. 2000. (in Serbian)
14. Green HJ and Patla AE. Maximal aerobic powers: muscular and metabolic considerations. Med Sci Sports Exerc 1992; 24: 38-46.
15. Wassermann K, Whipp BJ, Koyal SN. Anaerobic threshold and respiratory exchange during exercise. J Appl Physiol 1973; 35: 236-43.
16. Billat LV. Use of blood lactate measurements for prediction of exercise performance and control for training. Sports Med 1996; 22: 157-75.
17. Hofmann P, Seibert FJ, Pokan R . Relationship between blood pH, potassium and the heart rate per-formance curve. Med Sci Sports Exerc 1999; 31: 628.
18. Grazzi G, Alfieri N, Borsetto C, Casioni I, Manfre-dini, F, Mazzoni G.M, Conconi F. The power output/heart rate relationship in cycling: test standardiza-tion and repeatability. Med Sci Sports Exerc 1999; 31: 1478 - 83.
19. Grazzi G, Casioni I, Mazzoni G, Uliari S, Conconi F. Protocol of the Conconi test and determination of the heart rate deflection point. Physiol Res 2005; 54: 473-5,

Vers
ion fo
r revie
w
HealthMED - Volume 6 / Number 6 / 2012
Journal of Society for development in new net environment in B&H 2157
20. Bishop D. Performance changes following active warm up and how to structure the warm up. Sports Medicine 2003; 33: 483-98.
21. Chawalbinska-Moneta J, Hanninen O. Effect of acti-ve warming-up on thermoregulatory, circulatory and metabolic responses to incremental exercise in endu-rance trained athletes. Int J Sports Med; 10: 25-9.
22. Shimizu M, Myers J, Buchanan N, Walsh D, Krae-mer M, McAuley P,et al. The ventilatory threshold: method, protocol and evaluator agreement. Am He-art J 1991; 122: 509-16.
23. Renstrom P, Kannus P. Prevention of injuries in en-durance athletes. In: Endurance in sport. Shepard R.J, Astrand P. (eds), Blackwell Science Ltd.
24. Rosić G, Pantović S, Mladenović I and Rosić M. Va-lidity of the Conconi Test in Estimation of Anaerobic Threshold during Cycling. Medicus 2007; 8(3): 93 – 6. (in Serbian).
Corresponding Author Ivana Mladenovic Ciric, Faculty of sport and physical education, University of Nis, Serbia, E-mail: [email protected]

Vers
ion fo
r revie
w
2158
HealthMED - Volume 6 / Number 6 / 2012
Journal of Society for development in new net environment in B&H
Abstract
Background: In this case report we presented the stand-alone posterior approach for hemiverte-bra resection with unilateral laminar hooks.
Case report: The patient was male and five years old. The coronal and sagital X-Rays images showed a failure of vertebral formation, segmen-ted hemivertebra of third lumbar vertebra. The se-gmented hemivertebra caused a thoracolumbar sco-liosis from T12 to L4 (rightside convexity), of 30 degrees (Cobb angle). The patient was submitted to a hemivertebra resection from posterior approa-ch with two unilateral laminars hooks stabilization (superior lamina in L2 and inferior lamina of L4) in association to a compression system and autologus bone graft. The coronal X-Ray image after surgery showed a partial improvement to 25 degrees (Cobb angle) between L2 and L4. After three years of fo-llow up it was not observed system failure (hook pull-out), maintance of curve (25 degrees of Cobb angle) and correction of trunk inbalance.
Conclusion: The hemivertebra resection with posterior approach is safe, with satisfactory correc-tion of scoliosis curve, which means is a good choi-ce for congenital scoliosis surgical treatment.
Key words: Congenital malformations; Scoli-osis; Hemivertebrae .
Introduction
Currently, orthopedic sciences have received important attention [1-5]. Congenital scoliosis is the result of the formation of anomalous vertebral elements that cause the deviation of the vertebral alignment. These changes occur during embryo-
nic development in utero, i.e., in the first six weeks of gestational age [6].
The type of the hemivertebra is the most im-portant factor for the formation of scoliosis and its classification depends on the growth potential and may be characterized by the presence of the growth plate and intervertebral disc [6-8]. The partially segmented hemivertebra is characterized by the presence of an adjacent vertebra with syno-stosis in one of the intervertebral plateaus (i.e., the upper plateau) and the presence of disc and growth plate in the opposite segment (i.e. lower plateau). The non-segmented hemivertebra is attached to adjacent vertebrae (synostosis), not presenting, consequently, disk, and determining the growth plate. Therefore, an angular deviation of lesser magnitude and without potential growth [6, 9].
The treatment depends mainly on the type of he-mivertebra, location, magnitude and progression of curvature. The brace treatment was not very effecti-ve in congenital scoliosis due to the bending stiffne-ss of the primary, however, it is usually effective in secondary flexible curvatures [10, 11]. Surgical tre-atment aims to stop or slow the progression of the curvature and, if possible, restore spinal alignment. The surgical approaches and techniques range from the fusion in situ, associated or not with anterior or posterior instrumentation, with hemiepifisiodesis and resection of the fused hemivertebra [12].
Resection of the hemivertebra is a procedure that allows the restoration of spinal alignment and stabilization (arthrodesis). It is associated with a pronounced neurological risk, however, it is held below the conus, which varies in location depen-ding on the patient's age, it is a safe procedure. This procedure is commonly used for the treatment of
Stand-alone posterior ressection of lumbar hemivertebrae: case reportLuciano M. R. Rodrigues1, Adriano M. Yonezaki1, Fabrício H. Ueno1, Edgar S. Valesin1, Luiz Carlos de Abreu1, Vitor E. Valenti3, Guilherme A. Foizer1, Carlo Milani1
1 Grupo de Coluna da Disciplina de Doenças do Aparelho Locomotor, Santo André, SP, Brazil,2 Laboratório de Escrita Científica, Departamento de Morfologia e Fisiologia, Faculdade de Medicina do ABC, Santo André, SP, Brazil,3 Departamento de Fisioterapiia, Faculdade de Filosofia e Ciências, Universidade Estadual Paulista, UNESP, Presidente Prudente, SP, Brazil.
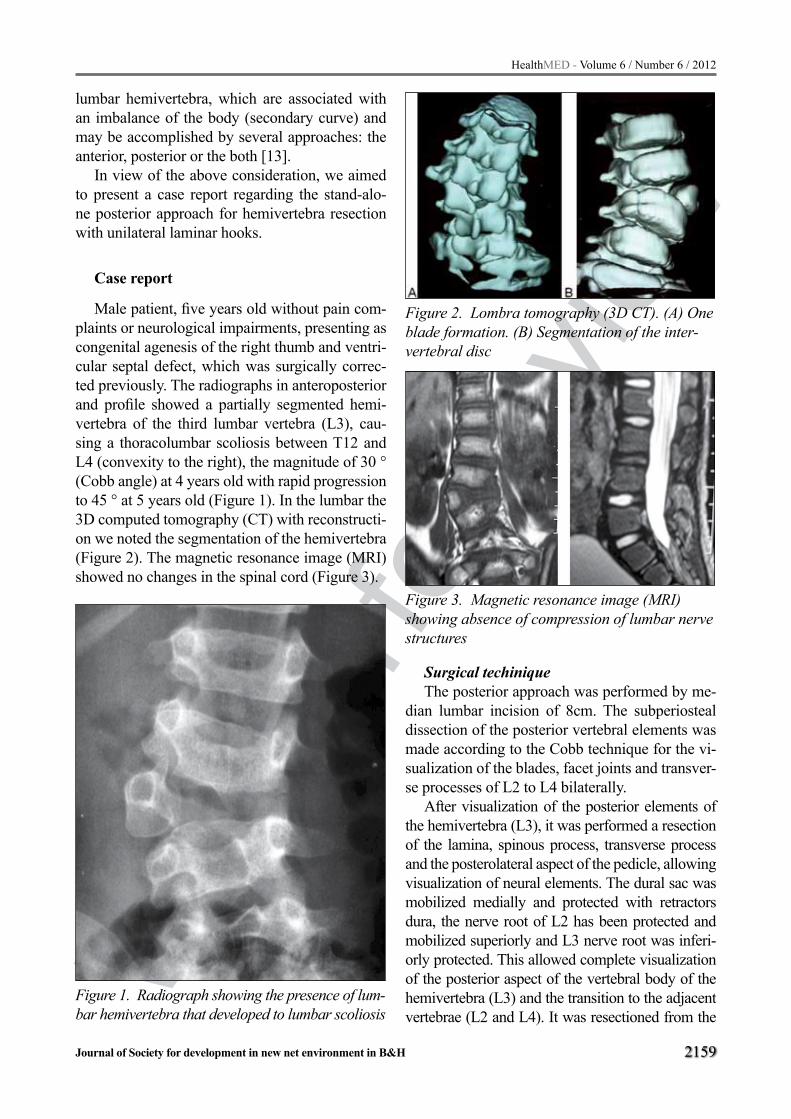
Vers
ion fo
r revie
w
HealthMED - Volume 6 / Number 6 / 2012
Journal of Society for development in new net environment in B&H 2159
lumbar hemivertebra, which are associated with an imbalance of the body (secondary curve) and may be accomplished by several approaches: the anterior, posterior or the both [13].
In view of the above consideration, we aimed to present a case report regarding the stand-alo-ne posterior approach for hemivertebra resection with unilateral laminar hooks.
Case report
Male patient, five years old without pain com-plaints or neurological impairments, presenting as congenital agenesis of the right thumb and ventri-cular septal defect, which was surgically correc-ted previously. The radiographs in anteroposterior and profile showed a partially segmented hemi-vertebra of the third lumbar vertebra (L3), cau-sing a thoracolumbar scoliosis between T12 and L4 (convexity to the right), the magnitude of 30 ° (Cobb angle) at 4 years old with rapid progression to 45 ° at 5 years old (Figure 1). In the lumbar the 3D computed tomography (CT) with reconstructi-on we noted the segmentation of the hemivertebra (Figure 2). The magnetic resonance image (MRI) showed no changes in the spinal cord (Figure 3).
Figure 1. Radiograph showing the presence of lum-bar hemivertebra that developed to lumbar scoliosis
Figure 2. Lombra tomography (3D CT). (A) One blade formation. (B) Segmentation of the inter-vertebral disc
Figure 3. Magnetic resonance image (MRI) showing absence of compression of lumbar nerve structures
Surgical techiniqueThe posterior approach was performed by me-
dian lumbar incision of 8cm. The subperiosteal dissection of the posterior vertebral elements was made according to the Cobb technique for the vi-sualization of the blades, facet joints and transver-se processes of L2 to L4 bilaterally.
After visualization of the posterior elements of the hemivertebra (L3), it was performed a resection of the lamina, spinous process, transverse process and the posterolateral aspect of the pedicle, allowing visualization of neural elements. The dural sac was mobilized medially and protected with retractors dura, the nerve root of L2 has been protected and mobilized superiorly and L3 nerve root was inferi-orly protected. This allowed complete visualization of the posterior aspect of the vertebral body of the hemivertebra (L3) and the transition to the adjacent vertebrae (L2 and L4). It was resectioned from the

Vers
ion fo
r revie
w
2160
HealthMED - Volume 6 / Number 6 / 2012
Journal of Society for development in new net environment in B&H
rest of the pedicle, vertebral body and intervertebral discs. For protection of vascular structures, a retrac-tor was positioned anterior to the vertebral body. The stabilization of the segment was done using the system with two interlaminar hooks (top in L2 and bottom in L4) associated with the compression sy-stem and lock it. After preparing the site of fusion, autologous bone graft (obtained from hemivertebra) was placed posterolaterally between the transverse processes of L2 and L4. At the post operative peri-od, it was used a plaster cast bivalve thoracolumbar during the first three weeks, followed by control X-rays in the following days.
The anteroposterior radiography in the postope-rative control showed partial restoration of the curve to 25° (Cobb angle) between L2 and L4 (Figure 4). After three years of follow-up there was no system failure (release of the hook). There was maintenance of correction - curvature of 25° (L2-L4) -, patient mi-salignment correction and maintenance of the trunk.
Figure 4. Postoperative radiograph showing the attachment and removal of the vertebral body
Discussion
Congenital scoliosis is caused by abnormalities of the spine that cause misalignment of the shaft and promotes biomechanical imbalance of the trunk during growth. A previous study [6] evalua-ted the natural history of congenital scoliosis and demonstrated that the abnormality is most com-monly caused by an unilateral hemivertebra failure of vertebral formation. According to McMaster and David [7], the risk of progression of the deviation (curvature) is related to the type of hemivertebra,
location, number and age [7]. Most of the hemi-vertebra has growth potential due to the presence of the growth plate (subtype targeted and partially-segmented), which further increases the chance of deviation from the alignment of the spine. This de-viation is caused by hemivertebra considered as pri-mary and, in most cases, promotes decompensation of the trunk due to formation of a secondary curva-ture (compensatory). Initially, these secondary cur-vatures present flexibility, however, in most cases, it progresses to the structural rigidity, not able to receive conservative treatment [9]. The secondary deformities that have stiffness are difficult to handle and increase the risk of neurologic impairment [6, 11]. Surgical treatment early in order to counteract the disease progression (progression to secondary curvatures rigid) becomes necessary [12].
According to our study, there was a positive ef-fect of combined approach. Several studies showed that the combined approach (anterior and posterior) provides the correction of curvature between 24% to 71%. Nevertheless, it was observed a marked morbi-dity (blood loss, infection and neurological risk) [14, 15]. The advent of new forms of posterior fixation (pedicle screws and hooks) associated with intraope-rative electrophysiological monitoring allowed the evolution of the technique of hemivertebra resection by posterior approach. Ruf and Harms [16] in 2002, described the results of 21 patients who underwent resection of the hemivertebra by posterior approach with transpedicular instrumentation. The initial cur-vature (Cobb angle) was 41º, which was reduced to 14° in the immediate postoperative period (66% re-duction) and 15º after two years of follow-up. Other studies showed similar results: Shono et al [17] re-ported 12 cases of hemivertebra resection by poste-rior approach with an average correction of around 63.3%. Nakamura et al [18] reported 5 cases with an average correction of 54.3%. Resection of the hemi-vertebra by the posterior approach has been shown to be safe (low rate of complications) and provided satisfactory correction of the curvature.
In our case we chose to use the technique for re-section of the hemivertebra by the posterior approa-ch because of the lower morbidity of the procedure when compared with the combined approach and provided satisfactory results of correction of the cur-vature magnitude. We used instrumentation with la-minar hooks, it allowed the assistance of the correc-

Vers
ion fo
r revie
w
HealthMED - Volume 6 / Number 6 / 2012
Journal of Society for development in new net environment in B&H 2161
tion due to compression of the convex curvature and ensuring a lower risk of injury to nerve structures. Radiography in the immediate postoperative period showed a reduction in curvature in 40% and this re-sult is similar to that found in the literature [17-19]. There were no postoperative complications (infec-tion and neurological deficit). Follow-up after three years showed maintenance of correction of curva-ture in 25º, there was no failure of the instrumenta-tion system (breaking or loosening) and the patient presented secondary correction of misalignment of the trunk. The difficulties found in performing this technique included incomplete resection of the po-sterior portion of the body due to the proximity of the hemivertebra with previous vascular structures, as demonstrated in other studies [15, 17-19]. For this reason, we suggest the implementation of preopera-tive imaging to a proper understanding of the anato-my of bone malformation. The anteroposterior and lateral radiographs allow diagnosis of the anomaly (segmentation fault, training or combined), the loca-tion and number of defects.
In conclusion, resection of the hemivertebra by posterior approach is a safe technique with satis-factory correction of scoliotic curvature. We indi-cated this procedure as a good alternative for the treatment of rigid congenital scoliosis.
Acknowledgements
This study received financial support from FMABC.
References
1. Almeida FS, Mainine S, Abreu LC, Valenti VE, Ferre-ira C, Fonseca FLA, Macedo JR. H, Carvalho TD, Valenti EE, Moreno IL, Gonçalves ACCR, Vander-lei LCM, Mansoldo AC. Muscle lesion treatment in brazilian soccer players: Theory vs. practice. Heal-thMED J. 2012;6:107-112.
2. Sevic S, Stefan-Mikic S, Sipovac D, Turkulov V, Cvjet-kovic D, Doder R. Spondylodiscitis – Current Diago-nosis and Treatment. HealthMED J. 2012;6:81-87.
3. Hojjatollah NB, Khosrow E, Reza RS, Monire MN. Effects of selected combined training on muscle str-ength in Multiple Sclerosis patients. HealthMED J. 2012;6:96-102.
4. Soyuer F, Ünalan D, Elmal F. Musculoskeletal Com-plaints of University Students and Associated Physi-cal Activity and Psychosocial Factor. HealthMED J.
2012;6:294-300.5. Özüm Ü, Balaban H, Yapışlar H, Topakta S. Effects
of magnetic stimulation of cervical spinal cord on main cerebral arterial blood flow. HealthMED J. 2012;5:1993-1999.
6. Winter RB. Congenital scoliosis. Orthop Clin North Am. 1988;19:395-408.
7. McMaster MJ, David CV. Hemivertebra as a cause of scoliosis. A study of 104 patients. J Bone Joint Surg Br. 1986;68:588-95.
8. Weiler C, Lopez-Ramos M, Mayer HM, Korge A, Sie-pe CJ, Wuertz K, Weiler V, Boos N, Nerlich AG. Histo-logical analysis of surgical lumbar intervertebral disc tissue provides evidence for an association between disc degeneration and increased body mass index. BMC Res Notes. 2011;4:497.
9. Bosch B, Heimkes B, Stotz S. Course and progno-sis of congenital scoliosis. Z Orthop Ihre Grenzgeb. 1994;132:363-70.
10. Dimeglio A, Bonnel F. The pediatric spine principles of pediatric neurosurgery. Verlag: Springer: 1989.
11. Orosz M, Tomory I. Congenital scoliosis. Orv Hetil. 1986;127:749-54.
12. Winter RB, Moe JH, Lonstein JE. Posterior spinal arthrodesis for congenital scoliosis. An analysis of the cases of two hundred and ninety patients, five to nineteen years old. J Bone Joint Surg Am. 1984;66:1188-97.
13. Bergoin M, Bollini G, Taibi L, Cohen G. Excision of hemivertebrae in children with congenital scoliosis. Ital J Orthop Traumatol. 1986;12:179-84.
14. Lazar RD, Hall JE. Simultaneous anterior and po-sterior hemivertebra excision. Clin Orthop Relat Res. 1999;364:76-84.
15. Hedequist DJ, Hall JE, Emans JB. Hemivertebra excision in children via simultaneous anterior and posterior exposures. J Pediatr Orthop. 2005;25:60-3.
16. Ruf M, Harms J. Hemivertebra resection by a poste-rior approach: innovative operative technique and first results. Spine. 2002;27:1116-23.
17. Shono Y, Abumi K, Kaneda K. One-stage posterior hemivertebra resection and correction using segmen-tal posterior instrumentation. Spine. 2001;26:752-7.
18. Nakamura H, Matsuda H, Konishi S, Yamano Y. Single-stage excision of hemivertebrae via the po-sterior approach alone for congenital spine defor-mity: follow-up period longer than ten years. Spine. 2002;27:110-5.
19. Ruf M, Harms J. Posterior hemivertebra resection with transpedicular instrumentation: early correction in children aged 1 to 6 years. Spine. 2003; 28: 2132-8.
Corresponding Author Luciano Miller Reis Rodrigues, Grupo de Coluna da Disciplina de Doenças do Apa-
relho Locomotor, Santo André, Brazil, E-mail: [email protected]

Vers
ion fo
r revie
w
2162
HealthMED - Volume 6 / Number 6 / 2012
Journal of Society for development in new net environment in B&H
Abstract
Introduction: Erysipelas is acute dermoepi-dermitis most often caused by group A beta-ha-emolytic streptococci. The disease is more com-mon in females, older age, immunocompromised persons and those suffering from chronic diseases.
Goal: to determine distribution of erysipelas patients related to sex and age, predisposing fac-tors, clinical characteristics related to sex and du-ration of hospitalization.
Methods: Retrospective analysis of medical histories of 86 erysipelas patients (54 females, 32 males) hospitalized at the Clinic for Infectious Di-seases, Clinical centre of Vojvodina during 3-ye-ars period was made. In the studied patients the following parameters were monitored: demograp-hic data (sex, age), predisposing factors for erysi-pelas, clinical characteristics of disease, duration of hospitalization, type and duration of used anti-biotic therapy and outcome of disease. Statistical analysis was performed by using χ2-test and t-test.
Results: Most of involved female patients were 70 to 79 years old; the majority of males were 50 to 59 years old. The most common localization of erysipelas was lower leg, both in females (68.6%) and males (81.3%). The most common clinical form of erysipelas in both sexes was classic form (51.8% of females, 46.9% of males). Most com-mon clinical characteristics in both sexes were fever, general complaints and local signs of infla-mmation, leucocytosis with polynucleosis, eleva-ted sedimentation rate and elevated serum fibrino-gen. When it comes to clinical manifestations of erysipelas, significant differences in relation to sex were not found. There was a statistically signifi-cant difference in terms of average values of ALT (t=3,0323, p<0,05), and average values of AST (t=2,0244, p<0,05) between genders, in favour of males. Average duration of antibiotic treatement
was 15 days in females and 14 days in males. Ave-rage duration of hospitalization was 14 days in fe-males vs. 13 days in males.
Conclusion: In our study erysipelas occurred more often in females. The majority of females with erysipelas belonged to age group of 70-79 years, but males most commonly suffered from erysipelas at age of 50-59 years. The most signi-ficant predisposing factors in both sexes were diabetes mellitus, chronic heart and blood vessel diseases, obesity, and alcohol abuse among males. Erysipelas was clinically expressed most com-monly with fever, general complaints, local signs of inflammation and leucocytosis. There was stati-stically significant increase of alanine- and aspar-tate- aminotranspherase among males. The outco-me of disease was favourable and complications were rare. There was no fatal outcome among studied erysipelas patients. A notable number of relapsing erysipelas cases was recorded.
Key words: erysipelas; group A beta-haemol-ytic streptococcus; clinical presentation.
Clinical presentation of hospitalized erysipelas cases
1. B.T, Clinic for Infectious Diseases, Clinical Centre of Vojvodina
2. D.C, Clinic for Infectious Diseases, Clinical Centre of Vojvodina
3. I. HC, Public Health Institute of Vojvodina4. J.J, Clinic for Infectious Diseases, Clinical
Centre of Vojvodina5. S. SM, Clinic for Infectious Diseases,
Clinical Centre of Vojvodina6. S.S, Clinic for Infectious Diseases, Clinical
Centre of Vojvodina
Clinical presentation of hospitalized Erysipelas casesBranka Tomasev1, Dejan Cvjetkovic1, Ivana Hrnjakovic Cvjetkovic2, Jovana Jovanovic1, Sandra Stefan Mikic1, Sinisa Sevic1
1 Clinic for Infectious Diseases, Clinical Centre of Vojvodina, Serbia,2 Public Health Institute of Vojvodina, Serbia.

Vers
ion fo
r revie
w
HealthMED - Volume 6 / Number 6 / 2012
Journal of Society for development in new net environment in B&H 2163
Introduction
Erysipelas is acute dermoepidermitis that char-acteristically extends into the cutaneous lymphat-ics [1]. In the Middle Ages it was known as St. An-thony's Fire, named after an Egyptian healer who successfully treated the infection [2]. Erysipelas is usually caused by group A beta-haemolytic strep-tococci (Streptococcus pyogenes), less commonly by group C, D and G streptococci. Group B strep-tococci are the most common cause of erysipelas in newborns. Very rarely, a similar skin lesion may be caused by S. aureus [3].
Reservoir of infection is a person with strep-tococcal infection or streptococcal carrier state [4, 5]. Particularly vulnerable are the elderly and immunodeficient persons or those with chronical diseases (diabetes, alcochol abuse, AIDS, neph-rotic syndrome). Predisposing factors for erysip-elas is also skin damaged by malnutrition due to peripheral venous insufficiency or atherosclerosis, increased air humidity and cold, pregnancy [2, 3, 6]. In the neonate, erysipelas may develop from an infection of the umbilical stump [3, 7]. Having the disease does not leave immunity afterwards; on the contrary, disposition for relapses occurs [4].
Erysipelas affects individuals of all races, more commonly female ones [2].
Incubation period lasts from few hours to 3-4 days. The disease starts abruptly with constitutional symptoms: temperature rises to 39,5˚C, accompa-nied by fever, sometimes by nausea and vomiting. Few hours later there are local signs of skin inflam-mation. Inflammation area is clearly demarcated by surrounding healthy skin, expands rapidly (“red wind”) and rises above the plane of the skin due to elastic edema (“erysipelas’ plate”). Affected skin is hot, tight, shiny, skin structure is wiped out (“peau d’ orange”). There is a maximum sensitivity with pal-patory pain at the periphery of erysipelas skin lesion [1, 6]. Untreated disease comes to peak at 5th to 7th day, meanwhile temperature is increased, headache intensifies, the patient is exhausted. Then tempera-ture falls, all signs of infection calm down and dis-appear. After withdrawal of skin inflammation signs, involved skin undergoes desquamation. Untreated, moderate form of erysipelas lasts for 8-10 days [6].
The commonest site of involvement are lower extremities (80%), face, trunk and arms [1,6]. Fa-
cial erysipelas is often preceded by rhinitis or na-sopharyngitis. The changes are first seen on the nose, presenting with butterfly rash, then spread above to the hairy part of head and downward to na-solabial folds [1]. Erysipelas of the scalp is a severe disease with constitutional symptoms, pasty scalp edema with unclear boundaries. Erysipelas of the auricle is usually accompanied by moderate fever, itching of outer ear and ear canal, a sense of tension and tenderness; constitutional symptoms are mild or absent [6].
Clinical forms of erysipelas are: classical, ve-siculous, bullous, haemorrhagic and gangrenous form [4, 6].
According to the predisposing factor and the portal of entry for causative agent, erysipelas may be spontaneous (with unknown or known portal of entry), post-traumatic (due to trauma, fungal in-fection or eczema) and post-operative (after mas-tectomy or vulvectomy) [1, 5].
Complications may be local and general. Lo-cal complications include cellulitis, purulent lym-phadenitis, conjunctivitis, keratitis, retrobulbar phlegmona [1, 6]. Elephantiasis is a late compli-cation occuring due to narrowing of lymphatic vessels and lymphostasis as a consequence of fre-quent episodes of erysipelas. General complica-tions are sepsis, intersticial nephritis, pneumonia, pulmonary thromboembolism, meningitis [1, 8].
Diagnosis of erysipelas is made on the basis of case-history, epidemiological data, clinical find-ing and course of disease. Complete blood count (CBC) reveals leukocytosis with polynucleosis. Sedimentation rate is elevated as well as serum fibrinogen [1, 6]. The differential diagnosis of ery-sipelas includes cellulitis, phlegmona, abscessus, shingles, dacriocystitis, thrombophlebitis [4, 6]. Prognosis is good for properly treated immuno-competent patients [8].
Erysipelas treatment is symptomathic and causal. Sympthomatic therapy includes bed rest, elevation of involved extremity, antipyretics, anti-septic dressing, rehydration, sometimes
diuretics, as well as proper skin care [1, 6]. Causal therapy of choice is a ten-day course of penicillin. In penicillin allergy, antibiotic alterna-tive is erythromycin. Cephalosporins are also used, primarily first-generation [1, 3, 7]. Comparing the consumption of certain groups of medicines

Vers
ion fo
r revie
w
2164
HealthMED - Volume 6 / Number 6 / 2012
Journal of Society for development in new net environment in B&H
(psychotropic and antibiotic drugs) throughout their utilization in Clinical Pharmacy of Clinical Centre of University of Sarajevo (CCUS), during three years and the year 2007, the consumption of antibiotics shows a decreased trend. However, the most increased consumption trend among an-tibiotics is registered for ceftriaxone, ceftazidime, while the most negative consumption trend is reg-istered for cefuroxime [9]. Recurrence should be treated the same way as the first attack. There is no specific prophylaxis [1] .
Goal
- to determine number of erysipelas patients hospitalized at the Clinic for Infectious Diseases, Clinical centre of Vojvodina during three-year period, sex and age distribution and predisposing factors for the occurrence of the disease;
- to determine clinical characteristics of erysipelas (symptoms and physical findings, body temperature, localization and clinical form of erysipelas, laboratory findings, course of disease, type and frequency of complications) related to sex;
- analysis of type and duration of used antibiotic therapy and duration of hospitalization in erysipelas patients related to sex.
Methods
The study is based on a retrospective analysis of medical histories of erysipelas patients hospitalized at the Clinic for Infectious Diseases in Novi Sad from January, 2005 to December, 2007. In the studied pa-tients the following parameters were monitored:
- demographic facts (sex, age); - predisposing factors for erysipelas; - clinical characteristics of disease (symptoms,
physical findings, duration of fever and the average value of body temperature during the first three days of hospitalization, clinical forms and localization of erysipelas, laboratory tests on admission- CBC, biochemical findings of urin, fibrinogen, urea, creatinine, total and direct bilirubin, alanine- aminotranspherase and aspartate- aminotranspherase, serum protein-electrophoresis);
- duration of hospitalization; - type and duration of used antibiotic therapy; - outcome of disease.
Distribution of patients by sex and age, the pre-valence of specific localizations and clinical forms of erysipelas, predisposing factors and clinical characteristics are presented in percentage (%), in the form of tables or charts. Statistical analysis was performed by using the χ2- test and the t- test.
Results
Retrospective analysis revealed that there were 86 patients - 54 females (62.8%) and 32 males (37.2%) treated at the Clinic for Infectious Diseases in Novi Sad, Clinical Centre of Vojvodina under diagnosis of erysipelas during the observed 3-year period. There was no statistically significant sex-related difference among involved patients. Among females suffering from erysipelas, the most common represented age group was 70-79 years (33.3%). The majority of males with erysipelas belonged to age group of 50-59 years (37.5%) (Table 1).Table 1. Age and sex structure of erysipelas patients
Age groups(years)
Genderfemales males
n % n %30-39 - - 1 3.140-49 7 13.0 5 15.650-59 14 26.0 12 37.560-69 12 22.2 7 21.970-79 18 33.3 5 15.680-89 3 5.5 2 6.3Total 54 100.0 32 100.0
χ2=3,38, p>0,05
The most common localization of erysipelas in involved patients was lower leg, both in females (37 - 68.6%) and males (26 - 81.3%) with no si-gnificant sex-related differences (Table 2).
The most common clinical forms of erysipelas among females were classic (28 - 51.8%) and bu-llous form (17 - 31.4%). Males most commonly suffered from classical form (15 - 46.9%) (Chart 1).

Vers
ion fo
r revie
w
HealthMED - Volume 6 / Number 6 / 2012
Journal of Society for development in new net environment in B&H 2165
Table 2. Localization of erysipelas
LocalizationGender
females malesn % n %
face 6 11.1 3 9.4lower leg 37 68.5 26 81.3auricle 3 5.5 - -
arm 5 9.4 1 3.1thigh 3 5.5 1 3,1
buttocks - - 1 3.1Total 54 100.0 32 100.0
χ2=1,52, p>0,05
χ2=1,6, p>0,05Chart 1. Clinical forms of erysipelas among fe-males and males
Table 3 presents clinical characteristics of ery-sipelas. Loss of appetite was present in all patients. Fever was registered in two-thirds of females (36 - 66.7%) and three-quarters of males (23 - 71.9%), but the statistically significant difference between genders was not proven. The average body tem-perature during the first three days of hospitaliza-tion ranged from 35.8°C to 39.2°C (average of 37.2°C) in females, whereas in males it ranged from 36.0°C to 40.0°C (average of 37.1°C).
Chills was present in half (36 - 57.4%) of fe-males and in three-quarters (23 - 78.1%) of males, with no statistically significant sex-related differ-ences. Significant differences in relation to sex were not found when it comes to other clinical manifestations of erysipelas (Table 3).
The most common predisposing factors for deve-lopment of disease in both sexes were chronic heart and vascular disease, diabetes and obesity. In terms of predisposing factors there was no statistically si-gnificant difference between genders (Chart 2).
Table 3. Clinical presentation of erysipelas
Clinical findingsfemales malesn % n %
fever 36 66.7 23 71.9 p>0,05chills 31 57.4 25 78.1 p>0,05
exhaustion 7 13.0 1 3.1 p>0,05vomiting 11 20.4 2 6.2 p>0,05
muscle pain 1 1.8 2 6.2 p>0,05joint pain 2 3.7 1 3.1 p>0,05
local tenderness 30 55.5 20 62.5 p>0,05itching 2 3.7 4 12.5 p>0,05edema 31 57.4 19 59.4 p>0,05redness 49 90.7 29 90.6 p>0,05regional
lymphadenitis 13 24.1 9 28.1 p>0,05
χ2=7,34, p>0,05Chart 2. Predisposing factors for erysipelas
Table 4 shows mean values of laboratory parame-ters in involved patients. In a half (50%) of fema-les there was reduced haemoglobin level, decreased lymphocytes were found in 58%, elevated sedimen-tation rate in 93.9%, and high fibrinogen level in 94% of females. As for males, all of them (100%) had elevated sedimentation rate, 92.6% had high fi-brinogen level, 53.6% had evidence of elevated ALT. Elevated AST was found in 46.4% of males. The-re was a statistically significant difference between genders in favour of males, both in terms of avera-ge values of ALT (t=3,0323, p<0,05), and average values of AST (t=2,0244, p<0,05). There was a di-fference in α2-globulin values in females and males (65.7%/39.1%), but with no statistical significance.
Proteinuria was present in five females (10.4%) and six males (19.3%). The presence of pus in urine was found in 5 females (10.4%) and 2 males (6.4%), while the other urine analyses were normal.

Vers
ion fo
r revie
w
2166
HealthMED - Volume 6 / Number 6 / 2012
Journal of Society for development in new net environment in B&H
Table 4. Average values of laboratory findings among erysipelas patients
Laboratory findingsGender
females maleserythrocytes (x 1014/l) 4.27 4.38 p>0,05hemoglobin (g/l) 118 134 p>0,05leukocytes (x 109/l) 10.4 10.8 p>0,05platelets (x 109/l) 282 259 p>0,05neutrophils (%) 70.3 65.2 p>0,05limphocytes (%) 19.8 21.4 p>0,05monocytes(%) 6.9 7.9 p>0,05ESR 67 58 p>0,05fibrinogen (g/l) 7.02 6.69 p>0,05urea (mmol/l) 7.17 6.18 p>0,05creatinine (mmol/l) 100 99 p>0,05total bilirubin (mmol/l) 9 14 p>0,05direct bilirubin (mmol/l) 2.02 3.1 p>0,05
ALT (J/l) 27 61 t=3,03, p<0,05
AST (J/l) 26 52 t=2,02, p<0,05
total proteins (g/l) 65.0 69.0 p>0,05albumins (g/l) 34.5 38.2 p>0,05α1-globulin (g/l) 3.0 2.7 p>0,05α2-globulin (g/l) 7.6 6.6 p>0,05β-globulin (g/l) 6.9 7.6 p>0,05γ-globulin (g/l) 13.5 14.3 p>0,05
Observing complications of erysipelas among female patients, the most common one was cel-lulitis (9-16.7%), while other complications such as thrombophlebitis (2-3.7%), and phlegmona (2-3.7%) were more rarely recorded. In female pa-tients, the following bacteria were isolated from the fluid taken from bulla: Staphylococcus spp. coagulase negative (3 patients), Acinetobacter spp. (3 patients), Pseudomonas aeruginosa (2 patients), Escherichia coli (1 patient), Enterococcus spp. (1 patient) and Streptococcus agalactiae (1 patient). Identical complications were noted in male patients: cellulitis, as the most common complication (4-12.5%), was followed by phlegmona (1-3.1%) and thrombophlebitis (1-3.1%). Bacteriological exami-nation of the fluid from bulla revealed the presence of Staphylococcus aureus (1 patient), Staphylococ-cus spp. coagulase-negative (2 patients), whereas Candida spp. was isolated from bullae in 1 male.
Relapses of erysipelas were the reason for hos-pitalization in 10 females (18.5%) and 8 males
(25.0%). In other patients, that was the first epi-sode of erysipelas.
Erysipelas had a favourable prognosis in ma-jority of patients of both sexes. On discharge, im-provement was noted in 87% of the affected female patients and even in 93.8% of males, but without statistically significant difference between genders. Three female patients (5.5%) were moved to other wards, either due to deterioration of the underlying disease or physical therapy (Chart 3a and 3b).
χ2=2,28, p>0,05Chart 3a. Outcome of disease among females
Chart 3b. Outcome of disease among males
The examined patients were treated with pe-nicillin, cephalosporins, glycopeptides and sulp-honamides. Average duration of antibiotic treate-ment was 15 days (7-36 days) in females and 14 days (5-23 days) in males. After withdrawl from the hospital, treatment was proceeded in 25 fema-les (46.3%) and 14 males (43.7%).
Average hospital treatment duration was 14 days (range 6-40 days) in females and 13 days (range 3-22 days) in males.

Vers
ion fo
r revie
w
HealthMED - Volume 6 / Number 6 / 2012
Journal of Society for development in new net environment in B&H 2167
Discusion
According to statistics made in England in the period 2002 -2003, among patients hospitalized due to erysipelas, significantly higher proportion belonged to females (65%: 35%) which agrees with the results obtained in our study [10].
The 10-year study of Masmoudi and associ-ates enrolled patients aged from 37-80 years with erysipelas after breast cancer treatment; age of pa-tients from our study was 30-89 years. The major-ity of female patients from our study was in age of 70 - 79 years (33.3%), while most of male patients in our study belonged to the age category of 50 - 59 years (37.5%) [11]. Age delayed appearance of erysipelas in females compared with males could be explained by longer life expectancy and, con-sequently, more frequent chronic diseases in older ages. In England, in year 2002 and 2003, 56% of hospitalized erysipelas patients were aged 15 - 59 years, while the age of 75 years was present in 9% [10]. At the same 2-year period (2002-2003), Gvozdenović and associates from Institute for In-fective and Tropical Diseases, Clinical Center of Serbia, established erysipelas like the most com-mon among patients of the 7th decade (40%) [5].
In seven hospital centers in France, Dupuy and colleagues questioned 129 of 167 hospitalized ery-sipelas patients, according to age, sex and duration of hospitalization, where 5% of them had first episode and 18% relapse of erysipelas [12]. In our study, re-lapsing erysipelas was the reason for hospitalization of total of 18 patients, 10 females (18.5%) and 8 males (25.0%). Other patients suffered from the first episode of illness. In Eriksson and associates’ study (from University Hospital in Sweden), the relapse of erysipelas was the cause of hospitalization in 21% of 229 erysipelas patients [13]. Gvozdenović’ study has revealed even higher incidence of relapses (35%) in 60 erysipelas patients [5].
Dupuy and colleagues in their research found a significant association with erysipelas of the legs and varicose veins or neurological disorders, but the influence of alcohol, diabetes mellitus, smoking and sitting at work on the occurrence of erysipelas of the legs could not be confirmed [12]. Research of Ronnen and associates, which involved 526 adult patients in the Sheba Medical Center from 1972 to 1982, marked a local trauma and superfi-
cial skin lesions as the main predisposing factors for development of erysipelas, while peripheral vascular disease, diabetes mellitus, steroid therapy, radiotherapy essants or radiation are less involved in the development of disease [14]. Contrary to the literature data, the most important predisposing fac-tors for erysipelas in our study in both sexes were chronic heart and vascular disease, diabetes melli-tus and obesity. Such results are probably the con-sequence of well-known inadequate eating habits and unacceptably high smoking rate among human population of Province of Vojvodina.
According to Ronnen’s study, 86% of lesions was localized on the lower extremities, and 5.9% on the face [14], whereas in our study the lower leg - erysipelas was present in 37 (68.5%) females and 26 (81.3%) males, and facial erysipelas in 6 (11.1%) females and 3 (9.4%) males.
Average values of erythrocyte sedimentati-on rate in the study of Masmoudi were about 17 mm/h [11], whereas in our patients were much more - in females on average 67 mm/h, and in ma-les on average 58 mm/h. In research of Gvozde-nović and associates, average values of elevated fibrinogen level were moderate- 5,6 g/l, while we found higher fibrinogen level in our patients- 7,02 g/l among females and 6,69 g/l among males [5].
Significantly higher values of AST and ALT in males could perhaps be explained by deterioration of some underlying hepatic diseases within the co-urse of erysipelas which are more frequent in men, for example, alcocholic liver disease.
Duration of erysipelas treatement was similar in both, our research (for females 7-36 days, an avera-ge of 15 days and for males - 5-23 days, an average of 14 days) and in that one of Masmoudi (11-25 days, an average of 16 days) [11]. According to sta-tistics in England 2002 - 2003, the average duration of hospitalization for erysipelas was 4 days [10], while the average length of hospitalization of our patients was much longer- an average for females was 14 (6–40 days), for males 13 days (3–22 days).
Conclusion
In a retrospective study conducted during three-year period at the Clinic for Infectious Diseases, Clinical Centre of Vojvodina, clinical characteris-tics of erysipelas among 54 female patients and 32

Vers
ion fo
r revie
w
2168
HealthMED - Volume 6 / Number 6 / 2012
Journal of Society for development in new net environment in B&H
male patients were analyzed. In our study erysipelas occured more often in females, mostly at age group of 70-79 years. The most significant predisposing factors in both, males and females, were diabetes mellitus, chronic heart and blood vessel diseases, obesity and plus alcohol abuse among males. Ery-sipelas was most commonly presented with fever, general complaints, local signs of inflammation and leucocytosis. The most common localization were lower extremities in both sexes. There was statis-tically significant increase of alanine-aminotrans-pherase and aspartate-aminotranspherase among males. With proper treatement, the outcome of dis-ease was favourable and complications were rare in most cases. There was no fatal outcome among studied erysipelas patients. A notable number of re-lapsing erysipelas cases was recorded.
Shortcuts
CBC- Complete blood countAST- Aspartate-aminotranspheraseALT- Alanine-aminotranspheraseESR- Erythrocyte sedimentation rate
References
1. Gvozdenović E. Infekcije kože, mekih tkiva i mišića. In: Infektivne bolesti, Medicinski fakultet, Univerzitet u Beogradu; Cibid 2004: 201 - 3.
2. Davis L, Benbenisty K. Erysipelas [eMedicine]. 2006 March [cited 2007 Nov 12]. Available from: http://www.emedicine.com/derm/topic129.htm.
3. Pasternack MS, Swartz MN. Cellulitis, Necrotizing Fasciitis, and Subcutaneous Tissue Infections. In: Mandell GL, Bennett JE, Dolin R. Principles and Practice of Infectious Diseases. 7th ed. Churchill Liv-ingstone, Philadelphia 2010: 1289- 312.
4. Mihaljević F, Fališevac J, Bezjak B, Mravunac B. Specijalna klinička infektologija. Jumena – Jugoslo-venska medicinska nauka, V prerađeno i dopunjeno izdanje; Zagreb 1985; 488.
5. Gvozdenović E, Dulović O. Erizipel danas. Med Pregl 2007; LX (5-6):282-6.
6. Dimić E. Bakterijska oboljenja. In: Akutne infektiv-ne bolesti, Medicinski fakultet, Univerzitet u Novom Sadu, III prerađeno izdanje; Novi Sad 2006: 39 – 44.
7. Bisno AL, Stevens DL. Streptococcus pyogenes. In: Mandell GL, Douglas RG, Bennett JE. Principles and Practice of Infectious Diseases; Churchill Living-stone, New York 2010; 2593-610.
8. Nochimson G. Erysipelas [eMedicine]. 2006 June [cited 2007 Nov 12]. Available from: http://www.emedicine.com/emerg/topic172.htm.
9. Loga-Zec S, Loga S, Mulabegovic N, Asceric M. Con-sumption Trend of Psychotropic and Antibiotic Drugs in Clinical Centre of University of Sarajevo (CCUS). HealthMED; DRUNPP, Sarajevo 2011; 5 (2): 419-26.
10. Hospital statistics about erysipelas [wrongdiag-nosis.com]. 2007 December [cited 2008 Jan 18]. Available from:http://www.wrongdiagnosis.com/e/erysipelas/hospital.htm.
11. Masmoudi A, Maaloul J, Turki H, Elloumi Y, Marrek-chi S, Bouassida S, et al. Erysipelas after breast can-cer treatment (26 cases). 2005 [cited 2008 Jan 18]. Dermatology Online Journal 11(3):12. Available from: http://lib.bioinfo.pl/pmid:16409908.
12. Dupuy A, Benchikhi H, Roujeau JC, Bernard P, Vaillant L, Chosidow O, et al. Risk factors for erysip-elas of the leg (cellulitis): case-control study [BMJ 1999]. 1999 June [cited 2008 Jan 18]; 318 (7198): [1591-4]. Available from: http://www.bmj.com/cgi/content/full/318/7198/1591.
13. Eriksson B, Jorup- Rönström C, Karkkonen K, Sjö-blom AC, Holm SE. Erysipelas: clinical and bac-teriologic spectrum and serological aspects. 1996 November [cited 2008 Jan 18]. Clin Infect Dis; 23(5): [1091-8]. Available from: http://lib.bioinfo.pl/pmid:8922808.
14. Ronnen M, Suster S, Schewach-Millet M, Modan M. Erysipelas. Changing faces. 1985 April [cited 2008 Jan 18]. Int J Dermatol 24(3): [169-72]. Available from: http://lib.bioinfo.pl/pmid:3997339.
Corresponding Author Branka Tomasev, Clinical Center of Vojvodina, Clinic for Infectious Diseases, Novi Sad, Serbia, E-mail: [email protected]

Vers
ion fo
r revie
w
HealthMED - Volume 6 / Number 6 / 2012
Journal of Society for development in new net environment in B&H 2169
Abstract
Objectives: The purpose of this paper is to review the research on team effectiveness in hos-pital management. The literature was reviewed to regulate how the idea of team effectiveness, defi-ned and what recommendations have been made as to how to manage hospitals.
Review methods: A search of OVID recourses, ISI Web of Science and googlescholar was conducted which combined the keyword search terms “team”, ‘‘team effectiveness’’, “hospital”, ‘‘hospital mana-gement’’, “management”, “administration”, High quality studies were selected and collective with stu-dies identified to the authors. The article was further developed according to the management knowledge of the author in hospital management. We also con-tacted manufacturers and researchers in the field and considered articles published in english language.
Results: The results relating to team effective-ness were few; therefore ‘hospital management’ was included which increased the amount of ma-terial. References that were deemed useful from bibliographies of relevant journal articles were included. The inclusion criteria were articles that provided information about the effectiveness and, hospital management backgrounds.
Conclusion: Most of the literature empha-ses on the cognitive aspects of hospital manage-ment. This generic approach can, lead to hospital management. A growing body of literature also confirms that effective work groups have become more important in hospitals, as pressures grow to manage resources more effectively and complexi-ty increases. The paper shows that team working approach can help to manage resources, improve task performance, learning and communication.
Key words: Team effectiveness, hospital, ma-nagement
Introduction
Most managers believe teamwork is important to the success of their department and company [1]. Research into team effectiveness has traditionally searched for characteristics of effective teams. Qu-antitative evaluations of specific interventions have largely been inconclusive and emphasized the need for further research [2]. There is a great interest in studying organizational teams. This interest is con-cerned with the increasing use of teams in hospitals [3]. Members of organizational teams are interde-pendent in a number of ways. In many cases, team members depend on each other for individual task completion. Such task interdependence needs to be distinguished from outcome interdependence, that is, the extent to which team members’ outcomes depend on their personal or team performance [4]. The importance of teamwork to delivering heal-thcare, a better understanding of how teams functi-on effectively will be invaluable for educating and developing teams. Hospitals and other organizati-ons can be dissected into anatomical and physiolo-gic subsystems: space, equipment, personnel, tasks, policies and rules, hierarchy, cost control, gover-nance, etc. These systems have to work together to achieve organizational goals and in doing so form healthy and effective beings. Hospital effectiveness has made enormous strides in the last two hundred years. Hospital management is much more sophi-sticated today.
The last years have seen its development from amateur status to skilled professionalism. This mi-ght explain why administratively caused efficiency differences may have diminished. Currently, two parts of hospital organization lag far behind: medi-cal staff organization and governance. Physicians are only beginning to become interested in mana-gement and most trustees remain amateurs. Perhaps
Team Effectiveness in Hospital Management: A literature ReviewDavoud Adham1, Bahram Delghoshaei1, Seyedin Seyed Hesam1, Masoud Salehi2
1 Health Services Management Department, School of Health Management and Medical Information Sciences, Tehran University of Medical Sciences, Tehran, Iran,2 Biostatistics Department, School of Health Management and Medical Information Sciences, Tehran University of Medical Sciences, Tehran, Iran.

Vers
ion fo
r revie
w
2170
HealthMED - Volume 6 / Number 6 / 2012
Journal of Society for development in new net environment in B&H
this is why studies in these areas show strong associ-ations with hospital effectiveness. Perhaps in twen-ty years these areas will have improved sufficiently that these correlations will vanish. Healthcare teams are often large, due to norms of professional repre-sentation, regardless of contribution to patient care. Further, it is often unclear as to whether patients and their families are team members[5]. The purpose of this paper is to report on a team effectiveness lite-rature review. While almost concentrated on team effectiveness in hospital management, this paper broadens the focus to include team effectiveness in hospital management. Also, while it is important to recognize team effectiveness sources and effects prior to exploring hospital management, this study addresses these foundational matters but then emp-hasizes team effectiveness in hospital management interventions and research articles on management teams were reviewed to determine the methods used to study these teams, with the aim of developing an understanding that can serve as the base for research of team effectiveness in hospital management.
Defining team and team effectiveness
There are many typologies have identified di-fferent types of teams. Work teams, Parallel te-ams, Project teams, Management teams. The re-search in management teams define effectiveness as firm performance and use objective measures. The most common rated variables are return on equity[6, 7] return on assets[8, 9] sales growth[10, 11] total return to shareholders change in sales and change in profitability.[11] Nevertheless, other studies consider decision quality[12, 13] contribu-tion to decision[14] Share information[6] and task performance.[15, 16]
Variables at the team-level of analysis and rated with subjective measures. Attitudinal outcomes are also taken into account for assessing effectiveness of management teams. Specifically, some of these vari-ables are consensus understanding and commitment to the decision[16] And satisfaction. Few studies fo-cus on behavioral outcomes, although turnover from both the team and the firm is studied the most.
There is general agreement that teams contain a small, manageable number of members, who have the right mix of skills and expertise, who are all co-mmitted to a meaningful purpose, with achievable
performance goals for which they are collectively responsible[17]. Teams are an important part of the functioning of an organization. They can be signifi-cant contributors to the effectiveness of organizati-ons or can cause problems and restrict organizatio-nal success [18]. Teams are defined as work groups that are charged with the fulfillment of a performan-ce task that requires joint cooperation. This distingu-ishes them clearly from other groups, which might instead seek to attain individual learning results that are acquired in groups, or merely cultivate social and other forms of contacts [19]. Teams have beco-me a basic building block in organizations [4, 20]. In this paper we are defining management teams.
The research in management teams define ef-fectiveness as firm performance and use objective measures. The most common rated variables are return on equity, return on assets, sales growth, total return to shareholders, change in sales and change in profitability[3]. team members must in-tegrate and synchronize strategies and activities to achieve the objections of the team [21]. To better understand team effectiveness, team performance is evaluated in terms of inter-team productivity and intra-team productivity. Team effectiveness is based on team performance, which is the extent to which the groups’ productive output meets the approval of customers, interdependent functio-ning, which is the extent to which the team is inter-reliant on one another, and team satisfaction, whi-ch is the extent to which the team is satisfied with team membership[22]. Other categorized dimen-sions related to group member behavior in pro-blem-solving situations as socio-emotional, task, and negative reactions[23].Team effectiveness can be evaluated by five broad principal variables: performance, behavior, attitude, team member style, and corporate culture[1]. The effectiveness of a health care team improves clinical outcomes, patient safety, the care environment for the patient and his or her family, and the work atmosphere and culture for practicing clinicians [24].
Origins of team effectiveness
There is broad consensus in the literature about the defining features of teams. Regular communica-tion, coordination, distinctive roles, interdependent tasks and shared norms are important features. Most

Vers
ion fo
r revie
w
HealthMED - Volume 6 / Number 6 / 2012
Journal of Society for development in new net environment in B&H 2171
commonly, teams are viewed as a three-stage sy-stem where they utilize resources (input), maintain internal processes (throughput) and produce specific products (output). Assuming this model, the neces-sary antecedent conditions (input) together with the processes (throughput) of maintaining teams defi-ne the characteristics of effective teams. Analysis of antecedent conditions and team processes often highlight issues for team development and training. In contrast, outcomes (output) are generally used to judge or evaluate team effectiveness [5]. Sources of team effectiveness in management were previously categorized in two types of models of team effec-tiveness can be distinguished. The first one is uni-dimensional and uses objective measures of team performance or of the degree of real productivity. The second one is multidimensional, since it sup-poses that team effectiveness depends on something else apart from performance or productivity .Seve-ral models have been developed under the multidi-mensional perspective. Thus, apart from performan-ce, satisfaction was aggregated by Shiflett[25] and Gladstein[26] . Cummings [27] and Hackman [28] and colleagues considered satisfaction and commi-tment, Sundstrom[29] et al. clustered satisfaction and commitment in team viability. Finally, Cohen and Bailey categorized effectiveness into three ma-jor dimensions according to the team’s impact:[30]
1. Performance effectiveness (productivity, efficiency);
2. Attitudinal outcomes (satisfaction, commit-ment and trust in management); and
3. Behavioral outcomes that included absen-teeism, turnover or safety.[3]
Team effectiveness is defined as performance and employee satisfaction [26]. More explicitly, [31]defines it as the degree to which a group’s output meets requirements in terms of quantity, quality, and timeliness (performance); the group experience improves its members’ ability to work as a group in the future (behavior), and the group experience contributes to individual satisfaction (attitude). This definition makes team effectivene-ss a function of performance, attitude, and beha-vior. There are different models available in the literature to measure team effectiveness and each of them makes reference to specific and neces-sary characteristics for teams to become effective.
Trying to identify the most relevant and common characteristics among these models, Adams et al.
Developed a framework to assist in the facilita-tion and measurement of effective teamwork[32]. In this model, seven constructs were identified as characteristics that need to be present during the team process for it to be effective. The seven con-structs are productive conflict resolution, mature communication, accountable interdependence, clearly defined goals, common purpose, role clari-ty and psychological safety.
Adams et al. presented this functional relation-ship symbolically as: TE =f (p, b, a)
(Team effectiveness (TE) is a function of per-formance (P), behavior (B), and attitude (A).) Functional relationship can be expanded to inclu-de corporate culture (C):
TE =f (p, b, a, m, c)
Team effectiveness (TE) is a function of perfor-mance (P), behavior (B), attitude (A), team mem-ber style (M), and corporate culture (C).)
A simple alternative representation of this rela-tionship is shown in figure 1.
Figure 1. Relationship of team effectiveness function
Team effectiveness in hospital management
Teams in health care organizations have a long, established tradition. However, despite health te-ams’ potential contributions to diagnosis, problem solving, and patient well-being, experienced team practitioners have warned of the teams’ fragility.
It is important to remember that teams have thin skins; there are not many forces holding them

Vers
ion fo
r revie
w
2172
HealthMED - Volume 6 / Number 6 / 2012
Journal of Society for development in new net environment in B&H
together in relation to those potentially able to pull them apart. The forces that hold a team together are patient needs, institutional support, satisfac-tion with effective work, respect and friendship, and an understanding of the diagnostic process. Professional rivalries, misunderstanding the role of patient splitting, personal competitiveness, and lack of understanding of the collaborative problem solving process [33].
Hospitals have been offering health promotion in response to external social, political, and eco-nomic forces. These include community benefit laws, unsustainable health care spending, low ran-kings internationally for health status measures, decreasing workforce productivity, and desire for improved quality of life [34]. The tasks of hospital management can be described as pertaining to two large areas: quality management and allocation of resources [35]. Cooperation and communication has become even more important in health care, and teams can be seen at many levels in health care organizations, for example between professi-onals in primary health care and in special pro-jects such as child protection. Inside and between departments in hospitals, communication and co-operation is necessary for the protection of both staff and patients, as regulation and public accoun-tability becomes ever more unforgiving [36].
Literature review methodology
This review emphasized the team effectiveness in hospital management literatures given the cen-tral importance of the team effectiveness literatu-re to this area and the author’s home discipline of hospital management. Literature from social and organizational and interprofessional practice per-spectives remain to be thoroughly considered.
Search methods for identification of studies
We searched the Ovid Resources and web of sci-ences ISI for related reviews and the following elec-tronic databases for primary studies Ovid Resources:
- Journals Ovid Full Text December 30, 2011, - EBM Reviews - Cochrane Central Register
of Controlled Trials 4th Quarter 2011, - EBM Reviews - Cochrane Database of
Systematic Reviews 2005 to December 2011,
- EBM Reviews - Database of Abstracts of Reviews of Effects 4th Quarter 2011,
- Ovid MEDLINE(R) In-Process & Other Non-Indexed Citations and Ovid MEDLINE(R) 1948 to Present,
- Ovid MEDLINE(R) Daily Update November 16, 2011
- ISI Web of Science (1975 to present) - Search strategies for primary studies
incorporate the methodological component of the OVID sources search strategy combined with selected index terms and free text terms. We translated the OVID search strategy into the other databases using the appropriate controlled vocabulary as applicable.
Full strategies for all databases are included in Appendix A.
Searching other resources - We hand searched the Google scholar. - We browsed the reference lists of all papers
and relevant reviews identified. - We e-mailed authors of other reviews in the
field of effective qualified practice apropos relevant studies of which they may be conscious.
Search terms
The terms used for search purposes included, but were not limited to: search terms “team”, ‘‘team effectiveness’’, ‘‘hospital management’’, “management”, “administration”. Exclusion/in-clusion criteria due to the breadth of subjects cove-red, the literature review concentrates on research published from 2001 to 2011. The study excluded research published before 2001 and also excluded non-English language publications.
One hundred and eighty-one unique papers were referenced in the OVID resources, ISI web of sciences and googlscholar database. One hun-dred and sixty-six papers were dropped because they clearly fell outside the fundamental parame-ters of the literature review. Fifty papers to be con-sidered it had to focus on team effectiveness. The 6 remaining papers were excluded because irrele-vant setting Finally 8 paper include for this study. Figure 2, Appendix 1
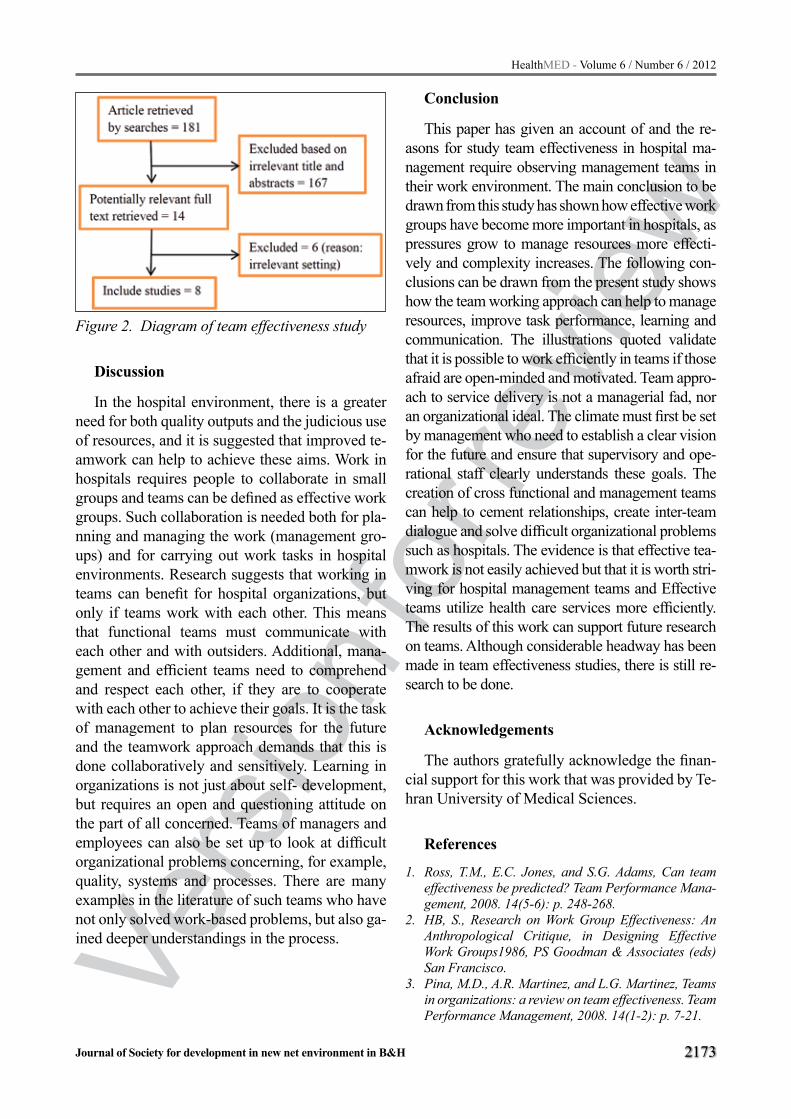
Vers
ion fo
r revie
w
HealthMED - Volume 6 / Number 6 / 2012
Journal of Society for development in new net environment in B&H 2173
Figure 2. Diagram of team effectiveness study
Discussion
In the hospital environment, there is a greater need for both quality outputs and the judicious use of resources, and it is suggested that improved te-amwork can help to achieve these aims. Work in hospitals requires people to collaborate in small groups and teams can be defined as effective work groups. Such collaboration is needed both for pla-nning and managing the work (management gro-ups) and for carrying out work tasks in hospital environments. Research suggests that working in teams can benefit for hospital organizations, but only if teams work with each other. This means that functional teams must communicate with each other and with outsiders. Additional, mana-gement and efficient teams need to comprehend and respect each other, if they are to cooperate with each other to achieve their goals. It is the task of management to plan resources for the future and the teamwork approach demands that this is done collaboratively and sensitively. Learning in organizations is not just about self- development, but requires an open and questioning attitude on the part of all concerned. Teams of managers and employees can also be set up to look at difficult organizational problems concerning, for example, quality, systems and processes. There are many examples in the literature of such teams who have not only solved work-based problems, but also ga-ined deeper understandings in the process.
Conclusion
This paper has given an account of and the re-asons for study team effectiveness in hospital ma-nagement require observing management teams in their work environment. The main conclusion to be drawn from this study has shown how effective work groups have become more important in hospitals, as pressures grow to manage resources more effecti-vely and complexity increases. The following con-clusions can be drawn from the present study shows how the team working approach can help to manage resources, improve task performance, learning and communication. The illustrations quoted validate that it is possible to work efficiently in teams if those afraid are open-minded and motivated. Team appro-ach to service delivery is not a managerial fad, nor an organizational ideal. The climate must first be set by management who need to establish a clear vision for the future and ensure that supervisory and ope-rational staff clearly understands these goals. The creation of cross functional and management teams can help to cement relationships, create inter-team dialogue and solve difficult organizational problems such as hospitals. The evidence is that effective tea-mwork is not easily achieved but that it is worth stri-ving for hospital management teams and Effective teams utilize health care services more efficiently. The results of this work can support future research on teams. Although considerable headway has been made in team effectiveness studies, there is still re-search to be done.
Acknowledgements
The authors gratefully acknowledge the finan-cial support for this work that was provided by Te-hran University of Medical Sciences.
References
1. Ross, T.M., E.C. Jones, and S.G. Adams, Can team effectiveness be predicted? Team Performance Mana-gement, 2008. 14(5-6): p. 248-268.
2. HB, S., Research on Work Group Effectiveness: An Anthropological Critique, in Designing Effective Work Groups1986, PS Goodman & Associates (eds) San Francisco.
3. Pina, M.D., A.R. Martinez, and L.G. Martinez, Teams in organizations: a review on team effectiveness. Team Performance Management, 2008. 14(1-2): p. 7-21.

Vers
ion fo
r revie
w
2174
HealthMED - Volume 6 / Number 6 / 2012
Journal of Society for development in new net environment in B&H
4. De Dreu, C.K., Cooperative outcome interdependen-ce, task reflexivity, and team effectiveness: a motiva-ted information processing perspective. Journal of Applied Psychology, 2007. 92(3): p. 628-38.
5. Mickan, S. and S. Rodger, Characteristics of effective teams: a literature review. Australian Health Review, 2000. 23(3): p. 201-208.
6. Bunderson, J.S. and K.M. Sutcliffe, Comparing al-ternative conceptualizations of functional diversity in management teams: Process and performance effects. Academy of Management Journal, 2002: p. 875-893.
7. Finkelstein, S. and D.C. Hambrick, Top-management-team tenure and organizational outcomes: The mode-rating role of managerial discretion. Administrative Science Quarterly, 1990: p. 484-503.
8. Murray, A.I., Top management group heterogeneity and firm performance. Strategic Management Jour-nal, 1989. 10(S1): p. 125-141.
9. Wiersema, M.F. and K.A. Bantel, Top management team turnover as an adaptation mechanism: The role of the environment. Strategic Management Journal, 1993. 14(7): p. 485-504.
10. Eisenhardt, K.M. and C.B. Schoonhoven, Organi-zational growth: Linking founding team, strategy, environment, and growth among US semiconductor ventures, 1978-1988. Administrative Science Quar-terly, 1990: p. 504-529.
11. Simons, T. Top management team consensus, hetero-geneity, and debate as contingent predictors of com-pany performance: The complementarity of group structure and process. 1995.
12. Amason, A.C., Distinguishing the effects of functio-nal and dysfunctional conflict on strategic decision making: Resolving a paradox for top management teams. Academy of Management Journal, 1996: p. 123-148.
13. Janssen, O., E. Van De Vliert, and C. Veenstra, How task and person conflict shape the role of positive interdependence in management teams. Journal of management, 1999. 25(2): p. 117-141.
14. Kirchmeyer, C. and A. Cohen, Multicultural groups. Group & Organization Management, 1992. 17(2): p. 153.
15. Jehn, K.A., A multimethod examination of the bene-fits and detriments of intragroup conflict. Admini-strative Science Quarterly, 1995: p. 256-282.
16. Schweiger, D.M., W.R. Sandberg, and J.W. Ragan, Group approaches for improving strategic decision making: A comparative analysis of dialectical inqui-ry, devil’s advocacy, and consensus. Academy of Ma-nagement Journal, 1986: p. 51-71.
17. Mickan, S.M., Evaluating the effectiveness of health care teams. Australian Health Review, 2005. 29(2): p. 211-217.
18. Cacioppe, R. and R. Stace, Integral team effectivene-ss: validity analysis of a theory-based team measure. Team Performance Management, 2009. 15(5/6): p. 220-234.
19. Glasl, F. and R. Ballreich, Team and organisational development as a means for conflict prevention and resolution. Berghof Handbook of Conflict Transfor-mation, Berlin: Berghof Research Centre for Con-structive Conflict Management, 2003.
20. Cohen, S.P., et al., Evolving intergroup techniqu-es for conflict resolution. Journal of Social Issues, 1997. 33(1): p. 165-189.
21. Graff, D., M. Koria, and T. Karjalainen, Modelling Research into Cross-functional Team Effectiveness.
22. Harris, C., An overview of team effectiveness. Retri-eved July, 2008. 7: p. 2008.
23. Watson, W., et al., Team processes, team conflict, team outcomes, and gender: An examination of US and Mexican learning teams. International Journal of Intercultural Relations, 2008. 32(6): p. 524-537.
24. Andreatta, P.B., A typology for health care teams. He-alth Care Management Review, 2010. 35(4): p. 345.
25. Shiflett, S., Toward a general model of small group pro-ductivity. Psychological Bulletin, 1979. 86(1): p. 67.
26. Gladstein, D.L., Groups in context: A model of task group effectiveness. Administrative Science Quar-terly, 1984: p. 499-517.
27. Cummings, N.A. and G.R. VandenBos, The twenty years Kaiser-Permanente experience with psychot-herapy and medical utilization: Implications for na-tional health policy and national health insurance. Health Policy Quarterly, 1981.
28. Gersick, C.J.G. and J.R. Hackman, Habitual routi-nes in task-performing groups. Organizational Be-havior and Human Decision Processes, 1990. 47(1): p. 65-97.
29. Sundstrom, E., K.P. De Meuse, and D. Futrell, Work teams: Applications and effectiveness. American Psychologist, 1990. 45(2): p. 120.
30. Cohen, S.G. and D.E. Bailey, What makes teams work: Group effectiveness research from the shop floor to the executive suite. Journal of management, 1997. 23(3): p. 239-290.
31. Hackman, J.R., Group influences on individuals in organizations. 1992.
32. Adams, S., L. Simon, and B. Ruiz, A Conceptual Mo-del for the Development and Facilitation of Effective Teamwork. Submitted for publication to Journal for Quality and Participation, 2001.
33. Frances Nason MSW, L., Diagnosing the hospital team. Social Work in Health Care, 1984. 9(2): p. 25-45.
34. Olden, P.C. and K.E. Hoffman, Hospitals’ health promotion services in their communities: Findings from a literature review. Health Care Management Review, 2011. 36(2): p. 104.
35. Biller-Andorno, N., C. Lenk, and J. Leititis, Ethi-cs, EBM, and hospital management. J Med Ethics, 2004. 30(2): p. 136-40.
36. Ingram, H. and T. Desombre, Teamwork in heal-th care: lessons from the literature and from good practice around the world. Journal of Management in Medicine, 1999. 13(1): p. 51-59.

Vers
ion fo
r revie
w
HealthMED - Volume 6 / Number 6 / 2012
Journal of Society for development in new net environment in B&H 2175
Corresponding Author Delghoshaei Bahram, Health Services Management Department, School of Health Management and Medical Infor-
mation Sciences, Tehran University of Medical Sciences, Tehran, Iran, E-mail: [email protected]
Appendix A
Literature Review Search StrategyWe searched the Ovid Resources: Journals@
Ovid Full Text December 30, 2011, EBM Revi-ews Cochrane Central Register of Controlled Tri-
als 4th Quarter 2011, EBM Reviews - Cochrane Database of Systematic Reviews 2005 to Decem-ber 2011, EBM Reviews - Database of Abstracts of Reviews of Effects 4th Quarter 2011, Ovid MEDLINE(R) In-Process & Other Non-Indexed Citations and Ovid MEDLINE(R) 1948 to Pre-sent, Ovid MEDLINE(R) Daily Update Novem-ber 16, 2011, ISI Web of Science and googlesc-holar. Search terms were limited to publication dates ranging from 2001 to 2011 (inclusive). We also contacted manufacturers and researchers in the field. A summary of the database searches that were performed during the process of conducting the review is set out below.
Database SearchesDatabase Searched Search Terms Results
ISI Web of Science
team effectiveness + management 20team effectiveness + management + hospital 8
Team + management + hospital 33hospital + administration + team 6
Journals@Ovid Full Text December 30, 2011,
Management + hospital 2Team effectiveness 4
Management + effectiveness + hospital 3Management + Team + hospital 2
Team effectiveness + Management 26
EBM Reviews - Cochrane Central Register of Controlled Trials 4th
Quarter 2011,
Management + hospital 1Team effectiveness -
Management + effectiveness + hospital 2Management + Team + hospital -
Team effectiveness + Management -
Ovid MEDLINE(R) In-Process & Other Non-Indexed Citations and
Ovid MEDLINE(R) 1948 to Present,,
Management + hospital 8Team effectiveness 14
Management + effectiveness + hospital 10Management + Team + hospital 9
Team effectiveness + Management 32
Ovid MEDLINE(R) Daily Update November 16, 2011
Management + hospital -Team effectiveness 1
Management + effectiveness + hospital -Management + Team + hospital -
Team effectiveness + Management -Total 181

Vers
ion fo
r revie
w
2176
HealthMED - Volume 6 / Number 6 / 2012
Journal of Society for development in new net environment in B&H
Abstract
Aim The aim of this review paper was to de-termine the effects of physical exercise on redu-cing body weight and body composition of per-sons between 40 and 64 years of age on the basis of collected data and analyzed papers published between 1998 and 2010 year.
Methods Literature search was made using the following search bases: MEDLINE, Google Scho-lar, CINHAL, EMBASE, Kobson, DOAJ. Papers were selected based on several criteria. The reducti-on of body mass and body composition were parti-cularly emphasized, that subjects were not suffering from other diseases except they were obese and that study only involves physical activity (exercise) and physical activity combined with diet during weight reduction of obese. In addition to the request that study included middle-aged people between 40 and 64 year and that they were over-weight (BMI> 25 kg/m2) or obese (BMI> 30 kg/m2), was the criteria that study was longitudinal.
Results The combination of exercise (either ae-robic or resistance training) and diet has shown the best results in the reduction of body weight. Sta-tistically significant differences (p <0.01) was not found between continuous and interval work when the volume and intensity of exercise was equal.
Conclusion Moderate physical activity for middle aged people (40-64 year) in combination with reduced calorie intake has positive impact on body fat and body weight reduction.
Key words: adiposity, exercise, fat, body mass index, obesity
Introduction
Physical activity is defined as any bodily mo-vement produced by skeletal muscles that result
in energy expenditure (1). It was found that the inactivity is associated with many types of dise-ases such as hypertension, Diabetes mellitus type 2, osteoporosis, cardiovascular and respiratory di-seases (2-4). The level of physical activity is often used as a parameter for monitoring and evaluation of public health and almost always associated with health status. This monitoring is especially im-portant for those middle-aged (40-64) people for the prevention of many diseases, but also for the reducing of mortality rate. Obesity is considered one of the most important public health problems and according to evaluation the second most co-mmon cause of mortality that can be successfully prevented. It is believed that almost 30% of obese adults were obese in childhood. The main diffe-rence is that the obesity among these individuals is in much worse stage than among those who were not obese in childhood. In the last decades in most countries there is increase in prevalence of obesity in adulthood that have reached epidemic proporti-ons in all industrialized countries (5).
There are many factors that may influence obe-sity, and the most important are: hereditary fac-tors, social conditions, lifestyle, eating habits and physical activity level and environment factor. Pa-rental obesity itself may have an impact on obesity of children through genetic factors and environ-mental factors within the family. The greatest risk for the developing of obesity in adulthood are the overweight parents and obesity in the period from three to ten years (6).
Parent obesity does not have too much influ-ence in children after the tenth year of life because it is considered that after ten years the main cause of excessive obesity is an energy intake (7). Some of the research results on twins have confirm the predisposition of obesity as a factor of inheritance
The Effects of Physical Exercise on Reducing Body Weight and Body Composition of Obese Middle Aged People. A Systematic reviewZoran Milanovic1, Sasa Pantelic1, Nebojsa Trajkovic1, Goran Sporis2, Marko Aleksandrovic1
1 Faculty of Sport and Physical Education, University of Niš, Niš, Serbia,2 Faculty of Kinesiology, University of Zagreb, Zagreb, Croatia.

Vers
ion fo
r revie
w
HealthMED - Volume 6 / Number 6 / 2012
Journal of Society for development in new net environment in B&H 2177
with 50-70% (8). It can also be viewed body mass index (BMI) in children, which largely depends on the BMI of biological parents. If both parents are obese, about 80% of their children will be obese. In other case, if only one parent is obese the frequency decreases to 40%. Finally, if neither parent is obese the prevalence of obesity is only 14% (9). Obesity is a chronic disease characterized by increased fat depots. It can be characterized as increasing body fat mass to a degree that leads to damage the health and development of a series of complications (10). When the people of secondary age are included in the program of physical exercise it is very important to respect the recommendations regarding the in-tensity and frequency in order to avoid side effects. Recommendations for people between 40 and 60 years of age include physical activity of moderate intensity, 30 minutes and more 3-5 times a week, however more recent recommendations suggest everyday physical activity (11). The U.S. Surgeon General's Report recommends weekly physical ac-tivity in the volume of consumption of 1.000 kcal / week (or 150 kcal / day).
The most common variety of activities for this population are walking, gardening and house working (12). Although aerobic activities domi-nate, it is now recommended to use strength ex-ercises to compensate the loss of muscle mass of the aging process and so reduce the risk of falls and injuries. The aim of this review paper was to determine the effects of physical exercise on re-ducing body weight and body composition of per-sons between 40 and 64 years of age on the basis of collected data and analyzed papers published between 1998 and 2010 year.
Methods
Literature search Literature search was made using the following
search bases: MEDLINE, Google Scholar, CIN-HAL, EMBASE, Kobson, DOAJ. For a more clo-sely defined search we have limited only to works that are problem of this study and the following key words were used: effect, prevalence, obesity, physical activity, overweight, diet and adult. With advanced search of the literature only those pa-pers that were published in the period from 1998 to 2010 were taken into consideration. In addition,
references from all papers were reviewed to find additional scientific studies that explored the same or similar field.
The selection of works and data collectionPapers were selected based on several criteria of
which the reduction of body mass and body com-position were particularly emphasized as both re-present the primary goal. Second requirement for the acceptance of the study was that subjects were not suffering from other diseases except they were obese, so that our research results would suggest a wrong conclusion about the impact of these ot-her diseases compared only with those who were obese. The third requirement for the study selecti-on was that study only involves physical activity (exercise) and physical activity combined with diet during weight reduction of obese. Since these are the physical effects of exercise on body weight re-duction, the fourth requirement is that the study was longitudinal. In addition to the request that study included middle-aged people between 40 and 64 year, was the criteria that subjects were over-weight (BMI> 25 kg/m2) or obese (BMI> 30 kg/m2).
Theoretical approach to the problemFor the collection and review of the papers des-
criptive method along with the theoretical analysis was used. Study included 20 closely associated re-search papers with the effects of physical exercise on obesity which were carefully analyzed and also respond to all criteria for selection. In the initial literature search 345 references were identified, which respond to some of the research criteria. However, 325 were eliminated on the basis of se-lection and other criteria (Figure 1). Collected and analyzed papers are shown in Table 1. Each re-search is shown by the following parameters: the sample of subjects referred to the number of parti-cipants, age, sex, body mass and body mass index (BMI). Experimental treatment included the dura-tion of exercise program, the number of groups, exercise program that has been applied in resear-ch, diet and the results of the study. The number of participants has quite varied from research to re-search so that the smallest number of participants were 22 in research Donnely, Jacobsen, Heelan, Seip, Smith, (13) and the largest number of parti-cipants was 130, in the research Layman, Evans,
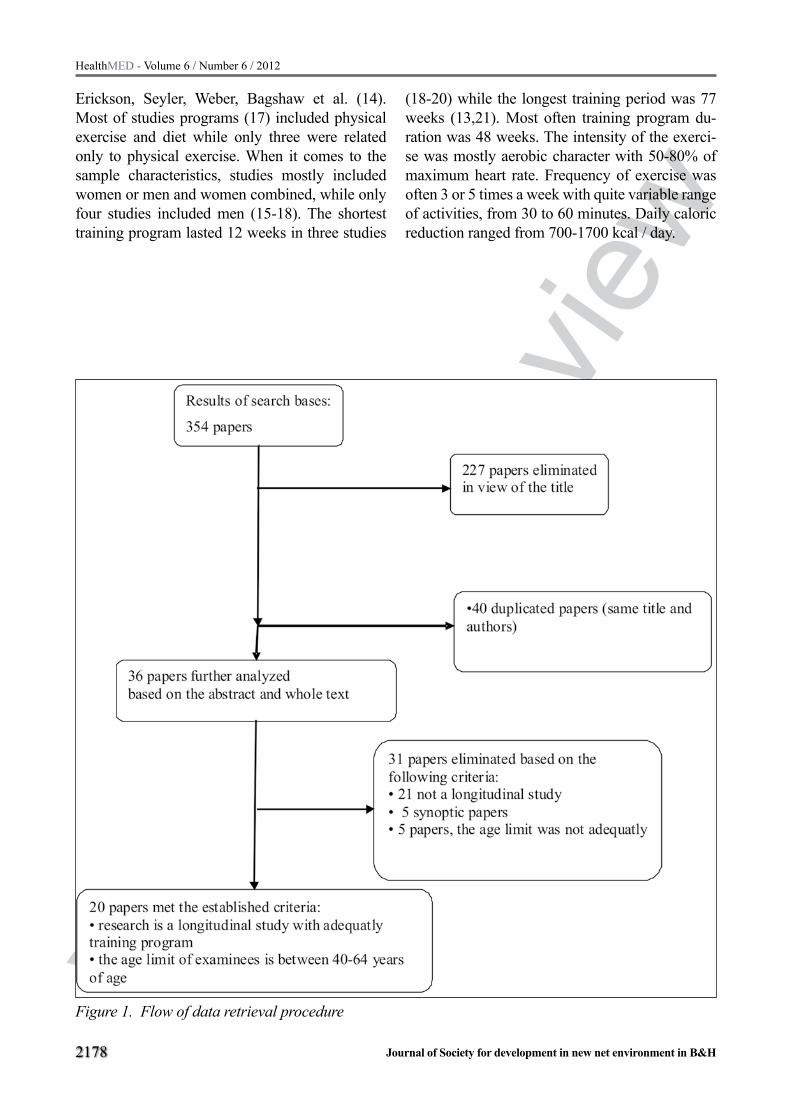
Vers
ion fo
r revie
w
2178
HealthMED - Volume 6 / Number 6 / 2012
Journal of Society for development in new net environment in B&H
Erickson, Seyler, Weber, Bagshaw et al. (14). Most of studies programs (17) included physical exercise and diet while only three were related only to physical exercise. When it comes to the sample characteristics, studies mostly included women or men and women combined, while only four studies included men (15-18). The shortest training program lasted 12 weeks in three studies
(18-20) while the longest training period was 77 weeks (13,21). Most often training program du-ration was 48 weeks. The intensity of the exerci-se was mostly aerobic character with 50-80% of maximum heart rate. Frequency of exercise was often 3 or 5 times a week with quite variable range of activities, from 30 to 60 minutes. Daily caloric reduction ranged from 700-1700 kcal / day.
Figure 1. Flow of data retrieval procedure

Vers
ion fo
r revie
w
HealthMED - Volume 6 / Number 6 / 2012
Journal of Society for development in new net environment in B&H 2179
Firs
t aut
hor,
ye
ar
Part
icip
ants
Expe
rim
enta
l pro
gram
Res
ults
Num
ber
of su
bjec
tsM
ean
age
sex
Body
wei
ght (
kg)
BMI
Prog
ram
du
ratio
nN
umbe
r of
grou
psEx
erci
se p
rogr
amdi
et (k
cal/
day)
Kuk
onen
- H
arju
la et
al.
2005
9042
M95
.3±6
.633
±2.6
24 w
eeks
a) w
alki
ng
b) re
sista
nce
train
ing
c) co
ntro
l gro
up
Thre
e tim
es p
er
wee
k fo
r 45
min
. a)
60-
70%
V
O2m
ax.
b) 6
0-80
% 1
RM
(8x3
)
Body
mas
s (k
g)a)
and
b) m
ean
-14.
2BM
I (kg
/m
2 )-4
.1
Fat m
ass
(kg)
Foge
lhol
m et
al
. 200
082
40F
80±9
.834
±3.6
12 w
eeks
a) 2
-3h
wal
king
w
eekl
y b)
4-6h
wal
king
w
eekl
yc)
cont
rol g
roup
a) 5
0% H
RR
b)60
% H
RR
Body
mas
s (k
g)
a) -3
.5±4
.75
b) -2
.6±1
1.35
c)+2
.0±9
.85
BMI (
kg/
m2 )
Fat m
ass
(kg)
a)-2
.3b)
-1.7
c) n
o ch
ange
And
erse
n et
al.
1999
4042
.9±8
.3F
89.2
±11.
632
.9±4
.316
wee
ksa)
aero
bic
b) w
alki
ng o
nsta
irs
a)fa
st w
alki
ng 4
5 m
in. a
day
. 3 ti
mes
pe
r wee
k
b) 3
0 m
in. o
f gr
owin
g ac
tivity
se
para
ted
into
few
pa
rts
1200
Body
mas
s (k
g)a)
- 8.
3±3.
8b)
– 7
.9±4
.2
%BF
(%)
a)-4
1.9
b)-4
5.5
Fat m
ass
(kg)
a)-7
.4b)
-6.2
FFM
(kg)
a)-0
.5b)
-1.4
Leer
mar
kers
et
al.
1999
6750
.8±2
.1M
+F86
.4±9
.530
.8±4
.524
wee
ks
a)ex
perim
enta
lb)
expe
rimen
tal
with
die
t c)
cont
rol g
roup
Indi
vidu
al w
alki
ng
for 3
0 m
in a
day,
5 tim
es a
wee
k
1200
w
oman
15
00 m
an
Body
mas
s (k
g)a)
- 8.
5b)
- 9.
0
Tabela 1. The effects of physical exercise on reducing body weight in obese people

Vers
ion fo
r revie
w
2180
HealthMED - Volume 6 / Number 6 / 2012
Journal of Society for development in new net environment in B&H
Wad
den
et a
l. 19
9877
44.2
±7.7
F95
.8±1
5.3
36.5
±5.7
48 w
eeks
a) o
nly
diet
b)
die
t and
aero
bic
exer
cise
c) d
iet a
nd
resis
tanc
e tra
inin
gd)
die
t, re
sista
nce
train
ing
and
aero
bic e
xerc
ise
3 tim
es a
wee
k in
tens
ity; 1
1-15
ac
cord
ing
to B
org
scal
e (ae
robi
c ex
erci
se);
11-1
4 x
2 se
ts (re
sista
nce
train
ing)
1200
-150
0 Bo
dy m
ass
(kg)
a) -1
7.7±
5.7
b) -1
5.8±
6.8
c) -1
7.8±
8.8
d) -1
8.6±
7.3
Wei
nsto
ck et
al
. 199
845
43.3
±1.1
F96
.9±2
.235
.9±0
.948
wee
ks
a) o
nly
diet
b)
die
t and
aero
bic
exer
cise
c) d
iet a
nd
resis
tanc
e tra
inin
g
3 tim
es a
wee
k 1-
28
wee
ks an
d 2
times
a w
eek
for 2
8-48
w
eeks
; a)
step
aero
bic f
or 1
2-40
min
pro
gres
sivel
y do
sed
b) 1
1 ex
erci
se b
igge
r m
uscl
e gro
ups,
10-
14 re
petit
ions
925
Body
mas
s (k
g)
Mea
n w
eigh
t lo
ss w
as 1
3.8,
no
stat
istic
al
signi
ficar
ion
betw
een
grou
ps
Ros
elan
d et
al.
2001
186
49.2
±2.5
M28
.6±3
.548
wee
ks
a) d
iet g
roup
b)
train
ing
grou
p c)
di
et an
d tra
inin
g gr
oup
d) co
ntro
l gr
oup
Aer
obic
trai
ning
, fas
t w
alki
ng, j
oggi
ng; 3
tim
es a
wee
k fo
r 60
min
Body
mas
s (k
g)
a) -
1.4
b) -
1c)
- 2.
4d)
- 0.
1
BMI (
kg/
m2 )
a)-1
.3b)
-0.3
c)-1
.8d)
0.3
%BF
(%)
a)-1
.4b)
-1.0
c)-2
.4d)
-0.1
Fat m
ass
(kg)
a)-1
.2b)
-0.9
c)-1
.1d)
0.05

Vers
ion fo
r revie
w
HealthMED - Volume 6 / Number 6 / 2012
Journal of Society for development in new net environment in B&H 2181
Cox
et a
l.
20
0359
42.4
±5.0
M96
.3±1
3.9
31.1
±3.9
16 w
eeks
a) i
c) co
ntro
l and
m
oder
ate e
xerc
ise
b) i
d) in
tens
ive
exer
cise
(bic
ycle
)
a) i
c) o
nes o
r tw
ice
a wee
k le
ss th
an
30m
in b
) i d
) 3 ti
mes
a
wee
k fo
r 30
min
a) i
b)
with
out
c)
i d)
120
0
Body
mas
s (k
g)
a) +
1b)
- 3.
2c)
- 8.
0d)
- 12
.2
%BF
(%)
a) -1
.5b)
-0.1
c) -1
5.6*
d) -1
5.6*
Don
nelly
et a
l. 20
0022
51.5
±8.5
F83
.6±9
.42
31.2
±3.8
77 w
eeks
a)co
ntin
uing
ex
erci
se
b)
exer
cise
with
re
sts th
roug
h fa
st w
alki
ng
a)3
times
a w
eek
aero
bic e
xerc
ise fo
r 30
min
. 60-
75%
max
b)
5 tim
es a
wee
k fo
r 15
min
., tw
ice a
day
Body
mas
s (k
g)a)
- 1.
7±5.
55b)
- 0.
8±13
.1
BMI (
kg/
m2 )
a)-0
.78
b)-0
.20
%BF
(%)
a)-1
.76
b)-0
.54
Fat m
ass
(kg)
a)-2
.11*
b)-0
.63
Laym
an et
al.
20
0548
46.6
±1.4
F87
.6±3
.932
.9±1
.516
wee
ks
a)di
et 1
b) d
iet +
exer
cise
c)di
et 2
d)
die
t 2 +
exer
cise
a)hi
gh p
rote
in d
iet
b)m
oder
ate w
alki
ng
5 tim
es a
wee
k fo
r 30
min
. + d
iet A
c)
low
pro
tein
die
t d)
wal
king
5 ti
mes
a
wee
k an
d re
sista
nce
exer
cise
2 ti
mes
a
wee
k +
diet
B
1700
Body
mas
s (k
g)
a) -
8.7±
4.75
b) -
9.8±
4.25
c) -
7.8±
3.25
d) -6
.7±2
.75
Lean
mas
s (k
g)
a) -2
.0*
b) -0
.4c)
-2.7
d) -1
.0*
Fat m
ass
(kg)
a) -5
.9*
b) -8
.8*
c) -5
.0*
d) -5
.5*

Vers
ion fo
r revie
w
2182
HealthMED - Volume 6 / Number 6 / 2012
Journal of Society for development in new net environment in B&H
Nie
man
et a
l.
2002
9145
.6±1
.1F
89.9
±1.5
33.1
±0.6
12 w
eeks
a) d
iet
b)ae
robi
c exe
rcise
c)
diet
and
aero
bic
exer
cise
d)
cont
rol g
roup
a)co
mbi
natio
n of
str
etch
ing
and
diet
, 4
time p
er w
eek
x45
min
b)w
alki
ng 5
tim
es
a wee
k 25
-45m
in
c)di
et +
wal
king
5
times
a w
eek
for
25-4
5min
uta
d)w
ithou
t die
t onl
y str
echi
ng 4
tim
es a
w
eek
for 4
5 m
inut
a
1200
-130
0
Body
mas
s (k
g)
a) -7
.8±0
.2b)
- 5.
0±2.
85c)
- 4.
1±0.
5d)
- 0.
8±2.
45
BMI (
kg/
m2 )
a) -2
.9*
b) -
0.3
c) -
2.9*
d) -0
.3
%BF
(%)
a) -4
.2*
b) -1
.0c)
-3.7
*d)
-1.1
Ros
s et a
l.
2000
5244
.6±1
.2F
97.5
±10.
931
.3±2
.012
wee
ks
a)di
et g
roup
b)ex
erci
se w
ith
body
wei
ght
redu
ctio
n c)
cont
rol
grou
p
a)on
ly d
iet
b) f
ast w
alki
ng an
d m
oder
ate r
unni
ng
on tr
eadm
ill 8
0%
Hrm
ax u
ntil
700k
cal
was
spen
t
700
Body
mas
s (k
g)
a) -
7.4±
0.9
b) -
7.6±
0.6
c) n
o ch
ange
BMI (
kg/
m2 )
a) -2
.4*
b) -2
.4*
c) n
o ch
ange
Fat m
ass
(kg)
a) -4
.8b)
-6.1
c) n
o ch
ange
Laym
an et
al.
2009
130
(5
8M)
(7
2Ž)
45.2
±1.2
M+
F91
.7±2
.032
.6±0
.748
wee
ksa)
diet
170
0 +e
xerc
ise
b)d
iet
3400
+ex
erci
se
Mod
erat
e wal
king
5
times
per
wee
k.
Ove
rall
100m
in/
wee
k w
ithou
t di
ffere
nce i
n gr
oups
1700
for
wom
en
1900
for
men
Body
mas
s (k
g)a)
- 8
.2±0
.5b)
- 7.
0±0.
5
Lean
mas
s (k
g)a)
-2.4
b) -2
.2
Fat m
ass
(kg)
a) -6
.6*
b) -4
.9

Vers
ion fo
r revie
w
HealthMED - Volume 6 / Number 6 / 2012
Journal of Society for development in new net environment in B&H 2183
Jans
sen
et a
l.
2002
3840
.1±6
.7F
90.8
±14.
533
.7±4
.116
wee
ks
a)ae
robi
c exe
rcise
+d
iet
b)
resis
tanc
e tra
inin
g +d
iet
c)
diet
onl
y
a)ae
robi
c exe
rcise
5
times
per
wee
k fo
r 15-
60 m
in in
co
mbi
natio
n w
ith
diet
b)re
sista
nce t
rain
ing
3 tim
es p
er w
eek
+ di
et. C
ircle
met
hod
(7 ex
erci
se; 8
-12
times
)
1000
Body
mas
s (k
g)
a) -
10.0
±3.9
b) -
11.1
±4.4
c) -
10.1
±3.1
BMI (
kg/
m2 )
a)-4
.2*
b)-3
.9*
c)-4
.0
Fat m
ass
(kg)
a)-9
.9*
b)-8
.6*
c)-7
.8
Hay
s et a
l.
2004
3460
.5±2
.3M
+ F
89±5
.830
.8±1
.514
wee
ks
a)hi
gh p
rote
in d
iet
b) h
igh
prot
ein
diet
+ ex
erci
se c
) co
ntro
l gro
up
a) h
igh
prot
ein
diet
b) 4
tim
es p
er w
eek
bicy
cle e
rgom
eter
80
%H
rmax
. 45
min
+die
t
1900
Body
mas
s (k
g)
a) -
3.2±
1.2*
b) -
4.8±
0.9*
c)-0
.1±0
.6
BMI (
kg/
m2 )
a)-1
.1*
b)-1
.5*
%BF
(%)
a)-2
.2*
b)-3
.5*
c)0.
2
Ash
et a
l.
20
0976
48±1
3M
+ F
90.3
±10.
134
±5.5
48 w
eeks
a) d
iet g
roup
b)
diet
and
exer
cise
c)
cont
rol g
roup
a)re
gula
r die
tb)
mod
erat
e aer
obic
ex
erci
se15
00Bo
dy m
ass
(kg)
a) -
5.6
b) -7
.8
Foge
lhol
m et
al
. 199
985
43±3
.1F
88.2
±6.3
3412
wee
ksa)
wal
king
b)
wal
king
c) co
ntro
l gr
oup
a)w
alki
ng 2
-3h
per
wee
k w
ith re
duct
ion
of 1
000k
cal
b)w
alki
ng 4
-6h
per
wee
k w
ith re
duct
ion
of 2
000k
cal
1000
-200
0
Body
mas
s (k
g)
a) -1
3±0.
7b)
-12.
6±0.
7c)
-13.
5±0.
6
Fat m
ass
(kg)
a)-8
.9b)
-8.6
c)-8
.9
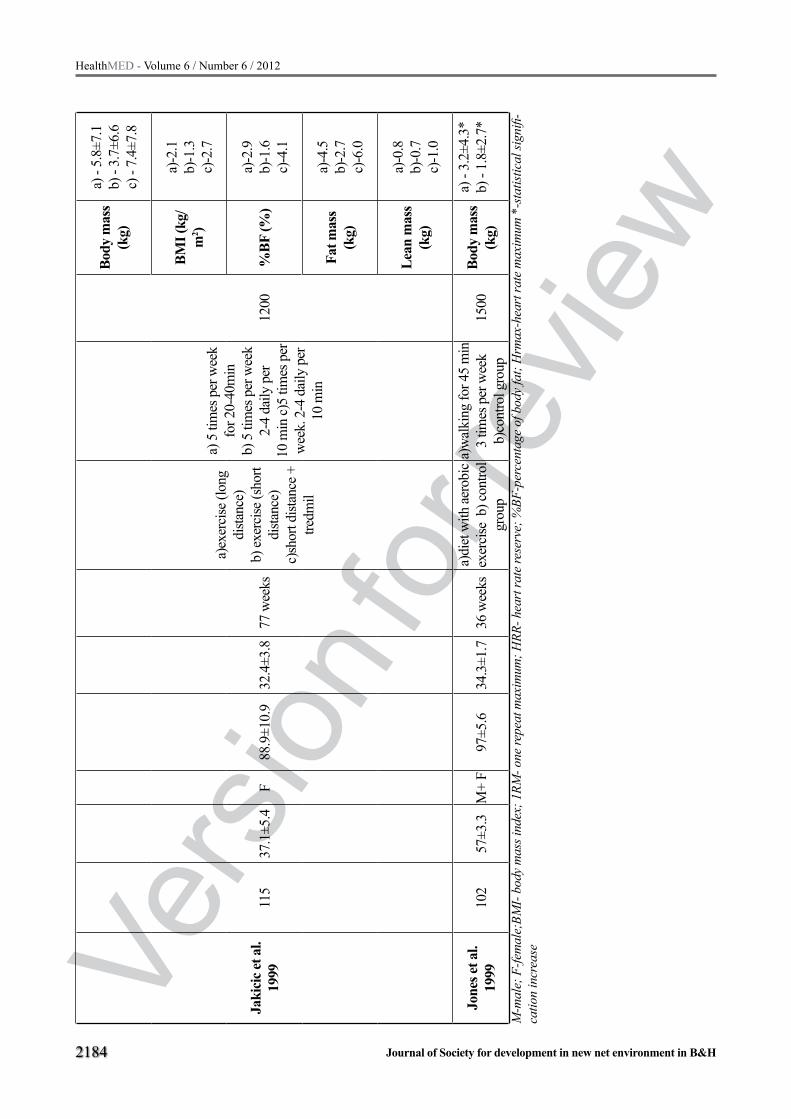
Vers
ion fo
r revie
w
2184
HealthMED - Volume 6 / Number 6 / 2012
Journal of Society for development in new net environment in B&H
Jaki
cic e
t al.
19
9911
537
.1±5
.4F
88.9
±10.
932
.4±3
.877
wee
ks
a)ex
erci
se (l
ong
dista
nce)
b)
exer
cise
(sho
rt di
stanc
e)
c)sh
ort d
istan
ce +
tre
dmil
a) 5
tim
es p
er w
eek
for 2
0-40
min
b)
5 ti
mes
per
wee
k 2-
4 da
ily p
er
10 m
in c)
5 tim
es p
er
wee
k. 2
-4 d
aily
per
10
min
1200
Body
mas
s (k
g)
a) -
5.8±
7.1
b) -
3.7±
6.6
c) -
7.4±
7.8
BMI (
kg/
m2 )
a)-2
.1b)
-1.3
c)-2
.7
%BF
(%)
a)-2
.9b)
-1.6
c)-4
.1
Fat m
ass
(kg)
a)-4
.5b)
-2.7
c)-6
.0
Lean
mas
s (k
g)
a)-0
.8b)
-0.7
c)-1
.0
Jone
s et a
l.
1999
102
57±3
.3M
+ F
97±5
.634
.3±1
.736
wee
ksa)
diet
with
aero
bic
exer
cise
b) c
ontro
l gr
oup
a)w
alki
ng fo
r 45
min
3
times
per
wee
k
b)co
ntro
l gro
up15
00Bo
dy m
ass
(kg)
a) -
3.2±
4.3*
b) -
1.8±
2.7*
M-m
ale;
F-fe
mal
e;BM
I- bo
dy m
ass i
ndex
; 1RM
- one
repe
at m
axim
um; H
RR- h
eart
rate
rese
rve;
%BF
-per
cent
age
of b
ody
fat;
Hrm
ax-h
eart
rate
max
imum
*-s
tatis
tical
sign
ifi-
catio
n in
crea
se

Vers
ion fo
r revie
w
HealthMED - Volume 6 / Number 6 / 2012
Journal of Society for development in new net environment in B&H 2185
Results
The duration of exercise was different and ran-ged in a wide range so that the shortest program was 12 weeks in two studies (18,20), and the lon-gest was 77 weeks, also in two studies (13,21). However, most studies lasted 48 weeks, and it co-uld be considered as an optimal period in which physical exercise may be experiencing its results and effects on the reduction of body weight. Also this period is sufficient to establish the possible yo-yo effects of using diet or exercise. In longi-tudinal studies where the effects of physical exer-cise are determined, a huge problem is a dropout sample, with about 35% of the sample that haven’t finished the program (13,19- 24)
Frequency, intensity and type of training programNumber of groups was different and ranged from
at least two groups (19, 22), to 4 groups. The largest number of studies (12,15,18,25-28) was designed with two experimental groups and one control gro-up. Exercise programs were mostly aerobic from low to moderate intensity in the form of walking or jogging in combination with different diets for re-ducing caloric intake. In several studies (15,26) ap-part for the use of regular exercise, strength training as a circular training method was added for the ma-jor muscle groups, with moderate intensity of 10-15 repetitions. Caloric intake has been quite variable so that it ranged from 700 kcal / day in the study Ross et al. (18) up to 1900 kcal / day in research Hays et al. (27). Research Layman et al. (14) had a special diet for men (1900 kcal / day) and especially for women (1700 kcal / day). Drastic differences have not been observed for the reduction of body weight using different low-protein diets (- 7.8 ± 3.5 kg) and high-protein diets (8.7 ± 4.75) regardless of what type of exercise was combined (23,29).
An average value of weight loss has quite vari-ed. The best effect was achieved by training pro-gram of aerobic exercise and strength training in combination with reduced calorie intake where par-ticipants have lost an average of 18.6 ± 7.3 kg for 48 weeks (30). The same research has showed that three times a week aerobic exercise with intensity of 11-15 and according to Borg scale and 11-14 re-petitions in two sets of strength training have led
to reduction in body weight of 15.8 ± 6.8 and 17.8 ± 8.8 kg. Frequency of exercise was three (13,15-17,22,30) to five times a week (14,20,21,23,26,29) with 30-60 minutes per session.
Effects of physical exercise on reducing body weight of persons of different sexes. The majority of experimental studies
(13,19,2022,25,29,30) have included the problem of obesity among women more than men, altho-ugh there are few studies (12,23,24,27,31) which were carried out in both men and women, but in these cases are usually more included women than men. One question clearly arises, whether women are more obese than men or are they really suitable target group? This review of research studies in-cluded only 11 women representing 55%, 5 studi-es (12,23,24,27,31) with mixed character as tested in parallel by both men and women, while only four (15-18) studies or 20% were those that tested the obesity in men. This situation could be explai-ned by the fact that women are more prone to gain weight than men and thus they have more need for greater look so the authors were mostly involved in finding the most appropriate training program.
Discussion
Effects of physical exercise on reducing body weightObesity, more than any other disease is a result
of change in lifestyle of modern man. These chan-ges are primarily related to increased use of moto-rized transport and use of devices that reduce the physical strain of man and thus lead to sedentary lifestyle causing a hypokinesis, disease of our time. The biggest reason for this modern society state is physical inactivity (32). Many studies have shown that an active lifestyle and daily physical activity play an important role in the prevention of obesity (19,33). Isolated physical activity affects the reduc-tion of body weight and body fat, but in combination with programmed reductive diet is an ideal formula for correct body composition (18,20,34). Also peo-ple who are physically active have bigger chance to maintain or reduce body weight for a longer period than those who only rely on a reduced diet. Some studies have shown that weight gain among partici-pants was significantly reduced in the experimental

Vers
ion fo
r revie
w
2186
HealthMED - Volume 6 / Number 6 / 2012
Journal of Society for development in new net environment in B&H
groups compared to controls after the exercise pro-gram (9,22,25,30). Significant body weight reduc-tion which amounted over 10 kg has been recorded in one study, which had perhaps the most complex program where the participants were divided into four groups and the exercise involved diet, aerobic exercise and strength training with the load (25). The best result of this combined program was the combination of strength training and aerobic exerci-se training, where the strength training have increa-sed muscle mass of the participants which would la-ter represent energy consumers in aerobic activities and along with diet has influenced that the number of calories in the end would be much smaller than the number of consumed which directly affect wei-ght loss. Monitoring the subject condition after the training period was one of the tasks of nearly all re-search papers to avoid the yo-yo effect and thereby reduce the importance of physical activity. The con-dition of the participants who have continued with some physical activity after the training period has showed that they have managed to maintain their weight values at the final testing (9,22,31).
Diet is a very important factor in reducing body weight in obese people but not the only one, be-cause the word diet only means a way of food in-take so that it actually represents only a slightly reduced energy intake. However the best results are in combination with physical activity because doing so it can increase and accelerate human me-tabolism which consumes more energy. In studies (14,23,27,29) in which was used two types of diets, it was clear that a high-protein diet had more im-pact than the low-protein diet where carbohydrate prevailed. Greater intake of protein and less car-bohydrate during aerobic exercise lead to the use of fat as energy source and thus directly affects the reduction of subcutaneous adipose tissue (14,27). Dosed aerobic exercise without diet suggested in the study Weinstorck et al. (25), with duration of 30-50 minutes three times a week showed a statisti-cally significant reduction of body weight but only after 20 weeks. Also, many studies have shown no statistically significant differences between dosing following exercise: 1) three times a week for 30 minutes; five times a week for 20 minutes (18), 2) three times a week for 60 minutes; five times a week for 30 minutes (22). Two studies (13,21) have examined the parallel effects of continuous
and intermittent exercise to determine which wor-kout method is more efficient. Study Donnelly et al. (13) was created with exercise three times a week for 30 minutes of continuous operation (gro-up I) and five times a week of interval work divi-ded into two sets of 15 minutes (group II), while in study Jakicic et al. (21) the training program was used with continuous exercise five times a week for 40 minutes (group I) and five times a week of interval work in four sets of 10 minutes (group II). The final result of these studies did not show sta-tistically significant differences (p<0.01) between continuous and interval work when the volume of exercise was equal. This fact shows us that in this target group of people from 40-64 years of age, total volume of exercise was the most important regardless of the duration of individual sessions. This fact is necessary for designing the recreatio-nal exercise program in modern life style, where one has not enough time to devote to continuity exercise because of work.
Effects of exercise training on body compositionShowing the real picture of body composition is
good for determining how an individual has decre-ased body weight due to the loss of subcutaneous adipose tissue. This loss represents a great risk for different types of diseases, so that only one centi-meter increase in waist circumference (visceral obesity) increases the risk of cardiovascular disease by 10%. The best effect of reducing body fat while increasing muscle mass was observed in subjects in the study conducted by Andersen et al. (22) and Ku-kkonen-Harjula et al. (15). The x-rays has directly measured free fat mass and in these two studies it was significantly reduced. Also very important is the relationship between hip circumference and waist. Waist to hip ratio was significantly lower in patients who had training with load than those who had a light aerobic training in form of walking (15).
In the study Laymen et al. (14) there were no difference between groups in the quantity of re-duced weight. However, if we look qualitatively we can see that the group with high protein intake and a low-carbohydrate intake significantly redu-ced the amount of fat compared to the group with the carbohydrate diet. Very similar results were observed in the study Hays et al. (27). This clearly
Vers
ion fo
r revie
w
HealthMED - Volume 6 / Number 6 / 2012
Journal of Society for development in new net environment in B&H 2187
indicates that for weight loss it is not enough to determine the whole body weight loss but it is ne-cessary to determine the percentage loss of body fat compared to muscle fat.
A statistically significant loss of abdominal, visceral and intramuscular adipose tissue, on the level of significance (p<0.01) followed by ma-gnetic resonance imaging, has helped Janssen et al. (26) to determine differences between gro-ups in the training program (aerobic and stren-gth training) in combination with diet. The total amount of reduced fat was higher in the group that had a strength training and diet (24 ± 8%), a group of aerobic exercise and diet had 21 ± 10% compared with the group who had only a diet where there was a reduction of only 15 %. A particular problem was the fact that few studi-es have compared men and women according to the criteria of better results between them and who have lost more weight, which represents an aggra-vating factor in interpreting the results. Therefore, future research is needed to examine the degree of obesity and weight reduction after the exercise program for people of different gender as well as any barriers for exercise in relation to gender and professional orientation.
Conclusion
Obesity is a public health problem associated with many chronic diseases or acute illnesses such as heart desease, hypertension, diabetes, low back pain syndrome. All recommendations for weight loss and body composition change in obese midd-le-aged people aged 40-64 years are reduced to the proper balance of energy intake in which the number of consumed calories exceeds the number of entered. A very important link in this process is the modification of ways of life, which means that reducing daily calorie intake and increase physical activity with regular education, promotion and mo-tivation of these people. Exercise programs vary according to intensity, frequency, type and duration of exercise. It is known that fats are the dominant source of energy for activities of low to moderate intensity (50% VO2max, 50-60% HRmax). A revi-ew of available literature is more than obvious that there is a dilemma to select the type of exercise for this target group because this are people who re-
gularly have their professional obligation to work. The main dilemma is aerobic exercise versus resi-stance training. Available studies have shown that both types of exercise provide significant results in terms of weight reduction. However, based on the analyzed parameters, it is impossible to establish a qualitative assessment of body composition.
Aerobic exercise has impact on the reduction of fat body mass and improvement of cardio-res-piratory functions of the body along with muscle hypertrophy. Due to the aging process degenera-tive changes in muscle tissue occurs (decreased muscle mass, the possibility of injuries and falls becomes more pronounced with this group of par-ticipants). Therefore, strength training is recom-mended because it maintains a suitable balance of muscle and reduces body weight without loss of non-fat body mass. Research has shown that the best results have been achieved with a combinati-on of these two types of training for more effective work on the body and body systems in the elderly while they can fit into the daily work activities. Common forms of physical exercise for this target group are: jogging, aerobic cyclic activity, wal-king, housework and work in the garden, modera-te strength training and low to moderate intensity activities. These activities can trigger larger num-ber of people because they are less physically de-manding and easier to fit into the daily routine of the individual. The World Health Organization has directed it’s attention to the daily walking, for 30 minutes, which need not be carried out continuou-sly, but can be divided into 2 or 3 sessions, which is equally effective. From the quantitative point of view, daily 20-minute walking will lead to a loss of about 5 kg of fat per year. Another very impor-tant aspect of training is related to the harmonious functioning of the cardiovascular, respiratory and central nervous system. In addition to the physical activity practice, field that was more studied is the combination of diet and exercise. From a review of available papers, we can conclude that the low calorie diet is sufficient if we want to achieve qu-antitative, eye visible results. However, the diet is the primary objective of metabolic improvement in contrast to the exercise that aims to improve he-alth. The combination of exercise (either aerobic or resistance training) and diet has shown the best results in the reduction of body weight. These pro-

Vers
ion fo
r revie
w
2188
HealthMED - Volume 6 / Number 6 / 2012
Journal of Society for development in new net environment in B&H
grams have reduced the body mass seven to nine times more than the programs that were designed only with exercise. Although diet alone gave po-sitive results in the elimination of excess pounds, detailed review of these studies and the effects were short-timeless.
Acknowledgement
This research was carried out as part of the project financed by the Ministry of Science of the Republic of Serbia, entitled “Physical activity and the fitness component of the elderly“ (number 179056), approved in 2010, and which is being carried out by the Faculty of Sports and Physical Education of the University of Nis.
References
1. Caspersen CJ, Powell EC, Christenson GM. Physi-cal activity exercise and physical fitness: definitions and distinctions for health-related research. Public Health. 1985; 100: 126-131.
2. Evenson KR, Rosamond WD, Cai J, Toole JF, Hutchinson RG, Shahar E, et al. Physical activity and ischemic stroke risk: the Atherosclerosis Risk in Com-munities Study. Stroke. 1999; 30: 1333–1339.
3. Bassuk SS, Manson JE, Epidemiological evidence for the role of physical activity in reducing risk of type 2 diabetes and cardiovascular disease. J Appl Physiol. 2005; 99: 1193–1204.
4. Sigal RJ, Kenny GP, Wasserman DH, Castaneda- Sceppa C. Physical activity/exercise and type 2 diabe-tes: a consensus statement from the American Diabe-tes Association. Diabetes Care. 2006; 29: 1433–1438.
5. Misra A, Khurana L. Obesity and the Metabolic Syn-drome in Developing Countries. J Clin Endocrinol Metab. 2008; 9311: S9 –S30.
6. Radujković BG, Zdravković D. Determinante go-jaznosti dece i adolescenata. Srp Arh Celok Lek. 2008; 136: 22-27.
7. Serra-Majem L, Ribas L, Perez-Rodrigo C, Garcia-Closas R, Pena-Quintana L, Aranceta J. Determi-nants of nutrient intake among children and adoles-cents; results from the enkid study. Ann Nut Metab. 2002; 46: 31-38.
8. Stunkard A, Foch T, Hrubec Z. A twin study of human obesity. JAMA. 1996; 256: 51-54.
9. Fogelholm M, Kukkonen-Harjula K, Nenonen A, Pasanen M. Effects of walking training on weight maintenance after a very low-energy diet in premeno-pausal obese women: a randomized controlled trial. Arch Inter Med. 2000; 160(14): 2177–2184.
10. World Health Organization. Report of a WHO Con-sultation. 2000; Geneva: Switzerland.
11. Pate RR, Pratt M, Blair SN, Haskel WL, Macera CA, Bouchar C, et al. Physical activity and public health. JAMA. 1995; 273: 402–7.
12. Ashe MC, Miller WC, Eng JJ, Noreau L. Older Adults Chronic Disease and Leisure-Time Physical Activity. Gerontology. 2009; 55: 64-72.
13. Donnely JE, Jacobsen DJ, Heelan KS, Seip R, Smith S. The effects of 18 months of intermittent vs Con-tinuous exercise on aerobic capacity body weight and composite and metabolic fitness in previously sedentary moderately obese female. Int J Obes Relat Metab Disord. 2000; 24: 566-572.
14. Layman DK, Evans EM, Erickson D, Seyler J, We-ber J, Bagshaw D, et al. A Moderate-Protein Diet Produces Sustained Weight Loss and Long-Term Changes in Body Composition and Blood Lipids in Obese Adults. J Nutr. 2009; 139: 514–521.
15. Kukkonen-Harjula K, Borg P, Nenonen A, Fogel-holm M. Effects of a weight maintenance program with or without exercise on the metabolic syndrome: a randomized trial in obese men. Prev Med. 2005; 41: 784–790.
16. Roseland JE, Anderssen SA, Solvoll K, Hjermann I, Urdal P, Holme I, et al. Effect of long-term changes in diet and exercise on plasma leptin concentrations. Am J Clin Nutr. 2001; 73: 240–245.
17. Cox KL, Burke V, Morton AR, Beilin LJ, Puddey IB. The independent and combined effects of 16 weeks of vigorous exercises and energy restriction on body mass and composition in free-living overweight men. Metabolism. 2003; 52: 107-115.
18. Ross R, Dagnone D, Jons JHJ, Smith H, Paddags A, Hudson R, et al. Reduction in Obesity and Related Comorbid Conditions after Diet-Induced Weight Loss or Exercise-Induced Weight Loss in Men. Ann Intern Med. 2000; 133: 92-103.
19. Fogelholm M, Nuutinen O, Pasanen M, Myohanen E, Saatela T. Parent-child relationship of physical activity patterns and obesity. Int J Obes Relat Metab Disord. 2000; 23: 126-135.

Vers
ion fo
r revie
w
HealthMED - Volume 6 / Number 6 / 2012
Journal of Society for development in new net environment in B&H 2189
20. Nieman DC, Brock DW, Butterworth D, UtterAC, Nieman CC. Reducing diet and/or exercises train-ing decreses the lipid and lipoprotein risk factors of moderately obese women. J Am Coll Nutr. 2002; 214: 344-350.
21. Jakicic JM, Winters C, Lang W, Wing RR. Effects of intermittent exercise and use of home exercise equip-ment on adherence weight loss and fitness in over-weight women. JAMA. 1999; 282(16): 1554–1560.
22. Andersen RE, Wadden TA, Bartlett SJ, Zemel B, Verde TJ, Franckowiak SC. Effects of life style activ-ity vs structured aerobic exercise in obesewomen: a randomized trial. JAMA. 1999; 2814: 335–340.
23. Fung TT, McCullough ML, Newby PK, Manson JE, Meigs JB, Rifai N, et al. Diet-quality scores and plasma concentrations of markers of inflammation and endothelial dysfunction. Am J Clin Nutr. 2005; 82: 163–173.
24. Jones DW, Miller ME, Wofford MR, Anderson JDC, Cameron ME, Wiloughby DL, et al. The effect of weight loss intervention on antihypertensive medi-cation requirements in the Hypertension Optimal Treatment. Am J Hypertens. 1999; 12: 1175–1180.
25. Weinstock RS, Dai H, Wadden TA. Diet and exer-cise in the treatment of obesity: effects of three inter-ventions on insulin resistance. Arch Int Med. 1998; 158(22): 2477–2483.
26. Janssen I, Hudson R, Fortier A, Ross R. Effects of an Energy-Restrictive Diet With or Without Exercise on Abdominal Fat Intermuscular Fat and Metabolic Risk Factors in Obese Women. Diabetes Care. 2002; 25: 431–438.
27. Hays NP, Starling RD, Liu X, Sulliven DH, Trappe TA, Fluckey JD, et al. High-Carbohydrate Diet on Body Weight Body Composition and Fat Distribu-tion in Older Men and Women. Arch Intern Med. 2004; 164: 210-217.
28. Fogelholm M, Kukkonen-Harjula K, Oja P. Eat-ing control and physical activity as determinants of short-term weight maintenance after a very lowcalo-rie diet among obese women. Int J Obes Relat Metab Disord. 1999; 232: 203–210.
29. Layman DK, Evans E, Baum JI, Seyler J, Erickson DJ, Boileau RA. Dietary protein and exercises have additive effects on body composite during weight loss in adult women. J Nutr. 2005; 135: 1903-1910.Wadden TA, Vogt RA, Foster GD, Anderson DA. Ex-ercise and the maintenance of weight loss: one-year follow-up of a controlled clinical trial. J Consult Clin Psychol. 1998; 662: 429–433.
30. Leermakers EA, Perri MG, Shigaki CL, Fuller PR. Effects of exercise-focused versus weight-focused maintenance programs on themanagement of obe-sity. Addict Behav. 1999; 242: 219–227.
31. Pretience AM, Jebb SA. Obesity in Britain: Gluttony or Sloth. Br Med J. 1998; 311: 437-446.
32. Di Pietro L. Physical activity in the prevention of obesity. Med Sci Sports Exerc. 1999; 31: 542-548.
33. Wing RR. Physical activity in the treatment of the adulthood overweight and obesity. Med Sci Sports Exerc. 1999; 31: 547-52.
Corresponding Author Zoran Milanovic, Faculty of Sport and Physical Education, Nis, Serbia, E-mail: [email protected]

Vers
ion fo
r revie
w
2190
HealthMED - Volume 6 / Number 6 / 2012
Journal of Society for development in new net environment in B&H
Abstract
Background: The popularity of complementa-ry and alternative medicine (CAM) has increased and has been used extensively in cardiovascular disease (CVD) patients. We aimed to determine prevalence, types of complementary and alterna-tive medicine (CAM), interactions between CAM and medicine therapy in patients with cardiovas-cular disease (CVD).
Methods: A systematic literature review was performed for the 10-year period. “Complementa-ry and alternative medicine”, “cardiovascular dis-ease”, “hypertension”, “herbal medicine”, “drug interactions”, “nonprescription medications” were used as key search terms.
Results: A total of 45 articles were located, six of them were national studies, and 39 of them were international literature. High prevalence use of CAM was 28.3% and 72.5% in national stud-ies, and 9.2% and 80.9% in international studies. The patients commonly preferred biological-based treatments as CAM such as ginseng, garlic, echina-cea, and ginkgo.
Conclusions: It is suggested that health pro-fessionals should conduct further research about CAM therapies in CVD and develop guidelines related to CAM. In order to identify the effects, orientate clinical results and safe use of CAM, ran-domized controlled studies, with adequate sample sizes in full-length and statistically powerful stud-ies are required in CVD.
Key words: Cardiovascular Diseases, Com-plementary Therapies, Herbal Medicine, Nonpre-scription Drugs
Introduction
Complementary and alternative medicine (CAM) therapies are increasingly used around the world. The American National Institutes of Health,
National Center for Complementary and Alterna-tive Medicine description has been the most wide-ly adopted in this field. According to this descrip-tion, “complementary and alternative medicine is a broad health domain that encompasses all health services, methods, practices and their accompany-ing beliefs other than the health system which is politically predominant in a particular society or culture in a given historical period"[1].
The prevalence of CAM use in people with chronic disease has been reported as higher than that found within the normal population [2] and is common in patients with cardiovascular problems. When CAM use in cardiac patients in the United States is examined, the rate has been as high as 61% in patients with coronary artery disease and arteriosclerotic risks [3] and 69.4% in hypertensi-ve adults of advanced age [4]. In a study perfor-med on women over age of 65 in Turkey, the use of herbal therapy has been found as 48.3%; among patients with hypertension CAM use is 70% [5].
Biological-based therapies are commonly used in Turkey. While herbal therapies or herbal essences are more frequently used rather than CAM in Tur-key, the reason that they are more popular might also be related to their greater availability and the-ir reduced costs [6]. In central Anatolia in Turkey, tales are told about herbals and “healers” like Lo-kman Hekim who used herbal medicine to cure sick people.7 Many people also make use of her-bal therapies because of the belief that “natural’’ is “safe’’. Herbal medicine still serves as a source of hope for some illnesses where modern medicine fails to offer a cure [7]. There are many studies on the side effects, allergic reactions and toxic effects of herbal products [8-10]. It is important, there-fore, that health professionals become acquainted with the effects of herbal products.
Use of complementary and alternative medicine in cardiovascular diseases: a literature reviewIlkay Ozkan Arslan, Zeynep Canli Ozer, Ozen Kulakac
Akdeniz University School of Health, Nursing of Department, Turkey

Vers
ion fo
r revie
w
HealthMED - Volume 6 / Number 6 / 2012
Journal of Society for development in new net environment in B&H 2191
Aim
This comparative literature review was per-formed using national and international studies to determine the prevalence of use of CAM methods and types, and drug interactions with CAM in pa-tients with cardiovascular problems.
Methods
Search strategyThis study was performed using an internet se-
arch of national and international publications by screening cases from October 2008 to May 2010 to determine the status of CAM use within patients with CVD.
In this study, key words used within the search were "complementary and alternative medicine", "cardiovascular diseases", "non-prescription trea-tments", "hypertension", "herbal treatments," and "drug interactions". The national and international literature from the last decade has been examined. The inclusion criteria of the investigation have been designated as comprising CVDs and CAM, written in English for international literature and written in Turkish and/or English for national literature. No li-mit was specified for research type. All kinds of in-vestigations including qualitative, quantitative and mixed have been approved and included in the study. Medline, PubMed, Cochrane, Up-to-date, CINAHL, NCCAM, Ovid, ProQuest, Ebscohost, Blackwell-Synergy, Google, HEC National Thesis Center were used as the search engines. Printed books and jour-nals have also been included into the research. In this study, 45 publications were reached and seven of the-se were in the Turkish literature (Table 1).
The research types and sampling size of the nati-onal studies examined are shown in Table 1 and have been mainly identified as descriptive (n=5), [11-15] with others determined as a case presentation [16] and a mixed investigation [17]. Although the resear-ch related to the last 10 years, the national studies seem to have been accumulated in the last two years.
When the 38 international research articles were distributed by research types, the descriptive-sec-tional researches (n=15) were most common [18-30], then systematic reviews (n=10) [3, 31-39], lite-rature reviews (n=5) [40-44], and non-randomized experimental researches (n=6) [45-50]. There were
only two randomized controlled studies (RCTs) among the analyzed studies [51-52]. In related in-ternational literature, the studies were found to be distributed mainly in last five-year period. These investigations have also been examined from the point of sampling size and presented in Table 1.
Results
The aim of this literature review was to analyze the status of CAM use among cardiovascular pa-tients as reported in Turkish and international pu-blications; a total of 45 publications were located.
The CAM Prevalence StudiesIn Turkey, six prevalence studies were found
and brief information about the studies are given in Table 2. As shown, the national prevalence stu-dies indicate the regional results relating to CAM use in patients with CVD, but do not reflect the country. According to these results, the CAM use prevalence has been found between 28.3% and 72.5%. The CAM prevalence is higher in studies performed in Samsun (northern Turkey) (72.5% and 53.5%) than others [17]. Fifteen internatio-nal prevalence studies about CAM use in patients with CVD were located. As shown in Table 2 the-se studies were mainly performed in the United States between 2002 and 2009. In international publications, the CAM use prevalence of patients with CVD is between 9.2% and 80.9% [18].
Although the biological-based treatments are reported to still be in the first place in international research, the body–mind treatments [4, 18, 20, 22, 26], the manipulative and body-based treatments, have been found to be used [22, 24, 25, 27, 29, 53]. There were only three studies where biologi-cal-based treatments have been used [28-30].
CAM Methods and Types StudiesIn this section, brief information about the
CAM type and methods and results of studies have been. Only one of the off-prevalence studies has been done in Turkey [16]. In this study, the ef-fects of LIDA capsule on coronary artery disease have been evaluated in a case of a young woman with no risk factors for CVD [16].
One of the 13 studies performed internationally in 2005 was a systematic review about CAM use

Vers
ion fo
r revie
w
2192
HealthMED - Volume 6 / Number 6 / 2012
Journal of Society for development in new net environment in B&H
Table 1. Distribution of National and International Studies Research Type and Sampling SizeAuthor Name, Year Research Type Sampling Size
National StudiesYılmaz et al. 2007 Descriptive 310Toprak and Demir 2007 Descriptive 72Çapraz and 2007 Mix (descriptive and semi-experimental) 7703 and 75Adıbelli et al. 2008 Descriptive 215Şentürk et al. 2008 Case Presentation 1Kütmeç et al. 2008 Descriptive 187Türk and Süner 2008 Descriptive 150International StudiesVaes and Chyka 2000 Literature Review -Holm et al. 2001 Experimental – RCT 45Yung et al. 2001 Experimental – Non-RCT 9Ai and Bolling 2002 Descriptive – -Sectional 246Wood et al. 2003 Descriptive – Cross-Sectional 107Vivekananthan et al. 2003 Systematic Review – Meta-Analyses 7 RCTKnekt et al. 2004 Systematic Review 9 cohort studyMiller et al. 2004 Literature Review -Wang et al. 2004 Systematic Review – Meta-Analyses 39 RCTChagan et al. 2005 Descriptive – Cross Sectional 198
Izzoa et al. 2005 Literature Review 43 case report and 8 experimental studies
Bıjlanı et al. 2005 Experimental – Non- RCT 98Vogel et al. 2005 Literature Review -Woodward 2005 Literature Review -
Pittler and Ernst 2005 Systematic Review – Meta-Analyses 7 Systematic Reviews – 3 RCT with meta analyses
Huntley et al. 2005 Systematic Review 36 clinical studiesBarraco et al. 2005 Descriptive – Cross-Sectional 223Ciceroa et al. 2005 Experimental – Non-RCT 111Reshef et al. 2005 Experimental – Non-RCT 12Zick et al. 2005 Descriptive – Cross-Sectional 252Yeh et al. 2006 Descriptive – Cross-Sectional 10.572Buettner et al. 2006 Systematic Review 44Artz et al. 2006 Descriptive – Cross-Sectional 1962Kaushik et al. 2006 Experimental – Non-RCT 100Saydah and Eberhardt 2006 Descriptive – Cross-Sectional 3451*Bell et al. 2006 Descriptive – Cross-Sectional 5821Decker et al. 2007 Descriptive – Cross-Sectional 596Mukamal et al. 2007 Experimental – RCT 31Buettner et al. 2007 Descriptive – Cross-Sectional 6671
Rosenfeldt et al. 2007 Systematic Review – Meta-Analyses 12 clinical experiments and 9 other researches
Corso et al. 2007 Descriptive – Cross-Sectional 153Eslick et al. 2008 Systematic Review – Meta-Analyses 47Gohar et al. 2008 Descriptive – Cross-Sectional 196Leung et al. 2008 Descriptive – Cross-Sectional 661Greenfield et al. 2008 Descriptive – Cross-Sectional 463Seifert et al. 2008 Experimental – Non-RCT 20Ried et al. 2008 Systematic Review – Meta-Analysis 11 RCTJepson et al. 2009 Systematic Review 1 RCT
* The number of test subjects with cardiovascular disease in the research.

Vers
ion fo
r revie
w
HealthMED - Volume 6 / Number 6 / 2012
Journal of Society for development in new net environment in B&H 2193
Table 2. The Methods and Prevalence of CAM in Turkey and International PublicationsAuthor Name, Year Location Prevalence (%) CAM Method
TurkeyToprak and Demir 2007 Afyon 26.4 Garlic, lemon, grapefruitÇapraz et al. 2007 Samsun 53.3 GarlicYılmaz et al. 2007 Sivas 38.7 PhytotherapyAdıbelli ve ark 2008 Samsun 72.5 LemonKütmeç ve ark 2008 Mersin 28.3 Lemon, garlic, olive oil and thymeTürk and Süner 2008 Gaziantep 59.4 Garlic – yoghurt with garlic, lemon-lemon juiceInternational
Ai and Bolling 2002 United States 80.9
Manipulative and body-based treatments (exercise), Body-mind treatments (Relaxing therapies, Spiritual healing), Biological-based treatments (nutrition support products), Alternative and medical systems (homeopathic), Energy treatments (healing touch)
Wood et al. 2003 Canada 64 Biological-based treatments (multivitamins)
Barraco et al. 2005 United States 63
Body-mind treatments (Prayer), Manipulative and body-based treatments (exercise, chiropractic therapy spine massage, physical therapy), Biological-based treatments
Chagan et al. 2005 United States 47.5*
Biological-based treatments (vitamin C, multi vitamins, calcium, vitamin B complex, coenzyme Q10, glucosamine, magnesium, vitamin D)
Zick et al. 2005 United States 30* Biological-based treatments (nutrition support products)
Artz et al. 2006 United States 48.1 Biological-based treatments (vitamin E, garlic, Omega
3, fish oil, folic acid, Coenzyme Q-10)
Yeh et al. 2006 United States 36 Biological-based treatments (garlic, ginseng, ginkgo
biloba, Echinacea), Body-mind treatments
Bell et al. 2006 United States 69.5
Body-mind treatments (Prayer), Biological-based treatments (herbal treatments), Manipulative and body-based treatments (chiropractic care), Alternative and medical system (homeopathic)
Saydah and Eberhardt 2006
United States 32 Biological-based treatments, Body-mind treatments,
Manipulative and body-based treatments
Decker et al. 2007 United States 19
Body-mind treatments (Relaxing therapies), Biological-based treatments (home-made drugs), Alternative and medical system (acupuncture), Body-mind treatments (biofeedback)
Corso et al. 2007 Italy 22 Biological-based treatments, Alternative and medical system (homeopathic)
Buettner et al. 2007 United States 61 Biological-based treatments (vitamin E, folic acid,
niacin, fish-oil, ginseng)
Greenfield et al. 2008 England 9.2 Biological-based treatments (vitamins and diets), Manipulative and body-based treatments (exercise)
Leung et al. 2008 Canada 35.1 Body-mind treatments
Gohar et al. 2008 England 43.1
Biological-based treatments (fish-oil, multi-vitamins, garlic, vitamin C), Body-mind treatment (prayer, relaxing, aroma therapy), Manipulative and body-based treatments (massage, acupuncture, reflexology), Alternative and medical systems (Chinese medicine, homeopathic), Energy therapies
* Percentages have been calculated as average.

Vers
ion fo
r revie
w
2194
HealthMED - Volume 6 / Number 6 / 2012
Journal of Society for development in new net environment in B&H
of patients with peripheral artery disease [35]. In this review, evidence relating to diet products that contain garlic, ginkgo biloba, omega-3 fatty acids, Padma 28 and vitamin E have been studied. Gink-go biloba and Padma 28 have been discovered to be effective in patients with intermittent claudica-tion comparing to the placebo group [35].
In second study conducted in 2008 the effects of garlic on blood pressure were analyzed by eval-uating 11 RCT and meta-analysis studies [36]. In patients with hypertension, it has been proved that garlic preparations were superior to placebo in re-ducing blood pressure [36].
In a pilot study that aimed to determine the an-tihyperlipidemic effects of red rice (monascus pur-pureus), an important decrease in levels of total cholesterol, low density lipoproptein (LDL) and triglyceride in patients with moderate hypercho-lesterolemia without any significant clinically toxic changes in liver and muscles was identified [46].
Reshef et al proved in their study that a mixture of citrus and grapefruit (which contained flavo-noid in high proportions and its active ingredients were naringin and narirutin) could be effective in the treatment of stage 1 HT [48].
In order to define the benefits of fish oil on hy-perlipidemia, Eslick et al used a systematic review and a meta-analysis of 47 studies [31]. In patients with hyperlipidemia, a daily dose of 3.25gm fish oil consumption has been shown to significantly decrease the level of triglyceride clinically, with-out causing a change in total cholesterol [31]. In their RCT pilot study, Mukamal et al found no consistent effects on biomarkers of cardiovascular risk following six months of black tea intake [52].
Seven RCT studies about preventing CVD by using vitamin E and ß carotenes were analyzed by Vivekananthan et al [38]. According to their study vitamin E had no positive effect on reduc-ing cardiovascular mortality and it was not recom-mended for routine use [34]. Nine cohort studies performed by Knekt et al aimed to understand the effect of antioxidant vitamins on the risk of cor-onary heart disease, and the intake of additional vitamin C in high proportion has been found to reduce CVD risk [34].
In some studies of mind–body techniques of CAM, Kaushik et al analyzed the effects of mental relaxation and slow breathing on essential hyper-
tension and proved that both mental relaxation and deep breathing had decreasing effects on systolic and diastolic blood pressure, heart rate and respi-ratory rate [47]. Similarly, Yung et al analyzed the effects of relaxing exercises in the treatment of hy-pertension, and showed that all relaxing techniques have been found to reduce blood pressure [50]. A study of the effects of rhythm therapy (eurhyth-my therapy), one of the body–mind treatments on heartbeat variability, reported that rhythm therapy was helpful in correcting patients’ heartbeat vari-ability [49]. In a non-random, pre-test–post-test study the effects of a yoga-based complementary life style training program for diabetic patients and cardiovascular risk factors were evaluated by Bi-jlani et al [45]. The patients’ blood samples taken on the first day of the course were compared with those taken on the last day; in the last day serum total cholesterol, LDL and total triglyceride lev-els of patients were identified to have reduced and HDL levels increased significantly [45].
Discussion
Individuals with CVD commonly use CAM methods for the purpose of both prevention and tre-atment. However, the evidence indicates that CAM may help the conventional management of CVD co-llaterally, but do not support its primary treatment. It is also indicated that some of the CAM methods have the potential to interact with widely prescribed drugs and may have negative effects [54].
According to the literature, some of the herbs or herbal products reported to be used may cause difficulties in control of blood pressure or plate-let functions in patients by interaction with the anti-platelet and/or antihypertensive drugs. For example, garlic (allium sativum), which has been used as a food and spice for many years all over the world, is able to affect plasma lipids, fibrino-lytic activity, platelet aggregation, blood pressure and blood glucose [43]. Like garlic, ginkgo/gink-go biloba, which was consumed for the purpose of increasing the microcirculation blood supply, could decrease the platelet level. Vitamin E, which was consumed as an antioxidant, can increase the bleeding risk by inhibiting platelet aggregation, increasing the effects of warfarin and decreasing the effects of statins [38]. In a similar vein, Cur-

Vers
ion fo
r revie
w
HealthMED - Volume 6 / Number 6 / 2012
Journal of Society for development in new net environment in B&H 2195
cuma (Curcuma longa) have been consumed as an anti-platelet agent and causes bleeding by increas-ing the effect of anticoagulant drugs [43].
Warfarin and vitamin K work at antagonists so that plants containing vitamin K (e.g. green tea, raw parsley) may antagonize the anticoagulant effects of warfarin [40]. In one case, the patient who takes a constant dose of warfarin and gins-eng therapy has demonstrated a reduced INR (in-ternational normalized ratio) level [54]. Ginseng/Panax Ginseng was consumed for its different ac-tions as an immunomodulator, anti-inflammatory, antitumor, and hypoglycemic. At the same time it reduces the anticoagulation effect of warfarin; de-crease the level of INR; decreases the blood pre-ssure and blood glucose; and increases the lipid profiles of the patient [37]. It shows positive ino-tropic effects by reducing the systolic and diasto-lic pressures in hypertensive patients and reduces the warfarin response by providing pro-coagulant effect. Health care personnel should supervise the prothrombin time and INR level more carefully in patients who desire to consume this product [43].
Herbal teas (e.g. green tea) have been consu-med in order to help weight loss, cause laxative and diuretic effects and perspiration. It is also known that herbal teas have some unwanted ef-fects from uncontrolled use or excessive intake by causing hypokalemia. In contrast to the anti-coagulant effects of garlic, ginkgo or vitamin E, herbal teas such as green tea may antagonize the anticoagulant effects of warfarin because of its vitamin K ingredient. Bradycardia, heart block, "torsades de pointes" syndrome, ventricular fi-brillation and heart failure may evolve depending on potassium deficiency [55]. The green tea is a product frequently used in Eastern countries and the United States. Green tea is a product that has been presented as an efficacious plant for health in recent years in Turkey. According to scientific re-search results, consuming 5–7 cups of fresh green or black tea (approximately 800–1120 mL) per day is recommended [56]. Another plant that has adverse effects on heart rate, rhythm and vascular system is Echinacea [57]. It has been consumed as an immunostimulant, local anesthetic and an-ti-inflammatory since ancient times. Echinacea is available in extracts, tinctures, tablets, capsules, and ointments. It is also available in combination
with other immune boosting herbs, vitamins, and minerals [58,59].
From the research studies we accessed there was a consensus that the vitamin C group do not have cardiovascular benefits, except grapefruit [60]. Grapefruit has been proved to have a healing effect on reducing diastolic blood pressure in the treatment of stage-1 hypertension [48] so patients should be informed about the benefits of grapefru-it on their CAD treatment. Especially in the Me-diterranean countries like Turkey, Italy or Spain grapefruit could be an available and economical CAM option for stage-1 hypertension patients.
Thyme is a naturally grown up herb all over Turkey and is commonly used in different ways, such as drinking it as thyme juice. Thyme juice is derived from the volatile oil of the thyme plant and used to reduce blood sugar and cholesterol levels [62]. Thyme oil can also be applied on the skin for the purpose of decreasing pain. No data about negative or positive effects of the thyme plant on cholesterol levels of the patients or its drug interac-tions could be found in the studies reviewed. Re-garding other herbs, parsley is a naturally grown herb all over the Turkey and has been consumed as a diuretic. Parsley also appears to increase diu-resis by inhibiting the Na+/K+-ATPase pump in the kidney, thereby enhancing sodium and water excretion while increasing potassium reabsorpti-on. It is also known that it has some unwanted ef-fects when use in excess by causing hypotension and increasing the effect of antihypertensives and toxicity of MAO inhibitors [62].
Fatty acids (Omega-3, Omega-6) effect eicosa-noid products (e.g. thromboxanes, prostaglandins) that are responsible for coagulation, inflammation and vasoregulation. A balanced intake of Ome-ga-3 and Omega-6 fatty acids (1 gram Omega-3 fatty acid for every 5-10 grams Omega-6 fatty acids) has an important role on the control of blo-od cholesterol and coagulation.64 The effects of Omega-3 fatty acids on CVD are as follows: de-creases the levels of triglyceride, fibrinogen and thrombosis; reduces blood pressure; decreases cell proliferation; increases endothelial functions and arterial compliance. Fish-oil preparations and fish are important sources of Omega-3 and Omega-6 so CAD patients’ use of fish oil and consuming fish as a source of fatty acids may be supported by

Vers
ion fo
r revie
w
2196
HealthMED - Volume 6 / Number 6 / 2012
Journal of Society for development in new net environment in B&H
the health care personnel. From our observations, Turkish people consume fish oil for the purpose of strengthening their bodies, especially their bones. They could also be advised about consuming fish or Fish-oil drugs and the other Omega-3, Ome-ga-6 from sources such as vegetables with dark green leaves, flax seed, sunflower seed and wal-nuts for the control of their blood cholesterol and coagulation [63].
Padma 28, which is a mixture of a variety of different herbs, originated from traditional Tibetan medicine and has been used since the 1960s in Eu-rope for the symptomatic treatment of circulatory disorders. Intermittent claudication, a symptoms cluster in peripheral vascular disorders, that inclu-des occurrence of pain, ache, cramps or a sense of fatigue due to inadequate blood supply and le-ading to an inability to walk. In a meta-analysis by Melzer and others it was found that Padma 28 increased the walking distance in these patients by >100 m and thus it could be beneficial for those with peripheral arterial occlusive diseases along with exercise [64]. On the other hand; Padma 28 also caused a significant inhibition of inducible nitric oxide synthesis in tests utilizing a mouse macrophage cell line. In humans, inducible nitric oxide synthesis is associated with infectious and inflammatory disease processes and is responsible for the vasodilatation and hypotension observed in cases of septic shock [66]. In Turkey, the usa-ge of Padma 28 is not common and the products that provide fast weight loss and increase physi-cal performance can be sold illegally. Şentürk et al’s case study manifests the requirement of public awareness regarding use of these products, such as LIDA and points out that health staff have impor-tant responsibilities in this regard [16].
As indicated above, there are several positi-ve and negative effects of biological-based trea-tments. The contents and effects of most herbal products are not known exactly and in what amo-unt and frequency individuals administer the acti-ve ingredient cannot be determined. In addition, sufficient information regarding effects of many herbal drugs concerning for acute and chronic toxicities, standardization, stability and qualities do not exist [60]. The use of herbal products may also lead to undesirable effects that cannot be an-ticipated, depending on genetic susceptibility and
an individual's sensitivity. Due to the individual effects of biological-based treatments, the evalua-tion of the patient with regard of CAM use should be included in the patient evaluation forms [66]. Unless evidence-based data exist, biological-ba-sed treatments are thought to be inappropriate for patients, and they should be informed by health staff not to use these products. Providing correct and appropriate suggestions to the patients about known benefits and possibilities of plant–drug in-teractions is a responsibility for health care suppli-ers.
Because drug–herbal interactions are not pla-ced in user’s manuals, health personnel’s unawa-reness of the patient’s herbal product use, and lack of sufficient relevant information, the possibility of unwanted significant adverse effects increase in some persons that using CAM methods. Examina-tion of herbal products, as well as synthetic drugs, through clinical studies during their standardiza-tions, considering the features such as use loca-tions, dosage, possible interactions, and possible adverse effects and packaging, will increase the safe and effective use of these products [58].
Conclusion
The interaction between herbal products and cardiovascular drugs is a crucial patient safety issue. Patients concomitantly using CAM with cardiovascular pharmacotherapy are under great risks in terms of unwanted adverse effects. Heal-th care professionals must have knowledge about CAM use and methods, potential risks of methods used, and plant–drug interactions, and must evalu-ate the patient using an unprejudiced approach and supply an appropriate consultancy.
Acknowledgments
This study is supported by Management Unit of Scientific Research Projects of Akdeniz Uni-versity.

Vers
ion fo
r revie
w
HealthMED - Volume 6 / Number 6 / 2012
Journal of Society for development in new net environment in B&H 2197
References
1. National Institute of Health, National Center for Complementary and Alternative Medicine. What Is Complementary and Alternative Medicine? http://nccam.nih.gov/health/whatiscam/D347.pdf. Accessed March 30, 2010.
2. Institute of Medicine Report on Complementary and Alternative Medicine in the United States, Committee on the use of Complementary and Alternative Medicine by the American Public. Semin Integr Med. 2005; 38.
3. Buettner C, Phillips RS, Davis RB, Gardiner P, Mit-tleman MA. Use of dietary supplements among United States adults with coronary artery disease and athe-rosclerotic risks. Am J Cardiol. 2007; 99: 661–666.
4. Bell RA, Suerken CK, Grzywacz JG, Lang W, Quandt SA, Arcury TA. CAM use among older adults age 65 or older with hypertension in the United States: Gene-ral use and disease treatment. J Alternative Compl Med. 2006;12(9): 903–909.
5. Kurt E, Bavbek S, Pasaoglu G, Abadoglu O, Misirligil Z. Use of alternative medicine by allergic patients in Turkey. Allergol Immunopathol. 2004;32: 289-294.
6. Aydın S, Bozyaka AO, Mazicioğlu M, Gemalmaz A, Özcakir A, Özturk A. What influences herbal medicine use? Prevalence and related factors. Turk J Med Sci. 2008;38: 455-463.
7. Bayat AH. Lokman, hakim ya da hekim? Tıp Tarihi Arastırmaları. 2001;10: 144–155.
8. Hasan MY, Das M & Behjat S (2000) Alternative me-dicine and the medical profession: views of medical students and general practitioners. East Mediterr He-alth J. 2000;6(1): 25–33.
9. Snyder M, Lindquist R. Issues in complementary the-rapies: how we got to where we are. Online J Issues Nurs. 2001;6(2): 1.
10. Vickers A, Zollman C. Herbal medicine. BMJ. 1999;319: 1050–1053.
11. Adıbelli Z, Dilek M, Akpolat T. Lemon juice as an al-ternative therapy in hypertension in Turkey [letter]. Int J Cardiol. 2009;35(2): 58-59.
12. Kütmeç C, Acar A, Karakoç T, Yurtsever S. Hiper-tansiyonu olan hastaların kullandıkları bitkisel te-davi yöntemleri 10. Ulusal İç Hastalıkları Kongresi (poster bildiri 28). Antalya (Turkey). 2008.
13. Toprak D, Demir S. Treatment choices of hypertensi-ve patients in Turkey. Behav Med. 2007; 33(1): 5-10.
14. Türk N, Süner A. Non-pharmacological method and the analysis of antihypertension medication. The Medical Journal of SSK Göztepe Educational Hos-pital. 2008;2(4): 133-142.
15. Yılmaz MB, Yontar OC, Turgut OO et al. Herbals in cardiovascular practice: Are physicians neglecting anything?. Int J Cardiol. 2007;122: 48–51.
16. Şentürk T, Özdabakoglu O, Baran İ. Acute myocar-dial infarction associated with use of herbal medica-tion. Clin Res Cardiol. 2008;97: 784–786.
17. Çapraz M, Dilek M, Akpolat T. Garlic, hyperten-sion and patient education [letter]. Int J Cardiol. 2007;121:130–131.
18. Ai AL, Bolling SF. The use of complementary and alternative therapies among middle-aged and older cardiac patients. Am J Med Qual. 2002;17(1): 21-27.
19. Artz MB, Harnack LJ, Duval SJ, Armstrong C, Ar-nett DK, Luepker RV. Use of nonprescription medi-cations for perceived cardiovascular health. Am J Prev Med. 2006;30(1): 78–81.
20. Barraco D, Valencia G, Riba AL, Nareddy S, Draus CBSN, Schwartz SM. Complementary and alterna-tive medicine (CAM) use patterns and disclosure to physicians in acute coronary syndromes patients. Complement The Med. 2005;13:34-40.
21. Chagan L, Bernstein D, Cheng JWM et al. Use of biological based therapy in patients with cardio-vascular diseases in a university-hospital in New York City. BMC Complement Altern Med. 2005;5:4. doi:10.1186/1472-6882-5-4.
22. Corso ED, Bondiani AN, Zanolla L, Vassanelli C. Nurse educational activity on non-prescription the-rapies in patients with chronic heart failure. Eur J Cardiovasc Nurs. 2007; 6: 314–320.
23. Decker C, Huddleston J, Kosiborod M. et al. Self-reported use of complementary and alternative me-dicine in patients with previous acute coronary syn-drome. Am J Cardiol. 2007;99: 930 –933.
24. Gohar F, Greenfield SM, Beevers DG, Lip GYH, Jo-lly K. Self-care and adherence to medication: a sur-vey in the hypertension outpatient clinic. BMC Com-plement Altern Med. 2008;8: 4 doi:10.1186/1472-6882-8-4.
25. Greenfield S, Pattison H, Jolly K. Use of comple-mentary and alternative medicine and self-tests by coronary heart disease patients. BMC Comple-ment Altern Med. 2008;8:47 doi:10.1186/1472-6882-8-47.

Vers
ion fo
r revie
w
2198
HealthMED - Volume 6 / Number 6 / 2012
Journal of Society for development in new net environment in B&H
26. Leung YW, Tamim H, Stewart DE, Arthur HM, Grace SL. The prevalence and correlates of mind-body the-rapy practices in patients with acute coronary syndro-me. Complement Ther Med. 2008;16: 254-261.
27. Saydah SH, Eberhardt MS. Use of complementary and alternative medicine among adults with chronic disea-ses: United States 2002. The Journal of Alternatıve and Complementary Medicine. 2006; 12(8): 805–812.
28. Wood MJ, Stewart RL, Merry H, Johnstone DE, Cox JL. Use of complementary and alternative medical therapies in patients with cardiovascular disease. Am Heart J. 2003;145(5): 806-812
29. Yeh GY, Davis RB, Phillips RS. Use of complemen-tary therapies in patients with cardiovascular disea-se. Am J Cardiol. 2006;98, 673–680.
30. Zick SM, Blume A, Aaronson KD. The prevalence and pattern of complementary and alternative su-pplement use in individuals with chronic heart failu-re. J Card Fail. 2005;11: 586-589.
31. Eslick GD, Howe PRC, Smith C, Priest R, Bensous-san A. Benefits of fish oil supplementation in hyperli-pidemia: a systematic review and meta-analysis. Int J Cardiol. 2009;136(1): 4-16.
32. Huntley AL, Coon JT, Ernst E. The safety of herbal medicinal products derived from echinacea species a systematic review. Drug Safety. 2005;28(5): 387-400.
33. Jepson RG, Kleijnen J, Leng GC. Garlic for pe-ripheral arterial occlusive disease. Cochrane Da-tabase Syst Rev. 1997;2. No.: CD000095. DOI: 10.1002/14651858.CD000095.
34. Knekt P, Ritz J, Pereira MA, et al. Antioxidant vitamins and coronary heart disease risk: a pooled analysis of 9 cohorts. Am J Clin Nutr. 2004;80: 1508-1520.
35. Pittler MX, Ernst E. Complementary therapies for peripheral arterial disease: systematic review. Athe-rosclerosis. 2005;181: 1–7.
36. Ried K, Frank OR, Stocks NP, Fakler P, Sullivan T. Effect of garlic on blood pressure: A systematic re-view and meta-analysis. BMC Cardiovasc Disord. 2008;8: 13 doi:10.1186/1471-2261-8-13.
37. Rosenfeldt FL, Haas SJ, Krum H, et al. Coenzyme Q10 in the treatment of hypertension: a meta-analysis of the clinical trials. J Hum Hypertens. 2007;21: 297–306.
38. Vivekananthan DP, Penn MS, Sapp SK, Hsu A, Topol EJ. Use of antioxidant vitamins for the prevention of cardiovascular disease: meta-analysis of randomi-sed trials. Lancet. 2003;361: 2017–23.
39. Wang C, Chung M, Balk E, et al. Effects of omega-3 fatty acids on cardiovascular disease. Evidence re-port/technology assessment No. 94 (Prepared by Tufts-New England Medical Center Evidence-based Practice Center, under Contract No. 290-02-0022). AHRQ Publication No. 04-E009-2. Rockville, MD: Agency for Healthcare Research and Quality.2004.
40. Izzoa AA, Carloa GD, Borrellia F, Ernst E. Cardio-vascular pharmacotherapy and herbal medicines: the risk of drug interaction. Int J Cardiol. 2005;98: 1-14.
41. Miller KL, Liebowitz RS, Newby LK. Complemen-tary and alternative medicine in cardiovascular di-sease: A review of biologically based approaches. Am Heart J. 2004;147(3): 401-411.
42. Vaes LP, Chyka PA. Interactions of warfarin with garlic, ginger, ginkgo, or ginseng: nature of the evi-dence. Ann Pharmacother. 2000;34(12): 1478-1482.
43. Vogel JH, Bolling SF, Costello RB, et al. Integrating complementary medicine into cardiovascular medici-ne. A report of the American College of Cardiology Foundation Task Force on Clinical Expert Consensus Documents. J Am Coll Cardiol. 2005;46: 184–221.
44. Woodward KN. The potential impact of the use of homeopathic and herbal remedies on monitoring the safety of prescription products. Hum Exp Toxicol. 2005;24: 219-233.
45. Bijlani RL, Vempatı RP, Yadav RK, et al. A brief but comprehensive lifestyle education program based on yoga reduces risk factors for cardiovascular disea-se and diabetes mellitus. Journal of Alternative and Complementary Medicine 2005;11(2): 267–274.
46. Ciceroa AFG, Brancaleoni M, Laghi L, Donati F, Mino M. Antihyperlipidaemic effect of a Monascus purpureus brand dietary supplement on a large sam-ple of subjects at low risk for cardiovascular disea-se: A pilot study. Complement Ther Med. 2005;13: 273-278.
47. Kaushik RM, Kaushik R, Mahajan SK, Rajesh V. Effects of mental relaxation and slow breathing in essential hypertension Complement Ther Med. 2006;14: 120-126.
48. Reshef N, Hayari Y, Goren C, Boaz M, Madar Z, Knobler H. Antihypertensive effect of sweetie fruit in patients with stage 1 hypertension. Am J Hypertens. 2005;18(10): 1360-1363.
49. Seifert G, Drievera PH, Pretzera K, et al. Effects of complementary eurhythmy therapy on heart rate variability. Complement Ther Med. 2008; doi:10.1016/j.ctim.2008.09.005.
Vers
ion fo
r revie
w
HealthMED - Volume 6 / Number 6 / 2012
Journal of Society for development in new net environment in B&H 2199
50. Yung P, French P, Leung B. Relaxation training as complementary therapy for mild hypertension con-trol and the implications of evidence-based medici-ne. Compl Ther Nurs Midwifery. 2001;7(2): 59-65.
51. Holm T, Andreassen AK, Aukrust O, et al. Omega-3 fatty acids improve blood pressure control and pre-serve renal function in hypertensive heart transplant recipients. Eur Heart J. 2001;22: 428–436.
52. Mukamal KJ, McDermott K, Vinson JA, Oyama N, Manning WJ, Mittleman MA. A 6-month randomized pilot study of black tea and cardiovascular risk fac-tors. Am Heart J. 2007;154(4): 724-730.
53. Buettner C, Yeh GY, Phillips RS, Mittleman MA, Kaptchuk TJ. Systematic review of the effects of gin-seng on cardiovascular risk factors. Ann Pharma-cother. 2006;40(1): 83-95.
54. Miller KE. Is herbal therapy safe in cardiovascular disease? Am Fam Physician. 2002;66(7): 1318-1321.
55. Saraçoğlu A, Ergun B. Türkiye’de satılan bazı bit-kisel zayıflama çaylarının içerikleri ve bu çayların kullanımına bağlı ortaya çıkabilecek istenmeyen etki-ler. Türkiye Klinikleri J Med Sci. 2006;26: 355-363.
56. Çelik F. Çay (camellia sinensis); içeriği, sağlık üze-rindeki koruyucu etkisi ve önerilen tüketimi. Türkiye Klinikleri J Med Sci. 2006;26: 642-648.
57. Kuhn MA. Herbal remedies: Drug-herb interacti-ons. Crit Care Nurse. 2002;22: 22-32.
58. Echinacea. http://www.umm.edu/altmed/articles/ec-hinacea-000239.htm. Accessed April 20, 2010.
59. Shah SA, Schlesselman L, Cios D, et al. Effects of echinacea on electrocardiographic and blood pre-ssure measurements. Am J Health Syst Pharm. 2007;64(15): 1615-1618.
60. Kris-Etherton PM, Lichtenstein AH, Howard BV, Steinberg D, Witztum JL. Antioxidant vitamin su-pplements and cardiovascular disease. Circulation. 2004;110: 637–641.
61. Başaran N. Medisinal bitkilerin kullanımında iste-nmeyen etkiler ve zehirlenmeler. Türkiye Klinikleri J Med Sci. 2008;28(Suppl): 213-216.
62. Kreydiyyeh SI, Usta J. Diuretic effect and mechani-sm of action of parsley. J Ethnopharmacol. 2002;79: 353–357.
63. Kris-Etherton PM, Harris WS, Appel LJ. Fish con-sumption, fish oil, omega-3 fatty acids, and cardiovas-cular disease. Circulation. 2002;106: 2747-2757.
64. Melzer J, Brignoli R, Diehm C, Reichling J, Do DD, Saller R. Treating intermittent claudication with Ti-betan medicine Padma 28: Does it work? Atherosc-lerosis. 2006;189(1): 39-46.
65. Anti-inflammatory activity of Padma 28. The Herb Research Foundation. http://www.herbs.org/cu-rrent/padma.htm. Accessed April 20, 2010.
Corresponding Author Zeynep Canli Ozer, Akdeniz University School of Health, Antalya, Turkey, E-mail: [email protected]
Vers
ion fo
r revie
w
2200
HealthMED - Volume 6 / Number 6 / 2012
Journal of Society for development in new net environment in B&H
Abstract
The development of physical medicine and rehabilitation in Vojvodina closley followed the development of the same branch of medicine in Serbia. Today, the three main institutions and lea-ders in the field of rehabilitation in Vojvodina are: Medical Rehabilitation Clinic of the Clinical Cen-ter of Vojvodina, Special Hospital for Rheumatic Diseases Iodine Spa and the Pediatric Habilitation and Rehabilitation Clinic of the Child and Adoles-cent Health Care Institute of Vojvodina.
The first institution for physical therapy in Vojvodina was the Iodine Spa, founded in 1911. Today, the Iodine Spa is known as the Special Hospital for Rheumatic Diseases, and it primarily provides prevention, diagnosis, treatment and re-habilitation of rheumatic patients in outpatient and hospital settings.
The Department of Physical Medicine and Reha-bilitation of the General Hospital in Novi Sad was founded in 1959. The most common disabilities treated at the Medical Rehabilitation Clinic include: hemiplegia after cerebrovascular accidents, paraple-gia due to spinal lesions, conditions after limb am-pultation, peripheral nerve palsy, severe consequen-ces of traumatism and traumatism in the elderly.
The Department of Pediatric Rehabilitation, first and foremost in Vojvodina, was founded in 1968, at the Mother and Child Health Care Institute. It is specialized for habilitation, rehabilitation, physical diagnosis and therapy of children with hereditary diseases, congenital diseases and deformities, acqu-ired diseases and after trauma and polytrauma.
The major goals of medical rehabilitation in Vojvodina are to integrate disabled people into their living and working environment through multidisciplinary approaches, using all the proce-dures of current medical rehabilitation.
Key words: Physical Medicine, Rehabilita-tion Centers, Child Health Services, Hystory of Medicine
Introduction
The history of physical medicine and rehabilitati-on in Serbia begins with the ancient Roman period. The Romans are credited with establishing balneot-herapy and use of hot springs, as they built baths and resting places for their troops. Today, there are more than 300 thermal springs in Serbia, and many of tho-se are located in Vojvodina. The first Spa Clinic in Serbia was founded in 1868 in Vrnjačka Spa.
The need for medical rehabilitation in Serbia arose after the First World War due to the large number of disabled persons, so in 1919 Orthopedic Institute was founded in Belgrade. The first Depar-tment of Physical Therapy was founded in 1930, in the General Military Hospital in Belgrade. Further activities associated with the integration of physi-cally disabled persons into the society were taken after the Second World War. This contributed to further development of medical rehabilitation in Serbia. Thus, in 1953, the Institute of Physical Me-dicine and Rehabilitation of Serbia was founded in Belgrade after the Rusk’s model in New York.
The development of physical medicine and rehabilitation in Vojvodina closley followed the development of the same branch of medicine in Serbia and its capital, Belgrade. The three main institutions and leaders in the field of physical me-dicine and rehabilitation in Vojvodina are: the Me-dical Rehabilitation Clinic of the Clinical Center of Vojvodina, the Special Hospital for Rheumatic Diseases Iodine Spa and the Pediatric Habilitation and Rehabilitation Clinic of the Child and Adoles-cent Health Care Institute of Vojvodina (1).
The history of the Special Hospital for Rheumatic Diseases Iodine Spa
The first institution for physical therapy in Voj-vodina was Iodine Spa founded in 1911. The Spa was built owing to the discovery of a spring of mi-neral water, around 193 meters under the ground.
The Development of Physical Medicine and Rehabilitation in VojvodinaGordana Devecerski, Dusica Simic
Medical Rehabilitation Clinic, Clinical Center of Vojvodina, Novi Sad, Republic of Serbia
Vers
ion fo
r revie
w
HealthMED - Volume 6 / Number 6 / 2012
Journal of Society for development in new net environment in B&H 2201
Chemical analysis of this mineral water was done by Ignjac Pfeiffer in 1907, and in 1914 Professor Vilmos Hanko determined the properties of this mineral water as muriatic, alkaline iodine water, 24 °C, ie. a hypothermic radioactive water.
Indications for Iodine Spa treatment in the ear-ly 20th century included: pains of rheumatic origin, neuralgia, sciatica, joint pain of rheumatic and trau-matic origin, arthritis, obesity, sexually transmitted diseases, arteriosclerosis and so on. The Iodine Spa has registered more than 15.000 visitors a year, and had a permanent spa physician employed. Due to its great popularity till 1963, the Iodine Spa was a joint accommodation and healthcare institution. In 1963, the Iodine Spa became a health facility with 65 hos-pital beds and three specialized clinics: Rheumato-logy Clinic, Physical Medicine and Rehabilitation Clinic, and Orthopaedics and Traumatology Clinic.
In 1977, the Special Hospital for Rheumatic Di-seases Iodine Spa was integrated with the Faculty of Medicine in Novi Sad and became a teaching hospital. In the mid eighties, the Spa kept only its name, while its facilities developed into a modern rheumatology institution. Due to its historical, cul-tural and artistic value, the Iodine Spa complex was declared a monument of culture in 1986.
In the early nineties, the inpatient capacity of Iodine Spa was expanded to a total of 102 beds. Reorganization of the Outpatient Clinics was made, so four outpatient specialized clinics were founded: the Rheumatic Diseases Clinic, the Infil-tration Treatment Clinic, the Acupuncture Clinic, and the Clinic for Manual Medicine.
In 2006, the Iodine Spa became a Special Hos-pital for Rheumatic Diseases, with a capacity of 70 beds. The priority of this reorganized Special Hospital was to provide prevention, diagnosis, tre-atment and rehabilitation of rheumatic patients in outpatient and hospital settings (2).
The history of the Medical Rehabilitation Clinic
The Department of Physical Medicine and Re-habilitation of the General Hospital in Novi Sad was founded in 1959, in a building that was espe-cially built for that purpose in 1958. This rehabi-litation facility was the first of its kind in the Pro-vince of Vojvodina.
The department started working in very unfa-vorable conditions, with only five qualified health workers: a specialist and four physiotherapists. Professionally qualified staff was scarse. Therefo-re, intensive professional training and specializati-on of the staff was undertaken.
As the need for medical rehabilitation has in-creased significantly, the Department of Physical Medicine and Rehabilitation was established as an independent health facility in 1963, by the decree of the Executive Council of AP Vojvodina and became a Physical Medicine and Rehabilitation Institute. In 1962, the Institute became a teaching hospital of the Faculty of Medicine in Novi Sad.
The Institute had a capacity of 100 hospital beds for adults with physical disability, who required me-dical rehabilitation. At the same time, the outpatient department was developed, led by an Outpatient Clinic and a Cabinet for Prosthetics and Orthotics. The Institute was equipped with facilities for kine-sitherapy, electrotherapy, hydrotherapy and occu-pational therapy. It also acquired all the necessary equipment for training disabled individuals through medical rehabilitation, as well as modern diagnostic tools such as two-channel electromyography (3).
The Institute provided medical rehabilitation for physically disabled adults, regardless of the cause and severity of the disability. The most nu-merous were patients with trauma, patients with hemiplegia, paraplegia (quadriplegia), patients af-ter limb amputation, peripheral paralysis, rheuma-tic diseases and other conditions.
In the eighties, scientific research focused on disabled person and their rehabilitation, with spe-cial emphasis on rheumatic diseases as the cause of disability. Special interest was paid to the lum-bar and cervical syndromes. Estimation of dama-ged functions was performed, as well as of the re-maining functional and working ability and with vocational guidance of patients.
In 1997, the Medical Rehabilitation Institute became an integral part of the Clinical Center of Vojvodina. Today, Medical Rehabilitation Clinic implements contemporary methods of evaluation and medical rehabilitation of disabled persons. Pre-vention of disability and secondary complications in patients who are undergoing treatment on other clinics is conducted by the early rehabilitation team. The basic principle is teamwork. Rehabilitation te-

Vers
ion fo
r revie
w
2202
HealthMED - Volume 6 / Number 6 / 2012
Journal of Society for development in new net environment in B&H
ams consist of experts of all those profiles that are necessary for solving complex physical, psycholo-gical and social repercussions of disability.
The most common disabilities treated at the Medical Rehabilitation Clinic today are: hemiple-gia after cerebrovascular accident, paraplegia due to spinal lesions, conditions after limb ampultati-on, peripheral nerve palsy, severe consequences of traumatism and traumatism in the elderly. It also provides physical treatment for patients with lumbar and cervical syndromes and other painful syndromes related to degenerative diseases of the musculoskeletal system.
Today, the Clinic has 120 beds, in four depar-tments. The outpatients visit three departments: Acupuncture Department, Orthotics and Prosthetics Department, the Electrodiagnosis Department, and the Follow-up Department of disabled patients after discharge. The premeses for physical therapy include 5 halls for kinesiotherapy, 3 rooms for electrotherapy and thermotherapy, a room for occupational therapy and a hydrotherapy area with a swimming pool.
Scientific research in the field of physical medi-cine and rehabilitation is regularly conducted throu-gh meetings, professional training, and specializati-ons. If conferences of national importance are held at the Clinic, all participants publish their papers, but they also actively participate in international scientific conferences abroad. Physicians employed at the Clinic are members of expert associations in the country and abroad. The Department is conduc-ting research in various research projects (4).
The History of Pediatric Rehabilitation in Novi Sad
The Department of Pediatric Rehabilitation, the first and foremost in Vojvodina, was founded in 1968, at the Mother and Child Health Care In-stitute. The Department was primarily responsible for the treatment of children with cerebral disse-ases from Novi Sad, who previously sought trea-tment in Belgrade.
The Department was originally located on the ground floor of the unfinished building for pedia-tric surgery, and had 30 beds. In 1972, it was mo-ved to inadequate premises, the basement in the new wing of the Pediatric Institute, where it rema-ined for the following 35 years.
Together with specialists in pediatric neuropsyc-hiatry, specialists in pediatric rehabilitation founded the so-called Novi Sad School, which focused on the problems of the developmental age in children. Collaboration was also established with the pediatric orthopedists in the field of congenital and acquired defects and deformities. Consultations with collea-gues from Belgrade, Zagreb and Ljubljana proved to be very useful as well. New knowledge, gained from international courses and seminars, has been applied in practice: therapeutic methods according to Tardieu, Bobath, Kabat, Vojta, application of Sco-lifes, FEPA, laser therapy and acupuncture.
A few years later, A Rehabilitation Institute for Children and Youth Principovac was founded 50 km away from Novi Sad. It was intended to accom-modate children who needed prolonged treatment, and it provided regular and special education. The Institute had three departments: neuropsychiatry, pediatrics and rehabilitation. At the beginning, both the Department for Child Rehabilitation in Novi Sad and Principovac were understaffed: with a specialist physician, three physiotherapists, one occupational therapist, a speech therapist, a psychologist, a teacher and several nurses. With the increasing number of patients and introduction of new therapeutic procedures, the number of em-ployees has increased as well.
The Pediatric Habilitation and Rehabilitation Center was founded in 2003, by merging the Depar-tment of Pediatric Rehabilitation and the Rehabili-tation Institute for Children and Youth Principovac. The Center was officially opened in a new building in 2007. It is an integral part of the Child and Ado-lescenth Health Care Institute of Vojvodina. The building was built according to current standards, it has two floors, and a total area of 1000 m2.
Today, the Pediatric Habilitation and Rehabili-tation Clinic consists of two parts: the Outpatient Clinic includes the Admission Ward, the Speciali-zed Examination Ward, Children Neurology De-partment and the Department for EMG Diagno-stics and a Daily Hospital. The Inpatient Clinic includes the Department of Physical Medicine and Rehabilitation with the Ward for habilitation of infants and children with high-risk development, the Ward for rehabilitation of neurological and surgical patients, and the Department of Physical Medicine. Presently, the Clinic has 43 beds.

Vers
ion fo
r revie
w
HealthMED - Volume 6 / Number 6 / 2012
Journal of Society for development in new net environment in B&H 2203
The Clinic is specialized in habilitation, rehabi-litation, physical diagnosis and therapy of children with hereditary diseases, congenital diseases and deformities, acquired diseases and conditions after trauma and polytrauma.
Pediatric Rehabilitation was incorporated into the subject of Physical Medicine and Rehabilitati-on at the Faculty of Medicine in Novi Sad in 1980, and the Department became a teaching hospital for undergraduate medical students, graduate students, residents, general practitioners and other medical school students. Scientific activities in the field of Pediatric Rehabilitation take place within research projects, professional and scientific papers, publica-tions, meetings, congresses, conferences, professio-nal trainings and study sections (5).
The main goal of Medical Rehabilitation in Vojvodina today is to help disabled persons succe-ssful integration into their living and working en-vironment, through multidisciplinary approaches, using all available sources of medical rehabilitation.
References
1. Jovin S, Beriac B. History of Medicine and Health Culture in the territory of Vojvodina. Novi Sad: Mati-ca Srpska. 1994.
2. Bobić B. Iodine Spa: Institute for Rheumatisam. 1897-1999. Novi Sad: Institute for Rheumatisam; 1999.
3. Nevidek B. Department of Physical Medicine and Re-habilitation. In: Memorial. Medical faculty Novi Sad 1960-1970. Novi Sad: Medicical faculty; 1070:161-4.
4. Devečerski G, Savić K, Bobić B. A historical review of the development of physical medicine and rehabi-litation service in Vojvodina. Medpregl. 2007; 60(11-12):657-661.
5. Savić K, urednik. Re-Habilitacija in childhood period. Novi Sad: Ortomedics; 2007.
Corresponding Author Dusica Simic, Medical Rehabilitation Clinic, Clinical Center of Vojvodina, Novi Sad, Republic of Serbia E-mail: [email protected]

Vers
ion fo
r revie
w
2204
HealthMED - Volume 6 / Number 6 / 2012
Journal of Society for development in new net environment in B&H
Abstract
The breast cancer is the most frequent tumor in the female population. In regard to the trend of in-creasing morbidity and high mortality rate as well as median of the disease and the age of 45 and below 45 years, this malignancy proved to be serious heal-th problem. As far as the patients with this problem are in 50% in generative period of life, the patients with promising prognostic parameters and disease-free intervals of more than 5 years (particularly in case of negative hormone receptors) who wish to get pregnant could be allowed pregnancy with spe-cial precautions. The planned pregnancy in patients treated for breast cancer was earlier inconceivable for oncologists and gynecologists. The pregnancy in patient after operation and treatment of breast cancer is a height risk pregnancy and need to be control from gynecologist-perinatologist, as well as intensive control from oncologist. In standard multidisciplinary team presents of psychologist is necessary. Our study presented a case of pregnancy and delivery after patient of 25 years old had been operated and irradiated for medullary breast cancer and disease-free intervals more than 5 years. After bearing normal pregnancy, the patient deliver heal-thy female baby.
Key words: Breast Neoplasms; Carcinoma Medullary; Pregnancy; Delivery
Introduction
Breast cancer is the most frequent present tu-mor in the female population. After cervical cancer, breast cancer is the second most common preg-nancy-associated malignancy (1). Breast cancer is relatively rare in young women, more than three-quarters of cases occur in women over age 50. In 2003 the American Cancer Society estimates that about 11500 US women under age 40 will devel-op invasive breast cancer and 1400 will die from
it (2). Women, nowadays, delay their childbirth to the 30ies (3). Breast cancer and pregnancy are events that have an enormous impact on the lives of young women. When these events are associated they become issue with possible devastating conse-quences (4, 5). In regard to the trend of increasing morbidity and high mortality rate as well as median of the disease and the age of 45 and below 45 years, this malignancy proved to be serious health prob-lem. As far as the patients with this problem are in 50% in generative period of life, the patients with promising prognostic parameters and disease-free intervals of more than 5 years (particularly in case of negative hormone receptors) who wish to get pregnant could be allowed pregnancy with special precautions (5). As improved treatments help more young women survive breast cancer, the question of whether to have a child later becomes increasingly important (6).
Pregnancy-associated breast cancer (PABC) is defined as breast cancer diagnosed during preg-nancy or within the first year after delivery (7). Up to 1/3000 live births are complicated by breast cancer each year (1). Given the aging of the preg-nant population, and the known relationship be-tween late parity, age and breast cancer, rates of PABC may be expected to rise in the coming years (8). In the future, therefore, more breast cancer pa-tients will have recently given birth, been pregnant concurrent with their diagnosis, or not yet started their childbearing at the time of their diagnosis (9).
Case report
Twenty-five years old women was admitted at the Institute of Oncology in Sremska Kamenica with palpable and movable tumefaction in the left breast. Physical examination confirmed the pres-ence of tumefaction, which was located in upper lateral quadrant of the left breast towards the axilla (Spenser’s lobe) (figure 1). The tumefaction was 1
Pregnancy and delivery after the breast carcinoma: is it possible?Zorica Grujic1, Mirjana Bogavac1, Aleksandar Curcic1, Aleksandra Nikolic1
¹ Clinical Center of Vojvodina, Department of Obstetrics and Gynecology, Novi Sad; Serbia

Vers
ion fo
r revie
w
HealthMED - Volume 6 / Number 6 / 2012
Journal of Society for development in new net environment in B&H 2205
cm in size, movable, well defined and of hard con-sistency. Laboratory findings, chest X ray, ECG and heart condition were in normal ranges. Upon the further questioning, menarche occurred at the age of thirteen, menstrual cycle was regular. The patient denied use contraceptive pills. No birth and 3 abortions are mentioned. The patient was smoker since the age of seventeenth. There were no inherited diseases or family history of cancer.
Figure 1. Localization of the tumor
The patient was operated on April 23, 1996 (figure 2). We performed biopsy extempore fol-lowed by quadrantectomy of the left breast with evacuation of axilla sec. Veronesi (because the ex-tempore analysis confirmed carcinoma of the left breast). Primary tumor (size, 0,6 x 0,6 cm) was completely removed.
Figure 2. Patient’s breast after operation
Histopathology analysis confirmed invasive breast cancer with dominant medullary component. The tumor was positive to ER and negative to PR receptors after operation the patient received irradi-ation therapy (50 Gy in 20 fractions and boost dose in tumor bed). The patient came for a regular control every third month for the first 3 years. Afterwards, she was checked up every 6 months according to the standard protocol: ultrasound of the liver every 6 months, scintigraphy of the skeleton once a year, and chest X ray. MRI of both breasts was preformed before the planned pregnancy (Figure 3).At her per-sonal insistence and responsibility, the patient got pregnant spontaneously at the age of 31 (5 years af-ter operation of primary breast carcinoma). The last menstruation was on December 31, 2001. During her pregnancy she came for regular controls. Ultra-sonographic examination was performed 3 times: at 12, 20 and 28 gestational weeks, and oncology examination in the 1st and 3rd trimester of pregnancy (ultrasound of the liver, laboratory analyses and CA 15.3). There was no need for early amniocentesis upon the consultation with the geneticist, but in the view of eventual consequences of the previous ther-apy, the patient underwent early amniocentesis at gestational week 16, and the following finding was obtained: 46 XX, normal karyotype. The pregnancy was regular throughout its course (Figure 4). The parturition occurred on October 8, 2002 at 5 a.m. It was a vaginal delivery of the newborn in occipi-tal position with episiotomy. She gave a birth to a live female newborn (Apgar score 9/10). The com-plete placenta was spontaneously separated and de-livered. Manual revision of the delivery canal was performed and the episiotomy was sutured.
Postpartum period was regular. Involution of the uterus was normal as well as serous-blood lo-chia. The episiotomy wound healed per primam. Control laboratory findings were normal. Lacta-tion was interrupted by bromocriptine agents. Control gynecology examination in week 6 after delivery was normal. The control oncology exam-ination was regular. Twelve years post labor, the patient remains free of disease.

Vers
ion fo
r revie
w
2206
HealthMED - Volume 6 / Number 6 / 2012
Journal of Society for development in new net environment in B&H
A
BFigure 3. MRI of both breast after operation. A: precontrast; B: postcontrast
Figure 4. Pregnant patient
Vers
ion fo
r revie
w
HealthMED - Volume 6 / Number 6 / 2012
Journal of Society for development in new net environment in B&H 2207
Discussion
After the analysis of literature data we real-ized that there have been a very small number of published reports on the pregnancy following the treated breast cancer. Many more references could be found on the breast cancer associated with preg-nancy (1, 10). As far as 10 years ago there was an attitude that the women treated for breast cancer should not get pregnant and deliver. The opinions on the post-breast-cancer pregnancy have changed in concern to the fact that the incidence of breast cancer has been increased in younger age groups, particularly in the women (concern of this paper) with no previous deliveries, and these with good prognostic parameters, long disease-fee interval in which the pregnancy could have been safely planned. In a prospective study oh 694,657 parous women in Norway, 5474 developed breast cancer after their first birth (11). It is generally accepted that early first childbirth is associated with reduced risk of developing breast cancer. In contrast, there is no evidence that pregnancy after breast cancer treatment has a negative influence on the progno-sis (10). In the medical literature there are no ran-domized clinical trials helping in the making deci-sion in this setting. Significant experience already exists in some institutions and can guide manage-ment in these difficult cases (12).
In our patient, the BRCA has not been estimat-ed for technical impossibility. It was planned to perform regular controls of the mother and future female child, and the pregnant woman had been introduced with the possible risk of the occurrence of the breast cancer in the female child during her generative period. The parents agreed to the risk. Prenatal testing for BRCA mutation should only be done after extensive counseling of the parents during which not only the medical genetic aspects but also the decision for prenatal BRCA testing and selective termination of views (13). Prenatal BRCA testing is morally defensible only in case of a female fetus. It parents have the intention to terminate the pregnancy when fetus is a carrier, the final decision is in any case up to the parents.
The problem of a pregnancy after treatment for breast cancer is analyzed and this aspect is an emerging issue in clinical oncology. The decision should evaluate for each patient, taking into ac-
count the prognosis of the patient and her desire of pregnancy (14). Furthermore it is likely that will-ingness of pregnancy after breast cancer contains, besides classic constituents of appeals of mother-hood, a specific meaning for the recovery of both health and femininity (15).
Although few studies have been done, none have found evidence that pregnancy after success-ful breast cancer treatment increases the risk of the disease coming back.
Mueller and her colleagues (2003) identified more than 15000 women under age 45 in Seattle, Detroit and Los Angeles who were diagnosed with invasive breast cancer (2). Of those, 438 women gave birth some time after being diagnosed. The re-searchers compared each of these women with up to 12 women of similar age and race with breast can-cer that had not give birth. Women who gave birth 10 months or longer after diagnosis had almost half the risk of dying from breast cancer, compared to women who did not have a child after diagnosis (2). Reduced risk was seen even among women whose disease had spread to the lymph nodes, or who had tumors larger than two centimeters.
Further research that need to be done to de-termine what risks pregnancy may pose to breast cancer survivors, and if that risk is influenced by factors like age, race, or disease characteristics (16). Such research could take 10 years or more.
Conclusion
In conclusion, our study presented a case of healthy pregnancy and delivery, which occur af-ter the patient had been operated and irradiated for breast cancer. The possibility of recurrence of the disease remains a constant life long hazard.
Abbreviations
BRCA: gene for breast cancer; ER: estrogen receptors; PR: progesterone receptors.

Vers
ion fo
r revie
w
2208
HealthMED - Volume 6 / Number 6 / 2012
Journal of Society for development in new net environment in B&H
References
1. Kelly HL, Frances A, Collichio and E. Claire Dees. Concomitant pregnancy and breast cancer: options for systemic therapy. Breast Disease 2006; 23: 95–101.
2. American Cancer Society. Is pregnancy after breast cancer safe? Journal Cancer 2003; 6: 1131-40.
3. Hartman M, Lim G, Czene K, Bhalla V, Chow K et al. Childbirth following breast cancer: an evaluation of the “healthy mothers” excess mortality risk. Ameri-can Association for Cancer Research 2009; 1-2.
4. Ives A, Semmens J, Saunders C, Puckridge P. A grow-ing dilemma-breast cancer and pregnancy. Aust Fam Physician 2002; 31 (10): 929-32.
5. Grujic Z, Dobanovacki Miljkovic Lj, Grujic I. Preg-nancy and delivery after the breast carcinoma. Ar-chive of Ocology 2003; 11 (2): 103-5.
6. Braun M, Hasson-Ohayon I, Perry S, Kaufman B, Uz-iely B. Motivation for giving birth after breast cancer. Psycho-Oncology 2005; 14 (4): 282-96.
7. Psyrri A, Burtness B. Pregnancy-associated breast cancer. Cancer J 2005; 11:83-95.
8. Rosenkranz KM, Lucci A. Surgical treatment of preg-nancy associated breast cancer. Breast Disease 2006; 87-93.
9. Langagergaard V, Gislum M, Skriver MV, Nørgard B et al. Birth outcome in women with breast cancer. British Journal of Cancer 2006; 94: 142-6.
10. Mouridsen HT, Kroman N. Pregnancy before and af-ter breast cancer. An Ass J Australasian Soc Breast Dis 2003; 12 (1): 12.
11. Vatten LJ, Romundstad PR, Trichopoulos D, Skjaer-ven R. Pregnancy related protection against breast cancer depends on length of gestation. Br J Cancer 2002; 87 (3): 289-90.
12. Crivellari D, Lombardi D, Scuderi C et al. Breast cancer and pregnancy. Tumor 2002; 88 (3): 187-92.
13. Cobben JM, Brocker Vriends AH, Leschot NJ. Pre-natal diagnosis for hereditary predisposition to mammary and ovarian carcinoma-defining a posi-tion. Ned Tijdschr Geneeskd 2002; 146 (31): 1461-5.
14. Kniazewski B, Olejak A. Breast cancer in pregnant women. Ginekol Pol 2002; 73 (4): 404-7.
15. Eisinger F, Noizet A. Breast cancer and pregnancy: decision making and the point view of the mother. Bull Cancer 2002; 89 (9): 755-7.
16. Kontzoglou K, Stamatakos M, Tsaknaki S, Goga H, Kostakis A, Safioleas M. Successful pregnancy after breast cancer therapy: dream of reality. Internation-al Seminars in Surgical Oncology 2009; 6: 7-16.
Corresponding Author Zorica Grujic, Clinical Center of Vojvodina, Department of Obstetrics and Gynecology, Novi Sad, Serbia, E-mail: [email protected]

Vers
ion fo
r revie
w
HealthMED - Volume 6 / Number 6 / 2012
Journal of Society for development in new net environment in B&H 2209
Abstract
We report a case of severe hypertension caused by renal artery stenosis of congenital solitary kid-ney in a 24-year-old female. After an admission of our 24-yeat female patient to hospital, the initial investigation ruled out endocrine cause of arterial hypertension. The left kidney could not be visua-lized by the ultrasound examination of the abdo-men, so we did the CT scan of the abdomen using per oral and intravenous contrast and the diagnosis of left kidney agenesis followed by the compen-satory enlargement of the right kidney was esta-blished. While some cases of renovascular steno-sis may be diagnosed by Doppler ultrasound, other cases have demonstrated that this technique may miss the diagnosis of renovasular hypertension. Renal angiography revealed a stenotic area in the upper renal artery of a solitary functioning kidney. It was 1.5 cm wide; the degree of the stenosis was over 60%. Renal artery supplying the inferior part of the kidney was without any pathological chan-ges. Although renal arteriography is the golden standard in diagnosing renal artery stenosis, there are certain risks: procedure- related complications and contrast induced nephropathy.
Endovascular treatment is an alternative to surgery with lower morbidity rates. Stenting the stenotic renal artery in solitary functioning kidney either improves or stabilizes the renal function and provides stabilization of the blood pressure. Implantation of stent in upper renal artery of the solitary functioning kidney in our patient led to normalization of hypertension and improvement of renal functioning.
Key words: solitary kidney, renal artery steno-sis, renal artery stent
Introduction
The stenosis of renal artery or/and its branches is mostly caused by atherosclerosis or fibromuscu-lar dysplasia, while blood vessel diseases are less common. It is the cause of all cases of hypertensi-on in 2-5% (1), with fibromuscular dyslpasia more common in women under 40 years of age, while atherosclerosis is more frequent in men with risk factors for developing atherosclerosis over fifty years of age (2).
According to Roodhoft et al. unilateral renal agenesis is present in 1 : 500 in general population (3), which is more often than seen on autopsies (4).
Renal artery stenosis in a solitary functioning kidney is a rare condition, and it is associated with hypertension, depletion of renal function, high morbidity and mortality (5-7). Considering mor-bidity and mortality characteristics of the patients with the renal artery stenosis in a solitary functi-oning kidney, it is an imperative to detect these patients as early as possible using a set of diagno-stic procedures in order to choose an adequate tre-atment regimen.
The goal of the treatment is to improve or nor-malize blood flow through an affected kidney, correct the renal artery stenosis, regulate arterial blood pressure. This can be achieved by medical management or by using certain percutaneous in-terventions or surgical revascularization (2).
Case report
A twenty-four year old female was admitted to hospital presenting with headache, nausea, vomi-ting, high artery blood pressure (220/120 mmHg) and tachycardia. Thorough anamnesis revealed that she had been having occasional headaches
Renal artery stenosis in a solitary functioning kidney - case reportEdita Stokic1, Ivana Bajkin2, Slobodan Curic3, Viktor Till4, Sanja Stojanovic4, Dragan Sagic5, Dragana Tomic-Naglic1
1 Clinic of endocrinology, diabetes and metabolic diseases, Clinical centre of Vojvodina, Novi Sad, Serbia,2 Emergency centre of Vojvodina, Clinical centre of Vojvodina, Serbia,3 Clinic of nephrology and clinical immunology, Clinical centre of Vojvodina, Novi Sad, Serbia,4 The Centre of radiology, Clinical centre of Vojvodina, Novi Sad, Serbia,5 The Institute of cardiovascular diseases Dedinje, Centre of invasive diagnostics, Belgrade, Serbia.

Vers
ion fo
r revie
w
2210
HealthMED - Volume 6 / Number 6 / 2012
Journal of Society for development in new net environment in B&H
with nausea for approximately two months, which was the reason of going to the general practitioner a day prior to hospitalisation at our Clinic, who diagnosed hypertension and prescribed antihiper-tensives which the patient had not been using.
The family history showed that the father of our patient had arterial hypertension.
Physical examination of the patient showed the following: sinus tachycardia (100/min), the discreet systolic murmur over all valves and arterial hyper-tension (200/120 mmHg). All periphery pulses were palpable. Echocardiography revealed concentric hypertrophy of the cardiac muscle of the left ventric-le, and neither the signs of aortic dissection nor the significant gradient at the isthmus were present. Ra-diogram of the heart and lungs showed normal heart silhouette without any signs of the left ventricular hypertrophy. On the count of severe headache, after initial lowering of the artery blood pressure using ACE inhibitors (nifedipin 40 mg per orally)
and calcium channel blockers (captopril 50 mg), we performed an urgent CT scan of the endocra-nium, which did not show any abnormalities. Ur-gent laboratory investigations showed an increase in creatinine (152 µmol/l with the upper reference limit 125 µmol/l) and urea (15.5 mmol/l with the upper reference limit 8 mmol/l) ( Table 1).
We performed all the necessary laboratory in-vestigations and ruled out an endocrine cause of the hypertension (Table 1). Screening for risk fac-tors for hypertension pointed out only the hyperc-holesterolemia (Table 1).
The left kidney could not be visualized by the routinely done ultrasonographyc examination of the abdomen, so we did the CT scan of the abdo-men using per oral and intravenous contrast and the diagnosis of left kidney agenesis followed by the compensatory enlargement of the right kidney was established (Figure 1). Doppler ultrasound visualised the renal artery partially, with the nor-
Table 1. Laboratory testsAnalysis Result Reference range
WBC 6,9 x l09/l 4-10 x 109/lRBC 4,58 x 10¹²/l 3.9-6.0 x 10¹²/lHaemoglobin 130 g/l 120-160 g/lPlatelets 154 x 109/l 140-150 x 109/lAspartat transferase 27 U/l 5-37 U/lAlanin transferase 10 U/l 5-40 U/lγ- glutamyl transpeptidase 11 U/l 7-38 U/lAlkaline phosphatise 54 U/l 30-115 U/lTotal bilirubin 8 µmol/l 3-21 µmol/lBUN 8.8…15…7.8 mmol/l 2.5-7 mmol/lCreatinine 152…112 µmol/l 30-127 µml/lSodium 141 mmol/l 135-155 mmol/lPotassium 4.6 mmol/l 3.5-5.5 mmol/lChloride 108 mmol/l 95-105 mmol/lTotal proteins 70 g/l 60-80 g/lAlbumins 48.8 g/l 35-50 g/lTotal cholesterol 7.26 mmol/l 4-5.20 mmol/lTriglycerides 0.52 mmol/l <1.7mmol/lThyroid-stimulating hormone 1.25 mIU/l 0.41-5.12 mIU/lACTH 7.54 pg/ml 9-46 pg/mlAldosterone 402.9 pg/ml 40-310 pg/mlAdrenalin-urine 27.3 nmol/dU 10.9-120 nmol/dUNoradrenalin-urine 140.1 nmol/dU 94.6-425.6 nmol/dUDopamine-urine 998.2 nmol/dU 948.8-2611.3 nmol/dUUrine proteins 3…0 0Glucose 4.6 mmol/l 3.5-5 mmol/l

Vers
ion fo
r revie
w
HealthMED - Volume 6 / Number 6 / 2012
Journal of Society for development in new net environment in B&H 2211
mal lumen and normal rate of blood flow on the segment which could be seen. Renal angiograp-hy was the next diagnostic step, and it revealed a stenotic area in the upper renal artery of a solitary functioning kidney. It was 1.5 cm wide; the degree of the stenosis was over 60%. Renal artery suppl-ying the inferior part of the kidney was without any pathological changes. (Figures 2, 3, 4).
Given all the facts, it was clear that permanent treatment of the artery hypertension and it’s un-derlying cause, i.e. renal artery stenosis, was nece-ssary, so the percutaneus transluminal angioplasty of the upper right renal artery with the placing the stent was done (angioplastica percutanea translu-minalis arteriae renalis superioris dextri cum stent – Palmaz blue 5x18). The procedure was perfor-med by a vascular interventional radiologist.
Figure 1. CT scan showing the absence of the left kidney
Figure 2. Renal angiography showing the stenotic area in the upper right renal artery
Figure 3. Renal angiography showing the stenotic area in the upper right renal artery
Figure 4. Renal angiography showing the stenotic area in the upper right renal artery
In the course of the post interventional period we treated the patient with small doses of ß-bloc-kers, statins and antiaggregational agents, the blo-od pressure normalized, which was confirmed by the twenty-four hours blood pressure monitoring. Renal function improved, as well. The control multislice CT contrast angiography showed good position of the stent and adequate lumen of the re-nal artery (Figures 5, 6, 7).

Vers
ion fo
r revie
w
2212
HealthMED - Volume 6 / Number 6 / 2012
Journal of Society for development in new net environment in B&H
Figure 5. CT angiography showing the position of the stent in the upper right renal artery
Figure 6. CT angiography showing the position of the stent in the upper right renal artery
Figure 7. CT angiography showing the position of the stent in the upper right renal artery
Discussion
This case report is educative for several reasons. The fact that unilateral renal agenesis was dia-
gnosed in a twenty-four year old patient, conside-ring the ability to use non-invasive, reproducible and precise enough ultrasonographyc examination of abdomen and kidneys can not be neglected. Con-sidering the age of our female patient, undiagnosed renal agenesis, impairment of renal function and the arterial hypertension which can be accompanied with severe complications could have had its first manifestation during pregnancy. The worsening of the hypertension and the development of pre-eclampsy with greater risk for foetal and maternal complications is to be expected (8).
The arterial hypertension in patients with soli-tary kidney can be found in a current literature. Lan et al. had observed fourteen children with uni-lateral agenesis and showed the greater prevalence of hypertension, proteinuria and renal insufficien-cy in 29%, 43%, 36% respectively, compared to the group of the patients who underwent unilateral nefrectomy (9). The incidence of congenital soli-tary kidney in this study was 1: 1496. The authors

Vers
ion fo
r revie
w
HealthMED - Volume 6 / Number 6 / 2012
Journal of Society for development in new net environment in B&H 2213
pointed out that the complications such as arterial hypertension, proteinuria and renal insufficiency were frequent in patients between the age of 30 -60. Peco-Antic A. et al. presented the case of a four months old patient with renal artery stenosis in congenitally solitary kidney with pelvic loca-lisation (10). Hayashida M. et al showed a case report of a twenty-four year old woman with reno-vascular hypertension, thus making our case a non unique one (11). This patient had been treated as essential hypertension since she was nineteen, all the way to the preeclampsy and HEELP syndrome (haemolysis, elevated liver enzymes, low platelet count) at the 28. week of gestation.
On the other hand, performing certain diagnostic procedures opens some dilemma. Considering the age of our patient and the abrupt onset of hyper-tension and tachycardia we suspected the endocri-ne cause of hypertension, which we excluded by the laboratory and morphological examinations. Urgent abdominal ultrasound failed to visualize the left kidney, so the CT scan of the abdomen fo-llowed, and showed left kidney agenesis with the compensatory enlargement of the right kidney. Do-ppler ultrasound of the right renal arteries did not verify any pathologic changes. It was only after the renal angiography had been done, that the stenotic area in the upper right renal artery was seen. Some cases of renovascular lesions can be diagnosed using Doppler ultrasonography, while in some, like ours, pathologic changes might stay undiagnosed. So, the normal findings on the Doppler ultrasono-graphy should be accompanied by other techniqu-es using methods with radioactive isotopes or/and angiography. Although the renal angiography is the „golden standard„ in diagnosing renal artery steno-sis and revealing the underlying cause of the steno-sis, this procedure may be accompanied with cer-tain complications including the onset of contrast induced nephropathy (CIN). These risks are espe-cially important in patients with a solitary kidney, which are categorized as a high-risk population for performing such procedures.
The general recommendation in diagnostics and treatment of hypertensive patients cannot be given, considering the low prevalence of reno-vascular hypertension in the general population of hypertensive patients, together with the cost and limitations of certain screening tests. The turn
and the significance of diagnostic procedures used should depend on the characteristics of each pa-tient, clinical findings and suspected reason for renovascular hypertension (fibromuscular dyspla-sia or atherosclerosis), as well as on whether the renal insufficiency is present and the eventual risk of contrast angiography. It depends upon the on-going antihypertensive therapy, which can affect rennin- angyotensin system (RAAS), too (12).
There are not only the dilemmas in diagnosti-cs, but in therapy regimen, as well. The goals in treating renovascular hypertension are to control arterial blood pressure, preserve renal function and prevent the development of the complications (12). The medicament treatment, percutaneous in-terventions and surgical revascularizing procedu-res are the therapeutical options.
Satisfactory result in treating renovascular hypertension in patients with solitary functioning kidney can hardly be achieved only by medicati-ons. More efficient are the interventional radiolo-gy methods (percutaneous transluminal angyopla-sty with stent).
Having the morbidity and mortality characteri-stics of the patients with the renal artery stenosis in a solitary functioning kidney in mind, early re-nal angioplasty with or without placing the stent in the affected artery in order to establish normal renal vascularisation is recommended (13,14). Watson et al. observed the effects of stenting on kidney fun-ction in a prospective study on thirty-three patients with chronic renal failure and bi- or unilateral renal artery stenosis with solitary or single functioning kidney (15). Prior to positioning the stent all pati-ents suffered from renal insufficiency. After stenting the improvement of renal function was observed in eighteen patients. Shanon et al. showed the use of stent in patients with solitary functioning kidney, renal artery stenosis and impaired renal function (16). During the follow up period of six to twen-ty-five months, normalization of renal function was achieved in 24% of the patients, improvement in 19% while deterioration of renal function was seen in 29% of the patients. Sahim S et al. showed cli-nical results in stenting renal artery in order to treat renovascular hypertension in patients with solitary functioning kidney. In 6.7% patients the arterial hypertension was cured, it was improved in 26.6% and stabilized in 66.7% of the patients. The impro-

Vers
ion fo
r revie
w
2214
HealthMED - Volume 6 / Number 6 / 2012
Journal of Society for development in new net environment in B&H
vement of renal function was observed in 60% of the patients, while it was stabilized in 26.6% of the patients. 13.4% of the patients had the worsening of the renal function (17). All these authors pointed out the significance of percutaneous recanalisation with stent implantation as a safe and efficient pro-cedure in controlling the arterial blood pressure in patients with renal artery stenosis in a solitary fun-ctioning kidney.
The renal artery stenosis in a solitary functio-ning kidney is a difficult state accompanied with hypertension, progressive renal insufficiency and higher morbidity and mortality risk, so the tenden-cy in treating these patients is to use minimally invasive procedures (13). The study of Cioni R et al, which followed up patients with the stent implantation in renal artery of the solitary kidney showed this form of treating to be relatively safe alternative to conventional surgical procedures in these high risk patients. There was an improve-ment or stabilizing of renal function in 74% of the participants (13). The percutaneous transluminal angioplasty with solitary functioning kidney leads to a clinical benefit in these patients (14). Further studies are necessary in defining criteria for iden-tifying these high risk patients who can benefit from therapeutic procedures. However, one sho-uld always keep in mind that there are numerous variations of renal vascular supply (hilar supera-numerary renal arteries) (18).
There was an obvious and abrupt correction of arterial hypertension and renal function improve-ment in our patient after percutaneous trasluminal angioplasty with stenting the upper right renal ar-tery, and the procedure went on without any com-plications.
Conclusion
Implantation of stent in upper renal artery of the solitary functioning kidney, as safe and effici-ent procedure, in our twenty-four female patient led to normalization of hypertension and improve-ment of renal function.
References
1. Goble MM. Hypertension in infancy. Pediatr Clin North Am, 1993; 40(1):105–122
2. Bloch MJ, Basile J. Diagnosis and management of renovascular disease and renovascular hypertension. J Clin Hypertens (Greenwich). 2007; 9(5):381-9
3. Roodhooft AM, Birnholz JC, Holmes LB. Familial na-ture of congenital absence and severe dysgenesis of both kidneys. N Engl J Med 1984; 310:1341–5
4. Kiprov DD, Calvin RB, McLuskey RT. Focal and seg-mental glomerulosclerosis and proteinuria associated with unilateral renal agenesis. Lab Invest 1982; 46: 275–81
5. Russo D, Iaccarino V, Conte G, Fuiano G, Niola R, Testa A, Mazzone P, Andreucci VE. Treatment of se-vere renovascular hypertension by percutaneous transluminal renal angioplasty in patients with soli-tary functioning kidney. Nephron 1988; 50: 315–9.
6. Weinberger MH, Yune HY, Grim CE, Luft FC, Klatte EC, Donohue JP. Percutaneous transluminal angi-oplasty for renal artery stenosis in a solitary function-ing kidney. Ann Intern Med 1979; 91:684–8
7. Connolly JO, Higgins RM, Waters HL. Presentation, clinical features and outcome in different patterns of atherosclerotic renovascular disease. Ann Intern Med 1994;91:684-688
8. Thorsteinsdottir B, Kane GC, Hogan MJ, Watson WJ, Grande JP, Garovic VD. Adverse outcomes of reno-vascular hypertension during pregnancy. Nat Clin Pract Nephrol 2006; 2(11):651-6
9. Lan RR, Huang JJ, Sung JM, Lid SN. Congenital solitary kidney: Review of 14 cases and their outcome on comparison with uninephrectomized patients. Acta Nephrol 1996; 10: 26-31
10. Peco-Antic A, Djukic M, Sagic D, Kruscic D, Krstic Z. Severe renovascular hypertension in an infant with congenital solitary pelvic kidney. Pediatr Ne-phrol 2006; 21(3):437-40
11. Hayashida M, Watanabe N, Imamura H, Kumazaki S, Kitabayashi H, Takahashi W, Uchikawa S, Yazaki Y, Kubo K. Congenital solitary kidney with renovas-cular hypertension diagnosed by means of captopril-enhanced renography and magnetic resonance angi-ography. Int Heart J 2005;46(2):347-53
12. Bloch MJ, Basile J. Diagnosis and management of renovascular disease and renovascular hypertension. J Clin Hypertens (Greenwich). 2007; 9(5):381-9

Vers
ion fo
r revie
w
HealthMED - Volume 6 / Number 6 / 2012
Journal of Society for development in new net environment in B&H 2215
13. Cioni R, Vignali C, Petruzzi P, Neri E, Caramella D, Vagli P, Bargellini I, Napoli V, Pinto S, Bartolozzi C. Renal artery stenting in patients with a solitary func-tioning kidney. Cardiovasc Intervent Radiol. 2001; 24(6):372-7
14. Tan J, Filobbos R, Raghunathan G, Nicholson T, Fowler R, Wright M, Eadington D. Efficacy of renal artery angioplasty and stenting in a soli-tary functioning kidney. Nephrol Dial Transplant. 2007;22(7):1916-9
15. Watson PS, Hadjipetrou P, Cox SV, Piemonte TC, Eisenhauer AC. Effect of renal artery stent-ing on renal function and size in patients with atherosclerotic renovascular disease. Circulation. 20003;102(14):1671-7
16. Shannon HM, Gillespie IN, Moss JG. Salvage of the solitary kidney by insertion of a renal artery stent. AJR Am J Roentgenol. 1998;171(1):217-22.
17. Sahin S, Cimsit C, Andac N, Baltacioglu F, Tuglular S, Akoglu E Renal artery stenting in solitary func-tioning kidneys: technical and clinical results. Eur J Radiol. 2006; 57(1):131
18. Talovic E., Voljevica A., Kulenovic A. Evaluation of methods in identifying hilar supernumerary re-nal arteries originating near aorta. HealthMed J 2011;5(6):1800-1805
Corresponding Author Ivana Bajkin, Emergency centre of Vojvodina, Clinical centre of Vojvodina, Serbia, E-mail: [email protected]

Vers
ion fo
r revie
w
2216
HealthMED - Volume 6 / Number 6 / 2012
Journal of Society for development in new net environment in B&H
Abstract
Introduction: The development of cardiovas-cular disease is closely linked to lifestyle and risk factors of this disease. There are scientific evi-dences that change of lifestyle with reduction of risk factors can slow the development of cardio-vascular diseases before the onset of clinical ma-nifestations. Prevention of cardiovascular disease should include people with multiple risk factors, no manifesting signs of disease, people with latent diseases as well as by people with cardiovascular diseases. In all three groups preventive actions ac-hieve successful results and the best are those in the first group where there have been no clinical manifestations of disease. Internal medicine prac-tice applied to the young student population is an example of a strategy of prevention in medicine, because it promptly discovers symptoms of cardi-ac diseases and disorders, but is also in extremely favorable position to deal with the causes and risk factors of cardiac disorders and diseases.
Objective: Analysis of quality of life of stu-dents at the University of Sarajevo and issuing re-commendations for lifestyle modification.
Materials and methods: The study was pros-pective, retrospective, clinical, and descriptive analytical. The sample consisted of the Univer-sity of Sarajevo students. The sample included students in regular and systematic examinations of the Institute for Health Protection of Students University of Sarajevo in the period 2005 - 2010.
Results: Sports activities in all patients- 91 pa-tients or 84% do not train, 10 or 10% trains,8 or 6 % trains sometimes. Lifestyle and nutrition for all patients: 58 or 53% live at parents, 44 or 40% of are tenants, 6 or 6 % live in dormitory, 1 or 1% live alone. Regularity and quality of meals and nutrition for all patients: 48 or 42% irregular meals mostly fast food, 51 or 49% regular, good quality food, 10
or 9% of regular, high calorie diet. Smoking in all patients: 67 or 62% are not smoking, 33 or 30% are smoking, 9 and 6% occasional smoking. The ener-gy level of all patients was with 94 or 86% lower energy level, 15 or 14% good. Number of hours spent on exercises, lectures and study: 3-5 hours 25 patients or 23%, 6-8 hours 64 patients or 64%, 9 - 10 hours 16 patients or 15%, 11 hours or more 4 patients, or 4%. Out of investigated population 94% of patients spent war in Bosnia.
Key words: The University of Sarajevo stu-dents, conditions, housing conditions and nutriti-on, quality and regularity of meals, sports activi-ties, smoking and alcohol, general state of fitness and energy, sleep-wake rhythm, time spent on exercises, lectures, studying; war period, preven-tion of cardiovascular disease; recommendations for lifestyle modification.
Introduction
The development of cardiovascular disease is closely linked to lifestyle and risk factors of these diseases. There are scientific evidences that lifestyle changes to reduce risk factors can slow the develo-pment of cardiovascular disease before the onset of clinical manifestations. Prevention of cardiovascu-lar disease should include people with multiple risk factors, no manifest signs of disease, people with latent diseases as well as by people with cardiovas-cular disease. In all three groups preventive actions achieve successful results, and the best are those in the first group where there have been no clinical manifestations of disease. Internal medicine prac-tices applied to the young student population is an example of a strategy of prevention in medicine, because it promptly discovers symptoms of cardiac diseases and disorders, but is also extremely favora-ble position to deal with the causes and risk factors of cardiac disorders and diseases.
Quality of life in students of University of Sarajevo in accordance to recommendations for lifestyle modificationZana Pozderac
Institute for Health Protection of Students University of Sarajevo, Bosnia and Herzegovina

Vers
ion fo
r revie
w
HealthMED - Volume 6 / Number 6 / 2012
Journal of Society for development in new net environment in B&H 2217
Materials and research methods
Sample consisted of the University of Sarajevo students. The sample included students in regular and systematic examinations of Institute for Heal-th Protection of Students University of Sarajevo in the period 2005 - 2010. Personal history of young student population between 18-26 years involves assessing the status of the patient through all as-pects of life. Questions must not be suggestive. Important life events should be noted to give the appropriate advice. A very important fact is infor-mation about previous illnesses, sports and family history. An essential anamnestic data for students is also faculty that participant attends.
Survey:1. The conditions, housing conditions and
nutrition;2. The regularity and quality of meals;3. Sports activities;4. Smoking and alcohol;5. General state of fitness and energy;6. The rhythm of sleep and waking;7. The time spent on exercises, lectures,
studying8. War period.
Aim of the investigation
Analysis of quality of life of students at the University of Sarajevo and issuing recommendati-ons for lifestyle modification.
Results with discussion with recommendations to students for lifestyle modifications
Table 1. Display of previous sport activities for all participants
Table review of previous sport activities for all patients
Type Number of participants %
Did previous sport activity 15 14 % No previous sport activity 94 86 %
TOTAL 109 100%
Graph 1. Relation of previous sport activities in all patients
Most of examined patients did not engage in sport activities. Highly significant response on level p<0,0000 was for total sample with t=7,46, and for girls with t=7,96. For young men differen-ce is less significant on level p<0,05 with t=2,37, while it is much more significant compared to girls on level P<0,005 with t=2,93.
Table 2. Display of presence of sport activities in all patients
Table display of previous sport activities for all patients
Type Number of participants %Does not train 91 84 %
Trains 10 10 %Trains sometimes 8 6 %
TOTAL 109 100%
Graph 2. Relation of sport activities in all patients
Most of examined patients did not train with highly significant difference on level p<0,0000 for total sample with t=7,46 and t=8,45, and for girls with t=7,09 and t=6,79. For young men that difference is less significant on level p<0,05 with t=3,36 i t=3,74.

Vers
ion fo
r revie
w
2218
HealthMED - Volume 6 / Number 6 / 2012
Journal of Society for development in new net environment in B&H
Summary of investigation of sport activities in students with recommendation on importance of active life From these results of part of the questionnaire
regarding sports activities of students we gained disturbing facts on their reduced physical activity while 84% of students surveyed do not currently practiced sports.
Recommendations to the students on importance of physical activities:a) It helps you feel better;b) A stronger heart, this is a very important
fact for us that we live in a culture in which every second someone dies from heart and cardiovascular diseases;
c) Lowers blood pressure and slows heart rate, thus protecting the heart and blood vessels, lowers blood cholesterol and LDH, increases HDL cholesterol, thus reducing the risk of heart and vascular diseases;
d) Strengthen bones by helping them to retain minerals and calcium;
e) Removes depression, exercising in nature is one of the most useful resources for the fight against this disease that so often leads to disability;
f) Frees from anxiety and stress, it was shown that physical activity is an effective remedy against stress in busy lives exposed to various pressures;
g) Increases overall energy and efficiency in all the individual areas of life;
h) It helps maintain desirable body weight;i) Improves circulation and promotes mental
clarity, better sleep, faster healing of damaged body parts
Table 3. Display of lifestyle and nutrition habits in all patients
Table display of nutrition and lifestyle habits in all patients
Type Number of patients %At parents 58 53 %
Tenant 44 40 %Dormitory 6 6 %Lives alone 1 1 %
TOTAL 109 100%
Graph 3. Relation of lifestyle and nutrition in all patients
At the time of examination most of participants ate at parent’s place. For total sample the differen-ce is highly significant on level p<0001 with t=4,02 and on level p<0,0000, with t=4,36. There is no statistically significant difference among genders.
Table 4. Display of regularity and quality of meals in all patients
Table reivew of regularity and quality of meals in all patients
Type Number of participants %
Fast food, irregular meals 48 42 %Regular, good quality food 51 49 %Regular, high calorie food 10 9 %
TOTAL 109 100%
Graph 4. Relation of regularity and quality of meals in all patients
There is no statistically significant difference among genders. In total sample only significant difference on level p<0,005 with t=3,27 among students, who eat irregularly and those on high calorie food.
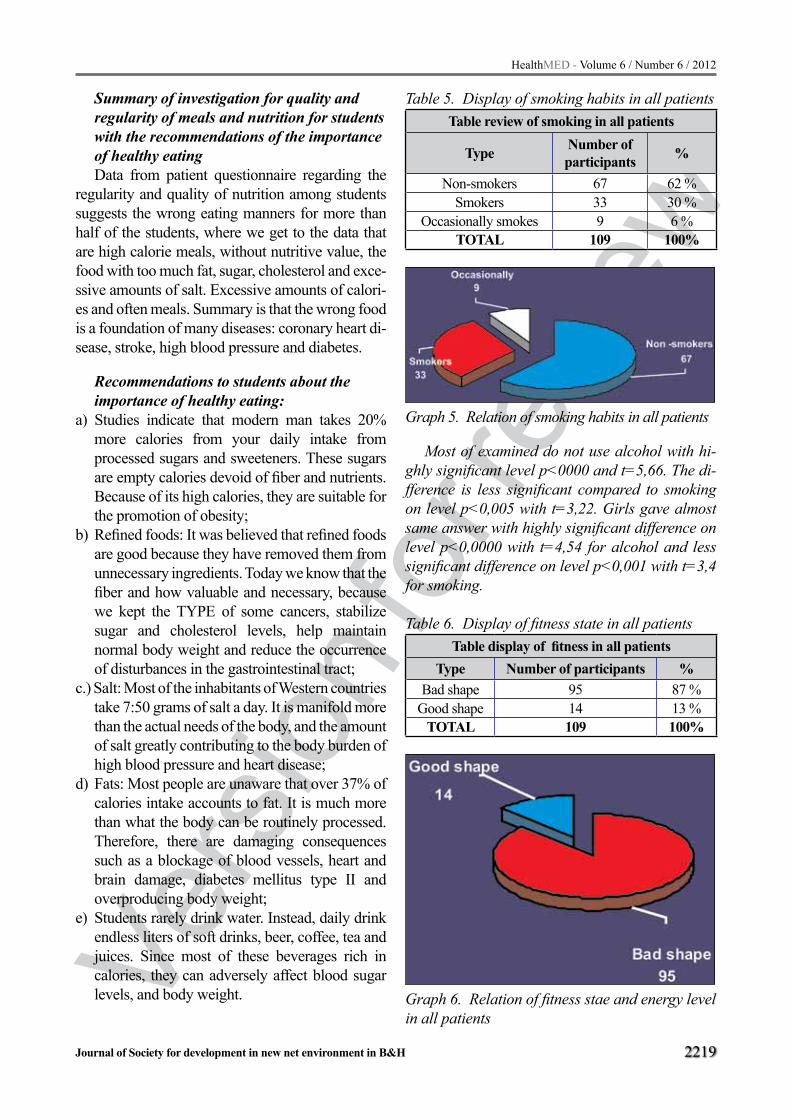
Vers
ion fo
r revie
w
HealthMED - Volume 6 / Number 6 / 2012
Journal of Society for development in new net environment in B&H 2219
Summary of investigation for quality and regularity of meals and nutrition for students with the recommendations of the importance of healthy eatingData from patient questionnaire regarding the
regularity and quality of nutrition among students suggests the wrong eating manners for more than half of the students, where we get to the data that are high calorie meals, without nutritive value, the food with too much fat, sugar, cholesterol and exce-ssive amounts of salt. Excessive amounts of calori-es and often meals. Summary is that the wrong food is a foundation of many diseases: coronary heart di-sease, stroke, high blood pressure and diabetes.
Recommendations to students about the importance of healthy eating:
a) Studies indicate that modern man takes 20% more calories from your daily intake from processed sugars and sweeteners. These sugars are empty calories devoid of fiber and nutrients. Because of its high calories, they are suitable for the promotion of obesity;
b) Refined foods: It was believed that refined foods are good because they have removed them from unnecessary ingredients. Today we know that the fiber and how valuable and necessary, because we kept the TYPE of some cancers, stabilize sugar and cholesterol levels, help maintain normal body weight and reduce the occurrence of disturbances in the gastrointestinal tract;
c.) Salt: Most of the inhabitants of Western countries take 7:50 grams of salt a day. It is manifold more than the actual needs of the body, and the amount of salt greatly contributing to the body burden of high blood pressure and heart disease;
d) Fats: Most people are unaware that over 37% of calories intake accounts to fat. It is much more than what the body can be routinely processed. Therefore, there are damaging consequences such as a blockage of blood vessels, heart and brain damage, diabetes mellitus type II and overproducing body weight;
e) Students rarely drink water. Instead, daily drink endless liters of soft drinks, beer, coffee, tea and juices. Since most of these beverages rich in calories, they can adversely affect blood sugar levels, and body weight.
Table 5. Display of smoking habits in all patients Table review of smoking in all patients
Type Number of participants %
Non-smokers 67 62 %Smokers 33 30 %
Occasionally smokes 9 6 %TOTAL 109 100%
Graph 5. Relation of smoking habits in all patients
Most of examined do not use alcohol with hi-ghly significant level p<0000 and t=5,66. The di-fference is less significant compared to smoking on level p<0,005 with t=3,22. Girls gave almost same answer with highly significant difference on level p<0,0000 with t=4,54 for alcohol and less significant difference on level p<0,001 with t=3,4 for smoking.
Table 6. Display of fitness state in all patients Table display of fitness in all patients
Type Number of participants %Bad shape 95 87 %
Good shape 14 13 %TOTAL 109 100%
Graph 6. Relation of fitness stae and energy level in all patients

Vers
ion fo
r revie
w
2220
HealthMED - Volume 6 / Number 6 / 2012
Journal of Society for development in new net environment in B&H
Most of examined patients believe they are in bad shape with highly significant difference on level p<0,0000 with t=7,69 for total sample and with t=7,26 for girls. For young men a significant difference is lower on level p<0,005 with t=3,38.
Table 7. Display of number of sleep hours in all patients
Table display of sleep hours in all patients
Type Number of participants %
Up to 6 hours of sleep 15 14 %Up to 7 hours of sleep 54 49 %Up to 8 hours of sleep 35 32 %
Sleeping to 9 hours and more 5 5 %TOTAL 109 100%
Graph 7. Relation of number of sleep hours in all patients
Most examined patients sleep to 7 hours, with highly significant difference for total sample on level p<0,0001 with t=3,88. For girls the differen-ce is less significant p<0,005 with t=2,93, and for young men even lower with p<0,01 and t=2,73.
Table 8. Display of hours spent at excersizes, lec-tures and studying in all patients Table display of time spent at excersizes, lectures or
studying in all patientsType Number of participants %
From 3 to 5 25 23 %From 6 to 8 64 64 %From 9 to 10 16 15 %
From 11 and more 4 4 %TOTAL 109 100%
Graph 8. Overview of the relationship hours spent on exercise, lectures and training in all patients
Most of examined young men study 3-5 hours daily, without significant difference compared to girls and within male groups. Most girls study 6-8 hours daily with highly significant difference on level p<0000 with t=4,78,t=4,7 and t=5,25 compared to other girls. In total sample there is a highly significant difference on level p<0,0000 with t=5,22 and t=4,56,and on level p<0,0001 with t=3,97.
Summary of research efforts of poor effort tolerance, poor fitness and reduced energy in students with recommendations on the importance of proper rest Data on the poor effort tolerance, poor fitness
and reduced energy in more than half the student points to multiple causes, which individually or mutifactorial cause these discomforts. On the one hand this points to errors in their lifestyle, seden-tary lifestyle, high calorie fast food, inversion of sleep, smoking and the presence of stress related to exams, or the weight of objective scientific - te-aching process through which pass daily. Low to-lerance of effort can be a sign of significant heart defect. Based on the above we make a conclusion that is done keeping in mind that our study analy-zed students who came for suspected or confirmed cardiac problems, the fact they get tired easily, partly are reflection of objective cardiac problems, associated with the inappropriate style of living and severity of the process of study, become pro-nounced. It is necessary to perform cardiac evalu-ation: ECG, chest x-ray and heart ultrasound.
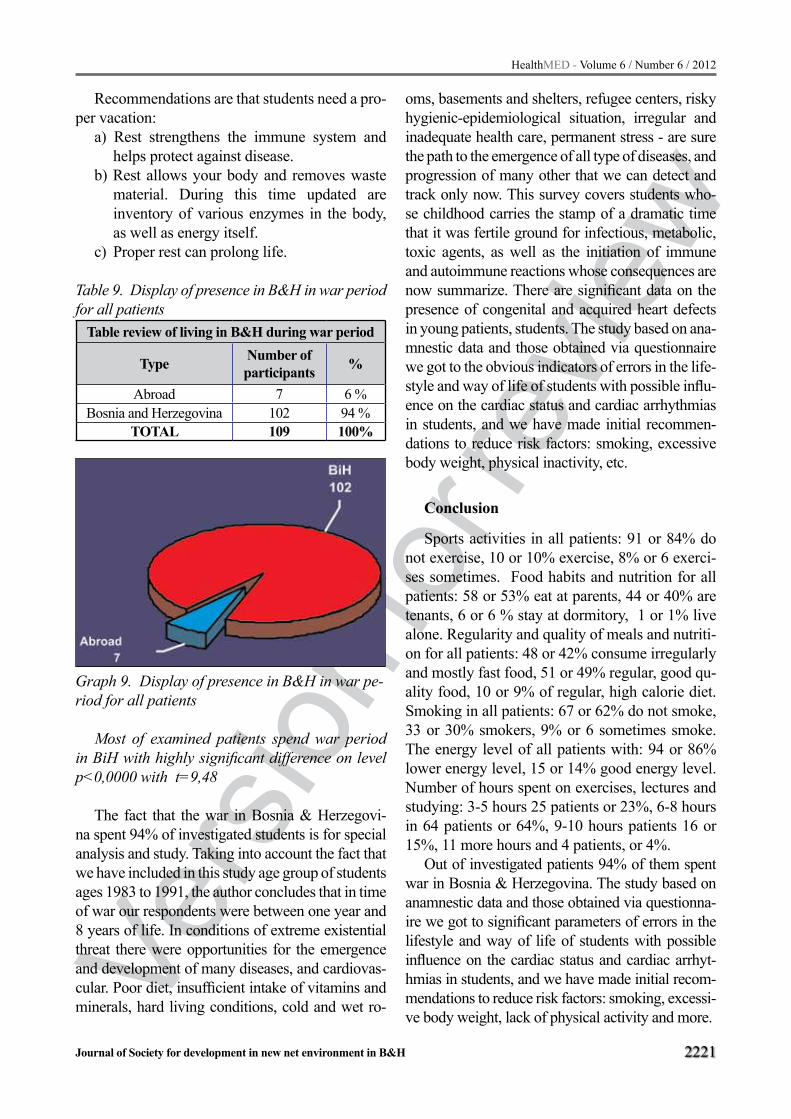
Vers
ion fo
r revie
w
HealthMED - Volume 6 / Number 6 / 2012
Journal of Society for development in new net environment in B&H 2221
Recommendations are that students need a pro-per vacation:
a) Rest strengthens the immune system and helps protect against disease.
b) Rest allows your body and removes waste material. During this time updated are inventory of various enzymes in the body, as well as energy itself.
c) Proper rest can prolong life.
Table 9. Display of presence in B&H in war period for all patients
Table review of living in B&H during war period
Type Number of participants %
Abroad 7 6 %Bosnia and Herzegovina 102 94 %
TOTAL 109 100%
Graph 9. Display of presence in B&H in war pe-riod for all patients
Most of examined patients spend war period in BiH with highly significant difference on level p<0,0000 with t=9,48
The fact that the war in Bosnia & Herzegovi-na spent 94% of investigated students is for special analysis and study. Taking into account the fact that we have included in this study age group of students ages 1983 to 1991, the author concludes that in time of war our respondents were between one year and 8 years of life. In conditions of extreme existential threat there were opportunities for the emergence and development of many diseases, and cardiovas-cular. Poor diet, insufficient intake of vitamins and minerals, hard living conditions, cold and wet ro-
oms, basements and shelters, refugee centers, risky hygienic-epidemiological situation, irregular and inadequate health care, permanent stress - are sure the path to the emergence of all type of diseases, and progression of many other that we can detect and track only now. This survey covers students who-se childhood carries the stamp of a dramatic time that it was fertile ground for infectious, metabolic, toxic agents, as well as the initiation of immune and autoimmune reactions whose consequences are now summarize. There are significant data on the presence of congenital and acquired heart defects in young patients, students. The study based on ana-mnestic data and those obtained via questionnaire we got to the obvious indicators of errors in the life-style and way of life of students with possible influ-ence on the cardiac status and cardiac arrhythmias in students, and we have made initial recommen-dations to reduce risk factors: smoking, excessive body weight, physical inactivity, etc.
Conclusion
Sports activities in all patients: 91 or 84% do not exercise, 10 or 10% exercise, 8% or 6 exerci-ses sometimes. Food habits and nutrition for all patients: 58 or 53% eat at parents, 44 or 40% are tenants, 6 or 6 % stay at dormitory, 1 or 1% live alone. Regularity and quality of meals and nutriti-on for all patients: 48 or 42% consume irregularly and mostly fast food, 51 or 49% regular, good qu-ality food, 10 or 9% of regular, high calorie diet. Smoking in all patients: 67 or 62% do not smoke, 33 or 30% smokers, 9% or 6 sometimes smoke. The energy level of all patients with: 94 or 86% lower energy level, 15 or 14% good energy level. Number of hours spent on exercises, lectures and studying: 3-5 hours 25 patients or 23%, 6-8 hours in 64 patients or 64%, 9-10 hours patients 16 or 15%, 11 more hours and 4 patients, or 4%.
Out of investigated patients 94% of them spent war in Bosnia & Herzegovina. The study based on anamnestic data and those obtained via questionna-ire we got to significant parameters of errors in the lifestyle and way of life of students with possible influence on the cardiac status and cardiac arrhyt-hmias in students, and we have made initial recom-mendations to reduce risk factors: smoking, excessi-ve body weight, lack of physical activity and more.

Vers
ion fo
r revie
w
2222
HealthMED - Volume 6 / Number 6 / 2012
Journal of Society for development in new net environment in B&H
Internal cardiac practice applied to the young student population is an example of a strategy of prevention in medicine, because it promptly dis-covers symptoms of cardiac diseases and disor-ders, but is also in extremely favorable position to deal with the causes and risk factors of cardiac disorders and diseases. We want to gain relevant parameters that our health is determined by our li-festyle choices, relatively of what we are willing to do for ourselves-to show what habits of our life we choose, especially about what we eat, drink, exercise, smoke or not. In this paper, applied to the student population, we have an opportunity to deal with it, because it is a population that is willing to cooperate and learn.
Students gladly accept information about heal-th, lifestyle mistakes that lead to disease and are one of the fittest populations for the modification of lifestyle. Many due to ignorance violate the laws of health, but most students actually know more than their way of living shows that. They should be brought to the point that they use the knowledge they have as a rule of life. Young people - students can serve as the best pattern for a long studied and desired medical road of prevention, through ear-ly diagnosis of disease, via decisions on better quality of life to a complete recovery. This study indicates the need for the development of preven-tive cardiology strategies of action in the manner of engagement team of experts through lectures, publication of brochures and DVDs.
References
1. L., Amouyel, P., and Dallongeville, J. Fruits, vege-tables and coronary heart disease. Nature Reviews Cardiology, 6 (2009): 599-608. doi: 1011038/nrcar-dio.2009.131
2. Mellen, P.B, Walsh, T.F., and Herrington, D.M. Who-le grain intake and cardiovascular disease: a meta-analysis. Nutrition, Metabolism and Cardiovascular Disease, 18 (2008): 283-290.
3. Ray, K.K., et al., Statins and all-cause mortality in high-risk primary prevention: a meta-analysis of 11 randomized controlled trials involving 65,229 parti-cipants. Arch Intern Med, 2010. 170(12): p. 1024-31.
4. Sattar, N., et al., Statins and risk of incident diabetes: a collaborative meta-analysis of randomised statin trials. Lancet, 2010. 375(9716): p. 735-42.
5. Sarter, B., T.C. Campbell, and J. Fuhrman, Effect of a high nutrient density diet on long-term weight loss: a retrospective chart review. Altern Ther Health Med, 2008. 14(3): p. 48-53.
6. Sabate, J., K. Oda, and E. Ros, Nut consumption and blood lipid levels: a pooled analysis of 25 intervention trials. Arch Intern Med, 2010. 170(9): p. 821-7.
7. Kris-Etherton, P.M., et al., The role of tree nuts and peanuts in the prevention of coronary heart disease: multiple potential mechanisms. J Nutr, 2008. 138(9): p. 1746S-1751S.
8. Dr. Esselstyn’s Prevent and Reverse Heart Disease Penguin, 2007.3-110
9. Effect of combined aerobic and resistance training versus aerobic training alone in individuals with co-ronary artery disease: a meta-analysis European Jo-urnal of Cardiovascular Prevention & Rehabilitation. 2012; 19:81-94,
10. Association of Physical Activity With Vascular En-dothelial Function and Intima-Media Thickness Cir-culation. 2011;124:1956-1963,
11. Arterial dysfunction and functional performance in patients with peripheral artery disease: A review Vasc Med. 2011;16:203-211,
12. Strength training versus aerobic interval training to modify risk factors of metabolic syndrome J. Appl. Physiol.. 2010;108:804-810,
13. Lifestyle Modifications for Its Prevention and Ma-nagement, American journal of lifestyle medicine. 2009;3:425-439,
14. A Review of Gay Men’s Health: Challenges, Strengths, and Interventions Isacco,Anthony; Yallum,Nicole K.; Chromik,Lindsay C. Follow American Journal of Life-style Medicine , Volume 6 (1): 45 SAGE – Jan 2, 2012
15. Nutrition and Inflammation: Insights on Dietary Pa-ttern, Obesity, and Asthma Myers,Jay L.; Allen,Jorie C. Follow American Journal of Lifestyle Medicine , Volume 6 (1): 14 SAGE – Jan 2, 2012
16. A Preliminary Investigation of Stimulus Control, Self-Monitoring, and Reinforcement in Lifestyle Interventi-ons for Pediatric Overweight Dalton, William T.; Kitz-mann, Katherine M. Follow American Journal of Life-style Medicine, Volume 6 (1): 75SAGE – Jan 2, 2012
17. Reducing Inflammation: Statins or Lifestyle? Gillespie,Nicole D.; Lenz,Thomas L. Follow Ameri-can Journal of Lifestyle Medicine , Volume 6 (1): 21 SAGE – Jan 2, 2012

Vers
ion fo
r revie
w
HealthMED - Volume 6 / Number 6 / 2012
Journal of Society for development in new net environment in B&H 2223
18. Recipe Makeovers for Life Follow American Jour-nal of Lifestyle Medicine, Volume 6 (1): 24 SAGE – Jan 2, 2012
19. University of California - San Francisco. (2012,) "Study Finds Tobacco Company Misrepresented Danger From Ci-garettes; Toxicity Levels Obscured, Increasing Risks Of He-art Disease, Cancer." Medical News Today. Retrieved from http://www.medicalnewstoday.com/releases/240043.php.
20. Cokkinides V, Bandi P, McMahon C, Jemal A, Glynn T, Ward E. Tobacco control in the United States — recent progress and opportunities. CA Cancer J Clin 2009;59(6):352-65
21. Serdula MK, Brewer RD, Gillespie C, Denny CH, Mokdad A. Trends in alcohol use and binge drin-king, 1985-1999: results of a multi-state survey. Am J Prev Med 2004;26(4):294-8.
22. Medical Expenditure Panel Survey online data query. 2008 Data on expenditures by age and sex. Agency for Healthcare Research and Quality; 2010. http://www.meps.ahrq.gov/mepsweb/data_stats/meps_query.jsp. ,2011.
23. Navas-Nacher EL, Colangelo L, Beam C, Greenland P. Risk factors for coronary heart disease in men 18 to 39 years of age. Ann Intern Med 2010;134(6):433-9.
24. Roger VL, Go AS, Lloyd-Jones DM, et al., Heart di-sease and stroke statistics-a report from the American Heart Association, Circulation, 2011;123:e18–e209.
25. Skelton JA, Cook SR, Auinger P, et al., Prevalence and Trends of Severe Obesity Among US Children and Adolescents, Acad Pediatr, 2009;9:322–9.
26. Ogden CL, Carrol MD, Prevalence of Obesity Among Children and Adolescents: United States, Trends 1963-1965 Through 2007-2008, 2010. Ava-ilable from: www.cdc.gov/nchs/data/hestat/obesity- child_07_08/obesity_child_07_08.pdf
27. Understand your risk of heart attack. American He-art Association. http://www.heart.org/HEARTORG/Conditions/HeartAttack/UnderstandYourRiskofHe-artAttack/Understand-Your-Risk-of-Heart-Attack_UCM_002040_Article.jsp. Accessed Oct. 18, 2010.
28. Erhardt L. Cigarette smoking: An undertreated risk factor for cardiovascular disease. Atherosclerosis. 2009;205:23.
29. Kodama S, et al. Cardiorespiratory fitness as a quantitative predictor of all-cause mortality and cardiovascular events in healthy men and women. Journal of the American Medical Association. 2009;301:2024.
30. Effects of omega-3 fatty acids on cardiovascular di-sease. Rockville, Md.: Agency for Healthcare Rese-arch and Quality. http://www.ahrq.gov/downloads/pub/evidence/pdf/o3cardio/o3cardio.pdf. Accessed Oct. 18, 2010.
31. Owen CG, et al. Is body mass index before middle age related to coronary heart disease risk in later life? Evidence from observational studies. Internati-onal Journal of Obesity. 2009;33:866.
32. Benderly M, et al. Relation of body mass index to mortality among men with coronary heart disease. American Journal of Cardiology. 2010;106:207.
33. U.S. Preventive Services Task Force. Screening for high blood pressure: U.S. Preventive Services Task Force reaffirmation recommendation statement. Annals of Internal Medicine. 2007;147:783.
34. Screening for lipid disorders in adults: Recommen-dation statement. U.S. Preventive Services Task For-ce. http://www.ahrq.gov/clinic/uspstf08/lipid/lipidrs.htm. Accessed Oct. 18, 2010.
35. Kahn R, et al. Age at initiation and frequency of screening to detect type 2 diabetes: A cost-effective-ness analysis. The Lancet. 2010;375:1365.
Corresponding Author Zana Pozderac, Institute for Health Protection of Students University
of Sarajevo, Bosnia and Herzegovina, E- mail: [email protected]

Vers
ion fo
r revie
w
2224
HealthMED - Volume 6 / Number 6 / 2012
Journal of Society for development in new net environment in B&H
Causes and differences in stress experience between doctors and nurses/medical technicians employed in Bureau of Emergency Medical Services of Canton SarajevoVedran Djido¹, Redzo Causevic¹, Aida Ramic-Catak², Gordana Manic¹1 Faculty of Health Studies, University of Sarajevo, Bosnia and Herzegovina,2 Institute for Public Health of the Federation of Bosnia and Herzegovina, Sarajevo, Bosnia and Herzegovina.
Abstract
Introduction: Fifty years ago no one used the word stress to describe personal anxiousness. In decades that followed stress has become the most frequent psychological phenomena of our society, and cause for the most health problems of any kind.
Aim: The aim of this research is to examine factors of stress, so called stressors, at work. That includes experience (subjective) of the employees with stressors they encounter, and difference in experience between doctors and nurses/medical technicians.
Respondents and methods: 115 health care workers (nurses/medical technicians and doctors) employed at the Bureau of Emergency Medical of Canton Sarajevo participated in this research in the period of June-July 2011. In this work we used descriptive research method type, sectional studi-es at present time.
Results: The results of the research were obtai-ned by a questionnaire (Likert scale) which consi-sted of 37 questions related to the stress experien-ce of health care workers at work. Among the most important stressors recognised by this group are: unrealistic expectations of the clients (users) and/or their family members, wrongly informed cli-ents (users), exposure to the inappropriate public criticism, fear of the possible infection, informing family members about the death of their relatives, unpredicted everyday situations, threat of lawsu-it, work at dispatching centre, overwork, conflicts with a clients (users) or their family members. For the doctors, the most stressful are the exposure to the inappropriate public criticism and wrongly in-formed clients (users). Nurses and medical tech-nicians experience unrealistic expectations of the
clients (users) and/or their family members more often than doctors, and wrongly informed clients (users), which is the same as with the doctors. Nurses/medical technicians also list the fear of in-fection as a distinctive stressor at their work place.
Conclusion: Causes of stress at work experien-ced by health care workers employed at the Bure-au of Emergency Medical of Canton Sarajevo are many and of great intensity, and it is established that there is significant difference between expe-rience and intensity of stress between doctors and nurses/medical technicians.
Key words: stress, stress at work, stressors, doctors, nurses/medical technicians.
Introduction
Today stress is talked about as ubiquitous and everyday phenomenon. People more often face the events they could not anticipate, such as: wars, terrorism, new kinds of diseases, non-democratic regimes, disregard of basic social needs of people, groups, and individuals, decay of family, loss of job, etc. Let us add that modern man additionally witnesses them by following them over the diffe-rent media (1). Stress would probably influence us in some period of our life. We all know some of the most stressful professions such as air traffic controllers, who know that each their mistake can cause plane crush and loss of hundreds of human lives. There are also journalists who can resear-ch and uncover different financial brokerage and corruption of large corporations or individuals, and many times we witnessed the murders of jour-nalists, police officers working in dangerous and violent areas, soldiers in unstable and war-affected countries. These are some of the extreme exam-

Vers
ion fo
r revie
w
HealthMED - Volume 6 / Number 6 / 2012
Journal of Society for development in new net environment in B&H 2225
ples of stress impact on people. But there are also everyday stressful situations with which each of us is quite familiar with, and which are inevitable in everyday life: family relationships, health pro-blems, conflicts with people, traffic jams, lack of time for performing work, loss of personal things, small defects in the house, and many different cri-ses in life (2, 3).
Health care workers also belong to the group of extremely stressful population. It is known in the health care system that health care workers who work in medical emergency institutions (es-pecially in the field) are constantly in the stressful environment, and therefore most exposed to the stress. Nature of health care worker’s job in the medical emergency institutions is such that every day they meet unpredictable, medical urgent and physically seriously injured persons, which often provides unsightly scene in the field, which incre-ases stress in health care workers.
Stress is defined as any interference which di-sturbs mental and physical well being of the indi-vidual. It happens when the body works outside its own normal capacity and capabilities (4). Me-dicine of the 19th century based the term stress on poor health condition, and connected it with cases of angina pectoris. In 1932 Walter Cannon said that the stress is a disorder of homeostasis which happens because of the cold, lack of oxygen, or lowered blood sugar (5). To put it simple, stress is a negative emotional reaction based on cognitive assessment of an event as a threat (6, 7).
During the last decade there has been great in-terest in research of psycho-social aspects of the healthcare workers operating environment. The reason for that is the exposure to the high levels of stress at work, increased risk of burnout syndro-me, role conflict, and dissatisfaction. Numerous researches in different countries prove that preva-lence of stress at work by health care workers is high. Prevalence of burnout syndrome by doctor specialists is from 41% to 76 %, while the preva-lence of depression in the same group of health care workers is from 7% to 56% (8).
Many researches, conducted in the population of nurses, showed connection between certain di-seases and stress at work such as emotional exha-ustion, physical exhaustion, and pain in the lower part of the back. Low level of decision making and
high demands, which are characteristics for the profession of nurses, maybe connected to increa-se risk of coronary diseases and mental disorders. The most common cause of stress among Chinese nurses are imbalance between given and obtained, bad image of nursery in society, and organisati-onal problems. In transition countries number of nurses who left their work is in increase (5).
Institute for Science and Technology of the Manchester University published the results of the research on the most stressful professions. Grades are from 0, for the lowest level of stress, to the highest 10, for the highest level of stress. Professi-on of doctors is graded with 6.8 and that of nurse with 6.5. Stress in health care institutions and their departments varies depending on working place of a doctor or a nurse, so these grades can also vary, which means that at some positions at work nur-se has a higher grade for the stress exposure than the doctor and vice versa. The example for that is the work of nurses with patients in terminal pha-se of life and “difficult patients”, where the nurse is under constant pressure and demands from the doctor and relatives of the patient. Extremely stre-ssful situation for all health care workers is the fi-nal moment of life and the death of the patient (9).
Aim
The aim is to indentify stressors which mostly cause stress in health care workers and determine difference in stress experience between doctors and nurses/medical technicians.
Respondents and methods
All employees of the Bureau of Emergency Me-dical of Canton Sarajevo between the age of 18 and 65 who worked at the position of nurse/medical te-chnician or a doctor in a period of June-July 2011, were included in this research. The research was vo-luntarily and anonymous, and health care workers were informed of the research in written and orally. The research was conducted by applying the que-stionnaire (Likert scale) under the name “Stress in health care workers at work in Public institution the Bureau of Emergency Medical of Canton Sarajevo.
In this work we used descriptive research met-hod type, sectional studies at present time, where

Vers
ion fo
r revie
w
2226
HealthMED - Volume 6 / Number 6 / 2012
Journal of Society for development in new net environment in B&H
we got the results with help of The questionnaire about stressors at work. The questionnaire (Likert scale) is standardised and it was taken over from the School of Public Health “Andrija Štampar”, Medical Faculty of the University of Zagreb un-der the name “The questionnaire on the stressors at work in hospital health care workers v 2.0.” The questionnaire is partly changed and adopted for the needs of this research. Respondents were of-fered 37 stressors at work, and they graded their subjective experience of certain stressor at Likert scale with grades 1 (not stressful at all), 2 (rarely stressful), 3 (sometimes stressful), 4 (stressful), 5 (extremely stressful).
Results
The final response rate to the questionnaire was satisfying and at the end of our research we had a sample of 115 respondents. Relative majority of 66 (57,4%) respondents are women while 49 (42,6%) respondents were men. Average age of respondents was 41.9 years average years of ser-
vice were 15-8 years. The structure of professions: 74 (64,3%) nurses/medical technicians, 1 (0,9%) senior nurse/medical technician 38 (33,0%) doc-tors, and 2 (1,7%) other respondents.
Ten questions mostly graded with 5(extreme-ly stressful) for the whole observed population: wrongly informed clients (users) - 47 respondents (40.9%), fear of infection possibility - 47 respon-dents (40,9%), unrealistic expectations of the cli-ents (users) and/or their family members - 46 res-pondents (40,0%), work at dispatching centre - 46 respondents (40,0%), lawsuit threat - 43 respon-dents (37,4%), exposure to inappropriate public criticism - 42 respondents (36,5%), overwork - 42 respondents (36,5%), informing family members about the death of their relatives - 40 respondents (34,8%), night work - 38 respondents (33,0%), unpredicted everyday situations - 38 respondents (33,0%).
Ten highest values (mean ± standard deviation) for the total observed population are: unrealistic expectations of the clients (users) and/or their fa-mily members – 3.86 ± 1.184, wrongly informed
Table 1. Correlation between ten highest values (mean) of the independent variables (stressors) towar-ds dependant variable profession is shown by scaling
Question (stressor) Profession N X σUnrealistic expectations of the clients (users) and/or their family members
Nurse/Medical technician 74 3.95 1.270Doctor 38 3.76 1.025
Wrongly informed clients (users)Nurse/Medical technician 74 3.92 1.236Doctor 38 3.79 1.094
Exposure to inappropriate public criticismNurse/Medical technician 74 3.68 1.294Doctor 38 4.00 1.040
Fear of infection possibilityNurse/Medical technician 74 3.85 1.300Doctor 38 3.45 1.267
Informing family members about the death of their relatives
Nurse/Medical technician 74 3.74 1.283Doctor 38 3.53 1.224
Unpredicted everyday situationsNurse/Medical technician 74 3.65 1.254Doctor 38 3.74 1.267
Lawsuit threatNurse/Medical technician 74 3.61 1.506Doctor 38 3.76 1.240
Work at dispatching centreNurse/Medical technician 74 3.68 1.406Doctor 38 3.53 1.409
OverworkNurse/Medical technician 74 3.38 1.421Doctor 38 3.89 1.226
Conflicts with clients (users) or their family membersNurse/Medical technician 74 3.57 1.366Doctor 38 3.34 1.321

Vers
ion fo
r revie
w
HealthMED - Volume 6 / Number 6 / 2012
Journal of Society for development in new net environment in B&H 2227
clients (users) – 3.84 ± 1.189, exposure to ina-ppropriate public criticism – 3.77 ± 1.209, fear of infection possibility – 3.72 ± 1.301, informing family members about the death of their relatives – 3.65 ± 1.250, unpredicted everyday situations – 3.63 ± 1.287, lawsuit threat – 3.63 ± 1.417, work at dispatching centre – 3.61 ± 1.387, overwork – 3.55 ± 1.359, conflicts with clients (users) or their family members – 3.48 ± 1.333.
Cronbach’s Alpha coefficient of reliability is 0.951.Table 2. Statistical significance (T-test) for the dependent variable profession in relation to inde-pendent variables (stressors)
Nurse / Medical technician / Doctor F Sig.Inadequate financial income 4.148 0.04Exposure to inappropriate public criticism 5.799 0.02
Discussion
Our research showed that of ten most stressful values for the whole respondent population of nur-ses/technicians Unrealistic expectations of clients (users) and/or the members of their families were considered the most stressful. Patients, as a rule, have unrealistic expectations from nurses and he-alth care workers in general, which is natural, be-cause they come to a health care institution with their needs and demands they hope to be solved by health care workers. Nurses/medical technici-ans spend more time with patients than any other health care worker, from the admission, by sol-ving their needs and requests, to the release. The following strong stressor for nurses/medical tech-nicians are wrongly informed clients (users), whi-ch we have already mentioned as the strong stre-ssor for doctors. Nurses/medical technicians we questioned stated the fear of infection as extreme stressor at work. Namely, all works of medical – technical interventions, such as cleaning and ban-daging wounds, providing of parenteral therapy, administration of medications, and similar, expose the nurse/medical technician to higher risk of in-fection than any other health care worker.
Our research showed that of ten most stressful values for the population of doctors, the most stre-ssful is considered the exposure to inappropriate
public criticism. This sort of stress has its source in media reports and often incorrect unprofessional criticism of doctor’s work, with huge consequences for professional and social position and reputation of some doctors and medical institutions (10). Be-side inappropriate public criticism, the following strong stressor is considered to be overwork. This simply means too much work and a little time for doing that work. This is very common with assistant workers, which mean workers whose primary task is helping the others. Reports show that overwork or the perception of the overwork is primary reason of burnout for teachers, social workers, supervisors of social work, school psyc-hologists, and health care workers (2). Research in Finland about sick benefit of doctors showed that bad team work at work has a greater influence on high rate of sick leaves than overwork or low con-trol at work. We also can explain overwork as the lack of medical stuff, which means the insufficient number of doctors in relation to workload (especi-ally during summer or winter when there is a grea-ter number of patients at the emergency because of the seasonal injuries). Wrongly informed clients is the stressor which is very stressful for the doctors. Recently the expectations of patients have drama-tically increased, much faster than the possibili-ties of the institutions to satisfy their demands. Although patients, more than ever before, dispose of much more efficient and effective diagnostics and treatment, in most of the countries spiral of financial investments in health care grows faster than inflation spiral – public pessimism about the future of health care systems is in increase. Why is that so? While the most users of health care are sa-tisfied with care they receive, there are still those who have bad experience with health care system, and the minority of them complain (11). In this context we can also mention unrealistic expectati-ons of clients, which means everyday flow of in-formation from different media about different qu-asi-doctors, medications, and procedures, that can cure everything and everyone, so the expectations from doctors and classical (official) medicine are unrealistic.
With regards to the profession of a nurse/me-dical technician towards a doctor, there is a stati-stically significant difference related to financial income, where the value of the significance is p

Vers
ion fo
r revie
w
2228
HealthMED - Volume 6 / Number 6 / 2012
Journal of Society for development in new net environment in B&H
= 0.04, so with certainty of 95% we can say that the population of nurses/medical technicians is more exposed to this stressor than the population of doctors. For the stressor exposure to inappro-priate public criticism, where significance is p = 0.02, we can affirm with certainty of 95% that the population of doctors is more exposed to the stress than the population of nurses/medical technicians.
As we can see in case of stressor of exposure to the public criticism, respondents with faculty diplo-ma and doctors are statistically much more under stress with regard to respondents with secondary school diploma and nurses/medical technicians. We explain this with the fact that employees with fa-culty diploma, where we include doctors, are more exposed to the stress than respondents with secon-dary school diploma, where we include nurses/me-dical technicians. This may happen because of the professional and/or positional authority, and that is why this population is so sensitive to the criticism, and so to the public and inappropriate. Inadequate financial income of nurses/medical technicians has significant statistical value with regard to the doc-tors simply because of the lower salary, that means workload in relation to salary.
We managed to find original scientific work on the subject of stress in health care workers by Knežević B. and co. published in 2009.Authors of this work explained that the stressors connected to financial income, organisation, inadequate work space, and unjust public criticism of their work are at the top of the hierarchical ranking by most of the doctors. Our research showed that exposure to inappropriate public criticism, overwork, and wrongly informed clients (users) are at the top of the stress scale of the doctors.
In his research Knežević B. and co. claim that by nurses/medical technicians, beside stressors of financial nature, at the top of the scale also have small number of workers, fear of danger and noxi-ousness at work such as ionizing radiation, cyto-static, infection, and pricking incidents. Our rese-arch showed that at the top of the scale by nurses/medical technicians are unrealistic expectations of the clients (users) and/or their family members, wrongly informed clients (users), and fear of po-ssible infection.
Here we can see that in Knežević B. and co. we have stressors of financial nature, which is not
the case with our research. Inappropriate criticism and fear of infection coincide as extremely stre-ssful questions in both researches.
Conclusion
In this research, according to the results, it is confirmed that there is a significant difference between basic features of observed population with regard to the presence and level of stress. Ca-uses of stress at work experienced by nurses/medi-cal technicians and doctors employed at the Bure-au of Emergency Medical of Canton Sarajevo are different, from moderate to high intensity, and it is confirmed that there is a statistically significant difference in experience and intensity of stress between doctors and nurses/medical technicians.
References
1. Dunđerović R. Osnovi psihologije menadžmenta. Fa-kultet za menadžment Novi Sad, Novi Sad 2005; 217 – 233.
2. Blonna R. Coping with stress: In a changing world. WBC McGraw – Hill, Boston, Burr Ridge, Dubuque, Madison, New York, San Francisco, St. Louis 1996; 3 – 15., 76 – 99., 155 – 186., 517 – 522.
3. Mićović P. Zdravstveni menadžment: Menadžment zdravstvenog sistema i zdravstvenih ustanova. Komo-ra zdravstvenih ustanova Srbije i Fakultet za menad-žment Zaječar. Beograd 2008; 286 – 289.
4. Heller R, Hindle T. Essential manager´s manual, Dor-ling Kindersley Limited. London 2008; 762 – 775.
5. Milošević M. Izrada mjernog instrumenta stresa na radnom mjestu bolničkih zdravstvenih djelatnika i procjena njegove uporabne vrijednosti. Doktorska disertacija obranjena na Medicinskom fakultetu Sve-učilišta u Zagrebu. Zagreb 2010.
6. Vizek-Vidović V. Model traumatskog stresa. U: Žužul M, Raboteg-Šarić Z. (Ur.): Ratni stres u djece. Mi-nistarstvo obrane Republike Hrvatske Zagreb 1992; 15-27.
7. Vizek-Vidović V. Some personality dimensions and job stress in blue collar workers. Studia Psychologica 1984; 26 (3): p. 187-192.
8. Golubić R. Domene kvalitete života kao prediktori radne sposobnosti bolničkih zdravstvenih djelatnika. Doktorska disertacija obranjena na Medicinskom fa-kultetu Sveučilišta u Zagrebu. Zagreb 2010.

Vers
ion fo
r revie
w
HealthMED - Volume 6 / Number 6 / 2012
Journal of Society for development in new net environment in B&H 2229
9. Pačnik T. Medicinska sestra in stres. Zdrav Ob-zor. 1992; 26, p. 15 – 20., Dostupno na: http://www.obzornikzdravstvenenege.si/Celoten_clanek.aspx?ID=b8ce055f-9423-45e6-8f4a-1bf5f6e49af3
10. Knežević B. i sur. Zdravstveni djelatnici u bolnicama i stres na radu: Istraživanje u Zagrebu. Izvorni znan-stveni rad. Sigurnost 2009; 51 (2): p. 85 – 92.
11. Riđanović Z, Nuhić M. Sistem žalbi u zdravstvenim ustanovama: Ključ za zaštitu u čijem je središtu pacijent, ključ za bolje upravljanje rizikom. AKAZ - Agencija za kvalitet i akreditaciju u zdravstvu u FBIH, Dostupno na: http://www.akaz.ba/Fokus/Za-lbe/Dokumenti/sistemi_zalbi_zr_mn.pdf
12. Rađo I, Wolf B. Kvantitativne metode u sportu: Tak-sonomska i diskriminativna analiza. Sarajevo 2002.
13. Vrančić I. Zdravstvena psihologija i posao. U: Ha-velka M. (Ur.): Zdravstvena psihologija. Naklada Slap. Jastrebarsko 1998; 237 – 242.
Corresponding Author Vedran Djido, Faculty of Health Studies, University of Sarajevo, Bosnia and Herzegovina, E-mail: [email protected]

Vers
ion fo
r revie
w
2230
HealthMED - Volume 6 / Number 6 / 2012
Journal of Society for development in new net environment in B&H
Abstract
SY level is amputation in level of ankle joint.Ch level is ampuatation of front and middle part
of foot with preserved calcaneus and talus. Treatmen of both type of patients demands pedantic ortophe-dic – technical treatment. Differencies in stump's is that SY level stump is stabile and 100% can be loaded, a stump after CH level is instabile. Within amputations during peace, where the talus and cal-caneus are fully preserved, stump is instabile, heel is moving cranial, talus plunge forward and often became a part of support. It all happens beacuse of the overbalance of Achilles tendon, it is all happe-ning beacuse the flexors of fornt and midlle part of foot are missing. Support is mainly on outer edge of the foot. Recomended procedures with tendon transplantation are trying to make balance between inner and outer edge of the foot, they are trying to make horisontal balance in foot during the support.
Stump load after the CH amputation is less than 50%, proff Baum- Gartner recomends Achille ten-don elongation and primary arthrodesis for impro-vement of balance and stability in stump during the support. During the war time situation is even more changned in negative way. Beside that for SY level of amputation all the characteristic stay the same, at CH ampuattion it is often that just parts (usually ½ or less) of talus and calcaneus are reamaning. Stump like that is often more instabile than the CH stump during the war conditions, Muminagić recomends primary arthrodesis and elongation of Achilles ten-don (Baum-Gartner procedure), primarni postponed suture (4-7 day), or secundary after 6 or more weeks after the infection is gone. ¨War¨ CH stump is more insuficient in teh manner of capacity and load. There is a dillema what ot decide in war time conditions and to preffer SY level of amputations. Our results have shown reamputation and sy level amputation are needed at most patients (beacuse of torpid ulce-ration at skin od instabile and deformated stump).
We have followed patients with Chopart am-putation during 1992 – 1995 and during 15 years. Our experience show's that Chopart have advanta-ge, but it is necessery to perform Baum – Gartner procedure during the first 6 weeks.
Key words: war amputation – Chopart – Syme – Dilemmas
Introduction
Syme amputation first time is performed 1854. By Baumgartner (1), it was performed by James Syme (1), profesor of Surgery in Edinburgh. Patient was a boy with a diagnosis of torpid osteomyelitis of tarsal bones. This amputation is indicatet at patients with unstatisfied results after the CH amputation or Pirogof/Spitzy, the at diabetic phlegmona's and with the patients who lost circulation in their foot.
Modern operative tehnique, unlike the clasical Syme amputation reserves cartilage of tibia's joint surface and as result there is a rounded stump, ca-pable for 100% load, shorthening extremity (7 cm) (1). There have been noted a tries of tibia elongation with modern distractors (Ao, Ilizarov, etc...). Syme amputation can be made in two steps by Wagner (1).
- Egzarticulation of upper ankle, - 6-8 weeks after the wound have healed,
maleolus resection is following.
Ch amputation
Level of amputation in line between talus and calcanus proximal in relation to distal, os cubo-ideum and os naviculare. Stump Inclined toward deformity, Achilles tendon pull heel, stump supi-nation is stronger and as a result disabilites toward support and protetic – technical amputation.
Many authors have critics to this procedures (Kirbi and others 1981., Stöcker 1895). Beacues of the stump supination and foot equinose they sugge-sted amputation on higher level – SY amputation.
SY level of amputation/versus CH chopart gel dilemmasSahib Muminagic1, Faruk Hodzic2, Oruc M.1
1 Faculty of Health University of Zenica, Bosnia nad Herzegovina,2 Cantonal Hospital Zenica, Bosnia nad Herzegovina.

Vers
ion fo
r revie
w
HealthMED - Volume 6 / Number 6 / 2012
Journal of Society for development in new net environment in B&H 2231
Beacues of tendention to equinus deformation Wagner considered that Chopart amputation sho-uld be avoid. (1) Other authors as Burgeos (2), Ba-umgartner (1) considered that stump should be un-der the control and they make some suggestion’s:
- Achille tendon elongation - Transfer of m. tibialis anteriot tendon. - Subtalar fusion - Calcaneo – tibial arthrodesis vith verticali-
sation of calcaneus.
Figure 1. Syme amputation of the left shank
Figure 2. Chopart amputation: correct axis, a slight of the heel backwards
Pinzur 1986. (1) is recommending profilactic primmary cutting of Achilles tendon.
Parziale and Haftan (1988) and Christie and ot-hers (1980) (1) recommended primary tenodesis of m. tibialis antertior during the amputation so the horisontal position of stump can be achieved and stronger supination can be avodided. All this critics of CH amputations level are advicing amputation on higher level. In favor of supporters of CH am-putation level, show the following attributes: (if the deformity is avoided and stump balance):
- Stump is capable to make support without prothesis
- Ekstremity does not lose on lenght - Ankle is preserved - Cosmetic effect - Very big psyhcological plus effect.
Figure 3. Excellent position of the stump at wie-ght loading after Chopart amputation

Vers
ion fo
r revie
w
2232
HealthMED - Volume 6 / Number 6 / 2012
Journal of Society for development in new net environment in B&H
Results
During the period 1992 – 1995 we have made 7 Syme amputation and 45 Chopart amputation. During the first years of War beacuse of mine inju-ries we made more 4 Chopart amputation. We have followed patients and stump behavior. Beacuse of stump instability we have made 5 more reamputti-ons. We have made it on higher level, Chopar level we have moved to Sy level (table 1.) During con-troled period we have made 19 correction (table 2.).
Figure 4. Chopart amuptation: there is no shift of the back foot axis
Table 1. ReamputationsReamputation Number of patients
Level of amputation – ChopartNew level's – Sy amputation 5
Table 2. CorrectionsNumber of corrections Number of patients
Elongation and Achilles tendon prolongation 12
Tibio – talus – calcaneus arthrodesis 7
Discussion
Number of reampuation at 49 patients, Cho-part amputation is translated in Syme amputati-on at 5 patients (10.2%). Number of corrections is 19 (38%). 4 patients have instabile stump and support was on outer and front surface of stump. They have refused indicated operative tretmanet and correction. We can make conclusion that 28 patients have unfarovable stump, results were not good at 57% of patients. Best results we have ac-hieved in cases where we have applied primary postopondes arthrodesis with Achilles tendon elongation (3). It is Baumgartner procedure from peace time conditions (1). We are publishing first experiences in war surgery. Very good stump can be made if we apply this method in second week after the primary amputation, or after the infection has gone. (3,4). Good result is aschieved if it is po-ssible to make it 6 weeks postoperative. Otherwi-se beacuse of inflammatory adhesions very strong and hard to solve contractures can occur.
Conclusion
Considering our results we are giving advan-tare to amputation on Chopart level. We are ad-vicing to perform Baumgartner operative proce-dure during the 6 weeks from injurie and primary amputation. Great advantage is also in that after the Chopart amputation there is no shortening of ekstremity unlike the Syme amputation where we have result of shortening for 7 cm.

Vers
ion fo
r revie
w
HealthMED - Volume 6 / Number 6 / 2012
Journal of Society for development in new net environment in B&H 2233
References
1. Baumgartner, R., Botta, P.: Amputation und Protae-sen – Versor gurug der unteren Extremitat Ferdinand Enke Stuttgart 1995.
2. Burges, E. M., Matsen, E. A.,:Current concept rewe determing amputation level in vascular disease. J. Boint. Jt. Surg. 63(A) 1981 (1493 – 1497)
3. Muminagić, S.:War amputation, Jože Moškrić
4. Muminagić, S.: Ch versus Sy level of amputations War surgery, Efort Lisabon 2005, abstract book.
5. Burgess, E., Romano, R., Zettle, J.H.: The Managment lower – Extremity Amputations. Surgery immediate postsurgical prostheting fitting patient care. Prosthe-tic reh. Study Seattle/Washington 1969.
6. Muminagić, S.: Solvage of lima war surgery Sicot. San diego 2002, abstract book.
Corresponding Author Sahib Muminagic, Facutly of Heatlh, University of Zenica, Bosna i Hercegovina, E-mail: [email protected]

Vers
ion fo
r revie
w
2234
HealthMED - Volume 6 / Number 6 / 2012
Journal of Society for development in new net environment in B&H
Abstract
The dominant artery is one that gives posterior descending artery and supply the inferior portion of the interventricular groove. The dominance can be: right, left and balanced (co-dominant) circula-tion with several subtypes. The aim of this study was to determinate the dominance patterns of the heart circulation on the angiograms and their re-presence on sex and age and to determinate their correlation with clinical consequences.
The study included 70 patients with ischemic heart disease (males 50, females 20, age between 33-78 years) who underwent coronary angiography in Heart Centre of the Clinical Center University of Sarajevo in period of 01.04.2011. to 01.04.2012., either for the symptoms of chest pain, angina pecto-ris etc. The angiograms were analyzed to determi-nate the dominance patterns of the heart circulation.
Angiograms of 70 patients showed the right dominant type in 50 (71,42%) cases, the left do-minant in 7 (10%) cases and the balanced circu-lation in 13 (18,57%) cases. The most common type of coronary circulation is the right dominant by both sex. Males were majority in this study.. Majority of the patients were in their 5th and 6th decades of life. There is no significant difference in dominance pattern with age or sex. Correlation with clinical consequences was observed through the myocardial infarction and the type of coronary circulation. Myocardial infarction was determina-ted in patients with left dominant circulation most frequently than in right and balanced circulation.
The right dominant circulation is most common by bouth sex. Myocardial infarction is most com-mon by males and by the left dominant circulati-on, where clinical consequences were worse and that explains the large area that is vascularisation by left coronary artery and the occlusion occurs most common on the left descending artery.
Key words: coronary dominance, coronary circulation, coronary angiography
Introduction
The heart is normally supplied by two coro-nary arteries: right coronary artery (RCA) and left coronary artery (LCA). Coronary arteries are known for their wide variations with regard to origin, course, termination and branching pattern.(1) There are many types of classification of coro-nary circulation. The first type was introduced by Banchi in 1904.The dominance can be: right, left and balanced (co-dominant) circulation with se-veral subtypes. Whichever artery crosses the crux of the heart and gives off the posterior descending branches is considered to be the dominant coro-nary artery.(2)
In 63% of individuals, the RCA crosses the po-sterior interventricular groove and gives rise to the posterior descending branches (right dominance); in 10-15% the LCx artery crosses the interventricu-lar groove and gives rise to branches to the poste-rior right ventricular surface (left dominance); and in the remaining 24%, the inferior interventricular septum is perfused by branches from both the dis-tal RCA and the distal LCx artery (codominance).(3) Approximately 70% of the general popularition are right dominant, 20% are co-dominant, and 10% left dominant(1,2,3,7). Some angiographic studies of the dominance pattern of coronary artery(4,5,6, 10) shows in approximately 85% cases right coronary predominance. The right coronary dominant and co-dominant pattern coronary arteries are more prevalent in these studies. Age and sex have no sig-nificant association with coronary dominance. Left dominance seems to be associated with higher mor-tality due to acute infarction and a higher incidence of arteriosclerosis.(3,8,9)
Angiographic evaluation of the dominance patterns of coronary circulationAida Hasanovic1, Belma Ascic-Buturovic2
1 Department of Anatomy, Faculty of Medicine, University of Sarajevo, Bosnia and Herzegovina,2 Clinic of Endocrinology, Diabetes and Metabolic diseases, Clinical Center University of Sarajevo, Bosnia and Herzegovina.

Vers
ion fo
r revie
w
HealthMED - Volume 6 / Number 6 / 2012
Journal of Society for development in new net environment in B&H 2235
Coronary angiography allows detailed assess-ment of the arterial supply of the heart, and domi-nant patterns of heart circulation. The study of the coronary dominace would help both cardiac sur-geons and radiologists in dealing better with the coronary heart disease. (11,12)
The aim of this study was to determinate the dominance patterns of the heart circulation on the angiograms and their represence on sex and age and to determinate their correlation with clinical consequences.
Patients and methods
The study included 70 patients with ischemic heart disease (males 50, females 20, age between 33-78 years) who underwent coronary angiograp-hy in Heart Centre of the Clinical Center Uni-versity of Sarajevo in period of 01.04.2011. to 01.04.2012., either for the symptoms of chest pain, angina pectoris etc. The angiograms were analyzed to determinate the dominance patterns of the heart circulation. Some of these patients had diabetes mellitus.
Statistical analysisThe statistical analysis of the results was per-
formed using Kolmogorow-Smirnow test. Using Kolmogorow-Smirnow test, the differences in the typy of arterial vascularisation established by co-ronary angiography were considered significant on the level p<0,05.
Results
Coronary angiographic analysis showed in 50 of 70 patients (71,42%) right coronary dominance, left dominance was found in 7 (10%) cases while balanced pattern was observed in 13 (18,57%) ca-ses (Table 1, Figure 1,2,3). Kolmogorov-Smirnov test shows that the most common type of coronary circulation is the right dominant by both sex.
Figure 1. Coronary angiography in the left an-terior oblique projection (LAO) showed the right type of coronary circulation
Figure 2. Coronary angiography in the left ante-rior oblique projection (LAO) showed the balan-ced type of coronary circulation (1. r. interventri-cularis anterior, 2. r. circumflexus, 3. a. coronaria dextra)
Table 1. Dominance patterns of coronary circulation Dominance patterns
Right dominance Left dominance Balanced Total (%)50 (71,42%) 7 (10%) 13 (18,57%) 70 (100%)

Vers
ion fo
r revie
w
2236
HealthMED - Volume 6 / Number 6 / 2012
Journal of Society for development in new net environment in B&H
Figure 3. Coronary angiography in the left an-terior oblique projection (LAO) showed the left type of coronary circulation (1. r. interventricula-ris anterior, 2. r. circumflexus).
Out of a total of 70 patients with coronary artery disease which underwent coronary angiography in Heart Centre of the Clinical Center University of Sarajevo, 50 were males while 20 were females. Majority of the patients were in their 5th and 6th decades of life. The age range was 33-78 years. The pattern of the coronary artery dominance with sex has been depicted in Table 2.Table 2. Distribution of coronary dominance with sex (n=70)
Kolmogorov-Smirnov test shows no correlations between sex and the type of coronary circulation.
Correlation with clinical consequences was observed through the myocardial infarction and the type of coronary circulation. Clinical consequences of coronary occlusion in our study were most seri-ous in patients with left dominant circulation than in patients with right and balanced circulation.
The result of occlusion of coronary artery de-pendent on the type of arterial vascularization.
Myocardial infarction is most common by males and by the left dominant circulation, where clinical consequences were worse and that ex-
plains the large area that is vascularisation by left coronary artery and the occlusion occurs most common on the left descending artery.
Discussion
Because of the importance of the anatomy in the planning of coronary disease surgeries, the do-minance of the circulation is a common theme for discussion in the literature. (1-11)
The current angiographic study indicates the frequency of coronary dominance in 70 patients with coronary artery disease. In our study, 71,42% of cases had right coronary dominance, 10% had left coronary dominance and 18,57% had co-do-minant coronary circulation. There is no signifi-cant difference in dominance pattern with age or sex. The results of the study were compared with other authors and variation were noted.
This relationship between the type of arterial vascularisation found Hadžiselimović (3)and Raj-ković et al.(7) Similar to our study Rajković et al. on angiograms of 27 patients established the right coronary dominance in 74% cases, in 14,8% left coronary dominance and balanced type in 11, 2%.
The coronary arteries were examined by gross dissection in the study of coronary dominance by Das et al (1).Right dominance was found in 70%, left dominace was found in 18, 57%, while balan-ced pattern was observed in 11,43% hearts.
Fazlul et al.(2) in angiographic study descri-bed in 60.50% cases right coronary dominance, 19.50% had left coronary dominance and 20% co-dominant coronary circulation. There is no signi-ficant difference in dominance pattern with age or sex. Authors concluded that the right coronary do-minant and co-dominant pattern coronary arteries are more prevalent in the population of Assam.
Higgins et al (4) the dominance of the coronary arterial system was determined angiographically in 75 adult patients with isolated aortic stenosis with or without insufficiency, 25 adult patients with pure aortic insufficiency, 51 adult patients with combined aortic stenosis and mitral valve dis-ease, and 44 children with bicuspid aortic valves.There was an unusually high incidence of left dominance in adults with isolated aortic stenosis (36%) and in children with bicuspid aortic valves (56.8%). These findings suggest the existence of

Vers
ion fo
r revie
w
HealthMED - Volume 6 / Number 6 / 2012
Journal of Society for development in new net environment in B&H 2237
a variant developmental complex consisting of a bicuspid aortic valve and reversal of dominance of the coronary arterial system.
Shan K (5)in the study of coronary predominance in 100 human hearts shows in 82% cases right coro-nary predominance and in 17% cases left coronary predominance. Similar results showed a posmor-tem morphological study by Hussain et al.(6)FaFFF
Ozturk et al.(11) angiographically determined the different vascularization patterns of the posterior in-terventricular sulcus with coronary CT angiography. Authors observed that the circulation was right do-minant in 310 (87.1%) of the 356 cases, the left do-minant in 34 (9.5%), and balanced in 12 (3.4%) ca-ses. Loukas et al. (12) in their study provide more de-finitive information on the vessels with myocardial bridges and the relationship between the presence of bridges and coronary dominance. Authors concludes that the presence of bridges appeared to be related to coronary dominance, especially in the left coronary circulation.In this study forty-six (66.6%) of the he-arts with bridges were left dominant, seventeen he-arts (24.6%) were right dominant and the remaining six hearts were co-dominant. The possible clinical implications of myocardial bridging may vary from protection against atherosclerosis to systolic vessel compression and resultant myocardial ischaemia.
Our results showed that the dominance pattern of hearts has important clinical significance. Left dominance was found to have significantly higher mortality than right dominance and mixed types. Dominance also showed a role in left anterior des-cending (LAD) artery stenosis. It was observed that in left dominance, the LAD usually wraps around the apex of the heart, supplying major portion of myocardium. In contrast, in right domimance, it was the posterior ineterventricular branch of the right coronary artery that supplied most of the myocardium. As such, lesions in LAD would have more profound clinical importance in a left domi-nant heart than in a right dominant one.(1,8,9,11,12)
Dominance also plays an important role in infe-rior infarcts of the heart. The dominant RCA usu-ally supplies the atrioventricular (AV) node. There-fore an inferior wall infarct caused by occlusion of the RCA will have higher risk of AV block.
Present study reported higher percentages of ri-ght dominance (71,42% of cases) and no significant difference in dominance pattern with age or sex.
Clinical consequences of coronary occlusion in our study were most serious in patients with left dominant circulation than in patients with right and balanced circulation.
The results of the study prove regional variati-ons in dominance pattern which should always be borne in mind for better cardiac care.
Conclusions
● The most common type of coronary circulation is the right dominant by both sex. The right dominant type was observed in 50 (71,42%) patients, the left dominant in 7 (10%) cases, and the balanced circulation in 13 (18,57%).
● There is no significant difference in dominance pattern with age or sex. Out of a total of 50 males with coronary artery disease the right dominance were found in 38 (76%) cases, the left dominance in 4 (8%) cases, while balanced were established in 8 (16%) cases. Out of total of 20 females right dominance were established in 12 (22%) cases, left dominance in 3 (6%) cases, and balanced in 5 (10%) cases.
● Myocardial infarction is most common by males and by the left dominant circulation, where clinical consequences were worse and that explains the large area that is vascularisation by left coronary artery and the occlusion occurs most common on the left descending artery.
References
1. Das H, Das G, Das D C, Talukdar K. A study of coro-nary dominance in the population of Assam. J. Anat. Soc.India 2010; 59(2):187-9.
2. Fazlul A. M, Shahid NM, Muhammad I et al. Coro-nary artery dominance: what pattern exists in Pakista-ni population? Ann Pak Inst Med Sci.2011;7(1):3-5.
3. Hadžiselimović H. Krvni sudovi srca, Jugoslovenska medicinska naklada, Zagreb, 1981.
4. Higgins CB, Wexler L. Reversal of dominance of the coronary arterial system in isolated aortic stenosis and bicuspid aortic valve. Circulation. 1975; 52: 292-296.

Vers
ion fo
r revie
w
2238
HealthMED - Volume 6 / Number 6 / 2012
Journal of Society for development in new net environment in B&H
5. Shah K. Study of coronary predominance in 100 hu-man hearts. Gujarat Medical Journal 2011; 66 (2): 38-40.
6. Hussain MA, Nahar A, Ara S. The dominance pattern of coronary artery of adult Bangladeshi people- A postmortem morphological study.CVJ. 2008; 1(1): 21-25.
7. Rajković S, Mujdragić M, Malobabić S, Tasić N. Od-nos šeme arterijske vaskularizacije srca i prekobroj-nih koronarnih arterija. Medicinski pomladak 2005; 56 (1) :5-11.
8. Hasanović A. Doprinos istraživanju varijacija srča-nih arterija čovjeka disekcijom i metodom koronarne angiografije. Veterinaria 2000; 49: 389-97.
9. Hasanović A, Junuzović A, Spužić M, Kudumović. Angiographic evaluation of myocardial bridges in re-lation to myocardial ischemia. HealthMED 2010; 4 (2):398-403.
10. Koşar P, Ergun E, Öztürk C, Koşar U. Anatomic variations and anomalies of the coronary arteries: 64-slice CT angiographic appearance. Diagn Interv Radiol 2009; 15 (4):275–283
11. Ozturk E, Duran C, Sonmez G, Sildiroglu HO, Ve-lioglu M, Bozlar U et al. Arterial supply of the po-sterior interventricular sulcus: a CT coronary angi-ographic study. Surg Radiol Anat.2011; 33:27–34.
12. Loukas M, Curry B, Bowers M, Robert G, Louis Jr, Bartczak A et al. The relationship of myocardial bridges to coronary artery dominance in the adult human heart. J. Anat. 2006; 209: 43–50.
Corresponding Author Aida Hasanovic, Faculty of Medicine, University of Sarajevo, Bosnia and Herzegovina, E-mail: [email protected]
Vers
ion fo
r revie
w
HealthMED - Volume 6 / Number 6 / 2012
Journal of Society for development in new net environment in B&H 2239
Abstract
Introduction: The one of the most serious adverse effects of antipsychotic drug treatment is hyperprolactinemia, which is mediated by the dopamine-blocking action. In psychiatric practi-ce this problem is often ignored. The findings of the conducted studies suggest that hyperprolacti-nemia is a potentional risk factor for pulmonary tromboembolism (PTE) in patients treated with antipsychotic drugs and that the thrombogenic ef-fect is presented through enhanced platelet reacti-vity. Clinicians and patients need the information about risks and benefits of these drugs before they start antipsychotic drug treatment.
Aims: The aim of this study was to describe so-cio-demographic and clinical characteristics of PTE cases which were treated with antipsychotic drugs.
Material and methods: The retrospective study was conducted in the period from October 2010 to November 2011 at the Department of Psychiatry of Clinical Center University of Sarajevo and as a source of data we used medical records. The study included seven schizophrenic patients treated with antipsychotic drugs and who were diagnosed as cli-nically relevant PTE cases. We analyzed socio-de-mographic and clinical characteristics.
Results: Out of seven patients, six were fema-les. The median of age for females was 55.5 years (IQR=52.5 to 61.5) and one male was 31 years. The specific incidence rate was 15.3 cases/1 000 schizophrenic patients hospitalized during a speci-fied period of time (31.5/1 000 for females, 3.7/1 000 for males). The median of length of treatment with antipsychotic drugs was 14 years (IQR=10 to 23). The median of length of hospitalization was 37.0 days (IQR=7.0 to 47.0). Chlorpromazine or other phenothiazines had been prescribed in three patients, haloperidol in four patients and atypical
antipsychotic drugs such as: olanzapine, clozapi-ne and risperidone in six patients. The one pati-ent had taken more than two antipsychotic drugs. Hyperprolactinemia was found in five females (Me=1072.0 mIU/L; IQR= 814.5 do 3537.0) and one male had the prolactine level of 1208.0 mIU/L.
Conclusion: The female schizophrenic patients have higher specific incidence rate of PTE. Clinici-ans must be very careful about antipsychotic drug treatment and should evaluate level of prolactine because vascular risk factors may interact with an-tipsychotics in terms of increasing the risk of PTE.
Key words: Hyperprolactinemia, Pulmonary Thromboembolism (PTE), Typical and Atypical Antipsychotic Drugs
Introduction
While extremely serious, a venous and pulmo-nary thromboembolism are rare conditions, but life threatening illnesses. In a large primary care population there was an association between the use of antipsychotic drugs and a risk of venous (VTE) and pulmonary thromboembolism (PTE). An annual incidence is more than 1/1 000 per-sons and a mortality rate is above 15% in the first three months after the diagnosis (1). In psychia-tric practice this problem is often ignored. The risk factors for development of deep venous throm-bosis (DVT) and PTE during medical hospitali-zation include: congenital factors (i.e. hereditary thromboembolia like Factor V Leiden, prothrom-bin deficiency) and acquired factors (advanced age, obesity, former DVT or PTE, surgery, trau-ma, neoplasms, heart, kidney and bowel disease, estrogen hormone therapy, immobilisation). The association between conventional antipsychoti-cs with PTE and DVT was investigated in eight observational studies. Two studies suggest a posi-
Is Hyperprolactinemia a risk factor for Pulmonary Thromboembolism (PTE) in patients treated with Antipsychotic Drugs?Saida Fisekovic1, Damir Celik2
1 Department of Psychiatry of Clinical Center University of Sarajevo, Bosnia and Herzegovina,2 Clinic for Physical medicine and rehabilitation, Clinical Center University of Sarajevo, Bosnia and Herzegovina.

Vers
ion fo
r revie
w
2240
HealthMED - Volume 6 / Number 6 / 2012
Journal of Society for development in new net environment in B&H
tive association between conventional antipsycho-tics and PTE. These studies were conducted over a small number of patients (2,3). The other large stuides support the association between antipsyc-hotic drugs with PTE and DVT due to conventio-nal antipsychotics (4,5,6,7,8). A strong association showed especially high potency of antipsychotics such as haloperidol (6,7). It is possible that indivi-dual vascular risk factors may interact with antip-sychotics on increasing the risk of DVT and PTE. There is a need to understand such mechanism in order to identify those patients who may be at the highest risk to developt tromboembolism (9). Clozapine, an atypical antipsychotic used against positive and negative symptoms of schizophrenia has been associated with PTE. The mechanism by which clozapine can induce thromboembolism is unclear. The increased risk was strongly marked among new users and those who were prescribed atypical antipsychotic drugs (Seroquel, Abilify, Solian, Lonasen and Risperidal). The older antip-sychotic drugs include Thioridazine, Prolixin and Haldol (9). The highest risk, nearly fourfold, was associated with quetiapine (Seroquel). Risperidon is an atypical antipsychotic drug used to treat a number of psychiatric diseases, such as schizop-hrenia, schizoaffective disorder, bipolar disorders and irritability in children with autism. A possible association between risperidone with PTE and DVT has been described (10). In the past decade the single most common cause of the withdrowal or restriction of the use of drugs that have alre-ady been marketed has been the prolongation of the QT interval associated with polymorphic ven-tricular tachycardia, or torsade de pointes which can be fatal. Drug–induced sedation, obesity and antiphospholipid antibodies are leading to incre-ased activity in the coagulation system. An asso-ciation of thromboembolic complications with conventional agents, including chlorpromazine, was suggested more than 20 years ago. Zornberg and Jick have also reported that low-potency of antipsychotic drugs, such as chlorpromazine and thioridazine, are strongly associated with VTE than the high-potency antipsychotic drugs, such as haloperidol. Recently, thromboembolic complica-tions have been reported with clozapine, an atypi-cal antipsychotic drug (6,7,11,13).
Materials and methods
The retrospective study was conducted in the period from October 2010 to November 2011 at the Department of Psychiatry of Clinical Center University of Sarajevo and as a source of data we used medical records. The study included seven sc-hizophrenic patient treated with antipsychotic dru-gs and diagnosed as clinically relevant PTE cases. We analyzed socio-demographic and clinical cha-racteristics. We calculated the specific incidence rate according to the formulas: the number of new PTE cases that occurred during a specified period of time/the total number of schizophrenic patients treated with antipsychotic drugs and hospitalized during that period of time x 1 000. The results are expressed as median and interquartile range (IQR). In the case of categorical variables, counts and per-centages were reported. Statistical analysis was per-formed by using the Statistical Package for the So-cial Sciences (SPSS Release 19.0; SPSS Inc., Chi-cago, Illinois, United States of America) software.
Results
Out of seven patients, six were females. The me-dian of age for females was 55.5 years (IQR=52.5 to 61.5) and one male was 31 years. The specific in-cidence rate was 15.3 cases/1 000 schizophrenic pa-tients hospitalized during a specified period of time (31.5/1 000 for females, 3.7/1 000 for males). The median of length of treatment with antipsychotic drugs was 14 years (IQR=10 to 23). The median of length of hospitalization was 37.0 days (IQR=7.0 to 47.0). Chlorpromazine or other phenothiazines had been prescribed in three cases, haloperidol in four, and atypical antipsychotic drugs such as olanzapi-ne, clozapine and risperidone in six patients. The one patient had taken more than two antipsychotic drugs (Table 1). The paranoid schizophrenia was diagnosed in five patients, catatonic schizophrenia and nondifferentiated schizophrenia in two cases, respectively. At the beginning of hospitalization patients were afebrile, normotensive, without para-doxal pulse. They were oriented in the time, place and to other persons. The Complete blood count (CBC) and chemistry panel were normal. Two days after hospitalization, in two cases, D-dimer was elevated at 7.2 mg/L (normal range up to 0.5); the

Vers
ion fo
r revie
w
HealthMED - Volume 6 / Number 6 / 2012
Journal of Society for development in new net environment in B&H 2241
other cases had elevated D-dimer after several days. Negative Chest X-ray was determinated in all ca-ses. The Spiral Computed Tomogram (spiral CT) of chest showed massive bilateral thromboembolism in four patients and thromboembolism of terminal part of the left pulmonary artery, segmental branch of the left pulmonary artery and right lower pulmo-nary vein, in three patients, respectively (Table 3).
Comorbidity was determinated, four patients had dyslipidemia and two patients had diabetes mellitus. Doppler ultrasound of the lower extremi-ties was negative for DVT (Table 4).
Table 4. Characteristics of PTE cases associated with Antipsychotic Drugs (n=7)
Case no. Dyslipidemia Diabetes
mellitusSite of PTE DVT
1. (-) (-) B (-)2. (+) (+) B (-)3. (+) (-) B (-)4. (+) (-) L (-)5. (+) (+) B (-)6. (-) (-) L (-)7. (-) (-) R (-)
DVT deep venous thrombosis; B billateral; R right; L left; (-) negative; (+) positive
Table 1. Psychiatric profile of PTE cases associated with Antipsychotic Drugs (n=7)Case no.
Age (years) Gender Diagnosis DNT
(years)LOH(days)
APD (daily doses-mg)Phenothiazines SDA Butyrophenones
1. 31 M PS 3 37 CH (300) OL (10) HPD (15)2. 58 F PS 13 32 TH (75) HPD (15)
3. 51 F NS 10 37 CL (300) RI (4)
4. 53 F KS 22 6 PH (5) CL (300)5. 53 F PS 23 47 CL (300) HPD (15)6. 63 F PS 28 82 CL (300) HPD (50)7. 61 F PS 14 7 CL (200)
M male; F female; DNT duration of neuroleptic treatment; LOH length of hospitalization; APD antipsychotic drugs; SDA se-rotonine-dopamine antagonist; PS, paranoid schizophrenia; NS, nondifferentiated schizophrenia; KS, catatonic schizophrenia; CH chlorpromazine; TH thioridazine; PH phluphenazine; OL olanzapine; CL clozapine; RI risperidone; HPD haloperidole;
Table 2. Specific and non-specific indicators of inflammation and measures of the pathway of coagulationCase no. WBC (x 109/L) Fibrinogen (g/L) CRP (mg/L) INR (sec.) APTT (sec.)
1. 18,2 3,2 32,0 1,22 103,52. 13,9 5,3 42,0 1,25 40,73. 16,7 6,4 58,0 1,13 25,54. 11,8 6,1 20,0 3,38 105,55. 8,7 3,6 56,0 1,76 36,96. 23,0 4,1 130,3 6,02 76,17. 17,2 6,5 24,6 1,12 24,5
WBC White Blood Cell; INR International Normalized Ratio; APTT Activated Partial Thromboplastin Time, CRP C-reac-tive protein
Table 3. Results of diagnostic proceduresCase no.
Frequency(heart rate)
SBP(mmHg)
DBP(mmHg) T-waves D-dimer
(mg/L)Chest X-ray spiral CT
1. 115 140 90 38,2 56,0 (-) (+)2. 100 130 50 38,0 2,8 (-) (+)3. 100 140 90 39,2 12,5 (-) (+)4. 75 100 60 37,5 4,0 (-) (+)5. 100 120 80 37,3 710,0 (-) (+)6. 120 170 100 38,2 8,3 (-) (+)7. 103 110 70 37,2 9,6 (-) (+)
SBP systolic blood pressure; DBP diastolic blood pressure; (-) negative; (+) positive;

Vers
ion fo
r revie
w
2242
HealthMED - Volume 6 / Number 6 / 2012
Journal of Society for development in new net environment in B&H
Table 5. Hormonal status of PTE casesCase no.
Thyroid hormonesProlactine
T3 T4 TSH1. 1,9 51 11,5 1208,02. 1,7 133 2,2 3914,03. 1,6 82 3,6 3160,04. 1,2 150 3,3 1072,05. 2,4 78 3,1 356,06. 0,7 95 0,2 716,07. 9,5 87 11,6 913,0
T3 triiodothironine; T4 thyroxin; TSH thyroid-stimulating hormone or thyreotropin
Hyperprolactinemia was found in five females (Me=1072.0 mIU/L; IQR= 814.5 do 3537.0) and one male had the prolactine level of 1208.0 mIU/L.
Discussion
The absolute individual risk of VTE for a su-bject taking antipsychotics is low (11). Immobi-lization is regarded as an important risk factor in persistant sitting position (12). In our study one female patient was immobilized for three days in bed. We were very careful because vascular risk factors may interact with antipsychotics in terms of increasing the risk of thromboembolism. The pa-tients in our study did not have a history of fevers or upper respiratory tract infection, pneumonia, coagulation disorders and long travel. One case had catatonia and one female had Neuroleptic ma-lignant syndrome. PTE was more often reported with the use of antipsychotic drug olanzapin than with other drugs. This is disproportional reporting, since the association that was obtained was based on incomplete clinical data. The results should be considered as pulmonary and interpreted cautio-usly (14). Clinical study of Parkins et al., 2003. showed the results for conventional antipsychotics that were consistent with previous studies of non fatal VTE and fatal PTE in 75 cases for period of eight years (7). The study of Hippisley-Cox et al., 2010. collected data on 25.532 people who deve-loped DVT or PTE between 1996 and 2007 (9). The study' authors found that people who took antipsychotic drugs for two years before develo-ping a DVT or PTE had 32% higher risk of de-veloping the conditions compared with those who were not taking these drugs. The most notorious
hormonal adverse effect of antipsychotic drugs is hyperprolactinemia, which is mediated by the do-pamine-blocking action of these agents. Wallasc-hofski et al. suggest that hyperprolactinemia is an important, new risk factor for PTE in patients on antipsychotic drugs and that the thrombogenic ef-fect is mediated through enhanced platelet reacti-vity (15). This adverse effect is also seen in male patients, but is highly marked in female patients (16). Our results showed the same, all patients had a high level od prolactine (males and fema-les). All patients showed sinus tachycardia at 105 to 120 beats per minute, with nonspecific T-wave changes, however, the patients were not in acute distress and did not complain of any chest pain or shortness of breath. Spiral CT scan demonstrated unilateral or billateral PTE. At magnetic resonan-ce imaging (MRI) of the brain masive thrombo-embolism was detected, in some cases unilateral and in some billateral.
Conclusions
The female schizophrenic patients have higher specific incidence rate of PTE. Clinicians must be very careful about antipsychotic drug treatment and evaluate levels of prolactine because vascu-lar risk factors may interact with antipsychotics in terms of increasing the risk of PTE.
ProphylaxisScreening of patients for additional risk fac-
tors of PTE seems advisible to identify those pa-tient that would benefit from prophylaxis. Some authors suggest anticoagulant therapy during im-mobility due to neuroleptic malignant syndrome for such patients. Further technical investigations such as ventilator-perfusion scan or spiral CT of the chest in diagnosis of PTE is neccessary.
References
1. Goldhaber SZ, Visani L, De Rosa M. Acute pulmonary embolism: clinical outcomes in the International Co-operative Pulmonary Embolism Registry (ICOPER). Lancet 1999 Apr24; 353(9162): 1386-1389.
2. Kamijo Y, Soma K, Nagai T. Acute massive pulmonary thromboembolism associated with risperidone and conventional phenothiazines. Circ J 2003; 67: 46-48.

Vers
ion fo
r revie
w
HealthMED - Volume 6 / Number 6 / 2012
Journal of Society for development in new net environment in B&H 2243
3. Thomassen R, Vandenbroucke JP, Rosendaal FR. An-tipsychotic medication and venous thrombosis. Br J Psychiatry 2001; 179: 63-66.
4. Hamanaka S, Kamijo Y, Nagai T. Massive pulmonary thromboembolism demonstrated at necropsy in Ja-panese psychiatric patients treated with neuroleptics including atypical antipsychotics. Circ J 2004; 68: 850-852.
5. Ray JG, Mamdani MM, Yeo EL. Antipsychotic and antidepressant drug use in the elderly and the risk of venous thromboembolism. Thromb Haemost 2002 Aug; 88(2): 205-209.
6. Zornberg G, Jick H. Antipsychotic drug use and risk of first-time idiopathic venous thromboembolism: a case-control study. Lancet 2000; 356: 1219-1212.
7. Parkin L, Skegg DC, Herbison GP, Paul C. Psycho-tropic drugs and fatal pulmonary embolism. Pharma-coepidemiol Drug Saf 2003 Dec, 12(8):647-52.
8. Lacut K, Le Gal G, Couturaud F, Cornily G, Leroyer C, Mottier D, Oger E. Association between antipsyc-hotic drugs, antidepressant drugs and venous throm-boembolism: results from the EDITH case-control study. Fundam Clin Pharmacol 2007 Dec; 21(6): 643-650.
9. Hippisley-Cox J.Antipsychotic drugs and risk of veno-us thromboembolism:nested case- control study. BMJ 2010; 341 doi: 10,1136/bmj.c4245 (Published 21 Sep-tember 2010).
10. Gallerani M, Imberti D, Mari E, Marra A, Man-fredini R. Risperidone and pulmonary embolism: A Harmful Association? Case series and review of the literature. Lancet 2000; 1135-1155.
11. Liperoti R, Pedone C, Lapane KL. Venous thrombo-embolism among elderly patients treated with aty-pical and conventional antipsychotic agents. Arch Inter Med 2005; 165: 2677-2682.
12. Beasley R, Raymond N, Hill S. Thrombosis: the 21th century variant of venous thromboembolism associ-ated with immobility. Eur Respir J 2003;21:374-376.
13. Hagg S, Bate A, Stahl M, Spigset O. 2008,vol 31, N8,pp 685-694. Drug Safety ISSN 0114-5916.
14. Parkin L, Skegg DC, Herbison GP, Paul C. Psycho-tropic drugs and fatal pulmonary embolism. Phar-macoepidemiol Drug Saf 2003 Dec, 12(8):647-52.
15. Wallaschofski H, Eigenthaler M, Kiefer M, Donne M, Hentschel B, Gertz HJ. Hyperprolactinemia in patients on antypsychotic drugs causes ADP-stimu-lated platelet activation that might explain the incre-ased risk for venous thromboembolism: Pilot study J.Clin. Psychopharmacol. 2003;23:479-483.
16. Urban A, Masopust J, Maly R, et al. Prolactin as a factor for increased platelet aggregation. NeuroEn-docrinol Lett 2007;28:518-23.
Corresponding Author Saida Fisekovic, Department of Psychiatry of Clinical Center Univer-
sity of Sarajevo, Bosnia and Herzegovina, E-mail: [email protected]

Vers
ion fo
r revie
w
2244
HealthMED - Volume 6 / Number 6 / 2012
Journal of Society for development in new net environment in B&H
Every sent article gets its number, and author(s) will be notified if their paper is accepted and what is the num-ber of paper. Every corresponedence will use that num-ber. The paper has to be typed on a standard size paper (format A4), leaving left margins to be at least 3 cm. Ali materials, including tables and references, have to be typed double-spaced, so one page has no more than 2000 alphanumerical characters (30 lines). Sent paper needs to be in the form of triplicate, considering that original one enclosure of the material can be photocopied. Presenting paper depends on its content, but usually it consists of a page title, summary, text references, legends for pictures and pictures. Type your paper in MS Word and send if on a diskette or a CD-ROM.
Title page
Every article has to have a title page with a title of no more than 10 words: name (s), last and first of the aut-hor (s), name of the instituion the authors (s) belongs to, abstract with maximum of 45 letters (including space), footnote with acknowledgments, name of the first aut-hor or another person with whom correspondence will be maintained.
Abstract
Second page needs to contain paper abstract, 200 words at the most. abstract needs to hold all essential facts of the work-purpose of work, used methods (with specific data, if possible) and basic facts. Abstract must have review of underlined data, ideas and conclusions from text. Abstract has no quoted references. For key words, at the most, need to be placed below the text.
Central part of the article
Authentic papers contain these parts: introduction, goal, methods, results, discussion and conclusion. Intro-duction is brief and clear review of a problem. Methods are shown so that interested reader is able to repeat des-cribed research. Known methods don’ t need to be iden-tified, it is cited (referenced). Results need to be shown clearly and legically, and their significance proven by statistical analysis. In discussion, results are interpreted and compared to existing, previously published findings in the same field. Conclusions have to give an answer to author’s goal.
Instructions for the authorsAll papers need to be sent to e-mail: [email protected]
References
Quoting references must be in a scale in which they are really used. Quoting most recent literature is reco-mmended. Only published articels (or articles accepted for publishing) can be used as references. Not-published observations and personal notifications need to be in text in brackets. Showing references is as how they appear in text. References cited in tables or pictures are also numbered according to quoting order. Citing paper with six or less authors must have cited names of all authors; if seven or more authors’ wrote the paper, the name of the first three authors are cited with a note “et all”. If the author is unknown, at the beginning of papers reference, the article is named as “unknown”. Titles of the publications are abbreviated in accordance to Index Medicus, but if not listed in the index, whole title of the journal has to be written.
Footnote-comments, explanations, etc., cannot be used in the paper.
Statisticial analysis
Tests used for statistical analysis need to be shown in text and in tables or pictures containing statistical analysis.
Tables and pictures
Tables have to be numbered and shown by their or-der, so they can be understood without having to read the paper. Every column needs to have title, every me-asuring unit (SI) has to be clearly marked, preferably in footnotes below the table, in Arabian numbers or sym-bols. Pictures also have to be numbered as they appear in text. Drawings need to be enclosed on a white paper or tracing paper, while black and white photo have to be printed on a radiant paper. Legends next to pictures and photos have to be written on a separate A4 format paper. All illustrations (pictures, drawings, diagrams) have to be original and on their backs contain illustration num-ber, first author last name, abbreviated title of the pa-per and picture top. It is appreciated if author marks the place for table or picture. Preferable the pictures format is TIF, quality 300 DPI.
Use of abbreaviations
Use of abbreviations has to be reduced to minimum. Conventional units can be used without their definitions.