volume 6 issue 2 assaywise letters - biomol
TRANSCRIPT

AssayWise Letters
Calbryte™: Next Generation Calcium IndicatorScreen Quest™ ELISA cAMP Kits
Volume 6 • Issue 2
SIE HABEN DIE VISION,WIR HABEN DIE SUBSTANZ.

Table of Contents
Latest News and Events .............................................................................................................................................................................................................1
Update to Spectrum Viewer ............................................................................................................................................................................................1
New Tools Added to the Website ...................................................................................................................................................................................1
The Upcoming American Heart Association®: Scientific Sessions 2017 ...........................................................................................................1
Featured Product Spotlight ......................................................................................................................................................................................................2
Calbryte™ Series: The Future of Calcium Detection Is Bright ................................................................................................................................2
Novel Products and Tools ..........................................................................................................................................................................................................6
A Highly Sensitive Direct ELISA of cAMP Without Acetylation .............................................................................................................................6
Selecting The Right ROS Probe .................................................................................................................................................................................... 11
Technology Review...................................................................................................................................................................................................................16
Quantitative Comparison of iFluor™ 488- and FITC-Conjugated Antibodies For Use In Cell Labeling ................................................. 16
A Practical Guide For Use of PE and APC In Flow Cytometry.............................................................................................................................. 19
Alphabetical Index ....................................................................................................................................................................................................................25
Trademarks of AAT Bioquest
AAT Bioquest®
Amplite™
Ascobrite™
Buccutite™
Calbryte™
Cell Meter™
iFluor™
LysoBrite™
MitoROS™
Nuclear Blue™
OxiVision™
Quest Fluor™
ReadiView™
ROS Brite™
Screen Quest™
Thiolite™ Green
Trademarks of Other Companies
Alexa Fluor® (Thermo Fisher)
Amplex™ (Thermo Fisher)
Amplex® Red (Thermo Fisher)
cAMP-Glo™ (Promega)
HTRF® (CisBio)
LANCE® cAMP (PerkinElmer)
MitoSox™ (Thermo Fisher)
On the cover:
Fluorescence image of CPA cells co-stained with lysosome dye LysoBrite™ Red (Red, Cat#22658), Phalloidin-iFluor™ 488 Conjugate (Green, Cat#23115) to label actin filaments, and nuclei stain Nuclear Blue™ DCS1 (Blue, Cat#17548). The cells were fixed in 4% formaldehyde.
1Calbryte™ Series: The Future of Calcium Detection Is Bright
A Highly Sensitive Direct ELISA of cAMP Without Acetylation
Selecting The Right ROS Probe
Quantitative Comparison of iFluor™ 488- and FITC-Conjugated Antibodies
A Practical Guide For Use of PE and APC In Flow Cytometry
5
10
15
18

The Calbryte™ series is a family of fluorescent dyes developed
to monitor intracellular calcium. It includes three novel calcium
indictors: Calbryte™ 520, Calbryte™ 590 and Calbryte™ 630.
These indicators differ primarily in their excitation and emission
wavelengths and can be detected using standard fluorescence
instruments. The Calbryte™ series has been optimized for use with
fluorescence microscopes, fluorescence microplate readers and flow
cytometers. They can also be used in high-throughput screening
applications.
The Calbryte™ dyes have several key advantages over dyes like Fluo-
3 and Fluo-4. Calbryte™ dyes generate much brighter signals, show
significantly improved signal-to-background ratio and have greatly
enhanced cellular retention. These qualities make the Calbryte™
series a superior choice over older, more traditional calcium
indicators.
Can you tell me more about the Calbryte™ dyes?
Dyes in the Calbryte™ series are named roughly according to
their maximal emission wavelength. For example, Calbryte™
520 fluoresces in the green region of the visible spectrum while
Calbryte™ 590 and Calbryte™ 630 fluoresce in the red and deep-red
region, respectively. All three indicators can be acquired in either
AM ester form or salt form (as a potassium salt). The AM ester form
is a cell-permeable form that is useful for assaying calcium in live
cells. The salt form is primarily used for the calibration of calcium
indicators. This step is often required when calculating intracellular
calcium concentration from fluorescence signal intensity. Salt forms
of Calbryte™ can also be used for microinjection into live cells and
tissue.
How do the Calbryte™ dyes work in live cells?
When assaying calcium in live cells, the preferred method is to
synthesize Calbryte™ dyes with several acetoxymethyl ester (AM
ester) functional groups. The reason for doing so is two-fold.
First, AM esters are lipophilic groups that, when attached to the
Calbryte™ core structure, create an overall more hydrophobic
compound. This increased hydrophobicity allows the Calbryte™
AM ester to easily penetrate intact lipid membranes and permeate
into live cells. This eliminates the need for electroporation,
microinjections or other similarly disruptive loading techniques.
Second, Calbryte™ dyes, while in AM ester form, are essentially non-
Calbryte™ Series
Figure 1.1 ATP response was measured in CHO-K1 cells with Fluo-4, AM (left) and Calbryte™ 520 AM (right). CHO-K1 cells were seeded overnight at 50,000 cells/100 µL/well in a 96-well black wall/clear bottom costar plate. 100 µL of 10 µg/ml Calbryte™ 520 AM in HH Buffer with probenecid or 10 µg/ml Fluo-4, AM in HH Buffer with probenecid was added and incubated for 45 minutes at 37 °C. Dye loading solution was then removed and replaced with 200 µL HH Buffer/well. ATP (50 µL/well) was added to achieve the final indicated concentration of 10 µM and then imaged with microscope FITC channel (Keyence).
2 Unless otherwise specified, all products are for Research Use Only. Not for use in diagnostic or therapeutic procedures.AssayWise Letters • 2017, 6 (2)
www.aatbio.com • [email protected] Tel: 800-990-8053 • Fax: 408-733-1304
Featured Product SpotlightCalbryte™ Series
Unless otherwise specified, all products are for Research Use Only.
For pricing information please visit: www.biomol.com
Calbryte™ Series
Tel.: 0800-246 66 51 · Fax: 0800-246 66 [email protected] · www.biomol.com 1

Unless otherwise specified, all products are for Research Use Only. Not for use in diagnostic or therapeutic procedures.
Calbryte™ Series
For pricing information please visit: www.biomol.com
fluorescent and non-activatable. They show minimal response to,
for example, trace Ca2+ present in extracellular solution. It is only
once the Calbryte™ probe permeates into the cell, and only after
intracellular esterases cleave off the AM ester function groups, that
the Calbryte™ dye becomes activated and responsive to calcium.
This two-step activation process is important because it greatly
minimizes non-specific, background fluorescence. And by extension,
it significantly enhances intracellular calcium signals.
Once the Calbryte™ probe is activated, it detects calcium through
a typical chelation process. Unlike other chelators such as Fluo-3
and Fluo-4, however, Calbryte™ dyes show much greater responses
upon binding to calcium. In experiments, Calbryte™ probes have
shown a greater than 300-fold increase in fluorescence upon
chelation. In comparison, Fluo-4 only demonstrates a 100-fold
increase. This drastic improvement in fluorescence response allows
for an extremely robust detection of calcium not achievable with
past calcium indicators.
What are the advantages of using Calbryte™ dyes?
Calbryte™ dyes easily outperform older, more traditional calcium
indicators. In live cell experiments, Calbryte™ dyes yield signal-to-
background ratios that are an order of magnitude greater than
other dyes such as Fluo-4. This is a huge advantage in experimental
studies. As many researchers can attest to, poor signal to background
ratios are a headache for data analysis. It conflates results with noise,
masks potentially significant data and leads to huge assay-to-assay
variability. For this reason, when choosing reagents, most researchers
prefer ones that have good to great signal-to-background ratios.
Poor signal-to-background ratios can be caused by a multitude of
factors that largely fall into two categories. First, there are factors
that lead to poor signal intensity. These can include:
1. Low extinction coefficient and/or quantum yield
2. Poor binding of the target
3. Absorbance maximum (λmax) far from excitation source
Calbryte™ dyes were created to address these concerns. For instance,
Calbryte™ 520 has a quantum yield three times greater than that
of Fluo-3 or Fluo-4. This means that per photon of light it absorbs,
Calbryte™ 520 fundamentally emits more fluorescence than
either Fluo-3 or Fluo-4 could, resulting in brighter signal intensity.
Additionally, all dyes in the Calbryte™ series are designed such that
their maximum absorbance occurs near standard excitation sources.
For example, Calbryte™ 520 (with λmax = 492 nm) is well excited by
the common 488 nm argon ion laser line.
The second reason many probes exhibit poor signal-to-background
ratio is due to high background. High background can be a result of:
1. Cell impermeability
2. High autofluorescence
3. Nonspecific activation/binding
4. Poor cellular retention
Many of these factors are related insofar as they concern a probe's
ability to enter a cell and localize efficiently in the cytosol. Looking
at many past calcium indicators, they often run into one of two
problems. 1) Either the probe would be fairly water soluble, but too
hydrophilic to permeate live cells or 2) they would be hydrophobic
enough to permeate live cells, but have such poor water solubility
that they would precipitate out of solution during loading. Neither
case is desirable. With the Calbryte™ series, the challenge has been
to create a probe which strikes a delicate balance between water
solubility and cell permeability. The Calbryte™ series addresses
this problem through manipulation of water-soluble functional
groups and the aforementioned AM ester groups. By optimizing the
presence and quantity of both groups, Calbryte™ dyes are able to
obtain drastically higher signal-to-background ratios.
Another reason calcium indicators perform poorly in live cell
experiments is because of poor cellular retention. Here, the problem
lies with a family of proteins called p-glycoprotein 1 (P-gp). In many
cells (such as the well studied HeLa cell line), P-gp acts as an ATP-
dependent efflux pump, actively moving a broad range of small
molecules from intracellular to extracellular space. With regards to
calcium indicators, this poses a problem because activated calcium
indicators can "leak" out of the cell through these pumps and
0.8
0.6
0.4
0.2
0Sig
na
l/Ba
ckg
rou
nd
x 1
00%
Without ProBenecid
carBachol (nM)
1
10.001 0.01 0.1 10
Figure 1.2 Carbachol dose response was measured in CHO-M1 cells with Calbryte™ 520 AM and Fluo-4 AM. CHO-M1 cells were seeded overnight at 50,000 cells/100 µL/well in a 96-well black wall/clear bottom costar plate. 100 µL of 10 µg/ml Calbryte™ 520 AM in HH Buffer or 10 µg/ml Fluo-4 in HH Buffer was added and incubated for 45 minutes at 37 °C. Dye loading solution was then removed and replaced with 200 µL HH Buffer/well. Carbachol (50 µL/well) was added by FlexStation 3 to achieve the final indicated concentrations.
2017, 6 (2) • AssayWise LettersUnless otherwise specified, all products are for Research Use Only. Not for use in diagnostic or therapeutic procedures. 3
www.aatbio.com • [email protected] Tel: 800-990-8053 • Fax: 408-733-1304
Featured Product Spotlight
Tel.: 0800-246 66 51 · Fax: 0800-246 66 [email protected] · www.biomol.com2

Calbryte™ Series
Unless otherwise specified, all products are for Research Use Only.
For pricing information please visit: www.biomol.com
into the extracellular matrix. This type of leakage results in a two-
fold problem. First, because the leaked calcium probes have been
activated (due to removal of AM esters by intracellular esterases),
they will bind to free calcium in the extracellular matrix and
fluoresce. This fluorescence is not the signal of interest, however, and
thus contributes to what is known is a high background, or noise.
Second, the leakage of probes into extracellular space results in a
decrease of probes within the cell. This leads to reduced detection of
intracellular calcium and lower signal intensity, further exacerbating
the problem.
One solution, that has been well documented, is to use probenecid
in conjunction with calcium indicator use. Probenecid, a channel
blocker, has shown moderate success in reducing probe leakage.
However, its use is far from an ideal solution. This is because
there are many experimental targets that are quite sensitive to
probenecid. For example, the TRPV2 receptors of sensory ganglia
have been shown to be activated by probenecid. On the other hand,
probenecid seems to have an inhibitory effect on TAS2R receptors,
or taste receptors. For many other serum-sensitive or drug-sensitive
targets, the effects of probenecid could be largely unknown. This
means that by using probenecid, a research risks the introduction of
a completely unknown factor into an experimental design.
Noting this critical problem with existing calcium indicators,
Calbryte™ has been specifically designed for high performance
without probenecid. Calbryte™ dyes accomplish this by carefully
balancing ionic charges across the compound. This leads to a
negatively charged, hydrophilic molecule that, once inside the
cell, shows dramatically reduced cell leakage. Under probenecid-
free conditions, Calbryte™ dyes outperform Fluo-4 by an order of
magnitude in terms of signal-to-background ratio.
One final advantage of Calbryte™ dyes is that they are well suited for
high-throughput screening (HTS) and drug-discovery applications.
Since Calbryte™ dyes have such excellent signal-to-background
ratios, they can be utilized in a no-wash format (see Cat No. 36317).
Moreover, because probenecid addition is not required, Calbryte™
dyes can easily be used in automated setups.
What Calbryte™ dyes are currently available?
At present, Calbryte™ dyes are available in three different
wavelengths: Calbryte™ 520, Calbryte™ 590 and Calbryte™ 630.
Calbryte™ 520 is our upgrade for traditional green fluorescent
indicators such as Fluo-3 and Fluo-4. This dye has an excitation
maximum at 492 nm, which closely matches the standard 488
nm argon ion laser line. Also, with an emission maximum at 514
nm, this dye is compatible with the FITC filter sets found in most
fluorescence instruments. Because Calbryte™ 520 has spectral values
nearly identical to that of Fluo-4, no additional instrument setup
is required. This allows for a seamless and convenient transition
between products.
Calbryte™ 590 is our upgrade for orange-red fluorescent indicators
such as Calcium Orange™ and Rhod-2. This dye has an excitation
maximum at 580 nm and is well excited by the 555 nm laser line.
Figure 1.3 Response of endogenous P2Y receptor to ATP in CHO-K cells. CHO-K cells were seeded overnight at 40,000 cells per 100 µL per well in a 96-well black wall/clear bottom costar plate. 100 µL of Calbryte™ 520 AM (left), Calbryte™ 590 AM (middle) or Calbryte™ 630 AM (right) in HHBS with 2 mM probenecid were added into the wells, and the cells were incubated at 37 °C for one hour. The dye loading mediums were replaced with 200 µL HHBS, treated with 50 µL of 50 µM ATP, and imaged with a fluorescence microscope (Keyence) using FITC channel (Calbryte™ 520), TRITC channel (Calbryte™ 590) or Texas Red channel (Calbryte™ 630).
4 Unless otherwise specified, all products are for Research Use Only. Not for use in diagnostic or therapeutic procedures.AssayWise Letters • 2017, 6 (2)
www.aatbio.com • [email protected] Tel: 800-990-8053 • Fax: 408-733-1304
Calbryte-520-ATP
Calbryte-520-Con
Calbryte-590-ATP
Calbryte-590-Con
Calbryte-630-ATP
Calbryte-630-Con
Featured Product Spotlight
Tel.: 0800-246 66 51 · Fax: 0800-246 66 [email protected] · www.biomol.com 3

Unless otherwise specified, all products are for Research Use Only. Not for use in diagnostic or therapeutic procedures.
Calbryte™ Series
For pricing information please visit: www.biomol.com
It has an emission maximum at 592 nm, making it compatible with
TRITC/Cy3 filter sets. Calbryte™ 590 is approximately ten times more
sensitive for calcium than Rhod-2, under comparable conditions.
Moreover, unlike Rhod-2 which primarily localizes in mitochondria,
Calbryte™ 590 retains well in the cytosol of cells.
Calbryte™ 630 is our upgrade for red & deep-red fluorescent
indicators such as X-Rhod-1. This dye has an excitation maximum
at 608 nm, which aligns well with the 594 nm laser line. This dye has
an emission maximum at 624 nm and is compatible with common
Texas Red filter sets. Because of its distance from the green region
of the spectrum, Calbryte™ 630 is well suited for multiplex with a
green fluorescent label such as iFluor™ 488, Alexa Fluor® 488 or GFP.
Moreover, Calbryte™ 630's long emission wavelength makes it well
suited for study of deep tissue. This is because longer wavelength
dyes have an easier time penetrating through many cell layers,
whereas short-wavelength dyes cannot.
What other forms do Calbryte™ dyes come in?
Calbryte™ dyes are also available in potassium salt form. These
products are designed to help researchers perform calibration of
calcium indicators. Calibration of calcium indicators may be required
before determining calcium concentration from fluorescence
intensity.
What other specifications should I know for the Calbryte™ dyes?
Calbryte™ dyes are shipped lyophilized (desiccated) and can be
stored for up to a year if frozen (< -20 °C). During use, Calbryte™
dyes can be reconstituted with a small amount anhydrous DMSO.
Reconstituted Calbryte™ dyes can be stored for up to three months
if frozen (< -20 °C).
Another specification of interest for some researchers is the
dissociation constant (Kd). Please see the table below for Calbryte™
Kd values.
Cat # Product Name Unit Size Excitation (nm) Emission (nm)
20650 Calbryte™-520 AM 2x50 ug 492 514
20651 Calbryte™-520 AM 10X50 ug 492 514
20653 Calbryte™-520 AM 1 mg 492 514
20656 Calbryte™-520, potassium salt 5x50 ug 492 514
20658 Calbryte™-520, potassium salt 10x50 ug 492 514
20700 Calbryte™-590 AM 2x50 ug 573 588
20701 Calbryte™-590 AM 10X50 ug 573 588
20702 Calbryte™-590 AM 1 mg 573 588
20706 Calbryte™-590, potassium salt 5x50 ug 573 588
20720 Calbryte™-630 AM 2x50 ug 608 626
20721 Calbryte™-630 AM 10X50 ug 608 626
20722 Calbryte™-630 AM 1 mg 608 626
20727 Calbryte™-630, potassium salt 5x50 ug 608 626
36317 Screen Quest™ Calbryte-520™ Probenecid-Free and Wash-Free Calcium Assay Kit 1 Plate 490 525
36318 Screen Quest™ Calbryte-520™ Probenecid-Free and Wash-Free Calcium Assay Kit 10 Plates 490 525
36319 Screen Quest™ Calbryte-520™ Probenecid-Free and Wash-Free Calcium Assay Kit 100 Plates 490 525
36200 Screen Quest™ Calbryte-590™ Probenecid-Free and Wash-Free Calcium Assay Kit 1 Plate 573 588
36201 Screen Quest™ Calbryte-590™ Probenecid-Free and Wash-Free Calcium Assay Kit 10 plates 573 588
36202 Screen Quest™ Calbryte-590™ Probenecid-Free and Wash-Free Calcium Assay Kit 100 Plates 573 588
Product ordering information for calbryte™ Probes & assay Kits
Ca2+ Indicator Excitation (nm) Emission (nm) Kd (µM)
Calbryte™ 520 492 nm 514 nm 1.2
Calbryte™ 590 580 nm 592 nm 1.4
Calbryte™ 630 608 nm 624 nm 1.2
Table 1.1 Spectral properties of Calbryte™ dyes
2017, 6 (2) • AssayWise LettersUnless otherwise specified, all products are for Research Use Only. Not for use in diagnostic or therapeutic procedures. 5
www.aatbio.com • [email protected] Tel: 800-990-8053 • Fax: 408-733-1304
Featured Product Spotlight
Tel.: 0800-246 66 51 · Fax: 0800-246 66 [email protected] · www.biomol.com4

A Highly Sensitive Direct ELISA of cAMP Without
Unless otherwise specified, all products are for Research Use Only.
For pricing information please visit: www.biomol.com
6 Unless otherwise specified, all products are for Research Use Only. Not for use in diagnostic or therapeutic procedures.AssayWise Letters • 2017, 6 (2)
www.aatbio.com • [email protected] Tel: 800-990-8053 • Fax: 408-733-1304
Cyclic AMP (cAMP) is one of the most studied secondary messengers
in G protein-coupled receptor (GPCR) signaling pathways (the
other being calcium). This is because cAMP can be used to
characterize GPCR activity in response to agonist and antagonists. In
pharmacology, this is especially important, as GPCRs are a common
drug target.
Assays for quantification of cAMP have been proposed since the
1970s. The traditional method involves the use of an anti-cAMP
primary antibody in a competitive ELISA format. In recent years,
a new class of cAMP assay has been developed. These new assays
rely on Förster resonance energy transfer (FRET) in addition to the
anti-cAMP primary antibody in order to detect cAMP. While not
necessarily more sensitive than the traditional ELISA method, new
FRET-based techniques do allow for easier HTS/HCS of cAMP (such
as during drug discovery) as these FRET-based assays do not require
the labor intensive washing step.
A Highly Sensitive Direct ELISA of cAMP Without Acetylation
Figure 2.1 Representation of direct ELISA of cAMP principle.
Novel Products & Tools
Tel.: 0800-246 66 51 · Fax: 0800-246 66 [email protected] · www.biomol.com 5

Unless otherwise specified, all products are for Research Use Only. Not for use in diagnostic or therapeutic procedures.
A Highly Sensitive Direct ELISA of cAMP Without Acetylation
For pricing information please visit: www.biomol.com
2017, 6 (2) • AssayWise LettersUnless otherwise specified, all products are for Research Use Only. Not for use in diagnostic or therapeutic procedures. 7
www.aatbio.com • [email protected] Tel: 800-990-8053 • Fax: 408-733-1304
Direct ELISA of cAMP – Principle
Aside from the lack of an acetylation step, our Screen Quest™
Colorimetric ELISA cAMP Assay Kit functions, in principle, as other
direct competitive ELISAs on the market. Anti-cAMP primary
antibodies are coated onto the surface a microplate well. Then a test
sample is added; cAMP in the test sample will bind to the coated
antibodies. Afterwards, cAMP-HRP is introduced, which will displace
the bound cAMP due to the antibodies’ higher affinity for cAMP-HRP
over unmodified cAMP. Finally, a chromogenic reagent is added and
oxidized by the bound cAMP-HRP, generating a signal proportional
to the cAMP-HRP concentration and inversely proportional to the
cAMP concentration.
Direct ELISA of cAMP – Methods
1. cAMP standards were prepared with the following
concentrations: 10000, 100, 30, 10, 3, 1, 0.1, 0.03, 0.01,
0.003 and 0 nM.
2. 75 µL of cAMP standards was added to respective wells of
an anti-cAMP antibody coated 96-well plate.
3. 96-well plate was incubated at room temperature for 10
minutes.
4. 25 µL of cAMP-HRP conjugate was added to each well
(both standards and test samples).
5. 96-well plate was incubated at room temperature for 3
hours on a shaker.
6. 96-well plate was aspirated and washed 4 times with 200
µL per well of wash solution.
7. 100 µL of Amplite™ Green solution was added to each well.
8. 96-well plate was incubated at room temperature for 3
hours protected from light.
9. Absorbance was read using a SpectraMax microplate
reader at 405 nm, 650 nm and 740 nm.
Figure 2.2 Unmodified cyclic AMP (left) compared to acetylated cyclic AMP (right). Acetylation circled in red.
Acetylation of cAMP
During the early development of ELISA-based cAMP detection, an
interesting discovery was made. It was found that the anti-cAMP
primary antibodies used in the assay actually had a higher affinity for
acetylated cAMP than unmodified cAMP. The difference was rather
stark. For the same antibody, acetylated cAMP had a dissociation
constant of less than 10-10 M. For reference, unmodified cAMP has a
dissociation constant of roughly 10-8 M. This represents a more than
100-fold difference in dissociation constants, and consequently, a
significant increase in antibody binding affinity for acetylated cAMP
over unmodified cAMP. Because of this, most modern ELISA-based
cAMP assays will recommend acetylation of the sample cAMP
before quantification, as it will result in a more sensitive experiment.
While acetylation does increase the sensitivity of cAMP detection,
there are two major drawbacks to such methods. First, many
biologically significant macromolecules besides cAMP can be
acetylated. For instance, the lysine groups on many proteins are
susceptible to acetylation, which can dramatically alter their
function. Because many different biomolecules can be acetylated,
the impact of acetylation on a given sample cannot be predicted.
Second, the acetylation step increases experimental complexity.
This not only allows for more experimental error, but deepens the
knowledge gap between the assay developer and the end-user.
Here, we introduce a simpler direct ELISA of cAMP that does not
require an acetylation step. Even without acetylation, our assay is
more sensitive than current assays on the market. It demonstrates
both a lower detection limit (0.1 nM) as well as a smaller IC50 (2.6
nM).
Novel Products & Tools
Tel.: 0800-246 66 51 · Fax: 0800-246 66 [email protected] · www.biomol.com6

A Highly Sensitive Direct ELISA of cAMP Without Acetylation
Unless otherwise specified, all products are for Research Use Only.
For pricing information please visit: www.biomol.com
Direct ELISA of cAMP – Results
Table 2.1 A comparison of available cAMP assays using cAMP standard curves.
As seen from the results, our acetylation-free cAMP assay
outperforms other assays that require acetylation of cAMP for high
sensitivity. Our acetylation-free cAMP assay also outperforms other
mechanistically-similar acetylation-free cAMP assay kits on the
market, as seen by the 10-fold difference in IC50 value in the figure
above. Compared to assay kits with different assay principles, such as
FRET-based or luminescence, our cAMP kit matches or outperforms
available assay kits on the market. The table and graphs below
shows some of these comparisons using cAMP standards.
Product Name Supplier Description IC50Screen Quest™ Colorimetric ELISA cAMP Assay Kit AAT Bioquest Direct competitive ELISA without acetylation 2.6 nM
cAMP Assay Kit Abcam Direct competitive ELISA with acetylation 90.4 nM
cAMP Parameter Assay Kit R&D Systems Direct competitive ELISA without acetylation 30.5 nM
Lance® cAMP Assay Perkin Elmer Time-resolved FRET with anti-cAMP antibody 3 nM
cAMP-Glo Assay Promega Luminescence from ATP-coupled, PKA-dependent luciferase reaction 8.3 nM
GS Dynamic Kit Cisbio Time-resolved FRET with anti-cAMP antibody 5.6 nM
www.aatbio.com • [email protected] Tel: 800-990-8053 • Fax: 408-733-1304
Figure 2.4 Sensitivity of cAMP assay as compared using cAMP standard curves. cAMP Parameter Assay Kit from R&D Systems (A, left). Screen Quest™ Colorimetric ELISA cAMP Assay Kit (B, Right).
Figure 2.3 Sensitivity of cAMP assay as compared using cAMP standard curves. cAMP Assay Kit from Abcam plc (A, left). Screen Quest™ Colorimetric ELISA cAMP Assay Kit (B, Right).
8 Unless otherwise specified, all products are for Research Use Only. Not for use in diagnostic or therapeutic procedures.AssayWise Letters • 2017, 6 (2)
Novel Products & Tools
Tel.: 0800-246 66 51 · Fax: 0800-246 66 [email protected] · www.biomol.com 7

Unless otherwise specified, all products are for Research Use Only. Not for use in diagnostic or therapeutic procedures.
A Highly Sensitive Direct ELISA of cAMP Without Acetylation
For pricing information please visit: www.biomol.com
www.aatbio.com • [email protected] Tel: 800-990-8053 • Fax: 408-733-1304
2017, 6 (2) • AssayWise LettersUnless otherwise specified, all products are for Research Use Only. Not for use in diagnostic or therapeutic procedures. 9
Our Screen Quest Colorimetric ELISA cAMP Assay Kit also offers a
distinct advantage over other assays on the market, namely, the
ability to be detected at three different absorbances. Our cAMP assay
kit can be read at either 405 nm, 650 nm or 750 nm. No other cAMP
assay on the market offers the choice of detection wavelength. Our
cAMP assay kit gives researchers the ability to choose the absorbance
most suited for their experiment, without any subsequent loss in
sensitivity (see figures below, IC50avg ≈ 3 nM). One application may
be the selection of a longer wavelength at which to read absorbance
(ie. 750 nm). This can help minimize interference from endogenous
absorbance signals that typically occurs at <300 nm.
Figure 2.6 cAMP standard curve using PerkinElmer LANCE® cAMP assay with FRET-based absorbance detection.
Figure 2.5 cAMP standard curve using Promega cAMP-Glo™ assay with protein-kinase A coupled, ATP-dependent luminescence generation by luciferase.
Figure 2.7 cAMP standard curve with CisBio GS Dynamic Kit using HTRF® FRET-based detection.
Figure 2.8 cAMP standard curve using Screen Quest™ Colorimetric ELISA cAMP Assay Kit with absorbance reading at 750 nm.
Figure 2.9 cAMP standard curve using Screen Quest™ Colorimetric ELISA cAMP Assay Kit with absorbance reading at 650 nm.
Novel Products & Tools
Tel.: 0800-246 66 51 · Fax: 0800-246 66 [email protected] · www.biomol.com8
A Highly Sensitive Direct ELISA of cAMP Without Acetylation
Unless otherwise specified, all products are for Research Use Only.
For pricing information please visit: www.biomol.com
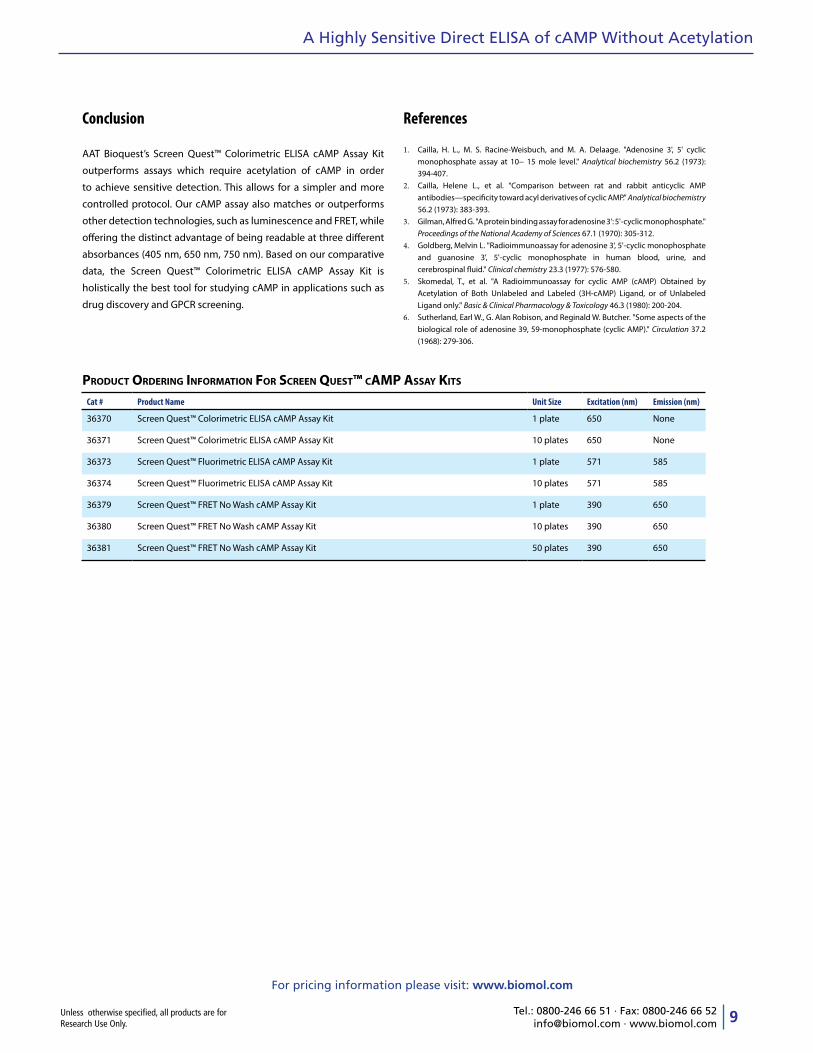
Cat # Product Name Unit Size Excitation (nm) Emission (nm)
36370 Screen Quest™ Colorimetric ELISA cAMP Assay Kit 1 plate 650 None
36371 Screen Quest™ Colorimetric ELISA cAMP Assay Kit 10 plates 650 None
36373 Screen Quest™ Fluorimetric ELISA cAMP Assay Kit 1 plate 571 585
36374 Screen Quest™ Fluorimetric ELISA cAMP Assay Kit 10 plates 571 585
36379 Screen Quest™ FRET No Wash cAMP Assay Kit 1 plate 390 650
36380 Screen Quest™ FRET No Wash cAMP Assay Kit 10 plates 390 650
36381 Screen Quest™ FRET No Wash cAMP Assay Kit 50 plates 390 650
Product ordering information for screen Quest™ camP assay Kits
Conclusion
AAT Bioquest’s Screen Quest™ Colorimetric ELISA cAMP Assay Kit
outperforms assays which require acetylation of cAMP in order
to achieve sensitive detection. This allows for a simpler and more
controlled protocol. Our cAMP assay also matches or outperforms
other detection technologies, such as luminescence and FRET, while
offering the distinct advantage of being readable at three different
absorbances (405 nm, 650 nm, 750 nm). Based on our comparative
data, the Screen Quest™ Colorimetric ELISA cAMP Assay Kit is
holistically the best tool for studying cAMP in applications such as
drug discovery and GPCR screening.
References
1. Cailla, H. L., M. S. Racine-Weisbuch, and M. A. Delaage. "Adenosine 3', 5' cyclic monophosphate assay at 10− 15 mole level." Analytical biochemistry 56.2 (1973): 394-407.
2. Cailla, Helene L., et al. "Comparison between rat and rabbit anticyclic AMP antibodies—specificity toward acyl derivatives of cyclic AMP." Analytical biochemistry 56.2 (1973): 383-393.
3. Gilman, Alfred G. "A protein binding assay for adenosine 3': 5'-cyclic monophosphate." Proceedings of the National Academy of Sciences 67.1 (1970): 305-312.
4. Goldberg, Melvin L. "Radioimmunoassay for adenosine 3', 5'-cyclic monophosphate and guanosine 3', 5'-cyclic monophosphate in human blood, urine, and cerebrospinal fluid." Clinical chemistry 23.3 (1977): 576-580.
5. Skomedal, T., et al. "A Radioimmunoassay for cyclic AMP (cAMP) Obtained by Acetylation of Both Unlabeled and Labeled (3H‐cAMP) Ligand, or of Unlabeled Ligand only." Basic & Clinical Pharmacology & Toxicology 46.3 (1980): 200-204.
6. Sutherland, Earl W., G. Alan Robison, and Reginald W. Butcher. "Some aspects of the biological role of adenosine 39, 59-monophosphate (cyclic AMP)." Circulation 37.2 (1968): 279-306.
www.aatbio.com • [email protected] Tel: 800-990-8053 • Fax: 408-733-1304
10 Unless otherwise specified, all products are for Research Use Only. Not for use in diagnostic or therapeutic procedures.AssayWise Letters • 2017, 6 (2)
Novel Products & Tools
Tel.: 0800-246 66 51 · Fax: 0800-246 66 [email protected] · www.biomol.com 9

10 Unless otherwise specified, all products are for Research Use Only. Not for use in diagnostic or therapeutic procedures.
Selecting The Right ROS Probe
For pricing information please visit: www.biomol.com
www.aatbio.com • [email protected] Tel: 800-990-8053 • Fax: 408-733-1304
Selecting the Right ROS Probe
Reactive oxygen species (ROS) are chemically reactive, oxygen-
containing chemical species that are generated as byproducts of
cellular metabolism. In animal cells, generation of ROS typically
occurs in the mitochondria. In plant cells, ROS can also be generated
in chloroplasts. More recently, ROS has been shown to be generated
in peroxisomes and from plasma membrane oxidases of various cell
types.
When generated in excess, ROS has long been thought to result
in damage of cellular macromolecules such as DNA, lipids and
proteins. Holistically, this is represented by a cell’s oxidative stress
state. Such states of stress have been linked to cellular processes
such as apoptosis, and more macroscopically, play a role in the
pathogenesis of many human diseases.
Because of its damaging effects, cells have several carefully
regulated systems for managing excess ROS. The most well studied
system is the glutathione-ascorbate cycle, which detoxifies H2O2
into H2O, using NADH and NADPH as electron donors. Other systems
include enzymes such as superoxide dismutase, which catalyzes
the dismutation of the superoxide anion (O2-) into O2 or H2O2, and
catalase, which catalyzes the decomposition of H2O2 into H2O and
O2.
While ROS has been extensively studied for their detrimental effect
on cells, it is only more recently that studies have looked at the role
of ROS in cell signaling. In controlled amounts, ROS has been shown
to regulate gene activation. The specific mechanism by which this
occurs is, however, still up for debate. It is possible that ROS binds
to special receptors which initiate a signaling cascade leading up
to gene regulation. It is also possible that ROS directly modifies
the proteins in such a signaling cascade, perhaps by regulation of
protein phosphorylation.
Due to its importance in biological systems, a plethora of tools have
been developed to study ROS both and in vivo. The table below
provides a summary of the most common tools as well as their
targets.
Figure 3.1 Reduction of oxygen and its byproducts
3O2 O2•- O2
2- O2-O23- O-
1O2 HO2• OH•H2O2 H2OH2O
2H+ 2H+ 2H+H+
e- e- e- e-
H+
Dioxygen
Singletoxygen
Superoxideradical ion
Perhydroxylradical
Peroxideion
Hydrogenperoxide
Oxeneion
HydroxylRadical
Water
Oxideion
Water
2017, 6 (2) • AssayWise LettersUnless otherwise specified, all products are for Research Use Only. Not for use in diagnostic or therapeutic procedures. 11
Novel Products & Tools
Tel.: 0800-246 66 51 · Fax: 0800-246 66 [email protected] · www.biomol.com
Selecting The Right ROS Probe
Unless otherwise specified, all products are for Research Use Only.
For pricing information please visit: www.biomol.com
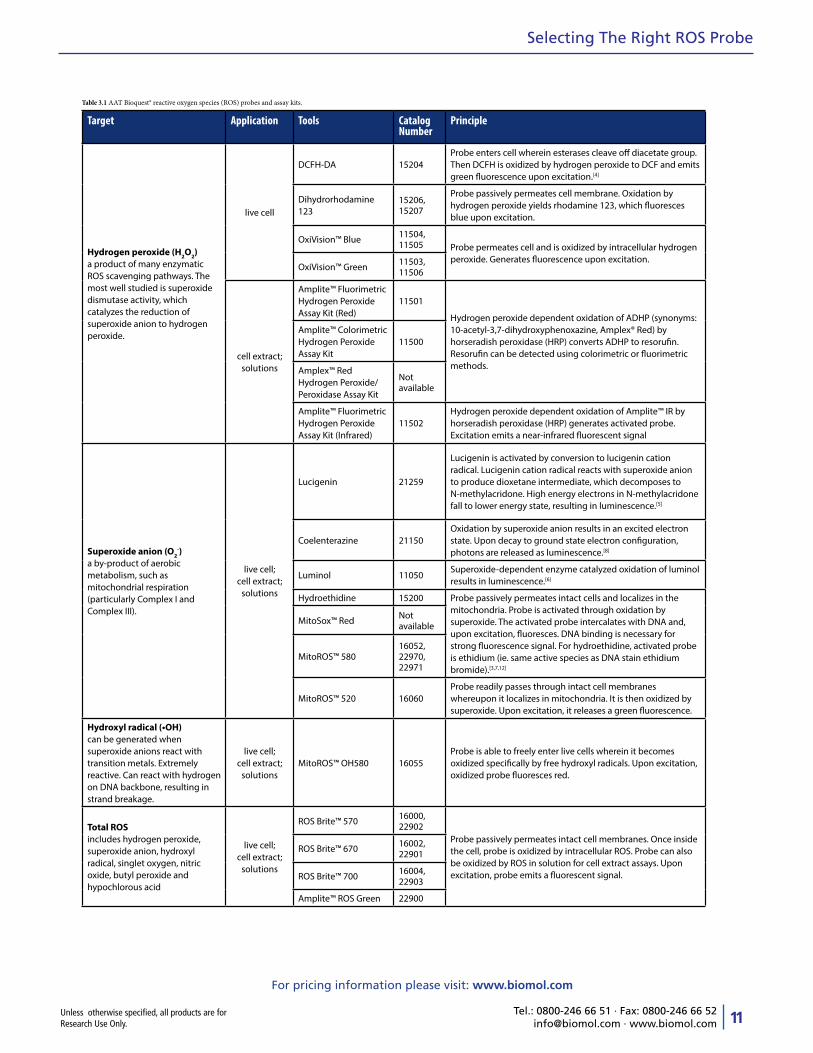
Target Application Tools Catalog Number
Principle
Hydrogen peroxide (H2O2) a product of many enzymatic ROS scavenging pathways. The most well studied is superoxide dismutase activity, which catalyzes the reduction of superoxide anion to hydrogen peroxide.
live cell
DCFH-DA 15204Probe enters cell wherein esterases cleave off diacetate group. Then DCFH is oxidized by hydrogen peroxide to DCF and emits green fluorescence upon excitation.[4]
Dihydrorhodamine 123
15206, 15207
Probe passively permeates cell membrane. Oxidation by hydrogen peroxide yields rhodamine 123, which fluoresces blue upon excitation.
OxiVision™ Blue 11504, 11505 Probe permeates cell and is oxidized by intracellular hydrogen
peroxide. Generates fluorescence upon excitation.OxiVision™ Green 11503,
11506
cell extract; solutions
Amplite™ Fluorimetric Hydrogen Peroxide Assay Kit (Red)
11501
Hydrogen peroxide dependent oxidation of ADHP (synonyms: 10-acetyl-3,7-dihydroxyphenoxazine, Amplex® Red) by horseradish peroxidase (HRP) converts ADHP to resorufin. Resorufin can be detected using colorimetric or fluorimetric methods.
Amplite™ Colorimetric Hydrogen Peroxide Assay Kit
11500
Amplex™ Red Hydrogen Peroxide/Peroxidase Assay Kit
Not available
Amplite™ Fluorimetric Hydrogen Peroxide Assay Kit (Infrared)
11502Hydrogen peroxide dependent oxidation of Amplite™ IR by horseradish peroxidase (HRP) generates activated probe. Excitation emits a near-infrared fluorescent signal
Superoxide anion (O2-)
a by-product of aerobic metabolism, such as mitochondrial respiration (particularly Complex I and Complex III).
live cell; cell extract;
solutions
Lucigenin 21259
Lucigenin is activated by conversion to lucigenin cation radical. Lucigenin cation radical reacts with superoxide anion to produce dioxetane intermediate, which decomposes to N-methylacridone. High energy electrons in N-methylacridone fall to lower energy state, resulting in luminescence.[5]
Coelenterazine 21150Oxidation by superoxide anion results in an excited electron state. Upon decay to ground state electron configuration, photons are released as luminescence.[8]
Luminol 11050Superoxide-dependent enzyme catalyzed oxidation of luminol results in luminescence.[6]
Hydroethidine 15200 Probe passively permeates intact cells and localizes in the mitochondria. Probe is activated through oxidation by superoxide. The activated probe intercalates with DNA and, upon excitation, fluoresces. DNA binding is necessary for strong fluorescence signal. For hydroethidine, activated probe is ethidium (ie. same active species as DNA stain ethidium bromide).[3,7,12]
MitoSox™ Red Not available
MitoROS™ 58016052, 22970, 22971
MitoROS™ 520 16060Probe readily passes through intact cell membranes whereupon it localizes in mitochondria. It is then oxidized by superoxide. Upon excitation, it releases a green fluorescence.
Hydroxyl radical (•OH) can be generated when superoxide anions react with transition metals. Extremely reactive. Can react with hydrogen on DNA backbone, resulting in strand breakage.
live cell; cell extract;
solutionsMitoROS™ OH580 16055
Probe is able to freely enter live cells wherein it becomes oxidized specifically by free hydroxyl radicals. Upon excitation, oxidized probe fluoresces red.
Total ROS includes hydrogen peroxide, superoxide anion, hydroxyl radical, singlet oxygen, nitric oxide, butyl peroxide and hypochlorous acid
live cell; cell extract;
solutions
ROS Brite™ 570 16000, 22902
Probe passively permeates intact cell membranes. Once inside the cell, probe is oxidized by intracellular ROS. Probe can also be oxidized by ROS in solution for cell extract assays. Upon excitation, probe emits a fluorescent signal.
ROS Brite™ 670 16002, 22901
ROS Brite™ 700 16004, 22903
Amplite™ ROS Green 22900
Table 3.1 AAT Bioquest® reactive oxygen species (ROS) probes and assay kits.
www.aatbio.com • [email protected] Tel: 800-990-8053 • Fax: 408-733-1304
12 Unless otherwise specified, all products are for Research Use Only. Not for use in diagnostic or therapeutic procedures.AssayWise Letters • 2017, 6 (2)
Novel Products & Tools
Tel.: 0800-246 66 51 · Fax: 0800-246 66 [email protected] · www.biomol.com 11

12 Unless otherwise specified, all products are for Research Use Only. Not for use in diagnostic or therapeutic procedures.
Selecting The Right ROS Probe
For pricing information please visit: www.biomol.com
www.aatbio.com • [email protected] Tel: 800-990-8053 • Fax: 408-733-1304
Target Tool Catalog Number Principle
SOD dismutase (SOD)catalyzes conversion (ie. dismutation) of superoxide into oxygen and hydrogen peroxide
Amplite™ Colorimetric Superoxide Dismutase (SOD) Assay Kit
11305
First uses xanthine oxidase (XO) to convert xanthine into hydrogen peroxide and uric acid while simultaneously catalyzing the reduction of molecular oxygen (O2) into superoxide anion (O2
-). Then uses competitive inhibition of superoxide dismutation by ReadiView™ SOD560 to quantify superoxide dismutase activity. Decrease in absorbance of ReadiView™ SOD560 is directly proportional to SOD activity.
Catalasenearly ubiquitous antioxidant enzyme that converts hydrogen peroxide to water and molecular oxygen
Amplite™ Fluorimetric Catalase Assay Kit (Red)
11306
Competitive inhibition assay. Amplite™ Red probe is activated through oxidation by hydrogen peroxide. Thus, probe competes with catalase for hydrogen peroxidase substrate. Amplite™ Red absorbance is inversely proportional to catalase activity.
Glutathione (GSH)very important redox compound. It is a major component of the glutathione-ascorbate cycle which converts hydrogen peroxide into water
Thiolite™ Green 10055, 22810Probe becomes activated after reaction with glutathione. Upon excitation, probe releases a green fluorescence.
Amplite™ Fluorimetric Glutathione GSH/GSSG Ratio Assay Kit
10056, 10060
Uses Thiolite™ Green probe, which becomes activated after reaction with glutathione (GSH), to quantify glutathione. Oxidized glutathione (GSSG) is determined by measuring GSH concentration before and after enzyme-catalyzed reduction of GSSG to GSH. GSSG concentration is calculated by subtracting initial GSH (before enzyme reaction) from total GSH (after enzyme reaction).
Glutathione peroxidase (GPx)catalyzes the oxidation of GSH to GSSG and the conversion of hydrogen peroxide to water
Amplite™ Fluorimetric Glutathione Peroxidase Assay Kit (Blue)
11560
Enzymatic cycling assay. Glutathione peroxidase (GPx) catalyzes the oxidation of glutathione from GSH to GSSG. Glutathione reductase (GR) then catalyzes the reduction of GSSG back into GSH with the coenzyme NADPH, which is oxidized to NADP+. The Quest Fluor™ NADP Probe then quantifies the level of NADP+ which is directly proportional to the original GPx activity.
Ascorbatealso called ascorbic acid or vitamin C, it is a major component of the glutathione-ascorbate cycle which converts hydrogen peroxide to water
Amplite™ Fluorimetric Ascorbic Acid Assay Kit (Blue)
13835Relies on the dehydrogenation of ascorbic acid to dehydroascorbic acid (DHA) by an enzyme-catalyzed reaction. Resulting DHA is quantified by Ascorbrite™ Blue probe.
NAD+/NADHmajor component in ATP synthesis that occurs in mitochondria. This coenzyme is thought to be involved in superoxide production, the rate of which is dependent on the NAD+/NADH ratio.
Amplite™ NAD/NADH Kits (assorted)
15273, 15258, 15275, 15280, 15263, 15257, 15261, 15262, 15291, 15290, 15259, 15271
Typically, uses a NAD+ specific probe to quantify NAD+ concentration. NAD+/NADH ratio is determined by enzymatic cycling assay.
NADPHacts as an electron donor in the glutathione-ascorbate cycle that converts hydrogen peroxide to water
Amplite™ NADPH Kits (assorted)
15274, 15272, 15260, 15276, 15264, 15262, 15259, 15291, 15290
Typically, uses a NADPH specific probe to quantify NADPH concentration. NADP/NADPH ratio is determined by enzymatic cycling assay.
References
1. Apel, Klaus, and Heribert Hirt. "Reactive oxygen species: metabolism, oxidative stress, and signal transduction." Annu. Rev. Plant Biol. 55 (2004): 373-399.
2. Bindokas, Vytautas P., et al. "Superoxide production in rat hippocampal neurons: selective imaging with hydroethidine." Journal of Neuroscience 16.4 (1996): 1324-1336.
3. Kalyanaraman, Balaraman, et al. "Measuring reactive oxygen and nitrogen
species with fluorescent probes: challenges and limitations." Free Radical Biology and Medicine 52.1 (2012): 1-6.
4. LeBel, Carl P., Harry Ischiropoulos, and Stephen C. Bondy. "Evaluation of the probe 2', 7'-dichlorofluorescin as an indicator of reactive oxygen species formation and oxidative stress." Chemical research in toxicology 5.2 (1992): 227-231.
5. Li, Yunbo, et al. "Validation of lucigenin (bis-N-methylacridinium) as a
Table 3.2 AAT Bioquest® reactive oxygen species (ROS) probes and assay kits.
2017, 6 (2) • AssayWise LettersUnless otherwise specified, all products are for Research Use Only. Not for use in diagnostic or therapeutic procedures. 13
Novel Products & Tools
Tel.: 0800-246 66 51 · Fax: 0800-246 66 [email protected] · www.biomol.com

Selecting The Right ROS Probe
Unless otherwise specified, all products are for Research Use Only.
For pricing information please visit: www.biomol.com
chemilumigenic probe for detecting superoxide anion radical production by enzymatic and cellular systems." Journal of Biological Chemistry 273.4 (1998): 2015-2023.
6. Misra, Hara P., and Pamela M. Squatrito. "The role of superoxide anion in peroxidase-catalyzed chemiluminescence of luminol." Archives of biochemistry and biophysics 215.1 (1982): 59-65.
7. Mukhopadhyay, Partha, et al. "Simple quantitative detection of mitochondrial superoxide production in live cells." Biochemical and biophysical research communications 358.1 (2007): 203-208.
8. Münzel, Thomas, et al. "Detection of superoxide in vascular tissue." Arteriosclerosis, thrombosis, and vascular biology 22.11 (2002): 1761-1768.
9. Murphy, Michael P. "How mitochondria produce reactive oxygen species."
Biochemical Journal 417.1 (2009): 1-13.10. Thannickal, Victor J., and Barry L. Fanburg. "Reactive oxygen species in
cell signaling." American Journal of Physiology-Lung Cellular and Molecular Physiology 279.6 (2000): L1005-L1028.
11. Turrens, Julio F. "Mitochondrial formation of reactive oxygen species." The Journal of physiology 552.2 (2003): 335-344.
12. Zielonka, Jacek, and B. Kalyanaraman. "Hydroethidine-and MitoSOX-derived red fluorescence is not a reliable indicator of intracellular superoxide formation: another inconvenient truth." Free Radical Biology and Medicine 48.8 (2010): 983-1001.
Cat # Product Name Unit Size Excitation (nm) Emission (nm)
15204 DCFH-DA [2',7'-Dichlorodihydrofluorescein diacetate] *CAS 4091-99-0* 25 mg 504 529
15206 Dihydrorhodamine 123 *CAS 109244-58-8* 10 mg 507 529
15207 Dihydrorhodamine 123 *CAS 109244-58-8* 5X1 mg 507 529
11504 Cell Meter™ Intracellular Fluorimetric Hydrogen Peroxide Assay Kit *Blue Fluorescence* 100 Tests 405 450
11505 Cell Meter™ Intracellular Fluorimetric Hydrogen Peroxide Assay Kit *Blue Fluorescence Optimized for Flow Cytometry*
100 Tests 405 450
11503 Cell Meter™ Intracellular Fluorimetric Hydrogen Peroxide Assay Kit *Green Fluorescence* 200 Tests 492 515
11506 Cell Meter™ Intracellular Fluorimetric Hydrogen Peroxide Assay Kit *Green Fluorescence Optimized for Flow Cytometry*
100 Tests 490 530
11501 Amplite™ Fluorimetric Hydrogen Peroxide Assay Kit *Red Fluorescence* 500 Tests 575 590
11500 Amplite™ Colorimetric Hydrogen Peroxide Assay Kit 500 Tests 650 None
11502 Amplite™ Fluorimetric Hydrogen Peroxide Assay Kit *Near Infrared Fluorescence* 500 Tests 647 670
21259 lucigenin [Bis-N-methylacridinium nitrate] 10 mg 455 505
21150 Coelenterazine *CAS#: 55779-48-1* 250 ug 429 466
11050 Luminol [3-Aminophthalhydrazide] *CAS 521-31-3* 1 g 355 411
15200 Hydroethidine [Dihydroethidium] *CAS 38483-26-0* 25 mg 518 605
16052 MitoROS™ 580 *Optimized for Detecting Reactive Oxygen Species (ROS) in Mitochnodria* 500 Tests 510 580
22970 Cell Meter™ Fluorimetric Mitochondrial Superoxide Activity Assay Kit*Optimized for Flow Cytometry*
100 Tests 540 590
22971 Cell Meter™ Fluorimetric Mitochondrial Superoxide Activity Assay Kit*Optimized for Microplate Reader*
200 Tests 540 590
16060 Cell Meter™ Fluorimetric Mitochondrial Superoxide Activity Assay Kit *Green Fluorescence* 200 Tests 509 534
16055 Cell Meter™ Mitochondrial Hydroxyl Radical Detection Kit *Red Fluorescence* 200 Tests 576 598
16000 ROS Brite™ 570 *Optimized for Detecting Reactive Oxygen Species (ROS)* 1 mg 556 566
22902 Cell Meter™ Fluorimetric Intracellular Total ROS Activity Assay Kit*Orange Fluorescence* 200 Tests 556 566
16002 ROS Brite™ 670 *Optimized for Detecting Reactive Oxygen Species (ROS)* 1 mg 658 675
22901 Cell Meter™ Fluorimetric Intracellular Total ROS Activity Assay Kit*Red Fluorescence* 200 Tests 520 605
16004 ROS Brite™ 700 *Optimized for in Vivo Imaging* 1 mg 680 706
22903 Cell Meter™ Fluorimetric Intracellular Total ROS Activity Assay Kit*Deep Red Fluorescence* 200 Tests 658 675
22900 Cell Meter™ Fluorimetric Intracellular Total ROS Activity Assay Kit*Green Fluorescence* 200 Tests 492 520
11305 Amplite™ Colorimetric Superoxide Dismutase (SOD) Assay Kit 1 kit 560 None
11306 Amplite™ Fluorimetric Catalase Assay Kit *Red Fluorescence* 1 kit 571 585
10055 Amplite™ Fluorimetric Glutathione Assay Kit *Green Fluorescence* 200 Tests 510 524
22810 Cell Meter™ Intracellular GSH Assay Kit *Optimized for Flow Cytometry* 1 kit 490 515
Product ordering information for ros Probes & assay Kits
14 Unless otherwise specified, all products are for Research Use Only. Not for use in diagnostic or therapeutic procedures.AssayWise Letters • 2017, 6 (2)
www.aatbio.com • [email protected] Tel: 800-990-8053 • Fax: 408-733-1304
Novel Products & Tools
Tel.: 0800-246 66 51 · Fax: 0800-246 66 [email protected] · www.biomol.com 13

14 Unless otherwise specified, all products are for Research Use Only. Not for use in diagnostic or therapeutic procedures.
Selecting The Right ROS Probe
For pricing information please visit: www.biomol.com
Cat # Product Name Unit Size Excitation (nm) Emission (nm)
10056 Amplite™ Fluorimetric Glutathione GSH/GSSG Ratio Assay Kit *Green Fluorescence* 200 Tests 510 524
10060 Amplite™ Rapid Fluorimetric Glutathione GSH/GSSG Ratio Assay Kit *Green Fluorescence* 200 Tests 510 524
11560 Amplite™ Fluorimetric Glutathione Peroxidase Assay Kit *Blue Fluorescence* 200 Tests 420 480
13835 Amplite™ Fluorimetric Ascorbic Acid Assay Kit 200 Tests 340 430
15273 Amplite™ Colorimetric NAD/NADH Ratio Assay Kit 250 Tests 460 None
15258 Amplite™ Colorimetric Total NAD and NADH Assay Kit 400 Tests 575 None
15275 Amplite™ Colorimetric Total NAD and NADH Assay Kit *Enhanced Sensitivity* 400 Tests 460 None
15280 Amplite™ Fluorimetric NAD Assay Kit *Blue Fluorescence* 200 Tests 422 466
15263 Amplite™ Fluorimetric NAD/NADH Ratio Assay Kit *Red Fluorescence* 250 Tests 571 585
15257 Amplite™ Fluorimetric Total NAD and NADH Assay Kit *Red Fluorescence* 400 Tests 571 585
15261 Amplite™ Fluorimetric NADH Assay Kit *Red Fluorescence* 400 Tests 571 585
15291 Cell Meter™ Intracelluar NADH Flow Cytometric Analysis Kit 100 Tests 540 590
15290 Cell Meter™ Intracelluar NADH Fluorescence Imaging Kit 100 Tests 540 590
15259 Amplite™ Fluorimetric Total NADP and NADPH Assay Kit *Red Fluorescence* 400 Tests 571 585
15271 Amplite™ Colorimetric NADH Assay Kit 400 Tests 460 None
15274 Amplite™ Colorimetric NADP/NADPH Ratio Assay Kit 250 Tests 460 None
15272 Amplite™ Colorimetric NADPH Assay Kit 400 Tests 460 None
15260 Amplite™ Colorimetric Total NADP and NADPH Assay Kit 400 Tests 575 None
15276 Amplite™ Colorimetric Total NADP and NADPH Assay Kit *Enhanced Sensitivity* 400 Tests 460 None
15264 Amplite™ Fluorimetric NADP/NADPH Ratio Assay Kit *Red Fluorescence* 250 Tests 571 585
15262 Amplite™ Fluorimetric NADPH Assay Kit *Red Fluorescence* 400 Tests 571 585
15281 Amplite™ Fluorimetric NADP Assay Kit *Blue Fluorescence* 200 Tests 422 466
Product ordering information for ros Probes & assay Kits
2017, 6 (2) • AssayWise LettersUnless otherwise specified, all products are for Research Use Only. Not for use in diagnostic or therapeutic procedures. 15
www.aatbio.com • [email protected] Tel: 800-990-8053 • Fax: 408-733-1304
Novel Products & Tools
Tel.: 0800-246 66 51 · Fax: 0800-246 66 [email protected] · www.biomol.com

iFluor™ 488- and FITC-Conjugated Antibodies
Unless otherwise specified, all products are for Research Use Only.
For pricing information please visit: www.biomol.com
www.aatbio.com • [email protected] Tel: 800-990-8053 • Fax: 408-733-1304
Quantitative Comparison of iFluor™ 488- and FITC- Conjugated Antibodies For Use In Cell Labeling
The use of fluorophore labeled antibodies has been a powerful tool
for the study of biological systems. These fluorophore-antibody
conjugates have found important applications in ELISA, Western
blotting, FACS and fluorescence microscopy. Their importance is
attributed to the sensitivity with which they detect a substrate and
the ease by which that detection event can be translated into a
quantifiable signal (ie. fluorescence). Because of their importance in
biological assays, a great deal of research has been conducted to
identify and synthesize the ideal fluorophore for a given application.
While subject to some debate, ideal fluorophores typically possess
one or more of the following qualities: (1) strong fluorescence as
characterized by a high extinction coefficient and quantum yield (2)
high photostability and resistance to photobleaching (3) resilience
under different environmental conditions, such as pH (4) minimal
background interference or auto-fluorescence and (5) simplicity and
consistency in experimental usage.
Here, we describe a novel fluorophore for cell labeling applications,
iFluor™ 488. This fluorophore is part of the iFluor™ family that spans
the spectrum from ultra-violet to infrared. iFluor™ 488 absorbs light
at 491 nm and emits at 518 nm, making it spectrally similar to the
conventional fluorophore fluorescein isothiocyanate (FITC), which
absorbs light at 495 nm and emits at 521 nm. However, iFluor™ 488
is far superior to FITC for cell labeling applications, particularly when
comparing fluorescence intensity and photostability. In the present
study, iFluor™ 488 and FITC were conjugated to goat anti-mouse
polyclonal antibodies (GAM). The resulting conjugates were used to
perform cell stains for fluorescence microscopy. Comparisons were
made for fluorescence intensity, degree of labeling (ie. the number
of fluorophores per antibody) and photostability.
Figure 4.1 Fluorescence image of HeLa cells stained with iFluor™ 488-goat anti-mouse IgG conjugate (Green, Cat#16448).
16 Unless otherwise specified, all products are for Research Use Only. Not for use in diagnostic or therapeutic procedures.AssayWise Letters • 2017, 6 (2)
Technology Review
Quantitative Comparison of iFluor™ 488- and FITC- Conjugated Antibodies For Use In Cell Labeling
Tel.: 0800-246 66 51 · Fax: 0800-246 66 [email protected] · www.biomol.com 15

16 Unless otherwise specified, all products are for Research Use Only. Not for use in diagnostic or therapeutic procedures.
iFluor™ 488- and FITC-Conjugated Antibodies
For pricing information please visit: www.biomol.com
www.aatbio.com • [email protected] Tel: 800-990-8053 • Fax: 408-733-1304
2017, 6 (2) • AssayWise LettersUnless otherwise specified, all products are for Research Use Only. Not for use in diagnostic or therapeutic procedures. 17
Materials and Methods
Conjugation of FITC and iFluor™ 488 to GAM IgG
FITC and iFluor™ 488 (AAT Bioquest, Sunnyvale, CA) were conjugated
to goat anti-mouse IgG (AAT Bioquest, Sunnyvale, CA) according to
manufacturer’s specifications. Final bioconjugates were purified
using size exclusion spin columns (Bio-rad, Hercules, CA).
Determination of degree of labeling (DOL)
Degree of labeling was determined using absorbance measurements
and Degree of Labeling Calculator (https://www.aatbio.com/tools/
degree-of-labeling-calculator/, AAT Bioquest, Sunnyvale, CA).
Preparation of fixed cells
HeLa cells were seeded in a 96-well black wall/clear bottom plate
(10,000 cells/well) in culture medium overnight. Growth medium was
removed, cells were washed once with phosphate buffered saline
(PBS) and then PBS was aspirated. 100 µL 4% paraformaldehyde in
PBS (pH 7.4) was added to each well and incubated with cells for
15 minutes at room temperature to fix the cells. Cells were then
washed with 200 µL PBS/well for three times. After fixation, 100 µL
of blocking solution (PBS + 1% BSA) was added to each well to block
for 30 minutes at room temperature. Blocking solution was then
replaced with cell permeabilization buffer (PBS + 1% BSA + 0.1%
TritonX-100 cells) and cells were incubated for 15 minutes at room
temperature. Cells were then washed with 200 µL PBS/well for three
times. 200 µL PBS was added to each well and the plate was stored
at 4˚C until staining.
Tubulin monoclonal antibody staining
Storage PBS buffer in each well was aspirated and 1 µg/mL alpha
tubulin monoclonal antibody (Thermo Fisher, Waltham, MA) in PBS
+ 0.02% Tween-20 was added and incubated at room temperature
for 30 minutes. For experimental control, cells were stained with 1
µg/mL mouse IgG. After incubation, cells were washed with 200 µL
PBS/well for three times.
GAM IgG-FITC and GAM IgG-iFluor™ 488 staining
10 µg/mL of previously prepared GAM IgG-FITC was added to
wells stained with alpha tubulin monoclonal antibody or stained
with mouse IgG (control) for 30 minutes at room temperature.
Cells were then washed with 200 µL PBS/well for three times. After
washing, 100µL PBS was added to each well. The same procedure
was repeated for GAM IgG-iFluor™ 488. Cells were imaged using a
Keyence X710 fluorescence microscope with FITC channel.
Test of photobleaching and photostability
Cells were continuously illuminated using a Keyence X710
fluorescence microscope. Images of the cells were captured and
saved every 2.5 seconds for the duration of 300 seconds. Final
intensity values were determined using ImageJ software’s integrated
density (National Institutes of Health, Bethesda, MD).
results
Degree of labeling (DOL)
The degree of labeling (DOL) was calculated using AAT Bioquest’s
Degree of Labeling Calculator (https://www.aatbio.com/tools/
degree-of-labeling-calculator/). The DOL represents the average
moles of fluorophore per mole of antibody. For GAM IgG-FITC, the
DOL was determined to be 4.5 fluorophores/antibody. For GAM
IgG-iFluor™ 488, the DOL was determined to be 6.5 fluorophores/
antibody.
Photostability
Measurements of total fluorescence intensity (TFI) showed that
HeLa cells labeled with GAM IgG-FITC had an initial intensity of
449.33 units, as determined by ImageJ analysis. After 300 seconds
of exposure (5 minutes), the TFI was 144.51 units. This represented a
68% decrease in TFI.
Measurements of TFI showed that HeLa cells labeled with GAM IgG-
iFluor™ 488 had an initial intensity of 1213.87 units, as determined
by ImageJ analysis. After 300 seconds of exposure (5 minutes), the
TFI was 885.29 units. This represented a 27% decrease in TFI.
Nor
mal
ized
Inte
nsity
(%)
Time (seconds)
120
100
80
60
40
20
30 60 90 120 150 180 210 240 270 3000
0
Figure 4.2 Comparison of fluorescence intensity between HeLa cells labeled with GAM IgG-FITC and GAM IgG-iFluor™ 488.
GAM IgG - iFluor™ 488
GAM IgG - FITC
Technology Review
Tel.: 0800-246 66 51 · Fax: 0800-246 66 [email protected] · www.biomol.com

iFluor™ 488- and FITC-Conjugated Antibodies
Unless otherwise specified, all products are for Research Use Only.
For pricing information please visit: www.biomol.com
discussion
One of the key motivators for this experiment was to determine if
iFluor™ 488 had the potential to replace FITC as a green fluorescent
dye for cell labeling applications. From this experiment, it was shown
that iFluor™ 488 had much better photostability compared to FITC
when conjugated to IgG and used to label tubulin. The fluorescence
intensity loss of FITC was more than double that of iFluor™ 488 (68%
vs 27%) over the same period of time. Thus, for applications which
require photostable dyes or long exposure times, iFluor™ 488 is
clearly superior.
Another quality to note is the dramatic difference in fluorescence
intensity when comparing FITC labeled cells to iFluor™ 488 labeled
cells. In captured images shown in Figure 2, iFluor™ 488 appears
much “brighter”. This notion is supported by the intensity values,
which demonstrates significantly greater intensity values for iFluor™
488 than for FITC. This stark contrast was perhaps most evident in
the image slice taken at 300 seconds, wherein the FITC labeled cells
were barely visible whereas the iFluor™ 488 labeled cells were still
clearly visible.
conclusion
In a direct comparison of FITC and iFluor™ 488, it was shown that
iFluor™ 488 has a superior fluorescence intensity. Furthermore,
iFluor™ 488 is significantly less susceptible to photobleaching,
allowing for stained cells to be detectable for a much longer period
of time. Based on these findings, iFluor™ 488 can serve as a superior
alternative to FITC for cell labeling applications.
GAM IgG-FITC GAM IgG-iFluor™ 488
0s
60s
120s
180s
240s
300s
Figure 4.3 Images of HeLa cells captured using Keyence X710 fluorescence microscope. TFI represents total fluorescence intensity as calculated by ImageJ software.
Cat # Product Name Unit Size Excitation (nm) Emission (nm)
16852 FITC goat anti-mouse IgG (H+L) 1 mg 492 515
16860 FITC goat anti-mouse IgG (H+L) *Cross Adsorbed* 1 mg 492 515
16868 FITC goat anti-rabbit IgG (H+L) 1 mg 492 515
16876 FITC goat anti-rabbit IgG (H+L) *Cross Adsorbed* 1 mg 492 515
1072 iFluor™ 488 amine 1 mg 491 514
1000 iFluor™ 488 azide 1 mg 491 518
16735 iFluor™ 488 goat anti-mouse IgG (H+L) 1 mg 491 514
16773 iFluor™ 488 goat anti-mouse IgG (H+L) *Cross Adsorbed* 1 mg 491 514
16800 iFluor™ 488 goat anti-rabbit IgG (H+L) 1 mg 491 514
16828 iFluor™ 488 goat anti-rabbit IgG (H+L) *Cross Adsorbed* 1 mg 491 514
1082 iFluor™ 488 hydrazide 1 mg 491 514
1062 iFluor™ 488 maleimide 1 mg 491 518
1023 iFluor™ 488 succinimidyl ester 1 mg 491 518
11060 iFluor™ 488 tyramide 1 mg 491 514
Product ordering information for ifluor™ 488 & fitc - labeled secondary antibody conjugtaes
www.aatbio.com • [email protected] Tel: 800-990-8053 • Fax: 408-733-1304
18 Unless otherwise specified, all products are for Research Use Only. Not for use in diagnostic or therapeutic procedures.AssayWise Letters • 2017, 6 (2)
Technology Review
Tel.: 0800-246 66 51 · Fax: 0800-246 66 [email protected] · www.biomol.com 17
18 Unless otherwise specified, all products are for Research Use Only. Not for use in diagnostic or therapeutic procedures.
A Practical Guide For Use of PE and APC In Flow Cytometry
For pricing information please visit: www.biomol.com
Flow cytometry and fluorescence activated cell sorting (FACS) have
enabled an unprecedented level of analysis in cell biology. With these
tools, entire cell populations can be screened and characterized
on a cell-by-cell basis for specific, biologically-significant traits. It
has become trivial to determine the percentage of viable cells in a
given population, or to quantify the presence of a particular protein
or marker. Indeed, flow cytometry provides a degree of specificity
unachievable by traditional microplate reader platforms and with
a practicality not afforded to microscopy. But perhaps the greatest
advantage of flow cytometry is the ease by which multi-factor
analysis can be accomplished.
Since its inception, researchers have been interested in flow
cytometry’s capability for multi-factor analysis. Due to the nature
of flow cytometry (ie. single-cell analysis), it becomes possible to
co-monitor several cellular events simultaneously within any given
cell. For example, a cell can be screened for both apoptosis and
surface marker expression. Because many biological processes are
co-dependent and occur in tandem, the ability to study multiple
variables in parallel is clearly advantageous.
In flow cytometry, multi-factor analysis, or multiplexing, is
accomplished through the use of several fluorescent probes
simultaneously. These fluorescent probes differ in their “color”, that
is, the wavelength at which they emit fluorescent light. Fluorescent
probes are typically chosen for their brightness, expressed as the
stain index, and their spectral separation from other probes in
the multiplex panel. Of potential fluorophores, PE and APC have
found great success in flow cytometry, both due to their individual
brightness as well as their ability to create spectral separation when
implemented as tandem dyes.
A Practical Guide For Use of PE and APC In Flow Cytometry
www.aatbio.com • [email protected] Tel: 800-990-8053 • Fax: 408-733-1304
Figure 5.1 Representation of two covalently attached fluorescent molecules that make up a tandem dye. One fluorescent molcule serves as the donor and the other as an acceptor. A tandem dye behaves as a unique fluorophore with excitation properties of the donor and the emission properties of the acceptor.
2017, 6 (2) • AssayWise LettersUnless otherwise specified, all products are for Research Use Only. Not for use in diagnostic or therapeutic procedures. 19
Technology Review
A Practical Guide For Use of PE and APC In Flow Cytometry
Tel.: 0800-246 66 51 · Fax: 0800-246 66 [email protected] · www.biomol.com

A Practical Guide For Use of PE and APC In Flow Cytometry
Unless otherwise specified, all products are for Research Use Only.
For pricing information please visit: www.biomol.com
Pe & aPcPhycoerythrin (PE) and allophycocyanine (APC) are members
of a protein family called phycobiliproteins. This family of
proteins is present in photosynthetic organisms, such as algae
and cyanobacteria. In nature, they typically act as accessory
proteins to chlorophyll pigments in photosynthesis. Structurally,
phycobiliproteins are comprised of a protein complex covalently
bound to phycobilins, the part which captures light energy. For use
in flow cytometry, PE and APC are extracted from red algae and
purified.
Phycoerythrin (PE) is available in two forms: R-PE and B-PE, though
R-PE has found more use in flow cytometry (because of this, the
shorthand PE is often used interchangeably with R-PE). PE has a
molecular weight of 240,000 Daltons, with an extinction coefficient
of 1,500,000 cm-1 M-1 and a quantum yield (Φ) of 0.84. PE is
maximally excited at 565 nm (with a secondary maximum at 495
nm) and emits at 573 nm, which is in the yellow-orange region of
the visible spectrum. For comparison, free Cy3, which also fluoresces
in the yellow-orange spectrum region, has an extinction coefficient
of 150,000 cm-1 M-1 and a quantum yield of 0.20 (Φ ≈ 0.40 when
bound to DNA). Thus, compared to Cy3, PE is much “brighter”. In fact,
PE is, across most experimental conditions, the brightest fluorophore
available for flow cytometry.
Allophycocyanine (APC) is a 105 kDa protein, with an extinction
coefficient of 700,000 cm-1 M-1 and a quantum yield (Φ) of 0.68.
APC is maximally excited at 652 nm (with a secondary maximum at
625 nm) and emits at 658 nm. Its fluorescence falls in the red region
of the visible spectrum. Compared to PE, APC is not as “bright”.
This is due in part to its lower extinction coefficient and quantum
yield. It is also because APC is red-shifted compared to PE. Thus, the
light source used to maximally excite APC will contain less energy
than the one used to maximally excite PE. Compared to other red
fluorophores such as Cy5, however, APC is still significantly brighter
and an excellent choice for use in flow cytometry.
PreParation of Pe and aPc for use in flow cytoMetry
In order to be used for flow cytometry, PE or APC must first be
conjugated to an antibody. The antibody serves as the detector for
the target of interest, while the PE or APC acts as the reporter which
translates the detected event into a quantifiable signal. Traditional
methods of PE or APC conjugation to antibodies involve activation
of PE or APC with SMCC. While not detailed here, the general process
is as follows:
1. Activate the reporter (PE or APC) with SMCC
2. Reduce the detector (antibody or protein) with DTT
3. Mix activated reporter with reduced detector
4. Purify bioconjugate using dialysis
Though an established method, SMCC-based conjugation does
suffer from several drawbacks. First, the conjugation efficiency
is typically low, with a good yield resting at approximately 30%
recovery. A second drawback is the need to reduce the antibodies
with DTT, which may significantly impact their function. Finally,
because the efficiency of SMCC-based reactions are typically low,
very high concentrations of reactants (ie. PE and antibody) are
required for adequate reactivity.
There are several alternatives to SMCC chemistry. These alternatives
typically rely on first conjugating the reporter and detector
independently, each with a different tag. These tags are typically
chosen for their high affinity and specificity for each other and only
each other, such that when the tagged reporter and detector are
900800700600500400300
100
80
60
40
20
0
rela
tive
inte
nsit
y (%
)
wavelength (nM)
900800700600500400300
100
80
60
40
20
0
rela
tive
inte
nsit
y (%
)
wavelength (nM)
Figure 5.2 Absorption and emission spectrum of PE (Cat#2556). Exciations at 488 nm (Blue laser line) and 568 nm (Green laser line). PE read with emission filter Cy3/TRITC (Yellow band).
Figure 5.3 Absorption and emission spectrum of APC (Cat#2554). Exciations at 594 nm (Orange laser line) and 633 nm (Red laser line). PE read with emission filter Cy5 (Red band).
www.aatbio.com • [email protected] Tel: 800-990-8053 • Fax: 408-733-1304
20 Unless otherwise specified, all products are for Research Use Only. Not for use in diagnostic or therapeutic procedures.AssayWise Letters • 2017, 6 (2)
Technology Review
Tel.: 0800-246 66 51 · Fax: 0800-246 66 [email protected] · www.biomol.com 19

20 Unless otherwise specified, all products are for Research Use Only. Not for use in diagnostic or therapeutic procedures.
A Practical Guide For Use of PE and APC In Flow Cytometry
For pricing information please visit: www.biomol.com
mixed, the tags bind, forming a bioconjugate between the reporter
and the detector.
One fairly established usage of this type of tagging is the biotin-
streptavidin conjugation system. In this system, an antibody is
tagged, or labeled, with biotin. The detector, for example PE, is then
labeled with streptavidin. Because of biotin’s and streptavidin’s high
affinity for each other, they form a strong covalent bond, ultimately
resulting, in this case, in an antibody-PE bioconjugate.
A second alternative to SMCC chemistry is AAT Bioquest’s Buccutite™
technology. Similar to the biotin-streptavidin conjugation system,
Buccutite™ technology relies on two separate tags: MTA and FOL.
These two tags are independently labeled onto the reporter and
detector, respectively, and when mixed will bind strongly to each
other, resulting in a reporter-detector bioconjugate. Compared to
other conjugation chemistries, Buccutite™ offers several unique
advantages. First, Buccutite™ reactions typically have much higher
yields, with final recovery more than double (>60%) that of SMCC
methods. Moreover, because the reaction between MTA and FOL
is very efficient, reactions can occur at very low concentrations of
reactants (ie. <1 mg/mL of antibody).
Usage of PE and APC in flow cytometry
While the actual experimental procedure will differ depending on
the experiment, there are some general guidelines to follow when
using PE and APC for flow cytometry.
1. Determine the equipment specifications
The successful usage of PE and APC depends on the available laser
and filter sets of the flow cytometer. For PE, this is typically a non-
issue. This is because, while PE has a maximal excitation at 565 nm,
it also has a secondary maximum at 495 nm. Thus, if the 568 nm
krypton laser is not available, the extremely common 488 argon
laser will suffice. For emission filter selection, PE can be read using
the Cy3/TRITC filter (590/40).
For APC, the excitation source can vary depending on the available
lasers. The 594 nm or 633 nm laser line are suitable. For emission
filters, the Cy5 filter (660/40) is recommended.
2. Determine if compensation is necessary
For multicolor analysis, compensation may be required before
analyzing data. This is because two or more fluorophores may
have overlapping emission spectra. In such cases, any signal read
may in fact be due to the combination of multiple individual
signals. Compensation accounts for this overlap by mathematically
removing signals that “spillover” into the main signal of interest.
Consider the following flow cytometry panel:
Here, there is a portion of spectral overlap between the PE
emission and the propidium iodide (PI) emission. To account for,
and remove the signal overlap, is the basis of compensation. Most
modern instrumentation and software can automatically perform
compensation if given the control parameters. In the case of the
above example, this would entail first performing a run with just PE
stained cells, then performing a run with just PI stained cells, before
finally performing the two-color analysis.
While modern technology has made the compensation process
much easier, choosing the right fluorophore can also minimize the
need to perform compensation to begin with. Here, advancements
in tandem dyes play a big role.
100
300 400 500 600 700 800 900
rela
tive
inte
nsit
y (%
)
wavelength (nM)
0
20
40
60
80
Figure 5.4 Representation of overlapping emission spectra of PE (Yellow, Cat#2556) and PI (Red, Cat#17516). The portion of spectral overlap between the PE emission and PI emission is represented by the orange shaded region between the yellow and red curves. Multicolor analysis may require compensation prior to data analysis. Compensation accounts for this overlap by removing signals that "spillover" into the main signal of interest.
www.aatbio.com • [email protected] Tel: 800-990-8053 • Fax: 408-733-1304
2017, 6 (2) • AssayWise LettersUnless otherwise specified, all products are for Research Use Only. Not for use in diagnostic or therapeutic procedures. 21
Technology Review
Tel.: 0800-246 66 51 · Fax: 0800-246 66 [email protected] · www.biomol.com

A Practical Guide For Use of PE and APC In Flow Cytometry
Unless otherwise specified, all products are for Research Use Only.
For pricing information please visit: www.biomol.com
Use as tandem dyes
Tandem dyes refer to compounds in which two different
fluorophores have been covalently linked. In this conformation, the
excitation of one fluorophore (termed the “donor”) results in the
transfer of energy to, and the fluorescing of, the other (termed the
“acceptor”). This transfer of energy from donor to acceptor occurs
through Förster resonance energy transfer, or FRET. Though not
elaborated upon here, the mechanism of FRET and its application in
biological probes is well documented. In particular, FRET has been
applied very successfully in studies of nucleotides and peptides.
More recently, however, there has been an explosion of interest in
FRET-based flow cytometry applications, particularly with PE and
APC based tandem dyes.
The reason PE and APC based tandem dyes are particularly useful in
flow cytometry is because of their unusually large Stoke’s shifts. The
Stoke’s shift refers to the distance between the maximal excitation
and the maximal emission. For a typical fluorophore, this difference
is small, ranging between 10 to 50 nm on average. PE and APC based
tandem dyes can achieve Stoke’s shifts in the hundreds, depending
on the fluorophore pair used. The large Stoke’s shifts of tandem
dyes is extremely valuable when design multicolor flow cytometry
panels.
Consider the following three flow cytometry panels:
Panel A has good spectral separation amongst the three fluorophores;
the three emission peaks are fairly far apart. This means that minimal
compensation is required. However, because the three fluorophores
have varying excitation maximums, an optimal experimental setup
will require three different laser sources. This in practice is both
expensive and inconvenient to set up.
Panel B has three fluorophores that can all be well excited by a singular
laser source. In this case, the three fluorophores can all be excited by
the extremely common 488 nm argon-ion laser. Thus in practice, the
instrumentation for such a panel is fairly straightforward. However,
panel B suffers from extensive spectral overlap; the emission peaks
are too close. Such a panel will require very complex compensation
calculations, if such calculations can be done at all.
Panel C demonstrates the power of tandem dyes (PE-Cy5 and PE-
Cy7). In this panel, all three fluorophores can be well excited by the
same laser line, as in panel B. However, unlike panel B, the three
fluorophores demonstrate excellent spectral separation. This, as
mentioned prior, is due to the large Stoke’s shifts of the tandem dyes
(171 nm and 283 nm). In panel C, the advantage of tandem dyes
becomes evident, namely, tandem dyes allow for the use of multiple
fluorophores that share an excitation maximum but do not require
extensive compensation.
Fluorophore Excitation (nm) Emission (nm) Stoke’s shift (nm)FITC 489 515 26
Cy5 554 568 14
Cy7 650 669 19
Panel a
Fluorophore Excitation (nm) Emission (nm) Stoke’s shift (nm)FITC 489 515 26
GFP 489 508 19
Alexa Fluor® 488 499 520 21
Panel b
Fluorophore Excitation (nm) Emission (nm) Stoke’s shift (nm)FITC 489 515 26
PE-Cy5 495 666 171
PE-Cy7 495 778 283
Panel c
www.aatbio.com • [email protected] Tel: 800-990-8053 • Fax: 408-733-1304
22 Unless otherwise specified, all products are for Research Use Only. Not for use in diagnostic or therapeutic procedures.AssayWise Letters • 2017, 6 (2)
Technology Review
Tel.: 0800-246 66 51 · Fax: 0800-246 66 [email protected] · www.biomol.com 21

22 Unless otherwise specified, all products are for Research Use Only. Not for use in diagnostic or therapeutic procedures.
A Practical Guide For Use of PE and APC In Flow Cytometry
For pricing information please visit: www.biomol.com
Tandem Dye Excitation (nm) Emission (nm) Stoke's shift (nm)PE-Cy5 495 666 171
PE-Cy5.5 495 672 177
PE-Cy7 495 778 283
PE-Alexa Fluor 647 495 666 171
PE-iFluor™ 700 495 722 227
PE-Texas Red 495 613 118
PE-Alexa Fluor 750 495 779 284
APC-Cy5.5 625 700 75
APC-Cy7 625 779 154
APC-Alexa Fluor 750 625 785 160
APC-iFluor™ 700 625 710 85
APC-iFluor™ 750 625 791 166
Preparation of PE and APC tandem dyes
The common method of synthesizing tandem dyes is through use of succinimidyl
esters (also called NHS esters). This is a common method to label small molecule
fluorophores onto proteins and antibodies. In this method, the small molecule
fluorophore becomes reactive due to the addition of the succinimidyl ester (SE)
functional group. The fluorophore-SE then reacts to free amine groups on PE or
APC, forming a covalent bond. Once the PE or APC tandem dye is synthesized, it can
then be conjugated to an antibody using SMCC or related chemistries as mentioned
previously.
Reactive succinimidyl esters of common small molecule fluorophores such as FITC, Cy
dyes, Alexa Fluors and iFluors can be directly purchased. For convenience purposes,
conjugated tandem dyes (such as PE-Cy5) and activated, conjugated tandem dyes
(such as Buccutite™ PE-Cy5) are also available for purchase.
100
101 102 103 104 105 106 107.2
80
60
40
20
0
coun
t (%
)
aPc - cy7 - h
Figure 5.6 Flow cytometry analysis of HL-60 cells stained with 1ug/ml Mouse IgG2a control (Green) or with 1ug/ml Anti-Human HLA-ABC (Red) and then followed by Goat Anti-Mouse IgG-APC-Cy7 conjugate prepared with Buccutite™ Rapid APC-Cy7 Tandem Antibody Labeling Kit (Cat#1321).
900800700600500400300
100
80
60
40
20
0
rela
tive
inte
nsit
y (%
)
wavelength (nM)
Figure 5.5 Abosrption and emission spectra of FITC (Green), PE-Cy5 (Orange) and PE-Cy7 (Red). All three fluorophores can be well excited by the 488 nm laser line (Blue) with excellent spectral seperation.
Table 5.1 Some common PE and APC tandem dyes
coun
t (%
)
100
101 102 103 104 105 106 107.2
80
60
40
20
0
Pe - cy5Figure 5.7 Flow cytometry analysis of HL-60 cells 1ug/ml stained with Mouse IgG2a Control or with 1ug/ml Anti-Human HLA-ABC and then followed by Goat Anti-Mouse IgG-PE-Cy5 conjugate prepared with Buccu-tite™ Rapid PE-Cy5 Tandem Antibody Labeling Kit (Cat#1315).
www.aatbio.com • [email protected] Tel: 800-990-8053 • Fax: 408-733-1304
2017, 6 (2) • AssayWise LettersUnless otherwise specified, all products are for Research Use Only. Not for use in diagnostic or therapeutic procedures. 23
Technology Review
Tel.: 0800-246 66 51 · Fax: 0800-246 66 [email protected] · www.biomol.com

A Practical Guide For Use of PE and APC In Flow Cytometry
Unless otherwise specified, all products are for Research Use Only.
For pricing information please visit: www.biomol.com
References
1. Autissier, Patrick, et al. "Evaluation of a 12‐color flow cytometry panel to study lymphocyte, monocyte, and dendritic cell subsets in humans." Cytometry Part A 77.5 (2010): 410-419.
2. Baumgarth, Nicole, and Mario Roederer. "A practical approach to multicolor flow cytometry for immunophenotyping." Journal of immunological methods 243.1 (2000): 77-97.
3. Roederer, Mario, et al. "Cy7PE and Cy7APC: bright new probes for immunofluorescence." Cytometry Part A 24.3 (1996): 191-197.
4. Sanborn, Matthew E., et al. "Fluorescence properties and photophysics of the sulfoindocyanine Cy3 linked covalently to DNA." The Journal of Physical Chemistry B 111.37 (2007): 11064-11074.
5. Schmid, Ingrid, et al. "Dead cell discrimination with 7‐amino‐actinomcin D in combination with dual color immunofluorescence in single laser flow cytometry." Cytometry 13.2 (1992): 204-208.
6. Strickler, S. J., and Robert A. Berg. "Relationship between absorption intensity and fluorescence lifetime of molecules." The Journal of chemical physics 37.4 (1962): 814-822.
Additional Resources
The Spectrum Viewer is a web-based tool for comparing a
comprehensive library of fluorophores. This proves useful when
designing flow cytometry panels. It can be used to determine
if two fluorophores have spectral overlap and if compensation
will be required. It can also be used to determine which of similar
fluorophores is most suited for an experimental instrumentation.
The Degree of Labeling Calculator is a web-based tool used
for determining the number of dyes conjugated to a particular
protein. The DOL is an important quantity when trying to optimize
an experiment. Typically, too many dyes labeled onto a protein
will result in a quenching effect, reducing the fluorescence of
the conjugate. On the other hand, too few dyes will also result in
decreased fluorescence intensity. The DOL Calculator can be used to
monitor the optimal conjugation ratio.
Cat # Product Name Unit Size Excitation (nm) Emission (nm)
2554 APC [Allophycocyanin] 1 mg 651 662
2622 APC-Cy5.5 Tandem 1 mg 651 700
2625 APC-Cy7 Tandem 1 mg 651 780
1311 Buccutite™ Rapid APC Antibody Labeling Kit *Microscale Optimized for Labeling 100 ug Antibody Per Reaction* 2 Labelings 651 662
1320 Buccutite™ Rapid APC-Cy5.5 Tandem Antibody Labeling Kit *Microscale Optimized for Labeling 100 ug Antibody Per Reaction* 2 Labelings 651 700
1350 Buccutite™ Rapid APC-Cy5.5 Tandem Antibody Labeling Kit *Microscale Optimized for Labeling 25 ug Antibody Per Reaction* 2 Labelings 651 700
1321 Buccutite™ Rapid APC-Cy7 Tandem Antibody Labeling Kit *Microscale Optimized for Labeling 100 ug Antibody Per Reaction* 2 Labelings 651 780
1351 Buccutite™ Rapid APC-Cy7 Tandem Antibody Labeling Kit *Microscale Optimized for Labeling 25 ug Antibody Per Reaction* 2 Labelings 651 780
1319 Buccutite™ Rapid APC-iFluor™ 700 Tandem Antibody Labeling Kit *Microscale Optimized for Labeling 100 ug Antibody Per Reaction* 2 Labelings 651 713
1347 Buccutite™ Rapid APC-iFluor™ 700 Tandem Antibody Labeling Kit *Microscale Optimized for Labeling 25 ug Antibody Per Reaction* 2 Labelings 651 713
1310 Buccutite™ Rapid PE Antibody Labeling Kit *Microscale Optimized for Labeling 100 ug Antibody Per Reaction* 2 Labelings 565 575
1340 Buccutite™ Rapid PE-Cy5 Tandem Antibody Labeling Kit *Microscale Optimized for Labeling 25 ug Antibody Per Reaction* 2 Labelings 565 674
1316 Buccutite™ Rapid PE-Cy5.5 Tandem Antibody Labeling Kit *Microscale Optimized for Labeling 100 ug Antibody Per Reaction* 2 Labelings 565 700
1341 Buccutite™ Rapid PE-Cy5.5 Tandem Antibody Labeling Kit *Microscale Optimized for Labeling 25 ug Antibody Per Reaction* 2 Labelings 565 700
1317 Buccutite™ Rapid PE-Cy7 Tandem Antibody Labeling Kit *Microscale Optimized for Labeling 100 ug Antibody Per Reaction* 2 Labelings 565 780
1342 Buccutite™ Rapid PE-Cy7 Tandem Antibody Labeling Kit *Microscale Optimized for Labeling 25 ug Antibody Per Reaction* 2 Labelings 565 780
1318 Buccutite™ Rapid PE-Texas Red Tandem Antibody Labeling Kit *Microscale Optimized for Labeling 100 ug Antibody Per Reaction* 2 Labelings 565 600
2558 PE [R-Phycoerythrin] *CAS 11016-17-4* 1 mg 565 575
2610 PE-Cy5 Tandem 1 mg 565 670
2613 PE-Cy5.5 Tandem 1 mg 565 700
2616 PE-Cy7 Tandem 1 mg 565 780
2619 PE-Texas Red Tandem 1 mg 565 600
Product ordering information for aPc, Pe and tandem dyes
www.aatbio.com • [email protected] Tel: 800-990-8053 • Fax: 408-733-1304
24 Unless otherwise specified, all products are for Research Use Only. Not for use in diagnostic or therapeutic procedures.AssayWise Letters • 2017, 6 (2)
Technology Review
Tel.: 0800-246 66 51 · Fax: 0800-246 66 [email protected] · www.biomol.com 23

Your Distributor:BIOMOL GmbH Kieler Straße 303a 22525 Hamburg · Germany [email protected] · www.biomol.de · www.biomol.comFon: 040-853 260 0 Fax: 040-853 260 22
TOLL FREE IN GERMANY: Fon: 0800-246 66 51 Fax: 0800-246 66 52

SIE HABEN DIE VISION,WIR HABEN DIE SUBSTANZ.
Notes

BIOMOL GmbH Kieler Straße 303a · 22525 Hamburg · Germany [email protected] · www.biomol.de · www.biomol.comTel. 040-853 260 0 · Fax 040-853 260 22 Gebührenfrei: Tel. 0800-246 66 51 · Fax 0800-246 66 52
SIE HABEN DIE VISION,WIR HABEN DIE SUBSTANZ.
2018