volume 42, number 4, pages 79–94 july/august 2005 ... · speech signals used to evaluate...
TRANSCRIPT

JRRDJRRD Volume 42, Number 4, Pages 79–94
July/August 2005, Supplement 2
Journal of Rehabil itation Research & Development
Speech signals used to evaluate functional status of the auditory system
Richard H. Wilson, PhD;1* Rachel McArdle, PhD21James H. Quillen Department of Veterans Affairs (VA) Medical Center, Mountain Home, TN; 1Departments of Surgery and Communicative Disorders, East Tennessee State University, Johnson City, TN; 2VA Medical Center, Bay Pines, FL; 2Department of Communication Sciences and Disorders, University of South Florida, Tampa, FL
Abstract—This review presents a brief history of the evolution of speech audiometry from the 1800s to present day. The two-component aspect of hearing loss (audibility and distortion), which was formalized into a framework in past literature, is pre-sented in the context of speech recognition. The differences between speech recognition in quiet and in background noise are discussed as they relate to listeners with normal hearing and listeners with hearing loss. A discussion of the use of sentence materials versus word materials for clinical use is included as is a discussion of the effects of presentation level on recognition performance in quiet and noise. Finally, the effects of age and hearing loss on speech recognition are considered.
Key words: aging, audibility, distortion, hearing aid, hearing loss, multitalker babble, signal-to-noise ratio, speech in noise, speech perception, speech recognition.
INTRODUCTION
This review focuses on speech signals used to evalu-ate the ability of patients to understand spoken word or sentence materials. Several aspects of speech paradigms and the implications of those paradigms are presented, including—1. A brief history of speech signals used to evaluate
auditory function.2. The two-component characteristics of hearing loss
and their relation to understanding speech.3. Speech recognition in quiet and in background noise.4. The use of words versus sentences to define speech-
recognition performance.
5. The effect of presentation level on speech recognition in quiet and in background noise.
6. The effects of age and hearing loss on speech recognition.
HistoryThe auditory system has two main functions in every-
day life. First, the auditory system constantly monitors the acoustic environment, thereby providing, among other things, alerts to danger signals. Second, the auditory system provides a critical link in communication activities.
Abbreviations: CID = Central Institute for the Deaf, CST = Connected Speech Test, HINT = Hearing in Noise Test, HL = hearing level, NU-6 = Northwestern University Auditory Test No. 6, PTA = pure-tone average, QuickSINTM = Quick Speech-in-Noise Test, S/B = signal-to-babble (ratio), SNR = signal-to-noise ratio, SPIN = Speech Perception in Noise (test), SPL = sound pressure level, VA = Department of Veterans Affairs, WIN = Words in Noise (test).This material is based on work supported by a Rehabilita-tion Research and Development Service, VA Merit Review, grant C2959R; the Auditory and Vestibular Dysfunction Research Enhancement Award Program; a Senior Research Career Scientist Award to the first author, grant C2400-S; and a Research Career Development Award to the second author, grant C3800R.*Address all correspondence to Richard H. Wilson, PhD; VA Medical Center, Audiology (126), P.O. Box 4000, Mountain Home, TN 37684; 423-979-3561; fax: 423-979-3403. Email: [email protected]: 10.1682/JRRD.2005.06.0096
79

80
JRRD, Volume 42, Number 4, 2005, Supplement 2
In general, the monitoring function involves rather gross auditory functions, whereas the communication function involves rather refined auditory functions. Although hear-ing loss affects both auditory functions, hearing loss has the most detrimental impact on the communication aspect in modern society. The importance of understanding speech has been discussed in the literature for more than 100 years. This article summarizes “how we got where we are today” with the use of speech materials to evaluate auditory function.
In 1891, Gruber emphasized the importance of speech in the following quote:
Oscar Wolf considers this [speech] the most per-fect method of testing the hearing power, inas-much as it embodies the most delicate shades in the pitch, intensity, and character of sound. Hart-mann thinks, on the contrary, that the [speech] test is too complicated to insure accuracy. In any case it [speech measurements] is indispensable, from the fact that nearly every patient seeks relief from disability in respect of it, and there-fore for social intercourse. It is desirable, in esti-mating the degree of perception for speech, to test first of all both ears simultaneously, even though only one be affected; proceeding after-wards to the examination of each [ear] in turn. A separate examination of the hearing power should be made for each ear, even if previous testing by the watch and the tuning-fork has indi-cated an equally diminished hearing capacity on both sides; since experience shows that the per-ception for speech is not always deficient in the same measure as that for simple noises and tones. Cases indeed occur in which conversation is best heard on that side on which the watch and tuning-fork are not perceived so well as on the other, and vice versa. The repetition [repeating] of the test-words gives the best control for the percep-tion of them [1, p. 131–32].So early on, the otology community realized that
hearing should be evaluated in the ears separately and together and that measures of speech understanding are just as important as frequency-specific information, which was obtained with tuning forks in those days. The refine-ment of these tone and speech tests paralleled develop-ments in the communication/electronic industry. For example, in 1876 Alexander Graham Bell developed the transducer that converted sound energy into electrical
energy and vice versa. In 1883, Edison developed thevacuum-tube concept that led to the creation of the elec-tronic amplifier by Lee de Forest in the early 1900s. Shortly after the invention of the phonograph in 1889, Lichtwitz [2] proposed the application of the device to the evaluation of hearing [3]; Bryant made a similar proposal in 1904 [4]. In 1910, Campbell described a nonsense-syllable paradigm that used recognition performance to evaluate telephone circuits [5]. In 1924, Jones, an otolo-gist, and Knudsen, a physicist, developed an audiometer that electronically generated pure tones for air- and bone-conduction testing and that used two vacuum tubes and an attenuator to vary the presentation level of speech materi-als [6]. At the same time, Fletcher introduced the Western Electric 4A audiometer, which incorporated a phonograph with recorded digit materials [7].
Following the examples established by researchers such as Campbell [5] and Crandall [8], Fletcher and Steinberg, in their classic 1929 article, developed the principles of test construction and implementation of speech-recognitionmaterials that have been followed for over 75 years [9]. The application of these principles during and shortly after World War II at places such as the Harvard Psychoacoustic Laboratory and Deshon General Hospital (Army) crystal-lized the formation of audiology as we know it today. The basic word lists used in speech audiometry were devised during this time. Hudgins et al. [10] developed the spon-daic word lists that were subsequently modified by Hirsh et al. [11] (under contract to the Navy and Veterans Administration [now the Veterans Health Administration or VHA]) into the Central Institute for the Deaf (CID) W-1 (and W-2) list of 36 spondaic words used today to establish speech-recognition thresholds. Concurrently, Egan devel-oped 20 PB-50 word lists [12], each consisting of 50 monosyllabic words. Again, Hirsh et al. modified the monosyllabic word lists for the CID W-22 materials that consisted of four 50-word lists. The CID W-1, W-2, and W-22 materials were recorded by Hirsh and available on33 1/3 rpm vinyl records that the Veterans Administration used until the early 1980s. Partially because of reports that the CID W-22 materials did not differentiate among various types and degrees of hearing loss, Tillman and Carhart developed the Northwestern University Auditory Test No. 6 (NU-6) [13], which also was composed of four 50-word lists of monosyllables. The CID materials and NU-6, all of which were recorded for use in quiet, form the main-stay of speech materials used to this day by audiologists. Efforts have only recently been made to incorporate

81
WILSON and MCARDLE. Speech signals used to evaluate auditory function
speech-in-noise testing into the routine audiologicalevaluation. (Feldmann provides an extensive history of the development of the field that we now call audiology [14].)
Two-Component Characteristics of Hearing LossIn the 1951 seminal article on speech audiometry, Car-
hart recognized two types of hearing loss [15]. The first type was a “loss of acuity” that Carhart described as a direct-current shift or displacement of the “articulation function” to the right of that for a listener with normal hearing. The second type was “a deficiency in the clarity with which speech is received.” Carhart indicated that, regardless of the presentation level of the speech signal, the clarity of hearing in this second type of loss could not be changed substantially. Some years later, Stephens men-tioned the same two types of hearing loss [16], referring to them as “a simple attenuation” such as in a conductive hearing loss and “major distortions” such as observed in cochlear hearing loss. Subsequently, Plomp formalized these concepts into a framework that included an audibility component (loss of acuity [Carhart] and attenuation [Stephens]) and a distortion component (clarity [Carhart] and distortion [Stephens]) [17].
The audibility component, which is predominately lin-ear and predictable, is quantified with sensitivity measures (e.g., pure-tone and speech-recognition thresholds) and to some degree by measures of word recognition in quiet. The audibility component of a hearing loss is usually cor-rected with amplification. The distortion component, which is nonlinear and unpredictable, must be measured directly [18]. The distortion component manifests itself as a reduced ability to understand speech, especially in back-ground noise and regardless of the presentation level. Therefore, the distortion component can be evaluated with a speech-in-noise task that measures signal-to-noise hear-ing loss, which typically is the signal-to-noise ratio (SNR) at which 50 percent of words are recognized correctly [17,19–20]. When viewed in this manner, for communica-tion purposes, the distortion component of hearing loss mainly involves an issue of SNR. The degree to which the distortion component disrupts communication prompted Plomp and Duquesnoy to note that “a hearing loss for speech in noise of 3 dB is more disturbing than a hearing loss for speech in quiet of 21 dB [21, p. 101].” The distor-tion component, which is not as easily corrected as the audibility component, remains the focus of research in the hearing aid industry. Hopefully, hardware and algorithms of signal-processing strategies will be developed to
improve the “clarity” of the speech signal even in the pres-ence of background noise.
SPEECH RECOGNITION IN QUIET AND IN NOISE
Most audiologists acknowledge that the most common complaint of adult patients about their hearing loss is their inability to understand speech in the presence of back-ground noise, especially background noise composed of multiple speech sources. Patient complaints of difficulty understanding speech in background noise are a charac-teristic manifestation of the distortion component of hearing loss. Thirty-five years ago, Carhart and Tillman suggested that the communication handicap imposed by sensorineural hearing loss was not only characterized by a hearing loss in the threshold for speech and a “discrimi-nation” loss in listening to speech in quiet, but also in “the masking efficiency of competing speech and other background sounds that plague the patient when he is in complex listening environments [22, p. 279],” i.e., the ability of the listener to understand speech in background noise. This observation was precipitated by experimental evidence that listeners with sensorineural hearing loss functioned at 10 to 15 dB disadvantages compared with listeners with normal hearing when listening in a back-ground of competing speech noise [22–24]. Carhart and Tillman urged that audiological evaluations include the use of an instrument that quantified the ability (or inabil-ity) of listeners to understand speech in a background of speech noise [22].
In a recent survey, Strom found that less than half of dispensing professionals use some type of speech-in-noise task to evaluate the ability of their patients to understand speech in background noise [25]. A speech-in-noise task has typically not been included in audiological evaluations for several reasons. First, unlike the tests of word-recognition abilities in quiet for which a plethora of normative data exists, no standardized tests of word-recognition ability in background noise are readily avail-able. As will be discussed in the subsequent section, sen-tence materials presented in background noise have been developed, particularly for research, but have not been implemented clinically. Second, audiology educational programs have traditionally emphasized assessing the ability of patients to understand speech, usually monosyl-labic words, presented in quiet. Third, audiologists, like everyone else, are resistant to changes. The evaluation of

82
JRRD, Volume 42, Number 4, 2005, Supplement 2
the ability of a listener to understand speech in back-ground noise is a big change in most audiology settings. Finally, time spent with the patient is a major issue. The inclusion of a speech-recognition task in noise would add to the length of an evaluation.
Why should a speech-in-noise task be included in an audiological evaluation? First, the metric addresses the most common complaint of patients, i.e., their inability to understand speech in background noise. Second, the data provide insight into the most appropriate amplification strategy for the patient. Third, and equally important, speech-in-noise results can be used when counseling patients, especially regarding their expectations about the benefits of a hearing aid when listening in background noise. For the most part, the speech-in-noise instrument has been dormant in audiology clinics for the past 35 years.Only recently has a revival occurred in the use of proto-cols evaluating the ability of patients to understand speech in background noise.
In general terms, the ability of a patient to understand speech can be inferred by the degree and configuration of the pure-tone audiogram. However, exceptions to this relation make exact predictions of word-recognition per-formance from the pure-tone audiogram tenuous. If the hearing loss only involved the linear attenuation compo-nent of hearing loss, then the prediction of speech-rec-ognition ability in quiet from pure-tone data would be straightforward and achieved with fairly good accuracy. The various versions of the articulation index are exam-ples [26–28]. When the hearing loss includes a nonlinear distortion component, however, the ability to predict speech-recognition ability from pure-tone data is dimin-ished. The involvement of both the attenuation and dis-tortion components compound hearing loss to make predicting word-recognition performance in quiet from pure-tone sensitivity data difficult.
Another prediction that is perhaps more difficult to make is word-recognition performance in background noise from recognition performance in quiet. The data in Figure 1 from 387 listeners with sensorineural hearing loss illustrate this point. The data, which were jittered (offset) for graphic clarity with a multiplicative algorithm between 0.975 and 1.025, were compiled from two stud-ies [29–30]. The percent correct word-recognition perfor-mance in quiet at a presentation level of 80 dB hearing level (HL) is shown as a function of the 50 percent point (decibel signal-to-babble [S/B] ratio) obtained with the Words in Noise (WIN) test, which uses the same words
and speaker as the quiet condition [20]. The 80 dB HL presentation level in quiet corresponds to the 20 dB S/B presentation level of the WIN test. The mean correct word-recognition in quiet for the listeners with hearing loss was 84.6 percent (standard deviation [SD] = 14.0). The shaded area of the figure defines the range of perfor-mances obtained by listeners with normal hearing on the WIN test [31]. The 90th percentile for the listeners with normal hearing was 6 dB S/B.
The data in Figure 1 suggest four relations. First, four listeners with sensorineural hearing loss performed in the normal range on both the quiet and noise tasks. The remain-ing 383 listeners had a mean performance on the WIN of 12.5 dB S/B which, with reference to the 90th percentile for listeners with normal hearing (6.0 dB S/B), yielded a
Figure 1.Percent correct word-recognition performance in quiet at 80 dB hearing level (HL) (ordinate) versus 50% point recognition performance (decibel signal-to-babble [S/B] ratio) in multitalker babble on Words in Noise (WIN) test (abscissa). Shaded area defines performance range (10th–90th percentiles) on WIN by listeners with normal hearing. Numbers within plot are number of listeners (percent) with word recognition in quiet ≥90%, ≥80%, and ≤70% correct on WIN. Sources:McArdle RA, Wilson RH, Burks CA. Speech recognition in multitalker babble using digits, words, and sentences. J Am Acad Audiol. 2005;16:726–39. McArdle RA, Chisolm TH, Abrams HB, Wilson RH, Doyle PJ. The WHO-DAS II: measuring outcomes of hearing aid intervention for adults. Trends Amplif. 2005:9:127–43.

83
WILSON and MCARDLE. Speech signals used to evaluate auditory function
mean 6.5 dB S/B hearing loss (the range was 6.8 to 23.6 dB S/B). With the W-22 words, Beattie reported a 5 dB S/B difference between performances by listeners with nor-mal hearing and listeners with hearing loss [32]. Interest-ingly, the mean 50 percent point of 12.5 dB S/B is almost identical to those obtained under similar conditions by Dirks et al. (12 dB S/B [33]) and Beattie (11.3 dB S/B [32]). Second, 45.5 percent of the listeners had word-recog-nition performances in quiet at 80 dB HL that were ≥90 percent correct. Third, the 107 listeners with word-recogni-tion performances in quiet between 80 and 90 percent cor-rect had poorer than normal performances on the WIN. Fourth, 26.9 percent of the listeners had word recognition in quiet that was <80 percent correct. Two conclusions can be drawn from the data in Figure 1. First, although the majority of listeners with sensorineural hearing loss operate in the normal range on word recognition in quiet (i.e., ≥80% correct), the vast majority have abnormal perfor-mance on word recognition in background noise. Second, good word recognition in quiet does not indicate good word recognition in background noise. One can safely say, how-ever, that poor word recognition in quiet only produces poorer word recognition in noise.
Use of Words and Sentences in Audiological EvaluationsFor more than 50 years, researchers have been exam-
ining the relationship between words and sentences in speech-recognition performance. Egan was perhaps the first to look at performance differences between words in isolation and in sentences [34]. He found that the same presentation level needed to perform at the 50 percent cor-rect point for a list of words in isolation produced on aver-age, for the same individuals, performance on sentences close to 80 percent correct. Looking at the performance differences in SNR versus overall percent correct, Egan found that the 50 percent point was 4 dB SNR for words in isolation but –2 dB SNR for sentences. Miller et al. [35] and O’Neill [36] also reported an approximate 6 to 7 dB SNR differentiation in speech-recognition performance of words and sentences, with words always requiring a better SNR. The aforementioned studies have two interesting points. First, the absolute value for SNR required for 50 percent correct performance (i.e., −2 to 4 dB SNR) sug-gests that the participants in these studies had normal hear-ing; however, the results suggest that a relative difference exists in the SNR required for words in isolation and for sentences to achieve equal recognition performance. Sec-ond, the difference of 6 to 7 dB SNR between words and
sentences may be a result of the methodology involved in creating the stimulus lists. Apparently, the words in isola-tion were recorded in sentences, then spliced and used in isolation. Extraction of individual words from recorded sentences most likely resulted in the acoustic characteris-tics of coarticulation producing a distorted signal that decreased the recognition of the words in isolation versus embedded in the original sentence recording. In addition, the sentences used in the aforementioned studies [35–36] were highly contextual, which would have facilitated bet-ter recognition performance at a lower SNR compared with isolated words.
To date, several tests of sentences in competing noise have been developed; for example, Speech Perception in Noise (SPIN) test [37], Connected Speech Test (CST) [38], Hearing in Noise Test (HINT) [39], and Quick Speech-in-Noise Test (QuickSINTM) [40]. Each sentence test was constructed differently and thus uses different stimuli, noises, and scoring metrics. SPIN, the oldest of these sentence tests, varies the amount of semantic infor-mation (context) preceding the last word of each sentence, which is the target word. The SNR is determined arbi-trarily and remains fixed throughout the protocol. The SPIN yields a low-predictability score (minimal context) and a high-predictability score (maximal context). In essence, the SPIN test is a word-level measure presented in sentence form that examines the ability of an individual to use context to aid in word recognition. The CST was developed for use as a criterion measure in studies of hear-ing aid benefit. The CST involves passages of multiple sentences containing 50 key words. The sentences arepresented individually with no more than seven key words per sentence. The performance is scored as percent correct recognition of the key words. The HINT and the QuickSINTM are scored as the decibel SNR required to achieve 50 percent correct recognition. The two tests vary in the type of sentences and noise employed. The HINT, which uses the BKB (Bamford-Kowal-Bench) sentences developed on a first-grade reading level in the United Kingdom [41], presents sets of 10 sentences. The listener must repeat the entire sentence correctly to receive credit. Speech-spectrum noise is held constant while the signalis varied to find the 50 percent correct point. TheQuickSINTM uses Institute of Electrical and Electronics Engineers sentences [42] which consist of five target words each that are not easily predicted from the sentence context [43]. Each list contains six sentences that arepresented in multitalker babble using a descending

84
JRRD, Volume 42, Number 4, 2005, Supplement 2
paradigm that starts at 25 dB S/B and decreases in 5 dB increments to 0 dB S/B. In essence, the QuickSINTM
strings several target words together to shorten test time but still maintain the temporal characteristics and coarticu-latory effects of running speech. All of these sentence tests have major differences; therefore, the selection of the appropriate test depends on the performance ability a researcher or clinician is interested in measuring.
The audiology literature does not answer the question of whether to use words or sentences to measure speech-recognition performance. Differing opinions exist; Plomp stated that words are the fundamental unit of speech percep-tion [44], whereas others stated that continuous discourse better represents everyday listening situations [38, 45]. In 1963, Giolas and Epstein stated that monosyllables as speech-recognition stimuli provided diagnostic but not prognostic value such that recognition performance on a list of monosyllables does not approximate how an individual understands conversational speech [46]. Jerger et al. agreed that sentences have better face validity than isolated words as a stimulus for speech recognition since sentences are of a longer duration more closely approximating everyday con-nected speech that constantly changes over time [47]. Finally, Cox et al. reported that monosyllables do not show a relationship between recognition performance and hearing aid benefit because of a lack of lexical, semantic, and syn-tactic redundancies and dynamic cues such as the relative duration of fricatives and vowels that provide probabilistic phonotactic cues aiding recognition of the utterance [38].
Sentences may be a more realistic stimulus type for examination of perception of fluent speech; however, context contributes heavily to intelligibility and makes basic auditory function difficult to determine. Another disadvantage to sentence-length stimuli, especially when the speech-recognition performance in noise of older adults is examined, is that repeating sentence materials in noise involves more complex cognitive skills than a sim-ple one-word speech-recognition task. The additional cognitive demands may differentially affect older listen-ers as compared with younger listeners [48–49]. More working memory effort is also required for an individual to recall multiple words, which can be influenced by recency and primacy effects [50] such that the first and last words of a string of words are easier to recall. Also, the syntactic and semantic structures of sentence-length stimuli influence performance and make longer word strings that are grammatically correct and meaningful easier to recall [51]. The ability to use compensatory
strategies such as rehearsal (mental repetition of informa-tion to be recalled) and elaborative encoding (linking of new information to knowledge already stored in long-term memory) may be inaccessible when sentence-length stimuli are presented in a background of noise [52–53].
Although monosyllables tend not to represent every-day speech since oral communication is conducted via phrases and sentences and not single words [54], recently the WIN test was shown to be sensitive to the different recognition abilities of listeners with normal hearing and listeners with hearing loss [20,55]. The use of monosylla-bles as test stimuli in speech-testing paradigms is often criticized for lacking natural dynamics of real speech such as word stress, coarticulation, and dynamic range [56]. Words, however, remain the most popular stimulus type among audiologists and minimize the effects of working memory and linguistic context on performance.
McArdle et al. examined the recognition performance of listeners with hearing loss on words in isolation and sen-tences in terms of SNR [29]. The WIN test [20] was used to measure word-recognition performance, whereas the QuickSINTM materials [40] were used to measure word recognition in a sentence paradigm. Figure 2 is a bivariate plot showing the individual 50 percent points of the QuickSINTM on the abscissa and the 50 percent points of the WIN on the ordinate for 72 listeners with hearing loss. The diagonal line represents equal performance on both the word and sentence materials. As shown in Figure 2, 60 per-cent of participants performed better on the QuickSINTM, whereas 40 percent performed better on the WIN; however, mean performance (as noted by •) suggests close to equal performances on the two materials. These results differ from previous studies [34–36] showing a separation in per-formance in SNR as a result of the use of words in isolation versus sentences. Although other methodological differ-ences (i.e., speaker differences, calibration differences) may have attributed to the equal recognition performance for words and sentences, most likely this result was influ-enced by a combination of the type of sentences used in the QuickSINTM materials, which varied from the highly con-textual sentences of the earlier studies and the isolated recordings of the monosyllables.
Speech Recognition in Noise as a Function of Presentation Level
As a general rule, increasing the presentation level of a speech signal increases the percent correct recognition performance in response to that speech signal. However,

85
WILSON and MCARDLE. Speech signals used to evaluate auditory function
many exceptions to this axiom exist both in the quiet and the background-noise domains. Recall the early article by Carhart in which he indicated that this axiom is true for some types of hearing losses (e.g., conductive and some mild types of cochlear hearing loss), whereas for other types of hearing loss (e.g., some types and degrees of cochlear hearing loss) increases in the presentation level of the speech signal did not produce an improvement in recognition performance (Carhart’s “clarity”) [15]. Over the years, reports have accumulated describing “roll-over” of the psychometric function for words presented in quiet with some types of hearing loss [47,57–59]. In roll-over, increases in the presentation level of a speech signal first produce an increase in recognition perfor-mance but further increases in the presentation level pro-duce a subsequent decrease in performance.
The roll-over phenomenon typically is associated with retrocochlear hearing loss (i.e., lesions on the VIIIth cranial nerve). Clinically, the same roll-over phenomenon(albeit to a lesser extent) is observed in the course of
routine speech audiometry measures in quiet on many lis-teners with hearing loss void of retrocochlear signs. A similar, perhaps more common, phenomenon is the decrease in recognition performance that can occur when the speech signal is presented in background noise at pro-gressively higher presentation levels with the SNR remaining constant. The implications of this phenomenon are especially noteworthy with regard to using amplifica-tion and understanding speech. The remainder of this sec-tion describes studies conducted in background noise that have and have not observed the inverse relation between presentation level and recognition performance. The rea-sons for these apparent contradictory findings are elusive.
Several studies observed the linear relationship between presentation level of the speech and noise sig-nals and recognition performance [60–63]. In the classic Hawkins and Stevens study [60], four listeners demon-strated a linear relation between the level of the signal and the level of the masker for both pure-tone and speech signals. At levels higher than approximately 30 dB above threshold, a 10 dB increase in the level of the masker pro-duced a 10 dB increase in the level of the signal required to maintain a given level of performance. This linearity, which was observed both for a detection task and a rec-ognition task in broadband noise, was maintained to lev-els about 90 dB above threshold (by our estimate in the 90 to 100 dB sound pressure level [SPL] range). Although exact details are lacking, perhaps the listening/response task in their study made the paradigm insensi-tive to the decrease in speech recognition often observed with increased presentation levels. In the study, the threshold of intelligibility was defined as “the level at which the listener is just able to obtain without percepti-ble effort the meaning of almost every sentence and phrase of the connected discourse (Adam Smith’s TheWealth of Nations) [60].” The four listeners in the study adjusted the level of the discourse until the threshold cri-terion was met from their perspective. Typically, in these early experiments, the listeners were either the experi-menters or other sophisticated listeners from a listening crew. It would not be unexpected, therefore, that cogni-tive processes overcame the slight deviation from linear-ity at high presentation levels that has been reported in other investigations.
Other studies have demonstrated a nonlinear, nega-tive relation between recognition of speech materials and the presentation level. With SNR maintained at a con-stant level, as the presentation level of the speech and
Figure 2.Bivariate plot of 50% points (decibel speech-to-babble [S/B] ratio) on Words in Noise (WIN) test (ordinate) and Quick Speech-in-Noise Test (QuickSIN™) (abscissa). Diagonal line represents equal performance, and larger filled symbol (•) indicates mean datum point. Dashed line is the linear regression fit to data. Numbers within the plot are numberof performances (percent) above and below line of equal performance.

86
JRRD, Volume 42, Number 4, 2005, Supplement 2
noise signals increases, word-recognition performance decreases. The Kryter [64] and Pollack and Pickett [65] articles are good examples. Data from these two studies on listeners with presumed normal hearing are summarizedin Figure 3 in which recognition performance on mono-syllabic words is plotted as a function of presentation level with SNR constant (0 and 15 dB are shown). At lev-els in the 80 to 120 dB SPL (60 to 100 dB HL) range, rec-ognition performance dropped appreciably in both studies as the presentation level was increased and SNR remained constant. This inverse relation between presen-tation level of the speech and the masker and recognition performance was demonstrated in several other investi-gations. For example, Chung and Mack observed decreased performance with the W-22 lists at fixed SNRs of 5, 12, and 19 dB as the presentation level was increased from 65 to 85 dB SPL [66]. Similar findings were observed in listeners with normal hearing and lis-teners with hearing loss. Dirks et al. noted that increased SNRs were required by listeners with normal hearing to maintain given levels of performance (29.3%, 50.0%, and 70.7%) at presentation levels of 70, 80, and 90 dB
SPL [33]. Dirks et al. also reported similar findings with listeners with hearing loss. Beattie measured speech-recognition performance for 18 listeners with normal hearing presented with the W-22 words in 45 and 65 dB HL multitalker babble [32]. Performance was better for the 45 dB HL condition than the 65 dB HL condition. The mean 50 percent point was 1.9 dB lower for the45 dB HL condition than the 65 dB HL condition. Over-all, recognition performances at 45 dB HL were 5 to 11 per-cent better than at 65 dB HL. Subsequently, Studebaker et al. revived interest in the inverse relation between pre-sentation level (of the signal and masker) and recognition performance, particularly at the higher levels [67]. When the SNR was held constant (4 dB steps between –4 and 28 dB) and the presentation level increased from 64 to99 dB SPL, listeners with normal hearing demonstrated decreased recognition abilities as presentation level increased. A similar but less dramatic effect was observed for listeners with hearing loss, especially at the lower SNRs.
In a large National Institute on Deafness and Other Communication Disorders/Department of Veterans Affairsmulticenter study involving hearing aid wearers (n = 360), Shanks et al. [68] reported unaided and aided speech-recognition performances obtained with the CST [38] in multitalker babble. The CST sentences were pre-sented at 52, 62, and 74 dB SPL with three S/B ratios at each presentation level (–3, 0, and 3 dB). The overall result for the unaided listeners was a decrease in perfor-mance from 31 to 26 percent as the presentation level was increased from 52 to 74 dB SPL. Further data analy-sis was performed with the participants divided into thefollowing four groups based on the degree and configura-tion of their hearing loss:1. Group A: pure-tone average (PTA) <40 dB HL with a
slope of <10 dB/octave.2. Group B: PTA <40 dB HL with a slope of >10 dB/
octave.3. Group C: PTA >40 dB HL with a slope of <10 dB/
octave. 4. Group D: PTA >40 dB HL with a slope of >10 dB/
octave.The results from this analysis of the unaided (Figure 4(a))
and aided (Figure 4(b)) data are presented. For Groups A and B in the unaided condition, recognition performance on the CST decreased for each S/B ratio as the presenta-tion level was increased from 52 to 74 dB SPL. As we dis-cuss later, the inverse relation between presentation level
Figure 3.Percent correct recognition for monosyllabic words in various background noises shown as a function of presentation level (decibel sound pressure level [SPL]). Sources: Kryter KD. Effects of ear protective devices on the intelligibility of speech in noise. J Acoust Soc Am. 1946;18(2):413–17 (dashed lines [K]). Pollack I, Pickett JM. Masking of speech by noise at high sound levels. J Acoust Soc Am. 1958;30(2):127–30 (solid lines [P&P]). In both studies, signal-to-noise ratio (SNR) was held constant at 0 and 15 dB.

87
WILSON and MCARDLE. Speech signals used to evaluate auditory function
and recognition performance can be attributed partially to the upward spread of masking (i.e., masking at frequencies above the spectrum of the masker) [69–70]. For the groups with greater hearing loss (C and D), unaided recognition performance increased for each S/B ratio as the presenta-tion level was increased from 52 to 74 dB SPL. In all probability, this increased performance for Groups C and
D was an audibility issue, i.e., as the speech signal and babble became louder, the individuals perceived more information from the speech signal, which was reflected in better recognition performance. Figure 4(b) illustrates the data for the aided condition. For comparison, the light lines in Figure 4(b) are the unaided data from Figure 4(a). In the aided condition, two relationships can be seen. First, at corresponding presentation levels and S/B conditions, all groups generally performed either equally on the aided and unaided conditions or better on the aided than the unaided condition, especially at the lower presentation levels. Sec-ond, with the S/B ratio fixed in the aided condition, recog-nition performance for all groups decreased as presentation level of the CST increased from 52 to 74 dB SPL. In sum-mary, increased presentation levels, with constant S/B ratios, produced decreased speech-recognition perfor-mance in both the aided and unaided conditions for the individuals with PTAs of <40 dB HL (Groups A and B) and in the aided condition for the individuals with PTAs of >40 dB HL (Groups C and D). These inverse relations can be partially attributed to the effects of the upward spread of masking. In contrast, increased presentation levels with constant SNRs produced increased speech-recognition performance under the unaided condition for the individu-als with PTAs of >40 dB HL (Groups C and D). This rela-tion is attributed to an increase in audibility provided by the increased presentation level of the signal that overshad-owed any effects of the upward spread of masking. One must remember that these effects are only observed when speech is presented in background noise. Different effects are produced when speech is presented in quiet. Shanks et al. concluded that “the relationship between speech and babble presentation level, signal-to-babble ratio, and gain provided by a hearing aid, however, is complex and requires further examination [68, p. 289].”
Most recently, Dubno et al. [71] observed the nonlin-ear relationship using the same words and masker as Studebaker et al. [67], namely, monosyllabic words and a masker shaped to the spectrum of the speaker. Additionally, Dubno et al. measured pure-tone thresholds in one-third octave intervals in the speech-shaped masker. As the level of the masker increased, a linear increase in the thresholds for frequencies below approximately 1,000 Hz and a nonlinear increase in the thresholds for frequencies above approximately 1,000 Hz occurred. This finding indicates that the upward spread of masking makes maskers (even of speech signals) more “effective” at higher presentation levels than predicted.
Figure 4.Percent correct recognition on Connected Speech Test obtained at three signal-to-babble ratios (–3, 0, and 3 dB) at each of three presentation levels (52, 62, and 74 dB sound pressure level [SPL]) from four groups of listeners with different degrees and configurations of hearing loss (see body text). Data from both (a) unaided and (b) aidedlisteners are shown. For comparison, thin lines in (b) are replots of data from (a). Data were originally analyzed in rationalized arcsine units. Source: Shanks JE, Wilson RH, Larson V, Williams D. Speech recognition performance of patients with sensorineural hearing loss under unaided and aided conditions using linear and compression hearing aids. Ear Hear. 2002;23(4):280–90.
88
JRRD, Volume 42, Number 4, 2005, Supplement 2
Perhaps the decreased speech-recognition perfor-mance observed in background noise as the presentation level increases is, in part, an extension of the roll-over phenomenon reported for speech materials in quiet. For different reasons, both phenomena may be reflecting dis-tortion within the cochlea as a result of exceeding a criti-cal input energy level.
Effects of Age and Hearing Loss on Speech RecognitionOlder individuals typically exhibit declines in the
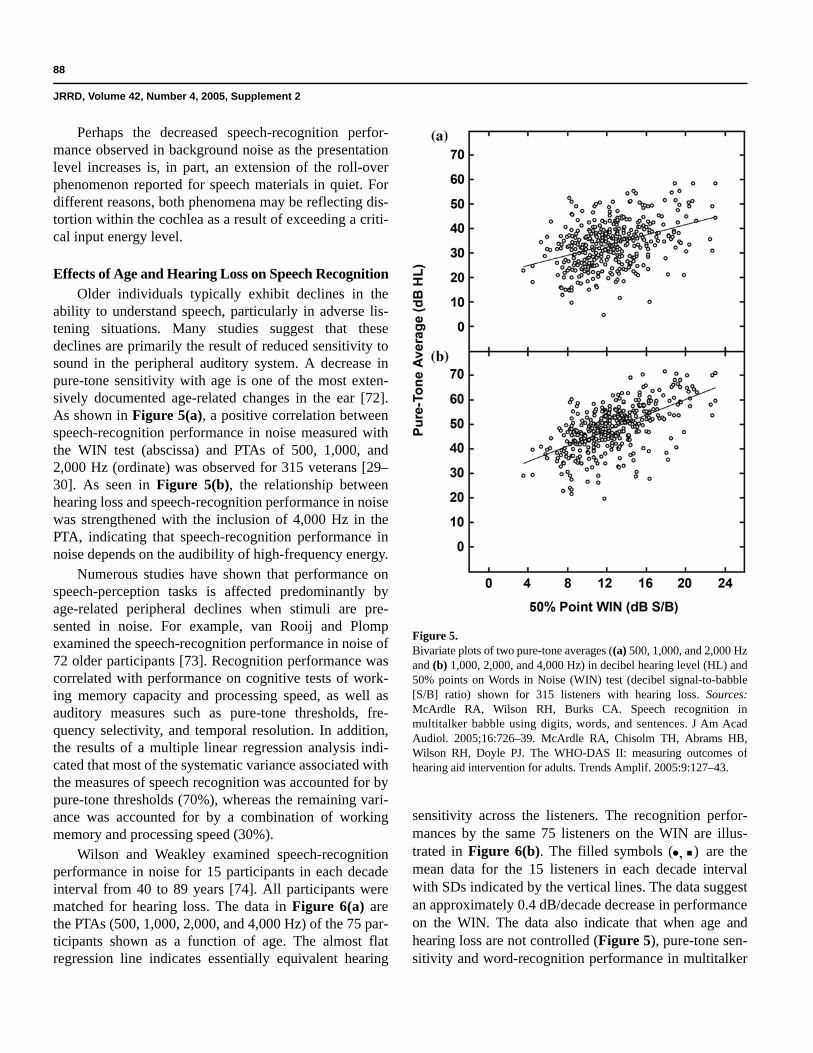
ability to understand speech, particularly in adverse lis-tening situations. Many studies suggest that these declines are primarily the result of reduced sensitivity to sound in the peripheral auditory system. A decrease in pure-tone sensitivity with age is one of the most exten-sively documented age-related changes in the ear [72]. As shown in Figure 5(a), a positive correlation between speech-recognition performance in noise measured with the WIN test (abscissa) and PTAs of 500, 1,000, and 2,000 Hz (ordinate) was observed for 315 veterans [29–30]. As seen in Figure 5(b), the relationship between hearing loss and speech-recognition performance in noise was strengthened with the inclusion of 4,000 Hz in the PTA, indicating that speech-recognition performance in noise depends on the audibility of high-frequency energy.
Numerous studies have shown that performance on speech-perception tasks is affected predominantly by age-related peripheral declines when stimuli are pre-sented in noise. For example, van Rooij and Plomp examined the speech-recognition performance in noise of 72 older participants [73]. Recognition performance was correlated with performance on cognitive tests of work-ing memory capacity and processing speed, as well as auditory measures such as pure-tone thresholds, fre-quency selectivity, and temporal resolution. In addition, the results of a multiple linear regression analysis indi-cated that most of the systematic variance associated with the measures of speech recognition was accounted for by pure-tone thresholds (70%), whereas the remaining vari-ance was accounted for by a combination of working memory and processing speed (30%).
Wilson and Weakley examined speech-recognition performance in noise for 15 participants in each decade interval from 40 to 89 years [74]. All participants were matched for hearing loss. The data in Figure 6(a) arethe PTAs (500, 1,000, 2,000, and 4,000 Hz) of the 75 par-ticipants shown as a function of age. The almost flat regression line indicates essentially equivalent hearing
sensitivity across the listeners. The recognition perfor-mances by the same 75 listeners on the WIN are illus-trated in Figure 6(b). The filled symbols (•, ) are the mean data for the 15 listeners in each decade interval with SDs indicated by the vertical lines. The data suggest an approximately 0.4 dB/decade decrease in performance on the WIN. The data also indicate that when age and hearing loss are not controlled (Figure 5), pure-tone sen-sitivity and word-recognition performance in multitalker
Figure 5.Bivariate plots of two pure-tone averages ((a) 500, 1,000, and 2,000 Hzand (b) 1,000, 2,000, and 4,000 Hz) in decibel hearing level (HL) and 50% points on Words in Noise (WIN) test (decibel signal-to-babble [S/B] ratio) shown for 315 listeners with hearing loss. Sources: McArdle RA, Wilson RH, Burks CA. Speech recognition in multitalker babble using digits, words, and sentences. J Am Acad Audiol. 2005;16:726–39. McArdle RA, Chisolm TH, Abrams HB, Wilson RH, Doyle PJ. The WHO-DAS II: measuring outcomes of hearing aid intervention for adults. Trends Amplif. 2005:9:127–43.

89
WILSON and MCARDLE. Speech signals used to evaluate auditory function
babble are strongly related. In contrast, when hearing sensitivity is controlled, the effects of age on word-recognition performance in babble are minimal (Figure 6).Humes and colleagues [75–78] as well as numerous other investigators [79–83] have similarly reported that
decreased speech-recognition performance in older indi-viduals can be explained primarily by auditory factors.
Pure-tone thresholds, however, are not always sensi-tive enough to determine abnormal cochlear phenomena like distortion, particularly when individuals are listening in background noise. Psychoacoustic tasks examining the ability of an individual to manipulate complex stimuli help profile the listening abilities of older individuals [84–85]. Schneider attributed declines in performance on various psychoacoustic measures (e.g., low-frequency discrimina-tion, temporal discrimination, localization, and binaural masking) to a loss of neural synchrony [85]. For example, without good frequency analysis abilities, speech recogni-tion has been shown to be impaired [86]. Gordon-Salant provides a detailed discussion in this area [87].
Although much of the observed performance of older individuals on speech-recognition tasks may be attributed to auditory factors, cognitive processes also may contrib-ute to decreased performance. One cognitive process pro-posed to decrease with increasing age is speed of processing [48,88]. Reaction-time studies consistently show an increase in the time necessary for transmission of sensory information, motor execution, and decision mak-ing with increasing age [89]. Cognitive slowing with age may result from cellular loss that occurs throughout the brain with normal aging [90]. This global cellular loss coupled with documented changes in the electrical activity in the brain [91–92] is associated with slowing in both motor response and information processing. Indeed, if an older individual needs excessive time to encode a mes-sage, then understanding would be poor during running speech because of the rapid rate of normal conversation.
That cognitive slowing occurs with age implies that rapid input processing is vulnerable in older adulthood [48,93]. Spoken language is a prime example of input that requires rapid online analysis; therefore, we might expect to see large age effects in the speech processing of older adults. Of course, the magnitude of the age effect will depend on the speech materials and the presence or absence of linguistic context [51].
Although older adults can apparently use linguistic context in speech-perception tasks, age-related working memory changes may affect context utilization. Significant memory constraints are known to limit the performance of older adults on various speech-perception tasks [94–95]. Finally, several studies in the cognitive aging literature have observed a strong correlation between perception and cognition in older adults. Lindenberger and Baltes
Figure 6.(a) Four-frequency pure-tone average (500, 1,000, 2,000, and 4,000 Hz)for listeners with normal hearing ( ) and hearing loss ( ) as a function of age. Data are from Wilson and Weakley study that included 15 listeners with hearing loss in each decade interval from 40 to 89 years matched for hearing loss (Source: Wilson RH, Weakley DG. The 500 Hz masking-level difference and word recognition in multitalker babble for 40- to 89-year-old listeners with symmetrical sensorineural hearing loss. J Am Acad Audiol. 2005;16(6):367–82). Shaded area indicates range of normal hearing sensitivity. (b) 50% correct points obtained with Words in Noise test as a function of age for same listeners. Larger filled symbols (•, ) represent mean data for each decade along with standard deviations (vertical lines). Shaded area indicates range of performance by listeners with normal hearing in which 90th percentile is 6 dB signal-to-babble (S/B) ratios. HL = hearing level.

90
JRRD, Volume 42, Number 4, 2005, Supplement 2
examined the intersystemic connection of hearing and vision with cognition [96–97]. They found that the correla-tion between these variables was low for young adults (0.38) but high for older adults (71). This line of research makes decreases in speech recognition for older adults dif-ficult to explain based solely on changes in the auditory system [98]. Further, it reflects the need for studies in which the interrelations between perceptual and cognitive aspects of speech perception can be delineated.
CONCLUSIONS
The most common complaint that people have about their hearing loss is difficulty understanding speech, especially when listening in a noisy environment. This article reviewed word-recognition tasks in the context of the two-component hearing loss model (attenuation/audi-bility and clarity/distortion) proposed by Carhart [15], Stephens [16], and Plomp [17]. A hearing loss that is pri-marily one of audibility is a sensitivity hearing loss. Clini-cally, the distortion component of a hearing loss is reflected primarily in an inability by the listener with hearing loss to understand speech in background noise, which typically is multitalker babble. Hearing loss in the distortion domain is called signal-to-noise hearing loss. Just as word-recognition ability in quiet is often difficult to predict from pure-tone thresholds, word recognition in babble is difficult to predict from recognition perfor-mance in quiet. Word-recognition performance in back-ground noise, therefore, must be measured. The data from these measures address the complaint of the patient and should help determine the appropriate intervention strategy with amplification.
REFERENCES
1. Gruber J. A text-book of the diseases of the ear. Translated by E. Law and C. Jewell from the second German edition. New York: D. Appleton and Company; 1891. p. 131–32.
2. Lichtwitz L. Über die anwendung des neuen Eidson’s chen phonographen als allgemeinen Hormesser. Prager med. Wochenschr. 1889;14:547–49.
3. Hawley ME. On the application of the new Edison phono-graph to general hearing measurement. In: Hawley ME, editor. Speech intelligibility and speaker recognition. Stroudsburg (PA): Dowden Hutchinson and Ross, Inc.; 1977.
4. Bryant WS. A phonographic acoumeter. Arch Otolaryngol. 1904;33:438–43.
5. Campbell GA. Telephonic intelligibility. Philos Mag. 1910; 19:152–59.
6. Jones JH, Knudsen VO. Functional tests of hearing. Laryn-goscope. 1924;39:1–16.
7. Fletcher H. Speech and hearing. New York: Van Nostrand Co; 1929.
8. Crandall IB. Composition of speech. Phys Rev. 1917; 10:74.
9. Fletcher H, Steinberg JC. Articulation testing methods. Bell Sys Tech J. 1929;8:806–54.
10. Hudgins CV, Hawkins JE Jr, Karlin JE, Stevens SS. The development of recorded auditory tests for measuring hear-ing loss for speech. Laryngoscope. 1947;57:57–89.
11. Hirsh IJ, Davis H, Silverman SR, Reynolds EG, Eldert E, Benson RW. Development of materials for speech audiome-try. J Speech Hear Disord. 1952;17:321–37.
12. Egan J. Articulation testing methods. Laryngoscope. 1948; 58:955–91.
13. Tillman TW, Carhart R. An expanded test for speech dis-crimination utilizing CNC monosyllabic words. Northwest-ern University Auditory Test No. 6. SAM-TR-66-55 (Technical Report). Brooks Air Force Base (TX): USAF School of Aerospace Medicine; 1966.
14. Feldmann H. A history of audiology: A comprehensive report and bibliography from the earliest beginnings to the present. Transl Beltone Inst Hear Res. 1970;22:1–111.
15. Carhart R. Basic principles of speech audiometry. Acta Otolaryngol. 1951;40:62–71.
16. Stephens SDG. The input for a damaged cochlea: a brief review. Brit J Audiol. 1976;10:97–101.
17. Plomp R. Auditory handicap of hearing impairment and the limited benefit of hearing aids. J Acoust Soc Am. 1978; 63(2):533–49.
18. Killion MC. New thinking on hearing in noise: a general-ized articulation index. Sem Hear. 2002;23:57–75.
19. Killion MC, Niquette PA, Gudmundsen GI, Revit LJ, Ban-erjee S. Development of a quick speech-in-noise test for measuring signal-to-noise ratio loss in normal-hearing and hearing-impaired listeners. J Acoust Soc Am. 2004;116 (4 Pt 1):2395–2405.
20. Wilson RH. Development of a speech-in-multitalker-babble paradigm to assess word-recognition performance.J Am Acad Audiol. 2003;14(9):453–70.
21. Plomp R, Duquesnoy AJ. A model for the speech-reception threshold in noise without and with a hearing aid. Scand Audiol Suppl. 1982;15:95–111.
22. Carhart R, Tillman TW. Interaction of competing speech signals with hearing losses. Arch Otolaryngol. 1970;91(3): 273–79.

91
WILSON and MCARDLE. Speech signals used to evaluate auditory function
23. Groen JJ. Social hearing handicap: Its measurement by speech audiometry in noise. Int J Audiol. 1969;8:182–83.
24. Olsen WO, Carhart R. Development of test procedures for evaluation of binaural hearing aids. Bull Prosthet Res. 1967; 10(7):22–49.
25. Strom KE. The HR 2003 dispenser survey. Hear Rev. 2003;10(6):22–38.
26. Fletcher H, Galt RH. The perception of speech and its rela-tion to telephony. J Acoust Soc Am. 1950;22:89–151.
27. Rankovic CM. An application of the articulation index to hearing aid fitting. J Speech Hear Res. 1991;34(2):391–402.
28. American National Standards Institute. ANSI S3.5-1997. Methods for the calculation of the speech intelligibility Index. New York: Acoustical Society of America; 1997.
29. McArdle RA, Wilson RH, Burks CA. Speech recognition in multitalker babble using digits, words, and sentences. J Am Acad Audiol. 2005;16:726–39.
30. McArdle RA, Chisolm TH, Abrams HB, Wilson RH, Doyle PJ. The WHO-DAS II: measuring outcomes of hearing aid intervention for adults. Trends Amplif. 2005:9:127–43.
31. Wilson RH, Abrams HB, Pillion AL. A word-recognition task in multitalker babble using a descending presentation mode from 24 dB to 0 dB in signal to babble. J Rehabil Res Dev. 2003;40(4):321–28.
32. Beattie RC. Word recognition functions for the CID W-22 test in multitalker noise for normally hearing and hearing-impaired subjects. J Speech Hear Disord. 1989;54(1):20–32.
33. Dirks DD, Morgan DE, Dubno JR. A procedure for quanti-fying the effects of noise on speech recognition. J Speech Hear Disord. 1982;47(2):114–23.
34. Egan JP. Articulation testing methods, II. OSRD report No. 3802. Cambridge (MA): Psychoacoustic laboratory, Har-vard University; 1944.
35. Miller GA, Heise GA, Lichten W. The intelligibility of speech as a function of the context of the test materials.J Exp Psychol. 1951;41(5):329–35.
36. O’Neill JJ. Recognition of intelligibility test materials in context and isolation. J Speech Hear Disord. 1957;22(1): 87–90.
37. Kalikow DN, Stevens KN, Elliott LL. Development of a test of speech intelligibility in noise using sentence materi-als with controlled word predictability. J Acoust Soc Am. 1977;61:1337–51.
38. Cox RM, Alexander GC, Gilmore C. Development of the Connected Speech Test (CST). Ear Hear. 1987;8(5 Suppl): 119S–25S.
39. Nilsson M, Soli SD, Sullivan JA. Development of the Hearing in Noise Test for the measurement of speech reception thresholds in quiet and in noise. J Acoust Soc Am. 1994(2);95:1085–99.
40. QuickSINTM Speech-in-Noise Test [compact disk]. Elk Grove Village (IL): Etymotic Research, Inc.; 2001.
41. Bench J, Bamford J, editors. Speech-hearing tests and the spoken language of hearing-impaired children. London: Academic Press; 1979.
42. Institute of Electrical and Electronics Engineers (IEEE). IEEE recommended practice for speech quality measure-ments. IEEE Trans Audio Electroacoust. 1969;17:227–46.
43. Rabinowitz WM, Eddington DK, Delhorne LA, Cuneo PA. Relations among different measures of speech reception in subjects using a cochlear implant. J Acoust Soc Am. 1992; 92(4 Pt 1):1869–81.
44. Plomp R. The intelligent ear: on the nature of sound per-ception. Mahwah (NJ): Lawrence Erlbaum Associates, Inc.; 2002.
45. Hirsh IJ. The measurement of hearing. New York: McGraw-Hill; 1952.
46. Giolas TG, Epstein A. Comparative intelligibility of word lists and continuous discourse. J Speech Hear Res. 1963;6: 349–58.
47. Jerger J, Speaks C, Trammell J. A new approach to speech audiometry. J Speech Hear Disord. 1968;33(4):318–28.
48. Salthouse TA. Theory of cognitive aging. Amsterdam (the Netherlands): Elsevier Science and Technology Books; 1985. p. 1–456 (Advances in psychology, vol 28).
49. Craik F. Memory changes in normal aging. Am Psychol Soc. 1994;3:155–58.
50. Murdock BB Jr. The serial position effect in free recall.J Exp Psychol. 1962;64:482–88.
51. Wingfield A. Cognitive factors in auditory performance: context, speed of processing, and constraints of memory.J Am Acad Audiol. 1996;7(3):175–82.
52. Craik F, Lockhart RS. Levels of processing: A framework for memory research. J Verb Learn Verb Behav. 1972;11: 671–84.
53. Rabbitt P. Mild hearing loss can cause apparent memory failures which increase with age and reduce IQ. Acta Oto-laryngol Suppl. 1990;476:167–76.
54. Olsen WO, Matkin ND. Speech audiometry in hearing assessment. In: Rintelman WF, editor. Hearing assessment. Baltimore (MD): University Park Press; 1979. p. 133–206.
55. Wilson RH, Burks CA, Weakley DG. Word recognition of digit triplets and monosyllabic words in multitalker babble by listeners with sensorineural hearing loss. J Am Acad Audiol. In press 2005.
56. Villchur E. The evaluation of amplitude-compression pro-cessing for hearing aids. In: Studebaker G, Bess F, editors. The Vanderbilt hearing aid report. Upper Darby (PA): Monographs in Contemporary Audiology; 1982. p. 141–43.
57. Jerger J, Jerger S. Diagnostic significance of PB word func-tions. Arch Otolaryngol. 1971;93(6):573–80.
58. Dirks DD, Kamm C, Bower D, Betsworth A. Use of perfor-mance-intensity functions for diagnosis. J Speech Hear Disord. 1977;42(3):408–15.

92
JRRD, Volume 42, Number 4, 2005, Supplement 2
59. Bess FH, Josey AF, Humes LE. Performance intensity functions in cochlear and eighth nerve disorders. Am J Otol. 1979;1(1):27–31.
60. Hawkins JE, Stevens SS. The masking of pure tones and of speech by white noise. J Acoust Soc Am. 1950;22(1):6–13.
61. Hirsh IJ, Bowman WD. Masking of speech by bands of noise. J Acoust Soc Am. 1953;25:1175–80.
62. Duquesnoy AJ, Plomp R. The effect of a hearing aid on the speech-reception threshold of hearing-impaired listeners in quiet and noise. J Acoust Soc Am. 1983;73(6):2166–73.
63. Dubno JR, Ahlstrom JB, Horwitz AR. Use of context by young and aged adults with normal hearing. J Acoust Soc Am. 2000;107(1):538–46.
64. Kryter KD. Effects of ear protective devices on the intelli-gibility of speech in noise. J Acoust Soc Am. 1946;18(2): 413–17.
65. Pollack I, Pickett JM. Masking of speech by noise at high sound levels. J Acoust Soc Am. 1958;30(2):127–30.
66. Chung DY, Mack B. The effect of masking by noise on word discrimination scores in listeners with normal hearing and with noise-induced hearing loss. Scand Audiol. 1979; 8(3):139–43.
67. Studebaker GA, Sherbecoe RL, McDaniel DM, Gwaltney CA. Monosyllabic word recognition at higher-than-normal speech and noise levels. J Acoust Soc Am. 1999;105(4): 2431–44.
68. Shanks JE, Wilson RH, Larson V, Williams D. Speech rec-ognition performance of patients with sensorineural hearing loss under unaided and aided conditions using linear and compression hearing aids. Ear Hear. 2002;23(4):280–90.
69. French NR, Steinberg JC. Factors governing the intelligibil-ity of speech sounds. J Acoust Soc Am. 1947;19:90–119.
70. Braida LD. Articulation testing methods for evaluating speech reception by impaired listeners. ASHA Reports. 1984;14:26–30.
71. Dubno JR, Horwitz AR, Ahlstrom JB. Word recognition in noise at higher-than-normal levels: decreases in scores and increases in masking. J Acoust Soc Am. 2005;118(2):914–22.
72. Willott JF. Anatomic and physiologic aging: A behavioral neuroscience perspective. J Am Acad Audiol. 1996;7(3): 141–51.
73. van Rooij JC, Plomp R. Auditive and cognitive factors in speech perception by elderly listeners. Acta Otolaryngol Suppl. 1991;476:177–81.
74. Wilson RH, Weakley DG. The 500 Hz masking-level dif-ference and word recognition in multitalker babble for40- to 89-year-old listeners with symmetrical sensorineural hearing loss. J Am Acad Audiol. 2005;16(6):367–82.
75. Humes LE. Speech understanding in the elderly. J Am Acad Audiol. 1996;7(3):161–67.
76. Humes LE, Christopherson L. Speech identification diffi-culties of hearing-impaired elderly persons: the contribu-
tions of auditory processing deficits. J Speech Hear Res. 1991;34(3):686–93.
77. Lee LW, Humes L. Factors for the speech recognition abil-ity of the hearing-impaired elderly. ASHA. 1992;34:212.
78. Humes LE, Roberts L. Speech-recognition difficulties of the hearing-impaired elderly: the contributions of audibil-ity. J Speech Hear Res. 1990;33(4):726–35.
79. Helfer K. Aging and the binaural advantage in reverberation and noise. J Speech Hear Res. 1992;33(6):1349–1401.
80. Helfer KA, Wilber LA. Hearing loss, aging, and speech perception in reverberation and noise. J Speech Hear Res. 1990;33(1):149–55.
81. Souza PE, Turner CW. Masking of speech in young and eld-erly listeners with hearing loss. J Speech Hear Res. 1994; 37(3):655–61.
82. van Rooij JC, Plomp R. Auditive and cognitive factors in speech perception by elderly listeners. II: multivariate analy-ses. J Acoust Soc Am. 1990;88(6):2611–24.
83. van Rooij JC, Plomp R. Auditive and cognitive factors in speech perception by elderly listeners. III: additional data and final discussion. J Acoust Soc Am. 1992;91(2):1028–33.
84. Gordon-Salant S, Fitzgibbons PJ. Profile of auditory tem-poral processing in older listeners. J Speech Lang Hear Res. 1999;42(2):300–311.
85. Schneider B. Psychoacoustics and aging: implication for everyday listening. J Speech Lang Pathol Audiol. 1997;21: 111–24.
86. Gengel RW. Temporal effects in frequency discrimination hearing-impaired listeners. J Acoust Soc Am. 1973;54(1): 11–15.
87. Gordon-Salant S. Hearing loss and aging: new research find-ings and clinical implications. J Rehabil Res Dev. 2005;42 (4 Suppl):9–24.
88. Wingfield A, Poon LW, Lombardi L, Lowe D. Speed of processing in normal aging: effects of speech rate, linguis-tic structure, and processing time. J Gerontol. 1985;40(5): 579–85.
89. Salthouse TA. The nature of the influence of speed on adult age differences in cognition. Dev Psychol. 1994;30:240–59.
90. Obler L, Au R, Albert M. Language and aging. In: Huntley R, Helfer K, editors. Communication in later life. Boston (MA): Butterworth-Heinemann; 1995. p. 85–95.
91. Marsh GR, Thompson LW. Psychophysiology of aging. In: Birren JE, Schaie KW, editors. Handbook of the psychology of aging. New York: Van Nostrand Reinhold; 1977. p. 219–48.
92. Woodruff DS. Brain electrical activity and behavior rela-tionships over the life span. In: Baltes PB, Brim OG, editors. Life-span development and behavior. New York: Academic Press; 1979. p. 112–181.
93. Cerella J. Information processing rates in the elderly. Psy-chol Bull. 1985;98(1):67–83.

93
WILSON and MCARDLE. Speech signals used to evaluate auditory function
94. Salthouse TA. Mediation of adult age differences in cogni-tion by reductions in working memory and speed of pro-cessing. Psychol Sci. 1991;2:179–83.
95. Wingfield A, Stine EA, Lahar CJ, Aberdeen JS. Does the capacity of working memory change with age? Exp Aging Res. 1988;14(2–3):103–7.
96. Lindenberger U, Baltes PB. Sensory functioning and intel-ligence in old age: a strong connection. Psychol Aging. 1994;9(3):339–55.
97. Baltes PB, Lindenberger U. Emergence of a powerful con-nection between sensory and cognitive functions across the
adult life span: a new window to the study of cognitive aging? Psychol Aging. 1997;12(1):12–21.
98. Helfer K. Auditory perception by older adults. In: Huntley R, Helfer K, editors. Communication in later life. Boston (MA): Butterworth-Heinemann; 1995. p. 41–84.
99. Studebaker GA. A “rationalized” arcsine transform.J Speech Hear Res. 1985:28(3):455–62.
Submitted for publication June 10, 2005. Accepted in revised form August 1, 2005.