volume 4, number 2 journal of the north …leaders and non-leaders volume 4, number 2, 2009 3...
TRANSCRIPT
© NORTH AMERICAN MANAGEMENT SOCIETY HTTPS://NAMS.BAKER.EDU
Leaders and Non-leaders: A Comparative Study of Some Major Developmental Aspects Karin Amit, Micha Popper, Revuen Gal, Tamar Mamane Levy, & Alon Lisak
2
Faculty Development through Training: Political and Public Relations Implications Claretha Hughes
20
An Empirical Investigation Focusing on the Composition and Performance of the Fortune 500 Joseph T. Martelli, Patricia B. Abels, & Kara M. Ward
31
Looking Through the “Glass Ceiling:” Compensation Equity & Promotional Challenges Michaeline Skiba & Joseph Mosca
46
Women in Management and Emotional Disequilibrium in the Workplace Willia Glover
55
International Truck and Engine Parts and Partners Case and Teaching Note Gurram Gopal & Eric Stasken
64
Narcissus in the Workplace: What Organizations Need to Know Mark Arvisais
79
Guidelines for Contributors 95
J o u r n a l o f t h e N o r t h A m e r i c a n M a n a g e m e n t S o c i e t y
EDITORIAL STAFF
JOURNAL & PROCEEDINGS EDITORJulia Teahen, Baker College
JOURNAL BOARD OF EDITORSBob Ballenger, Washington and Lee UniversityRichard Barker, ConsultantAmanda Baugous, Augustana CollegeJeff Fahrenwald, Rockford CollegeJohn Farlin, Ohio Dominican UniversityRonald Faust, University of EvansvilleGideon Falk, Purdue University-CalumetMichele Govekar, Ohio Northern UniversityPaul Govekar, Ohio Northern UniversityRegina Greenwood, Kettering UniversityBrian Hinrichs, Saint Xavier UniversityPeggy Houghton, Baker CollegeJohn Humphreys, Texas A & M UniversityLynn Isvik, Upper Iowa UniversityRichard Leake, Luther CollegeBill Livingston, Baker CollegeJim Maddox, Friends UniversityTerry Maris, Ohio Northern UniversityC. R. Marshall, U. of Wisconsin-Stevens PointJoseph Martelli, The University of FindlayEdward Murphy, Embry Riddle Aeronautical Univ.Richard Sebastian, St. Cloud State UniversityJohn Vinton, Baker CollegeCarolyn Wiley, Roosevelt University
COPYRIGHT AND PERMISSION TO COPYThe Journal of the North American Management Society owns the copyright of all content published within it. Permission to copy JNAMS content is subject to the fair use principles of U.S. copyright law. For permission to copy JNAMS materials, contact the Journal Editor by e-mail at [email protected] .
EDITORIAL OFFICE
VOLUME 4, NUMBER 2 FALL 2009

JOURNAL BOARD OF EDITORS Bob Ballenger, Washington and Lee University Richard Barker, Consultant Amanda Baugous, Augustana College Jeff Fahrenwald, Rockford College John Farlin, Ohio Dominican University Ronald Faust, University of Evansville Gideon Falk, Purdue University-Calumet Michele Govekar, Ohio Northern University Paul Govekar, Ohio Northern University Regina Greenwood, Nova Southeastern University Brian Hinrichs, Saint Xavier University Peggy Houghton, Baker College John Humphreys, Texas A & M University-Commerce Lynn Isvik, Upper Iowa University Richard Leake, Luther College Bill Livingston, Baker College Jim Maddox, Friends University Terry Maris, Ohio Northern University C. R. Marshall, University of Wisconsin-Stevens Point Joseph Martelli, The University of Findlay Edward Murphy, Embry Riddle Aeronautical University Richard Sebastian, St. Cloud State University John Vinton, Baker College Carolyn Wiley, Roosevelt University JOURNAL AND PROCEEDINGS EDITOR Julia Teahen, Baker College COPYRIGHT AND PERMISSION TO COPY The Journal of the North American Management Society owns the copyright of all content published within it. Permission to copy JNAMS content is subject to the fair use principles of U.S. copyright law. For permission to copy JNAMS materials, contact the Journal Editor by e-mail at [email protected] . EDITORIAL OFFICE Journal of the North American Management Society North American Management Society Baker College 1116 West Bristol Road Flint, MI 48507 [email protected]
Journal of the North American Management Society, Volume 4, Number 2, 2009
Leaders and Non-leaders: A Comparative Study of Some Major
Developmental Aspects*
Karin Amit, Micha Popper, Reuven Gal,
Tamar Mamane Levy, Alon Lisak,
Abstract: The research presented here is based on the assumption that there are unique features in the development of leaders in social and organizational settings. Fifty Israeli soldiers who were perceived as leaders by their commanders and peers were compared with 30 soldiers who received low scores on leadership evaluations. The participants were selected out of a group of 286 soldiers on a combat training course. Differences were found between those perceived as leaders and those who scored low on leadership evaluations, in developmental aspects such as relations in the family, expectations transmitted to them by the family, exposure to models of leadership, experiences of leadership roles in social frameworks, and openness to experiences.
LEADERS AND NON-LEADERS: A COMPARATIVE STUDY OF SOME MAJOR DEVELOPMENTAL ASPECTS.
Most of the writing on the development of leaders is characterized by (a) a focus on outstanding leaders, and (b) also takes a mainly psychoanalytic view of leaders’ development (Burns, 1978). Typically, leadership scholars from psychodynamic schools of thought (e.g. Aberbach, 1995; Kets de Vries, 1989; Zaleznik, 1992), identified in some well-known leaders similar types of socialization in early childhood, which, they claim, may indicate distinct patterns of development of leadership. For instance, several leaders’ analyses reveal a close relationship between the future leader and the mother, sometimes as the mother’s favorite child. Other studies point to the absence of a father in childhood (statistically more than the general average: Iremonger,1970), a situation that may develop self reliance and a sense of mission in life (Zaleznik, 1992 ). In addition, scholars point to the expectations of greatness projected by at least one of the parents (Kets de Vries, 1989), and to existing compensation mechanisms, for which ,where leadership is an answer to psychological deprivations in childhood (Aberbach, 1995; Kets de Vries, 1989 ). The literature also notes the importance of exposure to esteemed authority figures in the family or in social circles close to the family (Burns, 1978).
Such arguments appear in a steady stream of books about successful leaders of organizations, most of them based on the leaders’ personal memoirs, anecdotes, and outlooks (Bennis, 1989; Bennis & Nanus, 1985). Although psycho-biographies as well as recollections of known leaders might have clinical and practical applications, they are clearly limited with regard to the possibility of generalization.
In recent years, there have been some attempts to conduct studies that have attempted to attain more generalizable value. For example, some research has engaged in locating predictors of leadership, generally

Leaders and Non-Leaders Volume 4, Number 2, 2009 3
identifying leaders on the basis of a certain criterion (e.g., final results in military academies or command courses) and examining predictors such as early leadership experiences and their weight in that criterion (Atwater, Dionne, Avolio, Camobreco, & Leu et al., 1999; Judge & Bono, 2000; Klonsky, 1983; Popper, Amit, Gal, Sinai, & Lisak, 2004). Other recent studies, have focused on the effect of psychological processes during adolescence, which is recognized as a period time of great importance for the development of the adult identity (Erikson, 1959)- as a source of motivation and of the feeling of ability to lead (e.g. Atwater et al., 1999; Schneider, Paul, White, & Holcombe, 1999; Zacharatos, Barling & Kelloway et al., 2000). There are also some reports on the impact of practices such as coaching, feedback, and learning through doing on leaders’ development. Usually, these findings refer to data from before and after the intervention or training, in most cases reported by the people investigated themselves (Day, 2000). All these studies, as mentioned, are based either on psychodynamic premises or learning theories frameworks. Very few attempts have been made to formulate a theoretical framework that is more integrative and particularly oriented to explain leader development.
Gibbons (1986) examined the developmental process of transformational leaders through in-depth personal interviews conducted with a sample of senior managers who were asked to talk about events and experiences in their past from childhood to maturity. She analyzed the events using a combination of three developmental theories: psychoanalytic theory, which focuses on experiences in early childhood (see Zaleznik, 1992), humanistic theory, which deals with internal processes of awareness and self insight (see Allport, 1961), and structural theory, which discusses the interpretation and meaning ascribed by individuals to their experiences (see Kuhnert & Lewis, 1987). Popper and Mayseless (2002), Popper et al. (2005, 2007) and Popper & Amit (forthcoming) developed a leadership formula comprised of three essential components: psychological potential to lead (P), motivation to lead (M ) and developmental processes occurring in later phases in life (D). They claim that the P and M components of this “leadership formula” are formed in the family during early childhood. Of particular importance is the type of bonding the care giver (usually the mother) establishes with the infant (e.g. attachment pattern). The D component is essentially based on experiential learning, that is, experiences occurring in school, sports teams, and other social settings in which the individual takes part.
In sum, the main arguments discussed in the literature on leader development indicates that basically four factors are presented: 1. Conditions and expectations in the family during childhood (Campbell & Dardis , 2004; Klonsky , 1983; Popper , 2005; Shamir & Eilam , 2005 ). 2. Leadership experiences (Akin, 1987; Atwtater et al., 1999). 3. Exposure to leadership role models (Akin, 1987 ; Bennis , 1989; Kortter , 1990). 4. Openness to experiences (Bennis, 1989 ; Judge & Bono, 2000). It can be clearly noticed that one out of the four factors is a personality factor (openness to experiences) whereas all the rest are all circumstantial (atmosphere in the family, leadership experiences, exposure to leadership role models). This study aims at exploring the significance and weight of each of these factors (particularly the importance of the personality variable versus the other variables). We also believe (unlike the reviewed studies that focus solely on leaders) that only through comparison of leaders to non-leaders light be shed on possible unique aspects of leaders’ development. The following hypotheses relate to the factors noted.
1. Family conditions.
Empirical psychological studies conducted in this domain are very few in number (Popper, 2005). Klonsky (1983) studied the family sources of for the development of leadership ability and examined variables such as extent of warmth exhibited by the parents, and the extent and quality of discipline. His research results showed that individuals who were characterized as leaders had undergone intensive socialization. They had received much warmth, but at the same time were subjected to a high level of discipline and were expected to display responsibility and achievements. Similar findings were reported
4 Journal of the North American Management Society Amit, Popper, Gal, Levy, & Lisak
by Kotter (1982), and by senior commanders in the Israeli army (Zakay & Scheinfeld, 1993). Accordingly, our first research hypothesis, in comparing leaders with non-leaders, higher expectations transmitted upon the leaders will be reported. The leaders experience more pressure for achievement (including leadership), and have better relations with parents compared to non-leaders.
2. Leadership experiences.
All the major theories dealing with of learning and developmental psychological processes explicitly or implicitly place experience at the center of the learning process. For example, the learning theories generally identified with Skinner (1989) are based on the law of effect, according to which behavior is guided by past results. If a certain behavior was rewarded in the past, thus receiving positive reinforcement, the probability of that behavior appearing in the future is higher, while unrewarded behaviors will probably appear less and less and may even disappear. More abstract learning according to some leading developmental psychologists, also occurs through processes arising out of experience. For example, Kohlberg (1969) illustrated this with studies on the development of moral thinking, using a strategy defined as role taking experiences, in which an individual has to adopt the point of view of the other. This experience was found to lead to more complex thinking and greater understanding of the other’s judgment.
Aspects such as self-efficacy also develop on the basis of experience. Bandura (1977a, 1986), for example, showed that the sense of success based on experiences in certain areas led to the strengtheneding of self-efficacy in those areas. These principles have proved relevant and applicable in the area of leadership development. Akin (1987) and Kotter (1988) reported that managers retrospectively viewed practical experience as a cardinal learning experience in their development as leaders. Successful experiences in leadership roles, whether in the family framework or in educational or social frameworks, not only show the individual that he or she is perceived by others as a leader, but they also strengthen his or her own belief in his or her ability to be a leader. Leaders’ testimonies revealed that personal experience was an important element in their learning of leadership (Kotter, 1988, 1990). Atwater et al. (1999), seeking predictors of leadership, examined a large number of mental and physical characteristics of freshmen in a military academy. They found that past leadership experiences and self-efficacy differentiated levels of leadership most clearly; students with a rich background of leadership experiences and high self-efficacy belonged to the highest level of leadership. Thus, our second research hypothesis is that leaders will report on more leadership experiences in childhood than non-leaders.
3. Exposure to leadership figures.
Some of the mechanisms that have been found central in processes of learning through experience have also been found relevant for learning that does not stem from direct experience but is based on observation of the behaviors of others. This process was defined by Bandura (1977a, 1986) as vicarious learning. Since every individual is subject to countless stimuli, scholars have attempted to identify and analyze the psychological conditions that are necessary for vicarious learning to take place and be internalized (Bandura, 1997; Maddux, 1995). They found (consistent with the findings of research in learning theory) that when the individual observed was perceived as receiving positive reinforcement, the tendency to emulate his behavior was strengthened. Thus, according to the evidence of leaders, learning about leadership also occurs through observation of or exposure to leadership models (Burns, 1978; London, 2002; Popper & Mayseless, 2002). This argument is supported by findings in leadership research. Leaders in organizations reported that they had learned a great deal about leadership by observing other leaders, particularly their direct managers or officers (Kotter, 1988; Zakay & Scheinfeld, 1993). The possibility of learning through observation is very important, because it expands the opportunities of learning a broad range of behaviors that occur in situations too complex to be created

Leaders and Non-Leaders Volume 4, Number 2, 2009 5
artificially for the purpose of providing direct experience (e.g. crisis situations, battles). In light of this, our third research hypothesis is that leaders will have more leadership role models than non-leaders.
4. Openness to experiences.
This factor includes internal abilities that affect the scope of the exposure and experience, and also the quantity and quality of the reflective process in the leader’s development. The assumption is that people who have the ability to look at themselves and their environment without a rigid armor of defenses will be exposed to more opportunities for learning and will be capable of learning more from their experiences than will people who possess this ability to a lesser degree. In their study, Judge and Bono (2000) have found a modest relationship between openness to experience (one of the Big Five factors of the Big-Five) and transformational leadership. However, this correlation became non-significant in the presence of the other Big Five characteristics. Bennis (1989), London (2002), and Popper (2005), assert that the development of leaders is largely rooted in a capacity for self-insight. They claim that the leader’s development and personal growth is attended by this quality, namely his or her recognition of his or her strengths and weaknesses. Such recognition is essential for the individual’s awareness of himself or herself (his needs, his motives and abilities) and of the way in which he or she is perceived by others. For example, Cox and Cooper (1989) interviewed 45 CEOs and found that their common characteristic was high self awareness regarding of themselves and of their environment. Similar findings were presented by Bennis (1989). Accordingly, our fourth research hypothesis is that leaders are more open to experience (and learning) than non-leaders.
The general argument of this study, indicating the research hypotheses, is presented graphically in Figure 1.
FIGURE 1. DEVELOPMENTAL ASPECT DIFFERENTIATING LEADERS FROM NON-LEADERS
Family condition: H2
relations in the family, parents encouraged to
influence and achieve
Leadership experiences: H2 social status, roles in school, attempts
to change, responsibility at
home, responsibility at
school
Exposure to leadership figures: H3 relation with leadership figures
Openness to experiences: H4 self awareness, learning from failures, risk taking, openness to new experiences, curiosity, originality and intellectual interest.
Leaders High scores
Nonleaders Low scores
6 Journal of the North American Management Society Amit, Popper, Gal, Levy, & Lisak
METHOD
The hypotheses were examined by means of a t-test for independent samples for each variable, and also by a chi-square test.
Participants
The research took place in the Israel Defense Forces (IDF), and the participants were 286 male soldiers toward the end of their basic training. They belonged to four companies: two from the armored corps (169 soldiers) and two from the infantry (117). We distributed questionnaires, and the response in the armored companies was 65% and in the infantry 55%. Between 10% and 20% of the soldiers in the various platoons were new immigrants who had language difficulties answering the questionnaires and were accordingly excluded from the sample. Other soldiers who did not participate were absent for technical reasons (on duty, sick leave, etc.), and it may be assumed that their exclusion was random.
Of the 286 soldiers, 50 were evaluated as leaders and 30 were evaluated as non-leaders (on the basis of the leadership evaluation questionnaire described below). The comparative analysis was conducted on these two groups
Research Instruments
The above- mentioned lack of systematic discussion and research on leaders' developmental psychological aspects is matched by the absence of research tools to measure these aspects. For the purpose of the present study we developed three questionnaires:, one for evaluation of leadership, one for examining the development of leadership (LES), and one for examining openness to new experiences (OE). To develop and examine the research tools we conducted a pilot study among 195 soldiers from one armored company and one infantry company. The soldiers had served in the army approximately three months and were near the end of their basic training. The pilot study was conducted in three stages. In the first stage, we distributed to the soldiers a series of self report questionnaires. In the second stage, two weeks later, we returned to 28 of the soldiers (some 14% of the participants) for semi-structured in-depth interviews. In the third stage (six months later), we revisited the soldiers and again administered the questionnaires in order to test their stability. The semi-structured interview in the second stage of the pilot study included questions about four main subjects: their childhood and schooldays; leadership experiences, exposure to influential leadership figures, openness to experiences, and introspection and self learning in the context of leadership. We constructed three measures of development, which together represent the noted developmental aspects. Each measure was composed of the mean of the scores on the major questions that differentiated leaders from non-leaders.
Leadership evaluation questionnaire
To evaluate the soldier’s leadership we used a sociometric anonymous questionnaire filled out by peers and commanders. It was composed by the research team and is partly similar to the various sociometric questionnaires used in the IDF. The questionnaire examines peers’ and commanders’ perception of the soldiers’ leadership potential at a stage by which they have got to know each other very well. We emphasize that unlike many armies (such as the US army) in which the differentiation between officers and other ranks is determined "institutionally" (mostly through military academies), differentiation in the IDF occurs “naturally" – through a selection process out of the entire cohort. Starting on an equal footing, all Israeli conscripts undergo an ongoing selection process during their initial training period. This situation is a unique laboratory for examining leadership (e.g., Gal, 1986).

Leaders and Non-Leaders Volume 4, Number 2, 2009 7
Every soldier in the platoon was evaluated on two questions: the extent of his influence in the platoon and the extent to which he could be a good commander, on a scale ranging from 1 (very little) to 5 (very much). The questionnaire yielded four scores: two continuous mean scores on the soldier’s leadership based on peers’ rating (influence in the platoon and suitability for command), and two parallel scores based on commanders’ rating. The relationships between these continuous leadership variables proved significant and positive relations. A correlation of 0.79 (p< .01) was found between peers’ and commanders’ ranking on influence, and also between the two groups’ rankings of “a good commander”. Correlations between the two variables (influence and a good commander) within each group were also found to be strong: .87 (p< .01) for peers and .79 (p< .01) for commanders. These findings reinforce our understanding that leadership is a type of influence, and they also show that commanders and peers defined the soldiers’ leadership similarly.
From the leadership evaluation questionnaire we formulated a distinction between two polar groups: leaders and non-leaders. This kind of examination is less common in leadership studies, which, as mentioned, generally focus solely on leaders or examine correlations between leadership variables and other independent variables (Bass, 1990). Since our study deals with the development of leadership and argues for differential development of leaders, we considered thought that comparison with a polar group of non-leaders could illustrate effectively the uniqueness of the group of leaders. The group of leaders comprised soldiers who received a mean score of 4 or above on at least one of the questions (degree of influence or suitability for command) from their peers and commanders alike. The group of non-leaders group was composed of soldiers who received a mean score of 2 or below from both peers and commanders on at least one of the questions. A distribution cutoff determined by the possible answers and not by the distribution of the answers in practice ensured a clear distinction between groups. Since this questionnaire served as the basis for an absolute, not relative, sociometric evaluation (each soldier received a leadership score regardless of the other soldiers in the platoon), this cutoff ensured that those classified in the group of leaders or in the non-leaders group were those who really got an absolute high or an absolute low score respectively, and not just a score relative to the other participants (this division is stricter than a distribution into quartiles, which we also examined).
Construction of the leadership development questionnaire (LSE)
To examine the development of leadership we constructed a questionnaire that examines leadership- shaping experiences (LSE) from childhood to conscription into the military. The questionnaire was composed on the basis of Avolio and Gibbons’ (1988) measure and the semi-structured interviews conducted in the pilot study. We developed the semi-structured interview with the assistance of expert psychologist interviewers. The questions in the interview were divided into the following sections: the interviewee’s childhood; his schooldays; leadership experiences and exposure to influential figures; and questions examining openness to experiences, introspection and self learning in the context of leadership. On the basis of the pilot study, which included 28 interviews, the research team formulated the final version of the semi-structured interview, and this final version served for the construction of the research questionnaire (LSE). As stated, this version was based on Avolio and Gibbons’ model (1988) together with other issues that arose as central in the interviews. The research team members who had conducted interviews in the pilot study shared in developing the questionnaire. The logic behind the construction of this tool was the possibility of quantitative processing of issues that had hitherto been investigated by qualitative methods.
LSE questionnaire.
The questionnaire contained the four sections that appeared in the interview and was designed to measure quantitatively issues that had emerged as central. It comprised 44 closed questions, some of
8 Journal of the North American Management Society Amit, Popper, Gal, Levy, & Lisak
them informative, for example, "What did your parents urge you to achieve?" For some of the informative questions the scale of replies was based on the variety of replies that we had obtained in the pilot interviews. In certain questions the respondent was asked to rank on a 5-point Likert scale such matters as: to the extent he was given responsibility at home,? or the extent he felt in his childhood that his parents encouraged him to exert influence.?
Ten questions in the LSE questionnaire examined issues connected with the respondent’s level of openness, self awareness, and social awareness, and how he coped with failure. These issues had emerged as significant in the semi-structured interviews, and did not receive a satisfactory answer in the existing questionnaire examining on openness to experience (described below). The respondent was asked to rank on a 5-point Likert scale the extent of his agreement with various statements, such as: I am critical of myself; I expend much thought on trying to learn from my failures; when my opinion differs from the majority I prefer not to express it.
Questionnaire for examination of openness to new experiences
To examine the degree of openness to experience, the research team developed a questionnaire based on the NEO PI-R Personality Inventory (Costa & McCrae, 1992a). The NEO PI-R examines five personality factors (the Big Five), one of which is openness to new experiences. In the Hebrew version of the questionnaire this factor is examined by 48 items (Montag & Levin, 1994). The respondent is asked to indicate the degree to which he or she agrees or disagrees with each statement on a 5-point Likert scale ranging from 1 (strongly disagree) to 5 (strongly agree). The Cronbach's alpha reliability coefficient on the openness to experience factor in this Hebrew version is .65 (Montag & Levin, 1994). Our research team developed an abbreviated questionnaire, – Openness to Experiences (OE), comprising 24 items. The main reasons for constructing the new questionnaire were the need to shorten the questionnaires due to the limited time available for administering it in the army, and the need to adapt the language to make it more comprehensible to the participants. The general score on this measure can range from 24 to 120.
The OE questionnaire was validated against the Hebrew version of the original questionnaire (NEO PI-R ) by administering both questionnaires to 113 respondents, men and women, most of them (65%) students at Haifa University and the others attending pre-university courses. Cronbach's alpha reliability coefficient of the new questionnaire iswas .64, and a significant correlation (r= .77, p< .01) was found between the scores of the original and the new questionnaire. The latter was examined in the context of the pilot study, and its reliability level was found to be reasonable and to match the level reported in the literature (Montag & Levin, 1994).
RESULTS
The results presented are based on the division into the four major developmental factors in the model. The first three factors – family conditions in which the individual respondent grew up, his relations with his parents and their expectations of him; and leadership experiences and exposure to models of leadership – were measured by the LSE questionnaire, while the fourth factor, openness to experiences, was examined by analysis of both the LSE questionnaire and the OE questionnaire. Of the 286 soldiers participating in our study, a group of 50 soldiers who were perceived by their peers and commanders as leaders was compared with a group of 30 soldiers who were perceived as non-leaders.

Leaders and Non-Leaders Volume 4, Number 2, 2009 9
Family conditions in which the individual grew up
We wished to evaluate the family relations in the home where the individual respondent grew up, and the extent to which his parents encouraged him to exert influence and pressed him for achievements. Our first research hypothesis was partially supported.
TABLE 1. FAMILY CONDITIONS IN WHICH THE LEADERS AND NON-LEADERS GREW UP – RELATIONS WITH THE PARENTS AND PARENTS' EXPECTATIONS OF
THEM DURING CHILDHOOD, MEANS, STANDARD DEVIATION, T TEST VALUE, AND SIZE OF DIFFERENCE.
Leaders M (SD)
Non-leaders M )SD)
T value
Size of difference Cohen's d
Relations in the family (1 = not good; 5 =very good)
4.66 (0.75)
4.35 (0.98)
1.56 .35
Parents encouraged them to use influence (1 = very little; 5 = very much)
3.98 (0.81)
3.50 (1.21)
1.79
.47
Parents encouraged them to achieve (1 = very little; 5 = very much)
4.45 (0.79)
3.93 (1.06)
2.43* .57
*p < .05. **p< .01
Table 1 shows a small and not statistically significant difference in family relations as reported by leaders and non-leaders. Contrary to our first hypothesis, both groups reported fairly good relations in their immediate family. However, consistent with our hypothesis, there was a significant difference in the extent to which parents encouraged their children to use influence and to achieve. Leaders reported more than non-leaders that their parents had encouraged them to exert influence and achieve.
Leadership experiences and exposure to leadership figures
Table 2 reflects the leadership experience dimension -- the variety of leadership experiences in the framework of the school and the family -- among soldiers who were perceived as leaders and non-leaders. Table 3 shows the percentage in each group (leaders and non-leaders) of those who had experienced leadership and guidance roles in the school and in other frameworks (dichotomous response scale yes/no).
Consistent with our second research hypothesis, Tables 2 and 3 reveal significant differences in all of the questions examining leadership experiences. With the exception of taking responsibility at home (while not statistically significant, the differences between leaders and non-leaders found in this variable are in the direction of the hypothesis). A higher percentage of leaders had experienced leadership roles at school, and a higher percentage of them had attempted to change things in this framework. In addition, the leaders had been more popular than the non-leaders at high school. The questions on leadership experiences proved to have significant positive correlations. Of particular interest is the correlation found between assuming organizational roles and attempting to change things at school (r = .65, p< .01). Significant correlations were also found between the respondent's having assumed organizational roles and his social status at school (r = .42, p< .01), and between social status and the wish to change things at school (r = .35, p< .01). The score on the question about the respondent's cumulative leadership
10 Journal of the North American Management Society Amit, Popper, Gal, Levy, & Lisak
experience was found to be relatively low, but in significant correlation with the other questions (.20<r<.30, p< .01).
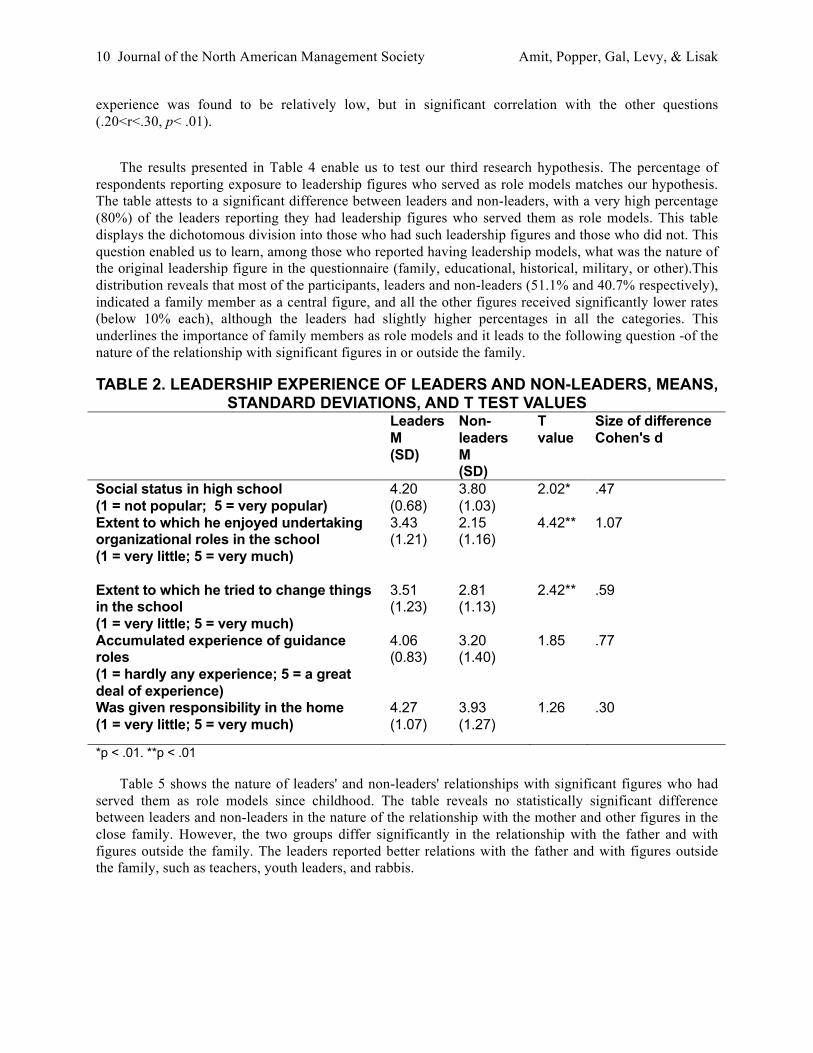
The results presented in Table 4 enable us to test our third research hypothesis. The percentage of respondents reporting exposure to leadership figures who served as role models matches our hypothesis. The table attests to a significant difference between leaders and non-leaders, with a very high percentage (80%) of the leaders reporting they had leadership figures who served them as role models. This table displays the dichotomous division into those who had such leadership figures and those who did not. This question enabled us to learn, among those who reported having leadership models, what was the nature of the original leadership figure in the questionnaire (family, educational, historical, military, or other).This distribution reveals that most of the participants, leaders and non-leaders (51.1% and 40.7% respectively), indicated a family member as a central figure, and all the other figures received significantly lower rates (below 10% each), although the leaders had slightly higher percentages in all the categories. This underlines the importance of family members as role models and it leads to the following question -of the nature of the relationship with significant figures in or outside the family.
TABLE 2. LEADERSHIP EXPERIENCE OF LEADERS AND NON-LEADERS, MEANS, STANDARD DEVIATIONS, AND T TEST VALUES
Leaders M (SD)
Non-leaders M (SD)
T value
Size of difference Cohen's d
Social status in high school (1 = not popular; 5 = very popular)
4.20 (0.68)
3.80 (1.03)
2.02* .47
Extent to which he enjoyed undertaking organizational roles in the school (1 = very little; 5 = very much)
3.43 (1.21)
2.15 (1.16)
4.42** 1.07
Extent to which he tried to change things in the school (1 = very little; 5 = very much)
3.51 (1.23)
2.81 (1.13)
2.42**
.59
Accumulated experience of guidance roles (1 = hardly any experience; 5 = a great deal of experience)
4.06 (0.83)
3.20 (1.40)
1.85 .77
Was given responsibility in the home (1 = very little; 5 = very much)
4.27 (1.07)
3.93 (1.27)
1.26 .30
*p < .01. **p < .01
Table 5 shows the nature of leaders' and non-leaders' relationships with significant figures who had served them as role models since childhood. The table reveals no statistically significant difference between leaders and non-leaders in the nature of the relationship with the mother and other figures in the close family. However, the two groups differ significantly in the relationship with the father and with figures outside the family. The leaders reported better relations with the father and with figures outside the family, such as teachers, youth leaders, and rabbis.

Leaders and Non-Leaders Volume 4, Number 2, 2009 11
TABLE 3. PERCENTAGES OF LEADERS AND NON-LEADERS WHO HAD EXPERIENCED LEADERSHIP ROLES, CHI SQUARE TEST AND CRAMER'S V
Leaders Non-leaders
χ² (df = 1)
Strength of relationship Cramer's V
Roles involving responsibility in junior high and high school (1 = yes; 0 = no)
58%
28% 6.06* .29*
Guidance roles in other social frameworks (1 = yes; 0 = no)
71% 33% 10.36** .40**
*p < .05. ** p < .01
TABLE 4. PERCENTAGES OF LEADERS AND NON-LEADERS WHO REPORTED THAT THEY WERE EXPOSED TO LEADERSHIP FIGURES WHO SERVED AS ROLE
MODELS, CHI-SQUARE AND CRAMER'S V TESTS Are there leadership figures whom you see as a source for imitation? (1 = yes, 0 –no)
Leaders
Non-leaders
χ² (df = 1)
Strength of relationship Cramer's V
80%
51.9% 6.03* .30*
*p < .05. ** p < .01
TABLE 5. RELATIONSHIP WITH SIGNIFICANT FIGURES: DIFFERENCES BETWEEN LEADERS AND NON-LEADERS, MEANS, STANDARD DEVIATIONS,
AND T TEST Significant figures (1 = not good relations; 5 very good relations)
Leaders M )SD(
Non-leaders M (SD)
T value
Size of difference Cohen's d
Father 4.66 (0.67)
3.96 (1.27)
3.06**
.72
Mother 4.65 (0.77)
4.35 (1.06)
1.41
.34
Close family (siblings, grandfather, grandmother)
4.72 (0.65)
4.50 (0.91)
1.08 .28
A figure outside the family 4.59 (0.56)
3.90 (1.07)
3.06**
.85
*p < .05. ** p < .01

12 Journal of the North American Management Society Amit, Popper, Gal, Levy, & Lisak
Openness to experiences
As described in the subsection on research instruments, the openness to leadership experiences dimension was examined by a combination of two measures. One measure consisted of ten questions from the LSE questionnaire which examined aspects concerning of the participant's level of openness, his self awareness and social awareness, and his manner of coping with failures. The reliability score obtained for this scale was sufficient (α= .71). On the basis of the participants' reports, it was found that the leaders' score on this measure (M = 3.83; SD = .39) was higher than that of the non-leaders' (M = 3.24; SD = .50), and the difference was statistically significant (t = 5.53; p < .01, d =1.33). In general, the leaders in our study were more critical of themselves, learned more from their failures, were less afraid of taking risks, and were less concerned about the possibility of having unusual opinions.
The second measure was calculated from the openness to experiences (OE) questionnaire and included matters such as openness to new experiences and accompanying characteristics – curiosity, imagination, originality, and intellectual interest. Based on the participants' reports, the leaders' score on this measure (M = 3.70; SD = .39) was higher than that of the non-leaders' (M = 3.45; SD = .38), and the difference was statistically significant (t = 3.53, p < .01 d=.81).
In the combined openness measure the leaders were significantly higher (M = 3.76; SD = .29) than the non-leaders (M = 3.34; SD = .35), statistical significance (t = 5.23; p < .01, d = 1.29). The reliability score obtained for this combined scale was sufficient (α= .75). These results support our hypothesis, namely leaders are more open to experience than non- leaders.
SUMMARY OF ANALYSIS
The comparative analysis indicated that leaders and non-leaders had some distinctly different developmental characteristics. The leaders perceived themselves as individuals who grew up in homes where their parents had urged them to achieve more and encouraged them to exert influence; they had been exposed more to significant figures in their childhood, and their relations with the father and with figures outside the family were better than those of the non-leaders. They recalled themselves as experiencing more leadership roles in at high school, enjoyed higher social status at school, and tried more to change things in the school framework. Differences were also found in the level of openness. The leaders proved more open to new experiences, were less afraid of taking risks, were less concerned about the possibility of being unusual in their opinions, and learned more from their mistakes.
MULTIVARIATE ANALYSIS
In addition to the comparative analysis between leaders and non-leaders, a multivariate regression analysis (Ordinary Least Square- OLS) was conducted on all our research sample (286 soldiers) in order to predict leadership by the various developmental variables. This analysis enabled us to examine the relative influence of the groups of independent variables. The leadership score was calculated as a mean of the four continuous leadership evaluation scores (by peers and commanders in the platoon). The reliability score obtained for this scale was high (α= .93).
The independent variables were computed as follows: (a) family conditions index - a mean score of the three relevant questions (specified in table 1) (α= .67); (b) leadership experience index - a mean score of the seven relevant questions (standardized) (specified in tables 2 & 3) (α= .71); (c) relations with
Leaders and Non-Leaders Volume 4, Number 2, 2009 13
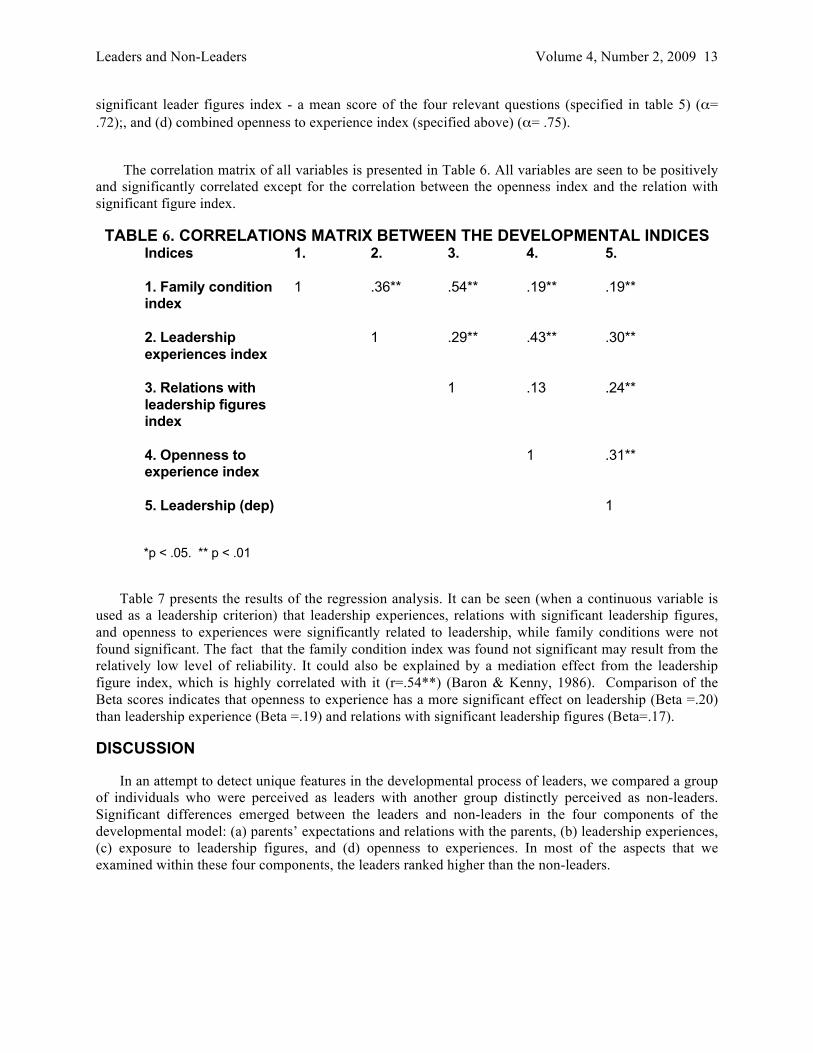
significant leader figures index - a mean score of the four relevant questions (specified in table 5) (α= .72);, and (d) combined openness to experience index (specified above) (α= .75).
The correlation matrix of all variables is presented in Table 6. All variables are seen to be positively and significantly correlated except for the correlation between the openness index and the relation with significant figure index.
TABLE 6. CORRELATIONS MATRIX BETWEEN THE DEVELOPMENTAL INDICES Indices
1. 2. 3. 4. 5.
1. Family condition index
1 .36** .54** .19** .19**
2. Leadership experiences index
1 .29** .43** .30**
3. Relations with leadership figures index
1 .13 .24**
4. Openness to experience index
1 .31**
5. Leadership (dep)
1
*p < .05. ** p < .01
Table 7 presents the results of the regression analysis. It can be seen (when a continuous variable is used as a leadership criterion) that leadership experiences, relations with significant leadership figures, and openness to experiences were significantly related to leadership, while family conditions were not found significant. The fact that the family condition index was found not significant may result from the relatively low level of reliability. It could also be explained by a mediation effect from the leadership figure index, which is highly correlated with it (r=.54**) (Baron & Kenny, 1986). Comparison of the Beta scores indicates that openness to experience has a more significant effect on leadership (Beta =.20) than leadership experience (Beta =.19) and relations with significant leadership figures (Beta=.17).
DISCUSSION
In an attempt to detect unique features in the developmental process of leaders, we compared a group of individuals who were perceived as leaders with another group distinctly perceived as non-leaders. Significant differences emerged between the leaders and non-leaders in the four components of the developmental model: (a) parents’ expectations and relations with the parents, (b) leadership experiences, (c) exposure to leadership figures, and (d) openness to experiences. In most of the aspects that we examined within these four components, the leaders ranked higher than the non-leaders.

14 Journal of the North American Management Society Amit, Popper, Gal, Levy, & Lisak
TABLE 7. REGRESSION ANALYSIS FOR PREDICTION OF LEADERSHIP. Variables Coefficients
SE Beta
Family condition index
-.01 .09 -.01
Leadership experiences index .23**
.09 .19
Relations with leadership figures index
.27* .12 .17
Openness to experience index .46**
.16 .20
Constant
.38
.76
F value
10.16**
R2 adjusted
.15
No. of cases 216
*p < .05. ** p < .01
Parents’ expectations: The leaders were more aware of their parents' high expectations of them for achievement and influence. Their self-reports indicate that they had internalized the expectations communicated to them during their socialization process. Many studies refer to a Pygmalion effect, whereby expectations absorbed from the environment, particularly from respected authority figures, become self-fulfilling prophecies, self-expectations that guide the individual’s aspirations and behaviors (see review of studies in Eden, 1990).
Moreover, encouragement to acquire influence may be seen as an expectation for achievements, particularly in the Anglo-American culture, where leadership is perceived in terms of social prestige and as an expression of social success (Dorfman, 1996).
Relations with parents: The leaders were found to have closer relationships with the father. As the research sample was composed exclusively of men, we may suggest a psychoanalytic interpretation of the father’s influence in the context of leadership. The psychoanalytic literature on leaders (e.g. Burns, 1978; Popper, 2000; Zaleznik, 1992) discusses this in terms of the Oedipal explanation (Freud, 1920). Burns (1978), for example, in analyzing several leaders, discerned a similar pattern in their development: - close and loving relations with the mother and admiration for the father.
Another possible explanation is related to Bandura’s (1977a) social learning theory, according to which fathers may be perceived, especially by young sons, as manifestly more worthy of imitation than other people. The reported correlation attests to the quality of the emotional bonding with the father. It does not necessarily show the direction of this relationship, but as Bandura argues, it indicates the fulfillment of the emotional preconditions required for social learning (this psychological process will be elaborated upon later).
Leadership experiences: The leaders, according to their own reports, ranked distinctly higher than the non-leaders in the categories referring to actual experience of leadership roles (guiding and organizational

Leaders and Non-Leaders Volume 4, Number 2, 2009 15
roles) as well as in their self-perception regarding their tendency to assume organizational roles at school and their perception of their social status there. On the methodological level, this finding provides further validation of our original classification into leaders and non-leaders. The leaders had experienced more leadership roles and remembered themselves as enjoying their use of influence and their high social status. The findings on concrete experiences of leadership, the high correlation of these experiences with the perception of the tendency to undertake leadership roles, and the fact that memories of this nature are common to the group of leaders as opposed to the very different memories shared by the other group – all these seem largely to negate the possibility that the differences are simply random recollections.
Exposure to and influence of leadership figures: The results indicate that leaders attach greater importance than do non-leaders to the father and other authority figures outside the family (youth leaders, teachers, etc.). A possible explanation for this may be based on Bandura’s (1977a, 1977b) social learning theory, according to which individuals tend to adopt and imitate social behaviors that they perceive as rewarding: people who are perceived as successful become models for imitation. This mechanism of learning through observation and imitation has indeed been found in the self-reports of many leaders in reference to a father whom they perceived as important and successful (see , for example, Burns, 1978; Chadha, 1997; Sampson, 1999). Burns (1978) and Bennis and Nanus (1985), in analyzing a large group of outstanding leaders, pointed out that all of them had mentors who strongly influenced various aspects of their leadership. This group of mentors included a broad range of authority figures whom the leaders had encountered in the course of their early lives, from sports instructors through school principals, teachers, newspaper editors, to politicians.
Openness to experiences: The major characteristics of openness to experience, as examined by the LSE and the OE questionnaires, concerned the respondents’ level of openness, self-awareness and social awareness, manner of coping with failure, curiosity, originality, and intellectual interest. In all these aspects, which were examined both separately and by the combined LSE and OE index, the leaders scored higher than the non-leaders.
While family conditions and leadership experiences are contextual variables, openness to experience is a personality variable that might have a different theoretical stand grounding. Indeed, openness as measured by the NEO Inventory was found to be in high correlation with variables that are clearly of central importance in development processes, such as experience seeking r = .43 (Zuckerman, Kuhlman, Joireman, Teta, & Kraft, 1993), and flexibility r = .42 (McCrae, Costa, & Piedmont, 1993), and in negative correlation (-.56) with tough-mindedness (Conn & Rieke, 1994). Openness to experiences can also contribute to the understanding of the social dimension of leaders described as socialized leaders (Popper, 2000, 2002). Guttman (1995) found that problems in human relations were more prevalent among individuals who were classified as low in openness. Similar findings were presented by Kirton (1976) and Gilbert (1991). Some researchers have shown that openness appears in early childhood and remains stable over the years. Costa and McCrae (1992b) reported a correlation of .66 between two indices of openness over an interval of 24 years. Finn (1986) reported a correlation of .62 with intellectual interest over a gap of 30 years. McCrae and Costa (1990) reported that analysis of the means on openness indicates a slight and insignificant decrease with advancing age, despite the stereotype that sees older people as more conservative and rigid. In other words, openness to experiences is possibly a basic personality feature that makes a future impact both on the people's actual willingness to experience leadership roles and on the scope, intensity, and ability to learn retrospectively from leadership experiences and from encounters with figures who have exert a possible influence on them in terms of vicarious learning (Bandura, 1997). That is to say, the basic ability to learning and development, whose seeds are sown in early childhood, meets the opportunity – the relevant social context for manifestation of
16 Journal of the North American Management Society Amit, Popper, Gal, Levy, & Lisak
leadership, prevalent context during the school years. Later successful experiences of leadership reinforce the individual’s self-efficacy (Bandura, 1977b, 1997). This process is advanced by the bestowal of social status on the leader's position (Dorfman, 1996). Initial indications of this research direction were recently presented by several researchers, who argued that internal representations formed in early childhood create a differential potential for development as leaders. For example, Mikulincer and Florian (1995) found that soldiers who were rated as leaders in sociometric evaluations were characterized by a secure attachment style. Attachment style is formed in early childhood (Bowlby, 1969). Similar results were presented by Popper, Mayseless, and Castelnovo (2000), and by Popper et al., Amit, Gal, Sinai, & Lisak (2004).
This argumentation is in line with the foremost psychological theories in developmental psychology, namely, that early childhood is a formative period (e.g., Bowlby, 1969; Freud, 1920; Kohut, 1971). This subject merits comprehensive research in itself. The broader argument is that in the developmental process there is a distinction between basic elements, such as openness, which are formed in early childhood or might even be genetic (Arvey, Rotundo, Johnson, and & McGue, in press), and "pure" acquired variables, such as self-efficacy.
In sum, the findings of this study present important differences between leaders and non-leaders, and this opens a new direction in research on leaders' development – a direction that is clearly missing from empirical psychological research on leadership. Future studies should also involve a broader range of participants in order to ensure better representation of the general population (in terms of age, gender, etc.). Although the multivariate findings point to the importance of openness to experiences, leadership experiences, and relations with leadership figures in predicting leadership, there may be other variables that are relevant for investigating the differences between leaders and non-leaders. Future studies should address this expansion of the variables. Moreover, as mentioned, leadership experiences, exposure to leadership role models, and openness do not share the same theoretical status. Future studies should treat questions such as the origins of these predispositions as well as their impact on leadership development.. Such efforts could add more psychological knowledge regarding the developmental processes distinctively related to leaders’ development.
REFERENCES
Aberbach, D. (1995). Charisma and attachment theory: A cross disciplinary interpretation. International Journal of Psychoanalysis, 76, 845-855.
Akin, G. (1987). Varieties of managerial learning. Organizational Dynamics, 16 (2): 36-48.
Allport, G.W. (1961). Pattern and growth in personality. New York: Holt, Rinehart & Winston.
Arvey, R., Rotundo, M., Johnson, W., & McGue, M. (in press). The determinants of leadership role occupancy: Genetic and personality factors. Leadership Quarterly.
Atwater, L. E., Dionne, S., Avolio, B., Camobreco, J.F., & Leu, A.W. (1999). A longitudinal study of the leadership development process: Individual differences predicting leader effectiveness. Human Relations, 52 (12): 1543-1562.
Avolio, B. J. & Gibbons, T.C. (1988). Developing transformational leaders: A life span approach. In J.A. Conger & R. N. Kanungo (Eds.) Charismatic leaders (pp. 276-308). San Francisco: Jossey-Bass.
Bandura, A. (1977a). Social learning theory. Englewood Cliffs, NJ: Holt, Rinehart & Winston.

Leaders and Non-Leaders Volume 4, Number 2, 2009 17
Bandura, A. (1977b). Self-efficacy: Toward a unifying theory of behavioral change. Psychological Review, 84 (2): 191-215.
Bandura, A. (1986). Social foundations of thought and action: A social cognitive view. Englewood Cliffs, NJ: Prentice-Hall.
Bandura, A. (1997). Self-efficacy: The exercise of control. New York: Freeman.
Baron, R.M. & Kenny, D.A. (1986). The moderator-mediator variable distinction in social psychology research: Conceptual, strategic and statistical considerations. Journal of Personality and Applied Psychology, 51: 1173-1182.
Bass, B. (1990). From transactional to transformational leadership: Learning to share the vision. Organizational Dynamics, 18 (3): 19-36.
Bennis, W. G. (1989). On becoming a leader. New York: Addison Wesley.
Bennis, W.G. & Nanus, B. (1985). Leaders: The strategies for taking charge. New York: Harper and Collins.
Bowlby, J. (1969). Attachment and loss. Vol. 1. New York: Basic Books.
Burns, J.M. (1978). Leadership. New York: Harper & Row.
Cambell, D., J. & Dardis , G., J. . (2004). The “Be, Know , Do" model of leader development . New York , Human Resource Planning , 27 (2): 26.
Chadha, Y. (1997). Gandhi: A life. New York: Wiley.
Conn, S.R., & Rieke, M.L. (1994). The 16PF fifth edition technical manual. Champaign IL: Institute for Personality and Ability Testing.
Costa, Jr. P.T. Jr., & McCrae, R.R. (1992a). Revised NEO personality inventory (NEO-PI-R) and NEO five-factor inventory (NEO-FFI) professional manual, Odessa, FL: Psychological Assessment Resources.
Costa, Jr. P.T. Jr., & McCrae, R.R. (1992b). Trait psychology comes of age. In T.B. Sonderegger (Ed.), Nebraska Symposium on motivation: Psychology and aging (pp. 169-204). Lincoln: University of Nebraska Press )pp. 169-204).
Cox, C. J., & Cooper, C.L (1989). The making of the British CEO: Childhood, work experience, personality, and management style. Academy of Management Executive, 3: 241-245.
Day, D.V. (2000). Leadership development: A review in context. Leadership Quarterly, 11: 581-613.
Dorfman, P. (1996). International and cross-cultural leadership. In B. J. Punnett & O. Shenkar (Eds.), Handbook for international management research (pp. 267-349). Oxford, UK: Blackwell.
Eden, D. (1990). Pygmalion in management: Productivity as a self-fulfilling prophecy. Lexington, MA: Lexington.
Erikson, E. (1959). Identity and the life cycle. Bloomington: Indiana University Press.
Finn, S. E. (1986). Stability of personality self-ratings over 30 years: Evidence for an age/cohort effect. Journal of Personality and Social Psychology, 50: 813-818.
Freud, S. (1920). A general introduction to psychoanalysis. American Edition. (pp. 363-365) Garden City, NY.
Gal, R. (1986). A portrait of the Israeli soldier. Westport, CT: Greenwood Press.
Gibbons, T.C. (1986). Revisiting the question of born vs. made: Toward a theory of development of transformational leaders. Doctoral dissertation. Fielding Institute, Santa Barbara, C.A.

18 Journal of the North American Management Society Amit, Popper, Gal, Levy, & Lisak
Gilbert, D.G. (1991). A personality X personality X setting. Biosocial model of interpersonal affect and communication. In D.G. Gilbert & J.J. Connolly (Eds.), Personality, social skills, and psychopathology: An individual differences approach. New York: Plenum, pp. 107-135.
Guttman, M.B. (1995). Personality structure and interpersonal problems: A theoretically guided item analysis of the Inventory of Interpersonal Problems. Assessment, 2: 343-361.
Iremonger , L . (1970). The Ffiery Cchariot . London: , Secker & Warburg .
Judge, T.A., & Bono, J.E. (2000). Five-factor model of personality and transformational leadership. Journal of Applied Psychology, 85 (5),751-765.
Kets De Vries, M.F.R. (1989). Prisoners of leadership. New York: Wiley.
Kirton, M. (1976). Adaptors and innovators: A description and measure. Journal of Applied Psychology, 61 (5): 622-629.
Klonsky, B.G. (1983). The socialization and development of leadership ability. Genetic Psychology Monographs, 108: 97-135.
Kohlberg, L. (1969). Stages in the development of moral thought and action. New York: Holt, Rinehart & Winston.
Kohut , H.(1971). The analysis of the self . New York: International Universities Press.
Kotter, J.P. (1982). The general manager. New York: The Free Press.
Kotter, J. P. (1988). The leadership factor. New York: The Free Press.
Kotter, J.P. (1990). A force for change: How leadership differs from management. New York: The Free Press.
Kuhnert, K.W., & Lewis, P. (1987). Transactional and transformational leadership: A constructive/developmental analysis. Academy of Management Review, 12 (4): 557-648.
London, M. (2002). Leadership development: Paths to self-insight and professional growth. Mahwahn, NJ: Erlbaum.
Maddux, J.E. (Ed.). (1995). Self-efficacy, adaptation, and adjustment: Theory, research and application. The Plenum Series in Social/Clinical Psychology. New York: Plenum.
McCrae, R. R., & Costa, P.T. Jr. (1990). Personality in adulthood. New York: Guilford Press.
McCrae, R.R., Costa, P.T. Jr., & Piedmont, R.L. (1993). Folk concepts, natural language, and psychological constructs. The California Psychological Inventory and the five factor model. Journal of Personality, 61:1-26.
Mikulincer, M., & Florian, V. (1995). Appraisal of and coping with a real life stressful situation: The contribution of attachment styles. Journal of Personality and Social Psychology, 21(4): 406-414.
Montag, I., & Levin, J. (1994). The five-factor personality model in applied settings. European Journal of Personality, 8: 1-11.
Popper, M. (2000). The development of charismatic leaders. Political Psychology, 21(4): 729-744.
Popper, M. (2002). Narcissism and attachment patterns of personalized and socialized charismatic leaders. Journal of Social and Personal Relations, 19 (6): 796-808.
Popper, M. (2005). Leaders who transform society. Westport, CT: Praeger.
Popper, M., Amit, K., Gal, R., Sinai, M., & Lisak, A. (2004). The capacity to lead: Major psychological differences between “leaders” and “non-leaders”. Military Psychology, 16 (4): 245-263.
Leaders and Non-Leaders Volume 4, Number 2, 2009 19
Popper, M., & Mayseless, O. (2002). Internal world of transformational leaders. In B. Avolio & F. Yammarino (Eds.), Transformational/charismatic leadership: The road ahead. New York: Elseveier.
Popper, M., Mayseless, O., & Castelnovo, O. (2000).Transformational leadership and attachment. Leadership Quarterly, 11(2): 267-289.
Popper, M ., Amit , K .(forthcoming ) Attachment and leaders' development via experiences . Leadership Quarterly.
Sampson , A .(1999).Mandela . London : Harper and Collins .
Schneider, B., Paul, M.C., White, S.S., & Holcombe, K.M. (1999). Understanding high school student leaders. 1. Predicting teacher ratings of leader behavior. Leadership Quarterly, 10: 609-636.
Shamir , B. . & Eilam , G . (2005). What is your story ? A life-stories approach to authentic leadership development . Leadership Quarterly, 16, (3): 39.
Skinner, B.F. (1989). Recent issues in the analysis of behavior. Columbus, Ohio, Merril Publications .
Zacharatos, A., Barling, J., & Kelloway, E.K. (2000). Development and effects of transformational leadership in adolescents. Leadership Quarterly, 11(2): 211-226.
Zakay, E., & Scheinfeld, A. (1993). Outstanding battalion commanders. Research report, School of Leadership Development, Israel Defense Forces (Hebrew).
Zaleznik, A. (1992). Managers and leaders: Are they different? Harvard Business Review, March- April, 126-133.
Zuckerman, M., Kuhlman, D.M., Joireman, J., Teta, P., & Kraft, M. (1993). A comparison of three structural models for personality: The big three, the big five, and the alternative five. Journal of Personality and Social Psychology, 65: 757-768.

Journal of the North American Management Society, Volume 4, Number 2, 2009
Faculty Development through Training: Political and Public Relations Implications
Claretha Hughes, University of Arkansas
Abstract: Many changes occur for reasons related the political atmosphere of an organization and/or its public relations status within the broader community. The first campus-wide training and development opportunity for faculty at a major, research institution in Southwestern Virginia occurred, partly, as a result of political and public relations concerns related to its emerging technological environment on campus. The success of this endeavor is perceived to have improved the political and public relations status of the University with regards to integrating technology into instruction. The concept of using tangible/measurable barriers as incentives appeared to influence the success of the program.
INTRODUCTION
The computer technology environment on campuses throughout the world began to change as the World WideWeb (WWW) expanded and individuals recognized its usefulness within the academic environment. The campus within this study was no exception. Integrating computer technology usage into the campus environment and convincing faculty to use it effectively was an issue of concern. Enhancing public relations and the political environment within the campus community and the state played a role in the implementation and acceptance of computer use within instruction on the campus. Pressure from parents, students, legislators, interested citizens and faculty themselves who felt that some faculty, particularly at major universities should teach more students (State Council of Higher Education for Virginia (SCHEV), 1993). “Teaching, in short, had become a public relations problem for university administrators…” (Nespor, 2006, p.47). Computer technology was perceived as one way to achieve the goal of teaching more students. According to Tilly (2001) computer-mediated instruction (CMI) has spread unevenly across the university as a product of contentious processes and the “actors ranging from legislators and university administrators to professors and students try to configure these relations to protect or extend their autonomy and influence" (Nespor, 2006, p. 2).
Although many faculty may have recognized the potential benefits offered by computer technology and the opportunities it would provide them in the classroom, they may not have been willing to invest the time needed to develop and enhance their skills. The barriers faculty were reluctant to address included: (a) upfront time required to develop their materials using a new technology; (b) lack of hardware and/or software resources; (c) funds to update hardware and/or software; and (d) experience, technical assistance and support needed to succeed (Eifler, Greene, & Carroll, 2001; Ndahi, 1998). Overcoming these barriers to incorporate computer technology into their instruction may or may not have been perceived as too difficult for the payoff that was to be obtained by faculty; yet, the public relations and political costs of not using computers within the instructional environment may be higher. Dealing with the barriers faced by faculty became a central part of the incentives that the Faculty Development Institute (FDI) used to motivate them to participate in the training program.
Organizations establish programs to achieve specific goals and expectations. Often their goals are achieved over longer terms and objectives are broader than specific goals of individuals or developers.

Faculty Development Through Training Volume 4, Number 2, 2009 21
Developers create programs to achieve certain goals and expectations as outlined by their affiliated organization. Programs are often designed to teach specific concerns. Outcomes of goals and expectations of all stakeholders may or may not be the same. Key issues of whether these goals and expectations match up hinge on effective communication before, during, and after program implementation. If goals and expectations for a program held by stakeholders involved are good matches, the stakeholders are usually satisfied and the program is often seen as having been valuable and successful for all involved. However, if there was a poor match between goals and expectations of stakeholders, they may not be satisfied; therefore, they perceive the program as ineffective, unsuccessful or a waste of resources.
In an attempt to address specific faculty needs, the university decided to enhance and build upon the idea of a formal faculty-training medium through the FDI. FDI was the first introduction of a large scale, formal faculty training program to this university environment. The university and FDI developers had specific goals and expectations with regards to the FDI program. Their goals and expectations may not have aligned with each other and may not have been met. The degree to which they did align or were met was likely to be a determining factor in the extent to which all involved with the program viewed the program as having been effective and valuable. If they did not align, the effectiveness and value of the program may have been questionable. The extent to which the outcomes were valued also affects the extent to which they were implemented. If the organization, developers, and participants value outcomes, it was likely to be continued and possibly expanded. Thus, the organization may choose to invest more resources, developers may enhance workshops and /or add new workshops, and the participants may come back for further workshops and implement acquired skills into their instruction.
The changing culture of students who came to campus expecting to use their existing computer skills and the need to make the process of learning more efficient and effective were determinants for development of a training entity that could help faculty acquire computer skills they needed in a relatively short period of time.
The vision of the FDI as initially implemented at the university is as follows:
A major initiative in instructional computing will transform the academic lives of all students and faculty and change the nature of teaching and learning at the university. Anticipated outcomes include courses with more emphasis on active and independent learning strategies, problem solving and collaboration; strengthened student competitiveness in the job market; improved student retention; improved quality of interactions among students and faculty; and improved use of computer skills by students and faculty throughout the entire academic enterprise. The university would gain from making a major commitment to its teaching mission that will enhance our competitiveness in student recruiting and placement while strengthening the long-term appreciation of alumni for the institution. (Instructional computing proposal, 1992, p.1)
Eight anticipated outcomes were expected four years after beginning the FDI initiative. However, the following four were essential to this study as they relate to faculty use of technology in instruction:
All faculty will receive a highly functional computer and an installed set of core software productivity programs (or a credit voucher towards a computer of even higher functionality). This will provide an

22 Journal of the North American Management Society Hughes
equitable baseline of computing technology for all faculty. Periodic replacement of these computers is included.
All faculty will be better prepared to take advantage of computing technologies by participating in summer faculty development workshops, hands-on software training, and small-group faculty-led discussions on re-thinking instruction. Faculty will be encouraged to develop and assess alternative approaches that unlock courses from traditional formats by making increasing use of computer-aided multimedia instruction, both in and out of classrooms.
There will be substantially different and higher levels of contact between students and faculty, through greatly increased use of electronic mail, electronic discussion groups, and “24-hour electronic office hours.”
All students and faculty will have 24-hour access to improved technical support and consulting on the common core of supported desktop software programs. Faculty will have enhanced access to professional staff and a support lab for help using new technologies in teaching. (Instructional computing proposal, 1992, p.2)
These four anticipated outcomes have been identified by Eifler, Greene, & Carroll (2001) and Ndahi (1998) as barriers that faculty faced when asked to integrate technology into their instruction. FDI appears to have made it a goal to eliminate barriers for the faculty at this University. FDI provided short-term training focused on utilizing computer technology for instruction based on perceived needs and specific objectives. Facultywere provided skills training on the use of computer technology within the instructional process. In addition, they had an opportunity to be actively involved in their skill development and gained access to technical assistance resources that allowed them to work at their own pace. They were allowed the opportunity to build relationships with other participants and facilitators of the FDI workshops and to use these individuals and other peers as mentoring/coaching resources after leaving the workshop(s). They were also provided written documentation of training materials that were specifically designed to meet their needs during, and as a reference after, the workshop.
This article offers an applied study assessing the impact of a training program on university faculty development. To assess the effectiveness of the FDI program for faculty training and development, the following research questions guided this study:
What were the goals and expectations of the university and FDI developers?
What were the perceived outcomes for the university and FDI developers?
THEORETICAL FRAMEWORK
Kirkpatrick (1994) developed four levels of an evaluation that have been extensively used by trainers and evaluators. They are: (1) Reaction – how participants react to program, (2) Learning – a measurable change in participants' attitudes, knowledge, and/or skill after attending the program, 3) Behavior – a measurable change in behavior after the participant attended the program and (4) Results – the overall results that occurred after participants attended the program (Kirkpatrick, 1994). Cascio (1998) concisely described the purpose of evaluation as a dichotomous outcome (i.e. either a program has value

Faculty Development Through Training Volume 4, Number 2, 2009 23
or it does not). Sackett and Mullen (1993) identified four reasons to evaluate training: (a) to make decisions about the future use of a training program or technique (e.g., continue, modify, or eliminate), (b) to make decisions about individual trainees (e.g., certify as competent, provide additional training, etc.), (c) to contribute to a scientific understanding of the training process, or (d) for political or public relations purposes (e.g., documenting success may increase the training function's credibility and visibility within an organization). They also felt that if concern for one of the first two (i.e., a program will not be repeated and no personnel decisions will be based on trainee performance), evaluation is unlikely unless the evaluator has a strong enough interest in the third or fourth to expend the resources needed for evaluation. All of their reasons were important to this study; however, c and d contributed most to the purpose.
Limitations of this study are self-serving bias and personal recall theory. Self-serving bias is “centered on the premise that people tend to accept responsibility for successes while blaming external factors for failures” (Miller & Ross, 1975, p.214). The developers of the program in essence based their career achievement on the success of this program. They may not have shared all of the negatives associated with the program. Weaknesses found with personal recall are that the prior response is likely to be:
biased when states (a) have changed and respondents are unaware of the change, (b) have changed and respondents uniformly miscalculate the degree or nature of the change, and (c) are stable and respondents assume that they have changed in a particular fashion … people exaggerated their consistency over time and inappropriately inferred that a prior response followed from their current state; people overestimated the extent to which their present state differed from an earlier state – they inferred a prior response that was too much at variance with their current status; and evidence was found that linked both of the above mentioned biases to people’s implicit theories of stability and change for the attribute in question. (Ross, 1989, p.351)
The developers’ responses were captured years after the program had been developed; therefore, there may be some personal bias in their responses.
REVIEW OF RELATED LITERATURE Human Resource Development (HRD)
Human resource departments within organizations are designed in part to assist employees in their professional development. Training and development activities are “planned programs of organizational improvement undertaken to bring about a relatively permanent change in employee knowledge, skills, attitudes, or social behavior” (Cascio & Aquinis, 2005, p.381). HRD also focuses on the individual’s ability to perform what has been learned in training and development activities after returning to the job. Performance is described as the demonstration of learning; the "observable, measurable behavior from which we infer learning” (Cascio & Aquinis, 2005, p. 381). HRD departments within organizations try to ensure that learning occurs whenever any training and development activity has been provided. One of the most prevalent areas of focus for HRD and training and development efforts throughout the past decade has been computer training and education because of the information technology revolution.
Training and education are processes or methods that are often used to introduce new technological innovations to individuals within organizations. Training is narrow in the sense that it focuses on the "gap" as described by Silberman (1998) or the assessed need of the individual to acquire some specific knowledge and/or skill. Training is often short-term and specific to a particular environment or task. It

24 Journal of the North American Management Society Hughes
also focuses on processes and/or procedures needed to perform one or more tasks by providing specific 'need to know' information to the individual.
Education, much broader in nature than training, is designed to prepare individuals for future aspirations as opposed to current needs. It often provides general, as opposed to specific, knowledge and/or skills, and in contrast to training, is more long-term and general in nature. It is a more all-encompassing process of acquiring knowledge. Education focuses more on theory and background of applications as opposed to practical application. Training and education are different in many respects; however, they are similar with regard to their primary purpose, which is to transfer knowledge to an individual.
Faculty Professional Development
Professional development of faculty on a university campus is a special case of HRD. Considerable learning occurs within organizations, but not all of it is planned. “Some of this learning is planned and formally sanctioned by the organization, but much of it is serendipitous, unplanned, and informal (e.g., learning from someone who has the inside ‘track’)” (Cascio & Aquinis, 2005, p.381). Traditionally, university faculty have acquired training and education through self-study, informal collaboration with peers, seminars, workshops, and professional conferences; however, those forms of skill acquisition techniques were often not specific in detail nor did they provide opportunities for faculty to develop their skills through practice. This training was often not directly related to the instructional roles of faculty.
Faculty were constantly in contact with students and were the ones who needed to become adept at providing these computer enabled resources to students. Because of their unique positions, faculty were considered to be in the optimum position for imparting new and evolving knowledge. Thus, faculty were placed in situations that may not always have been comfortable for them and required that they acquire additional knowledge and/or skills to provide necessary information to their students. In the past, course materials primarily consisted of written documentation (i.e. books, papers, course handouts, etc…) and whatever the student could obtain through lectures, labs, workshops, etc. In order to enhance student comprehension of the subject matter being presented, faculty spent considerable time preparing and revising their materials. The addition of computer technology does not reduce the amount of time faculty members must spend preparing (Deden, 1998). They could not take for granted that computers alone would enhance student learning. Course materials using computer technology needed to be well designed and much consideration given to how the materials were implemented into the instruction (Oliver, Omari, & Herrington, 1998)
The organization of FDI resembled more of a formal training program than a traditional education program. It provided short-term, specific training focused on the task of computer technology utilization in instruction. It was based on a perceived need and specific objectives. Its focus was not on following traditional teaching or educational methods, but on specific skills training -- how faculty could use computer technology within their instructional process. It helped faculty develop skills in an environment that promoted learning by doing (e.g., Dewian). Faculty were provided an opportunity to be actively involved in their skill development and gained access to technical assistance resources that allowed them to work at their own pace. They were given opportunity to build relationships with other participants and facilitators of the FDI workshops and to use these individuals and other peers as mentoring/coaching resources after leaving the workshop(s). They were also provided written documentation of training materials that were specifically designed to meet their needs during, and as a reference after, the workshop. Faculty members must also remain actively involved in their own development (Hurst, 1994).

Faculty Development Through Training Volume 4, Number 2, 2009 25
They must not be intimidated by technology, but be willing to take on new challenges for their own, and their students’ future development. This is accomplished by embracing new technologies, employing the necessary skills, and continuous improvements in the development process for educational growth.
Expectancy Theory
Vroom (1995) pioneered the development of expectancy theory for use in explaining work behavior. Since his initial study, many researchers have used expectancy theory to explain work behavior. As a result, many models have been designed, developed and modified to explain expectations, values and instrumentations. Porter, who worked closely with Vroom, and Steers focused upon the role that “met expectations” may have on withdrawal behavior of an individual. Their concept of met expectations is described as the “discrepancy between what a person encounters on this job in the way of positive and negative experiences and what he expected to encounter” (Porter & Steers, 1973). Porter and Steers (1973) hypothesized that when an individual’s expectations – whatever they are – are not substantially met, propensity to withdraw would increase. Irving and Meyer (1995) believed that the met expectations hypothesis could be tested by utilizing difference scores reflecting the discrepancy between post-entry experiences and pre-entry expectations. Investigation found, however, that difference scores produced artificial relations with outcome variables. The use of direct measures requires respondents to indicate how well their pre-entry expectations concerning their jobs were confirmed (Irving & Meyer, 1995). A weakness of direct measures of met expectations is that it requires individuals to recall their prior expectations after having been on the job for some time. Individual recollections of pre-entry expectations are filtered by more recent experiences and behaviors (Irving & Meyer, 1995).
METHOD
This study evaluated of the impact of training on initial 50 faculty participants of FDI through perceptions of the FDI developers. It also evaluated expectations and goals that were considered by developers of FDI as they made decisions about the future of the training program. This study also assess the contribution to the scientific understanding of the training process by evaluating the alignment of developer and participant expectations – whether they were met or not and how they affected perceived outcomes.
The population for this phase of the study was the five developers of the Faculty Development Institute. The developers of FDI were identified through meetings with current directors of the program. Their experiences working within a university environment at the time that FDI was developed ranged from five to 20 years. They worked in areas including the Provost office, information systems, media services, adjunct faculty, and other areas of the university. Four of the five were male, three of the men held doctoral degrees. There was 100 percent participation by the developers.
The research design for this study is a mixed methodological approach. Qualitative methodology was chosen to address the portion of the study that deals with the goals of the university and the developers of FDI. Interviews were conducted so that developer’s goals and expectations could be determined. Open-ended questions were asked so that the interviewees would not limit their response (Seidman, 1998). Data was also collected from historical analysis of documents relevant to the initiation and development of FDI.
The credibility and dependability of the data in this study was affirmed through the use of triangulation, member checking and participatory or collaborative modes of research (Merriam, 1998). Member checking was used allow the developers to review the summary of their responses for accuracy
26 Journal of the North American Management Society Hughes
throughout the study and adjustments were made as deemed appropriate. A participatory or collaborative mode of research was also used by meeting with the developers and obtaining their assistance with gathering documents and finding participants throughout the study.
Quantitative methodology was used because this was a descriptive and ex post facto study. Quantitative data was gathered from survey questionnaires. The questionnaire was developed from the interviews with FDI developers and historical document analysis. The survey participants in this study were the five developers and 50 faculty members who were the first to participate in the training program. The survey instrument was used to triangulate the developers’ interview responses and historical document analysis data. The reliability and validity of the Likert survey used in this study was evaluated by the dissertation committee and faculty members from the Education Research (EDRE) program within University’s Department of Leadership and Policy Studies. The survey was sent to various individuals for evaluation of readability and usability. All suggested changes were made to enhance the survey.
RESULTS
Evaluation of the political and public relations impact of the training was not an initial plan for this study; however, during the qualitative interviews it emerged as a consistent theme that the FDI developers were led to develop this program due to the political climate from state needs and public relations implications on campus and within the community.
The comparison results evaluated within this study are as follows:
University Expectations vs. FDI Expectations
The university and FDI had different expectations regarding the probable outcomes of the initial FDI workshop. The university had 11 broad strategies, goals, and expectations for meeting the challenges brought on by technological change and changes in the university environment. Of those, FDI had the potential to directly and significantly influence two. The first of those was the University's goal “to establish a comprehensive program of human resource development for faculty, staff, and administrators”. The FDI initiative was in alignment with the university objective “to strengthen and expand faculty development programs related to teaching effectiveness, advising, and the applications of advanced computing and communications technologies in the teaching-learning environment”.
The second goal of the university relevant to FDI was “to enhance the quality and accessibility of library and other information resources and advanced computing and communication technologies” (The University Plan: 1991-1996, 1991, p.1). FDI made that one of their expectations and assisted with providing faculty with the technological hardware and software necessary to meet this university goal. The FDI initiative may have impacted most, or even all, of the university goals to some extent; however, these two goals were those most compatible with the focus of FDI as initially conceived and implemented.
University Expectations vs. University Outcomes
Through historical document analysis information, the University expectations in regards to FDI were met and achieved according to the University Plan: Progress Toward 1991-1996 Goals (The University Plan: 1991-1996, 1991). FDI was a part of a larger Instructional Development Initiative and the outcomes that impacted on the broader university goals were achieved. According to findings from FDI developer interviews, FDI provided the capability for the accomplishment of many changes to help the
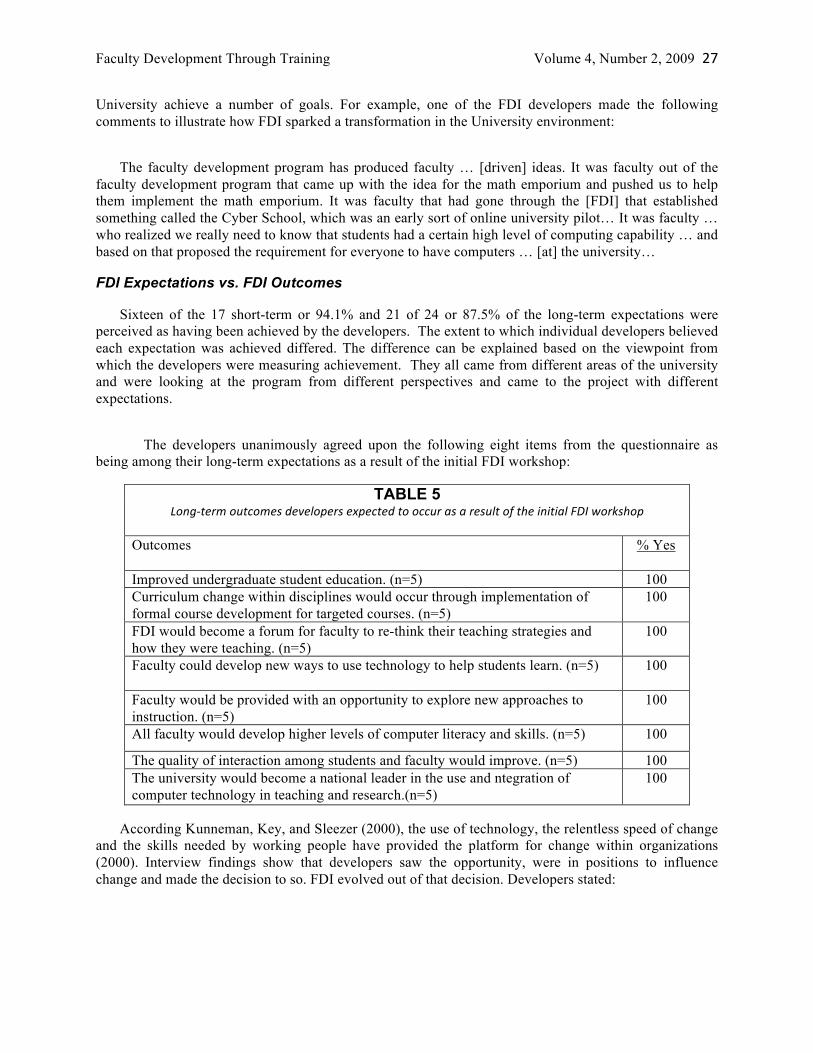
Faculty Development Through Training Volume 4, Number 2, 2009 27
University achieve a number of goals. For example, one of the FDI developers made the following comments to illustrate how FDI sparked a transformation in the University environment:
The faculty development program has produced faculty … [driven] ideas. It was faculty out of the faculty development program that came up with the idea for the math emporium and pushed us to help them implement the math emporium. It was faculty that had gone through the [FDI] that established something called the Cyber School, which was an early sort of online university pilot… It was faculty … who realized we really need to know that students had a certain high level of computing capability … and based on that proposed the requirement for everyone to have computers … [at] the university…
FDI Expectations vs. FDI Outcomes
Sixteen of the 17 short-term or 94.1% and 21 of 24 or 87.5% of the long-term expectations were perceived as having been achieved by the developers. The extent to which individual developers believed each expectation was achieved differed. The difference can be explained based on the viewpoint from which the developers were measuring achievement. They all came from different areas of the university and were looking at the program from different perspectives and came to the project with different expectations.
The developers unanimously agreed upon the following eight items from the questionnaire as being among their long-term expectations as a result of the initial FDI workshop:
TABLE 5 Long‐term outcomes developers expected to occur as a result of the initial FDI workshop
Outcomes % Yes
Improved undergraduate student education. (n=5) 100 Curriculum change within disciplines would occur through implementation of formal course development for targeted courses. (n=5)
100
FDI would become a forum for faculty to re-think their teaching strategies and how they were teaching. (n=5)
100
Faculty could develop new ways to use technology to help students learn. (n=5) 100
Faculty would be provided with an opportunity to explore new approaches to instruction. (n=5)
100
All faculty would develop higher levels of computer literacy and skills. (n=5) 100
The quality of interaction among students and faculty would improve. (n=5) 100 The university would become a national leader in the use and ntegration of computer technology in teaching and research.(n=5)
100
According Kunneman, Key, and Sleezer (2000), the use of technology, the relentless speed of change and the skills needed by working people have provided the platform for change within organizations (2000). Interview findings show that developers saw the opportunity, were in positions to influence change and made the decision to so. FDI evolved out of that decision. Developers stated:

28 Journal of the North American Management Society Hughes
…you know the argument was made, we talked about it as a good idea and I agreed and told people to go ahead with it…I was central to the executive decision that yes we should go ahead, it was a good idea.
I went to the University Provost and proposed our, initiating a program that would be aimed at, a faulty development program that would be aimed at 100% of our faculty over several years, then I indicated that I would be willing to reallocate internal resources… to support personnel and operating costs associated with this program, but that I would need support in winning a reallocation of some of the equipment trust fund monies to pay for the equipment that would be allocated to faculty…
According to the developers comments below the timing and involvement of individuals in the university community played a role in the success of the program as well:
we did it rather quickly because we first started meeting in October, November 1992 and the first workshops occurred June of 1993, so basically, we had six months. It was relatively fast for a University.
Actually, I think for a University initiative, it happened pretty quickly. I think one of the reasons why FDI was so successful was that there was a period of planning that extended for … three to six months before each workshop that happened with the representative or representatives of the groups that were going to be coming through and I think that made the workshops more meaningful for people who came…it was a workshop that was tailored to the needs of the group.
DISCUSSION
The initial FDI initiative was successful in meeting the expectations of the developers and the university. The perceived outcomes for the university were: (a) The Instructional Development Initiative would provide an opportunity for all faculty members over a four-year period with a state-of-the art computer and an intensive workshop focused on the integration of advanced computing and communications technology into the curriculum. Over 650 faculty members, almost half of the faculty, have participated in this program; and (b) the university has leveraged the communications infrastructure, enhanced through network technology and resources, allowing the development of hundreds of Internet home pages on campus (The University Plan: Progress Toward 1991-1996 Goals, 1996).
Sackett and Mullen (1993) stated that training programs should be evaluated for political or public relations purposes (e.g., documenting success may increase the training function's credibility and visibility within an organization). This study was an evaluation of the FDI. The results of this study show that FDI was successful in increasing its credibility and visibility within the university community. FDI is still a very viable training entity within the campus of this university. Faculty members are allowed to suggest topics for training that is customized to meet their needs.
A particular faculty member in this study offered the following synopsis:

Faculty Development Through Training Volume 4, Number 2, 2009 29
From my perspective the FDI initiative has been a resounding success at helping faculty become computer literate; however, few faculty incorporate technology in their classroom instructional strategies. I have been using technology in my classes for years. The FDI initiative has given me updated hardware, which I greatly appreciate; however, the integration of technology in my classroom behavior more or less comes from my professional interests. How do students learn? How can technology enhance this learning? (personal communication, 2001)
Today, all faculty at the university has had an opportunity to attend FDI workshops and seminars and all new faculty are required to attend the sessions to obtain their initial computer. University faculty are continuing to develop new uses for technology within their instruction. The FDI has also been expanded to include graduate student development. The future of FDI is open for ideas that are generated through enhanced training programs. Effective evaluation increases credibility and visibility of the training function. FDI has been a visible and integrated part of this university’s community because of its design to be a success initially. They focused on areas that were doable and measurable. They also “built and organizational base and generated trust and participation among professors interested in developing CMI, by making not-yet-worked-out technologies visible to them in demonstrations” (Nespor, 2006, p. 5).
IMPLICATIONS FOR TRAINING AND DEVELOPMENT
This study provides training and development professionals with another perspective from which to enhance evaluations of training programs. Understanding developer and organization’s expectations before a program is developed should lead to a better utilization of resources when implementing a program. Better measurement of the transfer of training occurs because what individuals expect to receive from training would have been clearly identified and documented. This method would allow trainers to use direct measures in which respondents would indicate the extent to which they perceived their pre-entry expectations concerning the training to have been confirmed (Irving and Meyer, 1995). Trainers can also use incentives that are directly applicable to removing barriers that participants encounter to potentially motivate learners. The computers and technical support that were provided to participants upon completion of the program was a significant factor in their participation in the program and they were subsequently used after the program. They may not all have been used directly instruction by all faculty members but there was evidence of application of some of the computer knowledge being applied upon return to the job.
Trainers can also add to scientific learning and enhance their relationships and public relations image within organizations by effectively documenting and communicating successes. Effective evaluation increases credibility and visibility of the training function. FDI has been a visible and integrated part of this university’s community because of its design to be a success initially. By focusing on areas that were clearly measurable and readily identifiable, they also benefited from an organized and informed base and established a rapport with professors, which helped the success of the initiative.
REFERENCES
Bassi, L., Cheney, S., & Lewis, E. (1998). Trends in workplace learning: supply and demand in interesting time. Training and Development, 52(11), 51-75.
Cascio, W.F. (1998). Applied psychology in human resource management (5th ed.). Upper Saddle River, NJ: Prentice Hall.
Cascio, W. F., & Aquinis, H. (2005). Applied psychology in human resource management, (6th ed.). Upper Saddle River, NJ: Prentice-Hall.

30 Journal of the North American Management Society Hughes
Deden, A. (1998). Computers and systemic change in higher education. Communications of the ACM, 41(1), 58-64.
Eifler, K. E., Greene, T. G., & Carroll, J. B. (2001). Walking the talk is tough: From a single technology course to infusion. The Educational Forum, 65, 366-375.
Hurst, D. (1994). Teaching technology to teachers. Educational Leadership, 52(7), 74-77.
Instructional computing proposal. (Draft) (1992). Blacksburg, VA: Virginia Tech.
Irving, P. G., & Meyer, J. P. (1995). On using direct measures of met expectations: a methological note. Journal of Management, 21(6), 1159-1176.
Kelly, L. (1995). The ASTD technical and skills training handbook. New York: McGraw-Hill, Inc.
Kirkpatrick, D.L. (1994). Evaluating training programs. San Francisco, CA: Berrett-Koehler Publishers, Inc.
Kunneman, D. E., Key, J. P., & Sleezer, C. M. (2000). Management training activities and training needs within selected business and industry organizations in Oklahoma. Journal of Career and Technical Education, 16(2), 51-56.
Merriam, S. (1998). Qualitative research and case study applications in education. California: Jossey-Bass Inc.
Ndahi, H. B. (1998). A study of industrial and technical teacher education faculty acceptance of distance learning technology. Unpublished doctoral dissertation, Oklahoma State University, Stillwater.
Nespor, J. (2006). Technology and the politics of instruction. New Jersey: Lawrence Erlbaum Associates.
Oliver, R., Omari, A., & Herrington, J. (1998). Investigating implementation strategies for WWW-based learning environments. International Journal of Instructional Media, 25(2), 121-136.
Porter, L. W., & Steers, R. M. (1973). Organizational, work, and personal factors in employee turnover and absenteeism. Journal of Management, 80, 151-176.
Ross, M. (1989). Relation of implicit theories to the construction of personal histories. Journal of Management, 96, 341-357.
Sackett, P. R & Mullen, E. J. (1993) Beyond formal experimental design: Towards an expanded view of the training evaluation process. Personnel Psychology, 46(3), 613-15.
Seidman, I. (1998). Interviewing as qualitative research: A guide for researchers in education and the social sciences, (2nd ed.). New York: Teachers College Press.
Silberman, M. (1998). Active training, (2nd ed.). San Francisco: Jossey-Bass/Pfeiffer.
State Council of Higher Education in Virginia (SCHEV). (1993). Change and improvement in higher education: A preliminary report to the Governor and General Assembly, January 2003. Retrieved October 15, 2007 from http://www.eric.ed.gov/ERICDocs/data/ericdocs2sql/content_storage_01/0000019b/80/15/52/94.pdf.
The university plan: 1991-1996 (1991). [Report]. Virginia Polytechnic Institute and State University. Retrieved, from http://www.provost.vt.edu/sp/uni_plan91-96.html
The university plan: Progress toward 1991-1996 goals (1996). [Report]. Virginia Tech. Retrieved, from http://www.provost.vt.edu/sp/UnivPlanUpdate.html.
Tilly, C. (2001). Mechanisms in political processes. Annual Review of Political Science, 4, 21-41.
Vroom, V. H. (1995). Work and Motivation. San Francisco: Jossey-Bass.

Journal of the North American Management Society, Volume 4, Number 2, 2009
An Empirical Investigation Focusing on the Composition
and Performance of the Fortune 500
Dr. Joseph T. Martelli, The University of Findlay, Findlay, Ohio
Dr. Patricia B. Abels, The University of Findlay, Findlay, Ohio
Kara M. Ward, The University of Findlay, Findlay, Ohio
Abstract: Each year Fortune Magazine categorizes American corporations into a snapshot view of how each performed in the previous year. The list compiles the top 500 companies based upon revenue. The following article looks closer at the NAICS industry sectors that make up the 2008 Fortune 500 list and the performance level of each sector represented using multiple dimensions of analysis. This research investigates the 2008 Fortune 500 companies in terms of their NAICS industry sector, geography, revenue generation, and profitability. The study further explores employment levels and labor productivity within and across sectors. Additionally, the education levels attained by the top executive are revealed. Finally, the report compares industry sectors in an effort to better understand the composition of the 2008 Fortune 500 list and its contribution to the American economy as a whole.
INTRODUCTION
Much has been done to define American industry and determine the value of its contribution as a whole. Each year, the Fortune 500 list examines America’s largest corporations and provides an annual snapshot of how these corporations measure up to each other. The problem experienced with existing literature is the difficulty in locating a composite of aggregate data to define and describe the various dimensions of America’s largest corporations. If individuals have a goal or the opportunity to become an entrepreneur they might find it helpful in knowing where to geographically settle, the expected revenues and profits for their chosen industry, along with the size of the workforce. These all are necessary components for a successful business plan. Moreover, prospective employees could utilize the results in order to decide their career paths and where best to geographical reside for their chosen fields.
While relatively small in proportion to the total number of businesses in the United States, not only do these firms contribute significantly to the overall productivity of the nation, they also provide an outlet for smaller businesses to sell their goods through the Supplier Chain and Business to Business (B2B) networks. This can be illustrated through the automotive sector of the economy which indirectly supports three employees through its tier supplier network for every direct employee of the Original Equipment Manufacturers themselves (Goldsmith, 2008). The following research delves further into the 2008 Fortune 500 list and examines the industry makeup, geographical settling, and their revenue contributions as a means of determining who is on top, where industry centralizes, and why the industry thrives
Discussion begins with a look at the 2008 Fortune 500 list and the sectors of American business that define these corporations. Next, there is investigation regarding the geographic regions in which these industries are headquartered. Because the Fortune 500 corporations contribute significantly to the Gross

32 Journal of the North American Management Society Martelli, Abels, & Ward
Domestic Product, we research the highs and lows of revenue and profit margins and figure individual employee contributions to the company’s overall bottom line. Sectors are analyzed to each other and across industry lines in order to reach a better understanding of the corporations that are considered the largest and most powerful in America today, the 2008 Fortune 500.
LITERATURE REVIEW
NAICS Composition of the Fortune 500
The North American Industry Classification System (NAICS) is utilized throughout Canada, Mexico, and the United States (U.S.) in order to distinguish business organizations based upon its primary trade and industry. The structure of NAICS enhances the collection, tabulation, presentation, and analysis of data pertaining to business entities located within these countries (United States Census Bureau, n.d.). The categorization of commerce using NAICS has been accepted throughout the regions and it has replaced the previous Standard Industrial Classification (SIC) coding schemes (United States Census Bureau, n.d.).
The NAICS standard permits the standardization and comparability of economic trade within North America when conducting any type of statistical research or publishing industry data whether it is prepared by the government or other researchers, regulatory agencies, taxation, academics, and etc. (Office of Management and Budget, 2005). The NAICS classification system logically organizes companies based upon its principal product or service, which is determined based upon the nature of the revenue being generated by those firms. This process permits the grouping of enterprises that utilize similar production processes to be classified collectively (Office of Management and Budget, 1997).
The NAICS classification is comprised of a hierarchical structure that classifies companies from the broadest level to the most detailed level of their primary business activity (Office of Management and Budget, 2005). According to the U.S. Department of Commerce (n.d.), digits one through five of the six digit code are universally accepted throughout North America. The first two digits identify the organizations sector, the third digit identifies the sub-sector, the fourth digit denotes a company’s industry group, and the fifth digit identifies a company’s NAICS industry. The sixth digit of the code is reserved for the home country for the organization’s industry. Periodic review provides assurance that the trade and industry information being presented is relevant, timely, and accurate (Office of Management and Budget, 2005). The last update was conducted in 2007 (North American Industry Classification System, n.d.).
When an organization conducts business within multiple activities, the NAICS code that is assigned to that company is based upon the organization’s principal product or group of products being produced or distributed, or the services being rendered (United States Census Bureau, n.d.). The principal product or service for these firms is determined by its proportional share of current production costs and the investment in capital for that organization (United States Census Bureau, n.d.). In order to classify organizations, other variables including revenue, number of shipments, and employment have been utilized (United States Census Bureau, n.d.). When measuring production, the most commonly used alternative has been the organizations sales revenue, followed by that of employment.
Geographic Dispersion of the Fortune 500
In the past, the corporate headquarters for all major U.S. enterprises have tended to cluster around large metropolitan areas because it is within these large metropolitan areas that companies were able to locate the necessary infrastructure, such as support services, major airports, major highways, and telecommunications, all which have been deemed to be critical components in order to carry out the activities required for those organizations (Klier & Testa, 2002). For example, in 1955, the New York
Fortune 500 Volume 4, Number 2, 2009 33
metro area accounted for 31% of all corporate headquarters in the U.S., and from this, 28% of the organizations were designated as leaders by Fortune Magazine within its first published 500 ranking (Diacon & Klier, 2003). According to Dow Jones, firms that locate within the larger metropolitan areas have found the additional benefit of being able to recruit and retain a more highly skilled professional when firms are centrally located in proximity of the large metro areas (Klier & Testa, 2002).
Today, the nation has seen a shift in the location of corporate headquarters within the U.S. even though the volume of sizeable publicly traded companies in the U.S. grew by 37% (Diacon & Klier, 2003). For instance, in 1999, the companies listed on the Fortune 500 ranking represented only 10% of the corporate headquarters in the New York metro area, yielding a 64.3% decline in Fortune 500 corporate headquarters located in the New York area since 1955 (Diacon & Klier, 2003). A contributing factor to this 64.3% plunge was due to the growth exhibited by smaller firms who now appear within the Fortune 500 ranking and these developing firms tend to be located within the mid-size metropolitan areas rather than urban areas (Klier & Testa, 2002).
Texas is now the primary home to 58 of the corporate headquarters, surpassing New York and the second ranked location of California (Associated Press, 2008). According to Klier and Testa (2002), the re-location of corporate headquarters to other urban areas will tend to lag behind the shift in industries. However, Texas is expected to continue being the recipient for those large companies desiring to relocate because these companies can benefit by being surrounded by other large companies (Associated Press, 2008). These other firms can provide the vast array of services, such as accounting, law, information technology, and etc., which is critical for successful businesses.
Revenue and Profit in the Fortune 500
According to Fortune Magazine, 2005 resulted in a record setting year. These Fortune 500 companies generated a total of $9.1 trillion in sales revenue, yielding a combined bottom line of $610 billion (McGirt, 2006). In 1955, the year Fortune Magazine published its first ranking, the sales revenue of the Fortune 500 companies as compared to the Gross Domestic Product (GDP) was 39%, and this figure has increased to 73.4% by 2006, with the expectations that the sales revenue of the Fortune 500 could conceivably exceed the GDP for economic output in years to come (McGirt, 2006).
According to the Organization for Economic Co-operation and Development (OECD), in 2005 the global economy grew by 4.25%, which translated into the higher profits being earned by the companies listed on the Fortune 500 (McGirt, 2006). As part of this growth, the U.S. economy grew by 3.5% and Fortune 500 organizations enhanced their sales revenue by 10.2%, with combined profits of $610 billion or an average increase of 18.8% (McGirt, 2006). Many of the Fortune 500 companies have substantial revenues being generated overseas. A profitable year globally can enhance the bottom line for these domestic-based organizations.
A firm’s accounting net profit is often termed as net income, net earnings, or the bottom line, and is defined as being the difference between the amount of revenue generated by the firm and all of its expenses incurred during a period of time, normally one year. Investors, creditors, and managers often investigate a company’s performance based upon the profitability of an organization (Gallagher & Andrew, 2003). Net profit margin is a financial tool that permits investors, creditors, and managers to evaluate how effective a firm controls the costs of the organization.
Percentages are frequently utilized in practice when assessing the financial health of organizations. For instance when Microsoft announced its first quarter results, even though the company’s sales were .3% higher than the previous year, its net income was down by 11%, and as a reaction to this news, Microsoft’s share of stock plunged 5% (Kaplan, 2008). Analyzing the net profit margin is one technique

34 Journal of the North American Management Society Martelli, Abels, & Ward
employed by interested parties to compare companies within and across sectors to assess which industries are more profitable.
Another method of comparison is the sales revenue per employee, across companies, and across and within industries. Sales revenue per employee is a substantive operating performance ratio that carries great importance to management and for those performing the human resource function of an organization (Loth, 2008). Harnish (2006) reported that larger organizations have a greater employee contribution to revenue than its smaller counterparts; this is because the larger firms, which are professionally managed, have systems and processes in place which increases an employee’s value.
Additionally, in a traditionally labor intensive industry, those firms tend to have a lower employee contribution to revenue ratio when compared to those firms operating in a more knowledge intensive environment (Street Authority, 2008). For instance, the top performing organizations within the computer industry have enjoyed above average, almost double, the revenue per employee as compared to their average performing competitors (Harnish, 2006). In 2005, the profits earned by the Information sector grew by 125.9% which enabled these companies to earn their own unique NAICS classification (McGirt, 2006).
The revenues per employee that were generated in 2005, were the highest within the energy related sector, with the industries in the health care and home construction contributing over $1 million in revenues per employee (Communication Workers of America, 2006). Other industries, which are known for paying low wages, also demonstrated high revenues per employee. For instance, the food and grocery firms generated $637,514 per employee; while the beverage organizations generated a per employee contribution of $448,812 (Communication Workers of America, 2006). Overall, the U.S. business and industry revenue generated per employee is $100,000 (Hoagland-Smith, 2007).
Fortune 500 Employment Levels
The U.S. Census Bureau Economic Census (2008) reported that nearly three-fourths of all U.S. businesses have no payroll. These firms consist of the self-employed and unincorporated businesses. On an average, those organizations tend to have an equivalent of 2.2 paid employees per firm. The Census Bureau (2008) classifies these firms as “Nonemployers”, and while those establishments comprise more than 75% of all firms in number, they account for only 3.4% of the total U.S. business receipts annually.
Additionally in 2004, the U.S. Economic Census data reported that 25,409,525 “Employer and Nonemployer” firms were in existence within the U.S. (United States Census Bureau, 2008). Conversely, large companies in the U.S., more specifically, America’s largest revenue producing firms, are defined as the Fortune 500. In 2004, these Fortune 500 firms reportedly employed approximately 24 million employees, resulting in an average of 50,000 employees per firm (Revell, 2005). By year end 2005, the Fortune 500 companies were enjoying an average increase in revenues of 10.2%, increases of 18.8% in profits, while at the same time increasing their headcount by only 2% (Communication Workers of America, 2006).
CEO Education by Sector
By the 1970’s, the Chief Executive Officers (CEO) of U.S. based companies were attaining higher and higher levels of education. Fortune Magazine reported that by the mid 1970’s, 28% of CEO’s employed at Fortune 500 companies had graduated from college, with 18% of the CEO’s having some level of postgraduate study (Burck, 1976). The rising level of well-educated CEO’s is illustrated by the research that was conducted by P.R. Chandy. The results of Chandy’s research indicated that over 60% of CEO’s have completed coursework beyond the undergraduate level, and that 66% of CEO’s hold at least one bachelor’s degree (Chandy, 1991).

Fortune 500 Volume 4, Number 2, 2009 35
In a study of 1001 CEO’s throughout the U.S. and Europe, Monica Hamori discovered that 38% of CEO’s employed with domestic firms held an MBA, as compared to 16% for its European counterparts. Additionally, Hamori (2008) revealed that CEO’s holding an advanced degree tended to climb more quickly to the top position of their respective companies as compared to their non-degreed counterparts. Michael Sampson-Akpuru (2008) studied 100 firms within the Fortune 500, uncovering that 90% of the CEO’s hold at least a Masters degree.
In a recent survey conducted within the U.S. Health Care sector, the study revealed certain characteristics pertaining to the level of education attainment of the Chief Executive Officer’s within the hospital industry. The findings revealed that 95% of CEO’s employed within the “best in class” ranked hospitals possessed graduate level degrees, (including MBA, MPA, and etc.), while 81% of the CEO’s at median performing hospitals had similar degrees (Cejak Search & Solucient, 2005). Additionally, the “best in class” hospital CEO’s had twice the number of advanced degrees of the median performing hospitals.
RESEARCH QUESTIONS
1. What is the composition of the Fortune 500 based on NAICS classification?
2. What is the geographic dispersion of the Fortune 500 companies?
3. What is the relationship between revenue and industry sector of Fortune 500 companies?
4. What is the profit margin in Fortune 500 companies by industry sector?
5. How many employees are employed by Fortune 500 companies?
6. What is the labor productivity of Fortune 500 companies across industry sectors?
7. What is the level of education of Fortune 500 leaders across industry sectors?
METHODOLOGY
Research Design
A quantitative framework was utilized for this exploratory and descriptive research study. This empirical investigation utilized secondary data in order to explore, describe and explain the composition and characteristics of the Fortune 500 companies. The data for the descriptive analysis were gathered from various online business databases and other online sources. The descriptive analysis is not designed to support generalizations across other businesses. The goal of this study is to provide some level of insight concerning the characteristics of the top 500 companies within the United States.
Selection of Companies
The target population of our study included all companies listed on the 2008 Fortune 500 listing. From this listing, the companies were cross-referenced across the Mergent database as well as other online databases. These other sources were also utilized in order to acquire all data that was deemed necessary in order to perform our SPSS analysis. Our data array consisted of 500 cases (one per company) and 45 original variables, and an additional 18 variables were created through SPSS data transformations. Data were obtained for 100% of the companies used in this study of 500 firms. A sampling plan was not utilized, resulting in a census study. The results of this study are applicable to the Fortune 500 and are not intended to be statistically generalized beyond this population. The Mergent online database was utilized to identify the primary NAICS code classification for each of the Fortune 500 companies.

36 Journal of the North American Management Society Martelli, Abels, & Ward
DATA ANALYSIS AND RESULTS
Research Question 1
What is the composition of the Fortune 500 based on NAICS classification?
When measuring the production of diversified firms, the NAICS coding scheme has been found to permit researchers with a form of standardization in order to compare trade within North America. Our analysis utilizes NAICS classification to the two digit level. The two digit level provides a broad level grouping of the Fortune 500 companies by industry and sector. At this level of analysis, there are twenty different industry sectors within North America.
FIGURE 1: DISTRIBUTION OF FORTUNE 500 COMPANIES BASED UPON NAICS
Figure 1 reveals the distribution of U.S. companies across the NAICS classification system. The dispersion is widely varied for these organizations, with Manufacturing (sectors 31-33) clearly dominating and comprising 35.6% of all Fortune 500 companies. The three runner-ups include Finance and Insurance (16.0%), Retail Trade (11.4%) and Utilities (7.0%). In all, these four sectors comprise 70% of all Fortune 500 firms based on the 2008 listing. Fortune 500 companies exist in eighteen of the twenty unique two digit NAICS classifications. The only two industry sectors not represented as being a Fortune 500 company are Educational Services (sector 61) and Public Administration (sector 92). Note that Public Administration would always be excluded from inclusion in the Fortune 500 listing due to the nature of the governmental services it provides.

Fortune 500 Volume 4, Number 2, 2009 37
Research Question 2
What is the geographic dispersion of the Fortune 500 companies?
Noted earlier, the shift in corporate headquarters was expected to continue into the future, with Texas being the recipient state for those firms wishing to relocate. Figure 2 reveals the state by state location for the Fortune 500 corporate headquarters. As can be seen, Texas is the home to 11.6% of all Fortune 500 headquarters. Texas is closely followed with New York at 11.0% and California with 10.4%. The headquarters become less concentrated with Illinois weighing in at 6.6%. The map does reveal the frequency counts for all fifty U.S. states and the District of Columbia (D.C.). As shown, the Fortune 500 companies reside in thirty-nine of the fifty U.S. states, and in D.C.
FIGURE 2: STATE CONCENTRATION OF FORTUNE 500 HEADQUARTERS
Using U.S. Census Bureau regional classification of the U.S., we have developed a geographic distribution model of the Fortune 500 companies based on their two digit NAICS classification. As might be expected and shown in Figure 3, industry headquarters are less concentrated in the West (85), with the primary locations hosted in the South (153) followed by the Midwest (133) and the Northeast (129). In reviewing the regional breakdown, it was found that 100% of the regions are dominated by the Manufacturing sector. After further separation of the regions into their unique U.S. Census Bureau divisions, the Manufacturing sector was still found dominant in all divisions, except one. The Information sector (sector 51) dominates the Mountain division in the Western U.S. The Information sector does

38 Journal of the North American Management Society Martelli, Abels, & Ward
include the publishing industries, including software, traditional, and internet; the motion picture, recording, and broadcasting industries; as well as the telecommunications industry; and Internet service providers.
FIGURE 3: GEOGRAPHIC CONCENTRATION OF FORTUNE 500 HEADQUARTERS
Research Question 3
What is the relationship between revenue and industry sector of Fortune 500 companies?
While domination thus far resides in the Manufacturing sector, as we turn to the Fortune 500 sales revenue things begin to change. In 2005, companies listed as being the largest 500 firms within the U.S. reported a total of $9.1 trillion in sales revenue, which was a record breaking year. Since then, sales revenues have continued to climb reaching $10.6 trillion in 2007. As shown in Table 1, the Management of Companies and Enterprise (sector 55) led the group in terms of sales revenue with $62 billion on the average being earned. Sector 55 comprised of only two firms, did generate more than twice the sales revenue of the second ranking industry, which was the Finance and Insurance (sector 52) who had an average sales revenue of $27 billion. The runners up reporting the next highest in terms of sales volume belongs to the Retail Trade sector ($26.1 billion) and the Manufacturing sector ($23.8 billion). Combined, these four industries account for 45.1% ($138.9 billion) of the total average industry revenues of $308.3 billion. The Real Estate and Rental and Leasing (sector 53) and the Agriculture, Forestry, Fishing and Hunting (sector 11) generate the least amount of revenue across the Fortune 500 profile of industries. An overall difference from the top performing industry to the lowest generating industry results in a difference of approximately 90% between those sectors.

Fortune 500 Volume 4, Number 2, 2009 39
TABLE 1: AVERAGE REVENUE (IN 000’S), PROFIT (IN 000’S) & PROFIT MARGIN PER FIRM BASED UPON NAICS
Research Question 4
What is the profit margin in Fortune 500 companies by industry sector?
External and internal stakeholders often investigate a firm’s performance based upon its profitability. Net profit margin has been noted as being one technique employed in order to compare companies within and across industry sector. The margins for net profit within the Fortune 500 industries range from a high of 19.49% dropping down to a net loss of 5.26% as shown in Table 1. The Mining, Quarrying, and Oil and Gas Extraction industry (sector 21) led the group in terms of profit margin by being able to generate almost $.20 in profit for every dollar that the sector generates in sales revenue, resulting in the best cost control industry. The prime leader in terms of revenue generation, the Management of Companies and Enterprises, placed second in terms of overall net earnings at 12.37%. The second ranked sales revenue industry, Finance and Insurance, came in fifth in terms of overall profits at 7.05%. The predominant geographic sector, Manufacturing, is ranked sixth in terms of industry profitability, yielding a 6.94% bottom line. The worst performing Fortune 500 industry in controlling costs was the Construction sector with net loss of 5.26%, followed by Real Estate and Rental and Leasing with a net loss of 2.12%.

40 Journal of the North American Management Society Martelli, Abels, & Ward
Research Question 5
How many employees are employed by Fortune 500 companies?
In 1994 Fortune 500 firms employed approximately 24 million employees, yielding an overall average of 50,000 employees per firm. Today, those same companies employ a combined workforce of over 25.3 million people, with an average of 50,617 per company. Table 2 shows the average workforce composition in total, and how the employment is distributed across the 18 different Fortune 500 reporting NAICS industries. Due to the growth of the service based economy, it can be seen in Table 2 that the Accommodation and Food Services (sector 72) had the largest volume of employees, with an average employment of 200,386 employees with an average industry profit margin of 9.18% (Table 1). Other Services (except Public Administration) industry (sector 81) comprised the second largest sector of the Fortune 500 workforce. Sector 81 employs on an average 165,000 employees with an average industry profit margin of 0.25% (Table 1).
TABLE 2: AVERAGE EMPLOYMENT & AVERAGE REVENUE PER EMPLOYEE BASED UPON NAICS
Numberof Employment RevenueNAICSIndustrySector(SectorNumber) Firms Mean perEmployeeAgriculture,Forestry,FishingandHunting(11) 2 16,250 $622,136Mining,Quarrying,andOilandGasExtraction(21) 12 13,407 $1,483,356Utilities (22) 35 11,357 $1,218,123Construction(23) 12 13,801 $1,174,442Manufacturing (31‐33) 178 47,748 $718,222WholesaleTrade(42) 27 27,013 $2,782,511RetailTrade(44‐45) 57 110,117 $422,448TransportationandWarehousing(48‐49) 24 54,111 $1,222,589Information(51) 30 48,736 $530,281FinanceandInsurance(52) 80 36,851 $1,545,782RealEstateandRentalandLeasing(53) 7 26,585 $409,490Professional,Scientific,andTechnicalServices(54) 13 53,407 $322,794ManagementofCompaniesandEnterprises(55) 2 107,000 $885,124AdministrativeandSupportandWasteManagement 6 38,117 $423,757
andRemediationServices(56)EducationalServices(61) 0 n/a n/aHealthCareandSocialAssistance(62) 6 59,994 $161,985Arts,Entertainment,andRecreation(71) 1 87,000 $124,430AccommodationandFoodServices(72) 7 200,386 $64,716OtherServices(exceptPublicAdministration)(81) 1 165,000 $75,057PublicAdministration(92) 0 n/a n/a

Fortune 500 Volume 4, Number 2, 2009 41
Research Question 6
What is the labor productivity of Fortune 500 companies across industry sectors?
Another known method of profitability comparison was found to be the generation of sales revenue on a per employee basis. This method was determined to be an important facet for those performing the human resource function within an organization. In 2005, the revenue per employee was the highest within the energy related sector, followed by health care and construction. Today, while the employment numbers across the industry sectors vary widely, labor productivity within the Wholesale Trade industry (sector 42) ranks as the highest in terms of overall labor productivity, with each employee contributing over $2.7 million in revenue. On productivity, the other industry sectors lag behind the Wholesale Trade sector. The second ranked industry is the Finance and Insurance (sector 52), coming in with productivity of $1.5 million per employee. Table 2 also shows sector 72 (Accommodation and Food Services) ranking the highest in the average number of workers employed, but last in terms of overall labor productivity. The second highest industry in terms of the average number of workers (Other Services) ranked the second lowest in terms of overall labor productivity.
Research Question 7
What is the level of education of Fortune 500 leaders across industry sectors?
Chief Executive Officers managing these enterprises have been reported as having a college degree. A growing trend includes some form of postgraduate study. Table 3 shows the distribution of education level attained by the Fortune 500 CEO’s across NAICS industry sectors. As displayed, a graduate degree is held by 302 (60.4%) of the CEO’s, with 100% of the 18 reporting industries having at least one CEO holding this advanced degree. Holding an advanced degree is the mode parameter for the level of education among top level Fortune 500 leadership. For those 165 CEO’s who have not obtained an advanced degree, they do hold at least a bachelor’s degree.
DISCUSSION AND CONCLUSIONS
The problem experienced with existing literature was the difficulty in locating a composite of aggregate data to define and describe the various dimensions of America’s largest corporations. The purpose of this study was to close the gap in the literature by defining and describing the various performance dimensions of Americas largest corporations—The Fortune 500. By integrating several existing sources of data, we were able to provide a perspective on the composition, distribution, and performance of the big business enterprises in America.
There are several key findings which have emerged from our study. Of key interest was the fact that in 2008, the Manufacturing sector clearly dominated the economic sectors within the U.S. In this sector, 178 individual firms proved to be more than twice the size of the second ranking Finance and Insurance sector, which consisted of 80 firms. Companies diversify or become more vertically integrated within their value chain, which permits organizations to venture into multiple activities and conglomerate operations. Our research showed that the manufacturing continues to be the principle business activity within the U.S.
Geographically, the Southern U.S. (which includes Texas) was found to be the largest home for Fortune 500 headquarters. A contributing factor to this experienced growth was a result of smaller firms who now appear on the Fortune 500 rankings. These firms tend to settle in mid-size metropolitan areas
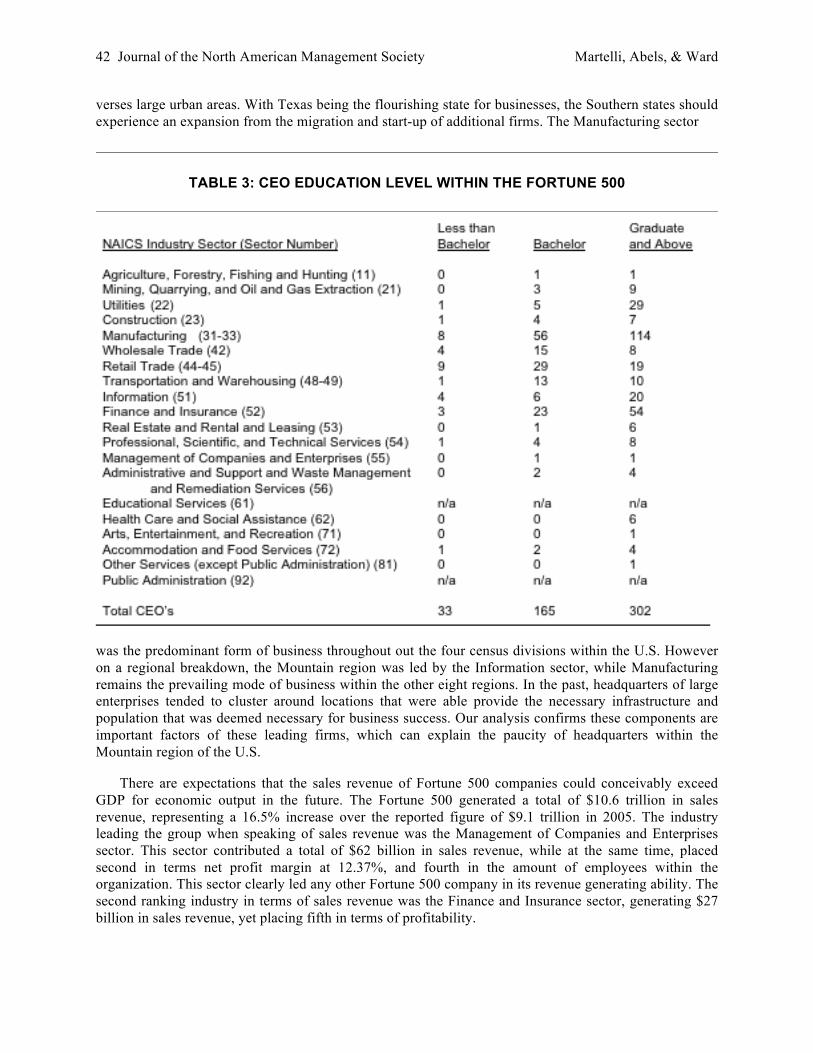
42 Journal of the North American Management Society Martelli, Abels, & Ward
verses large urban areas. With Texas being the flourishing state for businesses, the Southern states should experience an expansion from the migration and start-up of additional firms. The Manufacturing sector
TABLE 3: CEO EDUCATION LEVEL WITHIN THE FORTUNE 500
was the predominant form of business throughout out the four census divisions within the U.S. However on a regional breakdown, the Mountain region was led by the Information sector, while Manufacturing remains the prevailing mode of business within the other eight regions. In the past, headquarters of large enterprises tended to cluster around locations that were able provide the necessary infrastructure and population that was deemed necessary for business success. Our analysis confirms these components are important factors of these leading firms, which can explain the paucity of headquarters within the Mountain region of the U.S.
There are expectations that the sales revenue of Fortune 500 companies could conceivably exceed GDP for economic output in the future. The Fortune 500 generated a total of $10.6 trillion in sales revenue, representing a 16.5% increase over the reported figure of $9.1 trillion in 2005. The industry leading the group when speaking of sales revenue was the Management of Companies and Enterprises sector. This sector contributed a total of $62 billion in sales revenue, while at the same time, placed second in terms net profit margin at 12.37%, and fourth in the amount of employees within the organization. This sector clearly led any other Fortune 500 company in its revenue generating ability. The second ranking industry in terms of sales revenue was the Finance and Insurance sector, generating $27 billion in sales revenue, yet placing fifth in terms of profitability.
Fortune 500 Volume 4, Number 2, 2009 43
Frequently, a firm’s accounting net profit (expressed as a percentage) has been utilized when interested parties scrutinize the financial health of organizations. Net profit margin reveals how effective a company controls costs in order to improve its bottom line. In 2005, the Fortune 500 reported $610 billion in profits, and today, those firms earned $645 billion, which was an increase of 5.7%. Our study identified the Mining, Quarrying, and Oil and Gas Extraction sector to be the best in controlling its cost, yielding them the highest profit margin (19.49%), even though the industry placed in the lowest quartile in its revenue generating capabilities.
Another important method of organizational assessment was sales revenue supported on a per employee basis. In contrast to profit margins, our study revealed that overall employee productivity was within the Wholesale Trade sector within the U.S. This sector demonstrated an operating performance of $2.7 million per employee. Labor within these firms tended to be on the lower end of the spectrum, which would tend to create a higher employee contribution to revenue ratio. Management of these firms have systems and processes in place to increase employee value. The largest employment sector, Accommodation and Food Services, finished last in terms of this performance measure. This was not a surprise since these firms operate in a traditionally labor intense sector. Additionally, the second largest labor intensive sector, Other Services finished second to last.
Hoagland-Smith (2007) reported revenue generated per person in all U.S. businesses combined, including Fortune 500 and all other companies, was $100,000. Additionally noted, industries which customarily pay low wages tend to demonstrate higher revenue per employee. When taken independently, our 2008 ranked study revealed the average industry revenue per employee within the Fortune 500 was $418,901 in contributions for the year-end 2007. Clearly, big business as defined by the Fortune 500, out performs all other sectors of the business environment in the United States. In 2006, low wage firms within the food and grocery industry yielded $637,514 per employee in revenue; and in 2007, wholesale firms generated $2,782,511 in revenue per employee. Our study showed that economies of scale still seem to matter.
Finally, as shown these 500 large corporations today employ a workforce of over 25.3 million, a 1.3 million (5.6%) increase since 1994. The Accommodation and Food Services industry employs the largest number of employees (200,386), these firms tend to generate a moderate amount of sales revenue ($10.9 billion) and they experienced the third highest overall net profit of 9.18%. The second largest employing industry is held by the Other Services (except Public Administration) sector with 165,000 within its workforce, also had a moderate level of sales revenue and the third worst in terms of profitability (0.25%).
RECOMMENDATIONS FOR FUTURE RESEARCH
This study is limited to the geographical boundaries of the United States, and the large corporations that make-up the Fortune 500 composite. The results contained in this report are not intended to serve as a generalization of all companies, domestic or globally.
As revealed, the Manufacturing sector accounted for 178 of all Fortune 500 companies within the U.S. While the Fortune 500 revenues are eventually funneled back to the parent companies in the U.S., additional research analyzing the specific plant locations, domestic and globally, would broaden our knowledge base for these operations. Further research can also identify the specific location of these company’s employees as dispersed throughout the U.S. and the world. Determining where these companies add their value in the execution of their business model, and where their revenues are generated would also be of significant value. Performance measures across time that could be analyzed include revenue, profits and employment.

44 Journal of the North American Management Society Martelli, Abels, & Ward
We have initiated a probe into the leadership characteristics of the American CEO. In the past, 28% of CEO’s had graduated from college, with 18% having some form of postgraduate studies. As the business environment continues to change, the education expectations of successful CEO’s continues to climb. It was found in 1991 that 66% of CEO’s hold at least one undergraduate degree, with over 60% of CEO’s completing coursework beyond the undergraduate level. Our initial results indicated that 93.4% of Fortune 500 CEO’s either have a bachelor degree (165) or a graduate degree and above (302). Executives with advanced degrees rise more quickly to top positions within organizations. Additional research within the CEO’s specific qualities may sharpen our understanding on successful leadership.
BIBLIOGRAPHY
Associated Press. (2008, April 22). Texas passes New York on Fortune 500 list. Retrieved December 18, 2008, from http://www.dentonrc.com/sharedcontent/dws/bus/stories/042208dnbusfortunetexas.20aec09.html
Burck, C. (1976, May). A Group Profile of the Fortune 500 Chief Executive. Fortune , 173-177; 311-312.
Bureau of Labor Statistics. (2008, November). Economic News Release. Retrieved December 21, 2008, from United States Department of Labor: http://www.bls.gov/news.release/empsit.nr0.htm
Cejak Search & Solucient. (2005). Hospital CEO Leadership Survey. St. Louis MO & Evanston, IL: Cejak Search & Solucient.
Chandy, P. (1991, Winter). Cheif Executive Officers: Their Backgrounds and Predictions for the 90's. Business Forum , 18-19.
Communication Workers of America. (2006, June 2). Retrieved December 18, 2008, from The growing power of the Fortune 500: http://cwa3250.org/knock/content/view/159/2/
Diacon, T., & Klier, T. H. (2003). Where the Headquarters are - Evidence from Large Public Companies 1990-2000. Retrieved December 9, 2008, from http://www.ios.neu.edu/iioc2004/papers/f1m3.pdf
Gallagher, T. J., & Andrew, J. D. (2003). Financial Management. New Jersey: Prentice Hall.
Goldsmith, J. (2008, January 22). Siting Trends for Tier 1 and Tier 2 Automotive Suppliers. Retrieved December 21, 2008, from Trade & Industry Development: http://www.mccallumsweeney.com/uploads/ARTICLE-54-07-Siting%20Trends%20Tier%201%20and%202%20Auto%20Suppliers%20-%20Trade-Industry%20-%2005-07.pdf
Hamori, M. (2008). The Secrets of Career Success in the 21st century. European Business Forum (32), 28-33.
Harnish, V. (2006, May 29). Revenue per Employee; Our Nations Most Critical Number. Retrieved November 20, 2008, from Revenue per Employee: www.gazelles.com/columns/Revenue per Employee.pdf
Hoagland-Smith, L. (2007, February 26). Does Your Strategic Plan Include Revenue Goals Per Employee? Retrieved November 21, 2008, from Ezine articles: http://ezinearticles.com/?Does-Your-Strategic-Plan-Include-Revenue-Goals-Per-Employee?&id=468277
Kaplan, D. (2008, April 24). Earnings: Microsoft Net Income Down 11 Percent; Stock Slides on Outlook. Retrieved December 1, 2008, from http://www.paidcontent.org/entry/419-earnings-microsoft-operating-income-dives-331-percent-net-income-down-1/
Klier, T., & Testa, W. (2002). Location Trends of Large Company Headquarters during the 1990s. Economic Perspectives , 12-26.
Fortune 500 Volume 4, Number 2, 2009 45
Loth, R. (2008, November 20). Operating Performance Ratios: Sales/Revenue Per Employee. Retrieved November 20, 2008, from http://www.investopedia.com/university/ratios/operating-performance/ratio2.asp
McGirt, E. (2006, April 4). The Fortune 500: A banner year. Retrieved December 18, 2008, from Fortune: http://money.cnn.com/2006/03/31/news/companies/intro_f500_fortune/index.htm
(1997). North American Classification System. Part II, Office of Management and Budget.
(2005). North American Industry Classifaction System. Federal Register, Part IV, Office of Management and Budget.
North American Industry Classification System. (n.d.). Retrieved November 30, 2008, from United States Census Bureau: http://www.census.gov/eos/www/naics/
Revell, J. (2005). Up, Up and Away. Fortune , 151 (8).
Sampson-Akpuru, M. (2008). Does an Ivy League Education Amount to Higher CEO Pay? Lethbridge Undergraduate Research Journal. , III (1).
Street Authority. (2008, November 20). Revenue per Employee- A complete definition. Retrieved November 20, 2008, from Street Authority: http://www.streetauthority.com/terms/r/revenue-per-employee.asp
United States Census Bureau. (n.d.). Retrieved November 30, 2008, from Clarification Memorandum No. 3: http://www.census.gov/eos/www/naics/history/docs/cm_3.pdf
United States Census Bureau. (n.d.). Retrieved November 30, 2008, from NAICS Update Process Fact Sheet: http://www.census.gov/eos/www/naics/reference_files_tools/NAICS_Update_Process_Fact_Sheet.pdf
United States Census Bureau. (2008, September 04). Statistics about Business Size (including Small Business). Retrieved November 21, 2008, from U.S. Census Bureau: http://www.census.gov/epcd/www/smallbus.html
United States Department of Commerce. (n.d.). Retrieved November 30, 2008, from Frequenty Asked Questions: http://faq.bea.gov/cgi-bin/bea.cfg/php/enduser/std_adp.php?p_faqid=19&p_created=1132157763&p_sid=wP8GuUij&p_accessibility=0&p_redirect=&p_lva=&p_sp=cF9zcmNoPSZwX3NvcnRfYnk9JnBfZ3JpZHNvcnQ9JnBfcm93X2NudD0zODMsMzgzJnBfcHJvZHM9JnBfY2F0cz0mcF9wdj0mcF9jdj0mcF9

Journal of the North American Management Society, Volume 4, Number 2, 2009
Looking Through the “Glass Ceiling:”
Compensation Equity & Promotional Challenges
Michaeline Skiba, Monmouth University Joseph Mosca, Monmouth University
Abstract: The purpose of this study is to examine how a select group of current businesspeople view women’s pay equity and promotional opportunities. Research participants were selected from the memberships of two national professional associations and a graduate student class within a university’s MBA program. Although the collected information was limited in its scope, it shows great potential regarding but not limited to such dimensions as the importance of mentors, acquisition of knowledge of one’s chosen professional discipline as well as the law, and the need for work-life balance.
BACKGROUND
Historically, women in the U.S. have experienced invisibility in society in general and in most areas of the business sector in particular. In recent times – particularly over the last 40+ years – a woman working outside of her household is viewed as a normal occurrence. This sign of dramatic change in the composition of the U.S. workforce is shown in the following report:
“In 1950, the overall participation rate of women was 34 percent. The rate rose to 38 percent in 1960, 43 percent in 1970, 52 percent in 1980, and 58 percent in 1990. The number of women in the labor force rose from 18 million in 1950 to 66 million in 2000, an annual growth rate of 2.6 percent. The share of women in the labor force grew from 30 percent in 1950 to almost 47 percent in 2000, and the number of working women is projected to reach 92 million by 2050 (Toossi 2002, p. 18).
Women’s participation in the workforce is broadening and, in some industries, they are sharing the same roles and responsibilities as men. However, it is not surprising that a number of major industries remain highly segregated by gender, and this occupational segregation may be due to the nature of the job functions themselves. According to Shapiro, “the largest list of industries, the ones in which women gained a substantial presence during the last century, included some forms of manufacturing, many forms of retailing, commerce, the professions, leisure and recreation, and public administration – in short, all types of industries except those requiring heavy labor or a few, such as truck driving, where men by one means or another managed to retain a strong hold or where employers felt less compelled to replace them with women (Shapiro 2006, p. 23).”
Although women are more visible in the workforce, they continue to be confronted with considerable challenges that coincide with their visibility. These challenges include such dimensions as work-life balance and gender discrimination. In terms of work-life balance, one study of working women in the United States, Sweden and the Netherlands concluded that these women “…have given more effort to household chores and childcare and less effort to the workplace compared to male employees. Although these women provided lesser focus in the workplace, their total workloads appear to be somewhat greater and more unevenly distributed than those of men due to heavier workload at home (Gjerdingen et al 2000, p. 1).” This same study indicated that heavy workloads may adversely affect women’s health and impact their careers due to compensatory reductions in work commitment and job status.

Glass Ceiling Volume 4, Number 2, 2009 47
In terms of gender discrimination, one researcher who studied employment practices in the software engineering field found that women tend to start at lower positions and earn lower salaries than men and, perhaps more disturbingly, the salary gap is found in studies that equate years of experience, level of education, and industry (Isaacs 2005). Another study of 6,000 managers found that a quarter of the women employed in senior jobs did not feel adequately involved in decision making and did not think it was safe to speak up (Paton 2005).
Today, most of us want to believe that workplace equality for women is no longer an issue. Laws that include the Equal Pay Act, Pregnancy Discrimination Act, and Equal Employment Opportunity Act prohibit employers from discrimination based on sex, race, marital status, religion, national origin, age, or receipt of public assistance. Educational opportunities for women are increasing and, as a result, more women are moving into managerial levels that were once considered the exclusive province of men. Nevertheless, compensation and promotional opportunities for women have lagged behind these advancements and, while not as prominent as a few decades ago, the “glass ceiling” still exists.
INTRODUCTION TO THE STUDY
According to a 2004 report on women and diversity published by the Diversity Best Practices/Business Women’s Network in Washington, DC, women were paid an average of 79.7 cents for every dollar paid to men in 2000. The average earnings for women (workers and non-workers) were $16,554, compared with $35,942 for men (workers and non-workers) (US General Accounting Office 2003). More disturbingly, three years later, the median wage comparison demonstrated persistent inequity, as the ratio of women’s median wage to men’s median wage reached 81.3% in 2003 (Economic Policy Institute 2003). At the present time, most data sources suggest that these wages have not significantly changed. In fact, the Institute for Women’s Policy Research stated, “Given the current rates of change, it will be 50 years before women achieve equal pay with men and nearly 100 years before they gain equal representation in Congress” (BusinessWeek online 2004).
In more recent years, statistical data on women’s salaries vary according to their sources and foci; however, they do not show wide disparities in overall compensation results. For example, according to Women in the Labor Force: A Databook, published by the Bureau of Labor Statistics, U.S. Department of Labor and which presents data culled from a monthly survey of approximately 60,000 households, research findings included the following:
Women held half of all management, professional, and related occupations in 2004.
Nearly 60 percent of women who worked at some time in calendar year 2003 worked full time and year round, compared with 41 percent in 1970.
From 1979 to 2004, women’s earnings as a percent of men’s salaries increased by 18 percentage points, from 62 to 80 percent (Bureau of Labor Statistics 2005).
Similarly and as recently as the first quarter of 2005, another body of research indicated that on average, women holding the same position as men earn only 78 percent of what their male counterparts earn, regardless of the fact that, at that point in time, women held 56.3 percent of executive director positions within the United States (Jones 2005). An alarming and related trend from this same study revealed that the larger the organization, the more significant the gap between male and female executive directors.
The Equal Pay Act was implemented over 30 years ago, and changes in civil rights legislation enacted in 1991 allowed for jury trials and substantial compensatory and punitive damages against companies that
48 Journal of the North American Management Society Skiba & Mosca
discriminate by gender. Nonetheless, it appears clear that economic, market and demographic forces over the last decade alone have contributed to the increase in sex discrimination lawsuits and workplace distrust – among both employees and employers.
RATIONALE
This research study was designed to examine current views of women’s bonus and promotion opportunities within the business and academic sector, and whether women are receiving bonuses and promotions that are comparable to men. Interest in this project began in mid-2004 during the Morgan Stanley trial that, at that time, was the Equal Employment Opportunity Commission’s (EEOC’s) first sexual discrimination case against a Wall Street firm, and which resulted in the EEOC’s contention that the company systematically denied women promotions and raises. The trial featured testimony from over 25 employees who represented the experiences of 340 women employed by Morgan Stanley since 1995. Highlights from this trial included one plaintiff’s testimony that women had to work longer hours to prove themselves and that men with resumes similar to hers routinely were promoted over her, including some she had trained (Kelly and DeBaise 2004).
Wal-Mart Stores, the world’s largest retailer, is another employer under intense scrutiny for unfair policies including discrimination against women. Although Wal-Mart has tried to revitalize its corporate image in the eyes of customers and investors through increased marketing efforts, a more proactive corporate affairs department, and a restructured investor relations group (Troy 2006), a protest from department managers in a Florida-based facility prompted 200 employees to walk out in protest against unfair policies involving low salary, overtime work without compensation, and sex discrimination (Gogoi and Pallavi 2006). These legal actions are provocative in light of Wal-Mart’s changes to its compensation structure in 2005. As explained by the company’s chief diversity officer, Charlyn Jerrells Porter, “…the sex and race of those promoted closely reflect the percentages of those who apply, and this is not a quota system. Only the most qualified are to be promoted” (Morris 2005, p. 68). In addition to this policy change, Wal-Mart also requires that new hires with the same experience receive the same starting pay, regardless of what their pay was in the past.
The Morgan Stanley case was settled out of court with a $54 million settlement. On February 6, 2007, the Ninth Circuit court affirmed class certification in the Wal-Mart sex discrimination case, the largest civil rights class action (with over 1.5 million plaintiffs) ever certified against a private employer. Other prominent cases within the last few years have included Boeing, which paid over $70 million to settle a class-action lawsuit based on pay equity and the timeliness of promotions (as compared with male employees’ promotion time) and Costco, which faces a promotional opportunity class action suit.
RESEARCH METHODOLOGY
The research uncovered in this paper intended to determine how three select groups of business professionals view issues associated with pay equity and promotional opportunities for professionally employed females. Research participants were selected from two professional associations, one of which is comprised of various communications experts who work within the broad field of medical education (biomedical communications departments of college and university-based medical centers; medical librarians; medical education instructional designers; and sole proprietors of independent telemedicine services). The second association is a healthcare-related group whose membership is comprised of college and university-based healthcare professors and administrators. Most members of this second group also actively work as consultants in management, marketing, public health administration, and clinical settings (as nurses, physicians, and therapists). The third group was comprised of graduate

Glass Ceiling Volume 4, Number 2, 2009 49
students who were enrolled in the same course within the MBA program of a university in the northeastern region of the U.S.
The two association samples received an electronically mailed cover letter and attached survey, and the third group of graduate students received hard copies of the same materials. The researchers sought to receive answers to the following questions:
In your personal experience as a non-management employee, do you believe that women have had bonus and promotional opportunities that are comparable to those offered to men? If so, why? If not, why not?
In your personal experience as a manager of others, do you believe that women have had bonus and promotional opportunities that are comparable to those offered to men? If so, why? If not, why not?
What advice would you offer to an entry-level, female professional regarding her career strategies?
The electronic version was sent to approximately 250 people from the two association groups in early and mid-June of 2007, and 15 people responded. The graduate student population elicited 12 respondents. The researchers believe that the timing of data collection inhibited a larger return from the association members, and recommendations for broadening this number will be explained later in this paper.
RESEARCH FINDINGS Demographics
Twenty-six of the 27 respondents also responded to a request for basic demographic data. Among the 15 association respondents, 14 were of Caucasian-European ancestry, with an average age of 53 years (only two were younger than 50 years), and an average maximum salary slightly over $100,000. All but two listed their highest position as one that involved management, with one of the two exceptions an Associate Professor. Six of the 15 members of this group are males. This population could be characterized as Caucasian, mature, upper-middle class managers associated with the healthcare field.
In terms of the 12 respondents among the graduate student population, 11 reported themselves as Caucasian and one reported herself as a Latina. Both the average age and the average maximum salary in this group varied widely. The average age was 36 years (with six of the 12 respondents in their early 20s). However, one was 30 years of age, two were in their 40s, two were in their 50s, and the oldest respondent was 75. The average maximum salary was $54,000, almost half of what was reported by the association groups. The highest managerial position attained within this group was a director who also earned the highest salary of $120,000. This population could be characterized as Caucasian females, age and income diverse, lower to middle class managers seeking advanced business degrees.
Qualitative Responses
The survey contained only three open-ended questions, and the following is a summary of the responses from the 27 participants.
Question #1: In your personal experience as a non-management employee, do you believe that women have had bonus and promotional opportunities that are comparable to those offered to men? If so,why? If not, why not?

50 Journal of the North American Management Society Skiba & Mosca
Thirteen of the 27 respondents (approximately half of the sample) answered “yes” to this question; however, two of these indicated that opportunities applied only to promotions and not bonuses, due to their specific organizations in which bonuses are not given to non-management employees. One of these female respondents remarked that “women have had promotional opportunities in our department, but few have succeeded in their promoted positions….not because of incompetence but the inflexibility and short-sightedness of these individuals.” Another 51 year old female Director and Associate Dean claimed that while she received bonuses and recognition, she “never felt treated in a manner equitable to the recognition given to men” and added “while I have heard complaints of female colleagues in this regard, I don’t know all of the facts to make a determination on the validity of their claims.” A 64 year old female Associate Dean held a similar view with the following: “I was provided professional development opportunities that led to advancement, but the salary increases or bonuses didn’t come easily.” Interestingly, one respondent, a 60 year old male physician who works for the federal government, stated that, in his environment, “if women do not get comparable treatment to men, they can and do complain with serious consequences to management if their claims are proved valid.”
Respondents who answered “no” to this item spoke about the lack of female role models: “the numbers of women in power positions who could mentor [others] are smaller, and these ‘mentor women’ are also often trying to juggle families and the responsibilities of their power positions. Time is the limiting factor.” Another felt that the healthcare field in particular pays lower than other industries and “no matter how much we may think the division is closer, males are still seen as the main provider, regardless of their performance or qualifications.” Yet another respondent claimed that even with paternity leave, men have the option of staying at work or going home, and that most women bear the family responsibilities while men remain more stable, work-wise and for advancements.
Five respondents spoke of the need for “standing firm” and negotiating for their opportunities. One female 51 year old Assistant Administrator of Nursing Services told this self-described “story:” “In the mid-1970s, I took a position as an emergency room nurse that had been earlier filled by a man. I found out that his hourly wage was higher than mine, despite the fact that he had no more experience than I did. When I questioned our Human Resources folks about this, they responded that he was able to handle the stronger work requirements of the job. I reminded them that I’d be doing the exact same things that he did and that I was equally capable. They revised my salary to fit his immediately.” In terms of compensation differentials, one 57 year old female government employee who is earning a six-figure salary felt that over time, opportunities have improved but, as she stated, “…in some areas the opportunities have gotten better but it’s still not equal.” Another 42 year old Latina manager stated that in her last two jobs, she did not receive a promotion and “I left and looked for better jobs.”
Question #2: In your personal experience as a manager of others, do you believe that women have had bonus and promotional opportunities that are comparable to those offered to men? If so,why? If not, why not?
From the managerial perspective (versus the employee perspective), responses to this item were more greatly dispersed. Although 14 participants answered “yes,” (slightly more than half of the sample), six answered “no,” six indicated the item was not applicable to their situations, and one was “unsure.” Among those who answered in the affirmative, these statements emerged:
“At no time did a supervisor discourage me from giving recognition to a female and recognition in terms of bonuses, promotions and salary increases were equitable across gender.”
“As the owner of my own business, I have had opportunities that are not available to men…certain state grants give preference to minorities and women. I’m not sure if this is still the case, but I have been the recipient of a project that gave preference to women.”

Glass Ceiling Volume 4, Number 2, 2009 51
“I know of no situation that involved unequal pay for equal performance. If I had discovered such a situation, I would have rectified it at once.”
“I made it my business to move up. I don’t believe that women should get a hand-out. It should be based on how well you do your job.”
“The world is your oyster and sex shouldn’t make a difference. Character is one’s most important quality.”
Those who answered “no” did so with the following: “As a manager, I have not had the mentorship that other female colleagues have had. The women I have known who are willing to mentor are limited by time. As a golfer, it has only been in the past 10-15 years that professional women have learned that business and mentoring take place during the 3-4 hours on the course.” Other negative responses included these remarks:
“Women have had promotional opportunities here, and the successful ones know who they are and what unique strengths they bring to the department. While I recognize the strengths of these individuals, upper management does not.”
“I feel that there are multiple deciding factors depending on the profession. Men’s abilities are given more weight in certain professions seen as ‘unsuitable’ for women. We are still in a very gender biased society.”
While one respondent said that “all my staff except one are female, and I value the work ethics and dedication of female workers over males,” he added, “females have more responsibility at home and need flexibility of working hours” and “on the other hand, females have less opportunity of promotion, partly due to system bias, partly because they need to (or choose to) divide their time between work and family.”
The one respondent whose response was deemed “uncertain” answered as follows: “In my experience as a manager of others, the primary reason women did not have the same promotional opportunities as men was due to their greater priority on flex time often tied to family or caregiver responsibilities and commitments.”
Question #3: What advice would you offer to an entry-level, female professional regarding her career strategies?
This question was intended to elicit the various activities, traits, and behaviors that women use or do not use to achieve parity with men in the workplace. Not surprisingly, it produced a thoughtful and comprehensive array of replies that fell under the following topics.
Acquire knowledge of one’s chosen profession as well as the law. “Learn about the EEO complaint process and use it if there is discrimination in hiring, advancement or other personnel action affecting one’s career.” “Do your homework and learn to delegate.” “Use legal means to challenge business practices that appear to be discriminatory.” “Education, education, education – can I say get your education? One will have more leverage for career strategies than a non-educated person.” “Earn as many relevant qualifications as you can.” “If she perceives inequities, she needs to speak up about them or seek employment elsewhere.” “Get a good education. A female, if not better than a male, will not be seen as their peer in our school system.” “Stay on top of the latest data in your field and don’t hesitate to learn areas outside of your field of expertise.”
Seek out mentors/networking contacts. “Networking is critical and does take time, so select your networking opportunities strategically. Seek a mentor without being or appearing to be too needy or

52 Journal of the North American Management Society Skiba & Mosca
indecisive.” “Belong to a professional women’s group. Networking with other professionals is a great way to find out about new opportunities and advancement.” “Attend relevant conferences and professional meetings to network.” “You must network, network, network and not fall into the trap of putting other women down. I’ve seen that quite a bit in my previous jobs.”
Be aware of the need for work-life balance. “Beware of falling into the pitfalls that men have fallen into historically, such as careerism at the cost of personal and family life.” One respondent concentrated on this topic with these statements: “Women need to prioritize and balance their family and career goals early on. If career success is to be her priority she cannot always count on an employer’s having family friendly policies of flextime or telecommuting. Successful men and women alike commonly work in excess of 60 hours per week…successful women, more so than men, are likely to delay having families and are more likely than their male counterpart to feel added stress as a consequence of less social and familial support on the home front. Regardless of her priority she will need to understand that its pursuit will come at a cost and involve both sacrifice and compromise.”
Other forms of advice included the need to consider autonomy (“open your own business and be your own boss”); performing at one’s best (“There is nothing better in terms of career advancement than giving the job all that you can. Performance gets recognized eventually” and “Work hard and demonstrate your talent”); taking calculated risks; preparing to be an effective negotiator; and showing confidence/determination (“If she perceives inequities, she needs to speak up about them” and “Stand up for what you believe in, and don’t compromise your values and ethical principles”).
LIMITATION OF THE STUDY AND FUTURE RESEARCH
As mentioned earlier, this study produced 27 respondents. These researchers believe that the primary reason for this low number for the association groups was the time of year during which the surveys were sent to them – in the beginning of the summer when many businesspeople and most academic administrators are traveling or vacationing. In retrospect, a telephone-based structure, albeit a laborious process, is a more structured and personal one that may have proven more effective than the electronic approach. Although the hard-copy survey worked well with the graduate student segment and elicited rich feedback, the researchers believe that regardless of the use of either telephone or paper-based media, the human or interactive presence of a researcher is essential to qualitative data collection and, in particular, thoughtful and more in-depth responses from participants.
While the information collected from these small groups cannot be generalized across the spectrum of all U.S. women engaged in professional careers, and it does not thoroughly represent the regional, occupational and functional disciplines that are occupied by female professionals, it reinforced topics that continue to sustain interest and resolution from both the academic and business communities. For example, studies show that mentors and role models can have a significant effect on women’s advancement and high-profile visibility (Mattis 2001; Desvaux, Devillard-Hoellinger and Meaney 2008), confidence levels (Torrisi-Mokwa 2006), and psychosocial support (Roemer 2002). In addition, work-life balance issues most likely will increase as more and more women continue to earn higher educational levels and contribute to their organizations’ intellectual capital (Florida and Goodnight 2005; Gilbert 2007; Neil 2007).
In spite of the advancements that women have made over the last several decades, women and men still possess different amounts of accumulated labor market experience, and some disparity may be due to different occupational and industry distributions (Anonymous 2003). Disparities appear to be most acute within the technical and scientific occupations collectively known as the science, engineering, technology and mathematics (STEM) workforce. According to one research study, since 2000 and at the highest

Glass Ceiling Volume 4, Number 2, 2009 53
level of training (PhD), “…women earned 46.3 percent of the PhDs in the biological sciences, 28 percent of the mathematics and statistics degrees, 26 percent in physical sciences, 21 percent in computer science, and 18 percent in engineering” (Rosser and Taylor 2008, p. 21). The authors of this study uncovered two of the same conclusions that these authors did in that family obligations (work-life balance) and a lack of networking and mentoring inhibit and often terminate women’s presence in the STEM workforce. Within the information technology sector, salaries continue to remain unequal. In Computerworld’s 2007 annual salary survey, “male IT professionals continue to out-earn their female counterparts. At the highest level of IT, male CIOs and vice-presidents made on average $179,026 in total compensation, while women in the same jobs took in nearly $6,000 less, at $173,052. The pay differences between middle managers and technical workers are similarly unequal” (Hoffman 2007, p. 54). Executive recruiters who were queried about these numbers noted that salary gaps among IT positions have narrowed; however, they also expressed concern about the retention of talented females and the difficulties they encounter with promotions.
It is important to note that several participants in this study applied their advice to young, entry-level professionals who are both males and females, which raises the question of whether future research will reveal that career advice is universal for both sexes. Other dimensions that may or may not be revealed in future studies include the changes in attitudes (legally and socially) and culture across the country. Regardless of these and other themes that were not explored in this paper, they should be examined by others to determine how to maximize the productivity and potential of this large and growing segment of the workforce.
REFERENCES
Anonymous 2004. 2004 Wow! Quick Facts: Women and Diversity. 2004 Diversity Best Practices/Business
Women’s Network, Washington, D.C.
Anonymous 2003, May. Closing the Gap Amidst Ongoing Discrimination: Women and Economic Disparities. Multinational Monitor, 24(5), 25.
Bureau of Labor Statistics 2005. Women in the Labor Force: A Databook. Washington, DC: United States Department of Labor. Available at http://www.bls.gov/cps/wlf-databook2005.htm. Accessed on May 12, 2007.
Desvaux, G., Devillard-Hoellinger, S., Meaney, M.C. 2008, September. A business case for women. The McKinsey Quarterly. Available at http://www.mckinseyquarterly.com/article_print.aspx?L2=18&L3=31&ar=2192.
Florida, R., Goodnight, J. 2005, July/August. Managing for Creativity. Harvard Business Review, 83(7/8), 124-131.
Gilbert, L.A. 2007, Winter. Being Together, Working Apart: Dual-Career Families and the Work-Life Balance. Journal of Comparative Family Studies, 38(1), 182-183.
Gjerdingen, D., McGovern, P., Bekker, M., Lundberg, U., Willemsen, T. 2002. Women’s Work Roles and Their Impact on Health, Well-Being, and Career: Comparisons Between the United States, Sweden, and The Netherlands. Women and Health Journal, 30(4), 1. Available at http://proquest.umi.com/pqdweb?did=490399791&sid=1&Fnu=7&clientId=13492&RQT=309&VName=PQD
Gogoi, P. 2006. Wal-Mart Workers Walk Out. BusinessWeek Online. Available at: http://www.businessweek.com/bwdaily/dnflash/content/oct2006/db20061017_601244.htm. Accessed on June 4, 2007.
Hoffman, T. 2007, November 12. Women in IT: A Lopsided Pay Scale. Computerworld, 41(46), 54.

54 Journal of the North American Management Society Skiba & Mosca
Isaacs, E. 2005. Gender Discrimination in the Workplace: A Short Literature Review. Accessed on May 18, 2006 from http://www.izix.com/pro/bias/women.php
Jones, J. 2005, February. Top Executives Expect Raises, Women Leaders Pay Lags Behind Men. The NPT 2005 Salary Survey. Available at http://www.nptimes.com/Feb05/sr1.html. Accessed on July 1, 2007.
Kelly, K., DeBaise, C. 2004, July 6. Morgan Stanley Is Focus of Trial on Gender Bias. The New York Times.
Mattis, M.C. 2001. Advancing women in business organizations: Key leadership roles and behaviors of senior leaders and middle managers. The Journal of Management Development, 20(4), 371-390.
Morris, B. 2005, January 10. How Corporate America Is Betraying Women. Fortune, 151(1), 68.
Neil, M. 2007, August. Working Mother Lists Top 50 Law Firms. The ABA Journal. Accessed on August 17, 2007 from http://www.abajournal.com/news/working_mother_lists_top_50_law_firms/print
Paton, N. 2005, October 21. Women Squeezed Out of Organizational Life. Accessed on May 18, 2006 from http://www.managementissues.com/display_page.asp?section=research&id2687
Roemer, L. 2002, Fall. Women CEOs in Health Care: Did They Have Mentods? Health Care Management Review, 27(4), 57-68.
Rosser, S.V., Taylor, M.Z. 2008, Fall. Economic Security: Expanding Women’s Participation in US Science. Harvard International Review, 30(3), 20-24. Shapiro, J.R. (2006, January). Why Women Still Feel Persecuted. USA Today.
Stone, A. 2004. You’ve Got a Long Way to Go, Baby. In BusinessWeek online. Available at http://www.businessweek.com/bydaily/dnflash/nov2004. Accessed on November 22, 2004.
Toossi, M. 2002. A Century of Change: The US Labor Force, 1950-2050: With Slower Growth, Aging, and Increasing Diversity, the Profile of the US Labor Force Is Undergoing a Gradual, but Significant, Change. Monthly Labor Review, 125.
Torrisi-Mokwa, J. 2006, December. The Seven Questions Firm Leaders Need to Ask to Advance Professional Women More Effectively. CPA Practice Management Forum, 2(12), 13-15.
Troy, M. 2006, January 23. War of Words Continuing Over Wal-Mart’s Salaries, Benefits. DSN Retailing Today, 45(2).
U.S. General Accounting Office 2003. In 2004 Wow! Quick Facts: Women and Diversity, 11. Washington, DC: 2004 Diversity Best Practices/Business Women’s Network.
Journal of the North American Management Society, Volume 4, Number 2, 2009
Women in Management and Emotional Disequilibrium in the Workplace
Willia Glover, Emotional Intelligence Coaching and Consulting
Abstract: This exploratory study uses personal narratives from 5 women in senior management to explore the relationship, if any, between women in management and emotional disequilibrium in the workplace. The following questions are of primary interest: 1. Is the workplace a source of emotional disequilibrium for women in management?; and 2. If so, how are these emotionally challenging experiences being managed? This study reveals that many women in management encounter emotionally challenging experiences in the workplace confirming the workplace as a source of emotional disequilibrium.
Humans are emotional beings; therefore, emotional equilibrium and emotional disequilibrium are inherent in the human experience. However, sustaining the desired emotional state of equilibrium and stability requires emotional intelligence.
Emotional intelligence as defined by researchers Salovey and Mayer is “a form of social intelligence that involves the ability to monitor one’s own and others’ feelings and emotions, to discriminate among them, and to use this information to guide one’s thinking and action” (Cherniss, 2000, p. 1). Much has been written about emotional intelligence and its increasing importance to effective leadership in the workplace. According to Cooper (1997, p. 38), “one of the foremost challenges facing leaders and organizations [is] how to learn and lead through emotional intelligence and reasoning instead of abstract ideas and analysis.” However, little is written about emotional disequilibrium in the workplace, especially among women in management.
Emotional disequilibrium, which Goleman (2005) describes as “emotional hijacking” (p. 26) is a state of emotional distress represented by a disturbing emotion such as anger, fear, or frustration that short circuits rational thought and hurls the individual into a state of disequilibrium. Although this emotional state is temporary, it can greatly impact productivity.
This study seeks to determine if there is a relationship between women in management and emotional disequilibrium in the workplace. Personal narratives are used to recount emotionally challenging experiences in the workplace and explore the following questions:
1. Is the workplace a source of emotional disequilibrium for women in management?
2. If so, how do women leaders cope with these emotionally challenging experiences?
SUMMARY OF LITERATURE REVIEW
The literature provides little insight into the experience of emotional disequilibrium in the workplace and women in management. However, it exposes gender and power issues in the workplace that could trigger emotional challenges for women in positions of leadership.
For instance, Fletcher writes about a phenomenon in the workplace called ‘disappearing’ where one is ignored and becomes invisible. Fletcher asserts that ‘disappearing or getting disappeared’ by the

56 Journal of the North American Management Society Glover
organization or colleagues can produce emotional disequilibrium as a result of feeling dismissed, devalued, exploited, and misunderstood. This phenomenon, according to Fletcher (1999, p. 113), “abounds among women in the workplace” and is “largely an undiscussable subject in contemporary management.”
In a study conducted by Catalyst that examined barriers facing women in the workplace, it was discovered that “gender-based stereotyping in business limits opportunities for women to advance in the workplace and achieve their potential” (Catalyst, 2005, p. 3). This “obvious but unspoken” practice, according to Catalyst, continues to maintain gender disparities in corporate leadership (Catalyst, 2005, p. 3).
Catalyst (2000, p. 13) revealed that myths “held by both men and women” fostered gender stereotyping in the global business world and are the reason why “women currently make up only 13 percent of expatriates in U.S. corporations,” but comprise 50 percent of the labor pool (p. 2). Catalyst also discovered that gender stereotyping frequently puts women leaders in “double-bind, ‘no-win’ dilemmas” (Nierenberg & Fong, 2007, p. 1). If women business leaders are focused “on work relationships” and express “concern for other people’s perspectives,” they are considered “less competent” (Belkin, 2007, p. 3). If they “act assertively, focus on work task, display ambition”--they are seen as “too tough” and “unfeminine” (Belkin, 2007, p. 3).
Nierenberg & Fong (2007, p. 1) concluded that “women leaders face higher standards than men leaders and are rewarded with less” and “when women exhibit traditionally valued leadership behaviors such as assertiveness, they tend to be seen as competent but not personable or well-liked. Yet those who do adopt a more stereotypically feminine style are liked but not seen as having valued leadership skills.” The perception is that men are still viewed as “default leaders” and women as “atypical leaders.” As a result of this lingering perception, women “violate accepted norms of leadership, no matter what the leadership behavior” and “are perceived as ‘never just right’”.
The literature certainly suggests that the workplace can be a source of emotional disequilibrium for women in positions of leadership, but it does not address how women in management cope with emotional challenges in the workplace.
METHODOLOGY
This study uses personal narratives to access and explore deeply held experiences of emotional disequilibrium in the workplace among women leaders.
Participants in this study were self-selected by their response to the following primary question:
“As a member of management, have you ever had an interaction with members of your leadership team that triggered an emotion within you similar to feeling:
a. ignored b. exploited
c. devalued d. dismissed
e. misunderstood f. disheartened
g. inadequate h. incompetent or
i. damned if you do and damned if you don’t?”
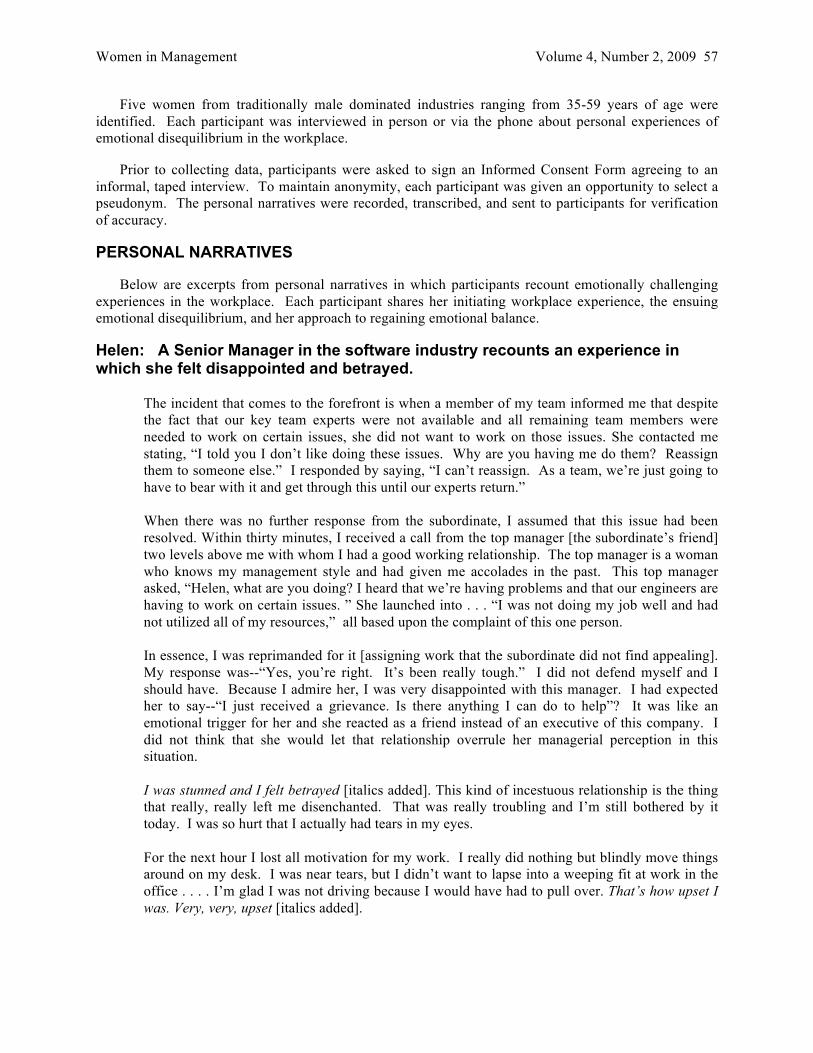
Women in Management Volume 4, Number 2, 2009 57
Five women from traditionally male dominated industries ranging from 35-59 years of age were identified. Each participant was interviewed in person or via the phone about personal experiences of emotional disequilibrium in the workplace.
Prior to collecting data, participants were asked to sign an Informed Consent Form agreeing to an informal, taped interview. To maintain anonymity, each participant was given an opportunity to select a pseudonym. The personal narratives were recorded, transcribed, and sent to participants for verification of accuracy.
PERSONAL NARRATIVES
Below are excerpts from personal narratives in which participants recount emotionally challenging experiences in the workplace. Each participant shares her initiating workplace experience, the ensuing emotional disequilibrium, and her approach to regaining emotional balance.
Helen: A Senior Manager in the software industry recounts an experience in which she felt disappointed and betrayed.
The incident that comes to the forefront is when a member of my team informed me that despite the fact that our key team experts were not available and all remaining team members were needed to work on certain issues, she did not want to work on those issues. She contacted me stating, “I told you I don’t like doing these issues. Why are you having me do them? Reassign them to someone else.” I responded by saying, “I can’t reassign. As a team, we’re just going to have to bear with it and get through this until our experts return.” When there was no further response from the subordinate, I assumed that this issue had been resolved. Within thirty minutes, I received a call from the top manager [the subordinate’s friend] two levels above me with whom I had a good working relationship. The top manager is a woman who knows my management style and had given me accolades in the past. This top manager asked, “Helen, what are you doing? I heard that we’re having problems and that our engineers are having to work on certain issues. ” She launched into . . . “I was not doing my job well and had not utilized all of my resources,” all based upon the complaint of this one person. In essence, I was reprimanded for it [assigning work that the subordinate did not find appealing]. My response was--“Yes, you’re right. It’s been really tough.” I did not defend myself and I should have. Because I admire her, I was very disappointed with this manager. I had expected her to say--“I just received a grievance. Is there anything I can do to help”? It was like an emotional trigger for her and she reacted as a friend instead of an executive of this company. I did not think that she would let that relationship overrule her managerial perception in this situation. I was stunned and I felt betrayed [italics added]. This kind of incestuous relationship is the thing that really, really left me disenchanted. That was really troubling and I’m still bothered by it today. I was so hurt that I actually had tears in my eyes. For the next hour I lost all motivation for my work. I really did nothing but blindly move things around on my desk. I was near tears, but I didn’t want to lapse into a weeping fit at work in the office . . . . I’m glad I was not driving because I would have had to pull over. That’s how upset I was. Very, very, upset [italics added].

58 Journal of the North American Management Society Glover
It took the remainder of that week and over the weekend to get beyond that hurt. No matter how well you do your job you’re always going to be suspect of being incompetent, unfair or unreasonable.
Tinkerbelle: A Director in the software industry shares an experience of feeling exploited, ignored, and frustrated.
In a previous management chain, there were several women and multiple men at the senior director’s level who would have been asked for information and ideas about future projects. Several times I submitted ideas, but many times my ideas were ignored, or what I would call almost dismissed. Yet, portions of my suggestions were included in the suggestions usually presented by men. This always made me feel that I was devalued and ignored for my ideas. For instance, in a discussion with my former boss who is not an American citizen, I presented an idea to resolve an issue we were having. He responded by saying, “Well, OK, that sounds like a good idea. Send it to me by email and copy two other male associates.” So, I did that. Two meetings later my boss informed us that he had received several ideas some of which were exceptional and the exceptional ideas were the ones that he had decided to move forward with.
One of the exceptional plans provided by one of my male associates included two primary steps that I had already initiated in my team with very positive results. He [my boss] rolled out this exceptional plan and gave applause on the phone to my associate and his excellent plan and details--patting him on the back to the point that made you sick.
I was emotionally crushed. I was mad [italics added]. Once again I was not validated for my contributions. Everyone else was validated, applauded and recognized, but my efforts were never put into the same scope as theirs. I was so furious; I actually shut down for a period of time. I was not willing to offer too much information to anyone for the simple fact that I knew that once again . . . they would take my information, capitalize off of it, and I would get no credit. I don’t say I want all ofthe credit, but I do want acknowledgement for that portion of the work that was mine.
It took me probably four to five months to recover from this emotionally challenging experience. During that four to five months, I no longer put my ideas out there for everyone to share. At the end of that four to five months, I began to share limited information that I could clearly show had been established and my track record with it.
Several years ago it was so frustrating for me that I would be frustrated for days. It wasn’t just my frustration with me, but I would snap at my husband and snap at the clerk in the grocery store when these people had no impact upon my frustration. One day after a frustrating day at work, I found myself snapping at a clerk in a store. It was then that I realized that I had become very negative and went home and cried. That’s when I started composing emails . . . to myself . . . saying exactly what I think, what the problems are, and what needs to be addressed. Then I close out the email and tell myself there is nothing more I can do. Carrying it around all day will not help my staff, my family, or anyone else. It feels good to be able to let that raw emotion out. So, by putting it in the email, it’s a great release . . . but it doesn’t address what I’m going to do to fix it going forward and I still struggle with that; trying to figure out a better way. Again I was working with my superior who is not an American citizen. It was one of the most frustrating times. I got to the point where I wanted to leave my job. I just didn’t think I was going to be able to do it anymore.

Women in Management Volume 4, Number 2, 2009 59
I work in an organization that is almost all men and there are very few women on my team. Regardless of whether you are in your country or his country, my boss believed that women should act and present themselves in a certain manner. We had gone to a Middle Eastern restaurant for dinner one night. The conversation was good, but you could tell that some topics are softly spoken about when a lady is sitting at the table. At the end of the evening we all went out to the patio where they have the hookah pipes. The men were going to smoke the pipes. My superior went over and selected the tobacco and they all got their little mouthpieces, except for me. My superior, of course, was the one handing out the mouth pieces. They were all sitting there chatting and having drinks and I’m sitting there in the corner completely excluded from the whole event. I decided at that point that “I’m a big girl, over 21, and I can peddle my own bike. I’ll get my own mouthpiece.” I talked to the gentleman and I got my mouthpiece. He was reserved about giving it to me, however. It was obvious that I was breaking tradition and culture. But in America I have equal opportunity. So, I took my mouthpiece over and this time instead of letting them pass the pipe across me, I put my mouthpiece in and took a puff and the conversation absolutely froze. Absolutely froze as my superior was sitting there staring. I’m not sure if he was speechless or what, but he didn’t say a word. Within five minutes, they were all ready to go. “We’re done, let’s go.”
On another occasion this superior came to my city. I had to pick him up at his hotel because he didn’t want to drive. I arrived at his hotel at 7:30 a.m. At 8:30 a.m. he shows up in the lobby and tells me he’s going to have breakfast. So he sits there and has breakfast in front of me and when he finishes, he offers me a banana. He lays it on the table and says, “I thought you might want some breakfast.” So, for five days I got a banana each morning and I could get to work anywhere from 8:30 to 9:30 a.m. I never knew. Yet I needed to arrive at his hotel around 7:30 or 8 o’clock and wait for his arrival, wait for his breakfast, and chauffeur him to the office. One morning, I had had enough. I needed to write my email and refresh myself so I asked a co-worker on another team to take my superior downstairs and get him a cup of coffee because he didn’t get his coffee at breakfast that morning. So my co-worker takes him to the cafeteria and he’s standing in front of the coffee machine and he tells her, “I like the medium size cup with cream and one packet of sugar.” My co-worker looks at him and says, “There’s your cup, there’s the cream, and there’s the sugar. I’ll wait at the register for you because you will need to pay for it.”
My co-worker says that my superior stood there for probably ten minutes looking at the coffee machine. She said she was not sure if he did not know how to work the equipment or if he was so frustrated that he wasn’t going to do it or what. I had to just chuckle at the look on her face when she brought him back up to my office. I had been feeling the same way for over two years of working with him.
Esther: A Senior Director in the information technology industry shares her experience of feeling devalued, inadequate, incompetent, and damned if you do and damned if you don’t.
I work as part of a delivery organization and there are certain expectations to deliver certain projects within budget and on time. In this incident, part of being able to deliver a service is that my budget was cut midway through delivery while at the same time the scope was increased.

60 Journal of the North American Management Society Glover
Initially, I shared with them [the client], “Here’s what I can do; here’s what my team can do.” I was asked to come back a couple of weeks later, basically, to see if there was any opportunity for me to accelerate the timeline or find ways to do something faster or with fewer resources. I think what they didn’t like is that the second report basically produced the same results. I think they expected that I would come back with some sort of out-of-the-box thinking to figure out how to do more within the revised budget guidelines and that has not been the case.
I’ve had one-on-one conversations with my manager . . . to get some sense of direction from him about how I should handle this situation. I know that he is also feeling some pressure from the business and is, therefore, coming back to me asking if there is anything else I can do. The lever I would be looking for is to change the date. If there are no more resources that can be applied, that’s fine, but I need some sort of buffer on the date and that’s not an option, at least right now, they’re willing to entertain.
There’s an expectation that not only will I deliver to the original scope, but deliver to the expanded scope with fewer resources. I’m made to feel like I should be smart enough to figure this out and that I shouldn’t take on the attitude of being a victim of a budget cut. I’m also made to feel if I can’t do it, then I am inadequate and that my peers or someone else could get the job done.
My way of responding is to try to present the facts and try not to get emotionally pulled into some of the accusations that are being presented. I’m trying to stick to the facts, but I can tell you that most people want to pull you into the emotional aspects of it because the delivery of this particular solution brings a lot of benefit to the company.
I am dealing with senior level executives in the company and this is a very high profile project. They don’t want to hear, “I can’t get the job done.” They want to hear how I can get that job done. So my approach has been, “Here’s where we are today, here’s what’s going to be required in order for us to finish the job, and then here’s how you can help me.”
It’s been frustrating to have doubt about your ability to deliver and frustrating because you’re spending so much mental energy trying to figure this out. You become tired and agitated. The energy level is low.
I make a conscious choice not to allow it to interfere with my ability to get back to the business at hand and function as the leader that I need to function as. But subconsciously, I’m still feeling a bit inadequate and a bit damned if you do and damned if you don’t.
I feel inadequate and frustrated and somewhat tired of having to go back multiple times to present the data. I’m frustrated with being asked to do the work again and again; inadequate when asked to come back with a different answer.
If I could really open up and openly share with my management or with the leadership team about what’s going on, without thinking about repercussions it would be very helpful.
Jessica: A Senior Manager in the software industry. Her experience produced feelings of self-doubt, fear, and intimidation.
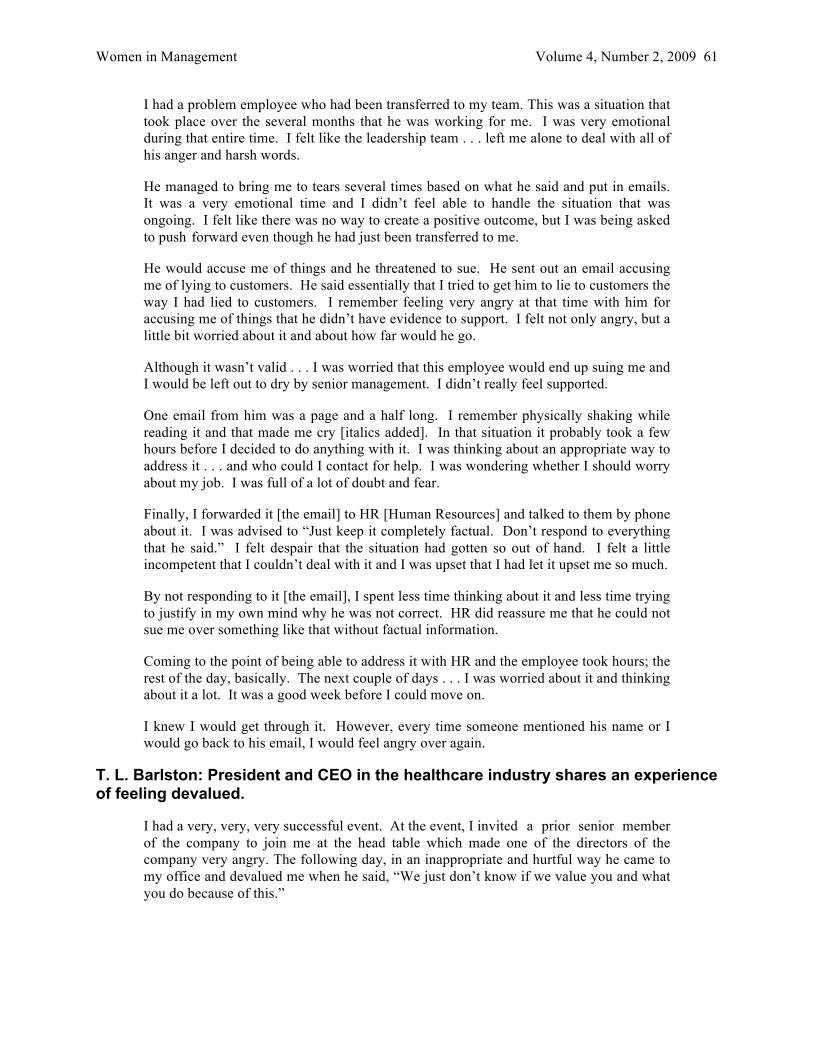
Women in Management Volume 4, Number 2, 2009 61
I had a problem employee who had been transferred to my team. This was a situation that took place over the several months that he was working for me. I was very emotional during that entire time. I felt like the leadership team . . . left me alone to deal with all of his anger and harsh words.
He managed to bring me to tears several times based on what he said and put in emails. It was a very emotional time and I didn’t feel able to handle the situation that was ongoing. I felt like there was no way to create a positive outcome, but I was being asked to push forward even though he had just been transferred to me.
He would accuse me of things and he threatened to sue. He sent out an email accusing me of lying to customers. He said essentially that I tried to get him to lie to customers the way I had lied to customers. I remember feeling very angry at that time with him for accusing me of things that he didn’t have evidence to support. I felt not only angry, but a little bit worried about it and about how far would he go.
Although it wasn’t valid . . . I was worried that this employee would end up suing me and I would be left out to dry by senior management. I didn’t really feel supported.
One email from him was a page and a half long. I remember physically shaking while reading it and that made me cry [italics added]. In that situation it probably took a few hours before I decided to do anything with it. I was thinking about an appropriate way to address it . . . and who could I contact for help. I was wondering whether I should worry about my job. I was full of a lot of doubt and fear.
Finally, I forwarded it [the email] to HR [Human Resources] and talked to them by phone about it. I was advised to “Just keep it completely factual. Don’t respond to everything that he said.” I felt despair that the situation had gotten so out of hand. I felt a little incompetent that I couldn’t deal with it and I was upset that I had let it upset me so much.
By not responding to it [the email], I spent less time thinking about it and less time trying to justify in my own mind why he was not correct. HR did reassure me that he could not sue me over something like that without factual information.
Coming to the point of being able to address it with HR and the employee took hours; the rest of the day, basically. The next couple of days . . . I was worried about it and thinking about it a lot. It was a good week before I could move on.
I knew I would get through it. However, every time someone mentioned his name or I would go back to his email, I would feel angry over again.
T. L. Barlston: President and CEO in the healthcare industry shares an experience of feeling devalued.
I had a very, very, very successful event. At the event, I invited a prior senior member of the company to join me at the head table which made one of the directors of the company very angry. The following day, in an inappropriate and hurtful way he came to my office and devalued me when he said, “We just don’t know if we value you and what you do because of this.”

62 Journal of the North American Management Society Glover
It was flabbergasting to me. You don’t have to thank me; you don’t have to pour accolades on me; but to say that you’re devalued is probably the most crushing statement professionally I’ve ever had and it took several weeks to recover from the depression.
In response to his statement, I stayed very calm. I really did not let that person know how much it hurt me and affected me.
I spoke to my immediate boss after that. I let him know how hurtful it was to me; how it affected my mojo; how it was very difficult to do my job given those circumstances and that it would take me time to get my mojo back. He was supportive, if you will, and said, “Oh, well, we’ll work through this,” but gave very little direction or willingness to step in because the person who did this was his boss.
This experience lingered with me. It crushed my energy for what I do and so it took a few weeks and many sleepless nights during that time to rethink. I felt completely unappreciated [italics added].
It wasn’t about the incident itself, it was about the bigger picture of what was said and about not feeling valued; about how I’d worked to change this company around and how successfully I’d done it over the past few years and how unappreciated I am; and nervous about whether they are trying to get rid of me.
[Nevertheless,] I did get up and come in on days I didn’t want to. I canceled some of my big meetings during that first week knowing that people would be able to read pretty easily that I’m not myself. So, I stayed more in my office that week; a little more phone work than in person and . . . slowly kept reminding myself of my value and who I was doing my job for—not to impress the big guys, but I was doing it for my company, staff, and for our clients. That helped sustain me . . . and slowly helped to get my energy back.
[Also]--I would think for strong women leaders others would have experienced this as well. I have always intimidated other women and actually men as well at upper levels. So I have found myself really trying to temper my behavior and be liked more--to be so sweet and so kind because of that. Sometimes I get resentful of that. I look at the behavior of a male, for instance, it’s perfectly acceptable for them. They’ll say something that if I said it, it would not be accepted. So, sometimes it’s frustrating.
I try too hard to be liked so that I’m not the witch; I’m not the ogre up there that thinks she knows everything.
RESULTS AND CONCLUSIONS
Three key findings emerged from this study. First, the workplace is, indeed, a significant source of emotional disequilibrium for women in management. Second, women in management struggle to manage the emotional disequilibrium they experience in the workplace. This suggests that although women tend to have highly developed emotional intelligence, further development of emotional competencies is needed to better manage emotionally stressful workplace experiences.
Third, strategies used to address emotionally challenging experiences in the workplace varied widely among participants. Generally, the participants had no proven strategy for managing the emotional disequilibrium and regaining their emotional balance.
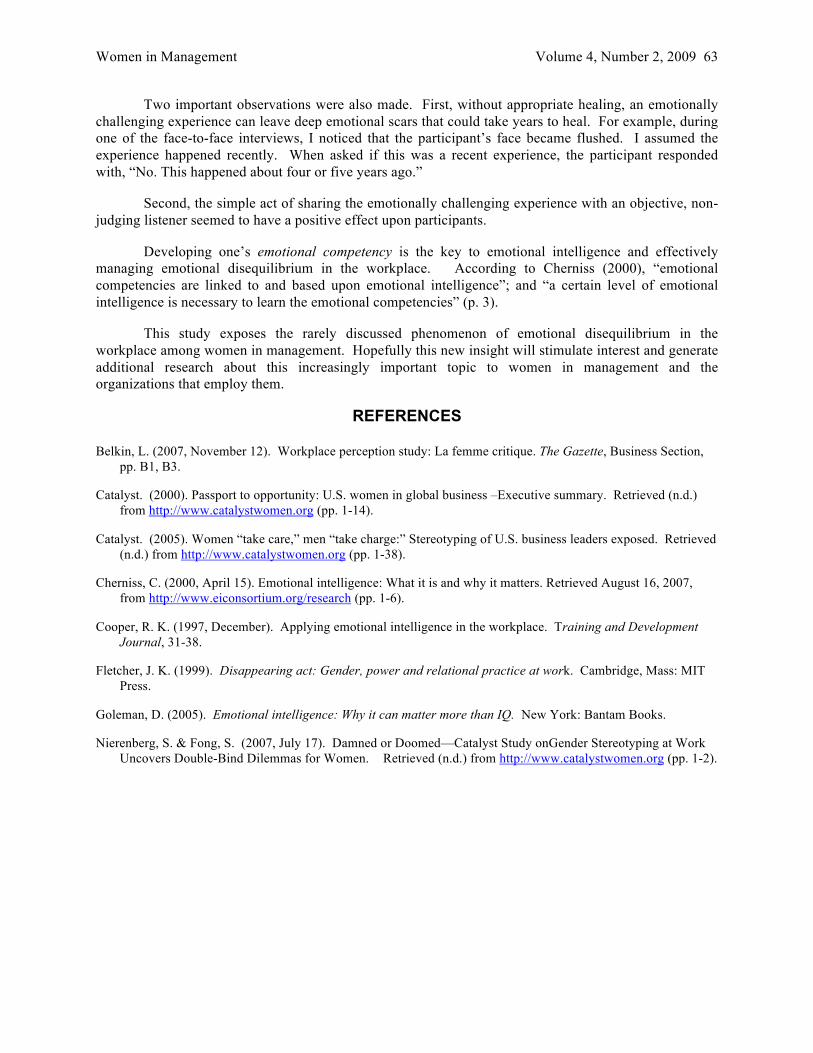
Women in Management Volume 4, Number 2, 2009 63
Two important observations were also made. First, without appropriate healing, an emotionally challenging experience can leave deep emotional scars that could take years to heal. For example, during one of the face-to-face interviews, I noticed that the participant’s face became flushed. I assumed the experience happened recently. When asked if this was a recent experience, the participant responded with, “No. This happened about four or five years ago.”
Second, the simple act of sharing the emotionally challenging experience with an objective, non-judging listener seemed to have a positive effect upon participants.
Developing one’s emotional competency is the key to emotional intelligence and effectively managing emotional disequilibrium in the workplace. According to Cherniss (2000), “emotional competencies are linked to and based upon emotional intelligence”; and “a certain level of emotional intelligence is necessary to learn the emotional competencies” (p. 3).
This study exposes the rarely discussed phenomenon of emotional disequilibrium in the workplace among women in management. Hopefully this new insight will stimulate interest and generate additional research about this increasingly important topic to women in management and the organizations that employ them.
REFERENCES
Belkin, L. (2007, November 12). Workplace perception study: La femme critique. The Gazette, Business Section, pp. B1, B3.
Catalyst. (2000). Passport to opportunity: U.S. women in global business –Executive summary. Retrieved (n.d.) from http://www.catalystwomen.org (pp. 1-14).
Catalyst. (2005). Women “take care,” men “take charge:” Stereotyping of U.S. business leaders exposed. Retrieved (n.d.) from http://www.catalystwomen.org (pp. 1-38).
Cherniss, C. (2000, April 15). Emotional intelligence: What it is and why it matters. Retrieved August 16, 2007, from http://www.eiconsortium.org/research (pp. 1-6).
Cooper, R. K. (1997, December). Applying emotional intelligence in the workplace. Training and Development Journal, 31-38.
Fletcher, J. K. (1999). Disappearing act: Gender, power and relational practice at work. Cambridge, Mass: MIT Press.
Goleman, D. (2005). Emotional intelligence: Why it can matter more than IQ. New York: Bantam Books.
Nierenberg, S. & Fong, S. (2007, July 17). Damned or Doomed—Catalyst Study onGender Stereotyping at Work Uncovers Double-Bind Dilemmas for Women. Retrieved (n.d.) from http://www.catalystwomen.org (pp. 1-2).
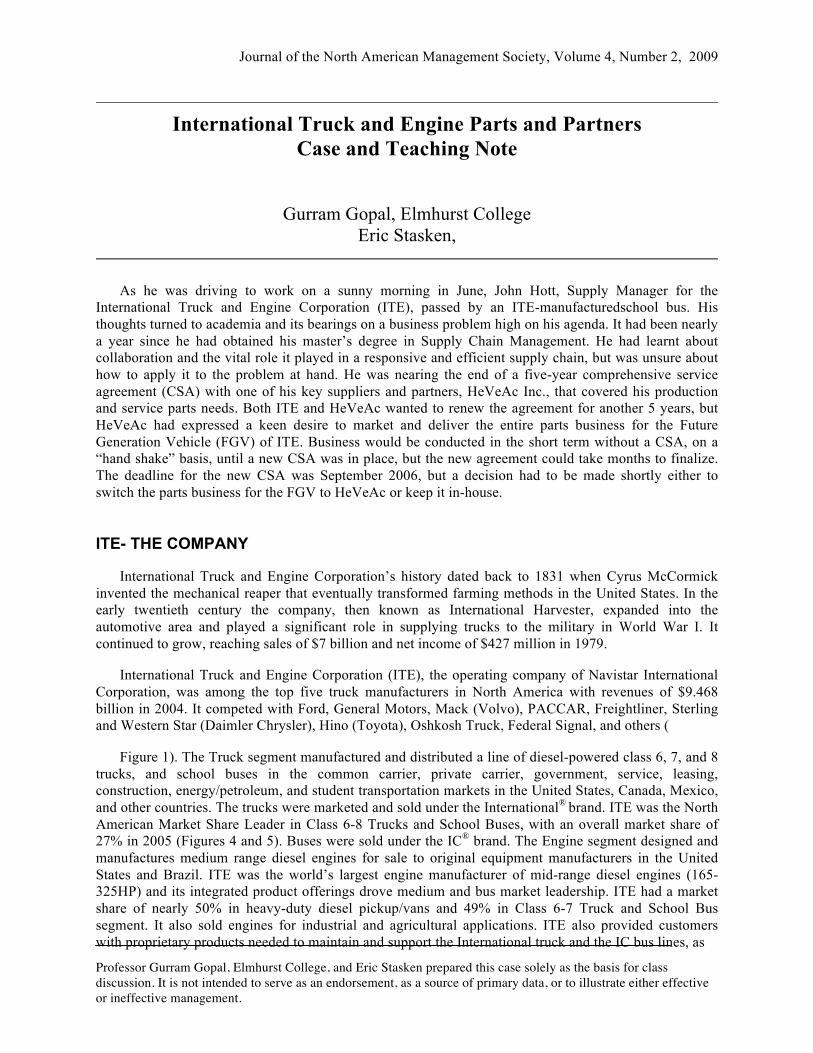
Journal of the North American Management Society, Volume 4, Number 2, 2009
Professor Gurram Gopal, Elmhurst College, and Eric Stasken prepared this case solely as the basis for class discussion. It is not intended to serve as an endorsement, as a source of primary data, or to illustrate either effective or ineffective management.
International Truck and Engine Parts and Partners Case and Teaching Note
Gurram Gopal, Elmhurst College Eric Stasken,
As he was driving to work on a sunny morning in June, John Hott, Supply Manager for the International Truck and Engine Corporation (ITE), passed by an ITE-manufacturedschool bus. His thoughts turned to academia and its bearings on a business problem high on his agenda. It had been nearly a year since he had obtained his master’s degree in Supply Chain Management. He had learnt about collaboration and the vital role it played in a responsive and efficient supply chain, but was unsure about how to apply it to the problem at hand. He was nearing the end of a five-year comprehensive service agreement (CSA) with one of his key suppliers and partners, HeVeAc Inc., that covered his production and service parts needs. Both ITE and HeVeAc wanted to renew the agreement for another 5 years, but HeVeAc had expressed a keen desire to market and deliver the entire parts business for the Future Generation Vehicle (FGV) of ITE. Business would be conducted in the short term without a CSA, on a “hand shake” basis, until a new CSA was in place, but the new agreement could take months to finalize. The deadline for the new CSA was September 2006, but a decision had to be made shortly either to switch the parts business for the FGV to HeVeAc or keep it in-house.
ITE- THE COMPANY
International Truck and Engine Corporation’s history dated back to 1831 when Cyrus McCormick invented the mechanical reaper that eventually transformed farming methods in the United States. In the early twentieth century the company, then known as International Harvester, expanded into the automotive area and played a significant role in supplying trucks to the military in World War I. It continued to grow, reaching sales of $7 billion and net income of $427 million in 1979.
International Truck and Engine Corporation (ITE), the operating company of Navistar International Corporation, was among the top five truck manufacturers in North America with revenues of $9.468 billion in 2004. It competed with Ford, General Motors, Mack (Volvo), PACCAR, Freightliner, Sterling and Western Star (Daimler Chrysler), Hino (Toyota), Oshkosh Truck, Federal Signal, and others (
Figure 1). The Truck segment manufactured and distributed a line of diesel-powered class 6, 7, and 8 trucks, and school buses in the common carrier, private carrier, government, service, leasing, construction, energy/petroleum, and student transportation markets in the United States, Canada, Mexico, and other countries. The trucks were marketed and sold under the International® brand. ITE was the North American Market Share Leader in Class 6-8 Trucks and School Buses, with an overall market share of 27% in 2005 (Figures 4 and 5). Buses were sold under the IC® brand. The Engine segment designed and manufactures medium range diesel engines for sale to original equipment manufacturers in the United States and Brazil. ITE was the world’s largest engine manufacturer of mid-range diesel engines (165-325HP) and its integrated product offerings drove medium and bus market leadership. ITE had a market share of nearly 50% in heavy-duty diesel pickup/vans and 49% in Class 6-7 Truck and School Bus segment. It also sold engines for industrial and agricultural applications. ITE also provided customers with proprietary products needed to maintain and support the International truck and the IC bus lines, as
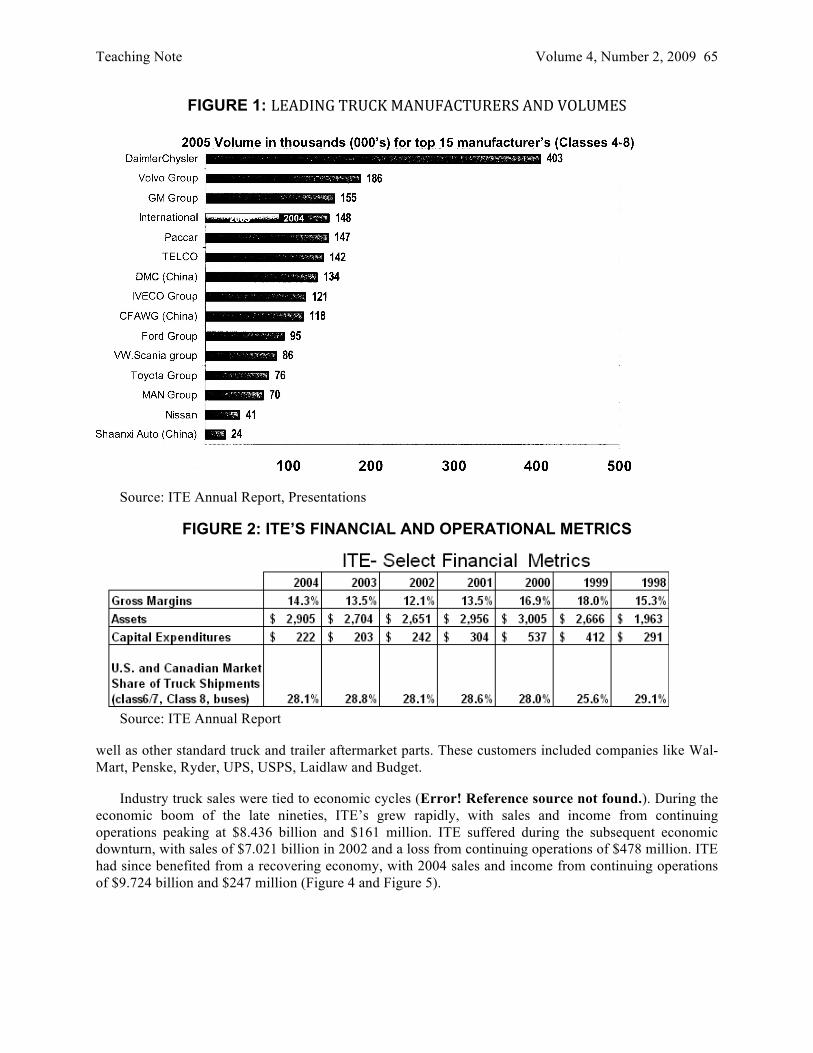
Teaching Note Volume 4, Number 2, 2009 65
FIGURE 1: LEADING TRUCK MANUFACTURERS AND VOLUMES
Source: ITE Annual Report, Presentations
FIGURE 2: ITE’S FINANCIAL AND OPERATIONAL METRICS
Source: ITE Annual Report
well as other standard truck and trailer aftermarket parts. These customers included companies like Wal-Mart, Penske, Ryder, UPS, USPS, Laidlaw and Budget.
Industry truck sales were tied to economic cycles (Error! Reference source not found.). During the economic boom of the late nineties, ITE’s grew rapidly, with sales and income from continuing operations peaking at $8.436 billion and $161 million. ITE suffered during the subsequent economic downturn, with sales of $7.021 billion in 2002 and a loss from continuing operations of $478 million. ITE had since benefited from a recovering economy, with 2004 sales and income from continuing operations of $9.724 billion and $247 million (Figure 4 and Figure 5).

66 Journal of the North American Management Society Gopal & Stasken
FIGURE 3: TRUCK INDUSTRY UNIT SALES IN UNITED STATES AND CANADA*
Source: ITE Annual Report, Presentations
FIGURE 4: ITE REVENUES AND PROFITS
Source: ITE Annual Report
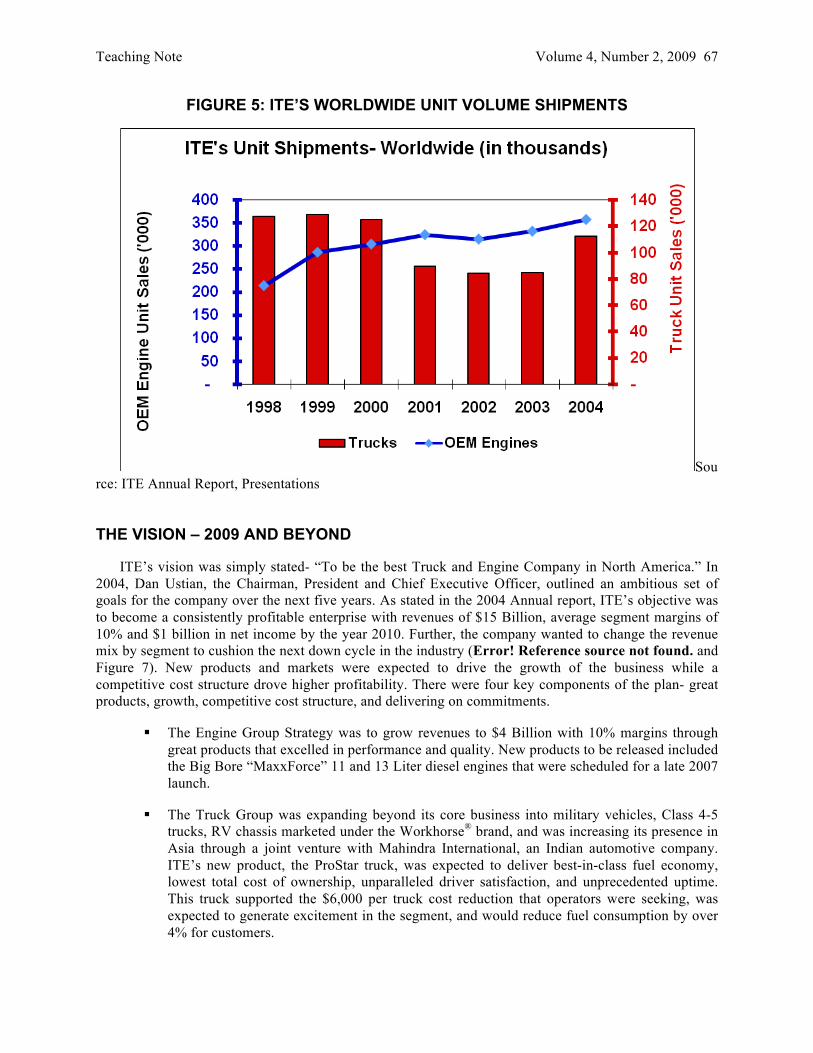
Teaching Note Volume 4, Number 2, 2009 67
FIGURE 5: ITE’S WORLDWIDE UNIT VOLUME SHIPMENTS
Source: ITE Annual Report, Presentations
THE VISION – 2009 AND BEYOND
ITE’s vision was simply stated- “To be the best Truck and Engine Company in North America.” In 2004, Dan Ustian, the Chairman, President and Chief Executive Officer, outlined an ambitious set of goals for the company over the next five years. As stated in the 2004 Annual report, ITE’s objective was to become a consistently profitable enterprise with revenues of $15 Billion, average segment margins of 10% and $1 billion in net income by the year 2010. Further, the company wanted to change the revenue mix by segment to cushion the next down cycle in the industry (Error! Reference source not found. and Figure 7). New products and markets were expected to drive the growth of the business while a competitive cost structure drove higher profitability. There were four key components of the plan- great products, growth, competitive cost structure, and delivering on commitments.
The Engine Group Strategy was to grow revenues to $4 Billion with 10% margins through great products that excelled in performance and quality. New products to be released included the Big Bore “MaxxForce” 11 and 13 Liter diesel engines that were scheduled for a late 2007 launch.
The Truck Group was expanding beyond its core business into military vehicles, Class 4-5 trucks, RV chassis marketed under the Workhorse® brand, and was increasing its presence in Asia through a joint venture with Mahindra International, an Indian automotive company. ITE’s new product, the ProStar truck, was expected to deliver best-in-class fuel economy, lowest total cost of ownership, unparalleled driver satisfaction, and unprecedented uptime. This truck supported the $6,000 per truck cost reduction that operators were seeking, was expected to generate excitement in the segment, and would reduce fuel consumption by over 4% for customers.
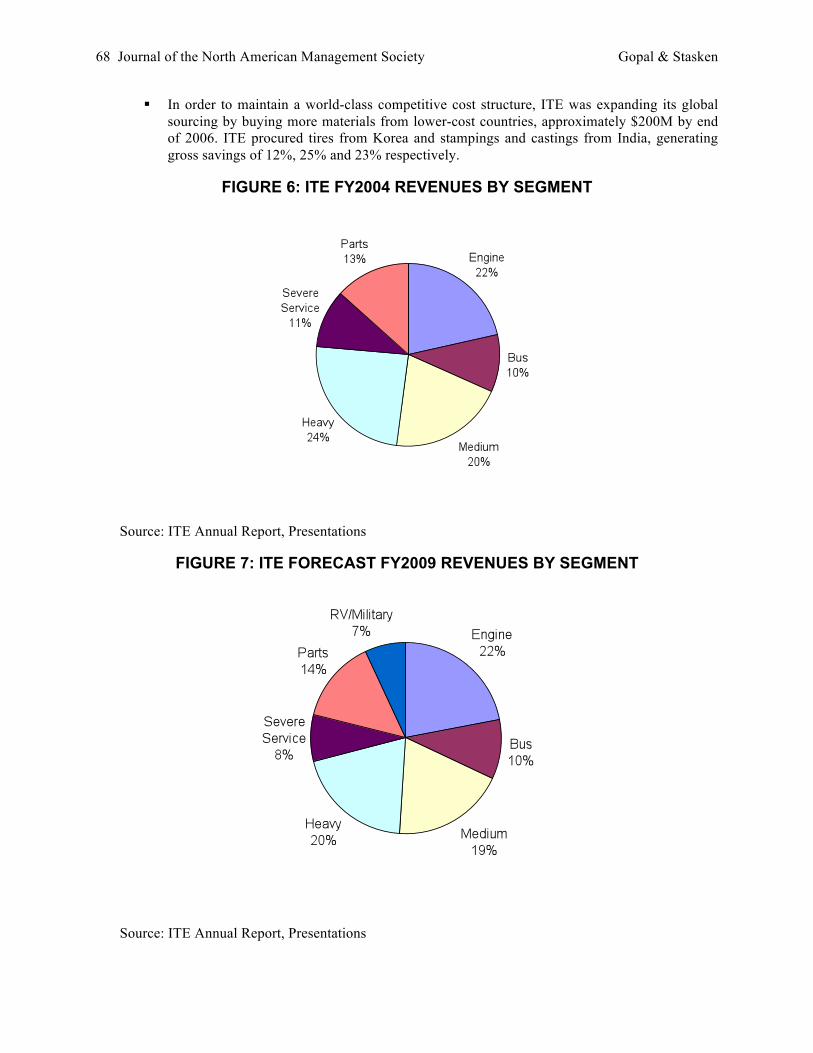
68 Journal of the North American Management Society Gopal & Stasken
In order to maintain a world-class competitive cost structure, ITE was expanding its global sourcing by buying more materials from lower-cost countries, approximately $200M by end of 2006. ITE procured tires from Korea and stampings and castings from India, generating gross savings of 12%, 25% and 23% respectively.
FIGURE 6: ITE FY2004 REVENUES BY SEGMENT
Source: ITE Annual Report, Presentations
FIGURE 7: ITE FORECAST FY2009 REVENUES BY SEGMENT
Source: ITE Annual Report, Presentations

Teaching Note Volume 4, Number 2, 2009 69
ITE’S PURCHASING ORGANIZATION, AND ITS PARTS SUPPLIERS
With cost of goods sold accounting for nearly 85% of the net selling price, parts procurement and supplier management was viewed as a critical success factor by management. The mission of Purchasing was “to be the Industry Leader in Supply Management for improved Profitability of the Extended Enterprise and Customer Life Cycle Value.” Extended Enterprise was defined to include ITE, its supply base, supply partners, service and logistics providers, dealers, truck equipment manufacturers, customers and ITE joint venture alliances. In support of this goal, ITE had created an “International Supplier Network” whose vision was “To be the source of information exchange with the ITE supply chain. With this vision, its mission was “to provide the best communication experience for the International Truck and Engine supply chain by providing timely and secure information and applications to add value to transactions between ITE and the supply chain.” The International Supplier Network had its own portal, and it was trying to shift supplier management to the web as much as possible. In 1998 ITE had initiated COMPASS (COst Management PArtners Sharing Savings), a supplier initiated cost reduction and waste elimination program. The goal of this program was to implement supplier recommended cost reduction ideas to save money for both parties. These ideas ran the gamut from a change in packaging to a change in the design of a part. Between November 1998 and September 2003, 283 suppliers had submitted a total of 2012 ideas, of which 1797 were completed and closed. ITE had also created eSPEC, a web-based system for exchanging electronic request for quotation (RFQ), and drawing information.
ITE’S SERVICE PARTS (AFTERMARKET) ORGANIZATION
Service parts, often referred to as the aftermarket parts, and associated services were receiving increased focus in the industry. Through unparalleled service to its customers, the ITE Service Parts business, henceforth referred to as parts, provided ITE’s dealer and customer base with a world-class parts distribution network. ITE had the largest truck and engine parts organization in United States, Canada and Mexico with nearly 1,000 ITE dealer locations (Table 1). It had five parts distribution centers in the United States, two in Canada, and one in Mexico. ITE’s distribution strategy was aimed at ensuring that its dealers had more capability and were better positioned to effectively serve customers than any of its competitors. Parts distribution centers and other facilities were located strategically to provide quick delivery to dealers. ITE had the most extensive distribution channel in Class 6-8 trucks and mid-range diesel engines. The Parts organization had received a number of accolades and had also introduced a number of innovations. It believed it had a compelling value proposition that added significant value to customers (Error! Reference source not found.).
TABLE 1: ITE DISTRIBUTION NETWORK
Source: ITE Annual Report, Presentations
In 2004 ITE was rated number one in dealer service by J.D. Power and Associates in their Heavy-Duty Truck Customer Satisfaction Study. The heavy truck customers J.D. Power surveyed gave International dealers high marks across virtually all of the service areas measured, including dealer

70 Journal of the North American Management Society Gopal & Stasken
FIGURE 8: ITE TRUCK AND ENGINE PARTS- GROWTH AND VALUE
PROPOSITION*
Source: ITE Annual Report, Presentations
FIGURE 9: KEY COMPANY METRIC: SALES PER EMPLOYEE
Source: ITE Annual Report, Presentations

Teaching Note Volume 4, Number 2, 2009 71
attitude, dealer facility, service quality, service delivery, service initiation, service advisor and price. Since 1998, International was the only OEM to win the heavy service award twice.
In 2001 it launched a critical service components program to the dealer network to support new truck launches, and introduced INTERconnection, an electronic marketing tool that sent customers timely information on ITE, the trucking industry, and parts and service information.
THE BLUE DIAMOND PARTS BUSINESS GREW ITS REVENUES BY 109 PERCENT IN TWO YEARS.
As new truck driver work rules raised the stakes for uptime, ITE’s dealer and customer support was becoming more critical in selling new trucks and engines. The Parts Group played an integral role in ITE’s value proposition of selling trucks with ease of maintenance and support, and was a key factor in maintaining customer perceptions of International’s quality.
ITE’s dealers were also expanding their reach through new parts and service retail locations. ITE’s first “greenfield” parts and service location was opened in November 2003. This enabled the dealers to reach more customers out of more locations, while addressing customers’ number-one priority: vehicle uptime. Future growth was also expected to be driven by new emissions control technology. ITE’s “International Emissions Technology Program” which was designed to reduce emissions on late model trucks through retrofit kits, had reached $9 million in its first year. When used with ultra-low-sulphur diesel fuel, the kits can reduce particulate matter and hydrocarbon emissions by more than 80% (2003 Annual Report).
ITE’s Parts organization was optimistic about the future, based on its strong record of performance. It reached $1 billion in sales for the second consecutive year in 2004, besting its own 2003 momentum and achieving its 713th consecutive year of record sales and profits. It had experienced double-digit growth in revenue and earnings over the past four years. Between 2001 and 2004 parts sales grew at 11.9% (CAGR) with 2004 sales exceeding 1.2 billion (Error! Reference source not found.). The Parts business was a non-cyclical Business with richer margins than the truck and engine sales segments.
SERVICE PARTS SUPPLY CHAIN
The supply chain for service parts often had to meet different needs than those for production. Due to its complexity, some of ITE’s competitors had outsourced the management of their service parts supply chain. Deloitte was managing the aftermarket service parts for Caterpillar, which was a major supplier to ITE. Steven Aschkenase, global leader of service management at Deloitte, stated that “companies that do begin to look at their service parts supply chain from a value perspective start to understand the main components and how improving any one of those components can add to the corporate bottom line.” (catlogistics.com).
ITE maintained five Product Distribution Centers (PDC) in the United States, two in Canada and one in Mexico. ITE had developed a ‘software and hardware based’ program called Diamond Connection™ solutions that enabled dealers to
• Find a specific part (or labor) numbers • Order parts • Scan parts in and out • Print bar code labels • Determine reorder points • This program was designed to enable its dealers, fleet managers, and other customers to • Manage their inventories
72 Journal of the North American Management Society Gopal & Stasken
• Reorder needed parts • Improve shop floor productivity • Improve parts warranty recovery • Produce powerful management reports • Identify extraordinary fleet trends • Schedule preventative maintenance • Provide inventory security • Re-sell parts and labor • Better manage their entire shop
(Source: Diamond Connection collateral, web site)
ITE claimed, as part of its Diamond Connection program’s marketing that “we are not even on your payroll.”
When a dealer or fleet manager or any other customer needed parts, they would either use the Diamond Connection and order parts online, or they would call customer service. Customer service representatives were located in each PDC, and were supported by the service parts organization at headquarters.
ITE’s service parts policy was to stock an item when a specified number of hits (orders) were generated within one year. For the Blue Diamond joint venture with Ford, the policy was to stock all service components for Ford dealers. If a part is not in stock, ITE charged a premium that ranged between 5% and 10% that was expected to cover the tool set up, labor and other overhead of suppliers. Due to lack of visibility, ITE might pay the additional cost to suppliers even when the supplier had the part in stock, especially because a non-stocked (non proprietary) part for ITE might be a high mover for a competitor such as Volvo or Freightliner. Some suppliers were taking advantage of this lack of visibility.
Some of ITE’s customers were still extracting valuable service out of vehicles that were legacies of the eighties. Meeting the service parts needs of these customers posed a special set of challenges. It was not uncommon for the service parts purchasing organization to spend many hours to seek a source of supply for a particular part for these vehicles, sometimes to find that the supplier no longer owned the tooling. ITE could not “manufacture discontinue” or delete the part, since there was demand for three pieces. ITE’s parts purchasing department sometimes located an alternate supplier, but that supplier would require a minimum run that exceeded current need. This meant that ITE might be stuck with holding obsolete parts. At times, the price quoted by the new supplier was higher than the price in ITE’s systems, which meant that to ensure customer satisfaction, ITE had lost money on the sale of the part.
THE NEXT GENERATION VEHICLE (NGV)
In 2000, ITE launched its Next Generation Vehicle (NGV) medium duty truck into the market. ITE had traditionally enjoyed 40% to 50% market share in the medium duty truck sales segment. The expected life cycle for the FGV product was 10 years, with a service parts life cycle of an additional 20 years. NGV trucks were expected to be sold from 2000 to 2015, and parts would have to be made available until the year 2030.
HEVEAC INC.
HeVeAc, Inc. began as a heater manufacturer in 1960 and had grown into a leading designer and supplier of complete operator environment systems and parts for commercial trucks, off-highway machines and specialty vehicles. Still privately owned, it was one of the leading heating, ventilation, and air conditioning (HVAC) suppliers to the demanding commercial truck and engine manufacturers.

Teaching Note Volume 4, Number 2, 2009 73
HeVeAc provided production and service parts and assemblies to ITE for a number of its trucks and engines, including some parts for the NGV. In addition, HeVeAc marketed ITE’s Fleetrite HVAC aftermarket parts program.
SALES OF AFTERMARKET PARTS- THE FLEETRITE PROGRAM
The engines and trucks made by ITE were used in service by its customers for twenty years or longer. During this period ITE’s customers needed replacement parts and assemblies in the geographies where they deployed the vehicles. These customers usually purchased these parts from independent dealers who sold aftermarket products for a wide range of vehicles, often from multiple manufacturers. To meet the needs of the dealers and end-customers ITE designed an aftermarket program called the Fleetrite program. For the HVAC parts, this program consisted of an HVAC catalog listing ITE-proprietary parts (those exclusive to ITE), commodity or universal fit parts, and all-makes parts which included parts for non-ITE vehicles.
Currently, HeVeAc managed the Fleetrite program for ITE. In addition to organizing, printing and distributing the catalogs to ITE’s dealers, it also provided sales and technical training and trade show support and organized sales contests. HeVeAc also funded events organized for dealers like golf outings and annual dealer meetings in Florida Keys. It also provided the first line of technical support for dealers. ITE estimated that the annual costs of these “value added” services exceeded half a million dollars (Error! Reference source not found.).
HeVeAc claimed that they funded these value added services and kept production parts pricing flat (i.e. no increases) by pricing the service parts higher than the same production parts. In other words, a production part price was marked up by a certain amount (either dollars or a percent), which became the service part cost.
Example: Part# Production Price Service Price Difference 123456 $23.28 $38.54 $15.26
Further. HeVeAc absorbed part of the rising cost of steel through this arrangement, rather than passing it on to ITE. This arrangement had been in place for 5 years, ever since HeVeAc took over the HVAC part of the Fleetrite program. This feature had a material impact on ITE, since the price of steel was rising rapidly over the past four years.
SERVICE PARTS PURCHASING AT ITE
Typically, most parts suppliers of ITE presented and held pricing firm for at least one year. The supplier price (ITE’s cost) was then marked up by ITE’s pricing group and published to its dealers as a dealer net (Dnet) cost which was then marked up by the dealers for its customers. The two-tier margin strategy (corporate & dealer) then established the end user’s price, known as the street price.
Like most purchasing groups within an organization, supplier cost and pricing was a sensitive issue at ITE. The goal of purchasing was to obtain cost reductions from suppliers, maintain flat pricing, or minimize cost increases, in decreasing order of preference. A supplier request for a price increase was met with much resistance and had to be justified. Most price increases were either due to higher material costs (steel, aluminum, copper, plastic, etc.) or due to overhead costs (labor, energy, etc.) or were margin driven. Cost increases due to a tangible factor such as material could be more easily justified and tracked. Various commodity indexes (steel, plastic, oil, etc.) were used to check, at least directionally, if material pricing was increasing or decreasing. Overhead costs were much more difficult to track due to the

74 Journal of the North American Management Society Gopal & Stasken
TABLE 2: EXAMPLE OF MARKETING SERVICES PROVIDED BY HEVEAC
Source: ITE Annual Report, Presentations, Company
suppliers’ unwillingness or hesitancy in disclosing their financial data. Negotiating was often the best approach to settle an overhead-caused price increase. Margin increases were the toughest to be approved, and were usually based on the value added by the part and whether the part was a proprietary part with a single manufacturer.
MARKETING OF PARTS
The marketing team’s role at ITE was to establish Dnet pricing, and choose which parts and programs to promote at various times. They were responsible for generating sales revenue, margins, and managing sales promotions. The “value added” services from HeVeAc directly benefited the marketing group by creating awareness of the Fleetrite program and by providing support and incentives to dealers and end customers. Since the “funding” for these services was derived from service parts pricing, the expenses for these programs did not come from the marketing group’s budget.
While it was occasionally proposed that ITE’s marketing group should take the entire program in-house including catalogs, training, financial sales support, etc., ITE’s senior management felt that HeVeAc had better industry knowledge and recognition in the HVAC area, and could execute the programs better than ITE.
OTHER HVAC SUPPLIERS
In addition to HeVeAc, there were other HVAC suppliers that provided production and service parts to ITE. Behr, Sanden, and Modine provided proprietary or exclusive parts, which could only be purchased through an ITE dealer. They however, did not have the “marketing strength” that HeVeAc did, which was why the majority of service parts were sold through the HeVeAc program. Currently, the above-
Teaching Note Volume 4, Number 2, 2009 75
mentioned suppliers provided the majority of FGV parts; HeVeAc provided a smaller number of FGV parts.
HeVeAc’s expressed desire was to obtain the management of all HVAC service parts. This was spelled out in the current comprehensive service agreement, commonly referred to as the CSA. This meant that parts not produced by HeVeAc but were provided by others, would be “switched over” to HeVeAc at some point in the future. HeVeAc wanted to switch over the parts prior to the expiration of the current CSA, but it had not happened yet.
If the switchover took place, HeVeAc would be allowed to purchase parts from the other HVAC parts suppliers via an “authorization to purchase” from the ITE production contract at production part prices. HeVeAc would then mark up the parts and re-sell them to ITE at a premium. This add-on (premium) was to fund the value added elements of the Fleetrite program, and cover revenue losses due to HeVeAc-produced parts dropping off in demand. In other words, as demand volumes for HeVeAc parts fell off, the loss in revenue would be compensated with the influx of new “switchover” parts. Thus ITE would take an immediate cost increase on the switchover parts due to the add-on/premium cost.
Another reason given by HeVeAc for needing the switchover parts was to absorb costs and maintain the current pricing on their parts for ITE. As material and overhead costs increased and demand dropped off for a particular part over the lifecycle, HeVeAc compensated for this margin loss by adding new parts, in this case the “switch over” parts. HeVeAc would also use the premium to help fund their tooling costs, which would help them replicate the parts and drive the part cost down over time.
IN THE HOT SEAT
ITE and HeVeAc were at the end of a 5-year comprehensive service agreement that covered production and service business. Both companies would like to renew the agreement for another 5 years. There was an option to extend the current CSA for another 1 or 2 years, but the date for extension had passed. Business was going to be conducted in the short term without a CSA, in essence on a “hand shake” basis. HeVeAc felt that a new CSA should be in place by the expiration date of the previous agreement, but they realized that a new agreement might take months to finalize. The target date for the new CSA was September 2006. Since the FGV was the predominant medium duty truck in the market place, the impact of the switchover would be significant for many years to come. John was thinking about the long-term financial impact of the decision, especially as the FGV truck and parts life cycle was not known accurately. He was also concerned about how the other suppliers would react to giving their parts to a competitor, with the possibility of ITE re-sourcing those parts from HeVeAc at some point in the future. What, if any, negative implications would this have down the road? What data should he gather from HeVeAc, and what data should he share with them, he wondered. It was clear that if this arrangement with HeVeAc proved successful, the marketing groups for all parts would adopt it, thus revolutionizing the way the service parts organization conducted its business. The service parts business had become a substantial piece of ITE’s revenues and profits, and with it came the challenge of maintaining high growth rates. Dan Ustian had clearly expected the Parts business to account for a higher percentage of a larger revenue pie. Executive management emphasized sales and profits per employee as one of the key metrics and often presented it at investor conferences (
Figure 1). What was the best way to achieve long-term growth while managing the increase in head count? Were there better alternatives to the proposed model? As the morning temperature rose, John turned on the air-conditioning in his truck and thought about how he could apply what he had learnt in his master’s program to this hot problem.
76 Journal of the North American Management Society Gopal & Stasken
TEACHING NOTE
CASE SYNOPSIS
International Truck and Engine Corporation (ITE), the operating company of Navistar International Corporation, was among the top five truck manufacturers in North America. It was nearing the end of a 5-year comprehensive service agreement (CSA) with one of its key suppliers and partners, HeVeAc Inc., that covered HVAC production and service parts business and the marketing programs for the service parts. Both ITE and HeVeAc wanted to renew the agreement for another 5 years, but HeVeAc had expressed a keen desire to market and deliver the entire parts business for the Next Generation Vehicle (NGV) of ITE. The deadline for the new CSA was September 2006, but a decision had to be made shortly on whether to switch the parts business for the NGV to HeVeAc, with major consequences for both ITE and HeVeAc.
POSITION IN COURSES
This case is intended for use in strategic management, supply chain management and related courses, at the undergraduate or early graduate level. In an undergraduate class, it has been used to illustrate combined outsourcing of both products and services to a supplier and securing the domain expertise of a supplier while not limiting a company’s options. In a graduate course the potential for conflict among suppliers is explored, as well as the long-term nature and impact of collaboration with key suppliers. Graduate students can also build analytical frameworks for making decisions in these situations. Organizational structure and the budgeting process and how it can impact decision-making can also be studied.
TEACHING OBJECTIVE
The teaching objectives of the case are to enable students to
1. Understand the role of suppliers in a company’s product development and product support over the product lifecycle,
2. Develop and analyze in-house versus outsourcing options for parts, services and combinations
3. Analyze these options, considering both short and long term impacts
4. Consider organizational structure, and how it could impact the success of each option
5. Develop a critical approach to collaboration with supply chain partners, considering both benefits and costs.
TEACHING APPROACH
The case was written for a class discussion lasting a half hour or more. This case is intended for use in courses on strategic management, supply chain management and related courses dealing with the topics of supplier management and collaboration with supply chain partners. Students are expected to read the case and explore the websites of relevant companies in the industry prior to discussing the case in class.

Teaching Note Volume 4, Number 2, 2009 77
TEACHING PLAN
This case is introduced by observing the trends in supplier-customer relationships. The instructor can initiate a discussion on recent trends in outsourcing and their drivers, especially in the automotive and truck industries. Themes like focusing on core competency and faster time to market should come up as part of the discussion. Some students may observe a movement by manufacturers towards buying entire ‘sub-systems’ and not just ‘piece-parts’ from suppliers. Another observation is that manufacturers are consolidating their supplier base and are increasing collaboration with a smaller group of suppliers.
Students are then asked to put themselves in the shoes of John Hott at ITE. John is a Supply Manager and has to work with his colleagues at ITE and with folks at HeVeAc in coming up with a new CSA. ITE, in the past, had relied on HeVeAc’s expertise for assistance in marketing the HVAC service parts through the distribution channel. However, with the NGV and other new products on the horizon, this appeared to be the time to consider alternatives. This leads to the following questions.
1. What needs should ITE consider in the marketing of HVAC parts for the NGV and other new trucks?
2. What are the trade-offs if ITE agrees to “switch” all service parts to HeVeAc?
Students should discern that there is no guarantee that HeVeAc’s long-term prices for parts from other suppliers would be lower than if ITE bought them from directly from the part makers. Another question is whether quality suffers, if parts makers have to deal with an intermediary like HeVeAc. It appears that HeVeAc wants to lock in a new 5-year CSA and obtain NGV parts to fund its existing marketing program and generate profit. But in the absence of knowledge about its ‘true’ cost structure how can ITE determine if HeVeAc is reaping the majority of the benefits from this new CSA?
1. How does John determine which needs are best fulfilled by HeVeAc? What data should John gather, and how can he analyze the data?
2. One of the touted benefits of the deal is that HeVeAc will maintain flat pricing for its parts. Is this a positive or a negative for ITE?
For planning purposes it is preferable to have predictable costs, especially for parts. However, is it better to have flat pricing (no increases) or to have competitive market pricing where price increases are specific, visible and tied to something substantive like higher material or overheads costs? If HeVeAc pushed a price increase on a declining product ITE could potentially put that part up for competitive analysis. In other words if pricing kept rising on a part, it would be vulnerable to competitive bids.
Students should realize that as new product volume increases, part procurement volume goes up, thus driving economies of scale for suppliers. Therefore, as NGV truck sells in volume, the HVAC parts cost should be lower. They should be higher as the part’s life cycle matures and the demand for the part decreases. However, flat pricing negates the early benefits from suppliers’ volume manufacturing.
ITE, like other manufacturing organizations, has separate purchasing and marketing departments. What organizational conflicts can John anticipate that might come into play in this decision? If it’s decided that HeVeAc is the best at promoting the Fleetrite program, then a big issue is which group within ITE is credited with the benefits and which group is saddled with the costs. If the proposal by HeVeAc is accepted, Purchasing will see an immediate increase in their parts pricing and will be viewed negatively by the group. However, marketing will reap the benefit of increased revenues, decreased expenses, and higher profits. So the question is – should marketing pay for all or a portion of the services from their budget?

78 Journal of the North American Management Society Gopal & Stasken
REFERENCES
Using Service Parts Building Blocks to Improve the Supply Chain. Vision Magazine, Volume 1-2, 2004.
Cohen, M.A., Agrawal, A., and Agrawal, V. Winning in the Aftermarket. Harvard Business Review. May 2006.
Journal of the North American Management Society, Volume 4, Number 2, 2009
Author Note: I would like to thank Dr. John Govern for his ideas in the development of this manuscript. I would also like to thank my graduate assistant, Kelsey Windmuller, for her assistance in reviewing the narcissism studies described in this document. Finally, I would like to thank Dr. Deborah Leather for her review and suggestions on the final manuscript.
Narcissus in the workplace: What Organizations Need to Know
Mark Arvisais Towson University
Any issue that hinders organizational progress is worthy of attention and concern. Researchers have linked the trait of narcissism with leadership and have identified an assortment of senior leader behaviors as representative of narcissism. Some of these behaviors tend to be self-focused but often have the dual benefit of helping the organization reach its objectives. The first question faced by organizations is whether narcissism is a significant component within the personality structure of most senior leaders. If confirmed as such, the institution must then learn how to channel those behaviors toward the benefit of the organization in addition to establishing boundaries that limit any dysfunctional yield. An analysis of the practices and behaviors of 67 CEOs reveals that narcissism is an important characteristic of their personalities. As such, narcissism is something that organizations need to understand since it can expect their senior leaders to rank higher on the narcissistic dimension than most other employees.
NARCISSUS IN THE WORKPLACE: WHAT ORGANIZATIONS NEED TO KNOW
The success and failure of an organization is a direct outcome of a leader’s behavior (Carpenter, Geletkanycz, & Sanders, 2004; Chatterjee & Hambrick, 2007). Further, a leader’s level of intelligence, self-confidence and energy has a positive relationship to organizational outcomes (House & Howell, 1992; Lord, De Vader, & Alliger, 1986). Certain personality structures, such has extraversion, have also been found to bolster the appearance and effectiveness of a leader (Bono & Judge, 2004; Judge & Bono, 2000; Judge, Bono, Ilies, & Gerhardt, 2002). Recently, narcissism has been thought to be included among the personality traits of top leaders (Emmons, 1984; Goveia, 2008; Harrison & Clough, 2006). “The ranks of corporate management undoubtedly consists of a higher percentage of narcissists than we’d find in the broader population” (McFarlin & Sweeney, 2000, p. 29). Researchers have also found a connection between narcissism and leader effectiveness (Blair, Hoffman, & Helland, 2008; M. F. Kets de Vries, 2004). This preliminary investigation explores the degree to which narcissism is prevalent among the CEOs of organizations and how that group compares to the general population.
The concept of narcissism traces to the Greek myth of a boy named Narcissus who was incapable of severing his stare from his own reflection in a pool of water. Narcissism is defined as:
“The essential features are a grandiose sense of self-importance or uniqueness and a preoccupation with fantasies of unlimited success and power; hypersensitivity to criticism; and lack of empathy. Self-esteem, while outwardly appearing high, is actually quite fragile, with a need for constant attention and admiration” (Post, 1993, p. 100).
The leader exposes these characteristics through a number of different behaviors. For example, the narcissistic leader is always on a quest to gain notoriety (Chatterjee & Hambrick, 2007). The satisfaction of this need can place the organization in “danger” because it brings forth the willingness to take greater

80 Journal of the North American Management Society Arvisais
and greater business risks. Risk taking tends to bring consistent attention to the leader, which is an important need for those with the syndrome. In addition, the narcissist not only believes he or she is unique but also protects that image relentlessly. This may lead to a good versus bad (e.g. called splitting) categorization of others, which evolves from a perception of support or lack of support of his or her constructed self-image (Segal, 1997). Anything that violates that image is defended. This is how the fragility, sensitivity and uncaring behaviors evolve.
Many theorists have concluded that narcissism is normal (Kohut, 1986; Kohut & Wolf, 1986; Post, 1993; Ronningstam, 2005) and does not necessarily reach the level of a personality disorder as defined by the DSM IV. “[Narcissism is] frequently encountered in everyday life…[and should be considered] as variants of the normal human personality, with its assets and defects” (Kohut & Wolf, 1986, p. 191). Freud theorized that at birth we are dominated by our narcissism but it is eventually set aside for the purpose of building close relationship with others (Alford, 1988; Gerson, 2000; Kets de Vries & Miller, 1998). However, the loss of one’s narcissism may only be partial (Morf & Rhodewalt, 2001) leaving some with remnants that can influence behavior in life and work (Kets de Vries & Miller, 1998; M. F. Kets de Vries, 2004; Morf & Rhodewalt, 2001). Work can be the means to satisfy some of these residual needs (Ronningstam, 2005). In fact, organizations provide an excellent climate for the growth and development of narcissistic leaders (Pullen & Rhodes, 2008) and narcissists are likely to emerge as leaders particularly when there is a leadership gap in the organization (Brunell et al., 2008). This can happen because in times of trouble or crisis followers look toward someone, anyone, to help resolve the issue. Senior leaders can easily fill this gap because of their increased need for power and achievement (Kirkpatrick & Locke, 1991). Leaders can use their power for personal gain or for the benefit of the institution they lead (Kirkpatrick & Locke, 1991); the narcissist commonly favors the former. Research unambiguously connects these power and achievement motives with narcissism (Chessick, 1993; Elliot & Thrash, 2001; Kernberg, 1986; Klein, 1959; Kohut & Wolf, 1986; McClelland & Burnham, 2003; Morf & Rhodewalt, 2001; Rothstein, 1986). If it is true that narcissism is a relevant trait of senior leaders then organizations need to accept and react.
LEADERSHIP AND NARCISSISM Narcissism and Leadership Theory
Today, full-range leadership (Antonakis, Avolio, & Sivasubramaniam, 2003; Avolio & Bass, 2004) is a prominent and important leadership theory because it represents the complete spectrum of leader behaviors from avoidant behavior to the more active (Kirkbride, 2006; Pounder, 2008). Three clusters of behavior define this construct: Transactional leadership, Transformational leadership and Laissez faire (Kirkbride, 2006). The transactional leader uses an exchange approach with followers by offering benefits (e.g. pay) in return for work productivity while maintaining a close watch on performance for purposes of either preemptive or post task correction (Avolio & Bass, 2004). The transformational leader adheres to a more collaborative posture by combining an interest in individual followers with an inspirational message that exemplifies the notion that together leaders and followers can transcend their current shared mental state and make positive changes in the organization (Avolio & Bass, 2004). Transformational leadership is characterized by positive working relationships in that followers are empowered to move forward with the leader instead of on behalf of the leader (Barling, Christie, & Turner, 2008). That is, the style corresponds to followers’ “[lower] levels of obedience, dependence, and job insecurity” (Barling et al., 2008, p. 858). Laissez faire, on the other hand, is a pattern of avoidance and non-leadership. This leader avoids interactions with followers or is passive—the antithesis of leadership (Pounder, 2008). The research also supports the enhancing effect of transformational on transactional leadership (Bass, 1985; Howell & Avolio, 1993).

Narcissus in the workplace Volume 4, Number 2, 2009 81
Both transactional and transformational leadership have been linked to different degrees of narcissism (Kets de Vries & Miller, 1998). When a leader falls prey to their underlying narcissistic tendencies the observer might see behaviors like a fierce reaction to perceived threats, an appearance of uneasiness, Machiavellianism and a self-focused motivation for power and achievement (Kets de Vries & Miller, 1998; Popper, 2002). It is likely that the transformational and narcissism link moves a leader toward what Barling, Christie and Turner (2008) have defined as pseudo-transformational leadership, meaning that the leader uses an inspirational message to satisfy a personal goal instead of the organization’s. This leader combines the positive characteristics of the transformational leader with counterproductive behaviors (Barling et al., 2008). For example, the trust commonly found within a transformational leader-follower relationship is replaced with “fear” and the leader’s insistence on obedience exacerbates the problem (Barling et al., 2008, p. 854). The narcissistic leader also typically surrounds him or her self with people who will automatically support planned initiatives and any supporting tactics. The narcissistic leader may also ignore opinions and recommendations when making decisions believing instead in his or her superior abilities and intellect. Finally, the narcissistic leader cares very little about others although may feign concern and affection (Kets de Vries & Miller, 1998). Ultimately this leader, unchecked, can be dangerous to followers and the organization he or she leads.
There has been some empirical work investigating the narcissism-charismatic and narcissism-transformational leadership relationships and positive associations have been found (Deluga, 1997; Judge, Lepine, & Rich, 2006; Kets de Vries & Miller, 1998; Padilla, Hogan, & Kaiser, 2007; Popper, 2002; Post, 1993; Rosenthal & Pittinsky, 2006). Charismatic leadership is often associated with the inspirational features of transformational leadership and can use narcissism as a mechanism to respond to the presenting environment (L. Foster, 2007). Narcissism has also been associated with leadership in several other important studies. These studies do not support each other but rather present various relational aspects of narcissism and leadership (Blair et al., 2008; Campbell, Goodie, & Foster, 2004; Kets de Vries & Miller, 1998; Khoo & Burch, 2008; O'Connor, Mumford, Clifton, Gessner, & Connelly, 1995; Rosenthal & Pittinsky, 2006).
Blair (2008) reports how common it is for a leader to be considered toxic to followers and that supervisor ratings of interpersonal performance (i.e. relational skills) are negatively related to narcissism. Campbell et al. (2004) revealed the connection between narcissism and overconfidence (i.e. elevated beyond common levels) as well as risk taking behavior. Kets de Vries and Miller (1998) outlined a connection between the level of narcissism and the most common leader styles (i.e. transactional and transformational) and suggested that all leaders were narcissists. Khoo and Burch (2008) found a negative relationship between all the dimensions of transformational leadership (idealized influence attributed and individualized consideration were significant) and narcissism. O’Connor et al. (1995), in a historiometric study, illuminates a connection between personalized charismatic leadership (i.e. focus on self gain versus organizational gain) and the need for power with narcissism. The need for power may explain why the narcissistic leader seeks senior leadership positions. Rosenthal & Pittinsky (2006) reviews the literature on narcissism concluding the discussion is limited and in its infancy. Their work described the range of negative and positive behaviors associated with narcissistic leaders. Pullen & Rhodes (2008) found that manifestation of narcissism in leaders differs depending on whether the leader exhibits a more feminine (“fragile”, “passive” and “losing their own voice”, p. 12) or masculine (e.g. “aggressiveness”, “boastful,” etc., p. 11) (Pullen & Rhodes, 2008, p. 11) behavioral orientation. The distinctions will likely increase in relevance as the CEO ranks become more gender balanced. Finally, Brunell, et al. (2008) found a connection between narcissism and emergence of a leader in three different studies and they also reported that the craving for power may be a primary connector.

82 Journal of the North American Management Society Arvisais
The Benefits of Narcissistic Leaders
Some narcissistic behaviors and characteristics are positive. For example, narcissistic leaders can be attractive and fun to be around; they often appear “bigger than life” (e.g. grandiosity) (Rosenthal & Pittinsky, 2006). “…An air of supreme confidence and dominance that are the hallmarks of narcissism are in some cases exactly what inspire a group of followers…” (Rosenthal & Pittinsky, 2006, p. 622). They are often considered eloquent (Harrison & Clough, 2006). This pattern helps them secure a leader position and maintain that position (Lubit, 2002). In fact some of the more prominent business leaders, like Jack Welch and Steve Jobs, have been defined as narcissistic and at the same time are considered exceptional leaders (Downs, 1997; Duchon & Burns, 2008; Maccoby, 2000). At the organizational level, The Liz Claiborne organization provides a good case study. It has channeled its narcissistic tendencies toward productivity, and has inculcated a culturally shared understanding that success is not an entitlement (Duchon & Burns, 2008); an attitude of entitlement is common among narcissists. Claiborne steadfastly insists on maintaining reality-based awareness about its strengths and weaknesses as an organization along with requiring accountability from its members’ successes and failures. Simultaneously the culture also values and protects individuality at the same time as promoting the work of teams. Together, these and other characteristics prevented the organization from falling victim to extreme narcissistic tendencies that are apt to blind organizations rather than support performance (Duchon & Burns, 2008).
Leader narcissists also tend to be great visionaries (Blair et al., 2008; Maccoby, 2000) and communicators (Maccoby, 2000), skills that make leaders successful. Further, narcissists use humor (Kohut, 1986) sometimes elevating them to the life of the party (Rosenthal & Pittinsky, 2006). In addition, one can readily observe the narcissist’s self-confidence (Chatterjee & Hambrick, 2007). However, the projection of confidence usually hides a low self-esteem (Post, 1993). Indeed, the “faking” of self-confidence leads to further trouble whereby the narcissistic leader may eventually believe in his or her own message of invulnerability (Campbell et al., 2004); feelings of invulnerability can lead to risky decisions and behaviors (discussed later).
Many studies have also found a linkage with achievement and power needs (Brunell et al., 2008; Chessick, 1993; Kernberg, 1986; Klein, 1959; Kohut & Wolf, 1986; Morf & Rhodewalt, 2001; Paunonen, Lonnqvist, Verkasalo, Leikas, & Nissinen, 2006; Rothstein, 1986). Without these needs coupled with a motivation to lead (Hughes, Ginnett, & Curphy, 2009; Yukl, 2002), few senior leaders would have reached their level of success. Recently researchers have begun to recognize that narcissistic leaders can exhibit positive characteristics (Chatterjee & Hambrick, 2007; Paunonen, Lonnqvist, Verkasalo, Leikas, & Nissinen, 2006; Rosenthal & Pittinsky, 2006) even when acknowledging its negative features which will discussed more fully below. . “Talented narcissistic people possessing intellectual giftedness combined with grandiose fantasies and strong self investment can experience sustained periods of successful academic, professional or creative accomplishments” (Godkin & Allcorn, 2009, p. 46). Leaders with a healthy dose of narcissism also have been identified as capable change advocates (Pullen & Rhodes, 2008). Narcissism is also positively related to individual creativity (Raskin & Hall, 1981) a characteristic important to successful leaders.
The research on narcissism has evolved. While there is no clear quantitative boundary the literature presents a qualitative separation between the good versus bad narcissism. For example, productive narcissism (a restrained narcissist that avoids the extreme characteristics) is thought to be acceptable or healthy and characteristic of many successful leaders (Harrison & Clough, 2006; Maccoby, 2003).

Narcissus in the workplace Volume 4, Number 2, 2009 83
The Negative Aspects of Narcissistic Leaders
Researchers have categorized the narcissist leader as either “destructive” (depreciation of others to elevate self) or “reparative” (elevating followers to gain support and admiration) (Volkan, 1980, pp. 138-139). While narcissism can have many positives, the generalized belief and bias is that all narcissism is negative and will overpower any positive characteristics. At the organizational level, studies continue to focus mostly on the negative consequences of leader narcissism. For example, King III (2007) proposes that leader narcissists will be ineffective at all stages of a developing crisis (e.g. prevention, reaction and recovery) because narcissistic structures get in the way of the necessary behaviors at such a difficult time. Kets de Vries (2004) adds that narcissistic behaviors often emanate out of the individual’s subconscious making it more difficult to self-regulate. Kellerman (2004) describes several cases where leaders were given free reign and how that freedom led to bribery and other atrocities (e.g. Samaranch’s leadership of the International Olympic Commitment). Therefore, when the organization’s “governors” do not pay attention, leaving the leaders unchecked, narcissism can have a greater influence on organizational outcomes. That is, unrestrained narcissism can influence decisions in “strategy, structure and staffing” (Chatterjee & Hambrick, 2007, p. 352), lessen effective communications (Adubato, 2009) and interfere with organizational learning (Godkin & Allcorn, 2009).
Organizations as an entity can also take on the characteristics and neuroticism of their leader (M. Kets de Vries, 2004); that is, the leader can broadcast his or her narcissism into the structures of the business, leading to a diminished capacity to learn and grow (Godkin & Allcorn, 2009). Duchon and Burns (2008) describe how an organization can also become narcissistic (see Duchon & Burns, 2008) and its evolution is often an outcome of the leader’s behavior (e.g. CEO Ken Lay of Enron). Therefore, for obvious reasons, if narcissism is prevalent among senior leaders an understanding of its characteristics is highly recommended (Post, 1993) so that appropriate action can be initiated.
At the individual and group level, narcissists exhibit behaviors that stand out. One observable characteristic is that the narcissist is continually in the hunt for admiration and confirmation (Chatterjee & Hambrick, 2007). This is an obsessive behavior whereby his or her attention is toward the acquisition of praise from those of importance. In addition, the narcissist unwittingly takes action to keep the receipts of praise flowing in his/her direction. This can translate into behavioral aberrations such as a willingness to take high risks as a means to remain the center of attention. After a completion of one accomplishment, the narcissistic leader tends to seek the next bigger, better and more praiseworthy success. At times the behavior can mirror that of an addiction. In American organizations the narcissist fits in very well given the business obsession with quarterly gains (Vazire & Funder, 2006). Often this focus comes at the expense of long-term organizational needs. He or she can also push followers to the brink leaving behind burned out staff-members (Rosenthal & Pittinsky, 2006). One behavior that has vast implications is the concept of splitting. Splitting, a theory developed by Melanie Klein, is the tendency to define everyone as part of an in-group (good) versus that of an out-group (bad) (Segal, 1997), which is sometimes explicated as “you are either for me or against me”. The narcissist tends to shun those in the out-group and magnetically draws in those from the in-group. There is a link between this concept and Leader Member Exchange Theory (LMX). LMX suggests the lower quality relationship between the leader and follower in the out-group may create an incentive for the worker to leave the organization (Bhal & Gulati, 2008; Gerstner & Day, 1997; Tse & Lam, 2008) suggesting a negative relationship between retention and leader narcissism. Splitting also can create the conditions for the Abilene Paradox, whereby out-group followers hold back from expressing their views and adopt positions that maintain unit harmony (Harvey, 1988). Restrictive environments like this also squelch follower creativity and promote compliance behaviors over that of commitment, resulting in a reduction of citizenship behaviors (e.g. willingness to go beyond the minimal requirements of a position) (Sun, Aryee, & Law, 2007). .
84 Journal of the North American Management Society Arvisais
The narcissistic leader will also tend to discount feedback that challenges his or her ordered system of beliefs (Vazire & Funder, 2006). This is why an organization must deliberately erect boundaries to channel these behaviors. Even when fully accountable for events the narcissistic leader is a master at deflecting blame (Rosenthal & Pittinsky, 2006; Vazire & Funder, 2006). Further, the narcissist’s behavior sometimes has interesting nuances in that the narcissist seeks relationships while simultaneously maintains arms length distance (Bacal & Newman, 1990). The main reason he or she wants relationships is to secure the admiration of others. Contrary to what is seen on the surface as a friendly, engaging and optimistic leader, he or she actually may have an underlying icy and distant demeanor (Rosenthal & Pittinsky, 2006).
Finally, as articulated clearly by Kellerman (2004) bad leadership behavior is never conducted in a vacuum. Instead, followers also have a say in their willingness to follow (Hollander, 1997). The narcissist often draws followers into their web. Kohut & Wolf (1986) describe the concept of mirror-hungry personalities and ideal-hungry personalities with the follower and leader looking to the other for support and admiration. The symbiotic leader-follower relationship becomes a crutch for the narcissistic leader and its strength ebbs and flows with the level of admiration and accolades received (Chatterjee & Hambrick, 2007; Kohut & Wolf, 1986). Blair et al.’s (2008) results suggest that followers seem to buy-in to their narcissistic leader’s drama. For example, Enron’s employees took on the belief system of their leaders (Duchon & Burns, 2008).
To summarize, narcissistic leaders have bad and good qualities. The organization and its constituents are drawn to the narcissistic leader because of the potential performance upside (Chatterjee & Hambrick, 2007). However, the negative characteristics can derail the leader, the organization and its followers (Maccoby, 2000) if not restrained in some way. The question is how prevalent is this personality feature among senior leaders? As will be discussed below more fully and is the central theme of this paper, the narcissism trait is prevalent among senior organizational leaders and thus organizational governance must include some kind of preemptive action. That is, if the premise is accurate it places narcissism among a variety of issues that organizational boards and stockholders need to monitor and manage.
LINKING NARCISSISM TO CEOS
Few investigations have looked directly at CEOs and their narcissistic traits (Chatterjee & Hambrick, 2007). While much has been written about narcissism among senior leaders no studies that I am aware of have actually confirmed its prevalence or compared how CEO leaders rank within the standard population. One likely reason is access. Organizations and their membership naturally resist being measured for narcissism. In addition, it is difficult to look across a large population of subjects. Thus, this preliminary investigation utilized an approach recommended by Bass, Avolio & Goodheim (1987) and studied the leaders behaviors, actions and characteristics through written biographical accounts. The method is called historiometry and was popularized by Woods in 1909 (Simonton, 1990). Historiometry is a quantitative analysis of information contained in written records (Simonton, 1986) and is designed to understand macro level phenomena. This investigation looks across a sample of leaders to determine overall levels of narcissism in the group as a whole (macro) and does not focus on a specific leader (micro). The approach asks rater participants to read written biographical accounts and then answer questions about the subject. The method has been used across an assortment of study topics including research on achievement, personality, motivation, politics and experiments (Simonton, 1986). Bass, Avolio and Goodheim (1987) studied the historiometric method and found it to be a reliable and

Narcissus in the workplace Volume 4, Number 2, 2009 85
valid way to investigate leadership; they also confirmed the use of an undergraduate student population as raters.
In the present investigation 283 graduate and undergraduate students read 67 behavioral profiles of corporate CEOs. The students did not know the identity of the leaders, the objectives of the investigation, or that a narcissism scale was being used. The student raters simply read the profiles and then answered survey questions based on the information contained in the written account. Five to nine questionnaires, from different raters, were completed for each leader. The goal was to obtain at least three questionnaires for each leader to enable the calculation of interrater reliability statistics. Beyond obtaining the three, I collected as many as questionnaires as possible for each leader. The leader profiles were created from articles published in three well-known national business publications. As is standard in this type of investigation the profiles approximated 600 to 800 (Bass et al., 1987; Deluga, 1997, 2001) words and all verbatim statements (e.g. ‘Tough, tireless, coolly rational’ ‘ability to relax people’) describing a leader’s behavior, actions and characteristics were extracted to form the profile. The statements were not edited other than to remove identifying information or information about the business being managed. Appendix A contains a sample profile.
Each of the 67 CEOs included in the study was in the senior position within 59 organizations. Four of the leader subjects were women. The leader group approximated 41% (67 out of approximately 160) of all leaders who led the 59 organizations from 3/1/1986 to 3/1/2006.
MEASURE
The measure for narcissism was the Narcissistic Personality Inventory (NPI). The NPI is a 40-item, forced choice instrument developed by Raskin and Hall in 1979, and validated by the authors and independent researchers (Deluga, 1997; Raskin & Terry, 1988). Raskin & Terry (1988) confirmed seven dimensions of narcissism with the NPI and its use in measuring narcissism among non-clinical or healthy populations (Raskin & Terry, 1988, pp., p. 894): (1) Authority (8 items) (“I see myself as a good leader”), (2) Self-Sufficiency (6 items) (“I rarely depend on anyone else to get things done”), (3) Superiority (5 items) (“I am an extraordinary person”), (4) Exhibitionism (7 items) (“I am apt to show off, if I get a chance”), (5) Exploitativeness (5 items) (“I find it easy to manipulate people”), (6) Vanity (3 items) (“I like to look at my body”) and (7) Entitlement (6 items) (“I will never be satisfied until I get all that I deserve”). The instrument was adjusted from a self-report to an observer report format. Two pilot studies, which followed the same approach as the primary study, confirmed there was no statistical difference between the different questionnaires. The scores of the different scales were aggregated for a total narcissism score. The pilot studies also compared graduate and undergraduate responses and found no statistical difference between the groups confirming Bass et al.’s findings (Bass et al., 1987) that undergraduates are viable raters.
RESULTS
Using methods informed by Shrout and Fleiss (1979) the rater reliability, ICC (1, k), was assessed for the NPI instrument. The ICC calculation for the NPI was .853 well above the .70 recommended benchmark. Table 1 details the results.

86 Journal of the North American Management Society Arvisais
TABLE I MEAN, STANDARD DEVIATION AND RATER RELIABILITY
Variable # Items N Mean Score Range
Std Dev
α ICC
Narcissism (NPI) 40 505 questionnaires
67 CEOs
23.62 2 - 40 9.56 .92 .853
The investigation obtained 505 questionnaires on 67 CEOs based on the profiles. The results showed an NPI mean score of 23.62, SD 9.56, and Cronbach’s alpha of .92.
Levels of Narcissism
The resulting scores reveal that overall the 67 CEO leaders have high levels of narcissism. However, the literature does not identify a quantitative benchmark score as a higher level of narcissism versus a lower level. Without this cutoff other comparisons are necessary to make the attribution.
The overall premise and concern of this paper is that higher levels of narcissism exist in the upper ranks of organizations and therefore it is important for the stakeholders in organizations to understand and react to the affliction. To provide some guidance as to whether this is an accurate assessment I compared this study’s results to that of other studies. First, I looked at studies that used a more general population as participants, which I believe offers a good comparison to the CEO group for this specific investigation. Then I looked at several studies that might be considered benchmark or normative, however, these studies exclusively used college students for participants.
I began with a review of 198 studies on narcissism that were conducted from 1968 to 2008. I eliminated 164 studies that did not use the NPI, use the same 40-item scale, include the mean scores or provide accessible information. I then eliminated 16 studies that used undergraduate college students as participants because the benchmark and normative studies described later used a large college student population. I then aggregated the results of the remaining 18 studies. The mean NPI scores ranged from 10.69 to 28.12. Only one study exceeded the CEO group’s NPI score of 23.62. This study (M = 28.12) investigated weightlifters and their steroid use and the sample size was relatively small (n = 36).
The weighted mean NPI score for the above 18 studies combined was 15.3 from 9673 participants, which is lower than the 23.62 mean from the present CEO group. The comparative studies used participants that included celebrities, different residential communities, parents, juvenile offenders, and sportsmen. No comparative study appeared to use CEO leaders as subjects but there is the possibility that some participants were senior leaders. One study had 3445 participants ranging in ages from 8 to 83. The study contained participants from around the world although most were from the U.S. This study found a mean NPI score of 15.2, SD 6.7 (J. D. Foster, Campbell, & Twenge, 2003). This study revealed that narcissism tends to be higher among the young population (< age 15, M ~ 18) with the lowest level at the ages of 50 – 54 (M ~ 11). Those above 59 had a mean score of ~ 12.5. Another study seems to offer the best comparison to the CEO group (J. Foster, D. & Campbell, 2007). The reasons are as follows: The study (1) contained the largest participant group reviewed, (2) participants were from across the general population (some students may have been included) among a wide age group (17 – 70), and (3) it is a recent study. One negative to using it as a comparison group was that its participant group was 75% female (male and female scores were not reported) which could skew the results. This study included
Narcissus in the workplace Volume 4, Number 2, 2009 87
3895 participants. It revealed a mean NPI score of 15.63, SD of 6.77. A statistical test confirmed this group was statistically different (lower) than the CEO group in the present investigation (t = 23.64, p < .05, d.f. 4398). To summarize, these studies from the general population in comparison to the CEO group suggest that CEOs are higher in narcissism.
In addition, to the previous studies described I looked at three additional studies that might be considered benchmark or normative. The first was the Raskin and Terry (1988) analysis conducted on the NPI instrument. This study validated the 40-item instrument using a principal components analysis. They looked at 1018 college students finding a mean NPI score of 15.55 (SD = 6.66). A more recent study looking at 10,491 college students over a period from 1996 and 2002 to 2007, found a mean score of 15.23 (SD not reported) (Trzesniewski, Donnellan, & Robins, 2008). Finally, a meta-analysis looked at a change in the Narcissistic Personality Inventory scores of 16,475 U.S. college students from studies conducted between 1979 and 2006 (Twenge, Konrath, Foster, Campbell, & Bushman, 2008). Over that time period, the mean scores increased from 15.06 to 17.29 with an averaged SD of 6.86. No single study exceeded a mean score of 21.54. Statistically this latter group (M = 17.29) was significantly different (lower) than the current CEO group (t = 20.145, p < .05, d.f. 16,978)
Based on these results, there is evidence that overall the 67 CEOs investigated demonstrated a higher level of narcissism than is commonly found among different participant groups in the general population. If this pattern holds true for the population of senior organizational leaders and CEOs then organizations need to be aware.
LIMITATIONS
Since this preliminary review was not a randomized sample, it cannot be generalized to a larger population. While Historiometry is a valid method to investigate leaders (see Bass, Avolio and Goodheim, 1987) the data is still gathered through written accounts of their actions and behaviors, (secondary sources) which may confound the results. Some might challenge this approach as more of a measure of implicit leadership theory. That idea might have merit because the raters could have an implicit expectation regarding the behaviors of a CEO group (Offermann, Kennedy Jr., & Wirtz, 1994) and their level of narcissism. One argument against that premise is that the raters were not aware they were rating narcissism. There are also outside resources that confirmed what was found. For example, Jack Welch was found to be higher on the narcissism scale (Arvisais, 2007) and several outside resources have identified him as a narcissist (Maccoby, 2000). In addition, the NPI scores for the CEO group ranged from 2 – 40 indicating that the raters were able to distinguish and separate the recounted behaviors from one leader to another. Nevertheless, more investigation is needed.
Another limitation could be the bias towards describing narcissism in more masculine terms (Pullen & Rhodes, 2008). The NPI instrument explores narcissism from a masculine angle favoring variables like exploitation, superiority and exhibitionism (Raskin & Terry, 1988) instead of the more feminine “servant” or “victim” (Pullen & Rhodes, 2008, p. 22). This could render the ability to detect narcissism more difficult among women or men if their leadership style tended toward a more feminine orientation. Four of the CEOs within the present investigation were women with mean scores falling as low as 10 to as high as 30 (i.e. 10, 19.33, 24.37, 30.20). Interpretations of these numbers are more difficult, since measures are not focused on feminine narcissistic behaviors. This is also something for future research. Finally, the behaviors described in the leader profiles could also be representative of a different pathology and or could be a temperament that appears narcissistic. Future research needs to get a closer look at the degree to which this phenomenon exists.
88 Journal of the North American Management Society Arvisais
The current result supports the claim that narcissism is stronger in a CEO population as compared to the general population and supports Kets de Vries’ (2004) argument that all leaders are highly narcissistic.
CONCLUSION AND IMPLICATIONS FOR HRD
The implication of this finding is very important for organizations. As articulated by Kellerman (2004) when organizations fail to establish controls, leaders can go astray and outcomes can suffer. Rosenthal and Pattinsky (2006) also confirmed that the negative narcissistic characteristics are something to be avoided and can cause lower performance (Campbell et al., 2004). If additional future investigations support this investigation’s premise, then the need to understand narcissism along with its corresponding behaviors is important (Blair et al., 2008; Post, 1993). Ultimately, the endgame for the organization becomes the capturing of the positive behaviors from the narcissistic leader (e.g. achievement motivation, charm, willingness to take acceptable risks (Chatterjee & Hambrick, 2007) whilst protecting against the negative (Downs, 1997).
Knowing that narcissism commonly exists should also lead toward the permanent placement of organizational level policies and procedures that can serve as checks and balances within the structures of the organization. These boundaries can take on many forms including the use of outside directors, separation of the Chairman and CEO positions, committees that are more involved in the day-to-day affairs of the organization and so forth. Even regular leader audits might provide an ongoing stream of feedback that can help check the leader (King III, 2007). Finally, the culture of the organization needs to be examined. Some institutional cultures will not tolerate narcissism (King III, 2007; Lubit, 2002). On the other hand, if the organization is tolerant of this kind of behavior then maybe a cultural change process should be implemented.
At the individual level, keep in mind that narcissism has a stealth component. That is, the narcissistic leader is likely to rise very fast and be very attractive to the organization due to his or her potential for improving performance. Eventually, however, the leader falls from grace (Brunell et al., 2008; Rosenthal & Pittinsky, 2006). The board can assist by establishing a coaching mechanism for senior leaders along with a self-awareness intervention (Blair et al., 2008; M. Kets de Vries, 2004; Rosenthal & Pittinsky, 2006). The board can also install a confidant for the leader (King III, 2007). The confidant can be a sounding board and also guide the leader when it appears behavior will deviate from what is known to be effective. Training on narcissism that offers alternative constructive behaviors (e.g. training on transformational leadership behaviors) is another course of action (Ling, Simsek, Lubatkin, Lyon, & Veiga, 2008). Additionally, narcissists need team training since they often find team settings a struggle (Lubit, 2002).
The composition of narcissism within the personality of the individual is stable, however, specific circumstances, such as a crisis, may draw out one’s latent narcissism. The organization needs to understand what can exacerbate these tendencies and avoid these situations. For example excessively high bonuses symbolize high praise for those in charge and can activate one’s narcissistic leanings.
There is one suggestion that is not recommended and that is attempting to prevent narcissists from being hired in the first place; this is an exercise in futility. The reason is that there is ample theoretical and growing empirical evidence that all leaders exhibit higher-levels of narcissism (Kets de Vries, In Giampetro-Meyer, S.J., Browne, & Kubasek, 1998; Harrison & Clough, 2006) and this investigation supports that premise. The strongly narcissistic individual is also likely to easily pass muster during the

Narcissus in the workplace Volume 4, Number 2, 2009 89
interview process “as a result of their outward confidence, willingness to distort history, and glibness that enables them to convincingly claim accomplishments they do not have” (Lubit, 2002, p. 134). If true then it would be very difficult for the organization to exclude those with the affliction from being hired. This strategy can also prevent the hiring of some very effective leaders (e.g. like Jack Welch). Thus, the key is not in the prevention of hiring a narcissist, but instead to recognize its existence and place barriers against potential negative behaviors so as to prevent any destructiveness.
To summarize, narcissism exists in all of us and senior leaders seem to be higher than those in the general population. As such, organizations must acknowledge its existence and take preemptive action as described earlier.
REFERENCES Adubato, S. (2009). Unchecked Narcissism Creates Poor Office Communication. NJBIZ.
Alford, C. F. (1988). Narcissism. New Haven, CT: Yale University Press.
Antonakis, J., Avolio, B. J., & Sivasubramaniam, N. (2003). Context and Leadership: An Examination of the Nine-Factor full-range Leadership Theory Using the Multifactor Leadership Questionnaire. The Leadership Quarterly, 14, 261 - 295.
Arvisais, M. A. (2007). Narcissism as a Trait of Full-Range Leadership: A Historiometric Investigation.Unpublished manuscript, Ann Harbor.
Avolio, B. J., & Bass, B. M. (2004). Multifactor Leadership Questionnaire (3rd ed.). Menlo Park, CA: Mind Garden, Inc.
Bacal, H. A., & Newman, K. M. (1990). Theories of Object Relations: Bridges to Self-Psychology. New York, New York: Columbia University Press.
Barling, J., Christie, A., & Turner, N. (2008). Pseudo-Transformational Leadership: Towards the Development and Test of a Model [Electronic Version]. Journal of Business Ethics, 81, 851 - 861.
Bass, B. M. (1985). Leadership: Good, Better, Best. Organizational Dynamics, 13(4), 26-40.
Bass, B. M., Avolio, B. J., & Goodheim, L. (1987). Biography and the Assessment of Transformational Leadership at the World-Class Level. Journal of Management, 13(1), 7 - 19.
Bhal, K. T., & Gulati, N. (2008). Predicting Turnover Intentions: Incorporating the Role of Organization and Work-Group Level Variables [Electronic Version]. Global Journal of Flexible Systems Management, 7(3 & 4), 41 - 50.
Blair, C. A., Hoffman, B. J., & Helland, K. R. (2008). Narcissism in Organizations: A Multisource Appraisal Reflects Different Perspectives [Electronic Version]. Human Performance, 21, 254 - 276.
Bono, J. E., & Judge, T. A. (2004). Personality and Transformational and Transactional Leadership: A meta-Analysis. Journal of Applied Psychology, 89(5), 901 - 910.
Brunell, A. B., Gentry, W. A., Campbell, W. K., Hoffman, B. J., Kuhnert, K. W., & DeMarree, K. G. (2008). Leader Emergence: The Case of the Narcissistic Leader [Electronic Version from psp.sagepub.com]. Personality and Social Psychology Bulletin, 34, 1663 - 1676.
Campbell, W. K., Goodie, A. S., & Foster, J. D. (2004). Narcissism, confidence, and risk attitude. Journal of Behavioral Decision Making, 17(4), 297.

90 Journal of the North American Management Society Arvisais
Carpenter, M. A., Geletkanycz, M. A., & Sanders, W. G. (2004). Upper Echelons Research Revisited: Antecedents, Elements, and Consequences of Top Management Team Composition [Electronic Version from Sagepub.com]. Journal of Management, 30(6), 749 - 778.
Chatterjee, A., & Hambrick, D. C. (2007). It's All about Me: Narcissistic Chief Executive Officers and Their Effects on Company Strategy and Performance. Administrative Science Quarterly, 52, 351 - 386.
Chessick, R. (1993). Psychology of the Self and The Treatment of Narcissism. Northvale, NJ: Jason Aronson, Inc.
Deluga, R. J. (1997). Relationship among American Presidential Charismatic Leadership, Narcissism, and Rated Performance. Leadership Quarterly, 8(1), 49 - 65.
Deluga, R. J. (2001). American Presidential Machiavellianism Implications for Charismatic leadership and Rated Performance. Leadership Quarterly, 12, 339 - 363.
Downs, A. (1997). Beyond the Looking Glass: Overcoming the Seductive Culture of Corporate Narcissism: AMACOM.
Duchon, D., & Burns, D. (2008). Organizational Narcissism [Electronic Version from Elsevier]. Organizational Dynamics, 37(4), 354 - 364.
Elliot, A. J., & Thrash, T. M. (2001). Narcissism and motivation. Psychological Inquiry, 12(4), 216-219.
Emmons, R. A. (1984). Factor Analysis and Construct Validity of the Narcissistic Personality Inventory [Electronic Version]. Journal of Personality Assessment, 48(3), 291 - 300.
Foster, J., D., & Campbell, W. K. (2007). Are there such things as "Narcissists" in social psychology? A taxometric analysis of the Narcissistic Personality Inventory [Electronic Version from sciencedirect.com]. Personality & Individual Differences, 43(6), 1321 - 1332.
Foster, J. D., Campbell, W. K., & Twenge, J. M. (2003). Individual Differences in narcissism: Inflated self-views across the lifespan and around the world. Journal of Research in Personality, 37, 469 - 486.
Foster, L. (2007). The Psychology of Prophetic Charisma: New Approaches to Understanding Joseph Smith and the Development of Charismatic Leadership [Electronic Version]. Cultic Studies Review, 6(1), 21 - 40.
Gerson, D. S. (2000). Self-Love In Organizations: A Model of How Others Perceive Narcissistic Behaviors. Paper presented at the Academy of Management, Toronto, Canada.
Gerstner, C. R., & Day, D. V. (1997). Meta-Analytic Review of Leader-Member Exchange Theory: Correlates and Construct Issues. Journal of Applied Psychology, 82(6), 827 - 844.
Giampetro-Meyer, A., S.J., T. B., Browne, M. N., & Kubasek, N. (1998). Do We Really Want More Leaders in Business? Journal of Business Ethics, 17, 1727 - 1736.
Godkin, L., & Allcorn, S. (2009). Institutional narcissism, arrogant organization disorder and interruptions in organizational learning [Electronic Version]. The Learning Organization, 16(1), 40 - 57.
Goveia, T. (2008). Big ego, big office [Electronic Version EBSCOhost]. Canadian Business, 81(21), 24.
Harrison, J. K., & Clough, M. W. (2006). Characteristics of "State of the Art" Leaders: Productive Narcissism Versus Emotional Intelligence and Level 5 Capabilities. [In Press]. The Social Science Journal, 43(2), 287 - 292.
Harvey, J. B. (1988). The Abilene Paradox and Other Meditations on Management. San Francisco, CA: Jossey-Bass Publishers.

Narcissus in the workplace Volume 4, Number 2, 2009 91
Hollander, E. P. (1997). How and Why Active Followers Matter in Leadership. In E. P. Hollander & L. R. Offermann (Eds.), The Balance of Leadership and Followership (pp. 11-28): University of Maryland.
House, R. J., & Howell, J. M. (1992). Personality and Charismatic Leadership. Leadership Quarterly, 3(2), 81 - 108.
Howell, J. M., & Avolio, B. J. (1993). Transformational Leadership, Transactional Leadership, Locus of Control, and Support for Innovation: Key Predictors of Consolidated-Business-Unit Performance. Journal of Applied Psychology, 78(6), 891 - 902.
Hughes, R. L., Ginnett, R. C., & Curphy, G. J. (2009). Leadership: Enhancing the Lessons of Experience (6th ed.). New York, NY: McGraw Hill Irwin.
Judge, T. A., & Bono, J. E. (2000). Five-Factor Model of Personality and Transformational Leadership. Journal of Applied Psychology, 85(5), 751 - 765.
Judge, T. A., Bono, J. E., Ilies, R., & Gerhardt, M. W. (2002). Personality and Leadership: A Qualitative and Quantitative Review [Electronic Version]. Journal of Applied Psychology, 87(4), 765 - 780.
Judge, T. A., Lepine, J. A., & Rich, B. L. (2006). Loving Yourself Abundantly: Relationship of the Narcissistic Personality to Self- and Other Perceptions of Workplace Deviance, Leadership, and Task and Contextual Performance. Journal of Applied Psychology, 91(4), 762 - 776.
Kellerman, B. (2004). Bad Leadership. Boston, Massachusetts: Harvard Business School Press.
Kernberg, O. F. (1986). Factors in the Psychoanalytic Treatment of Narcissistic Personalities. In A. P. Morrison (Ed.), Essential Papers on Narcissism (pp. 213 - 244). New York, New York: New York University Press.
Kets de Vries, M. (2004). Organizations on the Couch: A Clinical Perspective on Organizational Dynamics [Electronic Version from Elsevier]. European Management Journal, 22(2), 183 - 200.
Kets de Vries, M., & Miller, D. (1998). Narcissism and Leadership: An Object Relations Perspective. In R. P. Vecchio (Ed.), Leadership: Understanding the Dynamics of Power and Influence in Organizations (pp. 194 - 214). Notre Dame, IN: Notre Dame Press.
Kets de Vries, M. F. (2004). Organizations on the Couch: A Clinical Perspective on Organizational Dynamics. European Management Journal, 22(2), 183.
Khoo, H. S., & Burch, G. S. J. (2008). The 'dark side' of leadership personality and transformational leadership: An exploratory study. Personality & Individual Differences, 44, 86 - 97.
King III, G. (2007). Narcissism and Effective Crisis Management: A Review of Potential Problems and Pitfalls [Electronic Version]. Journal of Contingencies and Crisis Management, 15(4), 183 - 193.
Kirkbride, P. (2006). Developing transformational leaders: the full range leadership model in action [Electronic Version from ABI/INFORM Global]. Industrial and Commercial Training, 38(1), 23 - 32.
Kirkpatrick, S. A., & Locke, E. A. (1991). Leadership: Do traits matter? Academy of Management Executive, 5(2), 48 - 60.
Klein, M. (1959). Our Adult World and Its Roots in Infancy. Human Relations, 12, 291 - 301.
Kohut, H. (1986). Forms and Transformations of Narcissism. In A. P. Morrison (Ed.), Essential Papers on Narcissism (pp. 61 - 90). New York, New York: New York University Press.
Kohut, H., & Wolf, E. S. (1986). The Disorders of the Self and Their Treatment: An Outline. In A. P. Morrison (Ed.), Essential Papers on Narcissism (pp. 175 - 196). New York, New York: New York University Press.

92 Journal of the North American Management Society Arvisais
Ling, Y., Simsek, Z., Lubatkin, M. H., Lyon, E., & Veiga, J. F. (2008). Transformational Leadership's Role in Promoting Corporate Entrepreneurship: Examining The CEO-TMT Interface. Academy of Management Journal, 51(3), 557 - 576.
Lord, R. G., De Vader, C. L., & Alliger, G. M. (1986). A Meta-Analysis of the Relation between Personality Traits and Leadership Perceptions: An application of Validity Generalization Procedures. Journal of Applied Psychology, 71(3), 402 - 410.
Lubit, R. (2002). The long-term organizational impact of destructively narcissistic managers. Academy of Management Executive, 16(1), 127 - 138.
Maccoby, M. (2000). Narcissistic Leaders: The Incredible Pros, and the inevitable cons. Harvard Business Review, 78(1), 69 - 77.
Maccoby, M. (2003). The Productive Narcissist: The Promise and Peril of Visionary Leadership. New York, NY: Broadway Books.
McClelland, D. C., & Burnham, D. H. (2003). Power is the Great Motivator. Harvard Business Review, 81(1), 117 - 126.
McFarlin, D. B., & Sweeney, P. D. (2000). House of Mirrors: The Untold truth about Narcissistic Leader and How to Survive Them. Dover, NH: Kogan Page U.S.
Morf, C. C., & Rhodewalt, F. (2001). Unraveling the Paradoxes of Narcissism: A Dynamic Self-Regulatory Processing Model. Psychological Inquiry, 12(4), 177 - 196.
O'Connor, J., Mumford, M. D., Clifton, T. C., Gessner, T. L., & Connelly, M. S. (1995). Charismatic leaders and destructiveness: An historiometric study. Leadership Quarterly, 6(4), 529 - 555.
Offermann, L. R., Kennedy Jr., J. K., & Wirtz, P. W. (1994). Implicit Leadership Theories: Content, Structure, and Generalizability. Leadership Quarterly, 5(1), 43 - 58.
Padilla, A., Hogan, R., & Kaiser, R. B. (2007). The toxic triangle: Destructive leaders, susceptible followers, and conducive environments. The Leadership Quarterly, 18, 176 - 194.
Paunonen, S. V., Lonnqvist, J. E., Verkasalo, M., Leikas, S., & Nissinen, V. (2006). Narcissism and Emergent Leadership in Military Cadets. Leadership Quarterly, 17, 475 - 486.
Popper, M. (2002). Narcissism and Attachment Patterns of Personalized and Socialized Charismatic Leaders. Journal of Social and Personal Relationships, 19(6), 797 - 809.
Post, J. M. (1993). Current Concepts of the Narcissistic Personality: Implications for Political Psychology. Political Psychology, 14(1), 99 - 121.
Pounder, J. S. (2008). Full-range Classroom Leadership: Implications for the Cross-organizational and Cross-cultural Applicability of the Transformational-transactional Paradigm [Electronic Version]. Leadership, 4(2), 115 - 135.
Pullen, A., & Rhodes, C. (2008). 'It's All About Me!': Gendered Narcissism and Leaders' Identity Work [Electronic Version from Lea.sagepub.com]. Leadership, 4(1), 5 - 25.
Raskin, R., & Hall, C. S. (1981). The Narcissistic Personality Inventory: Alternative Form Reliability and Further Evidence of Construct Validity [Electronic Version]. Journal of Personality Assessment, 45(2), 159 - 162.
Raskin, R., & Terry, H. (1988). A Principal-Components analysis of the Narcissistic Personality Inventory and further evidence of its Construct Validity. Journal of Personality and Social Psychology, 54(5), 890 - 902.
Narcissus in the workplace Volume 4, Number 2, 2009 93
Ronningstam, E. (2005). Identifying and Understanding the Narcissistic Personality [Electronic Version]. Oxford: Oxford University Press.
Rosenthal, S. A., & Pittinsky, T. L. (2006). Narcissistic Leadership. The Leadership Quarterly, 17, 617 - 633.
Rothstein, A. (1986). The Theory of Narcissism: An Object-Relations Perspective. In A. P. Morrison (Ed.), Essential Papers on Narcissism (pp. 308 - 320). New York, New York: New York University Press.
Segal, M. (1997). Points of Influence: A guide to using personality theory at work (First ed.). San Francisco, California: Jossey-Bass, Inc.
Shrout, P. E., & Fleiss, J. L. (1979). Intraclass Correlations: Uses in Assessing Rater Reliability. Psychological Bulletin, 86(2), 420 - 428.
Simonton, D. K. (1986). Presidential Personality: Biographical Use of the Gough Adjective Check List. Journal of Personality and Social Psychology, 51(1), 149 - 160.
Simonton, D. K. (1990). An Introduction to Historiometry. New Haven, CT: Yale University Press.
Sun, L.-Y., Aryee, S., & Law, K. S. (2007). High-Performance Human Resource Practices, Citizenship Behavior, and Organizational Performance: A Relational Perspective. Academy of Management Journal, 50(3), 558 - 577.
Trzesniewski, K. H., Donnellan, M. B., & Robins, R. W. (2008). Do Today's Young People Really Think They are So Extraordinary? [Electronic Version]. Psychological Science, 19(2), 181 - 188.
Tse, H. H. M., & Lam, W. (2008). Transformational Leadership and Turnover: The Roles of LMX and Organizational Commitment [Electronic Version by EBSCO]. Paper presented at the Academy of Management.
Twenge, J. M., Konrath, S., Foster, J. D., Campbell, W. K., & Bushman, B. J. (2008). Egos Inflating Over Time: A Cross-Temporal Meta-Analysis of the Narcissistic Personality Inventory [Electronic Version Blackwell Publishing]. Journal of Personality, 74(4), 875 - 902.
Vazire, S., & Funder, D. C. (2006). Impulsivity and the Self-Defeating Behavior of Narcissists. Personality and Social Psychology Review, 10(2), 154 - 165.
Volkan, V. D. (1980). Narcissistic personality organization and "reparative" leadership. Int J Group Psychother, 30(2), 131-152.
Yukl, G. (2002). Leadership in Organizations (5th ed.). Upper Saddle River, NJ: Prentice-Hall, Inc.
.

94 Journal of the North American Management Society Arvisais
APPENDIX A - SAMPLE PROFILE USED IN THE INVESTIGATION Leader: Robert 0508A*
‘Robert [is] a Wall Street operator with a long history of minting money in the…business’ ‘Robert seems to have a knack for selling just when markets are at their peak, which has given some buyers severe indigestion.’ ‘Robert is at it again, pulling together another … empire, which-though Robert won't acknowledge that he has an endgame in mind-he'll ultimately look to sell for another big score’. ‘These are Robert's strengths: identifying trends in the…business before others, then gathering and deploying capital to make the strategy work. "Robert is like a Clint Eastwood character in an old Western movie," says….a business associate of Robert. "He rides into town and leaves with all the money and the women. He made a lot of people wealthy, and he made himself even wealthier."’ ‘Visit with Robert for an hour or two in his…office, and you are likely to get a rapid-fire discourse on politics from the 1960s to today, or rock & roll radio, or Thoreau, or education in America, or all of the above.’ ‘You may find him a bit quirky. He loves to party. He's been known to sneak up on people and scare them. And there are a couple of Robert stories that involve nudity.’ ‘"Robert is very exhausting to be with. He has unbounded energy when it comes to business. He can outlast and outtalk anybody." Says a close colleague: "His BlackBerry messages start at 6 A.M. and never stop into the night. I should get [him] a waterproof one for the shower."’ ‘"He's obviously smart, and he doesn't B.S. around."’ ‘What kind of person would grow up to have business dreams like these? On Wall Street they like to say Robert hardly knows failure, but he saw it firsthand growing up….”I suppose of you ere a psychiatrist you could say I wanted to do well, where my father had had a lack of success,” Robert says.’ ‘Robert graduated magna cum laude…in 1969 after becoming immersed in counterculture politics and rock & roll. He set up his own business’ ‘"Robert can sell igloos," says … "Robert can sell anything-it doesn't matter-he has that kind of head."’ ‘Once [he] had a beef with [a] late night [employee]…."The guy didn't have any energy," says Robert…."I thought he was asleep. The [room]…had a glass wall. So in the middle of one night, Robert and I took off all of our clothes and ran back and forth in front of the glass naked. We cured him."’ ‘Robert was known for pushing the envelope. At various points heated negotiations and lawsuits ensued between Robert and [a seller]…who alleged that Robert was trying to shortchange investors.’ ‘To Robert the soft patch was an opportunity to reload.’ ‘"He's a very smart guy, but I don't think you want to be sitting on the other side of the negotiating table from him."’ ‘By then Robert was already toiling away on his next project’ ‘Robert was looking to become the single big fish in this business.’ ‘Several managers…bristled over having to negotiate with such a corporate gorilla.’ ‘Robert insists that cancer hasn't impeded his business or his social life, which can be a bit wild and woolly.’ ‘"He likes to jump out of the bushes or hide in hotel rooms and scare people," says … "He's like a little boy."’ ‘While some might find that a 25th wedding anniversary is best celebrated privately, Robert held his at the Manhattan rock hall Irving Plaza with hundreds of guests.’ ‘Lately Robert has become more guarded, though. And don't even think about asking him what his middle initials…stand for. "I've tried to get him drunk to get him to tell me," says …. "Didn't work." Okay, so come on, Robert what does …stand for? "I could tell you, but I'd have to kill you," he says.’ ‘How big will [it]… become? As big as Robert’s ambitions, perhaps.’ ‘Which suggests that Robert is either very confident in his ability to create more value with these … companies, or believes he can sell them to someone who has even more confidence, or both.’
*Excerpts are direct quotes from different portions of one or more previously published articles in one or more business magazines. All articles are available to the general public. Duplication without permission is prohibited. Contact the study’s author to identify the source (s).
JOURNAL OF THE NORTH AMERICAN MANAGEMENT SOCIETY GUIDELINES
The Journal of the North American Management Society [JNAMS] is the official journal of the North American Management Society [NAMS]. JNAMS is a multidisciplinary, online journal of interest to scholars, professionals, students, and practitioners in a broad range of management thinking. The fields of study encompasses human resources, industrial relations, general management, organizations, ethics, leadership, entrepreneurship, global strategy, nonprofit, and public management. This is not an exclusive list. JNAMS is an inclusive journal publishing peer-reviewed articles from any discipline that addresses management issues. Non-peer-reviewed materials such as essays, research-in-progress, pilot studies, or commentary are also published after review for quality and appropriateness. JNAMS is committed to developing theoretical and practical knowledge about management and welcomes the full and equal participation of scholars and practitioners alike. General Information Submissions should be written in standard American English, following the style outlined in The Publication Manual of the American Psychological Association, 5th Edition. The reference style of all papers should follow APA style, except that no line of the reference should be indented; all lines in the references should be flush left. JNAMS Invites Submissions in the Following Categories Peer-reviewed Articles Full-length manuscripts are sought on research, theory, or reviews of the literature. In human resource management, manuscripts are sought on topics that encompass compensation and benefits, international HR and labor relations, labor and industrial relations, legal issues (EEO, ADA, FLMA, etc.), performance appraisal, collective bargaining, recruitment and selection, safety and health, training and career development, HRM applications, HR new technologies, and teaching HR. Under general management, manuscripts are sought on topics that encompass organizational behavior, managing quality initiatives, organizational theory, organizational change and development, organizational communication and decision making, organizational culture and climate, managing diversity in organizations, organizational management applications, managing organizations, emerging organizational forms, and teaching management. Under ethics and management, manuscripts are solicited that address ethics in management in all forms; ethical decision-making in relation to suppliers, employees, customers, and investors; in ethics and the law; and teaching ethics in the management curriculum. In nonprofit management, works are invited which address areas of volunteer management, fund development management, board and staff selection and training, planning and outcomes assessment, as well as other topics related to the realities and challenges in the management of nonprofit organizations. Under the broad topic of global strategy, manuscripts are invited on the topics of business functions, communications, organizational management, distance learning, human resource management, information management, industrial/organizations psychology, operational management, and business education.

96 Journal of the North American Management Society Guidelines
For the broad topic of entrepreneurship, manuscripts are solicited in the topics of theories and models of entrepreneurship, identifying and developing entrepreneurs, family-owned businesses, small business planning, small business life cycles, innovation and entrepreneurship, corporate entrepreneurship/intrapreneurship, entrepreneurship and economic development, new venture finance, cyberpreneurship, entrepreneurial applications, and teaching entrepreneurship. Leadership manuscripts are invited on the topics of leadership and leading, studies of leaders in resl-life settings, paradigms of leadership, leadership applications and practice, research methods, cross-cultural leadership practices, leadership development, leadership strategy, leadership education and training, leaders as change agents, leadership in different contexts, entrepreneurial leadership, and teaching leadership in the management curriculum. The above-listed topics are not all-inclusive; rather, they are suggestive of the fields of study and instruction from which manuscripts are invited. Case studies in any of the topic areas are also invited. All manuscripts submitted for peer-reviewed publication will be reviewed by at least two anonymous reviewers. Length: No more than twelve (12), single-spaced pages, excluding references and appendices. Non-peer-reviewed Articles These articles include: pilot studies, research-in-progress, studies with a small number of subjects, as well as essays or commentaries that discuss management studies and management-related experiences based on the author’s experience or opinion. All non-peer-reviewed material will be reviewed by the Editorial Board for quality and appropriateness. Such submissions are not guaranteed publication. Length: 3,000 to 5,000 words Letter to the Editor A letter to the editor should be a direct response to a paper that was recently published in JNAMS. The authors of the paper referred to are given a chance to respond to the letter in the same issue in which the letter appears. Letters may be edited for length and style, and are not guaranteed publication. Letters are not peer reviewed. Length: Varies

Guidelines Volume 4, Number 2, 2009 97
Book, Film, or Video Review These submissions include an evaluation of a recent book, film, or video that assesses its value for JNAMS readers. Scholarly books and videos should be sent to the Journal Editor for consideration. Any book, film, or video on a management studies-related topic will be considered. Send inquiries about reviewing to the Journal Editor. Length: 500 to 750 words News and Notes Unsigned short pieces announcing new publications, programs, resources, and events related to the broad field of managment studies will be considered for publication. The submission should be made to the Journal Editor and may not be used in its entirety, but will be used as source material for staff-written items. Length: Varies Calls for Papers Announcements of management-related calls for papers for conferences, journals, symposia, funding, etc., will be published as time and space permit. Such submissions should be sent to the Journal Editor. Length: Varies
Submission Information Authors should a copy of their submission via e-mail, or mail one CD copy, in Microsoft Word or WordPerfect. Authors agree to a copyright transfer that gives JNAMS copyright to the paper once it is published. JNAMS does not consider manuscripts that are simultaneously submitted elsewhere or previously published elsewhere. Contact Information Submissions transmitted by e-mail should be sent to: [email protected]