volume 3 number 11 november 2019 pages 2877–3246
TRANSCRIPT

Sustainable Energy & FuelsInterdisciplinary research for the development of sustainable energy technologiesrsc.li/sustainable-energy
ISSN 2398-4902
COMMUNICATIONPaul R. Shearing et al.Virtual unrolling of spirally-wound lithium-ion cells for correlative degradation studies and predictive fault detection
Volume 3 Number 11 November 2019 Pages 2877–3246

SustainableEnergy & Fuels
COMMUNICATION
Ope
n A
cces
s A
rtic
le. P
ublis
hed
on 1
9 A
ugus
t 201
9. D
ownl
oade
d on
1/8
/202
2 9:
17:4
7 PM
. T
his
artic
le is
lice
nsed
und
er a
Cre
ativ
e C
omm
ons
Attr
ibut
ion
3.0
Unp
orte
d L
icen
ce.
View Article OnlineView Journal | View Issue
Virtual unrolling
aElectrochemical Innovation Lab, Departm
College London, London, WC1E 7JE, UK. E-bThe Faraday Institution, Quad One, B
Innovation Campus, Didcot, OX11 0RA, UKcElectrochemical Diagnostics & Forensics La
University College London, London, WC1E 7
† Electronic supplementary informatiinformation includes specic informatiodetailed information about the cycling pathe tomography. See DOI: 10.1039/c9se00
Cite this: Sustainable Energy Fuels,2019, 3, 2972
Received 12th July 2019Accepted 15th August 2019
DOI: 10.1039/c9se00500e
rsc.li/sustainable-energy
2972 | Sustainable Energy Fuels, 2019,
of spirally-wound lithium-ion cellsfor correlative degradation studies and predictivefault detection†
Matt D. R. Kok, abc James B. Robinson, ac Julia S. Weaving,a Anmol Jnawali,ab
Martin Pham,ac Francesco Iacoviello, a Daniel J. L. Brett abc
and Paul R. Shearing *abc
A spirally-wound LG 18650 MJ1 lithium-ion battery was imaged in 3D
before and after 1061 cycles using X-ray computed tomography. The
battery's capacity had faded to 79% of its initial value and some of that
fade was attributed to delamination in the innermost region of the ‘jelly-
roll’ structure. Amethod for virtually unrolling the jelly-roll and analysing
it in different coordinates is presented. The method allows efficient
comparison of the position and shapeof the electrodes at different times
and highlights imperfections present in the jelly-roll before cycling
which were shown to nucleate the delamination of the electrode.
Introduction
Lithium-ion batteries have become ubiquitous in modern lifedue to their high energy and power densities, relatively longcycle life and portability. This widespread deployment hasgenerated a huge market and increased the need for improvedperformance, longevity and reliability of cells. The cycle life ofa battery is governed by a wide array of factors1,2 including, thetemperatures that cells are exposed to,3 rate of operation4 andthe depth-of-discharge of each cycle.5 There are many varieddegradation mechanisms6 and similarly varied techniques fortracking them including acoustic time-of-ight measurements,7
electrochemical methods,8 and X-ray computed tomography(CT) among others. X-ray CT has been shown to be a powerful,non-destructive technique to investigate batteries with studieshighlighting its efficacy in identifying microstructural evolu-tion9,10 and cell failure.11,12
ent of Chemical Engineering, University
mail: [email protected]
ecquerel Avenue, Harwell Science and
b, Department of Chemical Engineering,
JE, UK
on (ESI) available: Supplementaryn about the cell used in the study,rameters used and information about500e
3, 2972–2976
Using X-ray CT, Waldmann et al.13 identied deformations inspirally-wound cells (which exhibit what is commonly referredto as a ‘jelly-roll’ architecture), of a number of cell chemistriesas a result of high rate cycling. Comparison to cells cycled at lowrates showed substantially larger deformations; similar defor-mations, observed towards the centre of the cell, were observedby Pfrang et al.14 The capacity fade observed in the cells wasascribed to delamination of the cathode in the central region ofthe jelly-roll.
In this work, the structural deformation of the electrodes ofa commercial cell are examined using X-ray CT. Virtual unrollingof the jelly-roll structure provides a radially resolved deformationmap of a battery electrode revealing, for the rst time, that initialdefects in the jelly-roll are nucleation points for electrodedeformation which can be correlated to ageing and ultimatelycell failure. The rapid nature of the X-ray CT scans, coupled withfast analysis, provides a pathway to an in-line quality assuranceprocess, which currently rely on optical assessments15 of theelectrodes prior to assembly, which could have a signicantimpact on safety, durability and recyclability of Li-ion batteries.
Methods & results
The major computational challenge in this study was therigorous extraction of the jelly-roll. The ‘edge’ of the repeatinglayer was chosen to be the boundary between the anode andseparator phase and the cathode as this offered the greatestcontrast. The contrast was enhanced using an adaptive edgeenhancement algorithm consisting of a linear deployment ofa small kernel median lter, an unsharp mask and a Gaussiandifference lter. The Cartesian coordinates of the edge wereextracted using a modied marching cubes algorithm aroundthe mean of the image.16
Once extracted, the 2-dimensional jelly-roll should forma continuous Archimedean spiral, which in cylindrical coordi-nates is:
r ¼ a + bf (1)
This journal is © The Royal Society of Chemistry 2019
Communication Sustainable Energy & Fuels
Ope
n A
cces
s A
rtic
le. P
ublis
hed
on 1
9 A
ugus
t 201
9. D
ownl
oade
d on
1/8
/202
2 9:
17:4
7 PM
. T
his
artic
le is
lice
nsed
und
er a
Cre
ativ
e C
omm
ons
Attr
ibut
ion
3.0
Unp
orte
d L
icen
ce.
View Article Online
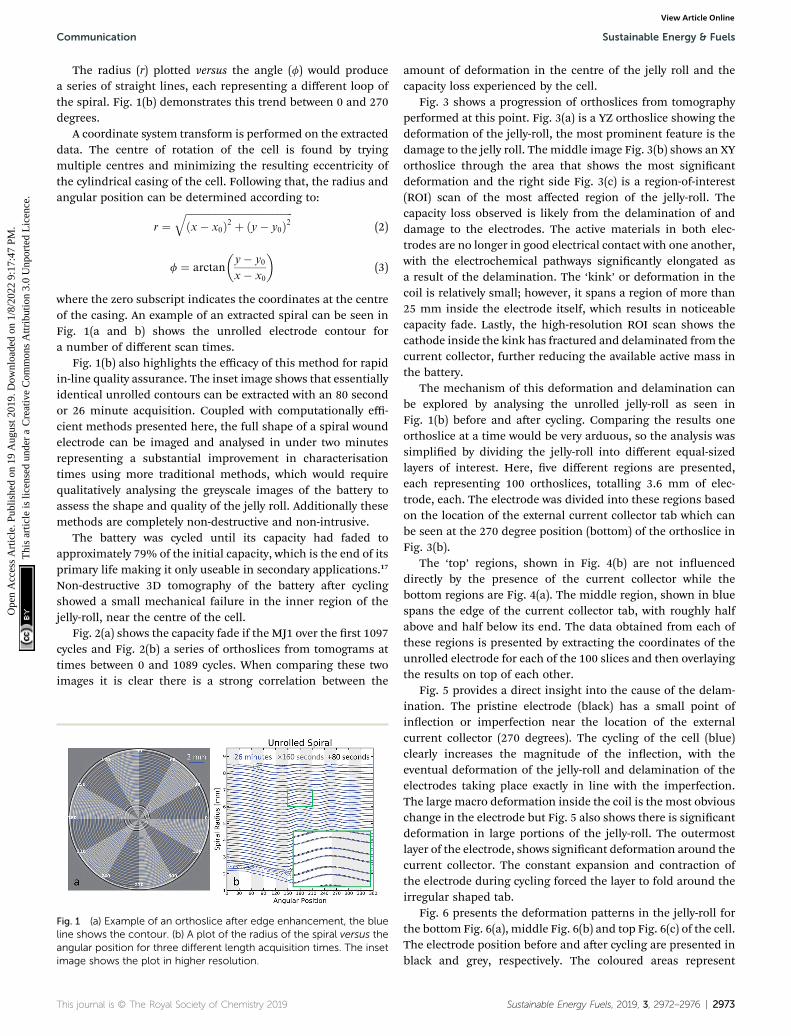
The radius (r) plotted versus the angle (f) would producea series of straight lines, each representing a different loop ofthe spiral. Fig. 1(b) demonstrates this trend between 0 and 270degrees.
A coordinate system transform is performed on the extracteddata. The centre of rotation of the cell is found by tryingmultiple centres and minimizing the resulting eccentricity ofthe cylindrical casing of the cell. Following that, the radius andangular position can be determined according to:
r ¼ffiffiffiffiffiffiffiffiffiffiffiffiffiffiffiffiffiffiffiffiffiffiffiffiffiffiffiffiffiffiffiffiffiffiffiffiffiffiffiffiffiffiffiðx� x0Þ2 þ ðy� y0Þ2
q(2)
f ¼ arctan
�y� y0
x� x0
�(3)
where the zero subscript indicates the coordinates at the centreof the casing. An example of an extracted spiral can be seen inFig. 1(a and b) shows the unrolled electrode contour fora number of different scan times.
Fig. 1(b) also highlights the efficacy of this method for rapidin-line quality assurance. The inset image shows that essentiallyidentical unrolled contours can be extracted with an 80 secondor 26 minute acquisition. Coupled with computationally effi-cient methods presented here, the full shape of a spiral woundelectrode can be imaged and analysed in under two minutesrepresenting a substantial improvement in characterisationtimes using more traditional methods, which would requirequalitatively analysing the greyscale images of the battery toassess the shape and quality of the jelly roll. Additionally thesemethods are completely non-destructive and non-intrusive.
The battery was cycled until its capacity had faded toapproximately 79% of the initial capacity, which is the end of itsprimary life making it only useable in secondary applications.17
Non-destructive 3D tomography of the battery aer cyclingshowed a small mechanical failure in the inner region of thejelly-roll, near the centre of the cell.
Fig. 2(a) shows the capacity fade if the MJ1 over the rst 1097cycles and Fig. 2(b) a series of orthoslices from tomograms attimes between 0 and 1089 cycles. When comparing these twoimages it is clear there is a strong correlation between the
Fig. 1 (a) Example of an orthoslice after edge enhancement, the blueline shows the contour. (b) A plot of the radius of the spiral versus theangular position for three different length acquisition times. The insetimage shows the plot in higher resolution.
This journal is © The Royal Society of Chemistry 2019
amount of deformation in the centre of the jelly roll and thecapacity loss experienced by the cell.
Fig. 3 shows a progression of orthoslices from tomographyperformed at this point. Fig. 3(a) is a YZ orthoslice showing thedeformation of the jelly-roll, the most prominent feature is thedamage to the jelly roll. The middle image Fig. 3(b) shows an XYorthoslice through the area that shows the most signicantdeformation and the right side Fig. 3(c) is a region-of-interest(ROI) scan of the most affected region of the jelly-roll. Thecapacity loss observed is likely from the delamination of anddamage to the electrodes. The active materials in both elec-trodes are no longer in good electrical contact with one another,with the electrochemical pathways signicantly elongated asa result of the delamination. The ‘kink’ or deformation in thecoil is relatively small; however, it spans a region of more than25 mm inside the electrode itself, which results in noticeablecapacity fade. Lastly, the high-resolution ROI scan shows thecathode inside the kink has fractured and delaminated from thecurrent collector, further reducing the available active mass inthe battery.
The mechanism of this deformation and delamination canbe explored by analysing the unrolled jelly-roll as seen inFig. 1(b) before and aer cycling. Comparing the results oneorthoslice at a time would be very arduous, so the analysis wassimplied by dividing the jelly-roll into different equal-sizedlayers of interest. Here, ve different regions are presented,each representing 100 orthoslices, totalling 3.6 mm of elec-trode, each. The electrode was divided into these regions basedon the location of the external current collector tab which canbe seen at the 270 degree position (bottom) of the orthoslice inFig. 3(b).
The ‘top’ regions, shown in Fig. 4(b) are not inuenceddirectly by the presence of the current collector while thebottom regions are Fig. 4(a). The middle region, shown in bluespans the edge of the current collector tab, with roughly halfabove and half below its end. The data obtained from each ofthese regions is presented by extracting the coordinates of theunrolled electrode for each of the 100 slices and then overlayingthe results on top of each other.
Fig. 5 provides a direct insight into the cause of the delam-ination. The pristine electrode (black) has a small point ofinection or imperfection near the location of the externalcurrent collector (270 degrees). The cycling of the cell (blue)clearly increases the magnitude of the inection, with theeventual deformation of the jelly-roll and delamination of theelectrodes taking place exactly in line with the imperfection.The large macro deformation inside the coil is the most obviouschange in the electrode but Fig. 5 also shows there is signicantdeformation in large portions of the jelly-roll. The outermostlayer of the electrode, shows signicant deformation around thecurrent collector. The constant expansion and contraction ofthe electrode during cycling forced the layer to fold around theirregular shaped tab.
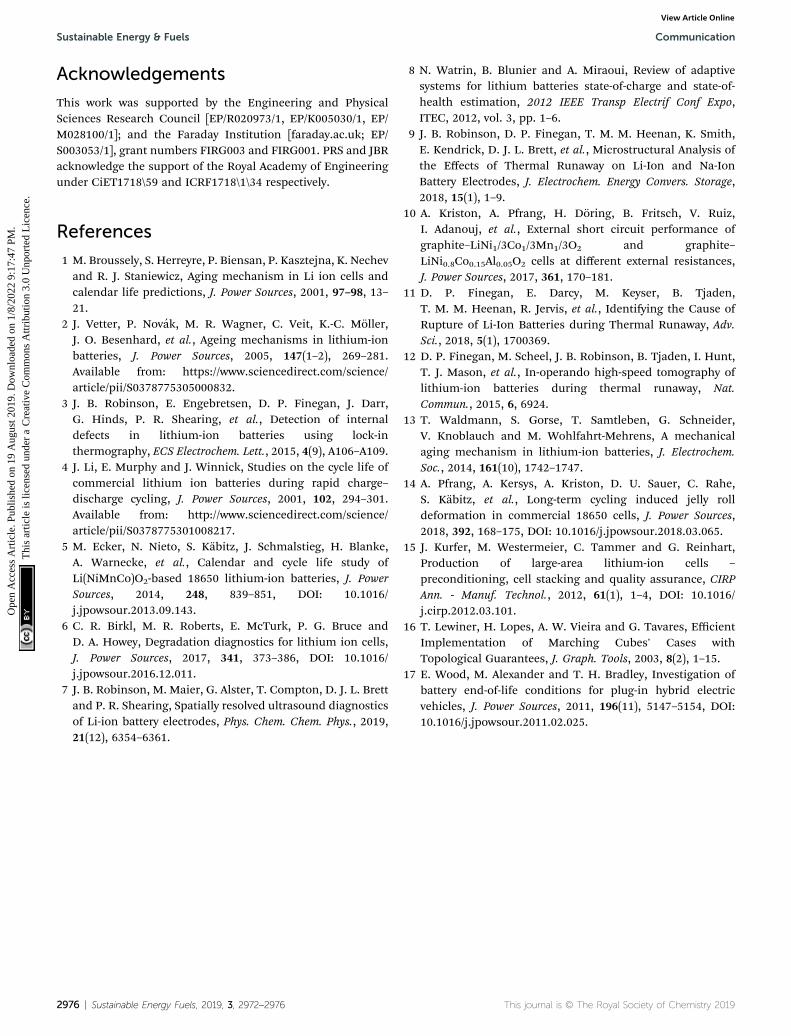
Fig. 6 presents the deformation patterns in the jelly-roll forthe bottom Fig. 6(a), middle Fig. 6(b) and top Fig. 6(c) of the cell.The electrode position before and aer cycling are presented inblack and grey, respectively. The coloured areas represent
Sustainable Energy Fuels, 2019, 3, 2972–2976 | 2973
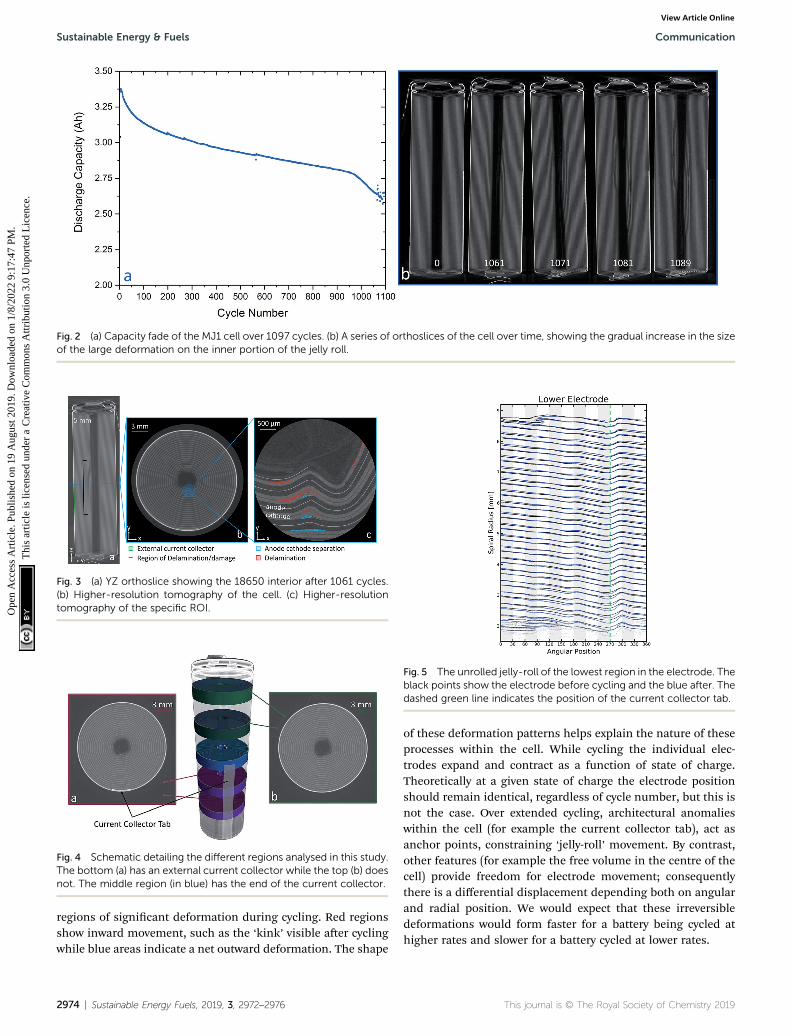
Fig. 2 (a) Capacity fade of the MJ1 cell over 1097 cycles. (b) A series of orthoslices of the cell over time, showing the gradual increase in the sizeof the large deformation on the inner portion of the jelly roll.
Fig. 3 (a) YZ orthoslice showing the 18650 interior after 1061 cycles.(b) Higher-resolution tomography of the cell. (c) Higher-resolutiontomography of the specific ROI.
Fig. 4 Schematic detailing the different regions analysed in this study.The bottom (a) has an external current collector while the top (b) doesnot. The middle region (in blue) has the end of the current collector.
Fig. 5 The unrolled jelly-roll of the lowest region in the electrode. Theblack points show the electrode before cycling and the blue after. Thedashed green line indicates the position of the current collector tab.
Sustainable Energy & Fuels Communication
Ope
n A
cces
s A
rtic
le. P
ublis
hed
on 1
9 A
ugus
t 201
9. D
ownl
oade
d on
1/8
/202
2 9:
17:4
7 PM
. T
his
artic
le is
lice
nsed
und
er a
Cre
ativ
e C
omm
ons
Attr
ibut
ion
3.0
Unp
orte
d L
icen
ce.
View Article Online
regions of signicant deformation during cycling. Red regionsshow inward movement, such as the ‘kink’ visible aer cyclingwhile blue areas indicate a net outward deformation. The shape
2974 | Sustainable Energy Fuels, 2019, 3, 2972–2976
of these deformation patterns helps explain the nature of theseprocesses within the cell. While cycling the individual elec-trodes expand and contract as a function of state of charge.Theoretically at a given state of charge the electrode positionshould remain identical, regardless of cycle number, but this isnot the case. Over extended cycling, architectural anomalieswithin the cell (for example the current collector tab), act asanchor points, constraining ‘jelly-roll’ movement. By contrast,other features (for example the free volume in the centre of thecell) provide freedom for electrode movement; consequentlythere is a differential displacement depending both on angularand radial position. We would expect that these irreversibledeformations would form faster for a battery being cycled athigher rates and slower for a battery cycled at lower rates.
This journal is © The Royal Society of Chemistry 2019
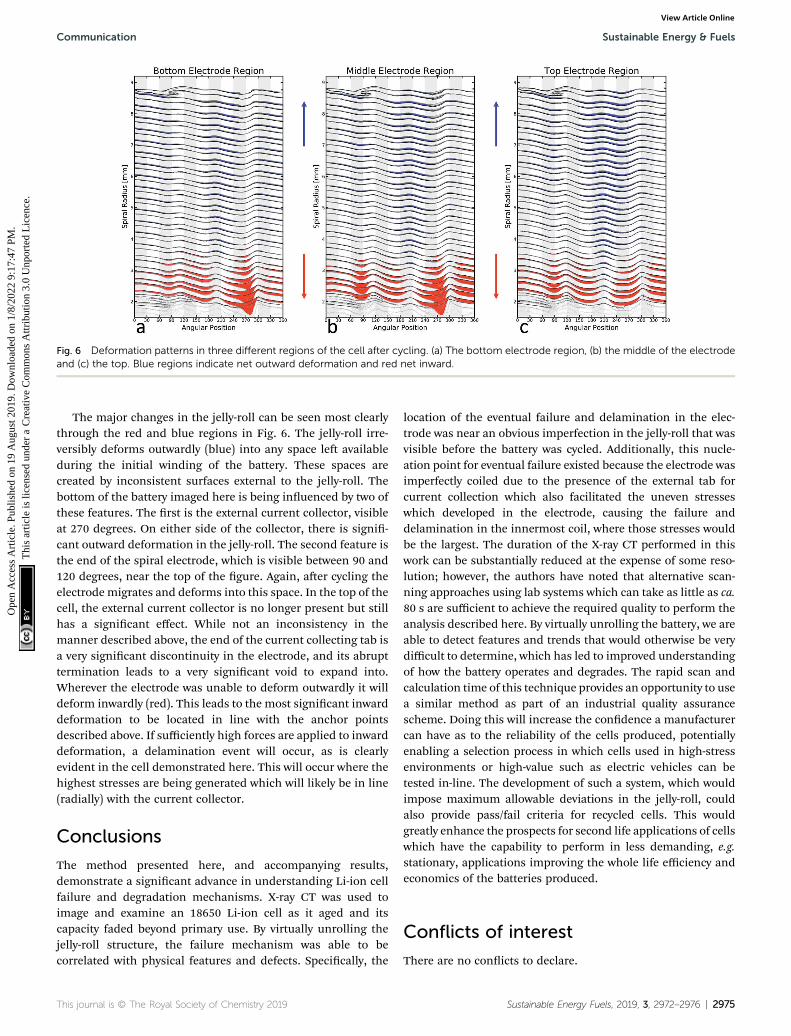
Fig. 6 Deformation patterns in three different regions of the cell after cycling. (a) The bottom electrode region, (b) the middle of the electrodeand (c) the top. Blue regions indicate net outward deformation and red net inward.
Communication Sustainable Energy & Fuels
Ope
n A
cces
s A
rtic
le. P
ublis
hed
on 1
9 A
ugus
t 201
9. D
ownl
oade
d on
1/8
/202
2 9:
17:4
7 PM
. T
his
artic
le is
lice
nsed
und
er a
Cre
ativ
e C
omm
ons
Attr
ibut
ion
3.0
Unp
orte
d L
icen
ce.
View Article Online
The major changes in the jelly-roll can be seen most clearlythrough the red and blue regions in Fig. 6. The jelly-roll irre-versibly deforms outwardly (blue) into any space le availableduring the initial winding of the battery. These spaces arecreated by inconsistent surfaces external to the jelly-roll. Thebottom of the battery imaged here is being inuenced by two ofthese features. The rst is the external current collector, visibleat 270 degrees. On either side of the collector, there is signi-cant outward deformation in the jelly-roll. The second feature isthe end of the spiral electrode, which is visible between 90 and120 degrees, near the top of the gure. Again, aer cycling theelectrode migrates and deforms into this space. In the top of thecell, the external current collector is no longer present but stillhas a signicant effect. While not an inconsistency in themanner described above, the end of the current collecting tab isa very signicant discontinuity in the electrode, and its abrupttermination leads to a very signicant void to expand into.Wherever the electrode was unable to deform outwardly it willdeform inwardly (red). This leads to the most signicant inwarddeformation to be located in line with the anchor pointsdescribed above. If sufficiently high forces are applied to inwarddeformation, a delamination event will occur, as is clearlyevident in the cell demonstrated here. This will occur where thehighest stresses are being generated which will likely be in line(radially) with the current collector.
Conclusions
The method presented here, and accompanying results,demonstrate a signicant advance in understanding Li-ion cellfailure and degradation mechanisms. X-ray CT was used toimage and examine an 18650 Li-ion cell as it aged and itscapacity faded beyond primary use. By virtually unrolling thejelly-roll structure, the failure mechanism was able to becorrelated with physical features and defects. Specically, the
This journal is © The Royal Society of Chemistry 2019
location of the eventual failure and delamination in the elec-trode was near an obvious imperfection in the jelly-roll that wasvisible before the battery was cycled. Additionally, this nucle-ation point for eventual failure existed because the electrode wasimperfectly coiled due to the presence of the external tab forcurrent collection which also facilitated the uneven stresseswhich developed in the electrode, causing the failure anddelamination in the innermost coil, where those stresses wouldbe the largest. The duration of the X-ray CT performed in thiswork can be substantially reduced at the expense of some reso-lution; however, the authors have noted that alternative scan-ning approaches using lab systems which can take as little as ca.80 s are sufficient to achieve the required quality to perform theanalysis described here. By virtually unrolling the battery, we areable to detect features and trends that would otherwise be verydifficult to determine, which has led to improved understandingof how the battery operates and degrades. The rapid scan andcalculation time of this technique provides an opportunity to usea similar method as part of an industrial quality assurancescheme. Doing this will increase the condence a manufacturercan have as to the reliability of the cells produced, potentiallyenabling a selection process in which cells used in high-stressenvironments or high-value such as electric vehicles can betested in-line. The development of such a system, which wouldimpose maximum allowable deviations in the jelly-roll, couldalso provide pass/fail criteria for recycled cells. This wouldgreatly enhance the prospects for second life applications of cellswhich have the capability to perform in less demanding, e.g.stationary, applications improving the whole life efficiency andeconomics of the batteries produced.
Conflicts of interest
There are no conicts to declare.
Sustainable Energy Fuels, 2019, 3, 2972–2976 | 2975
Sustainable Energy & Fuels Communication
Ope
n A
cces
s A
rtic
le. P
ublis
hed
on 1
9 A
ugus
t 201
9. D
ownl
oade
d on
1/8
/202
2 9:
17:4
7 PM
. T
his
artic
le is
lice
nsed
und
er a
Cre
ativ
e C
omm
ons
Attr
ibut
ion
3.0
Unp
orte
d L
icen
ce.
View Article Online
Acknowledgements
This work was supported by the Engineering and PhysicalSciences Research Council [EP/R020973/1, EP/K005030/1, EP/M028100/1]; and the Faraday Institution [faraday.ac.uk; EP/S003053/1], grant numbers FIRG003 and FIRG001. PRS and JBRacknowledge the support of the Royal Academy of Engineeringunder CiET1718\59 and ICRF1718\1\34 respectively.
References
1 M. Broussely, S. Herreyre, P. Biensan, P. Kasztejna, K. Nechevand R. J. Staniewicz, Aging mechanism in Li ion cells andcalendar life predictions, J. Power Sources, 2001, 97–98, 13–21.
2 J. Vetter, P. Novak, M. R. Wagner, C. Veit, K.-C. Moller,J. O. Besenhard, et al., Ageing mechanisms in lithium-ionbatteries, J. Power Sources, 2005, 147(1–2), 269–281.Available from: https://www.sciencedirect.com/science/article/pii/S0378775305000832.
3 J. B. Robinson, E. Engebretsen, D. P. Finegan, J. Darr,G. Hinds, P. R. Shearing, et al., Detection of internaldefects in lithium-ion batteries using lock-inthermography, ECS Electrochem. Lett., 2015, 4(9), A106–A109.
4 J. Li, E. Murphy and J. Winnick, Studies on the cycle life ofcommercial lithium ion batteries during rapid charge–discharge cycling, J. Power Sources, 2001, 102, 294–301.Available from: http://www.sciencedirect.com/science/article/pii/S0378775301008217.
5 M. Ecker, N. Nieto, S. Kabitz, J. Schmalstieg, H. Blanke,A. Warnecke, et al., Calendar and cycle life study ofLi(NiMnCo)O2-based 18650 lithium-ion batteries, J. PowerSources, 2014, 248, 839–851, DOI: 10.1016/j.jpowsour.2013.09.143.
6 C. R. Birkl, M. R. Roberts, E. McTurk, P. G. Bruce andD. A. Howey, Degradation diagnostics for lithium ion cells,J. Power Sources, 2017, 341, 373–386, DOI: 10.1016/j.jpowsour.2016.12.011.
7 J. B. Robinson, M. Maier, G. Alster, T. Compton, D. J. L. Brettand P. R. Shearing, Spatially resolved ultrasound diagnosticsof Li-ion battery electrodes, Phys. Chem. Chem. Phys., 2019,21(12), 6354–6361.
2976 | Sustainable Energy Fuels, 2019, 3, 2972–2976
8 N. Watrin, B. Blunier and A. Miraoui, Review of adaptivesystems for lithium batteries state-of-charge and state-of-health estimation, 2012 IEEE Transp Electrif Conf Expo,ITEC, 2012, vol. 3, pp. 1–6.
9 J. B. Robinson, D. P. Finegan, T. M. M. Heenan, K. Smith,E. Kendrick, D. J. L. Brett, et al., Microstructural Analysis ofthe Effects of Thermal Runaway on Li-Ion and Na-IonBattery Electrodes, J. Electrochem. Energy Convers. Storage,2018, 15(1), 1–9.
10 A. Kriston, A. Pfrang, H. Doring, B. Fritsch, V. Ruiz,I. Adanouj, et al., External short circuit performance ofgraphite–LiNi1/3Co1/3Mn1/3O2 and graphite–LiNi0.8Co0.15Al0.05O2 cells at different external resistances,J. Power Sources, 2017, 361, 170–181.
11 D. P. Finegan, E. Darcy, M. Keyser, B. Tjaden,T. M. M. Heenan, R. Jervis, et al., Identifying the Cause ofRupture of Li-Ion Batteries during Thermal Runaway, Adv.Sci., 2018, 5(1), 1700369.
12 D. P. Finegan, M. Scheel, J. B. Robinson, B. Tjaden, I. Hunt,T. J. Mason, et al., In-operando high-speed tomography oflithium-ion batteries during thermal runaway, Nat.Commun., 2015, 6, 6924.
13 T. Waldmann, S. Gorse, T. Samtleben, G. Schneider,V. Knoblauch and M. Wohlfahrt-Mehrens, A mechanicalaging mechanism in lithium-ion batteries, J. Electrochem.Soc., 2014, 161(10), 1742–1747.
14 A. Pfrang, A. Kersys, A. Kriston, D. U. Sauer, C. Rahe,S. Kabitz, et al., Long-term cycling induced jelly rolldeformation in commercial 18650 cells, J. Power Sources,2018, 392, 168–175, DOI: 10.1016/j.jpowsour.2018.03.065.
15 J. Kurfer, M. Westermeier, C. Tammer and G. Reinhart,Production of large-area lithium-ion cells –
preconditioning, cell stacking and quality assurance, CIRPAnn. - Manuf. Technol., 2012, 61(1), 1–4, DOI: 10.1016/j.cirp.2012.03.101.
16 T. Lewiner, H. Lopes, A. W. Vieira and G. Tavares, EfficientImplementation of Marching Cubes' Cases withTopological Guarantees, J. Graph. Tools, 2003, 8(2), 1–15.
17 E. Wood, M. Alexander and T. H. Bradley, Investigation ofbattery end-of-life conditions for plug-in hybrid electricvehicles, J. Power Sources, 2011, 196(11), 5147–5154, DOI:10.1016/j.jpowsour.2011.02.025.
This journal is © The Royal Society of Chemistry 2019