volume: 201601 issue: 01 november. m. reza shadnam scientific manager canadian scientific research...
TRANSCRIPT

Ednvklsdvndkln
ISBN: 978-0-9957075-0-4
EMPIRICAL RESEARCH PRESS LTD.
Kemp House, 160 City Road, London
United Kingdom
Volume: 01 Issue: 01 November 2016

IJEACS
International Journal of
Engineering and Applied Computer Science
Empirical Research Press Ltd.
London, United Kingdom

ii
© 2016 by the author(s) of each contribution; publisher and licensee
Empirical Research Press Ltd. United Kingdom. This is an open access
article distributed under the terms and conditions of the Creative
Commons by Attribution (CC-BY) license. (http://creativecommons.org/licenses/by/4.0/).
Volume: 01, Issue: 01
ISBN: 978-0-9957075-0-4
www.ijeacs.com

iii
Indexing, Hosting and Advertising

iv
Message
International Journal of Engineering and Applied Computer Science (IJEACS) is
an open access, double-blind peer reviewed international journal monthly
publishing online by Empirical Research Press Ltd. Empirical Research Press is a
research publishing company with name, trademark registered and incorporated in
England and Wales, United Kingdom.
The scope of International Journal of Engineering and Applied Computer Science
is to publish high quality research contributions, latest innovations, advance
development carried out in the field of Engineering, Computer Science and
Technology. The original research, review, case study, survey, new interpretation
and implementation of concepts and theories, recent technological development,
technical reports, empirical discussions are invited to submit for publication.
The major objective of International Journal of Engineering and Applied Computer
Science is to maintain high quality of publications and indexing with world’s
highly accessed and cited research and academic databases. The scope of IJEACS
publications also includes special and interdisciplinary research contributions. We
offer best wishes to all readers, reviewers and contributors of IJEACS.

v
Board Members of IJEACS
Chief Editor
Prof. Bao Yang Professor
Department of Mechanical Engineering
University of Maryland, USA.
Consultant Editor
Prof. Hassan Kazemian Professor
Director of Intelligent Systems Research Centre,
London Metropolitan University, UK.
Associate Editors
Prof. Prasad Yarlagadda Professor
Faculty of Science and Engineering
Queensland University of Technology
Australia.
Prof. Ghassan Beydoun Professor
School of Management, Information Systems &
Leadership, University of Technology Sydney,
Australia.
Prof. Zahid Ali Professor & Director
SSI College of Management & Information
Technology, Punjab Technical University
India.
Dr. Fadi Ghaith Associate Professor
School of Engineering & Physical Sciences
Heriot Watt University, Dubai Campus, UAE.
Dr. Shahanawaj Ahamad Chair, Software Engineering Research
Deputy Director of Quality Assurance &
Development, University of Ha'il
Saudi Arabia.
Dr. Amit Kumar Kohli Associate Professor
Thapar University, Patiala, India.
Dr. Shamimul Qamar Associate Professor
Dept. of Computer Network Engineering
King Khalid University, Saudi Arabia.
Dr. Mieczyslaw Drabowski Assistant Professor & Deputy Dean
Faculty of Electrical & Computer Engineering
Cracow University of Technology, Poland.
Dr. Magdy S. A. Mahmoud Assistant Professor
Faculty of Computers and Informatics
Suez Canal University, Egypt.
Dr. K. S. Senthilkumar Assistant Professor
Department of Computer & IT
St. George University, Grenada, West Indies.
Dr. Hany Elslamony Assistant Professor
Helwan University, EGYPT.
Taimoor Khan, Assistant Professor
National Institute of Technology, Silchar, India.

vi
Dr. G. Suseendran Assistant Professor
Department of Information Technology
School of Computing Sciences
Vels University, India.
Dr. Sugam Sharma Senior Scientist
Iowa State University, USA.
Dr. Xinggang Yan Senior Lecturer
University of Kent, UK.
Dr. M. Reza Shadnam Scientific Manager
Canadian Scientific Research & Experimental
Development Vancouver, Canada.
Dr. Xuefei Guan Scientist
Siemens Corporate Research, New Jersey,
USA.
Dr. Gururaj Revanasiddappa
Lecturer
Department of Computer Science, Gulbarga
University, India.

vii
Content
Sr. Title Page No.
1. The Proposed Cluster and Position Based Fault Tolerant
Multicast Protocol in Ad Hoc Networks.
Mahboobeh Abdoos
1-6
2. Study of Ethical Hacking and Management of Associated
Risks
Mohammed Abdul Bari, Shahanawaj Ahamad
7-11
3. Software Complexity Measurement: A Critical Review
Harmeet Kaur, Gurvinder N. Verma
12-16
4. Program Comprehension and Analysis
Asfa Praveen
17-21
5. Fuzzy Model for Parameterized Sign Language
Sumaira Kausar, Samabia Tehsin, M. Younus Javed
22-30
International Journal of Engineering and Applied Computer Science (IJEACS)
Volume: 01, Issue: 01, November 2016 ISBN: 978-0-9957075-0-4
www.ijeacs.com 1
Abstract—A location service gives the requested location
information to the nodes in the ad hoc networks. It is supposed
that there are different clusters in the different levels. Every
cluster has a cluster head. The clusters can be logical or
physical. The higher level cluster heads have the information of
the tables of lower level cluster heads. The information of tables
of a cluster head is updated periodically by its lower level cluster
heads. The combination of the cluster and position based
routing can be used. In this paper the cluster and position based
location service is represented, that every node can find the
location of its destination node via the location service. Some
nodes are selected as the mirror nodes of a cluster head which
can act as the cluster head after the failing of cluster head. These
nodes have the replicated information of a cluster head. Here a
multicast protocol is proposed that a source node can get the
location information of the destination nodes via the proposed
location service and puts this information into the header of
packets and sends them toward the destination nodes. The
simulation results show that the proposed Cluster and Position
based Multicast protocol (CPMB) has more packets delivery
ratio and packets transfer ratio than the Multicast Ad hoc
On-Demand Distance Vector multicast protocol (MAODV).
Keywords —Ad hoc network; position service; fault tolerant;
cluster; protocol.
I. INTRODUCTION
An ad hoc network consists of some wireless mobile nodes which route the packets without any infrastructure. The ad hoc network is divided to static and dynamic ad hoc networks. In a static ad hoc network, the location of a node does not change. In the dynamic ad hoc networks the nodes are moving like the mobile and vehicle ad hoc networks. The topology of the mobile ad hoc network is changing. There are two kinds of routing, the first one is the topology based routing and the second one is the location based routing. The topology based routing use the information of links of the network to transfer the packets. They are divided to the table-driven and the demand based routing protocols. The table-driven routing protocols consist of the distance-vector protocols and the link-state protocols. The location based routing protocols
eliminate some topology based limitations, by additional information. They need to the location information of nodes in the network. Every node finds its location by GPS.
A source node uses the location service to find the location of a destination node and puts it into the header of the data packets. every node routing decision is based on the location of destination node and the neighbor nodes. The location based routing protocols do not need to create or support the routes. The nodes do not need to the routing tables and the updating packets. There are different location services like the square location service or simple location service. The section 2 surveys the MAODV multicast protocol and the section 3 reviews the cluster based position service and the section 4 represents the proposed location and cluster based fault tolerant location service then the proposed cluster and position based multicast protocol (CPMB) is represented. In continue the simulation results are shown, which show that the proposed multicast protocol has more packet delivery than the AODV. [1], [2], [3], [4], [5], [6]
II. MAODV PROTOCOL
The MAODV is a demand based routing protocol that the necessary routes are discovered. The MAODV has the least control and processing overhead and the multi hop capability and saves the topology dynamically and avoids the loops. Because of the limited resources of an ad hoc network, the MAODV tries to minimize the control overhead by limiting the updating packets. To minimize the processing overhead, the MAODV packets are simple so they need a little computation. MAODV uses the sequential numbers to prevent the loops. In MAODV, every node has a routing table which consists of information of the routes. Every entry of the routing table consists of destination IP address and the sequential number and the number of hops toward the destination node and the next hop toward the destination node and the time to live (TTL) field. When the information of a route is entered in the routing table, the TTL field for destination node, will be set based on the RREQ (route request), RREP (route reply) or the hello packets.
The Proposed Cluster and Position Based Fault
Tolerant Multicast Protocol in Ad Hoc Networks
Mahboobeh Abdoos
Department of Electrical and Computer Engineering
Qom Islamic Azad University, Qom, Iran.

Mahboobeh Abdoos International Journal of Engineering and Applied Computer Science (IJEACS)
Volume: 01, Issue: 01, November 2016 ISBN: 978-0-9957075-0-4
www.ijeacs.com 2
When a node uses a route toward the destination node, the TTL field will be updated. The neighbor hello packets receiver will update the TTL entry of that node. If a route toward a node is not used and any packet is not received through that route, the routing table TTL entry of that node is not updated. The routes which are not used during the time to live (TTL) field of route will be expired. [7], [8], [9], [10], [11], [12]
III. CLUSTER BASED POSITION SERVICE
A. Geographical Forwarding
In geographical transfer, every node finds its location by GPS and sends its location and speed to its neighbors by periodic hello packets. The content of Hello packet is represented in table 1. The geographical transfer uses the two-hop distance-vector protocol. A hello packet consists of a list of neighbor nodes and their locations. Every node has some routing tables which have the information of the one and two hop neighbor nodes which are updated through the hello packets. Every tuple in a routing table consists of the ID and velocity and location and time stamp of neighbors. Every tuple in the routing table is expired after the predefined time and is deleted from table. When a node needs to send the packets toward the destination node and has the ID and location information of a destination node, it uses the location information and sends the packets to its nearest neighbor node, to the destination node and this algorithm is repeated. Here is a big problem that if a node does not know that which neighbor node is nearest to the destination node, the GPRS (the Greedy Perimeter Stateless Routing) can solve the problem. It is a geographical routing protocol which uses the sub graph. (See Table 1) [13], [14], [15], [16], [17], [18]
TABLE 1. THE FIELDS OF A HELLO PACKET
Hello Packet
Source ID Source Location Source Speed
Neighbor list: ID and Location
Forwarding Pointers
IV. THE PROPOSED CLUSTER BASED LOCATION
SERVICE
The combination of the cluster and position based routing can be used. Suppose that there are different clusters in the different levels. The clusters can be logical or physical. An accidental unique ID is assigned to every node by using a strong hash function. Every cluster has a cluster head. The cluster head of the lowest level is selected by voting of the nodes of that cluster and the higher level cluster head is defined by the voting of its lower level cluster heads. Every cluster head has a table which is named the cluster neighbor table (Table 2) that its tuples are the neighbor cluster heads of the same level. This table is updated by the neighbor cluster heads. A cluster head has the ID and location information of its cluster nodes in a table, which is named the cluster member table (Table3). Unless the lowest level, every cluster node has a table, which is named the cluster location table that its entries are ID and location of the lower level cluster nodes. (Table 4)
Every cluster head has the location of its higher cluster head. When a node enters a cluster, it sends a packet to the cluster head of that cluster. This packet consists of ID and velocity and the location of that node and time stamp of sending the packet. When a node leaves a cluster, it sends a packet to the cluster head of that cluster. That packet consists of the ID and current location and velocity and movement direction of that node and the time stamp. Via the location of node and the location of the neighbor clusters, it is understood that to which cluster, the node will go. During the predefined time, the location table entry of that node has a pointer to the new cluster which the node wants to enter and after the predefined time, that entry is expired. (See Fig. 1) (See Table 1, Table 2, Table 3)
4
21
3
11
10
13
Level 3
Level 2
Level 1
Clusterhead
NodeInternal
Node
Gateway
Node
A
B C
E F
G H
9
12
5
.
Figure 1.The Structure of Clusters
TABLE 2- THE CLUSTER NEIGHBOR TABLE
Location Information ID
2318122"'0
11
2317110"'0
11
TABLE 3- THE CLUSTER MEMBER TABLE
Location Information ID
2318122"'0
9
2318130"'0
11
TABLE 4- THE CLUSTER LOCATION TABLE
Location Information ID
2318122"'0
1
1520115"'0
1
Mahboobeh Abdoos International Journal of Engineering and Applied Computer Science (IJEACS)
Volume: 01, Issue: 01, November 2016 ISBN: 978-0-9957075-0-4
www.ijeacs.com 3
231156"'0
3
2318122"'0
4
173947"'0
5
A. Location Request
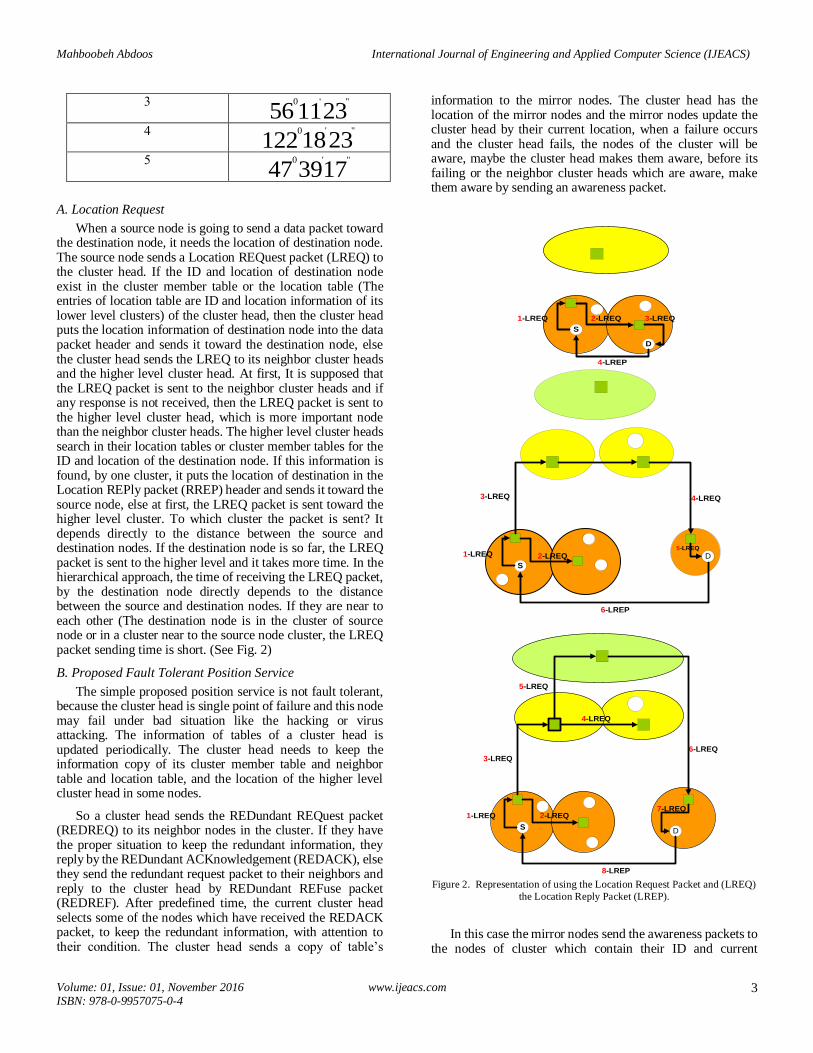
When a source node is going to send a data packet toward the destination node, it needs the location of destination node. The source node sends a Location REQuest packet (LREQ) to the cluster head. If the ID and location of destination node exist in the cluster member table or the location table (The entries of location table are ID and location information of its lower level clusters) of the cluster head, then the cluster head puts the location information of destination node into the data packet header and sends it toward the destination node, else the cluster head sends the LREQ to its neighbor cluster heads and the higher level cluster head. At first, It is supposed that the LREQ packet is sent to the neighbor cluster heads and if any response is not received, then the LREQ packet is sent to the higher level cluster head, which is more important node than the neighbor cluster heads. The higher level cluster heads search in their location tables or cluster member tables for the ID and location of the destination node. If this information is found, by one cluster, it puts the location of destination in the Location REPly packet (RREP) header and sends it toward the source node, else at first, the LREQ packet is sent toward the higher level cluster. To which cluster the packet is sent? It depends directly to the distance between the source and destination nodes. If the destination node is so far, the LREQ packet is sent to the higher level and it takes more time. In the hierarchical approach, the time of receiving the LREQ packet, by the destination node directly depends to the distance between the source and destination nodes. If they are near to each other (The destination node is in the cluster of source node or in a cluster near to the source node cluster, the LREQ packet sending time is short. (See Fig. 2)
B. Proposed Fault Tolerant Position Service
The simple proposed position service is not fault tolerant, because the cluster head is single point of failure and this node may fail under bad situation like the hacking or virus attacking. The information of tables of a cluster head is updated periodically. The cluster head needs to keep the information copy of its cluster member table and neighbor table and location table, and the location of the higher level cluster head in some nodes.
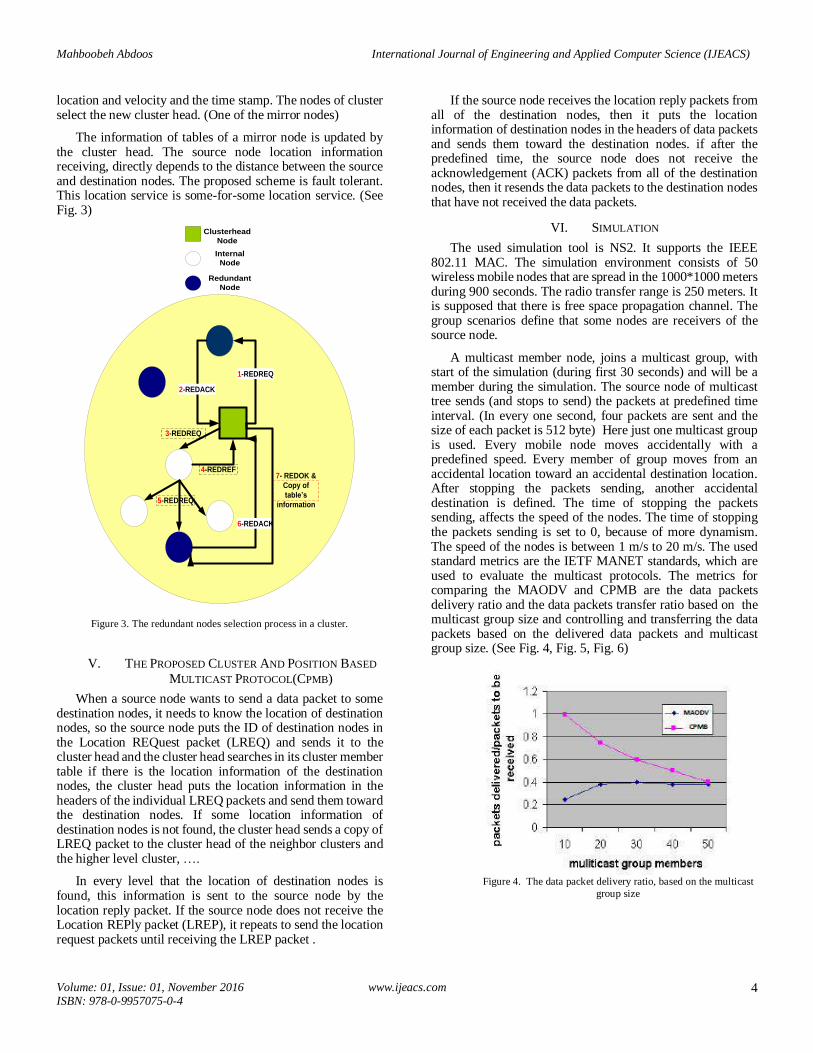
So a cluster head sends the REDundant REQuest packet (REDREQ) to its neighbor nodes in the cluster. If they have the proper situation to keep the redundant information, they reply by the REDundant ACKnowledgement (REDACK), else they send the redundant request packet to their neighbors and reply to the cluster head by REDundant REFuse packet (REDREF). After predefined time, the current cluster head selects some of the nodes which have received the REDACK packet, to keep the redundant information, with attention to their condition. The cluster head sends a copy of table’s
information to the mirror nodes. The cluster head has the location of the mirror nodes and the mirror nodes update the cluster head by their current location, when a failure occurs and the cluster head fails, the nodes of the cluster will be aware, maybe the cluster head makes them aware, before its failing or the neighbor cluster heads which are aware, make them aware by sending an awareness packet.
S
1-LREQ
D
3-LREQ
4-LREP
2-LREQ
S
3-LREQ
1-LREQ
4-LREQ
2-LREQ D
6-LREP
5-LREQ
S
3-LREQ
1-LREQ
6-LREQ
2-LREQ
D
8-LREP
7-LREQ
5-LREQ
4-LREQ
Figure 2. Representation of using the Location Request Packet and (LREQ)
the Location Reply Packet (LREP).
In this case the mirror nodes send the awareness packets to the nodes of cluster which contain their ID and current
Mahboobeh Abdoos International Journal of Engineering and Applied Computer Science (IJEACS)
Volume: 01, Issue: 01, November 2016 ISBN: 978-0-9957075-0-4
www.ijeacs.com 4
location and velocity and the time stamp. The nodes of cluster select the new cluster head. (One of the mirror nodes)
The information of tables of a mirror node is updated by the cluster head. The source node location information receiving, directly depends to the distance between the source and destination nodes. The proposed scheme is fault tolerant. This location service is some-for-some location service. (See Fig. 3)
Clusterhead
Node
Internal
Node
Redundant
Node
2-REDACK
1-REDREQ
5-REDREQ
3-REDREQ
4-REDREF
6-REDACK
7- REDOK &
Copy of
table’s
information
Figure 3. The redundant nodes selection process in a cluster.
V. THE PROPOSED CLUSTER AND POSITION BASED
MULTICAST PROTOCOL(CPMB)
When a source node wants to send a data packet to some destination nodes, it needs to know the location of destination nodes, so the source node puts the ID of destination nodes in the Location REQuest packet (LREQ) and sends it to the cluster head and the cluster head searches in its cluster member table if there is the location information of the destination nodes, the cluster head puts the location information in the headers of the individual LREQ packets and send them toward the destination nodes. If some location information of destination nodes is not found, the cluster head sends a copy of LREQ packet to the cluster head of the neighbor clusters and the higher level cluster, ….
In every level that the location of destination nodes is found, this information is sent to the source node by the location reply packet. If the source node does not receive the Location REPly packet (LREP), it repeats to send the location request packets until receiving the LREP packet .
If the source node receives the location reply packets from all of the destination nodes, then it puts the location information of destination nodes in the headers of data packets and sends them toward the destination nodes. if after the predefined time, the source node does not receive the acknowledgement (ACK) packets from all of the destination nodes, then it resends the data packets to the destination nodes that have not received the data packets.
VI. SIMULATION
The used simulation tool is NS2. It supports the IEEE 802.11 MAC. The simulation environment consists of 50 wireless mobile nodes that are spread in the 1000*1000 meters during 900 seconds. The radio transfer range is 250 meters. It is supposed that there is free space propagation channel. The group scenarios define that some nodes are receivers of the source node.
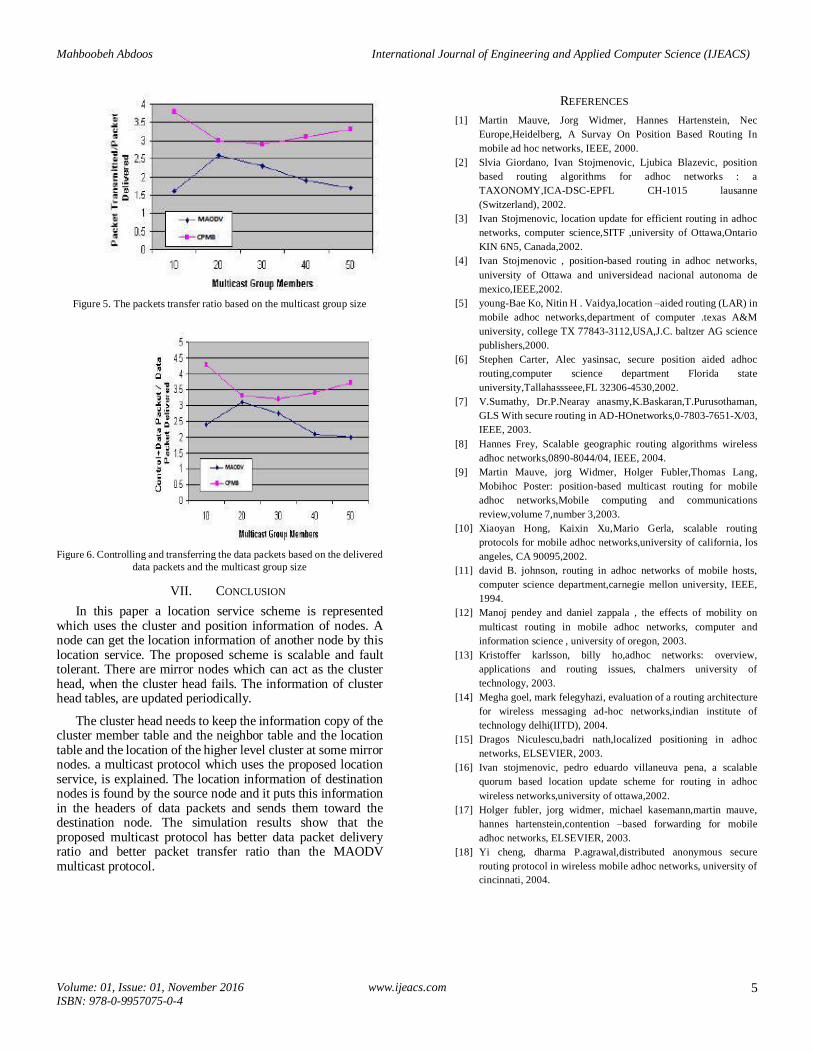
A multicast member node, joins a multicast group, with start of the simulation (during first 30 seconds) and will be a member during the simulation. The source node of multicast tree sends (and stops to send) the packets at predefined time interval. (In every one second, four packets are sent and the size of each packet is 512 byte) Here just one multicast group is used. Every mobile node moves accidentally with a predefined speed. Every member of group moves from an accidental location toward an accidental destination location. After stopping the packets sending, another accidental destination is defined. The time of stopping the packets sending, affects the speed of the nodes. The time of stopping the packets sending is set to 0, because of more dynamism. The speed of the nodes is between 1 m/s to 20 m/s. The used standard metrics are the IETF MANET standards, which are used to evaluate the multicast protocols. The metrics for comparing the MAODV and CPMB are the data packets delivery ratio and the data packets transfer ratio based on the multicast group size and controlling and transferring the data packets based on the delivered data packets and multicast group size. (See Fig. 4, Fig. 5, Fig. 6)
Figure 4. The data packet delivery ratio, based on the multicast
group size
Mahboobeh Abdoos International Journal of Engineering and Applied Computer Science (IJEACS)
Volume: 01, Issue: 01, November 2016 ISBN: 978-0-9957075-0-4
www.ijeacs.com 5
Figure 5. The packets transfer ratio based on the multicast group size
Figure 6. Controlling and transferring the data packets based on the delivered
data packets and the multicast group size
VII. CONCLUSION
In this paper a location service scheme is represented which uses the cluster and position information of nodes. A node can get the location information of another node by this location service. The proposed scheme is scalable and fault tolerant. There are mirror nodes which can act as the cluster head, when the cluster head fails. The information of cluster head tables, are updated periodically.
The cluster head needs to keep the information copy of the cluster member table and the neighbor table and the location table and the location of the higher level cluster at some mirror nodes. a multicast protocol which uses the proposed location service, is explained. The location information of destination nodes is found by the source node and it puts this information in the headers of data packets and sends them toward the destination node. The simulation results show that the proposed multicast protocol has better data packet delivery ratio and better packet transfer ratio than the MAODV multicast protocol.
REFERENCES
[1] Martin Mauve, Jorg Widmer, Hannes Hartenstein, Nec
Europe,Heidelberg, A Survay On Position Based Routing In
mobile ad hoc networks, IEEE, 2000.
[2] Slvia Giordano, Ivan Stojmenovic, Ljubica Blazevic, position
based routing algorithms for adhoc networks : a
TAXONOMY,ICA-DSC-EPFL CH-1015 lausanne
(Switzerland), 2002.
[3] Ivan Stojmenovic, location update for efficient routing in adhoc
networks, computer science,SITF ,university of Ottawa,Ontario
KIN 6N5, Canada,2002.
[4] Ivan Stojmenovic , position-based routing in adhoc networks,
university of Ottawa and universidead nacional autonoma de
mexico,IEEE,2002.
[5] young-Bae Ko, Nitin H . Vaidya,location –aided routing (LAR) in
mobile adhoc networks,department of computer .texas A&M
university, college TX 77843-3112,USA,J.C. baltzer AG science
publishers,2000.
[6] Stephen Carter, Alec yasinsac, secure position aided adhoc
routing,computer science department Florida state
university,Tallahassseee,FL 32306-4530,2002.
[7] V.Sumathy, Dr.P.Nearay anasmy,K.Baskaran,T.Purusothaman,
GLS With secure routing in AD-HOnetworks,0-7803-7651-X/03,
IEEE, 2003.
[8] Hannes Frey, Scalable geographic routing algorithms wireless
adhoc networks,0890-8044/04, IEEE, 2004.
[9] Martin Mauve, jorg Widmer, Holger Fubler,Thomas Lang,
Mobihoc Poster: position-based multicast routing for mobile
adhoc networks,Mobile computing and communications
review,volume 7,number 3,2003.
[10] Xiaoyan Hong, Kaixin Xu,Mario Gerla, scalable routing
protocols for mobile adhoc networks,university of california, los
angeles, CA 90095,2002.
[11] david B. johnson, routing in adhoc networks of mobile hosts,
computer science department,carnegie mellon university, IEEE,
1994.
[12] Manoj pendey and daniel zappala , the effects of mobility on
multicast routing in mobile adhoc networks, computer and
information science , university of oregon, 2003.
[13] Kristoffer karlsson, billy ho,adhoc networks: overview,
applications and routing issues, chalmers university of
technology, 2003.
[14] Megha goel, mark felegyhazi, evaluation of a routing architecture
for wireless messaging ad-hoc networks,indian institute of
technology delhi(IITD), 2004.
[15] Dragos Niculescu,badri nath,localized positioning in adhoc
networks, ELSEVIER, 2003.
[16] Ivan stojmenovic, pedro eduardo villaneuva pena, a scalable
quorum based location update scheme for routing in adhoc
wireless networks,university of ottawa,2002.
[17] Holger fubler, jorg widmer, michael kasemann,martin mauve,
hannes hartenstein,contention –based forwarding for mobile
adhoc networks, ELSEVIER, 2003.
[18] Yi cheng, dharma P.agrawal,distributed anonymous secure
routing protocol in wireless mobile adhoc networks, university of
cincinnati, 2004.

Mahboobeh Abdoos International Journal of Engineering and Applied Computer Science (IJEACS)
Volume: 01, Issue: 01, November 2016 ISBN: 978-0-9957075-0-4
www.ijeacs.com 6
AUTHOR PROFILE
Mahboobeh Abdoos received the B.S and M.S degrees in computer engineering from Azad
University, Ghazvin, Iran, in 2002 and 2007 respectively. She is now the Ph.D. research student
of Islamic Azad university, Qom, Iran. She has taught at Islamic Azad and Payam Nour
Universities from 2005 til now. She has been the referee of some conferences. Her current research
interest includes position based routing protocols in mobile ad hoc networks, QOS and security based routing protocols in mobile ad hoc networks, cloud
computing and data base.
© 2016 by the author(s); licensee Empirical Research Press Ltd. United Kingdom. This is an open access article distributed under the terms and conditions of the Creative Commons by Attribution (CC-BY) license.
(http://creativecommons.org/licenses/by/4.0/).
International Journal of Engineering and Applied Computer Science (IJEACS)
Volume: 01, Issue: 01, November 2016 ISBN: 978-0-9957075-0-4
www.ijeacs.com 7
Abstract - Hacking has become an extensive trouble with the
beginning of the digital age, almost worldwide access to the
internet and other digital media. It is significant for individuals,
corporations, and the government to guard them from being
susceptible to such attacks. The purpose of this paper is to
provide information about ethical hacking; their skill to share
advanced security knowledge and capabilities with organization
and pointing out their vulnerabilities.
Keywords—hackers; ethical hacking; risk management; risk
assessment; network hacking.
I. INTRODUCTION
A hacker is an intelligent professional who likes to mess with software or electronic systems, consequently harms the organizations and individuals IT assets economically and socially if working negatively. They enjoy exploring to educate them self how to hinder, temper computer systems functions. They love discovering new ways to work with computer system [2]. As the esteem of computers and their sustained high cost, a few users would defy the access pedals that had been put in place. They would pinch passwords or account numbers by looking over someone’s shoulder, discover the system for bugs that might get them past the rules, or even take cope of the whole system. They would do these things in order to be able to run the programs of their choice, or just to change the confines under which their programs were running. Initially these computer intrusions were fairly benign, with the most damage being the theft of computer time [1]. Sporadically the less endowed, or less careful, intruders would accidentally bring down a system or harm its files, and the system administrators would have to restart it or make maintenance other times, when these intruders were another time denied access once their activities were exposed, they would react with determination destructive actions and when the number of these destructive computer intrusions became noticeable, due to the visibility of the system or the extent of the damage inflicted, it became “news”. Instead of using the
more precise term of “computer criminal”, the media began using the term “hacker” to describe folks who break into computers for fun, revenge, or profit. Since calling someone a “hacker” was initially meant as a tribute, computer security professionals prefer to use the term “cracker” or “intruder” for those hackers who turn to the dark side of hacking [3].
II. ETHICAL HACKING
With the growth of the Internet, a computer safety measure has become a major anxiety for businesses and governments. They fancy being able to take benefit of the Internet for electronic commerce, publicity, in sequence distribution and admission, and other pursuits, but they are concerned about the prospect of being “hacked”. The probable patrons of these services are worried about maintaining control of personal information that varies from credit card numbers to social security numbers and home addresses [1]. In their search for a way to approach the problem, organizations came to understand that one of the best ways to assess the intruder threat to their interests would be to have self-governing computer security professionals attempt to break into their computer systems. This scheme is similar to having self-governing auditors come into an organization to verify its bookkeeping records. In the case of computer security, these “tiger teams” or “ethical hackers” [4] would use the same tools and techniques as the intruders, but they would neither damage the target systems nor steal information. Instead, they would assess the target systems’ security and report back to the owners with the vulnerabilities they found and instructions for how to remedy them. This method of evaluating the security of a system has been in use starting the early days of computers. In one early ethical hack, the United States Air Force conducted a “security evaluation” of the Multics operating systems for “potential use as a two-level (secret/top secret) system” [5]. Hacking is usually legal as long as it is being done to find weaknesses in a computer or network system for testing purpose. This sort of hacking is called Ethical Hacking [6].
Study of Ethical Hacking and Management of
Associated Risks
Mohammed Abdul Bari
Dept. of Computer Science & Engineering
Nawab Shah Alam Khan College
of Engineering & Technology
Hyderabad, India.
Shahanawaj Ahamad
Dept. of Computer Sc. & Software Engineering
College of Computer Sc. & Engineering
University of Hail
Hail, Saudi Arabia.

Mohammed Abdul Bari et.al. International Journal of Engineering and Applied Computer Science (IJEACS)
Volume: 01, Issue: 01, November 2016 ISBN: 978-0-9957075-0-4
www.ijeacs.com 8
Figure 1. Types of Hacking [7]
Password Hacking:
Recovering secret
passwords from data
that has been stored
Email Hacking:
Unofficial access
on an Email
Website Hacking:
Unlawful control over a web server
Computer Hacking: Stealing computer ID &
password
Ethical Hacking:
Finding weaknesses
in a computer or network system
Network Hacking:
Gathering information about
a network by using tools like
Telnet, NS lookup, Ping,
tracert, netstat, etc.
Types of Hacking
A. Path Taken by Hackers [11,12]:
Initiation: Development in early interest in computers
Innocent motives: Hear the subjects wanted to know more about computers, and enhance their online experiences, in order to do so it to alter existing software or overcome network restrictions.
Growth: Hacker preferred to spend their time learning hacking skills. Hackers organized into loosely associated groups and practical or real communities, obtain technical skills through mentoring and sharing, and establish social orders, group norms, and individual and social identities
Maturation: Associate with other hackers: If I have a problem, I go to the experts for an answer. Asked someone who's already done it. Hackers felt they knew the difference between right and wrong, and have not stepped over the line. The number one enabler is the lack of security and the abundance of software vulnerabilities. One thing that successful hacks have in universal is the aptitude to remain secret – right up until the moment that the time is right and the attackers strike.
B. Path taken by Hackers
This section explained the phases of ethical hacking as shown in fig.3.
Phase 1: Reconnaissance This is divided into two phases as Passive reconnaissance
and Active reconnaissance. Passive reconnaissance involves congregation information about a possible target lacking the targeted individual's or company's information. Active reconnaissance involves probing the network to discover individual hosts, IP addresses, and services on the network. Both passive and active reconnaissance can lead to the discovery of useful information to use in an attack. Example, it's usually easy to find the type of web server and the operating system version number that a company is using. This information may allow a hacker to find vulnerability in that OS version and exploit the vulnerability to gain more access.
Phase 2: Scanning Scanning involves taking the information discovered
during reconnaissance and using it to examine the network.
Phase 3: Gaining Access Hear where the real hacking takes place. Vulnerabilities
which are uncovered during the reconnaissance and scanning phase are now exploited to gain access to the target system. The hacking attack can be delivered to the target system via a local area network (LAN), either wired or wireless
Phase 4: Maintaining Access Formerly a hacker has gained access to a target system;
they want to keep that access for future exploitation and attacks. They can use it as a base to launch additional attacks. In this case, the owned system is sometimes referred to as a zombie system [4].
Dam
age to
society
Figure 2. Growth of Hackers [11]

Mohammed Abdul Bari et.al. International Journal of Engineering and Applied Computer Science (IJEACS)
Volume: 01, Issue: 01, November 2016 ISBN: 978-0-9957075-0-4
www.ijeacs.com 9
Phase 5: Covering Tracks Formerly hackers have been able to gain and maintain
access; they cover their tracks to avoid detection by security personnel, to continue to use the owned system, to remove evidence of hacking, or to avoid legal action.
C. Path taken by Hackers Why Ethical Used in Organization
Ethical hacking companies offer tremendous value in their skills to share their sophisticated security and organizational knowledge and knowledge. This examines enables businesses to adjust their security technologies, train their staff, and ratify security practices that improved protect dangerous systems and responsive data. Ethical hacking services offer organization with purpose and real-world assessments of security weaknesses, vulnerability, risk, and remediation options. As a result, ethical hacking is rapidly gaining attention as an essential security practice that should be performed on a regular basis [6]. They are highly paid professionals with a rightful status. They can reduce the risk of impact, clearly identifying reimbursement and flaws helping senior company directors to appreciate if such tricks should be undertaken. Ethical hackers could explore vulnerabilities earlier to minimize the risk. The company could presume diffusion tests to find if they are susceptible to attack. Finding vulnerabilities for companies not only helps the company but also minimizes the risks of attacks, though ethical hackers have five days in universal to carry out tests, what happens if vulnerabilities are overlooked. If an ethical hacker fails to deliver results to the business and assume the system is safe and that it has no problems, which can be liable for legal actions if a hateful hacker gets into the system [3].
Major organizations such as Google, RSA, and Sony have lately made headlines as sufferers of highly complicated cyber-attacks that appear in major security breaches and data loss. Data security crack can involve massive amounts of sensitive customer data such as credit card numbers, social
security numbers, passwords, and PINs. 77 million customer records were leaked in the 2011 Sony Networks data violate. In other cases, security breaches can absorb the loss of precious scholar property or hush-hush state secrets.
III. VULNERABILITY ASSESSMENT OF AN ORGANIZATION BY
ETHICAL HACKING
A vulnerability evaluation is a procedure, [8] which is a part of the Vulnerability Management Program, whose idea is to examine a given system for possible points of breakdown and measure their scale after that. Its scope encompasses not only the companies’ technological possessions – i.e., systems and networks – but also their physical truthfulness and security measures concerning the safety of personnel. Such a wide perimeter to content determines the variety of techniques designed to perform the vulnerability assessment, namely scanning tools, physical checks, and social engineering tests.
A. Risk Assessment
Create a record list of all resources and assets (e.g., networks, systems, personally identifiable information, etc.) Evaluate these company assets and resources and assign them values Catalog the vulnerabilities and define the potential threats to each asset/resource and these can be done by risk analysis [9]. Many factors are measured when performing a risk analysis: asset, vulnerability, threat and impact to the company. An example of this would be an analyst trying to find the risk to the company of a server that is vulnerable to Heartbleed [10]. A risk analysis, when concluded, will have a final risk rating with explanatory controls that can further reduce the risk. Business managers can then take the risk report and mitigating controls and decide whether or not to implement them. To carry out a Risk management, we must first recognize the possible threats that we face, and then estimate the likelihood that these threats will materialize. Risk Analysis can be complex, as you'll need to draw on detailed information such as project plans, financial data, security protocols, marketing forecasts, and other relevant information. However, it's an essential planning tool, and one that could save time, money, and reputations.
The three different concepts explained here are not elite of each other, but somewhat harmonize each other. In many information security programs, vulnerability assessments are the first step – they are used to carry out wide sweeps of a network to find absent patches or misconfigured software. From there, one can either perform a penetration test to see how usable the vulnerability is or a risk analysis to ascertain the cost/benefit of fixing the vulnerability. Of course, you don’t need either to perform a risk analysis. Risk can be determined anywhere a threat and an asset is present. It can be data center in a hurricane zone or confidential papers sitting in a wastebasket.
Penetration Testing is a method that many companies follow in order to minimize their hazard in security breaches [6], they are as follows:
Black Box − In back box, the ethical hacker doesn’t have any in sequence about the infrastructure of the
Figure 3. Phases of ethical hacking
[4]
Mohammed Abdul Bari et.al. International Journal of Engineering and Applied Computer Science (IJEACS)
Volume: 01, Issue: 01, November 2016 ISBN: 978-0-9957075-0-4
www.ijeacs.com 10
organization that he is trying to break in. Here, hacker tries to find the in sequence by his own way.
White Box − In white-box breach testing, the ethical hacker is provided with all the essential information about the infrastructure and the set of connections of the organization that he needs to break in.
Grey Box − It is a type of breach testing where the ethical hacker has an incomplete knowledge of the infrastructure, like its domain name server.
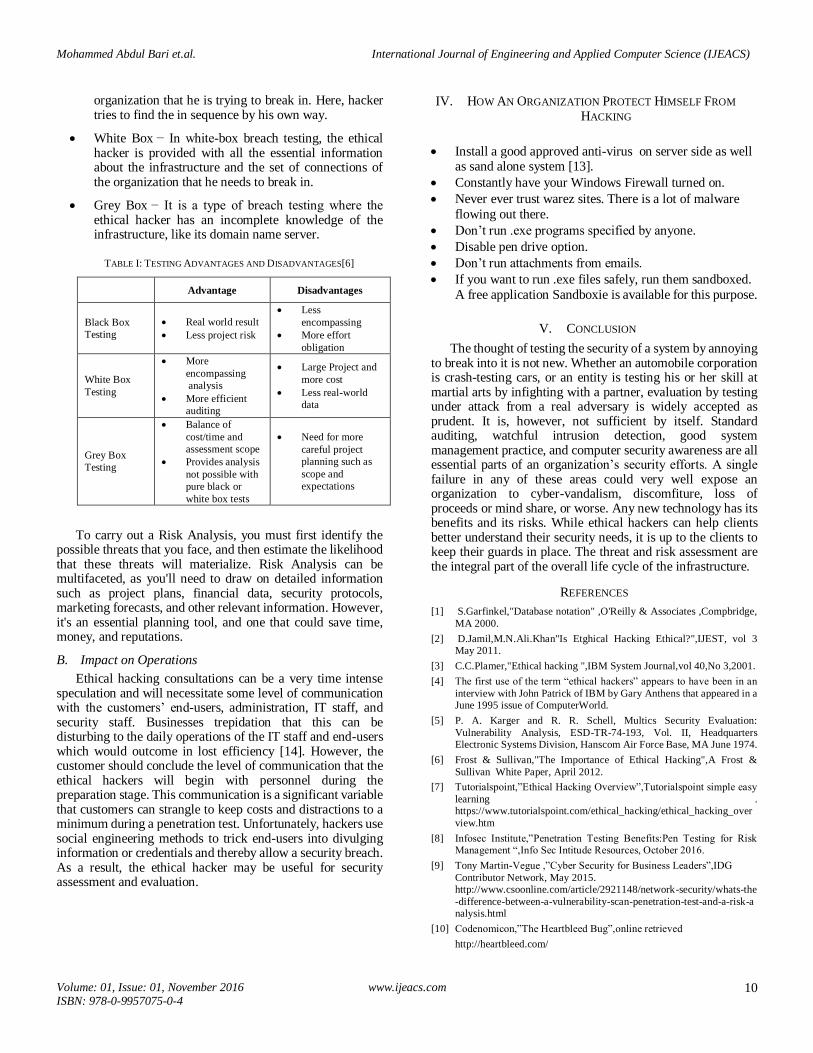
TABLE I: TESTING ADVANTAGES AND DISADVANTAGES[6]
Advantage Disadvantages
Black Box
Testing
Real world result
Less project risk
Less
encompassing
More effort
obligation
White Box
Testing
More
encompassing
analysis
More efficient
auditing
Large Project and
more cost
Less real-world
data
Grey Box
Testing
Balance of
cost/time and
assessment scope
Provides analysis
not possible with
pure black or
white box tests
Need for more
careful project
planning such as
scope and
expectations
To carry out a Risk Analysis, you must first identify the possible threats that you face, and then estimate the likelihood that these threats will materialize. Risk Analysis can be multifaceted, as you'll need to draw on detailed information such as project plans, financial data, security protocols, marketing forecasts, and other relevant information. However, it's an essential planning tool, and one that could save time, money, and reputations.
B. Impact on Operations
Ethical hacking consultations can be a very time intense speculation and will necessitate some level of communication with the customers’ end-users, administration, IT staff, and security staff. Businesses trepidation that this can be disturbing to the daily operations of the IT staff and end-users which would outcome in lost efficiency [14]. However, the customer should conclude the level of communication that the ethical hackers will begin with personnel during the preparation stage. This communication is a significant variable that customers can strangle to keep costs and distractions to a minimum during a penetration test. Unfortunately, hackers use social engineering methods to trick end-users into divulging information or credentials and thereby allow a security breach. As a result, the ethical hacker may be useful for security assessment and evaluation.
IV. HOW AN ORGANIZATION PROTECT HIMSELF FROM
HACKING
Install a good approved anti-virus on server side as well as sand alone system [13].
Constantly have your Windows Firewall turned on.
Never ever trust warez sites. There is a lot of malware
flowing out there.
Don’t run .exe programs specified by anyone.
Disable pen drive option.
Don’t run attachments from emails.
If you want to run .exe files safely, run them sandboxed.
A free application Sandboxie is available for this purpose.
V. CONCLUSION
The thought of testing the security of a system by annoying to break into it is not new. Whether an automobile corporation is crash-testing cars, or an entity is testing his or her skill at martial arts by infighting with a partner, evaluation by testing under attack from a real adversary is widely accepted as prudent. It is, however, not sufficient by itself. Standard auditing, watchful intrusion detection, good system management practice, and computer security awareness are all essential parts of an organization’s security efforts. A single failure in any of these areas could very well expose an organization to cyber-vandalism, discomfiture, loss of proceeds or mind share, or worse. Any new technology has its benefits and its risks. While ethical hackers can help clients better understand their security needs, it is up to the clients to keep their guards in place. The threat and risk assessment are the integral part of the overall life cycle of the infrastructure.
REFERENCES
[1] S.Garfinkel,"Database notation" ,O'Reilly & Associates ,Compbridge,
MA 2000.
[2] D.Jamil,M.N.Ali.Khan"Is Etghical Hacking Ethical?",IJEST, vol 3 May 2011.
[3] C.C.Plamer,"Ethical hacking ",IBM System Journal,vol 40,No 3,2001.
[4] The first use of the term “ethical hackers” appears to have been in an
interview with John Patrick of IBM by Gary Anthens that appeared in a June 1995 issue of ComputerWorld.
[5] P. A. Karger and R. R. Schell, Multics Security Evaluation:
Vulnerability Analysis, ESD-TR-74-193, Vol. II, Headquarters Electronic Systems Division, Hanscom Air Force Base, MA June 1974.
[6] Frost & Sullivan,"The Importance of Ethical Hacking",A Frost &
Sullivan White Paper, April 2012.
[7] Tutorialspoint,”Ethical Hacking Overview”,Tutorialspoint simple easy
learning . https://www.tutorialspoint.com/ethical_hacking/ethical_hacking_over
view.htm
[8] Infosec Institute,”Penetration Testing Benefits:Pen Testing for Risk Management “,Info Sec Intitude Resources, October 2016.
[9] Tony Martin-Vegue ,”Cyber Security for Business Leaders”,IDG
Contributor Network, May 2015. http://www.csoonline.com/article/2921148/network-security/whats-the
-difference-between-a-vulnerability-scan-penetration-test-and-a-risk-analysis.html
[10] Codenomicon,”The Heartbleed Bug”,online retrieved
http://heartbleed.com/

Mohammed Abdul Bari et.al. International Journal of Engineering and Applied Computer Science (IJEACS)
Volume: 01, Issue: 01, November 2016 ISBN: 978-0-9957075-0-4
www.ijeacs.com 11
[11] Zhengchuan,Qing Hu,Chenghong Zhang,” Start with talent and Skill
driven by curiosity and hormones ,constrained only by moral values and judgment “,Communications of ACM, vol 56,no 4,April 2013.
[12] Michael Kassnern,” Hacker: From innocent curiosity to illegal activity
“,IT Security News latter ,May 2013
http://www.techrepublic.com/blog/it-security/hackers-from-innocent-c
uriosity-to-illegal-activity/
[13] Mahesh,” How do Hackers Hack your Passwork", Block for Blogger ShoutMe,April 2015.
[14] M.A.Bari & Shahanawaj Ahamad ," Process of Reserve Engineering of
Enterprise Information System Architecture ",IJCSI,vol 8,Iss 5,no 3,Spetember 2011.
© 2016 by the author(s); licensee Empirical Research Press Ltd. United Kingdom. This is an open access article
distributed under the terms and conditions of the Creative Commons by Attribution (CC-BY) license. (http://creativecommons.org/licenses/by/4.0/).
International Journal of Engineering and Applied Computer Science (IJEACS)
Volume: 01, Issue: 01, November 2016 ISBN: 978-0-9957075-0-4
www.ijeacs.com 12
Abstract - It is considerably recognized that in software
engineering, the utilization of metrics at the initial stages of the
object oriented software can encourage designers to bring about
a noticeable improvement decisions. In this paper, a literature
review and classification scheme for software complexity
measurement researches is presented. The study shows that an
expanding volume of complexity measurement has been
conducted in diverse range of areas. As software complexity is
an important factor that ought to be recognized at different
levels of software development and it requires in profundity
study with comprehension. Examinations of the chosen
scrutinizes are completed and holes in the exploration are
recognized. Analyses of the selected researches are completed
and crevices in the research are identified. A complete record of
references is explored. This review is planned to furnish driving force in exploration and help simulate further interest.
Keywords— LOC; Complexity; SDLC; MOOD; OOP.
I. INTRODUCTION
More than 200 papers, which were published between the time period 1974-2012 in international journals and conferences of IEEE were collected, analyzed and classified into a number of categories and subcategories. The study led to the identification of gap in software complexity measurement researches and enabled the authors to recommend the area where there is a lot of scope for future research.
A. What is Software Complexity?
In last decades, software complexity has created a new era in computer science. Software complexity could be defined as the principle driver of cost, reliability and performance of software. In any case, there is no common agreement on software complexity definition, yet the greater part of them is dependent upon Zeus perspective of software complexity (Zuse, 1993)," software complexity is the level of challenge in analyzing, maintaining, testing, designing and modifying software ". In other words, software complexity is an issue that
is in the whole software development process and each phase of software development life cycle (SDLC).
Software complexity is a broad topic in Software Engineering and has attracted numerous workers since1976, and numerous metrics have been proposed to measure software complexity. This measurement is exceptionally imperative in the software management and assumes a major role in project success. Complexity strongly impacts the needed effort to analyze and portray requirements, design, code, test and debugging the system during the development phases of software. In maintenance phases, complexity indicates the trouble in error correction and the needed effort to change distinctive software module.
The expanding vitality of software measurement and metrics accelerated the growth of new software complexity measurement and in software engineering metrics are essential for estimations for project planning and project measurement. The increased demand for software quality has brought about higher quality software and these days quality is the fundamental differentiator between the software products. Due to this reason software designers and developers require substantial measures for the assessment, improvement and acceptance of software product from the initial stages. These days software measurement assumes an essential part for measuring complexity and quality of software. Since software complexity influences software development effort, cost, testability, maintainability and so on. Thus it is indispensible to measure the software complexity in every software development phase. A variety of metrics have been proposed for measuring software complexity.
II. IDENTIFIED SOFTWARE COMPLEXITY
MEASUREMENT RESEARCH AND EXTENT OF
RESEARCH CARRIED OUT
The research framework shown in fig.1 is based on the
literature review and the nature of software complexity
measurement researches, which meant to give an
understanding of how the subject has evolved and
progressing. Since software complexity measurement is an important area it is very essential to have clear and better
understanding of it.
Software Complexity Measurement: A Critical
Review
Harmeet Kaur
Ph.D. (Computer Applications)
Research Scholar
Punjab Technical University Jalandhar, Punjab, India
Gurvinder N. Verma
Professor & Hood-Applied Sciences
Shri Sukhmani Institute of Engg. & Tech.
Derabassi, Punjab, India.
Harmeet Kaur et.al. International Journal of Engineering and Applied Computer Science (IJEACS)
Volume: 01, Issue: 01, November 2016 ISBN: 978-0-9957075-0-4
www.ijeacs.com 13
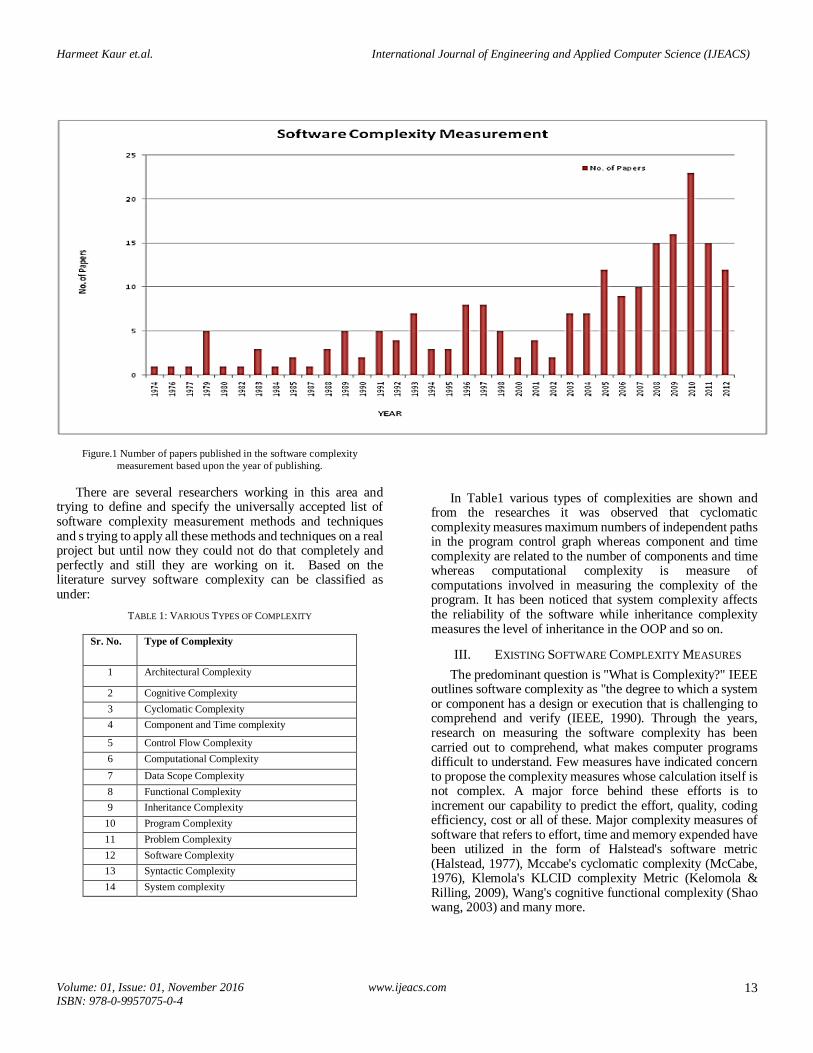
Figure.1 Number of papers published in the software complexity
measurement based upon the year of publishing.
There are several researchers working in this area and trying to define and specify the universally accepted list of software complexity measurement methods and techniques and s trying to apply all these methods and techniques on a real project but until now they could not do that completely and perfectly and still they are working on it. Based on the literature survey software complexity can be classified as under:
TABLE 1: VARIOUS TYPES OF COMPLEXITY
Sr. No. Type of Complexity
1 Architectural Complexity
2 Cognitive Complexity
3 Cyclomatic Complexity
4 Component and Time complexity
5 Control Flow Complexity
6 Computational Complexity
7 Data Scope Complexity
8 Functional Complexity
9 Inheritance Complexity
10 Program Complexity
11 Problem Complexity
12 Software Complexity
13 Syntactic Complexity
14 System complexity
In Table1 various types of complexities are shown and
from the researches it was observed that cyclomatic complexity measures maximum numbers of independent paths in the program control graph whereas component and time complexity are related to the number of components and time whereas computational complexity is measure of computations involved in measuring the complexity of the program. It has been noticed that system complexity affects the reliability of the software while inheritance complexity measures the level of inheritance in the OOP and so on.
III. EXISTING SOFTWARE COMPLEXITY MEASURES
The predominant question is "What is Complexity?" IEEE outlines software complexity as "the degree to which a system or component has a design or execution that is challenging to comprehend and verify (IEEE, 1990). Through the years, research on measuring the software complexity has been carried out to comprehend, what makes computer programs difficult to understand. Few measures have indicated concern to propose the complexity measures whose calculation itself is not complex. A major force behind these efforts is to increment our capability to predict the effort, quality, coding efficiency, cost or all of these. Major complexity measures of software that refers to effort, time and memory expended have been utilized in the form of Halstead's software metric (Halstead, 1977), Mccabe's cyclomatic complexity (McCabe, 1976), Klemola's KLCID complexity Metric (Kelomola & Rilling, 2009), Wang's cognitive functional complexity (Shao wang, 2003) and many more.
Harmeet Kaur et.al. International Journal of Engineering and Applied Computer Science (IJEACS)
Volume: 01, Issue: 01, November 2016 ISBN: 978-0-9957075-0-4
www.ijeacs.com 14
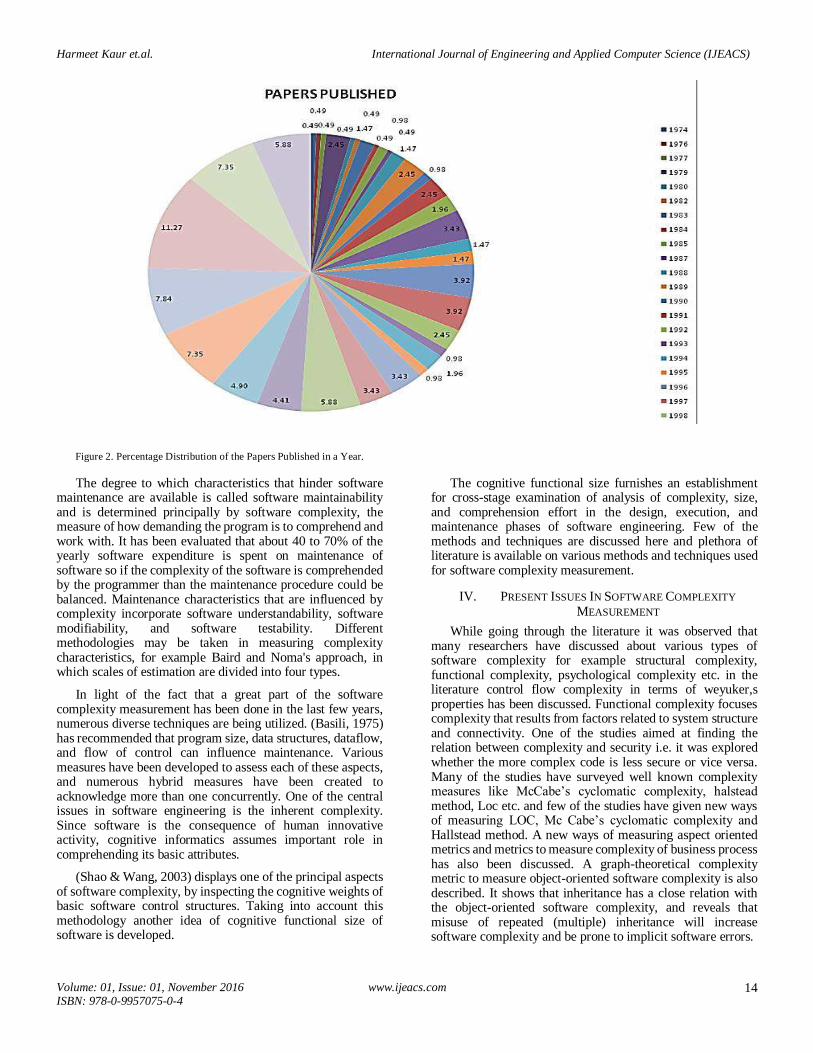
Figure 2. Percentage Distribution of the Papers Published in a Year.
The degree to which characteristics that hinder software maintenance are available is called software maintainability and is determined principally by software complexity, the measure of how demanding the program is to comprehend and work with. It has been evaluated that about 40 to 70% of the yearly software expenditure is spent on maintenance of software so if the complexity of the software is comprehended by the programmer than the maintenance procedure could be balanced. Maintenance characteristics that are influenced by complexity incorporate software understandability, software modifiability, and software testability. Different methodologies may be taken in measuring complexity characteristics, for example Baird and Noma's approach, in which scales of estimation are divided into four types.
In light of the fact that a great part of the software complexity measurement has been done in the last few years, numerous diverse techniques are being utilized. (Basili, 1975) has recommended that program size, data structures, dataflow, and flow of control can influence maintenance. Various measures have been developed to assess each of these aspects, and numerous hybrid measures have been created to acknowledge more than one concurrently. One of the central issues in software engineering is the inherent complexity. Since software is the consequence of human innovative activity, cognitive informatics assumes important role in comprehending its basic attributes.
(Shao & Wang, 2003) displays one of the principal aspects of software complexity, by inspecting the cognitive weights of basic software control structures. Taking into account this methodology another idea of cognitive functional size of software is developed.
The cognitive functional size furnishes an establishment for cross-stage examination of analysis of complexity, size, and comprehension effort in the design, execution, and maintenance phases of software engineering. Few of the methods and techniques are discussed here and plethora of literature is available on various methods and techniques used for software complexity measurement.
IV. PRESENT ISSUES IN SOFTWARE COMPLEXITY
MEASUREMENT
While going through the literature it was observed that many researchers have discussed about various types of software complexity for example structural complexity, functional complexity, psychological complexity etc. in the literature control flow complexity in terms of weyuker,s properties has been discussed. Functional complexity focuses complexity that results from factors related to system structure and connectivity. One of the studies aimed at finding the relation between complexity and security i.e. it was explored whether the more complex code is less secure or vice versa. Many of the studies have surveyed well known complexity measures like McCabe’s cyclomatic complexity, halstead method, Loc etc. and few of the studies have given new ways of measuring LOC, Mc Cabe’s cyclomatic complexity and Hallstead method. A new ways of measuring aspect oriented metrics and metrics to measure complexity of business process has also been discussed. A graph-theoretical complexity metric to measure object-oriented software complexity is also described. It shows that inheritance has a close relation with the object-oriented software complexity, and reveals that misuse of repeated (multiple) inheritance will increase software complexity and be prone to implicit software errors.
Harmeet Kaur et.al. International Journal of Engineering and Applied Computer Science (IJEACS)
Volume: 01, Issue: 01, November 2016 ISBN: 978-0-9957075-0-4
www.ijeacs.com 15
System complexity comprised of internal and external complexity it was examined that system complexity ordinarily influences characteristics for software reliability, maintainability, and testability of software systems which are recognized as of utter significance in composing an improved software product. For accomplishing these software qualities, system complexity must be regulated by modularizing the system into different modules of suitable complexities. Software complexity measures are regularly proposed as suitable indicators of diverse software quality traits.
An incredible deal of effort is currently being dedicated to the study, analyses, expectation, and minimization of expected software maintenance cost, much sooner than software is conveyed to users or stakeholders. It had been evaluated that, on an average, the effort spent on software maintenance is as expensive as the effort used on all other software stages. Ways to mitigate software maintenance complexity and increased cost may originate in software design.
In the past data complexity has been overlooked in measuring the software complexity however now few of the studies have done on data complexity and data scope complexity. The data scope complexity can demonstrate complexities of various characteristics of object oriented programming in the meantime and work to quantify object oriented and procedure oriented programming has been done. Many researchers have concentrated their work on measuring the cognitive weight unpredictability and the information flow complexity which is dependent upon the information held by the program. Much of work has been done on measuring the software complexity yet this field needs further research for the advancement of software complexity measurement techniques and strategies.
V. CONCLUSION
From the literature it has been concluded that software complexity measurement is a subject of concern for the researchers since 70’s.From fig.1 it is clear that maximum work on software complexity measurement is done in the year 2010 followed by 2008-09, 2011 and 2012. From 1974-77 minimum work has been dealt with and slight increase in the software measurement complexity area has been seen in 1979.After 2003 it can be concluded that an increase in the work of software complexity measurement has been observed. The Maximum percentage of papers were published in the year 2010 followed by 2008-09 as depicted in the fig.2.Since complexity affects the quality attributes and cost of the software so it is an area of interest for the researchers working in the field of software development and maintenance and it requires further research.
VI. FUTURE SCOPE
Scientific investigation improvements are to be made in software productivity and quality. The development of new complexity metrics is required to refine the measures. Further studies are needed to fully resolve the question about the effectiveness of traditional metrics in measuring OOP software complexity. The work on only one object-oriented feature of complexity, that is, inheritance level has been done.
Other object-oriented features like polymorphism, information hiding, and encapsulation require further study. As the work was concentrated on small object-oriented programs but it is expected that more complex object-oriented systems will be explored. It is expected to see continued use and further development of OO metrics is required in the years ahead In order to empirically validate the complexity metrics experiments need to be carried out it has been suggested that experimentation is a crucial part of evaluation of new metrics. Another important issue that needs to be investigated is what are both the meaning of complexity metrics and the precise number to use as a complexity limit in a process development. Future investigations are necessary to clarify how complexity of aspect-oriented programs depends on the internal structure of the code. The software complexity metric is becoming an extremely important part of the software engineering. And more work is required in this field in the future. In future an integrated approach to measure the software complexity is needed.
REFERENCES
[1] E. Brito, F. Abreu, W. Melo, ―Evaluating the impact of
Object-Oriented Design on Software Quality,‖Proceedings of 3rd
International Metric Symposium, 90-99, 1996.
[2] G. K. Gill and C. F. Kemerer, 1991, ―Cyclomatic complexity
density and software maintenance productivity,‖ IEEE
Transactions on Software Engineering, Vol. 17, No.12, pp. 1284–
1288,1991.
[3] Halstead, M.H., Elements of Software Science, Elsevier North,
New York, 1977.
[4] IEEE Computer Society: IEEE Standard Glossary of Software
Engineering Terminology, IEEE Standard 610.12 – 1990, IEEE.
[5] J. C. Munson and T. M. Khoshgoftaar, ―The detection of
fault-prone programs,‖ IEEE Transactions on Software
Engineering, Vol. 18, No. 5, pp. 423–433,1992.
[6] McCabe, T.H., ―A Complexity Measure‖, IEEE Transaction on
Software Engineering, SE – 2, 6, pp. 308 – 320, 1976.
[7] Misra,S and Misra,A.K. ,―Evaluating Cognitive Complexity
measure with Weyuker Properties,‖
[8] Proceeding of the3rd
IEEE International Conference on Cognitive
Informatics, 2004.
[9] M. Marchesi,―OOA metrics for the United Modeling Languages,‖
Proceedings of 2nd Euromicro Conference on Software
Maintenance and Reengineering, Palazzo degli Affari, Italy, 67-73,
1998.
[10] M. Genero, M.E. Manso, M. Piattini, et al,―Early metrics for object
oriented information systems,‖ Proceedings of 6th International
Conference on Object Oriented Information Systems, London,
UK, 414-425,2000.
[11] M. R. Woodward, M. A. Hennell and D. A. Hedley, ―A measure of
control flow complexity in program text,‖ IEEE Transactions on
Software Engineering, Vol. 5, No. 1, pp. 45–50,1979.
[12] R. D. Banker, M. D. Srikant, C. F. Kemerer, and D. Zweig,
―Software complexity and maintenance cost,‖ Communications of
the ACM, Vol. 36, No. 11, pp. 81–94, 1993.
[13] R. Subramanyam &M. S. Krishnan, ―Empirical analysis of CK
metrics for object-oriented design complexity: Implications for
software defects,‖ IEEE Transactions on Software Engineering,
Vol. 29, No. 4, pp. 297–310, 2003.

Harmeet Kaur et.al. International Journal of Engineering and Applied Computer Science (IJEACS)
Volume: 01, Issue: 01, November 2016 ISBN: 978-0-9957075-0-4
www.ijeacs.com 16
[14] S. Chidamber, C. Kemerer, ―A Metrics Suite for Object Oriented
Design,‖ IEEE Transactions on Software Engineering, 20(6),
476-493, 1994.
[15] Sheng, Yu., Shijie, Zh.,"A survey on metric of software
complexity,"2nd IEEE International Conference on Information
Management and Engineering, pp.352-356,2010.
[16] Tian, J., and Zelkowitz, M. V, ―Complexity Measure Evaluation
and Selection,‖IEEE Transactions on Software Engineering, vol.
21, No. 8: 641—650, 1995.
[17] T. Menzies, J. Greenwald and A. Frank, ―Data mining static code
attributes to learn defect predictors,‖ IEEE Transactions on
Software Engineering, Vol. 33, No. 1, 2–13, 2007.
[18] Tuomas Klemola and Juergen Rilling, ―A Cognitive Complexity
Metric Based on Category Learning,‖ IEEE International
Conference on Cognitive Informatics, 2003.
[19] V. Basili and A. Turner, "Iterative Enhancement: A Practical
Technique for Software Development," IEEE Trans. Software
Eng., Vol. SE-I, pp. 390-396, 1975.
[20] Wang, Y., and Shao, J, ―Measurement of the Cognitive Functional
Complexity of Software,‖ IEEE International Conference on
Cognitive Informatics, 2003.
[21] Zuse, H, ―Criteria for Program Comprehension Derived from
Software Complexity Metrics,‖ Proceedings of the Second
International Workshop on Software Comprehension, IEEE,
Capri/Italy: 8—16, 1993
AUTHOR PROFILE
Harmeet Kaur has seven years of experience in academic and research, she is currently pursuing
Ph.D. in Computer Applications from Punjab Technical University, Jalandhar, India; after
completing two years Master of Technology (I.T.) degree in year 2011; three years Master of Computer
Applications (M.C.A.) degree in year 2008; she had the recipient of UNDP scholarship to conduct high
quality research, is member of IEEE and has qualified National Eligibility Test (NET) conducted
for lectureship. Presently she is working as Assistant Professor of Software Engineering in Green Hills Engineering College, Solan (HP). She has
published three research articles; her area of research includes Program Analysis, Software Reengineering and Quality Assurance.
Prof. (Dr.) Govinder N. Verma has more than
twenty years of wide experience in research, academics and administration, held various positions
as Director, Professor, lecturer in universities and engineering colleges after completion of Ph.D. in
Fluid Mechanics from Himachal Pradesh University, Shimla, with excellent grade; he has completed
M.Phil, M.Sc., B.Sc. in Applied Mathematics all in first division from Himachal Pradesh University,
Shimla; he has published five research papers in reputed journals and supervising Ph.D. thesis; currently he is designated as Professor and Head of
Department of Applied Science of Shri Sukhmani Institute of Engineering and Technology, Derabassi, affiliated to Punjab, Technical University,
Jalandhar, India.
© 2016 by the author(s); licensee Empirical Research Press Ltd. United Kingdom. This is an open access
article distributed under the terms and conditions of the Creative Commons by Attribution (CC-BY) license. (http://creativecommons.org/licenses/by/4.0/).
International Journal of Engineering and Applied Computer Science (IJEACS)
Volume: 01, Issue: 01, November 2016 ISBN: 978-0-9957075-0-4
www.ijeacs.com 17
Program Comprehension and Analysis
Asfa Praveen
Dept. of Computer Science
Shri Venkateshwara University, Gajraula
Amroha, U.P., India.
Abstract - Due to continuous change in business requirements and
to implement proactive, adaptive maintenance procedures in
application program; it is required to evolve application program
time to time. Program comprehension is a process of program
understanding and reverse engineering, which supports the
analyst to easily undertake the program for further
reengineering. This paper highlights the program elements,
components, its analytical solutions for understanding,
comprehensions and extension.
Keywords- component; wrapper; comprehesion; application; code.
I. INTRODUCTION
Program comprehension process uses the term component to denote the various elements needed to develop a program. Comprehension is a process of analyzing program components and reverse engineering. Analyze data are recorded in knowledge base. To better comprehend the program, it is core issue to find the elements of program which mostly depends on perspective of understanding and investigation. Subject of concern is to investigate the candidate program, identify program elements, slice it and fed them in to a knowledge base. This knowledge base can be further managed to find the information of program for comprehension purpose. The effectiveness of method depends on program under study, its logic, structure, programming language used, problem solution implementation mechanism, what program does and how the program does. Program comprehension process is a highly cognitive task; conceptual knowledge based on human cognitive efficiency can’t be overlooked. Analyst must understand the program structure, flow and environment.
Comprehension process [1] also based on objects identification, class investigation, study of components formation process, elements interactions and flow control. Program elements also include database descriptors, program specification blocks, screens, file definitions and message formatting services. These also represent the components associated with system-level understanding.
II. PROGRAM AND ITS RELATIONSHIP LAYER
Program comprehension layers can be categorized as:
1) Program elements and their relationships
2) Program control, data flow and business modules
3) Program process flows and business rules
In the process of program comprehension, analyst identifies
a) Unknown elements
b) Unknown relationships The various levels of comprehension identify all level of
relationships with application interfaces, this is significant when existing software is needed to be reengineered or subjected to migration towards wrapping technologies. It also establishes the migration opportunities to updating software. This stage of comprehension needs identifying the relationship among program elements. In homogeneous system architecture, identifying and analyzing this type of relationship is easy to obtain and record, while in heterogeneous program, it is very tedious task.
Next step for the comprehension process is to study about control flow, data description, data flow, business logics and modular structure; integration of components and program code. With the analysis of program code and connection of relationships the understanding of control and data elements will take place. This maturity of comprehension is important to develop a big understanding level of program elements integration and deployment. This is also useful when existing systems incorporate new components through wrapping.
Process flows investigation propagates to write line by line description of code components, inner process flow and business rules integration. Modifications in the program code which have occurred time to time generally increases the level of complexity of comprehension and reduce understandability level [2]. Syntax, semantics and statement logic organization are necessary to analyze and document to find a relationship with domain of program classification.
III. PROGRAM COMPLEXITY
75-80% of total software cost dedicated to maintenance and reengineering in a software life time. 40-60% of total reengineering and maintenance effort spent for program comprehension process. Program complexity plays a major role in comprehension of candidate program. The discipline of software measurements has analyzed the levels of complexity with many specified software and conceptual tools such as cyclomatic complexity.

Asfa Praveen (IJEACS) International Journal of Engineering and Applied Computer Science
Volume: 01, Issue: 01, November 2016 ISBN: 978-0-9957075-0-4
www.ijeacs.com 18
Cyclomatic complexity represents the number of independent paths through a program. The Software Engineering Institute (SEI) provides the following range for identifying complex programs and associated risks.
TABLE I. COMPLEXITY EVALUATION
(Source: SEI CMU)
This Program comprehension has become more complex
process when it is needed to analyze business rules and
migration to new technologies. Study of program, its level of
effort, which is needed for comprehension study, is facilitated
by cyclomatic complexity analysis. Cyclomatic complexity
results play crucial role in program study and understanding
process.
IV. MAJOR PROGRAM ELEMENTS
In the abstract level program analysis procedure focuses on the following three major elements of application structure.
a) Program presentation
b) Program logic
c) Program data and flow Above mentioned elements are very helpful in identifying
business process and analysis of rules in candidate application program. Program logic is a cognitive entity which has high level of abstraction of data, control flow and application integration [3]. Other graphical user interface extension capabilities allow more pleasant and accessible performance for many initiatives. Separating the performance logic allows the various initiatives to increase the complexity of their integration capabilities with other program elements. Further separation of business logic compromises the probability for assessment of integrated elements [4] which can be reused during program integration initiatives. It is assumed that understanding the data is not considered as a part of comprehension study but it is required because of data flow and file management [5]. Because of many strict causes data needs profiling, which is a task of filtering and summarizing. Renovation phases need many stages to cover to comprehend code elements. The following headings explain the level of comprehension required for each stage [6].
A. Extensions
Program comprehension process improves with help of component extension approach. Extension if properly documented and implemented with existing program can give a better realization of program defects. Front and back end of database applications need extensions time to time when evolution is required for business rule applications.
B. Integration
Current application and program comprehension knowledge at most level of initiatives are not adequate to apply the increased levels of system evolution. Whether determined by application integration requirements, analysis for program elements replacement activities for identifying wrappers and integration to migrate system program. There is a strong comprehension of application data flow and control analysis is needed for proper logical understanding of element integration.
C. Vendors Trends
Many vendors take application integration initiative to compete the demands of new business objectives. Vendors adopt the generic technologies and multidisciplinary initiatives as some distributed application program integration process need some Java involvements. Comprehension of flows, interface and logics and relationships in old technologies and databases need advanced tools. Vendors trends changes according to development process and practices affects the comprehension and differs the practices.
D. Restructuring
Restructuring of programs is studied to assess interfaces, program insulation from its surroundings, isolation of individual functions from each other, and what are prevented undesired side-effects. Extracting knowledge from program requires practically structured code [7]. Program rationality is hard to measure without objective software metrics. Extraction process uses these metrics to control the extremes and implementation of complex system application. It reduces the cost of reengineering by dropping the program complexity.
For programs with high-complexity metrics, analysis proposes to wrap them in the same condition in spite of extracting them for reusability. Much research effort has been applied into considering the basis of extracting elements or developing wrappers. Covering the presentation layer with business logic and data steering logic originates most analysts to keep away from restructuring the consequences of scenarios. The previous research returns the results with programs or well-structured code understanding. Start with user interface and go to the code base. Analyze sequence and state diagram of application. Need to comprehend the following elements of restructuring for reengineering.
a) Class inheritance
b) Control Flow tree
c) Form show tree
d) External class metric
Cylcomatic
Complexity
Risk Evaluation
1 – 10
Simple program which don’t have so much risk
11 – 20
This is more complex program which has moderate
risk level
21 – 50
This is a complex program with high risk
> 50
This is an un-testable program with very high level of
risk
Asfa Praveen (IJEACS) International Journal of Engineering and Applied Computer Science
Volume: 01, Issue: 01, November 2016 ISBN: 978-0-9957075-0-4
www.ijeacs.com 19
V. ANALYTICAL SOLUTIONS
A. System Extensions
System needs to be extended for users those who are external to the organization want to access the system and associated program application; these are categorized as untraditional users. It has been become very difficult to study the character-based data and covert them to more meaningful form. There are some needs to convert a character based interface to visual interface, which has changed variety of sources of business information which need to being made available outside traditional channels. These business process changes possibilities have changed the flow of work and data control; this has become to a source to study further future changes in program [8]. Hyper Text Markup Language based documents based presentation has not limitations which can be presented using data streams application programming interface. If it is required to update existing system in a new ways program and surrounding analysis is needed for systems modifications. Software wrappers can support up to some extents but do not fulfill all demands in all perspectives.
B. Wrappers
Several types of software wrappers are available which can be integrated to application and program, which is a depiction of the process but not the data. Object oriented methods are extended with wrappers to use the existing procedural. These wrappers generate a fulfillment of gap between traditional procedural programs and Object Oriented methods. Procedural programs are purposed to perform some action to solve some particular problem such as processing of database queries. The actions on data are in procedural order. The wrapper exists to hide one method from other code in action. This is done in n-tier architecture to apply separation of concerns. It is accepted widely, program logic represent data to the traditional user, who should not have to check that from where the data is coming and similarly program code who retrieving the data should not care what is the display of this. Wrappers support for some specific features as some tile language does not provide the multiple inheritance but it can be simulated with the help of wrappers.
C. Black-Box Method
Extending the business logic needs the use of analysis or code comprehension tools and summary of reports [9]. The efficacy of a comprehension capability depends on the ease with which the analysis has been performed. Batch and concurrent processes, database transactions, application programs or even methods subroutines can be analyzed for reengineering towards new applications. These approaches minimize the efforts of understanding needed. This reduces internal complexity of comprehension which is time consuming process.
D. White Box Method
Analyst can understand the leveraging of business rules of existing program, but needs to remove from the limitations of
the program surrounding. Migration existing business rules and functionalities to new platform requires the understanding with wrapping and comprehension to program translation. Further translation requires the program concepts identification, understanding business functions, rules with identifying the data items. This identification is critical to program redefinition. This method of white box approach is performed for detailed level of understanding, reusable components.
E. Performance and Scalability
The transaction analysis solutions must communicate a session to program interaction. Many results may limit scalability to manage a dynamic session’s management for always changing source information and interactions. Other than this the solutions must provide clustering and load balancing capabilities for new application to adapt the new demands and growing new extensions in services.
F. Solution for Data ExtensionUnderstanding and Recovery
Data integration analysis is a problem of assortment such as variety of data sources and uses types. Data analysis tools can be applied to separate the data source from interface, backend and application layers and the client interface layer from the integration of transaction server. This enables enhanced growth in analysis of data sources and clients implementations. The main data sources are virtual machine, recovery files, transactional servers, extension applications, component objects, query processers source optimizers. Various analysis technologies allow the understanding of used data models in the all layers of file management systems. These models can be converted into logical models for further analysis and extension, solution of end term extension of application and program slicing. Many analyst uses a set of data implementation allows the extended use of the actual data for either server reporting or for transporting of data to new application migration.
G. Transaction Anslysis
Extracting information from repository which usually created after analysis is very useful for knowledge base development. Migrating from straightforward interactions of program with candidate application is done by this procedure. This requires more programmatic analysis to ensure integrity of objects. Software analysis enables existing business rule logic to be reused and unchanged functionality. The program interface business logic mainly requires modification to support input validation parameters. Analytical input requirements are major concerns for reengineering when using advanced programming tools develop wrapping solutions. Information systems analysts are experienced to enable increased use of traditional systems components for reuse to new environments. Enlarged complexity by duplicate business logic and maintenance of data inconsistencies become difficult to manage for post analysis procedures.
Program can be observed as the point of integration rather than simply as a means of accessing data using traditional
Asfa Praveen (IJEACS) International Journal of Engineering and Applied Computer Science
Volume: 01, Issue: 01, November 2016 ISBN: 978-0-9957075-0-4
www.ijeacs.com 20
transactional programs. Analysis procedures have to evolve for transaction server to enable connectivity of lost data identification. In order for the comprehension to get complete use of evolved capabilities of leveraging candidate programs, it must isolate communication logic from the outstanding business logic for ease of implementation. Most analysts have opted to delay this procedure to use the existing logic as a program implementation. The continuing evolution of analysis procedures results for possibilities of technology and business logic should change at specific layer of concern. The loss of control of the flows changes the demands on this program analysis effort for migration. While many tools application offer more refined integration of knowledge to repository but this is not manual tracking solution.
H. Program Analysis Issues
Procedure of program analysis is for automatic extraction of useful information from program and supply for further extraction for knowledge generation. Data and program control flow information are considered as major entity of observation to understand the sequence of action. Some of the major issues are:
a) Session establishment management
b) Performance and scalability
c) Control building
I. Sessions Establishment Management
One of the technical problems related with application analysis solutions is to find out the differences between the session-based management of applications and the session-less management for networked program [10]. The transaction analysis solution must assure session establishment to client program and interactions, to maintain the integrity of the data, application, and sessions.
J. Control Building
Analysis procedure implements methods through a more traditional ways to call for existing procedural program encapsulation and control integrity. Comprehension depending on the current implementation of the program design and logical framework, reengineering the interface may be applied for that. Program modules are mostly easiest to track the flow of control, or encapsulate, because they are probably designed to independent connected modules. Encapsulating program modules is the most difficult, because it normally needs restructuring of existing program to enable external procedures to be internally incorporation with suitable parameters
The following guidelines should follow in building control:
a) Object oriented analysis and implementation should separate the data only to the methods that use them.
b) Program slicing tools are required to extract business logic. Object identification is not clear from procedural implementation.
c) Unstructured code must be corrected, to separate, code slice with methods.
d) Naming validation is essential for more strong association with attributes and methods.
e) Reengineering of complete application should not solve the issue but need to connect the entities with procedural framework as defined in control flow.
f) Deadlock need to be identified and removed from program code structure and execution flow.
g) Traditional procedural programs control in many cases uses the same flow in the same field for different code segments, which results in different methods of analysis. These field usage problems need to be understood to enable proper separation of concern.
VI. CONCLUSION
Program analysis is an important and useful task for program comprehension. Wrapper provides useful extensions to the existing capabilities of the program for functionality enhancement. Program comprehension is a necessary and significant requirement; if the document of application is not available at that time the comprehension procedures are very useful to draw program control and logic design. This paper has presented some useful methods and solutions for program comprehension and elements analysis.
REFERENCES
[1] A. S. Alardawi and A. M. Agil, "Novice comprehension of Object-
Oriented OO programs: An empirical study," 2015 World Congress on Information Technology and Computer Applications (WCITCA),
Hammamet, 2015, pp. 1-4. doi: 10.1109/WCITCA.2015.7367057
[2] A. Shargabi, S. A. Aljunid, M. Annamalai, S. Mohamed Shuhidan and
A. Mohd Zin, "Program comprehension levels of abstraction for novices," 2015 International Conference on Computer,
Communications, and Control Technology (I4CT), Kuching, 2015, pp. 211-215.
doi: 10.1109/I4CT.2015.7219568
[3] T. Roehm, "Two User Perspectives in Program Comprehension: End Users and Developer Users," 2015 IEEE 23rd International Conference
on Program Comprehension, Florence, 2015, pp. 129-139. doi: 10.1109/ICPC.2015.22
[4] F. Fittkau, S. Finke, W. Hasselbring and J. Waller, "Comparing Trace Visualizations for Program Comprehension through Controlled
Experiments," 2015 IEEE 23rd International Conference on Program Comprehension, Florence, 2015, pp. 266-276.
doi: 10.1109/ICPC.2015.37
[5] I. d. M. Lessa, G. d. F. Carneiro, M. J. T. P. Monteiro and F. B. e. Abreu, "A Multiple View Interactive Environment to Support MATLAB
and GNU/Octave Program Comprehension," Information Technology - New Generations (ITNG), 2015 12th International Conference on, Las
Vegas, NV, 2015, pp. 552-557. doi: 10.1109/ITNG.2015.93
[6] A. Shargabi, S. A. Aljunid, M. Annamalai, S. M. Shuhidan and A. M. Zin,
"Tasks that can improve novices' program comprehension," 2015 IEEE Conference on e-Learning, e-Management and e-Services (IC3e),
Melaka, 2015, pp. 32-37. doi: 10.1109/IC3e.2015.7403482
[7] R. Kadar, S. M. Syed-Mohamad and N. Abdul Rashid, "Semantic-based
extraction approach for generating source code summary towards program comprehension," 2015 9th Malaysian Software Engineering

Asfa Praveen (IJEACS) International Journal of Engineering and Applied Computer Science
Volume: 01, Issue: 01, November 2016 ISBN: 978-0-9957075-0-4
www.ijeacs.com 21
Conference (MySEC), Kuala Lumpur, 2015, pp. 129-134.
doi: 10.1109/MySEC.2015.7475208
[8] X. Liu, X. Sun, B. Li and J. Zhu, "PFN: A novel program feature network for program comprehension," Computer and Information Science
(ICIS), 2014 IEEE/ACIS 13th International Conference on, Taiyuan, 2014, pp. 349-354.
doi: 10.1109/ICIS.2014.6912158
[9] Y. Liu, X. Sun, X. Liu and Y. Li, "Supporting program comprehension with program summarization," Computer and Information Science
(ICIS), 2014 IEEE/ACIS 13th International Conference on, Taiyuan, 2014, pp. 363-368.
doi: 10.1109/ICIS.2014.6912159
[10] N. Saroni, S. A. Aljunid, S. M. Shuhidan and A. Shargabi, "An empirical study on program comprehension task classification of novices," 2015
IEEE Conference on e-Learning, e-Management and e-Services (IC3e), Melaka, 2015, pp. 15-20.
doi: 10.1109/IC3e.2015.7403479
© 2016 by the author(s); licensee Empirical Research Press Ltd. United Kingdom. This is an open access article distributed under the terms and conditions of the Creative Commons by Attribution (CC-BY) license. (http://creativecommons.org/licenses/by/4.0/).

International Journal of Engineering and Applied Computer Science (IJEACS)
Volume: 01, Issue: 01, November 2016 ISBN: 978-0-9957075-0-4
www.ijeacs.com 22
Abstract-Sign languages use visual pattern to communicate
rather than acoustic patterns that are communication mode in
verbal communication. Sign languages being the most
structured form of gestures can be considered as the benchmark
for systems of gesture recognition. SLR has got its applicability
in the areas of appliances control, robot control, interactive
learning, industrial machine control, virtual reality, games,
simulations etc. apart from its significance for hearing impaired
community. The paper aims to present a systematic, robust,
reliable, and consistent system for static Pakistani Sign
Language (PSL) recognition. The paper is based on empirical
evaluation of different classification techniques for SLR. This
pragmatic approach leads to a Fuzzy Model (FM) that has
shown very high accuracy rate for PSL recognition. Sign
languages have inherent uncertainty, so SLR systems demand a
classification method that give due consideration to this aspect
of uncertainty. This is the reason for selecting fuzzy inference
for the proposed SLR system and experimental analysis has
proven its suitability for SLR. The meticulous statistical analysis
performed for proposed PSL-FM has shown very promising results.
Keywords-pattern recognition;fuzzy classifier; sign language;
classification.
I. INTRODUCTION
The increasing technological developments and advancements in the world of machines are leading to more and more demanding users. Human beings want machines to interact with them in more natural way. The users of the machine wish to have an interaction with machine in the same pattern as they have with their fellow beings. With every progressing day, machines are becoming part of human life, more and more. This intermingling of machines and human is asking for removing the barriers in the communication channels between human and machines and hence researchers are having their focus to make this channel as natural as possible. Human needs speech and gestures to communicate and same is the communication requirements from machines. So these human like modes of communication should be equipped into the machines. The domain of speech as mode of communication is well researched but gestures as mode of human-machine communication still have a lot of room for
research. Another motivation behind research in the domain of gesture recognition is the opening of new aspects of communication for the hearing impaired people. For deaf community, Sign Language (SL) as a kind of gestures is the primary communication media. Sign language is considered to be the most structured form of gestures. There are millions of deaf people around the world, who are using sign language for accessing and exchanging information. This is the reason that in recent years, SLR is in focus and researchers came up with variety of solutions. Sign language is the language of visual gestures that are mainly used as a communication tool for deaf community. Sign languages use visual pattern that are used to communicate rather than acoustic patterns that are used in verbal communication. Being most structured form of gestures, Sign language can be taken as benchmark for gesture recognition system. There are many communities in the world, because of having high number of deaf people; the whole community is using gestures instead of verbal communication. Some examples of such communities are Martha's Vineyard Sign Language (USA), Kata Kolok (Bali), Adamorobe Sign Language (Ghana) and Yucatec Maya sign language (Mexico) [15].
Sign languages, just like acoustic languages, have got vast variety. SLs have got diversity in the base language and then these base languages have variety in dialects. Different countries have different signlanguages and then there exist difference of dialects in different regions of same country. Generally, automated SL recognition (SLR) is performed in following phases: image acquisition, gesture segmentation, feature acquisition and classification.
Signer‟s image is provided as input to Sign Language Recognition system. This input image is then passed onto the segmentation module that segments out the region of interest i.e. hands, face, arm or may be foot, depending upon the scope of the recognition system. This segmented image is then goes for the feature acquisition module. This module extracts required features for the classification. Classification module receives the extracted features andapplies some classification algorithm to give the results of the recognized sign as output.
SL is not internationally uniform; rather it varies from country to county and region to region. Researchers have proposed different SLR systems for different SLs. Some languages are more in focus by researchers such as Chinese
Fuzzy Model for Parameterized Sign Language
Sumaira Kausar
Department of Computer Science
BahriaUniversity, Islamabad
Pakistan
Samabia Tehsin
Department of Computer Science
Bahria University, Islamabad
Pakistan
M. Younus Javed
HiTec University, HIT Taxila
Pakistan
SumairaKausaret.al. International Journal of Engineering and Applied Computer Science (IJEACS)
Volume: 01, Issue: 01, November 2016 ISBN: 978-0-9957075-0-4
www.ijeacs.com 23
Sign Language CSL [22,23,24], American Sign Language ASL [19,20,1,2] and Arabic Sign Language ArSL[25,26,27,28]. Unfortunately, Pakistani Sign Language (PSL) could not get its due share in this SLR development. kausar and et. al. [8] has proposed a fuzzy classifier using colored gloves for PSL alphabets recognition. Khalid and et. Al [16] has made use of data gloves for the recognition of static one handed PSL alphabets. There are approximately nine million people (5% of total Pakistani population) in Pakistan with hearing impairments [14] and out of these 1.5 million are deaf [14]. Pakistani Sign Language (PSL) is a visual-gestural language, it is a blend of Urdu(national language of Pakistan), and some regional languages. Less than ten thousand Pakistani deaf have attended school [14] because the information exchange methods prevailing in the schools are not sufficiently fulfilling their needs. Bringing PSL in modern technologies using SLR can improve the lives of deaf community in many aspects. SLR is a complex domain and has many inherent challenges with respect to region of interest segmentation, signer‟s environment, descriptor‟s invariance, sign articulation, variation in sign dictionary, selection and extraction of representative sign descriptors, correct, efficient and reliable classification.
The paper presents a reliable and efficient method for PSLR. The proposed method uses static one-handed signs. Classification method is the main contribution of the paper,
II. RELATED WORK
The domain of sign language recognition can be used as benchmark in many other gesture recognition systems. This diverse applicability of the domain has compelled the focus of many researchers towards it. This focus has led to the immense and valuable contribution.
Multiple cameras have been used by Elons et al. [5] and Dreuw et al. [1] for recognition of SL. Two different viewing angles have been utilized by Elons et al. to generate image features using pulse coupled neural network for recognition of American Sign Language. Special angle setting is required for mounting cameras to get 3 dimensional features. So system requires multiple cameras and complex angle adjustments for accurate recognition. Priyal et al. have utilized Krawtchouk moment features for recognition of static hand sign [9] with a claim of signer independence and incorporation of camera angle variation. Li. et al. have recognized Chinese sign language using portable accelerometer and surface electromyography sensors [3]. High accuracy rates are claimed using hand shape, movement and orientation. Data gloves have been used byShijian et al. [10] and Tan et al. [11] for SLR. Data gloves raise the accuracy rate but system‟s dependence on external gadgetry is not appreciated and accepted widely. Colored and marked gloves have been used by Akmeliawati [12] and kausar et al. [13 for SLR. Prime points of hand are marked with special colors; this marking has made the recognition easier. The size of dictionary of signs for SLR systems is quite small in many cases. Al-Alali et al. [6] proposed a system for only four signs. Wassnerr et al. developed a system that was for recognition of only two French signs. Zafrullah et al. [2] have proposed American Sign
Language recognition system to recognize only six signs. Ershaed et al. [6], Brashear et al. [2], Xing et al. [4] and Helen et al.[13] have recognized SL by utilizing depth cameras. The depth cameras are quite costly.
This section has presented few contributions in SLR domain. It is observed that different proposed methods have their own strengths and weaknesses. The proposed method has undertaken all these weaknesses of SLR systems into consideration and tried to reduce these significantly in the proposed system.
III. METHODOLOGY
The paper presents PSL recognition system using a novel method. Signer‟s image is provided as input to the system. This input image then processed by the segmentation module. The segmentation module segments the signer‟s hand. The segmented hand is then transformed into one dimensional signature. This signature is then parameterized to obtain polynomial coefficients. These polynomial coefficients are then fed into the fuzzy classifier as feature vector. Classifier then classifies the sign and displays the output. Rest of the paper is providing the details of these modules.
System initiates with the input image of signer. The image frame only has one hand. Signer has to wear full sleeves shirt. Signer‟s background should be non-occluded. These constraints make the segmentation process, simple and accurate. The system does not require expensive and cumbersome external gadgetry for input; rather it purely relies on visual input. Ordinary 2-D camera is used for image capture; range cameras have associated barriers of computational complexity, cost, and special experimental environment. The proposed image capturing makes the system, cost effective and more adoptable. The captured signer image is then passed to the segmentation module. K-means clustering is used for the segmentation of hand. K-means clustering is used to segment out skin color pixels from the background. To improve the segmentation, morphological operations are performed on the segmented hand. The output of the segmentation module is the binary image of the signer‟s hand. This binary hand image is then further processed for extraction of sign descriptor.
A. Sign Descriptors
After the conversion to binary image, the image is processed further for extraction of sign descriptors. Signature based features are used as descriptors. The descriptor used, is very robust and efficient. The descriptor set is quite compact but results are very promising. The binary image of hand is transformed into one dimensional shape signature. These signatures are then used to approximate the parameters of the signatures. Different types of parameterizations are experimented for PSL recognition. Gaussian, Polynomial, exponential and sine parameterization is applied on the shape signature. Different numbers of coefficients for each parametric class are tried out to check their appropriateness for SLR. These coefficients are then used as sign descriptor for classification. Polynomial parameterization gives the best
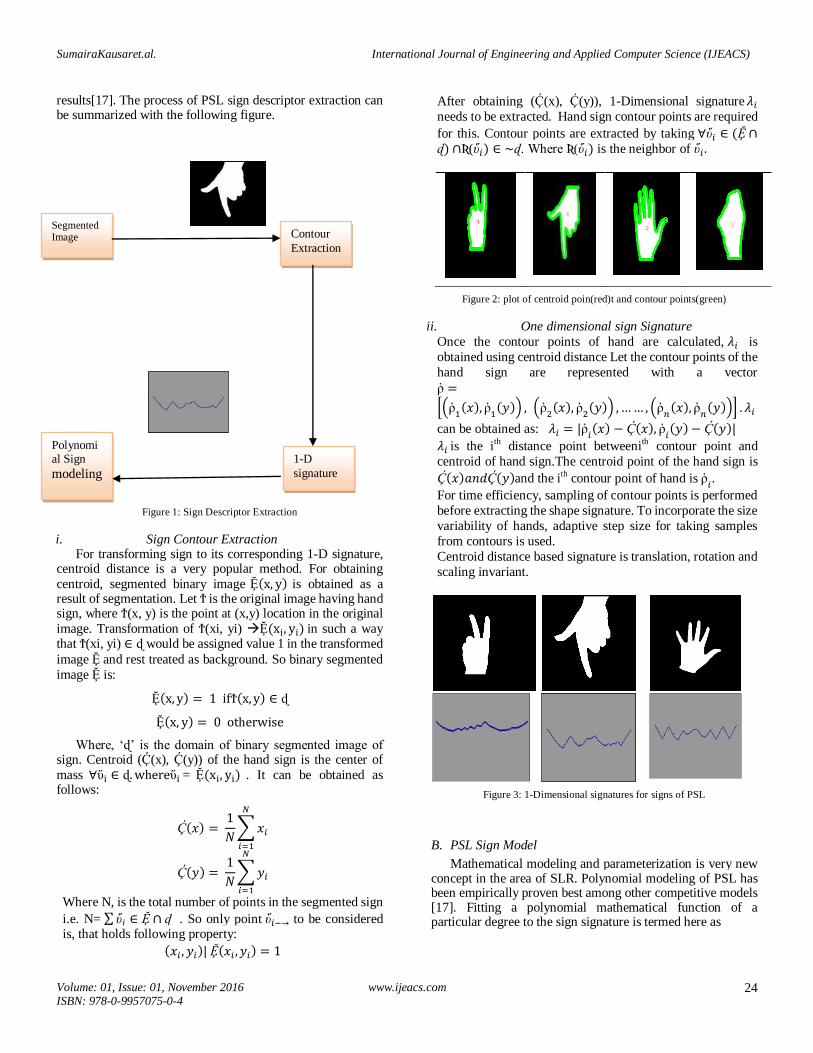
SumairaKausaret.al. International Journal of Engineering and Applied Computer Science (IJEACS)
Volume: 01, Issue: 01, November 2016 ISBN: 978-0-9957075-0-4
www.ijeacs.com 24
results[17]. The process of PSL sign descriptor extraction can be summarized with the following figure.
Figure 1: Sign Descriptor Extraction
i. Sign Contour Extraction For transforming sign to its corresponding 1-D signature,
centroid distance is a very popular method. For obtaining
centroid, segmented binary image ( ) is obtained as a result of segmentation. Let Ϯ is the original image having hand sign, where Ϯ(x, y) is the point at (x,y) location in the original
image. Transformation of Ϯ(xi, yi) ( ) in such a way that Ϯ(xi, yi) would be assigned value 1 in the transformed
image and rest treated as background. So binary segmented
image is:
( ) Ϯ( )
( ) h
Where, „ ‟ is the domain of binary segmented image of sign. Centroid (Ḉ(x), Ḉ(y)) of the hand sign is the center of
mass h = ( ) . It can be obtained as follows:
( )
∑
( )
∑
Where N, is the total number of points in the segmented sign
i.e. N= ∑ . So only point to be considered is, that holds following property:
( ) ( )
After obtaining (Ḉ(x), Ḉ(y)), 1-Dimensional signature needs to be extracted. Hand sign contour points are required
for this. Contour points are extracted by taking ( ) Ʀ( ) . Where Ʀ( ) is the neighbor of
Figure 2: plot of centroid poin(red)t and contour points(green)
ii. One dimensional sign Signature
Once the contour points of hand are calculated, is
obtained using centroid distance Let the contour points of the
hand sign are represented with a vector
*( ( )
( )) (
( )
( )) (
( )
( ))+
can be obtained as: ( ) ( )
( ) ( )
is the ith distance point betweenith contour point and
centroid of hand sign.The centroid point of the hand sign is
( ) ( )and the ith contour point of hand is .
For time efficiency, sampling of contour points is performed
before extracting the shape signature. To incorporate the size
variability of hands, adaptive step size for taking samples
from contours is used.
Centroid distance based signature is translation, rotation and
scaling invariant.
Figure 3: 1-Dimensional signatures for signs of PSL
B. PSL Sign Model
Mathematical modeling and parameterization is very new concept in the area of SLR. Polynomial modeling of PSL has been empirically proven best among other competitive models [17]. Fitting a polynomial mathematical function of a particular degree to the sign signature is termed here as
Segmented Image Contour
Extraction
1-D
signature
Polynomial Sign
modeling
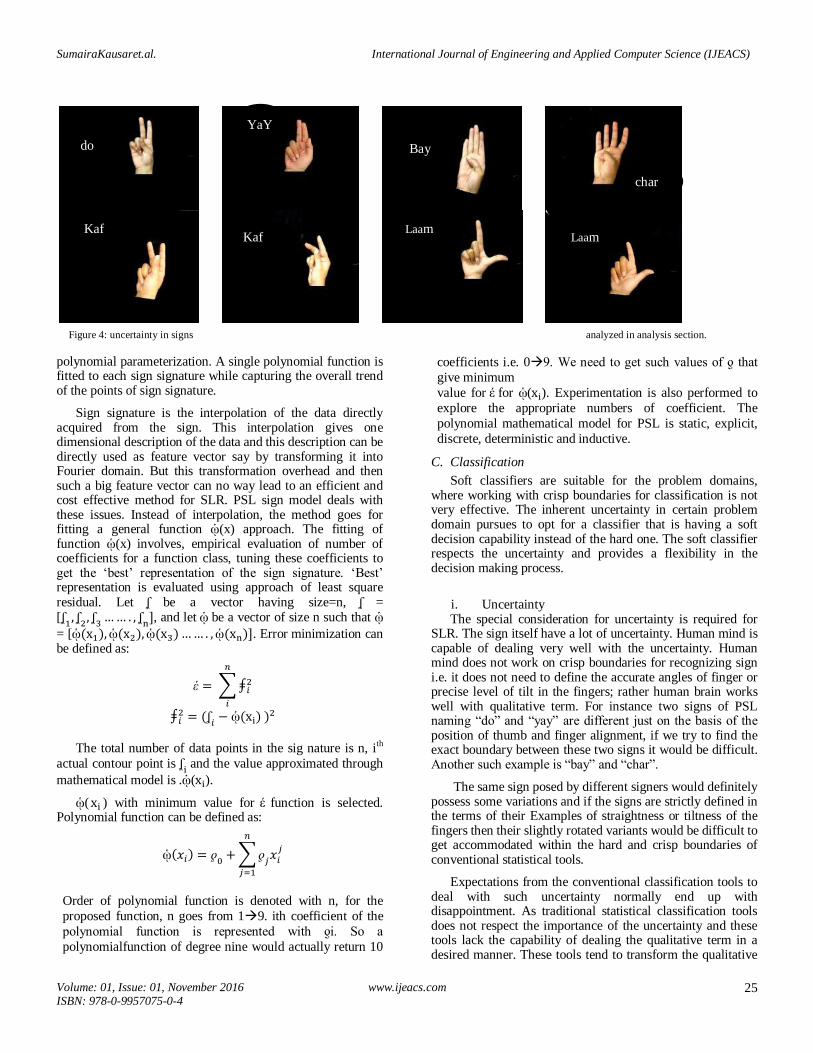
SumairaKausaret.al. International Journal of Engineering and Applied Computer Science (IJEACS)
Volume: 01, Issue: 01, November 2016 ISBN: 978-0-9957075-0-4
www.ijeacs.com 25
polynomial parameterization. A single polynomial function is fitted to each sign signature while capturing the overall trend of the points of sign signature.
Sign signature is the interpolation of the data directly acquired from the sign. This interpolation gives one dimensional description of the data and this description can be directly used as feature vector say by transforming it into Fourier domain. But this transformation overhead and then such a big feature vector can no way lead to an efficient and cost effective method for SLR. PSL sign model deals with these issues. Instead of interpolation, the method goes for fitting a general function ᾡ(x) approach. The fitting of function ᾡ(x) involves, empirical evaluation of number of coefficients for a function class, tuning these coefficients to get the „best‟ representation of the sign signature. „Best‟ representation is evaluated using approach of least square residual. Let be a vector having size=n, = [
, and let ᾡ be a vector of size n such that ᾡ
= [ᾡ( ) ᾡ( ) ᾡ( ) ᾡ( ) . Error minimization can be defined as:
∑
(
ᾡ( ) )
The total number of data points in the sig nature is n, ith
actual contour point is and the value approximated through
mathematical model is .ᾡ( ).
ᾡ( ) with minimum value for function is selected. Polynomial function can be defined as:
ᾡ( ) ∑
Order of polynomial function is denoted with n, for the
proposed function, n goes from 19. ith coefficient of the
polynomial function is represented with ƍi. So a
polynomialfunction of degree nine would actually return 10
coefficients i.e. 09. We need to get such values of ƍ that
give minimum
value for for ᾡ( ). Experimentation is also performed to
explore the appropriate numbers of coefficient. The
polynomial mathematical model for PSL is static, explicit,
discrete, deterministic and inductive.
C. Classification
Soft classifiers are suitable for the problem domains, where working with crisp boundaries for classification is not very effective. The inherent uncertainty in certain problem domain pursues to opt for a classifier that is having a soft decision capability instead of the hard one. The soft classifier respects the uncertainty and provides a flexibility in the decision making process.
i. Uncertainty The special consideration for uncertainty is required for
SLR. The sign itself have a lot of uncertainty. Human mind is capable of dealing very well with the uncertainty. Human mind does not work on crisp boundaries for recognizing sign i.e. it does not need to define the accurate angles of finger or precise level of tilt in the fingers; rather human brain works well with qualitative term. For instance two signs of PSL naming “do” and “yay” are different just on the basis of the position of thumb and finger alignment, if we try to find the exact boundary between these two signs it would be difficult. Another such example is “bay” and “char”.
The same sign posed by different signers would definitely possess some variations and if the signs are strictly defined in the terms of their Examples of straightness or tiltness of the fingers then their slightly rotated variants would be difficult to get accommodated within the hard and crisp boundaries of conventional statistical tools.
Expectations from the conventional classification tools to deal with such uncertainty normally end up with disappointment. As traditional statistical classification tools does not respect the importance of the uncertainty and these tools lack the capability of dealing the qualitative term in a desired manner. These tools tend to transform the qualitative
Figure 4: uncertainty in signs analyzed in analysis section.
do
YaY
Bay
char
Kaf Kaf
Laam Laam
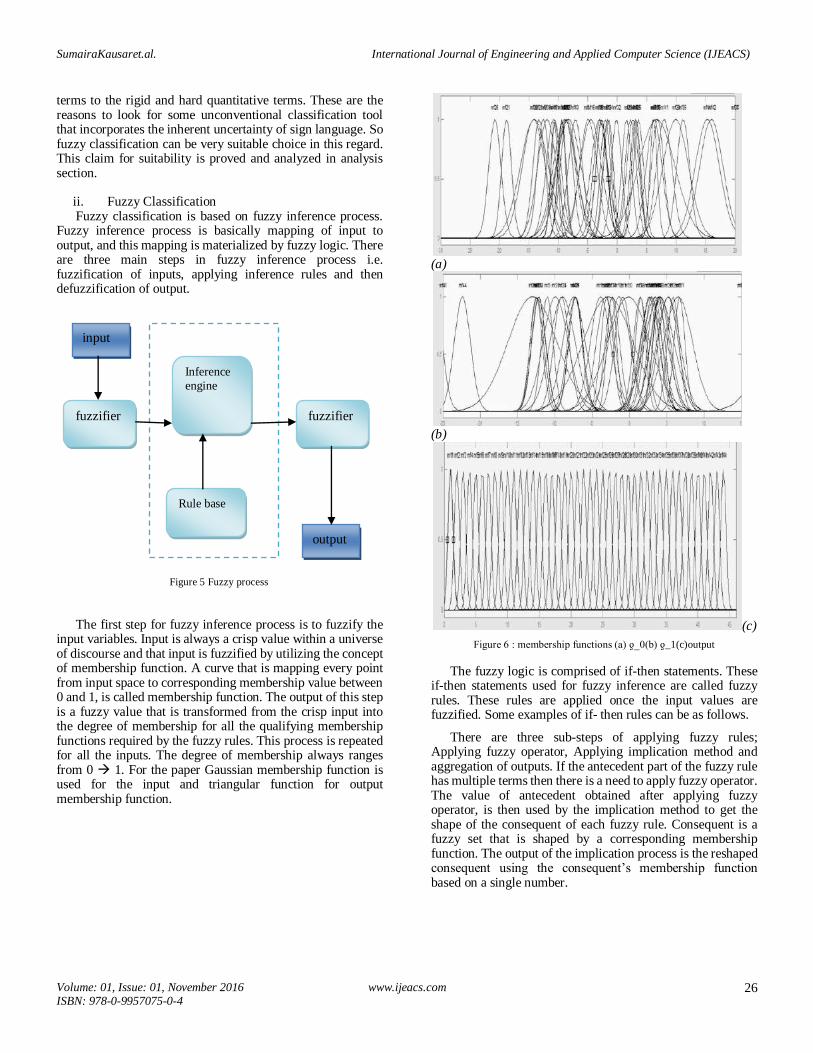
SumairaKausaret.al. International Journal of Engineering and Applied Computer Science (IJEACS)
Volume: 01, Issue: 01, November 2016 ISBN: 978-0-9957075-0-4
www.ijeacs.com 26
terms to the rigid and hard quantitative terms. These are the reasons to look for some unconventional classification tool that incorporates the inherent uncertainty of sign language. So fuzzy classification can be very suitable choice in this regard. This claim for suitability is proved and analyzed in analysis section.
ii. Fuzzy Classification Fuzzy classification is based on fuzzy inference process.
Fuzzy inference process is basically mapping of input to output, and this mapping is materialized by fuzzy logic. There are three main steps in fuzzy inference process i.e. fuzzification of inputs, applying inference rules and then defuzzification of output.
The first step for fuzzy inference process is to fuzzify the input variables. Input is always a crisp value within a universe of discourse and that input is fuzzified by utilizing the concept of membership function. A curve that is mapping every point from input space to corresponding membership value between 0 and 1, is called membership function. The output of this step is a fuzzy value that is transformed from the crisp input into the degree of membership for all the qualifying membership functions required by the fuzzy rules. This process is repeated for all the inputs. The degree of membership always ranges from 0 1. For the paper Gaussian membership function is used for the input and triangular function for output membership function.
(a)
(b)
(c)
Figure 6 : membership functions (a) ƍ_0(b) ƍ_1(c)output
The fuzzy logic is comprised of if-then statements. These if-then statements used for fuzzy inference are called fuzzy rules. These rules are applied once the input values are fuzzified. Some examples of if- then rules can be as follows.
There are three sub-steps of applying fuzzy rules; Applying fuzzy operator, Applying implication method and aggregation of outputs. If the antecedent part of the fuzzy rule has multiple terms then there is a need to apply fuzzy operator. The value of antecedent obtained after applying fuzzy operator, is then used by the implication method to get the shape of the consequent of each fuzzy rule. Consequent is a fuzzy set that is shaped by a corresponding membership function. The output of the implication process is the reshaped consequent using the consequent‟s membership function based on a single number.
fuzzifier
Inference
engine
fuzzifier
Rule base
input
output
Figure 5 Fuzzy process
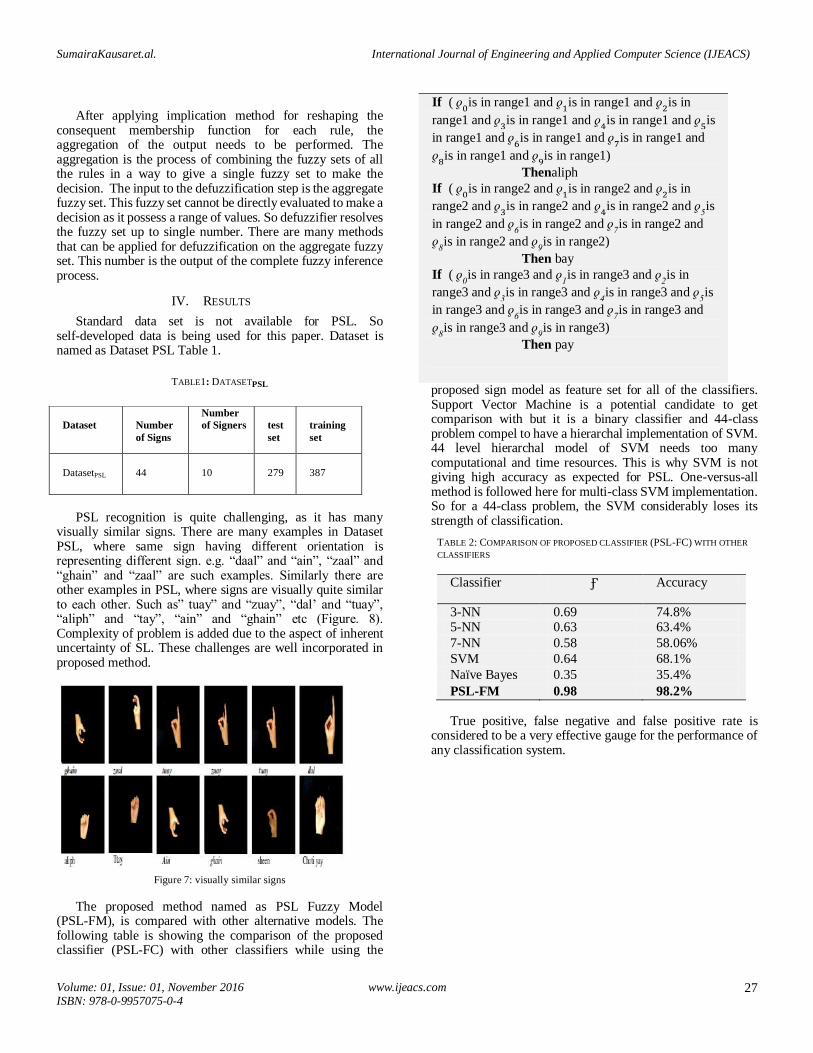
SumairaKausaret.al. International Journal of Engineering and Applied Computer Science (IJEACS)
Volume: 01, Issue: 01, November 2016 ISBN: 978-0-9957075-0-4
www.ijeacs.com 27
After applying implication method for reshaping the
consequent membership function for each rule, the aggregation of the output needs to be performed. The aggregation is the process of combining the fuzzy sets of all the rules in a way to give a single fuzzy set to make the decision. The input to the defuzzification step is the aggregate fuzzy set. This fuzzy set cannot be directly evaluated to make a decision as it possess a range of values. So defuzzifier resolves the fuzzy set up to single number. There are many methods that can be applied for defuzzification on the aggregate fuzzy set. This number is the output of the complete fuzzy inference process.
IV. RESULTS
Standard data set is not available for PSL. So self-developed data is being used for this paper. Dataset is named as Dataset PSL Table 1.
TABLE1: DATASETPSL
PSL recognition is quite challenging, as it has many
visually similar signs. There are many examples in Dataset PSL, where same sign having different orientation is representing different sign. e.g. “daal” and “ain”, “zaal” and “ghain” and “zaal” are such examples. Similarly there are other examples in PSL, where signs are visually quite similar to each other. Such as” tuay” and “zuay”, “dal‟ and “tuay”, “aliph” and “tay”, “ain” and “ghain” etc (Figure. 8). Complexity of problem is added due to the aspect of inherent uncertainty of SL. These challenges are well incorporated in proposed method.
Figure 7: visually similar signs
The proposed method named as PSL Fuzzy Model (PSL-FM), is compared with other alternative models. The following table is showing the comparison of the proposed classifier (PSL-FC) with other classifiers while using the
proposed sign model as feature set for all of the classifiers. Support Vector Machine is a potential candidate to get comparison with but it is a binary classifier and 44-class problem compel to have a hierarchal implementation of SVM. 44 level hierarchal model of SVM needs too many computational and time resources. This is why SVM is not giving high accuracy as expected for PSL. One-versus-all method is followed here for multi-class SVM implementation. So for a 44-class problem, the SVM considerably loses its strength of classification.
TABLE 2: COMPARISON OF PROPOSED CLASSIFIER (PSL-FC) WITH OTHER
CLASSIFIERS
Classifier Accuracy
3-NN 0.69 74.8% 5-NN 0.63 63.4%
7-NN 0.58 58.06%
SVM 0.64 68.1%
Naïve Bayes 0.35 35.4%
PSL-FM 0.98 98.2%
True positive, false negative and false positive rate is considered to be a very effective gauge for the performance of any classification system.
If ( is in range1 and
is in range1 and
is in
range1 and is in range1 and
is in range1 and
is
in range1 and is in range1 and
is in range1 and
is in range1 and
is in range1)
Thenaliph
If ( is in range2 and
is in range2 and
is in
range2 and is in range2 and
is in range2 and
is
in range2 and is in range2 and
is in range2 and
is in range2 and
is in range2)
Then bay
If ( is in range3 and
is in range3 and
is in
range3 and is in range3 and
is in range3 and
is
in range3 and is in range3 and
is in range3 and
is in range3 and
is in range3)
Then pay
D
Dataset
N
Number
of Signs
Number
of Signers
T
test
set
T
training
set
D
DatasetPSL
4
44
10
3
279
2
387

SumairaKausaret.al. International Journal of Engineering and Applied Computer Science (IJEACS)
Volume: 01, Issue: 01, November 2016 ISBN: 978-0-9957075-0-4
www.ijeacs.com 28
Figure 8: True positive and False Positive rate analysis
Recall and precision are established statistical analysis
measure. These are defined in terms of true positive and false
positive. Recall and precision defines F measure. F measure
is used to analyze the PSL-FM.
F= 2* (Precision * recall) / (Precision + recall)
Precision= true positive/ (true positive + false positive)
Recall= true positive/ (true positive + false negative)
Figure 9 shows the analysis of PSL-FM using recall,
precision and F measure for each sign of the dataset.The
Figure 10shows the comparative analysis of different PSL
recognition systems. The comparison reinforces the fact
about the high accuracy achievement of the proposed
system. The proposed system is developed for bigger dataset
as compared to the other PSL recognition systems;even then
its accuracy rate is much higher than others.
There is very small part of research contribution towards
the Pakistani sign language recognition system. Even after very exhaustive search for such publications, the above mentioned only four researches could be found. The proposed system is far better than these systems in term of accuracy and number of sign dictionary.
Figure 9: Recall precision and F measure analysis using Radar plot of
Dataset combined
Apart from accuracy analysis, Comparative time analysis is also performed for PSL-FM. This time analysis is just a way of comparing the time efficiency of different alternatives for PSL recognition. The proposed methodology does not involve any training so training time is zero. SVM is the most costly classifier in terms of training time as it needs training time once for the training set and once for the support vector training time. The recognition of a sign is also not taking considerable time. So not only the accuracy, the time efficiency of PSL-FM is also quite high if compared to other competitive techniques.
0
0.2
0.4
0.6
0.8
1
1.2
1 5 9 13 17 21 25 29 33 37 41
TP rate
FP rate
0
0.2
0.4
0.6
0.8
1Aliph
BayPayTayTtay
SayJeem
ChayHayKhayDalDdalZal
RayZay
YaySeen
SheenSuad
ZuadtuayzuayAin
GhainFayQafKaf
GafLaam
MeemNoon
WowHamza
CyayByay
AikDo
TeenCharPanch
ChaySaatAathNo
Recall
Precision
F-measure
TABLE3 COMPARATIVE ANALYSIS OF DIFFERENT PSL
RECOGNITION SYSTEMS WITH PROPOSED MODEL
Proposed By Methodology No. of
Signs
Accuracy
%
Yousaf et.al [] Neural Network
using data gloves
24 84%
Kausar et. al
[8]
Fuzzy Classifier
using geometric
features extracted
from color coded
gloves
35 92.1%
Alvi et al. [7] Statistical
Template
Matching using
data gloves
26 85%
Alvi et al. [7] Statistical
Template
Matching using
data gloves
33 69.1%
PSL-FM
(Proposed)
Fuzzy Classifier 44 98.2%
SumairaKausaret.al. International Journal of Engineering and Applied Computer Science (IJEACS)
Volume: 01, Issue: 01, November 2016 ISBN: 978-0-9957075-0-4
www.ijeacs.com 29
Figure 10: Time analysis of proposed model
The multi-aspect analysis of PSL-FM has shown that the proposed methodology has outperformed many other classification systems. The system can be considered as a framework that can get tailored for different gesture recognition systems.
V. CONCLUSION
The paper presents a signer-independent robust and efficient classification method for PSL. The proposed classification method can be used as sort of a framework that can get tuned for other sign languages by empirical analysis for readjustment of fuzzy rules. Parameterization of shape signatures as sign descriptor is presented. Main contribution of the paper is on classification module, fuzzy classifier is proposed. The paper is an effort to contribute in the services area for a special group of humanity i.e. Deaf society. This is a research area that should have ongoing research. The proposed methodology has produced very high accuracy rate for recognition of PSL. The approach of mathematical modeling can be further extended to the dynamic sign language recognition. The dataset for PSL can be extended further for future research.
REFERENCES
[1] Philippe Dreuw, Pascal Steingrube, Thomas
Deselaers, Hermann Ney. Smoothed Disparity Maps for
Continuous American Sign Language Recognition. In: Pattern
Recognition and Image Analysis LECT NOTES COMPUT SC
2009; 5524: 24-31.
[2] Zafrulla, H. Brashear, T. Starner, H. Hamilton, and P. Presti.
American sign language recognition with the kinect. In:
Proceedings of the 13th International Conference on Multimodal
Interfaces, ICMI ‟11, 2011; New York, NY, USA. Pp. 279–286.
[3] Yun Li, Xiang Chen, Xu Zhang, Kongqiao Wang, and Z. Jane
Wang.. A Sign-Component-Based Framework for Chinese Sign
Language Recognition Using Accelerometer and semg Data. In:
IEEE T BIO-MED ENG 2012; 59.
[4] Xing Guo, Zhenyu Lu, RongbinXu, ZhengyiLiu ,Jianguo Wu.
Big-screen text input system based on gesture recognition. In:
Proceedings of the 2nd International Conference On Systems
Engineering and Modeling (ICSEM-13), 2013; Paris; France.
[5] A. Samir Elons , MagdyAbull-ela, M.F. Tolba . A proposed
PCNN features quality optimization technique for pose-invariant
3D Arabic sign language recognition. In: APPL SOFT
COMPUT April 2013;13: 1646–1660.
[6] Ershaed, I. Al-Alali, N. Khasawneh, and M. Fraiwan. An arabic
sign language computer interface using the xboxkinect. In:
Annual Undergraduate Research Conf. On Applied Computing
May 4-5, 2011; Dubai, UAE.
[7] Aleem Khalid Alvi, M. Yousuf Bin Azhar, MehmoodUsman,
SulemanMumtaz, Sameer Rafiq, raziurRehman, Israr Ahmed.
Pakistan Sign Language Recognition Using Statistical Template
Matching. In: World Academy of Science, Engineering and
Technology , 2005; 3.
[8] SumairaKausar, M. Younus,Javed, Shaleeza,Sohail.
Recognition of gestures in Pakistani sign language using fuzzy
classifier. In: 8th conference on Signal processing,
computational geometry and artificial vision 2008; Rhodes,
Greece: pp. 101-105
[9] S. PadamPriyal, Prabin Kumar Bora . A robust static hand
gesture recognition system using geometry based normalizations
and Krawtchouk moments. In: Pattern RecognitionLECT
NOTES COMPUT SC; August 2013; 46: 2202–2219.
[10] Xushijian, Xujie, Tang yijun, Shenlikai. Design of the Portable
Gloves for Sign Language Recognition. In: Advances in
Computer Science and Education Applications Communications
in Computer and Information Science; 2011; 202:171-177.
[11] Tan TianSwee, A.K. Ariff, S.-H. Salleh, Siew Kean
Seng, Leong SengHuat. Wireless data gloves Malay sign
language recognition system. In: proceeding of 6th International
Conference on Information, Communications & Signal
Processing 2007.
[12] RiniAkmeliawati, Melanie Po-LeenOoi and Ye Chow Kuang.
Real-Time Malaysian Sign Language Translation using Colour
Segmentation and Neural Network. In: IMTC 2007 -
Instrumentation and Measurement Technology Conference 1-3
May 2007; Warsaw, Poland; 2007.
0
5
10
15
20
Central momentsNN
Hu moments
Fourier descriptorsNN
GeometricFeatures NN
Polynomialparameterization…
Central momentsNB
Hu moments NBGeometric
Features NBPolynomial
parameterization…
Central momentsSVM
Hu moments SVM
Fourier descriptorsSVM
GeometricFeatures SVM
Polynomialparameterization…
Polynomialparameterization…
Training Time(387 examples) scaleddown by a factor of 100
Test time per Sign
SumairaKausaret.al. International Journal of Engineering and Applied Computer Science (IJEACS)
Volume: 01, Issue: 01, November 2016 ISBN: 978-0-9957075-0-4
www.ijeacs.com 30
[13] Helen Cooper, Eng-Jon Ong, Nicolas Pugeault, Richard
Bowden. Sign Language Recognition using Sub-Units”, In:J
MACH LEARN RES 2012; 13: 2205-2231.
[14] Annual report 2013 by Family Educational Services Foundation
(FESF).
[15] Disabled World: Sign Language and Deaf Communication
Methods and Information.
Http://www.disabled-world.com/disability/types/hearing/comm
unication/. Accessed on: 12.12.2013.
[16] Disabled World: Sign Language and Deaf Communication
Methods and Information.
Http://www.disabled-world.com/disability/types/
hearing/communication/. Accessed on: 12.12.2013.
[17] Sumairakausar, Javed, Y., samabiatehsin, Almas Anjum, “A
Novel Mathematical Modeling and Parameterization for Sign
Language Classification”. International Journal of Pattern
Recognition and Artificial Intelligence, Vol 30 (5), pp. 1-21,
Apr. 2016.
AUTHOR PROFILE
Sumaira Kausar is Asst. Professor at Bahria
University in Department of Computer Science. Her major areas of interest are Computer Vision and Pattern
Recognition.
Samabia Tehsin is Asst. professor at Bahria
University in Department of Computer Science. Her major areas of interest are Document Analysis,
Computer Vision, Image Processing and Pattern Recognition.
Muhammad Younus Javed is Professor at Hitec
university, Pakistan. His major areas of specialization are Adaptive Systems, Parallel Computing, Computer
Vision and Algorithmics.
©2016 by the author(s); licensee Empirical Research Press Ltd. United Kingdom. This is an open access article distributed under the terms and conditions of the Creative Commons by Attribution (CC-BY) license. (http://creativecommons.org/licenses/by/4.0/).

Call for Papers
International Journal of Engineering and Applied Computer Science (IJEACS) invites authors to
submit their manuscripts for categories like research papers, review articles, survey papers,
technical reports , report of unsuccessful research projects , case studies , tutorials , book
reviews, short communications and cross talk, extended version of conference papers for
publication in our monthly issue.
IJEACS reviews manuscripts through double blind peer review process. Authors can submit their
original, unpublished manuscript which is not under consideration for publication in any journal
or conference through email. IJEACS publish papers in major streams of Engineering and
Computer Science include following but not limited to.
Computer Science
Software Design and Modeling
Service Oriented Architecture
Open Source Software
Software Testing and Maintenance
Software Measurement and Reliability
Knowledge based Systems
Image Processing and Computer Graphics
Extreme Programming and Formal Methods
Artificial Intelligence, Image Recognition and Bio metrics.
Machine Learning and Computer Vision
Algorithm Analysis and Design
Computational Mathematics
Data Structures and Graph Theory
Video Coding and Data Compression
Database Systems and Big Data Analytics
Internet of Things, Architecture and Computing
Parallel and Distributed Computing
Cloud Computing, Agent Oriented System

Communication Network and Systems
Embedded Systems and Applications
Cryptography and Information Assurance
Computational Biology and Bioinformatics
Human Computer Interaction
Natural Language Processing
Engineering
Micro Processor Architecture and Design
VLSI/IC Microelectronics and Computer Design
Parallel Processing and Digital Systems
Wireless Transmission and Mobile Communication
Antenna and Wave Propagation
Semiconductors, Circuits and Signal System
Material Science and Metallurgy
Machine and System Design
Robotics and Automated Control
Manufacturing Processes and CAD/CAM
Quality Control and Assurance
Digital Signal Processing
Photonics, Fiber Optics and Optical Communication
Biosensors, Electrical-based Interactions
Nano electronic Devices and Silicon Micro/Nano Electronics Applications
Distributed monitoring systems and Smart Systems
Fluid Dynamics and Implementations
Mechanics and Vibration
Heat Transfer
Combustion Engines and Automobiles
Health Instrumentations and Technologies
Thermal Engineering
Solar Power Systems
Ergonomics
Submit your manuscript to: [email protected] or [email protected]
Innovations continue to serve the humanity

Ednvklsdvndkln
International Journal of Engineering and Applied Computer Science
Volume: 01, Issue: 01, November 2016
ISBN: 978-0-9957075-0-4
Issue Highlights
Ad-hoc Networks Mahboobeh Abdoos
Ethical Hacking Mohammed Abdul Bari
Software Complexity Harmeet Kaur
Program Comprehension Asfa Praveen
Sign Languages Sumaira Kausar, Samabia Tehsin, M. Younus Javed