volume 2, number 3 march 1, 2010 issn:1553-992x a c a d e m … · carielo aa ,calomeni mr , diré...
TRANSCRIPT

MARSLAND PRESSMultidisciplinary Academic Journal Publisher
http://www.sciencepub.net/academiahttp://www.sciencepub.net
Emails: [email protected] [email protected]
Websites:
Academia Arena
Volume 2, Number 3 March 1, 2010 ISSN:1553-992X
9 771553 992005
ISSN 1553-992X
Academia Arena
Volume 2, Number 3 (Cumulative No.9) March 1, 2010 ISSN:1553-992X
Copyright © 2010 Marsland Press
Marsland PressPO Box 180432 Richmond Hill, New York 11418, USA
Websites:http://www.sciencepub.net/academiahttp://www.sciencepub.net
Emails: [email protected] [email protected]
Phone: (347) 321-7172
Cover design: MA,Hongbao
Photograph: YOUNG, Mary
Academia Arena 2010;2(3)

MARSLAND PRESSMultidisciplinary Academic Journal Publisher
http://www.sciencepub.net/academiahttp://www.sciencepub.net
Emails: [email protected] [email protected]
Websites:
Academia Arena
Volume 2, Number 3 March 1, 2010 ISSN:1553-992X
Academia Arena, ISSN 1553-992X, http://www.sciencepub.net, [email protected]
http://www.sciencepub.net [email protected]
Academia Arena (Academ Arena) ISSN 1553-992X
学术争鸣Academia Arena is published bi-linguistically with English and Chinese for the scientists and Engineers. The journal founded in January 1, 2009 aims to present an arena of science and engineering. The Editor-in-Chief, Associate Editors-in-Chief and Editors have backgrounds in Philosophy, Science, Technology, Cosmology, Mathematics, Physics, Chemistry, Biology, Medicine, Civil, Electrical, Mechanical Engineering, etc. Papers submitted could be reviews, objective descriptions, research reports, opinions/debates, news, letters, and other types of writings. 学术争鸣于2009年元月1日在美国纽约马斯兰德出版社发刊,主要目标为提供科学家与工程师及社会工作者学术辩论的发表园地,专业
领域包含哲学、科学、技术、宇宙学、数学、物理、化学、生物学、医学、土木、电机、化工、机械工程,等,编辑群将以最专业客
观的立场为所有投稿作者服务。
Editor-in-Chief: Ma, Hongbao, [email protected] Associate Editors-in-Chief: Cherng, Shen; Henry, Mark; Herbert, John Editors: Badoni, Anoop; Chen, George; Chen, Guoren; Kalimuthu, Sennimalai; Kholoussi, Naglaa; Kumar, Anand; Ma, Margaret; Mahmoud, Amal; Tan, Tianrong; Tewari, Lalit M; Wang, Kuide; Young, Jenny; Refaat, Youssef; Yusuf, Mahmoud; Zaki, Maha Saad; Zaki, Mona Saad Ali; Zhang, Dongsheng Web Design: Ma, Hongbao
Information for Authors
1. Manuscripts Submission(1) Submission Methods: Electronic submission through email would be accepted. (2) Software: The Microsoft Word file is preferred. (3) Font: Normal, Times New Roman, 10 pt, single space. (4) Indent: Type 4 spaces in the beginning of each new paragraph. (5) Manuscript: Don’t use “Footnote” or “Header and Footer”. (6) Cover Page: Put detail information of authors and a short running title in the cover page. (7) Title: Use Title Case in the title and subtitles, e.g. “Debt and Agency Costs”. (8) Figures and Tables: Use full word of figure and table, e.g. “Figure 1. Annul Income of Different Groups”, Table 1. List Data”. (9) References: Cite references by “last name, year”, e.g. “(Smith, 2003)”. References should include all the authors’ last names and initials, title, journal, year, volume, issue, and pages etc.
Reference Examples: Journal Article: Hacker J, Hentschel U, Dobrindt U. Prokaryotic chromosomes and disease. Science 2003;301(34):790-3. Book: Berkowitz BA, Katzung BG. Basic and clinical evaluation of new drugs. In: Katzung BG, ed. Basic and clinical pharmacology. Appleton & Lance Publisher. Norwalk, Connecticut, USA. 1995:60-9.
(10) Submission Address: Marsland Press PO Box 180432, Richmond Hill, New York 11418, USA; Telephone: (347) 321-7172; Email: [email protected]. (11) Reviewers: Authors should suggest 2-8 competent reviewers with their name and email.
2. Manuscript PreparationEach manuscript should be formatted to include the following components:
(1) Title: Complete article title; (2) Author(s): Each author’s full name; institution(s) with which each
author is affiliated, with city, state/province, zip code, and country; and the name, complete mailing address, telephone number, facsimile number (if available), and e-mail address for all correspondence.
(3) Abstract: including Background, Materials and Methods, Results, and Discussions. (4) Key Words. (5) Introduction. (6) Materials and Methods. (7) Results. (8) Discussions. (9) Acknowledgments. (10) References. (11) Date submitted
3. Copyright and Responsibility of Authors to their Articles: Whenthe manuscript(s) is submitted to the journal, the authors agree the following: All the authors have participated sufficiently in this work; The article is not published elsewhere; Authors are responsibility on the contents of the article; The journal and author(s) have same right for the copyright of the article and either of the journal or author(s) can use it by anyway without noting the other party.
Journal Address: Marsland Press PO Box 180432 Richmond Hill, New York 11418, USA Telephone: (347) 321-7172 E-mail: [email protected]; [email protected] Websites: http://www.sciencepub.net
2010 Marsland Press

Academia Arena 2010:2(3) http://www.sciencepub.net/academia
i
CONTENTS
1 Force exerted by Hawking radiation emitted from Black hole
Manjunath. R. (reader in physics)
1-4
2 Acute Effects Of Brain Stimulation In Short-Term Memory Of Young Persons
Carielo Aa ,Calomeni Mr , Diré Gf
,, Gomes Ml
, Fernandes Jfo
, Freire Rb, Borba Hr
, Almeida
Mws , Bianchi Ce , Silva Vf
5-14
3 中国 2019 年前后的房地产、中国反腐败以后还有出路吗?垄断国企将走向何处?
张洞生
15-31
4 Regarding ultimate fate of our mother earth
Manjunath. R. (Reader in physics)
32-40
5 Sorbent Capacities And Intensities Of Thermochemically Cracked Shea Nut Shells For The
Removal Of Waste Water Dyestuff
Itodo A. U. and Itodo H. U.
41-50
6 Activation Chemistry And Kinetics Of Shea Nut Shell Biosorbents For Textile Waste Water
Treatment
Itodo A.U. and Itodo H.U.
51-60
7 Tangential acceleration of emitted photon from the star
Manjunath. R. (Reader in physics)
61-64
8 Screening Six Cultivars of Cowpea (Vignia unguiculata (L.) Walp for Adaptation to Soil
Contaminated with Spent Engine Oil
Agbogidi, O. M.
65-75
9 Dynamic Simulation for Domestic Solid Waste Composting Processes
Beidou Xi , Zimin Wei , Hongliang Liu
76-89
10 创 立 统 一 场 论
孙纯武
90-100

Academia Arena , 2010;2(3)
http:/www.sciencepub.net/academia [email protected] 1
Force exerted by Hawking radiation emitted from Black hole Manjunath. R. (reader in physics)
#16, 8th Main road,
Shivanagar, Rajajinagar,
Bangalore-560010
Karnataka, India
Abstract: Hawking radiation (also known as Bekenstein-Hawking radiation) is a thermal radiation with a black body spectrum predicted to be emitted by black holes due to quantum effects. The Hawking radiation process reduces the mass of the black hole and is therefore also known as black hole evaporation. Force exerted by hawking radiation is defined as function of entropy of black hole emitting hawking radiation, density of black hole and schwarzschild radius of blackhole .The above equation F = K ρ / rs S ( where F = Force exerted by hawking radiation , K=proportionality constant , rs = schwarzschild radius of black hole,s = entropy of black hole , ρ =black hole density) was developed based on quantum mechanical concepts . The above equation also describes outward force is exerted by hawking radiation to overcome the gravitational force of attraction of black hole. [Academia Arena, 2010;2(3):1-4] (ISSN 1553-992X).
Keywords: force, density, entropy
Introduction
When particles escape as thermal radiation, the black hole loses a small amount of its energy and therefore of its mass (mass and energy are related by Einstein's equation E = mc²).The power emitted by a black hole in the form of Hawking radiation can easily be estimated for the simplest case of a nonrotating, non-charged Schwarzschild black hole of mass ‘M’ .Hawking radiation consist of photons, neutrinos, and to a lesser extent all sorts of massive particles.By the application of quantum mechanical concepts we can derive an equation for force is exerted by hawking radiation to overcome the gravitational force of attraction of black hole .
DERIVATION:
FORCE EXERTED BY HAWKING RADIATION EMITTED BY BLACK HOLE
When quantum mechanical effects are taken into account one finds that Blackhole emit thermal radiation (hawking radiation) at a temperature(hawking radiation temperature) is given by
T=hc^3/2 π (8 π GMk) where h=planck’sconstant, G=universal gravitational constant
M= Mass blackhole, k=Boltzmann constant, c=speed of light in vaccum /air

Academia Arena , 2010;2(3)
http:/www.sciencepub.net/academia [email protected] 2
Schwarzschild radius of black hole can be given by rs =2GM/c^2
Thus T=hc^3/2 π (8 π GMk) becomes T=hc .c^2/8 π^2k 2GM i.e T=hc /8 π^2k rs
KT=hc/8 π^2rs
According to Boltzmann’s law: Energy of emitted thermal radiation by black hole is directly proportional to it’s temperature given by E=KT where k= Boltzmann constant
Then the equation KT=hc/8 π^2rs becomes E=hc/8 π^2rs
Emitted thermal radiation by black hole will exert outward force to overcome the gravitational force of attraction of black hole. Hence energy of emitted thermal radiation can alsobe given by E=F λ where E= energy of emitted thermal radiation,F =force exerted by radiation, λ=wavelength of emitted radiation.
(Proof for E=F λ is shown at the end of derivation)
Thus E=hc/8 π^2rs becomes F λ=hc/8 π^2rs
Debroglie wavelength assosiated with the emitted hawking radiation can be given by λ=h/mc
Where m= mass of emitted hawking radiation
Note: radiation travels at speed of light i.e c (3*10^8m/s)
Thus F h/mc=hc/8 π^2rs hence F=mc^2/8 π^2rs is obtained.
The rate of energy flow from black hole is given by P=e σ T^4 A.
Where P=rate of energy flow at temerature T , e=emissivity power(for black hole e=1)
A=surface area of black body. i.e P= σ T^4 A is obtained.
According to Stefan ‘s law :Energy of emitted radiation from blackhole is directly proportional to fourth power of it’s temperature E = σ T^4 .where σ=stefan’s constant.
Energy of emitted hawking radiation can be given byE=mc^2 ,where m=mass of emitted hawking radiation
By equivalence of stefan’s law and einstein’s mass energy equivalence law we get
mc^2= σ T^4 then the equation P= σ T^4 A becomes P= mc^2A.
then P= mc^2A i.e P/A=mc^2
Then the equation F=mc^2/8 π^2rs becomes F=P/8 π^2rs A
where A=surface area of black hole emitting hawking radiation.
Entropy of black hole emitting hawking radiation is given by S=KA/4lp^2
Where lp = planck’s length ,S= entropy of black hole emitting hawking radiation
By rearranging the above equation we get A=4Slp^2/K
i.e F=P/8 π^2rs A becomes F=PK/8 π^2rs 4Slp^2 i.e F=PK/32 π^2rs Slp^2 .

Academia Arena , 2010;2(3)
http:/www.sciencepub.net/academia [email protected] 3
Rate of rate of energy flow by blackhole is given by P= ρhG/180 π
where ρ=black hole density,G= universal gravitational constant.
then the equation F=PK/32 π^2rs Slp^2 becomes F= ρhGK/180 π(32 π ^2 rs Slp^2 )
Planck’s length is given by lp^2=Gh/2 πc^3.
Then F= ρhGK/180 π(32 π ^2 rs Slp^2 ) becomes F= ρhGK2 πc^3/5760 π ^3 rs Gh S
F= ρKc^3/2880 π ^2 rs S
As K’ =KC^3/2880 π ^2 ,where K’= proportionality constant
Thus equation F = K’ρ /rs S is obtained. Where ρ=black hole density, rs =Schwarzschild radius of black hole,
F=force exerted by hawking radiation, S= entropy of black hole
PROOF FOR THE EQUATION E=F λ
Determination of the Photon Force and Pressure
Reissig, Sergej
The 35th Meeting of the Division of Atomic, Molecular and Optical Physics, May 25-29, 2004, Tuscon, AZ. MEETING ID: DAMOP04, abstract #D1.102
In [1] the formula for the practical determination of the power of a light particle was derived: P = hf^2 (W) (1). For the praxis it is very usefully to define the forces and pressure of the electromagnetic or high temperature heat radiation. The use of the impulse equation F = fracdPdt = fracd(mc)dt (2) together with the Einstein formula for E = mc^2 leads to the following relationship: F = frac1cfracd(mc^2 )dt = frac1cfracdEdt (3) In [1] was shown: - fracdEdt = P (4). With the use the eq. (1), (3), (4) the force value could be finally determinated: | F | = frachf^2 c or | F | = frachcλ ^2 = fracEλ [N]. The pressure of the photon could be calculated with using of the force value and effective area: p = fracFA [Pa]. References 1. About the calculation of the photon power. S. Reissig, APS four corners meeting, Arizona, 2003 -www.eps.org/aps/meet/4CF03/baps/abs/S150020.html
Note: Emitted hawking radiation also possess wavelength and energy during it’s motion then it also exerts outward force to overcome the gravitational force of attraction of black hole.
Then the above equation E=F λ can be applied to emitted hawking radiation also.
Result:
1) Force exerted by hawking radiation emitted by black hole as a function of black hole density, Schwarzschild radius of black hole, entropy of black hole emiting thermal radiation is given by F = K’ ρ / rs S
Discussions: Normally, a black hole is considered to draw all matter and energy in the surrounding region into it, as a result of the intense gravitational fields. Because Hawking radiation allows black holes to lose mass, black holes that lose more matter than they gain through other means are expected to dissipate, shrink, and ultimately vanish. Smaller micro black holes (MBHs) are predicted to be larger net emitters of radiation than larger black holes, and to shrink and dissipate faster. In order to overcome the gravitational force of attraction of black hole hawking radiation

Academia Arena , 2010;2(3)
http:/www.sciencepub.net/academia [email protected] 4
should posses outward force such that particles of thermal radiation are emitted from black hole.
Conclusion: According to the general theory of relativity, a black hole is a region of space from which nothing, including light, can escape. It is the result of the deformation of spacetime caused by a very compact mass. Around a black hole there is an undetectable surface which marks the point of no return, called an event horizon. It is called "black" because it absorbs all the light that comes towards it, reflecting nothing, just like a perfect black body in thermodynamics. Force is exerted by hawking radiation to overcome the gravitational force of attraction of black hole. As F α ρ /rs S if density of blackhole is more, then force exerted by hawking radiation is more (F α ρ). As schwarzschild radius of black hole is more, then force exerted by hawking radiation is less (F α 1 /rs) .As entropy of black hole is more, then force exerted by hawking radiation is less (F α 1 / S).
Acknowlegement:
I would like to express my deep gratitude to all those who gave me the possibility to complete this thesis. My sincere thanks to the Lord Ganesha, Editor of “NATURE AND SCIENCE” journal, my physics teachers, & parents.
Correspondance to:
Manjunath. R. (Reader in physics)
#16,8th Main road,
Shivanagar, Rajajinagar,
Bangalore-560010
Karnataka, India
Contact: res -080-65960971
mob: 91-9008487836
References:
1) Cl Robert M. Wald, General Relativity, Sections 14.2-14.4, University of Chicago Press, Chicago, 1984. (A good precise introduction to the subject.)
2) Hawking radiation (From Wikipedia,the free encyclopedia)
3) Stephen W. Hawking, Particle creation by black holes, Commun. Math. Phys. 43 (1975), 199-220. (The original paper.)
4) Black hole thermodynamics (From Wikipedia, the free encyclop edia) 5) Mass –energy equivalence, www.worsleyschool.net/science/files/emc2.html catched pages , (From Wikipedia,the free encyclopedia).
6) Thermal radiation (From the free Wikipedia encyclopedia)
7) Blackhole (From the free Wikipedia encyclopedia)
8) Determination of the Photon Force and Pressure Reissig, Sergej (www google.com)
Date of submission: 04|01|2010

Academia arena ,2010;2(3)
5
ACUTE EFFECTS OF BRAIN STIMULATION IN SHORT-TERM MEMORY OF YOUNG PERSONS
CARIELO AA 1,2,3 ,CALOMENI MR 1, DIRÉ GF 2,4,5,, GOMES ML 4, FERNANDES JFO 4 , FREIRE RB 6, BORBA HR 6, ALMEIDA MWS 1, BIANCHI CE 1, SILVA VF 1
1Universidade Castelo Branco – LABNEU II, Rio de Janeiro/RJ – Brazil.
2Universidade Estácio de Sá – Centro de Ciências da saúde, Rio de Janeiro/RJ – Brazil.
3Projeto de pesquisa da escola de medicina da Unigranrio – Rio de Janeiro/ RJ – Brazil.
4Universidade Estadual da Zona Oeste, Colegiado de Ciências Biológicas e da Saúde, Campo Grande, Rio de Janeiro, Brazil.
5Instituto Federal de Educação, Ciência e Tecnologia do Rio de Janeiro, campus Maracanã, Rio de Janeiro, Brazil.
6Universidade Federal Rural do Rio de Janeiro, Departamento de Biologia Animal, Seropédica, Rio de Janeiro, Brazil.
Correspondence: e-mail: [email protected]
ABSTRACT: The inherent goal here was to verify the effects of brain stimulation via an instrumentation frequency hearing and vision, aiming, immediate results (acute effect) on memory tasks associated with short-term. The random sample included 20 individuals of both genders, aged between 18 and 25 years (mean 21.8 years). The application for evaluation was to memorize in 10 seconds, a sequence of letters submitted and requiring the faithful reproduction of this sequence, after 20 seconds. Two days later, this providence, proceeded to brain stimulation by means of an electronic computer named Orion manufactured by Mindplace (brain machine), using the auditory modality of stimulation for only 10 individuals, and the visual, for others ten. Next, we carried out a reassessment in the same manner as the previous one. The pre-and post-stimulation were studied using three parametric Analysis of Variance (One-way ANOVA) independent, and the first occurred on the basis of global data, regardless of the rules and, second, by viewing the auditory modality, while the third, the visual. The results indicated a significant difference in performance from the whole group joining the two modalities (visual + auditory), compared to post-stimulation, F 7.467, df (1.38) = 0.009, p <0.05. Checking the effects isolated by method of stimulation, the analysis revealed to be F 6.68, df (1.18) = 0.019, p <0.05 and F = 1.699, df (1.18) = 0.209, p> 0.05 for the visual and auditory modalities, respectively. These results were interpreted as restricting or promoting support for the benefits of acute brain stimulation on the function of short-term memory, indicating further that the photic stimulation is more interactive than the auditory modality when dealing with this benefit. [Academia Arena, 2010;2(3):5-14] (ISSN 1553-992X).
Key words: Brain, Memory, Young persons, Acute effects, photic, sound
Academia arena ,2010;2(3)
6
INTRODUCTION Learning and memory processes are related and inseparable. Learning corresponds to the acquisition of new knowledge and consequent behavior modification, while the memory can be understood as the retention of this knowledge (Maxwell et al., 2003, quoted in Cardoso Machado, Silva, 2006). According to Sternberg (2000), quoted Linassi, Soares, Mota (2005), states that the basic operations of memory are encoding, storage and retrieval. The coding is the transformation of sensory input in a form of mental representation that can be stored. Storage is the storage of information encoded. According to Squire & Kandel (2003) recovery refers to access and use of information stored. All these processes interact and are interdependent. The working memory, according to Flavell et al., (1999), quoted Linassi, Soares, Mota (2005), is responsible for the temporary storing of information and has an active role in information processing. The duration of information in short-term memory is small and the decay usually happens within a period of approximately 15 to 25 seconds. The information may be copied or can be downloaded from this deposit to deposit, and long-term effectiveness of memory tends to always depend on the type of strategy used by the aide-memoire. Studies have long ago by George Miller, using a procedure like this determined that the deposit in the short term can "hold" 7 items of information, plus or minus 2. An item of information is "a piece" of information as a letter, number, formula, or sentence. In other words, anything that the brain stores as a unitary representation. In this case it may, the brain, register and hold more information in short-term memory, if organized in a few pieces of high-level information, such as group letters into words.
Developmental searches have revealed a number of differences between young children and older in terms of operability. One of them, and of critical importance to ensuring a sufficiency in learning is referred to the time of durability of a temporary storage (Squire, Kandel, 2003).
If video games as an advisory stimulation may benefit the performance of some mechanisms of memory and the consequent and related performance, which could be the result of stimulation, the part on those same mechanisms? Brain stimulation is not a new event, since many years ago some researchers have managed to identify the effects of electromagnetic loads in individuals with diseases of various facets, in which they included some kind of depression and also neuroses (George et al., 2003).
Regarding the driving issues, Spiegel et al. (2003), found a significant improvement in ambulation of patients with parkinsonian brain stimulation through sound and photic stimulation, and these improvements were associated both amplitude and frequency gait. Another line of evidence, viewing the performance and not specifically, processes, points to the brain stimulation as a variant able to promote significant changes in motor performance (Carter et al., 2006, Marques et al., 2005, Lins, 2006, Silva et al., 2008), as well as for the development of cognitive skills of reference (Marques et al., 2005). This line, combined with stimulation through auditory and noise sources, as described by Marques et al. (2005), in order to produce changes in cortical patterns (rhythms of the brain), hoping for a improvement in its performance, tasks of contractual, or special of the day-to-day social human. Attempts changes are made by selecting a specific frequency to the nature of the individual involved in the research and referentially you want to achieve. The training is made operational by converging streams of light to the retina, then to the olivary nucleus and then to the thalamus, a structure that is responsible for receiving and filtering external stimuli (Machado, 2004). Through the activation of the reticular system, the frequency of operation is then sent to the cortex, occurring, then grip cortical frequency imposed (Brady, 2002).

Academia arena ,2010;2(3)
7
Thus, considerations about the importance of a system of mental processing fast (fast and accurate) can have on all levels of human competence and the possibility that brain stimulation may have a potential effect on it, define need to conduct research that will strengthen knowledge on the possible relationship of interaction between mental processing and brain stimulation. This paper characterizes an effort toward this need.
MATERIALS AND METHODS
SAMPLE The study sample was characterized on the agenda for the 20 individuals of both genders, 9 males and 11 females, all of school age (N = 20). As priority setting, they could not present any type of visual disturbance, hearing, physical or mental. Belonging to the same social class and the institution, aiming to keep this one more homogeneous as possible between them. These school children aged between 14 and 21 years were selected randomly, with no distinction made in practice or not physical activities because we believe that this type of control in this case would be irrelevant. This study met the standards for the conduct of human research, as directed by the National Health Council, Resolution 196/96 and approved by the Institutional Ethics Committee of the Universidade Castelo Branco - UCB / RJ. All participants were volunteers, having been requested in all cases, the agreement of parents or guardians for them.
PROCEDURES The selection took place within a state institution in the city of Campos, RJ. The protocol for data collection was completed the following: young people were examined in a room inside the institution to which they belonged properly equipped with temperature controlled by external noise. Initially as a control for the research subjects were usually held in that room where he
explained the type of work they would participate. Then, in order to assess the capacity of short-term memory of these were carried out individually, each of which tests should be evaluated memorize a sequence of letters from a common deck that was presented and, for this task of memorization, a total time of 10 seconds. Immediately after, the assessed should repeat the sequence was shown to them using this time a maximum of 20 seconds. We recorded the total time of execution and the maximum score of mistakes and successes of each individual. After a period of one day control experiment was performed, the process of stimulation, which is applied to groups composed of 4 individuals, and for two of each group used to photic stimulation and for the other two, the sound. Thus, all components of the group were stimulated. We used this stimulation to the electronic device (computer) named Orion (brain machine), manufactured by Mindplace, composed of dark glasses with 4 LEDs on the inner surface of each lens, a stereo headset and a PC where the sessions pre-programmed. These, picked up, according to the methodology, the appropriate section of paragraph 12, which is intended for the learning factor (stimulation to learning). The duration of the session lasted 10 minutes. After this stimulation the individuals were referred to another room, also in ideal conditions, where they repeated the first experimental procedure of memorization of playing cards. It should be noted that for this second data collection, the letters were presented in a different manner to control the collection. For the analysis of data obtained was used as a tool for statistical analysis using SPSS 10.0 for Windows, and the inferential statistics procedure was defined a parametric analysis (ANOVA), while the descriptive references for analysis were the mean and standard standard group, in comparison between pre and post-stimulation. We adopted the margin of error for the test of the principal value of alpha <or = 0.05. The results are listed below.
Academia arena ,2010;2(3)
8
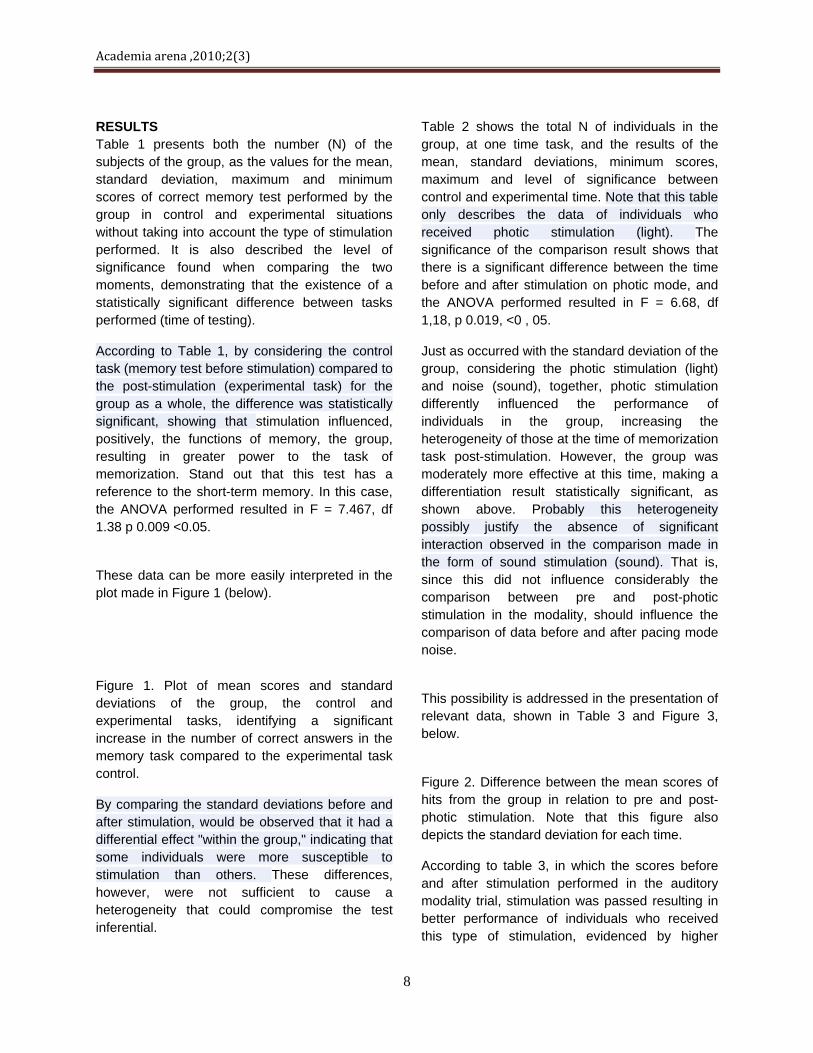
RESULTS Table 1 presents both the number (N) of the subjects of the group, as the values for the mean, standard deviation, maximum and minimum scores of correct memory test performed by the group in control and experimental situations without taking into account the type of stimulation performed. It is also described the level of significance found when comparing the two moments, demonstrating that the existence of a statistically significant difference between tasks performed (time of testing).
According to Table 1, by considering the control task (memory test before stimulation) compared to the post-stimulation (experimental task) for the group as a whole, the difference was statistically significant, showing that stimulation influenced, positively, the functions of memory, the group, resulting in greater power to the task of memorization. Stand out that this test has a reference to the short-term memory. In this case, the ANOVA performed resulted in F = 7.467, df 1.38 p 0.009 <0.05.
These data can be more easily interpreted in the plot made in Figure 1 (below).
Figure 1. Plot of mean scores and standard deviations of the group, the control and experimental tasks, identifying a significant increase in the number of correct answers in the memory task compared to the experimental task control.
By comparing the standard deviations before and after stimulation, would be observed that it had a differential effect "within the group," indicating that some individuals were more susceptible to stimulation than others. These differences, however, were not sufficient to cause a heterogeneity that could compromise the test inferential.
Table 2 shows the total N of individuals in the group, at one time task, and the results of the mean, standard deviations, minimum scores, maximum and level of significance between control and experimental time. Note that this table only describes the data of individuals who received photic stimulation (light). The significance of the comparison result shows that there is a significant difference between the time before and after stimulation on photic mode, and the ANOVA performed resulted in F = 6.68, df 1,18, p 0.019, <0 , 05.
Just as occurred with the standard deviation of the group, considering the photic stimulation (light) and noise (sound), together, photic stimulation differently influenced the performance of individuals in the group, increasing the heterogeneity of those at the time of memorization task post-stimulation. However, the group was moderately more effective at this time, making a differentiation result statistically significant, as shown above. Probably this heterogeneity possibly justify the absence of significant interaction observed in the comparison made in the form of sound stimulation (sound). That is, since this did not influence considerably the comparison between pre and post-photic stimulation in the modality, should influence the comparison of data before and after pacing mode noise.
This possibility is addressed in the presentation of relevant data, shown in Table 3 and Figure 3, below.
Figure 2. Difference between the mean scores of hits from the group in relation to pre and post-photic stimulation. Note that this figure also depicts the standard deviation for each time.
According to table 3, in which the scores before and after stimulation performed in the auditory modality trial, stimulation was passed resulting in better performance of individuals who received this type of stimulation, evidenced by higher
Academia arena ,2010;2(3)
9
scores on the task of memorization, after sound stimulation. It should be noted, the same trend observed in previous periods, in which the heterogeneity of the group increases when the experimental task (the post-stimulation). Since this time, the standard deviation shown greater good. In fact, nearly doubling compared to the time of task control.
As predicted this heterogeneity is reflected in the inferential analysis, resulting in a not statistically significant when comparing pre and post-stimulation, and F = 1.699, df 1.18, p 0.209> 0.05.
Table 1. Average of correct answers, SD - standard deviation scores of correct minimum and maximum memory in the sequence of letters submitted to the group, task control and experimental. ____________________________________________________________________________
Task Subjects Mean SD Minimum Maximum Significance Control 20 3.1 1.02 1 5
0.009 Experimental 20 4.4 1.96 0 8 ____________________________________________________________________________
Table 2. Averages of correct answers, SD - standard deviation, scores of correct minimum and maximum storage in the sequence of letters submitted to the group in control and experimental moments, with hit rates far higher in the experimental time.
____________________________________________________________________________
Task Subjects Mean SD Minimum Maximum Significance Control 10 3.2 1.03 2 5
0.019 Experimental 10 5.0 1.94 2 8
Table 3. Average of correct answers, SD - standard deviations and scores of correct maximum and minimum on memorization of the sequence of letters presented in the experimental and control groups.
____________________________________________________________________________
Task Subjects Mean SD Minimum Maximum Significance Control 10 3.0 1.05 1 5
0.209 Experimental 10 3.9 1.91 0 7 ____________________________________________________________________________

Academia arena ,2010;2(3)
10
Figure 3 represents the statistical equality of the scores of hits in the memory test compared to control tasks, referring to the auditory stimulation, with their respective standard deviations.
Figure 3. Representation of the negligible difference between the scores of hits from the control group and the group received only auditory stimuli.
Studying Table 3 and Figure 3, respectively, we see, in a first instance, the big difference in the standard deviation of the group, when comparing the data for the task to control the experimental task. In a second instance, we notice that although this is so, the group performance when the experimental task was remarkably better, because it identifies a trend effect also of sound stimulation on individuals stimulated in this mode.
TAREFA CONTROLE X TAREFA EXPERIMENTAL
0
1
2
3
4
5
6
7
Nº DE ACERTOS
TAREFA CONTROLE
TAREFAEXPERIMENTAL
Figure 1. Plot of mean scores and standard deviations of the group, the control and experimental tasks, identifying a significant increase in the number of correct answers in the memory task compared to the experimental task control.
Task control vs. experimental task
number of hits
Task control
Experimental task

Academia arena ,2010;2(3)
11
TAREFA CONTROLE X TAREFA EXPERIMENTAL "LUZ"
012345678
Nº ACERTOS
TAREFA CONTROLE
TAREFAEXPERIMENTAL
Figure 2. Difference between the mean scores of hits from the group in relation to pre and post-photic stimulation. Note that this figure also depicts the standard deviation for each time.
TAREFA CONTROLE X TAREFA EXPERIMENTAL "SOM"
01234567
Nº ACERTOS
TAREFA CONTROLE
TAREFAEXPERIMENTAL
Figure 3. Representation of the negligible difference between the scores of hits from the control group and the group received only auditory stimuli.
DISCUSSION After the presentation of the results it is, from this point is to highlight the relationship between cause and effect that may have generated the differences that were observed in the test scores of memory, in a comparative way between the time of testing before and after the stimulation effected manipulated.
The first comparison made between the time the control test (control) and experimental (test after stimulation), in which it was not considered separately the effects of sound stimulation or photic, the group of 20 subjects showed an average success rate measured in 3.2 ± 1.03, with the minimum score 1, maximum 5. As for the
number of hits
Task control
Experimental task
Task Control Task experimental X "Light"
Task control
Experimental task
Task Control Task experimental X "Sound"
number of hits
Academia arena ,2010;2(3)
12
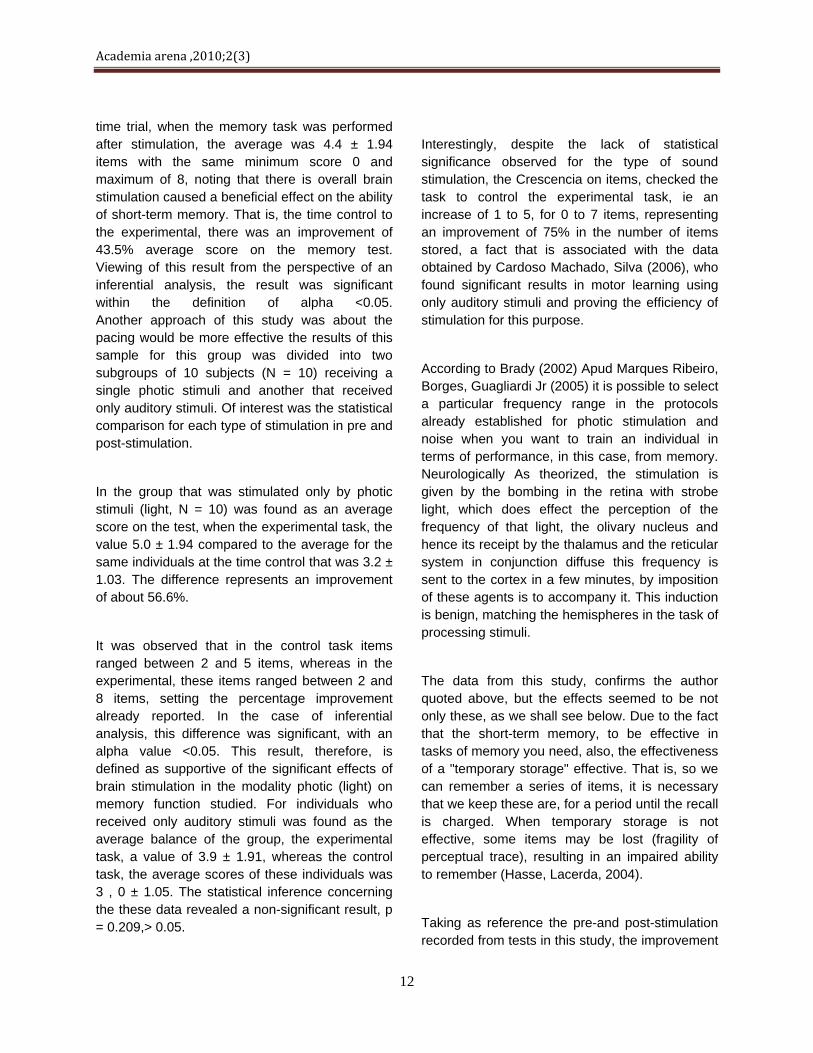
time trial, when the memory task was performed after stimulation, the average was 4.4 ± 1.94 items with the same minimum score 0 and maximum of 8, noting that there is overall brain stimulation caused a beneficial effect on the ability of short-term memory. That is, the time control to the experimental, there was an improvement of 43.5% average score on the memory test. Viewing of this result from the perspective of an inferential analysis, the result was significant within the definition of alpha <0.05. Another approach of this study was about the pacing would be more effective the results of this sample for this group was divided into two subgroups of 10 subjects (N = 10) receiving a single photic stimuli and another that received only auditory stimuli. Of interest was the statistical comparison for each type of stimulation in pre and post-stimulation.
In the group that was stimulated only by photic stimuli (light, N = 10) was found as an average score on the test, when the experimental task, the value 5.0 ± 1.94 compared to the average for the same individuals at the time control that was 3.2 ± 1.03. The difference represents an improvement of about 56.6%.
It was observed that in the control task items ranged between 2 and 5 items, whereas in the experimental, these items ranged between 2 and 8 items, setting the percentage improvement already reported. In the case of inferential analysis, this difference was significant, with an alpha value <0.05. This result, therefore, is defined as supportive of the significant effects of brain stimulation in the modality photic (light) on memory function studied. For individuals who received only auditory stimuli was found as the average balance of the group, the experimental task, a value of 3.9 ± 1.91, whereas the control task, the average scores of these individuals was 3 , 0 ± 1.05. The statistical inference concerning the these data revealed a non-significant result, p = 0.209,> 0.05.
Interestingly, despite the lack of statistical significance observed for the type of sound stimulation, the Crescencia on items, checked the task to control the experimental task, ie an increase of 1 to 5, for 0 to 7 items, representing an improvement of 75% in the number of items stored, a fact that is associated with the data obtained by Cardoso Machado, Silva (2006), who found significant results in motor learning using only auditory stimuli and proving the efficiency of stimulation for this purpose.
According to Brady (2002) Apud Marques Ribeiro, Borges, Guagliardi Jr (2005) it is possible to select a particular frequency range in the protocols already established for photic stimulation and noise when you want to train an individual in terms of performance, in this case, from memory. Neurologically As theorized, the stimulation is given by the bombing in the retina with strobe light, which does effect the perception of the frequency of that light, the olivary nucleus and hence its receipt by the thalamus and the reticular system in conjunction diffuse this frequency is sent to the cortex in a few minutes, by imposition of these agents is to accompany it. This induction is benign, matching the hemispheres in the task of processing stimuli.
The data from this study, confirms the author quoted above, but the effects seemed to be not only these, as we shall see below. Due to the fact that the short-term memory, to be effective in tasks of memory you need, also, the effectiveness of a "temporary storage" effective. That is, so we can remember a series of items, it is necessary that we keep these are, for a period until the recall is charged. When temporary storage is not effective, some items may be lost (fragility of perceptual trace), resulting in an impaired ability to remember (Hasse, Lacerda, 2004).
Taking as reference the pre-and post-stimulation recorded from tests in this study, the improvement

Academia arena ,2010;2(3)
13
in scores in the post-stimulation, may well be directly related to the mechanisms of memory associated with this temporary custody. This deduction, however is only an assumption, considering that the experimental manipulation, here committed, was not addressed in this type of test.
The fact of photic stimulation to show in this research, more efficient in relation to auditory stimulation should be considered for future analysis. Accepting that the cognitive tasks are performed in a subsystem of the short-term memory (or working memory), the speed with which these can be run as the deciding factor in performance (Vernon, 1983a, 1983b, apud Ribeiro, Almeida, 2005). It is expected that the more quickly they recovered and processed the relevant information to solve a problem, the greater the probability threshold of system capacity is not exceeded. Similarly, in the absence of test information in working memory is subject to a rapid decline or disappearance. Hence, a situation of slow processing, the previously encoded information can be recovered or lost, or the maintenance can be done at the expense of overloading the system, so it is unable to perform the processes needed to solve a problem (Ribeiro, Almeida, 2005).
CONCLUSION
According to the results discussed above, we can speculate that the brain stimulation as a whole was effective in improving short-term memory of individuals studied here.
The examination in this study on the processing speed, in reference to short-term memory, showed a beneficial effect of brain stimulation, via light and sound. This knowledge can be used to improve the functions decaying by aging and to improve the functions of the body or specific common tasks of life, since, Andrade, Belmonte, Viana (2007) reports that it is genetically
predisposed, but it is possible to improve it (memory) through training, and this improvement can reach 15%.
Correspondence to:
Prof. Alessandro Carielo de Albuquerque
Universidade Estácio de Sá – Centro de Ciências da saúde, (Bangu) Rio de Janeiro/RJ – Brazil.
Rua Arlete C. Ayres Wanderley, 336, CEP 21745-650
Sulacap, Rio de Janeiro - RJ – Brazil.
Telephone: ++ (55) (21) 35552134
Cellular phone: ++ (55) (21) 95291430
e-mail: [email protected]
REFERENCES Andrade A, Belmonte AP, Viana MS. Tempo de reação, flexibilidade e velocidade acíclica de membros inferiores de atletas de tae kwon do. Lecturas Educación Física y Deportes. 2006;11(96).
Silva VF, Poly MWO, Junior SMR, Calomeni MR, Pinto MMV, Silva SAL. Efeito agudo da estimulação cerebral atraves de luz e som no tempo de reação motora de jovens atletas. Lecturas Educación Física y Deportes. 2008;13(120). Lins FRW. A incidência padrão de atividade cortical e a influência da potencialização cerebral sobre os efeitos da ansiedade na execução do pênalti, em atletas de futebol de campo. 2006. Dissertação de mestrado. Universidade Castelo Branco-RJ.

Academia arena ,2010;2(3)
14
Machado SEC, Cardoso FB, Silva VF. Estimulação Cerebral e Aprendizagem Motora: Efeitos no Aprendizado do Jogo de Boliche. III Congresso Científico Latino-Americano da FIEP, Foz do Iguaçu – PR/2006. http://penta.ufrgs.br/edu/telelab/1/types.htm#primary Linassi LZ, Keske S, Marcia MHB. Habilidades de memória de trabalho e o grau de severidade do desvio fonológico. Pró-Fono R. Atual. Cient. 2005;17(3):383-92.
Brady DB. Binaural-Beat Induced Theta EEG Activity and Hypnotic Susceptibility. Northern Arizona University. 1997. http://www.portalmonroebrasil.com/.
Cardoso FB, Machado SEC, Silva VF. Estimulação Cerebral e Aprendizagem Motora: Efeitos no Aprendizado do Jogo de Boliche. Apresentado no III Congresso Científico Latino-Americano da FIEP, Foz do Iguaçu - PR/2006.
Ribeiro IS, Almeida LS. Velocidade de Processamento da Informação na Definição e Avaliação da Inteligência. Psicologia: Teoria e Pesquisa. 2005;21(1):1-5.
Spiegel S, Fuss G, Backens M, Reith W, Magnus T, Becker G, Moringlane JRD. Journal of Neurosurgery. 2003;99:772-74.
George M, Nahas Z, Lisanby S, Schlaepfer T, Kozel F, Greenberg B. Transcranial Magnetic Stimulation. Neurosurgery Clinics of North America. 2003;2(14):283-301.
Marques LJ, Ribeiro LHB, Borges D, Guagliardi JR, Mário R. Método M.R. de Potencialização Cerebral e Controle da Mente © 2004 em Atleta de Triatlon. 2005. Apresentado no Congresso FIEP Cabo Frio.
Marques LJ, Ribeiro LHB, Rocha D, Barros G, Borges D, Dias F, Delanei L, Araujo CEV, Guagliard JR, Mário R, Godoy ES, Silva RPA. Comparação dos efeitos da Potencialização Cerebral sobre a atividade cortical em grupos de diferentes preferências de processamento hemisférico. 2005. Artigo apresentado no congresso FIEP/Foz do Iguaçu.
Squire LR, Kandel ER. Memória: da mente as moléculas. Artmed. Porto Alegre, Brasil. 2003.
Machado ABM. Neuronanatomia funcional. Atheneu. São Paulo, Brasil. 2004.
Hasse VG, Lacerda SS. Neuroplasticidade, Variação interindividual e recuperação funcional em neuropsicologia. Temas em psicologia da SBP. 2004;12(1):28-42.
Submission date: 19/01/2010

Academia arena ,2010;2(3)
15
中国 2019 年前后的房地产、中国反腐败以后还有出路吗?垄断国企将走向何处?
张 洞 生 Email: [email protected]
【前言】。下面集合了 近作者在博客上发表过的 3 篇文章。1*。也谈 2019 年以前和以后的中国
房地产。2*。为什么中国现在反腐败太难太难,以后还有出路吗?3*。中国现在发展的国有垄断
企业,今后是否会成为祸国殃民的国家垄断资本主义?文章的观点是否正确并不重要。可以讨论和
批驳。在科学上,提出问题比解决问题更为重要。题目是不是危言耸听,愿人们能认真思考。[Academia Arena, 2010;2(3):15-31] (ISSN 1553-992X).
关键词:中国; 房地产; 腐败; 垄断; 国企
第一篇 也谈 2019 年以前和以后的中国房地产
==看润涛阎先生的大作“2019 年以前和以后的中国房地产”后有感==
【1】。 润涛阎先生的大作‘2019 年以前和以后的中国房地产’中,有许多正确而独到的见解。使人
佩服。根据中国人口的变化规律,由于现在人口在 2019 年之前保持相对的稳定,大约在 2019 年之
后人口开始下降。会造成城市中房地产业不再风光,空房会越来越多,价格会越来越下降,这个结
论基本上是正确的。======
【2】。至于从 2009~2019 这 10 年间,城市中的房地产是否会因为农村的城市化,使农民大量进城
工作而造成城市中的住房供不应求、造成房价的暴涨呢?这是值得商榷的。这要取决于以下的几个
条件:
2-1*;现在城市中的人均住房面积究竟达到多少?由于对城市总住房面积和每年新建住房面积没有
一个令人信服的权威的公布数字,很多假大空的数字都是为了忽悠老百姓,前后矛盾,是在为房地
产大腕制造天价房作广告宣传的。因此,只能采用一些学者们推算出来的数据作一些估算。根据资
料,在 1978 年,全国人口总数是 9.6259 亿,城镇人口 1.7245 亿,城市化率为 17.9 %。到 2008年,总人口 13.273 亿,城市人口 6.06 亿,农村人口 7.213 亿,城市化率为 45.6%。估算 2009 年,
总人口 13.3414 亿,城市人口 6.28 亿,农村人口 7.0614 亿,城市化率为 47.07%.。
表 1 未来 50 年的人口城市化进程摘自《南方房地产》2005
年份 1997 2000 2010 2020 2050
中国总人口规模(亿
人) 12.36 12.9 14.00 14.90 16.00
城市人口规模(亿
人) 3.07 4.13 5.60 7.45 11.2
为 1997 年城镇人口
倍数 ---- 1.1 1.51 2.01 3.03
城市化水平 30% 32% 40% 50% 70%

Academia arena ,2010;2(3)
16
另一资料,『即 2011 年,中国城镇住房面积将达到 256 亿平米。届时,我们按照 6 亿人在城
市居住计算,每人可使用的面积将达到 42 平米。』[1]
另外资料:『在全国每年新增的 1800——2000 万的城镇人口中,约有不到 500 万的处在城乡
结合部农村人口,是由于城市规划的扩充而“由农民变市民”的,他们每年 “带到”城市的新增住房面
积 多也就 1.5 亿平方米(由于农村变城市后往往伴随着大规模的改造拆迁,另外农民自身的原有住
宅也有一个改造的问题,所以这些 “带房新市民”的“有效住宅”人均以 30 多平方米计算。』
从上面可以得出的估算数据如下:假设 2010 年,全国人口达到≈14 亿。城市人口≈6.5 亿,城
市化率≈48%。城市人均住房面积≈40 平米/每人。那么,一个独生子女的 3 口家庭住房一般≈80 平米
的 2~3 居室已足够了。因此可见,城市的住房空置率约大于 30%。这与许多实际的调查资料相符
合。一些拿房地产商好处的学者和官员说:『2008 年,北京商品房北京空置率高达 16.64%,空置
面积消化周期达 12.92 个月,高居全国榜首』。这可能都是骗人的鬼话。北京的现实情况是,除了
民工挤在一间房间之外(而民工是不算城市户口的),现在北京和其它城市还真难找到一家 5~6 口
人挤在一个 2~3 居室的套间的。而有 2 套以上豪宅的官员多不胜数。既然城市 6.5 亿人口有高达 1/3的房屋空置率,因此,房地产商才雇佣各式各样的托儿卖房。房产现在已过剩,就是说,从 2010年起,到 2020 年止,即使城市不再建筑商品住房,10 年再从农村再迁入城市 1.5 亿人口,也可以
有房子可住(当然不是指豪宅,而是指可供一家 3 口住的 60~80 平方米的经济房)。即使按照某些
替房地产大款代言的学者所说的 16.5%的房屋空置率算,城市也可至少在 5~6 年之内不盖新房,而
能满足每人 25 平米基本住房要求,这里还没有包括房地产商所滞留在手中而未开发的大力土地。
现实是,『中国社科院蓝皮书。数据令人寒心:中国 85%的家庭无能力购房。』 [5] 而几乎所有
城市的居民,除民工之外都有房住,这说明城市中的房屋空置率,特别是高价(级)房的空置率是
非常高的。大款和高官因为政府不收物业税而大量囤积房产作为私人财产。郎咸平:『近几个月,
代表中国目前主流购买力的中高档以及写字楼盘的租金不断下跌,意味着刚性需求的下跌;在这种
情况下的房价猛涨是资金推动型,其内在原因就是对于企业家而言,投资环境恶化,产能过剩,转
而从实体经济投身购买楼盘。』[6] 其实,更多是从“天上掉下的馅饼”中,即官员大款从宽松的银
行贷款中所得的钱投资到房市中的结果。
2-2*;如果政府将现在的政策不变的延续到 2020 年,不大力扶植私人中小企业,就不可能每年将
1,500 百万农村人口转化为城市人口(注意:城市人口每年也要解决约 1 千万人就业)。从上面可
见,1978 年,城市人口≈1.7 亿,到 2010 年,城市人口≈6.5 亿,32 年增加了 4.8 亿,城市
人口平均每年增加≈1,500 百万。而说城市人口每年增加≈1,800 ~2,000 万也是有点夸大其词,可能是
近几年才有的现象。但是,自 2008 年美国大金融经济危机爆发以来,由于劳动密集型外贸产业产
品大量滞销,造成沿海有关工厂大批倒闭和减产,使工人大批失业。美欧的消费者由于失业和半失
业而可能会永远捂紧荷包。这些工厂如不升级或转型,就只能永远关闭。中国既无中小型私人银
行,这些工厂又得不到国有银行刺激经济的贷款而升级或转型,很多已经倒闭,为倒闭几乎都奄奄
一息。国家 2009 年约 10 万亿元的巨额贷款几乎都给了国有企业和房地产。估计大约有 3.5~4.5 万
亿的贷款进入房地产市场,而吹成了现在巨大的房地产泡沫。要知道,10 万亿元的巨额贷款比
2008 年的 1/3 GDP 还要多一点呢。
由于国家刺激经济的贷款几乎没有用于扶助城镇的中小企业和第三产业,扩大内需和增加就业
就成为一句空话。大批民工们只能靠吹大的房地产泡沫和国家对产能过剩的基建投资才暂不失业。
按照政府现有一贯的“劫贫济富”政策,现在还在继续更加卖力地搞“国进民退“,挤压私人企业,许
多高官跑到井冈山顶礼膜拜,是不是又打算走回改革开放前时代?这就表明,如果将现在的政策不
变的延续到 2020 年,不可能每年将 1,500 百万农村人口转化为城市人口。何况,也不可能连续 10年每年以 10 万亿元发放贷款吧。一旦房地产泡沫和其它产能过剩的产业泡沫因紧缩贷款而破灭,
可会造成金融经济危机的风暴的。中国的社会经得起吗?迪拜房地产泡沫的破灭是另一次更响亮的
警钟。

Academia arena ,2010;2(3)
17
2-3*;现在的高房价与供需关系毫不相干,是政府的巨额贷款吹起来的。“随着十余年来经济的高
速发展,腐败也不断加深,地方官员的财产也在逐步累积,一个科长几套房、处长十几套房、市长
书记几十套房是普遍的现象,人民赋予的公权也彻底沦为谋私的工具。在 2008 年与 2009 年的房产
冷热交替中可以发现,类似于中石油团购一样的政府机关团购充斥了全国楼市的每个角落,他们以
难以解释的 4~5 折低价买入,按市场价格售出,从中谋取无数的暴利,就连普通公务员也是有了钱
就投资房产,一个人几套房的公务员不用查,已比比皆是,这群人 也当之无愧的成为了炒房团的
骨干与中坚力量。”【2】 可见,住房的空置率是很高的。而且,现在的房地产商手中都囤积着大量
土地不盖房,以便高价倒卖出去。
2-4*;为什么政府会一贯的实行这种“劫贫济富”的政策呢?因为政府财经的决策权掌握在许多贪腐
高官和国有垄断企业官员的的手里,就是人称的特殊利益集团人的手里。吹大房地产泡沫只对贪官
们有利。房地产泡沫是现今中国社会政治经济的恶性肿瘤。[3] 他们的贪腐(80~90)%都与房地产
有关。高房价已经成为中国经济之害,成为人民公敌。 近,中国水、电、煤气、食物等价格的飞
涨就是高房贷投资造成的通货膨胀。只有刺穿房地产泡沫,中国经济才能走上正常持续发展的轨
道。刺穿房地产泡沫其实是很简单的,用收取 1/(50~100)房价的物业税的收入买下大部分或者全部
现有的经济适用房,作为市政府的不许买卖的永久财产,然后减或免租转租给无房住者和新参加工
作的年轻人,以解决“居者有其屋”的问题。这是所有美欧发达国家行之有效的“低收入房”的办法,
这是真正的“以民为本”和扶植社会“弱势群体”一项好政策。但是,刺穿房地产泡沫会受到各级官员
的极大阻力,因为极大多数贪官的大部分非法所得都是房地产,一方面房产可以作为他们隐秘的不
上税增值的巨大的资产,另一方面他们可以用 N 座私密房产包养 N 奶,这也是他们的隐秘。所以
政府征收物业税就是直接暴露他们非法财产的有效办法,是 切实可行的反贪措施。
【3】。几点看法:3-1*;无论是所谓的“资本主义现代化”,还是所谓的“社会主义现代化”,其 终
目标就是要达到在全国范围内消除工农、地区、城乡 3 大差别,以使(80~90)%以上的农村转变
为城市。中国在 2010~2020 之间人口大约稳定在 14~15 亿之内,如果上天保佑,中国在这 10 年之
内,共产党的领导在不出大乱的情况下,能够排除各种困难和来自左右两方面的阻扰,每年将约
1500 万农村人口转变为城市人口。那么,到 2020 年,中国城市总人口将达到约 8 亿,而农村人口
尚有 6 亿多,城市化率约为 55%.,虽然成绩巨大,但离现代化的目标还有很远的距离。中国现在
实际上已在改变独生子女政策。因此,到 2049 年,人口是否会降低到 7 亿,不得而知。
3-2*;对经济率先(假)复苏的中国而言,对充溢乐观情绪的中国房地产业而言,迪拜神话破灭的
这瓢冷水的确来得太及时了。有许多喷青陶醉在美国电影《2012》内的“中国拯救世界”的迷魂汤
中。有一种声音在中国天空震荡;“中国拯救了世界,房地产拯救了中国”。只要看看 G20 和联合
国大会后,超过 55 国对中国大打贸易战,就可知傻乎乎的中国又“被国际忽悠”了。中国用 10 万亿
元银行贷款保住了 2009 年的鸡底屁超过 8%。10 万亿元相当于 2009 年总鸡底屁总值的 1/3 呢。就
是说,这是全体中国人加班白干了 2009 年中的 4 个月换来的。请用不灌水的脑子想一想,在一般
情况下,一年中多干了 4 个月应该使该年的鸡底屁至少要增长多少?不错,10 万亿元对房地产和
其它项目的投资救了 2009 年的中国。但这种刺激经济的模式今后年年能够继续吗?如果这个巨大
的房地产泡沫被推延到 2012 年破灭,像迪拜一样,谁来拯救中国?而 2012 年房地产泡沫破灭的可
能性是极大的,因为中国政府极难连续在 2010,2011,2012 年,每年再以 10 万亿贷款发放出去,
像 2009 年一样。
3-3*;郎咸平说,中国资产泡沫如爆破,将造成 2010 年世界经济危机。近期水、电、油以及铁矿
石等价格上涨,也给中国经济带来了很大的成本压力。郎咸平表示,在金融风暴过后,国际环境对
中国经济越来越不友善,在汇率压力越来越大的同时,贸易制裁、贸易壁垒也越来越严重,这一切
都在提醒中国的企业在 2010 年要格外的谨慎。[6] 现在许多学者和高官们故意过分地夸大“北京共
识”的作用,实际上是毛泽东的“人有多大胆,地有多大产”思想的流毒。经济发展有其规律,意
识形态和政治不能过分干预。中国 2009 年用 10 万亿元贷款刺激经济,使中国躲过了 2009 年的金

Academia arena ,2010;2(3)
18
融经济危机,但这只是一年的特例,不能常态化,长期化,因为今年的刺激经济产生了更多滞后的
产能过剩和更大的房地产泡沫,为明后年埋伏下了更大的危机。
3-4*;现抄录一段有关高房价所产生的严重社会问题,看了会使人震颤。『如 今出了一部电视剧叫
《蜗居》,有评论说《蜗居》讲的是“一个残忍的性掠夺故事”,“在贫富差距迅速拉大、道德标准
荡然无存的大环境下,性资源正向权钱阶层 加速流动。”“这种性资源的掠夺,不仅造成社会道德感
的缺失和正义感的沦丧,也导致性泛滥与性匮乏的共存,极少数人占有过量性资源,而陷入性贫乏
和性短缺的群体不断扩大。这就不再仅仅是一个道德层面的问题,而是关系到社会的稳定。”(经
济观察网汪雷)』[4]
3-5*;中国房地产研究会副会长顾云昌 12 月 3 日,在接受记者采访时说:“因此按照保守估计,今
年全国一手房和二手房销售总额很可能达到 5.7 万亿-6 万亿元”。12 月 3 日,商务部市场运行调节
司司长王炳南预计全年全国社会消费品零售总额能达到 12 万亿元左右。上海易居房地产研究院发
展研究所所长李战军则概括道:“今年是新世纪以来中国经济 困难的一年,但也是房地产业 辉
煌的一年。”只要稍动脑筋分析一下上述 3 条 近新闻,就可以得出以下惊人的结论:1*。今年是
是房地产业 辉煌的一年。销售总额达到 6 万亿元。为什么?因为今年政府刺激经济的贷款 10 万
亿元中的约 50%,即约 5 万亿元流进了房屋产业,因为房地产业今年并没有新建较多的新房,所以
5 万亿元贷款中相当大的一部分成为现款落进高官和大款的腰包,他们总不可能像文强一样,将所
得的大量赃款封存好后埋进池塘或夹墙中吧,于是只有买高价房这一着了。这就造成了今年房产业
异常的繁荣。2*。他们没有说出来的是,这房地产中 辉煌的的交易中,绝大部分一定是高档房,
绝不是经济商用房。3*。6 万亿元的房屋销售总额也只能买 1~4 百万套高级住宅,却占据了全中国
13 多亿人口销售总额的一半,这说明普通老百姓在“上学难、看病难、住房难”3 座大山压力下,每
人每年平均的消费额还不到 5000 元。这种极大地贫富悬殊是造成中国现在“贫富对立”和“官民对
立”的根源,亦是社会群体事件产生的根源。
3-6*;由于 2019 年以后,全国总人口量的下降,城市人口的下降应该比农村更快,因为那时城市
人口已多于农村,而出生率较农村低。并且老年人口由于寿命的增长而增多,城市对青年劳动力的
需求增加,加上城市房价的下降,这可能更有利于加速城市化的进程。由此可见,从 2010 ~ 2019这 10 年间是中国社会政治经济发展的关键时期,充满危机。但只要党政高层有足够的智慧和才
能,制定的政策措施得当,也就会充满转机,转危为安。
3-7*。但是,现在的温家宝政府,在 2009 年超过 10 万亿的银行贷款中,有约 5 万亿落进了房地产
市场,成为国有企业高管炒房地产的本钱。『属于央企的中化集团,旗下中化方兴投资管理公司,
就经常以“大款”作风在土地拍卖会上举牌,对地价是否符合市场价格毫不理会,今年六月备受瞩目
的北京广渠路 15 号地拍卖如期举行,中化方兴以 40.6 亿元拿下地王的大款作风,甚至连地产商
SOHO 的董事长潘石屹也为之咋舌。』 [6] 这不是个别的事例,而是遍及全国各大城市。从而造成了
今年房地产价格的暴涨,形成了巨大的房地产泡沫。高房价排斥农民进入城市,排斥农村的城市
化。而房地产泡沫的破灭是迟早的事,绝不可能被推延到 2019 年之后。这就是说,想再用房地产
来带动中国经济高速发展 10 年,可能只是一种幻想。房地产泡沫被吹得越大,破灭时产生的金融
经济危机也越大。中国今后经济发展的根本出路在于扩大内需,也就是大力发展私人中小企业,特
别是私人银行。由此带动农村的城镇化和城市的房地产业。这是唯一正确的发展道路。现在却反其
道而行,用搞房地产泡沫来搞城市化,这和从前用“大炼钢铁”搞工业化是同一个思路,是注定要
失败的。
====完====
参考文献:

Academia arena ,2010;2(3)
19
[1]。『天涯杂谈』 天涯网友恳请国务院公布全国城市人口和住房面积。 作者:宕渠小生 提交日期:2009-9-27 14:25:00. [2]。韩令国:中国经济必将崩溃在高房价下。www.wenxuecity.com, 时事述评。09-11-11 17:54:41 [3]。张洞生:试论目前中国经济中的的房地产泡沫。wenxuecity.com/diary.php?c_lang=big5...200910 [4]。《蜗居》社会学:性阶级与性阶级斗争。信源:英九博客|编辑:2009-12-03| 网址:http://www.popyard.org [5] 。数据令人寒心:中国 85%的家庭无能力购房。新华网 于 2009-12-07 14:13:19 [6]. 总算闹明白了 :中央救市 4 万亿元部分竟是央企炒地本钱. 作者 香港特约记者 郑汉良 华盛顿人 于 2009-12-17 08:42 编辑 www.backchina.com
第二篇 为什么中国现在反腐败太难太难,以后还有出路吗?
【一】。人的欲望有“善”和“恶”的两重性。反对对“权力”和“财富”的垄断
帕斯卡( Blaise Pascal 1623-1662,法国哲学家)曾说:人是什么?一半是天使,一半是野兽。人的欲
望有两重性,或者说,有两面性。性善或性恶是一个很古老的话题。每个人都是善和恶的矛盾统一
体,每个人的善/恶比相差是很大的,其善恶的内容也不一样。对一个人来说,其善/恶比也不固
定,会随环境和经历的改变而会改变。人类社会经济、文化艺术、科学技术、互助合作的发展进步
是人性中善的发扬。个人犯罪、损人利己、贪赃枉法、腐败堕落等是人性中恶的膨胀。所以老子
说:“罪莫大于可欲,祸莫大于不知足,咎莫大于欲得”。这就是人性恶的一面膨胀的结果。然
而,可悲的是,随着社会经济科技文明的发展,到现在为止,人类总的善恶比却在下降,即善/恶在减小。这就是悖论。为什么?因为随着社会经济的发展,财富增加了,人与人之间的合作关系和
环境变得更紧密复杂,人的智慧和手段更是增多,所以人变得更易于掠夺和骗取别人和社会的财
富。所以老子对人性恶的一面看的很透,说:“智慧出,有大伪”。一个人作好事做多了会上瘾。
同样,一个人作坏事做多了也会上瘾。这就人性的第一定律:惯性定律。人做好事做得越多,劲头
越大,越作越想作,科学家、艺术家、工程师、医生均如是。人作坏事也一样,从小偷(贪)到大
偷(贪),越来贪欲越大,劲头越大,绝不会满足,看看那些被揭发出来的贪官污吏们,有谁是已
经满足了的呢?他们都是不撞南墙不回头。 美国华尔街的大鳄们不同样贪婪成性吗?现代高科技的互联网使华尔街的大鳄们坐在办公室敲敲打
打键盘就能诈骗到亿万财富。这符合是人性的第二定律:加速定律。贪得越多,动力越大。无利不
早起。人生的过程是由一连串的循环或者震荡构成的。作善事和作坏事有类似的规律,在一个人连
连作好事时,如果都适时地得到鼓励、奖赏或助力,他就会越作越好,越做越多越大,这就是人性
对外界环境的共振效应。相反,在一个人连连作好事时,如果都适时地得到打击、奚落、失助,他
就可能灰心不干了,这就是阻尼效应。同样,如果一个人连连做坏事没有得到外界给予的应有惩
罚,而是一路禄灯,他的胆子就会越来越大,作坏事就会越来越大,越来越多。这就是人性的第三
定律:共振定律,即一个人的人性会受强大外力的干扰而可能会有所改变,或产生倍加效应,或产
生倍减效应。由上所述,可以得出有关反贪腐的以下结论: 第一;贪腐是人性中恶的一面在其有利条件下(制度和环境)恶性膨胀的结果。任何制度,不管是
民主制度,还是独裁制度,都不可能完全杜绝欺骗贪腐,而只能减少欺骗贪腐,并使其危害降低。
好制度和好环境的有效配合可大大的减少贪腐,坏制度和坏环境则助长贪腐。 第二建立有效地反对对权力和财富的垄断制度,以制止权贵大鳄的祸国殃民行为。绝对的权力造成
了绝对的腐败是铁律。只有上梁正,下梁才极难歪。 第三;建立透明的严厉的反贪腐制度。除了独立、公正、严格的法制外,强大的外部压力和环境是
反贪腐的必要条件,如网络监督,媒体监督等。高薪养廉”实质上是对贪腐者的屈从,是公开为腐

Academia arena ,2010;2(3)
20
败开道,为贪腐正名。反贪既要看到产生贪官污吏的环境和其财的源头,也要看到他们财的出处。
现在,中国(80~90)%贪腐都与房地产有关。90%以上的贪官都包二(多)奶、情人、小蜜。N 座房
产是他们包养 N 奶的必要条件。因此,第一;征收房地产税是暴露贪官受贿的 有效的措施。第
二;应该制定条例,重赏揭发检举贪官的二(多)奶、情人、小蜜们,因为她们少数是共犯,多数
是受害者。重赏之下,必有勇妇”。这可能是一条有效地反贪措施。由于人的恶性欲望(贪欲)具
有普遍性,我们不应把它作为腐败产生的根源,而应找出让贪欲得以恶性膨胀的制度性根源,这样
才能找到纵容腐败的制度和环境。贪官们贪得越多,冲破制度约束的欲望和能量也越大,办法也越
多,对社会和民众的危害也越大。
【二】。中国滋生贪腐官员的温床:国有垄断企业,暴利的房地产业,政府的基建投资
《1》。官商一体的国有企业特别是国有垄断企业和国有银行的高管是滋生贪腐的重要温床。 中国近 15 年来的经济发展形成了强大的权贵和买办的垄断资本主义集团,即特殊利益集团。集团
主要是国有垄断企业和银行的总裁、董事长、总经理等,他们是现阶段中国经济发展和政治改革的
主要阻力。 一位在中国居住了 20 多年的美国官员,一针见血地指出:中国的问题,其实很简单,就是那么大
约 500 个特权家庭的问题。这 500 个家庭,加上他们的儿孙、 亲友及身边工作人员,构成了约 5000 人的核心体系。他们之间还存在着普遍的通婚联姻的关系。他们垄断权力、形成利益集团,
竭力维护现状,并制造了"一旦民主,就会天下大乱"的谎言; 十几亿中国人民,都成了这个小集
团的人质。现在 0.4%的富人占有全国 GDP 的 70%的财富.他们都位居政经高位.其中有许多贪
腐官员已成为黑社会的代言人和保护伞.这是一场中国人民和中国特殊利益集团的较量。 决定胜
负的却是中国共产党 国有企业中的高层是形成现今中国权贵买办垄断资本家的特殊利益集团的主要成员,其中的一些中
上层人物是买办卖国贼,其中不少人的发家都靠暗中向外国公司或外国出卖政治经济利益或机密情
报。已揭老底和被处死的姬鹏飞的儿子姬胜德就是其中之一。几年来发生在著名跨国公司针对中国
官员的“行贿门”事件及从商务部的周京毅案到各省市有关部门的涉外腐败案件,那就会明白,官
僚和国企高层是把这些利益通过公开甚至合法(通过立法)的手段送到国际寡头财团面前的。2009年,美国国会通过议案指责美国公司向中国中石油等 3 大公司行贿,中国政府调查后,否认了美国
的指责。老百姓要相信谁呢?这个集团中有许多人可能是裸官,和陈水扁杨秀珠一样,将大量非法
获得的财产转移到了外国。因此,这些人都是国家的蛀虫。由于国企高管往往是自定薪酬等原因,
难以控制他们的个人工资和红利总量。 《2》。(80~90)%的贪官都与暴利行业的房地产,黑煤矿等有权钱交易 『随着十余年来经济的高速发展,腐败也不断加深,地方官员的财产也在逐步累积,一个科长几套
房、处长十几套房、市长书记几十套房是很普遍的现象,人民赋予的公权也彻底沦为谋私的工具。
在 2008 年与 2009 年的房产冷热交替中可以发现,类似于中石油团购一样的政府机关团购充斥了全
国楼市的每个角落,他们以难以解释的 4~5 折低价买入,按市场价格售出,从中谋取无数的暴利,
就连普通公务员也是有了钱就投资房产,一个人几套房的公务员不用查,已比比皆是,这群人 也当之无愧的成为了炒房团的骨干与中坚力量。』【2】 官员的贪腐(80~90)%都与房地产有关,都受贿豪华住宅。高房价已经成为中国经济之害,成为
人民公敌。高房价的泡沫和暴利扼杀和排斥私有中小企业的生存环境,只有征收物业税和国有银行
不给购第 2 套房这贷款才能有效地刺穿房地产泡沫,中国经济才能走上正常持续发展的轨道。 《3》.政府的基建投资。公共财政投资问题很多,官员争夺和利用投资与商人和黑社会勾结,进行
权钱交易,是滋生官员贪腐的另外一个重要温床。也造成真正用于民生改善方面的投资较低,在世
界各国中排在后面,导致民生难以好转,消费需求严重不足,并且拉大了政府和民众的矛盾。

Academia arena ,2010;2(3)
21
《4》.共产党党的一贯封建特权思想和制度。一党专政本身就形成官员的特权。使官员能够“权钱
交易”和“以权谋私”。当官员无阻碍地利用和扩大自己的特权,并进行钱权交易时,就走上了贪
腐之路。 《5》。结论:1*。这就是反腐败太难太难的原因,因为腐败产生于国有垄断企业的高层,这是中
央部级官员贪腐的主要来源。地方高中层的腐败绝大多数产生于房地产、暴利的煤矿和各种矿、基
建投资,乡镇小官员的贪腐来源于对底层民众的强行摊派和收费的压迫剥削。这就是说,中国从中
央到省市县再到基层的乡镇都遍布滋生贪腐的温床或曰土壤。但是仅有土壤,种子也不会生长壮
大。而在共产党“一党专政”条件下的“党大于法”和各种特权制度的“姑息养奸”才使得贪官污
吏可以“有恃无恐”、横行霸道、“无法无天”。这就造成了下面有中国贪腐特色的 5 化。2*。薄
熙来在重庆的打黑除恶反腐 多只能解决地方黑社会、大款与政府官员勾结形成“官商黑”“三位
一体”的问题,而这只占贪腐中的小部分。国有垄断企业和暴利的房地产中滋生的贪腐却占据贪腐
的大部分,而这是薄熙来无法解决的问题。因此,如果没有中共中央高层出手,将打黑除恶反腐推
广到全国,中国的反贪腐要取得全国性的胜利是太难太难的。3*。薄熙来在打黑除恶反腐中取得的
初步胜利,使中国广大民众看清了,黑势力及其保护伞,可能已渗透至中国各层级的政治和经济领
域、公检法系统、学术和媒体界。因此,薄熙来的打黑反腐就成为中国社会政治经济发展前进中不
可绕过的一道坎,关系中国的前途.已经取得的成绩开创了中国今后反腐的必由之路.这就是薄熙
来的打黑反腐的现实意义和历史意义。
【三】。中国现在官员严重贪腐的 5 化特征及其成因
《1》。腐败对党和国家的严重危害性:现阶段中国 大敌人是贪官污吏。薄熙来说,贪腐现在已
经成为党政的“致命伤”。这可能是薄熙来从重庆打黑除恶反腐所暴露的和未能公开的实情得出的
结论和感慨。腐败使“官民对立”、“官兵对立”、人心涣散,使民众淡漠对抗外敌外侮的意志,
使贪腐官员容易被外敌收买,前伊拉克萨达姆的共和国卫队的高级军官全部被美国中央情报局收买
就是例子。戴旭:『腐败问题也会加速我们外部灾难的到来,现在我认为我们的很多官员已经腐败
到极端无耻、无边界的程度,这会导致我们外部的危险加速到来。重庆不是在打黑吗,我要问一个
问题:其他城市比重庆白多少?我们现在的国民意识,不仅是很多官员腐败,人民也腐败。』
有人说,各国都有官员贪腐,有的国家还很严重,没什么可怕。由于国情不同,贪腐对各国的
危害性是大不相同的。比如,台湾的主要矛盾是“统独”,又有一定的民主和法制。印度 85%的人
信仰印度教,能够忍受严重的压迫剥削而不反抗,又有一定的民主制度。俄罗斯有较好的社会福利
保障和民主制度。因此,在这些国家的贪腐绝大多数往往是以“权钱交易”和“愿打愿挨”的方式
进行,所以难以引起社会的大动乱。而中国则不同,既无民主法制又失效,又无基本的社会福利保
障。而中国老百姓既无宗教信仰以支持其忍让,又经过文化大革命“造反有理”的熏陶,具有很强
的反抗性。杨佳事件,邓玉娇事件,湖北石首事件,吉林通钢打死总经理事件,新疆民众游行要求
王乐泉下台事件等等,都说明现在全国已经成为一个高压蒸锅,随时都有可能爆破。
现在买办官僚及其依附的精英充斥全国,南海是中国的领海,那里有上千口美、英、俄的油
井,却没有一口中国的油井。中石油宁可跑到非洲打油,也不愿、不敢在南海打油,以维护中国的
领海和权益。另据中纪委、国务院研究室、监察部的调研报告显示,全国党政国家机关系统违规违
纪挪用、侵占公款吃喝、休假旅游、出境出国读书、送礼、滥发奖金福利,2006 年度高达两万亿
元,超过国家财政收入的 50%.
《2》。 第一;中国 严重的问题在于贪腐的高层化,或者党政高层对贪腐的容忍和保护。叶永烈
说:“中国现在官员的贪腐的特征已成为集团化,部门化,市场化和黑帮化”,这 4 个官员贪腐的
现代化已经压迫得无权的平民百姓透不过气来。特别是整个公检法系统几乎完全烂成贪腐官员和黑
社会的保护伞,再加上不少贪腐官员与大款和黑社会勾结成“三位一体”。 严重的其实不是叶永
烈的 4 化,而是第五化,即贪腐的高层化,或者党政高层对贪腐的容忍和保护。这就是中共 17 届
4 中全会仍然通不过官员财产申报制度的原因。这才是薄熙来心中所想而没有说出来的“贪腐已成
致命伤”的原因。这就是中共 20 年来“越反越贪”和“前腐后继”的原因。

Academia arena ,2010;2(3)
22
第二;中国现在“以官为本”的政治制度来源于共产党一贯顽固的“打天下,座天下”的封建家族
特权思想,即“望子成龙,望女成凤”。从毛泽东起,就搞封建官僚特权,行宫遍中国,专列到处
跑。毛泽东自己是“和尚打伞,无法无天”,现在发展到大小官员几乎都是“和尚打伞,更加无法
无天”,贪污腐败、二奶、N 奶、买处、官商黑勾结一起,好话说尽,坏事做绝。三鹿奶粉案的结
果是杀了 2 个无知的制作三聚氢胺的农民。赵紫阳倒台的重要原因之一可能就是在六四中答应“反
贪腐”从查自己的子女开始。这触到了当时元老包括邓小平、陈云、王震和新贵李鹏的敏感神经。
不过当时元老们的太子太妹们还不过是利用特权占据党政中层捞些油水而已,不像现在形成一个个
千万、亿万的大家族,互相联姻,勾结在一起。所以,邓小平的重要错误之一就是“睁只眼,闭只
眼”地容许自己和其它元老的子女利用特权牟利。江泽民上台后,为了维护和巩固自己的“核心”
地位和其家族“闷声发大财”的需要,拉帮结派,一方面培植亲信和跟班,一方面又向太子太妹们
输送利益和权力(党政军高位),并封给他们“先进代表”的桂冠加以保护,以拉拢他们,巩固自
己的地位和家族利益。胡锦涛 2002 年裸身上台,没有自己的班底,江泽民搞阴谋诡计硬将自己的
一大批跟班塞进胡锦涛的左右,虎视眈眈,使胡动弹不得,只能“空话治国”。高喊“以民为
本”、“和谐社会”、“科学发展观”而无所作为。于是形成了现在的权贵和买办为首的“特殊利
益集团”。特殊利益集团的成员及其代言人占据党政军高层,掌控了社会政治经济的决策权。『中
国所谓特殊利益集团,直白点说,就是以特殊的权力或优势,掠夺国家和民众利益的集团,他们获
得的“特殊利益”,不仅是利润的 大化,还从资源的占有、权力的操纵、舆论的玩弄,一直到司法
的护航,无所不有。』[3]
《3》。惩治党内腐败问题,要有强大的外力,即上层压力。只要党政 高层自身清白,坚决公正
地反贪腐,将自己、家族和派系的利益置之度外,严惩贪腐,贪腐就并不难清除。
第一香港、新加坡两地“管住权力”的经验很简单,那就是严刑峻法,从严治吏。以新加坡为例,它
不但首创了要“让腐败者在政治上身败名裂,在经济上倾家荡产”的提法,实际上也是这么做的。首
先,法律对权钱交易的认定极其严苛,公职人员只要收受与政府机关或公共机构签约人或其代理人
的报酬,不管是否为对方谋取利益,也不管收受好处多少,都会被认定为受贿行为。对“收取报酬”的范围规定极为宽泛,既包括金钱、礼物、证券和财产,也包括信息、服务、恩惠和许诺等。其
次,在证据上采取有罪推定,如果发现有官员消费明显超过收入,或拥有与收入不相称的财产,法
院即可作为贪污受贿的证据。再次,在量刑上实行逐项量刑、合并计算的刑罚制度。【4】
这些法规都很简单,也易于操作。移之于中国,绝对足以震慑贪官。对比中国现状,不难从
中找到官商勾结、权钱交易屡治不愈的奥秘。特殊利益集团不仅拥有利用权力攫取利益的强大能
力,更拥有通过权力影响政策、法律的制订,扭曲其执行,为自我利益“保驾护航”的强大能力。因
此,“无罪推定”在中国被 多运用在职务犯罪上,美其名曰“贪官也应有人权”;在许多国家可以相
比,贪污受贿罪加一等的巨额财产来历不明罪,在中国 高刑期仅仅 10 年(1 年前还是 5 年);虽
然公 众千呼万唤,官员财产公开法案就是不出来……法律对特殊利益的呵护如此无微不至,它们
焉得不发如雨后春笋?【4】 第二;中国当前的反腐必须跟薄熙来一样,从打黑除恶反腐开始。薄熙来在重庆打黑反腐的初步胜
利已经证明了现在在全国打黑反腐的必要性、迫切性、可行性。说明在全国打黑反腐是“不为”的
问题,而不是“不能”的问题。在全国公检法系统已经普遍贪腐、变成黑社会和贪官污吏的保护伞
的状况下,只有从打黑除恶反腐做起,才有可能使反贪腐逐步深入,而后走上正道,以便 后使公
检法成为清廉、独立、公正的系统。这是构建“以民为本”的和谐社会的必要条件。
《4》。贪腐是从特权中滋生出来的。 今日中国与上世纪 70 年代前的香港较类似。当时香港,以
权谋利也无所不在:救护人员接病人到医院要“茶水钱”,消防员开水龙头救火要“开喉费”,住院病
人领取开水或便盆要打赏医院护工。弄得天怒民怨。这一切乱象,却在短短几年间,由于一个矢志
澄清吏治的港督而被改变。【4】 第一让公权和私权独立地获取自己的营养。被多数国人误读了的新加坡“高薪养廉”,其实就是一 个很好的公私分明的例子。表面上看,新加坡高级领导人的收入差不多是世界上 高的,但真正拿

Academia arena ,2010;2(3)
23
100 万以上高薪的人很少,政府部门估计也就 30 人左右,而且,这个薪金是政府给他们的全部收
入,部长包括总理都没有专职司机,上班开自己的车;他们没有政府的退休金和医疗保险;如果一
位部长在大选中落选,那他什么也 没有了。可见,新加坡政府之所以清廉,不是因为“高薪”,而
是因为“公私分明”。这种公私权力界限的清晰划分,不能仅仅停留于制度条文上,更要体现在实际 操作中。 第二;中国 大的特权来源于“以官为本”,“党大于法”,进而形成“权大于法”。从邓小平
的“稳定压倒一切”到现在的“稳定是硬任务”,将官员变成维护社会稳定(维稳)的工具,说白
了们就是维护共产党“一党专政”的工具,所以中央 高层现在需要官员维稳而容忍其腐败。这就
是薄熙来的打黑除恶反腐不能在全国推广的原因。反腐败搞隔靴搔痒的结果是贪腐官僚对媒体的控
制反而变得更加严厉,强化对媒体控制,对民众的维权和上访严厉打压,各省的驻京办事处私设牢
房关押上访民众,有些办事处还奸污女访民。 第三;集团化,部门化,市场化、黑帮化、高层化的贪官们已经结成巨大的贪腐网,他们互相勾
结、联姻、共用情妇,并与大款黑社会结成“三位一体”,互相保护,共同压迫剥削广大民众。造
成了全国普遍的尖锐的“贫富对立”、“官民对立”和“黑社会与民众对立”。如果贪腐继续发展
下去,会造成重大的社会政治经济危机。现在纵容贪腐和强压民众以维持社会稳定的政策不是治国
的政策,这种高压是难以持久的。 《5》。现在的党政高层忙于权斗,互相拉帮结派,无心无力管贪腐,还纵容贪腐。胡锦涛不是核
心,原来又无班底,需要铁杆支持。支持者就要分享权力和利益,而他们的屁股可能原来就不干
净,或者后来变得不干净。老 J 是特殊(既得)利益集团和贪腐高官的总后台。两派为了其集体的
利益既斗争,又搞利益的平衡和交换,对派内的贪腐加以保护,对派外的贪腐只好听之任之。比如
黄菊就是例子,他的秘书妻子亲戚都贪腐,只有他自己一人是无产阶级革命家。怎能自圆其说。更
坏的是为了拉拢地方官员投靠自己而放纵其贪腐。现在公检法烂掉了,靠不住,搞出个中纪委,中
纪委又管不了政治局成员,办案就只能有选择性、符合派系斗争的利益和平衡的要求了。前深圳市
长许宗衡是靠买官上来的,那卖官者就是幽灵?现在四川的文强是被查出的贪腐 高官,他在四川
贪腐十几年,就没有给他的某位上级打点和上贡?这说明现在中国贪腐之所以猖獗,是根在党政高
层。是高层“不为”,而不是“不能”。 高层家族成员的把柄可能成为绑架高层的人质。中国这个几千年来的封建官僚特权社会,父母
将子女看到比自己的命还重要。姬鹏飞因为保不住出卖国家机密的儿子姬胜德的命而自杀。邓小平
可以枪毙朱德的孙子,但能管住自己所有的子女吗?陈云的女儿 近回忆作为“中国的财经大管
家”,死时只有 2 万存款。这些当然无可置疑。但是,他们这个家族是否与其父辈一样呢?朱镕基
本身无疑一个清官,他能保证他的属下,更重要的是他的儿子也能跟他一样,不贪腐、不利益输送
吗?我相信现在的胡锦涛温家宝本身没有贪腐,可他们为什么没有表现出一些正气和正义感呢?是
自己无能保权位、还是有错误被人抓住、还是家族成员有把柄被人掌握?改革开放后,几乎所有元
老子女都跑到美欧学财经,镀金几年之后,在国外就因被外国财团看中其特殊身份,拿高薪。他们
之中有几个不给外国公司输送情报利益的?回来摇身一变,就是行长、总经理、董事长、总裁、
CEO 等,站住党政高位,成为特殊利益集团中的权贵资本家和买办,成为现在贪腐官员的总代表
和代理人。更可怕的是,他们互相勾结、联姻、近亲繁殖,排忧存劣,形成更疯狂的骄奢淫逸富二
代、富三代。他们轻易地掠取巨额财富,使他们养成了贪婪的本性。他们的辫子可成为父辈高管被
要挟的把柄。各派都因此而无反腐的真心是造成中国现在贪腐猖獗的主要原因。 【四】。结论:中国今后反贪腐形势的 5 种出路 《1》。现在中国的实际情况是胡锦涛不是“核心”,受制于政治局常委中的江派,没有足够的权
威进行反腐(至于他自己是否有决心反腐尚不得而知),在这种情况下,薄熙来的打黑除恶反腐就
是唯一的出路,就有普遍的意义。如果能在他的坚持和影响的不断扩大下,能逐渐得到全国广大民

Academia arena ,2010;2(3)
24
众的支持和中央高层的表态支持,而扩展到全国各省。这样,反腐日后就可能以地方包围中央的态
势出现和完成。但这将是一个长期的艰难的反腐过程,有可能中途夭折。 《2》。即使如上所述,中国现在的特色的体制、制度和环境造成了上面有中国特色 5 化的贪腐状
况,难以清除,但也不是不能清除。正如以前的香港和新加坡一样,只要党政 高层有足够的权
威—即在政治局和常委达成共识,本身公正廉明,无懈可击,而有决心反腐,那 5 化的贪腐还是可
以清除的。特别是,如果老江在 2012 年前荣归八宝山,形成树倒猢狲散,胡温可能放手打黑除恶
反贪,以收复民心,为建立“和谐社会”做些实事。 《3》。如果胡锦涛温家宝政府在 2012 年届满前仍然“空话治国”“无为而治”,官场派系恶斗,
上级管不了下级。官员假大空话满天飞以忽悠民众,却互相勾结以“闷声发大财”。 就是说,如果现在的党中央不能如上 2 条中之一进行反腐,那就只能寄希望于 2012 年的 18
届的中国中央政治局。他们这一代人中,许多人经过文化大革命的上山下乡和工厂劳动,多少体念
到底层民众的疾苦。上无老,下只有独生子女,家庭利益链短,包袱少.比如,习近平.薄熙来,
王歧山.李源朝,汪洋,仇和等等,有助于他们中之一些人施展其政治智慧才能和抱负。不象从前
的许多元老大家族有一大帮太子太妹需要照顾提拔和委以重任,使他们为了家族的私利而牺牲广大
民众的利益,充当腐败官僚买办和大款的代言人和保护伞。18 大中已经没有老 J 的跟班了。而胡
锦涛可能作为军委主席与习等的利害冲突不是很大,也许胡对老 J 还可乘机出口恶气.因此,我觉
得没有太多包袱的 18 大中央领导班子,有可能八仙过海,各显神通,施行一些新政,如打黑反
腐,给社会减减压,如扩大一些党内民主,健全保障社会民众的福利制度等.但愿如此。
而且,又由于新 18 届政治局一定会面临国内外许多重大的危机,如美国向中国转嫁经济危
机,中国的房地产泡沫破灭,高失业和高通货膨胀等。因此,18 大的中共中央在危机面前,只能
从反贪开始,提振民气,这是赢回民心的 佳途径。有了民心,就能克服危机,转危为安。
《4》。同时,如果胡锦涛温家宝政府在 2012 年届满前仍然只能“空话治国”“无为而治”,反过
来将使特殊利益集团会更加疯狂,『今年以来,与特殊利益集团相关联的争论、事件,可谓层出不
穷,遍地开花,从地方政府大开涨戒,从水到电等公用事业大加价,到垄断集团玩弄油荒、气荒之
术,逼宫涨价;再到巨型国企和地方政府联手炒地,“地王”频现, 后是竞争性行业中,出现了
“国进民退”潮。这一切,都被 认为是特殊利益集团的翻云覆雨。』 [3] “上帝让谁灭亡,必先使他疯狂”。现在,在特殊利益集团疯狂掠夺国家和民众财富得不到政
府和民众阻扰的状况下,他们贪婪成性的欲望必然会更加恶性膨胀,当他们弄到天怒人怨、党和政
府危机四伏时,也就是“物极必反”、“否极泰来”之时,到那时,“反贪腐者,得民心,得天
下”,自然会有顺应民意而有远见、有智慧才能、有政治理想的党内高层集体或者领袖出来收拾他
们,正如从前毛泽东邓小平所作的一样,也正如从前的香港和新加坡所作的一样,谁不愿意抓紧
“大好时机”一跃而以成为“转危为安”的英雄人物呢。 因此,一个切实可行的办法就是 18 届党中央成立独立于政治局的中央监察委员会,由薄熙来
任书记,取代现在的中纪委,一方面使共产党“依法治国”,从专政党转变为执政党,一方面严厉
公正的反贪腐。这样,我想,共产党高层被特殊利益集团绑架的时间不会延续到 2012 年的中共 18大之后太久的,因为中共 18 大的政治局已经没有江泽民的贪腐的跟班了,而老江本身也可能力不
从心了。中国的转机仍然取决于政治老人的生命,这也是中国的特色、无奈和可叹之处。
《5》。如果 2012 年的中共 18 大之后仍然继续现在被特殊利益集团操控的路线,不反贪腐,让特
殊利益集团继续他们的好日子。人民对腐败的忍耐力不是无限的。那么,党的创始人,党的第一
任总书记陈独秀所预料到的“二次革命”就会来临,到时,恐怕共产党都可能会成为特殊利益集团
的陪葬品。 ====完==== 参考文献: [1]. 胡星斗中国问题学、弱势群体经济学网站:www.huxingdou.com.cn [2]。韩令国:中国经济必将崩溃在高房价下。www.wenxuecity.com, 时事述评。09-11-11 17:54:41

Academia arena ,2010;2(3)
25
[3]。中国的困扰:普遍、庞大、凶猛的"特殊利益集团"。中评社 于 2009-12-02 09:35:35 [4]。改革 30 年后中国的困惑与出路:出路在壮大中产阶级?DWNEWS.COM—2009。11。4。
第三篇 中国现在发展的国有垄断企业,今后是否会成为祸国殃民的国家垄断资本主义?
【一】。从人性角度认识公有制和私有制的本质。
《1》。自从马克思提出消灭私有制以来,许多人,特别是社会底层民众,从仇富的心理出发,往
往被马克思的错误理论所误导,认为私有制是万恶之源,认为只有消灭私有制,实行公(国)有
制,才能实现社会的公平正义,才能实现和谐社会,才能实现世界大同。然而,前苏联东欧式、中
国的毛泽东式、柬埔寨的波尔布特式、现在的北朝鲜式等各种各样的社会主义制度的彻底失败强有
力的证明:消灭私有制和实行单一的公有(国)制只能给社会和广大民众带来极大的灾乱,使社会
退回到封建专制的极权社会,广大民众沦为贫困的失去自由的奴隶。为什么单一的公有(国)制的
社会主义会失败?因为:1**。当人们把自己所有的财产交给公有或国有时,他就同时失去了生活
和工作的自由和能力,而只能任人摆布,而掌握大量“公共”财富的掌权者就可以随意分配、摆布
和奴隶赤贫的广大民众。2**。当一个人失去财富而只能任人摆布时,他除了向上乞讨或者争夺更
多一点的自由、财产和权力之外,他没有本钱、自由、能力去发挥自己的才智、爱好和理想,以为
社会作更多的贡献。而正是这些好的自由竞争欲望推进了社会、经济和文明的进步。恩格斯说:
“正是人的恶劣的情欲、贪欲和权势欲成了历史发展的杠杆” 。这就是造成所有社会主义国家消
灭私有制后产生贫穷落后的根本原因。由此可见,如果不从人性角度看公有制和私有制,马克思和
恩格斯也只能互相矛盾。马克思是从他的理论和自己的贫困生活环境出发,认为私有制是万恶之
源,但是恩格斯从自由市场的历史发展和现实社会的实践中看到了私有制的自由资本主义具有极其
强大的活力,历史发展的杠杆。3**。现在人类社会已经进入知识经济时代,个人的知识、技巧、
思想、观念等都已成为无形的私人财产,只要给予适合的条件和环境,就可以转化为物质财富,而
这些是无法公有的。这说明了财产或者生产资料公有(国)制的本质缺陷。
《2》。可见,财产的私有制是合乎人性中的“个性自由”、“自由竞争”、“自由发展”的需要
的。所以私有制的自由资本主义是推动社会经济发展进步的主要力量。所谓“公有”,实际上只能
由许多的“个人所有”组合而成。一个没有“个人所有”的“公有”是假“公有”,实际上是为这
些个人之外的别人所有。正如一个团体是由其中的所有个人所组成一样,如果没有组成该团体的所
有个人,该团体就是一个空头团体。但人性有“两面性”或者说“两重性”,是“善”和“恶”同
时并存。就是说,对每个人来说,都是如此。只不过每个人具有不同的“善”“恶”内容和不同的
善/恶比而已。人无完人,金无足赤。但一个人“善的发扬”和“恶的膨胀”都需要有其适合的条
件和环境。因此,一个好的社会制度应能制定出人性中所需的“善的发扬”和限制“恶的膨胀”的
社会条件和环境。所以说,好的社会政治经济制度就应能同时“反恶”和“扬善”。
《3》。那么,在现今的世界上,无论是“社会主义国家”,还是发达的“资本主义国家”,还是
各种欠发达的或者落后国家,都存在着各种不公平正义的、国家欺负掠夺其它国家的、少数人诈骗
压迫剥削奴隶多少人等现象,其产生的根源在那里?其根源在于社会制度尚未能限制少数掌权者和
富豪们坏欲望的“恶性膨胀”。美国发动的历次对外战争都是为了军火、石油和金融集团的利益。
美国 2008 年发生的大金融经济危机就是贪婪的华尔街和金融大鳄们无限制的鲸吞和掠夺国家和民
众财富的结果,麦道夫(Medoff)就是其中之一。中国现在造成社会尖锐的“贫富对立”、“官民
对立”和“黑(社会)民对立”就是贪腐的官员和国有企业高管所形成的“特殊利益集团”“无法
无天”地掠夺、抢劫、出卖国家国民财产、资源和利益的结果,即“坏的人性恶性膨胀”的结果,
当自由资本主义变成垄断资本主义时,当权力被少数人或者个人操纵和垄断时,就会引起社会政治
经济的巨大灾乱。因此,对“权力的垄断”和对“财富的的垄断”才是每个国家的灾乱之源。而
“权力的垄断者”和“财富的的垄断者”又往往是互相勾结和互相输送利益的,是排斥和反对自由
Academia arena ,2010;2(3)
26
资本主义的自由和公平的竞争机制的。所以每个国家只有建立有效地“反权力垄断” 和“反财富
垄断”的法制,才能维持其社会政治经济的稳定持续地发展,才能维持其社会的基本和谐,才可能
使世界免除战争的威胁。就是说,只有把政府官员的权力“关进笼子里”和把垄断资本肆意窃取和
掠夺国家和民众财富的权力“关进笼子里”,才是每个国家稳定持续发展的根本出路。
《4》。人性也有友爱互助合作团结的美好的一面。这种本性在人类还是动物时就储存在其 DNA中。随着人类社会的进步发展,社会分工愈细,这种好的本性就应愈发展。如果人要求自由竞争、
自由发展是人性固有的个性的话,那么,“友爱互助合作团结”就是人性中的共性。二者在人性中
的共存是一个铜板的两面,是相辅相成的。因此,随着社会经济的发展,政府应该从其财政收入、
公有财产、公有资金和基金中提供全体国民所需的愈来愈多的社会福利保障,即提供每个国民生老
病死、教育、住房、工作的基本保障。这也是合乎人性的需要的。可见,财产的“私有制”和“公
有制”都是合乎人性的需要的。问题在于,各个国家应该根据其生产力的发展水平和国情使二者有
不同的内容、比例和适当的配合。
【二】。中国国有垄断企业现在已经成为危害社会政治经济持续发展的祸首
近 15 多年来,中国党和政府大力维护和发展国有垄断企业,危害甚大。正是国有垄断企业的高管
和贪腐的高官们(权贵和买办)形成了现在中国的“特殊利益集团”。他们肆意窃取、掠夺国家和
民众的财富和资源,造成了现在中国社会普遍的尖锐的“贫富对立”、“官民对立”和“黑社会与
民众的对立”。 《1》。在改革开放的前 15 年,绝大多数人为了脱贫和解决温饱,他们与少数先富起来的人们的冲
突不是很大。但现在中国的人均 GDP 已经接近 4000 美元/人年,每个人都有财产和利益需要保
护,形成了与官员和特殊利益集团利益的直接冲突。周瑞金:『上世纪 70 年代末到 90 年代上半
叶,社会各界普遍心情舒畅,改革如牧歌般行进。可是进入 21 世纪,特别是发生了对于市场化方
向的改革争论以后,另一种政策取向占了上风。一些同志转而强调扩大国企的市场份额和对国民经
济的控制力,认为只有强化国企特别是央企才能确保国家“经济安全”。于是,在电力、交通、能
源、电信、金融等领域, 出现了超大型国企,块头之庞大直逼世界 500 强企业(但经济效益,如
资源产出率等与之相比,不可同日而语)。它们不仅保持着经营高度垄断,而且影响到、甚 至一
手把持了市场定价权和政府的产业政策走向。与此同时,普通民营企业介入大中型国企产权改革的
通道被基本堵塞,公司内部人收购办法也被基本叫停。』
《2》。近 15 年中国经济不太正常的发展形成了强大的权贵和买办的垄断资本主义集团,集团主要
是国有垄断企业总裁、董事长、总经理和党政高官家族等,他们是现阶段中国经济发展的主要阻
力。 一位在中国居住了 20 多年的美国官员,一针见血地指出:中国的问题,其实很简单,就是那
么大约 500 个特权家庭的问题。这 500 个家庭,加上他们的儿孙、 亲友及身边工作人员,构成了约 5000 人的核心体系。他们之间还存在着普遍的通婚联姻的关系。他们垄断权力、形成利益集团,
竭力维护现状,并制造了"一旦民主,就会天下大乱"的谎言; 十几亿中国人民,都成了这个小集
团的人质。现在 0.4%的富人占有全国 GDP 的 70%的财富.他们都位居政经高位.其中有许多贪
腐官员已成为黑社会的代言人和保护伞.这是一场中国人民和中国特殊利益集团的较量。 决定胜
负的却是中国共产党。在中共中央四中全会上,全国人民迫切期盼的制定的“官员财产公布制度”
也被置之高阁。这说明,权贵垄断资本主义集团的成员及其代理人已经充塞中共中央政治局高层,
能够左右党的政策和中国社会政治经济的发展方向。可见,中国继续发展和前进的阻力来自共产党
内部及其高层。如果今后的党中央政治局不能清除垄断官僚资本主义集团的成员及其代理人,今后
中国的发展就只能以他们的利益为本。
《3》。『这些央企大多都拜中央(2009 年)四万亿元人民币救市方案之赐,因为这笔刺激经济的
款项,九成由央企实施完成,而与此同时,银行大举授信力挺央企,今年一季度全国信贷规模总量
增加 4.8 万亿元,当中八成投向大企业,仅央企下属地产公司就获得近 400 亿授信资金。此外,股

Academia arena ,2010;2(3)
27
市也是央企套现的 佳途径,目前央企八成资产已经上市,今年第二季度以来,中国建筑 IPO、保
利地产等一系列招股措施接连出台。 『属于央企的中化集团,旗下中化方兴投资管理公司,就经常以“大款”作风在土地拍卖会上举
牌,对地价是否符合市场价格毫不理会,今年六月备受瞩目的北京广渠路 15 号地拍卖如期举行,
中化方兴以 40.6 亿元拿下地王的大款作风,甚至连地产商 SOHO 的董事长潘石屹也为之咋舌。』{1}
《4》。一半央企偷税。唯国税局能查.央企的滥权行为。远不止如此,据《第一财经日报》报道,
国税总局从今年 4 月开始对首批 24 家自查偷漏税的大型企业集团进行抽查,其中 12 家被查出问
题。原因之一就是很多企业的行政级别较高,各地税务稽查机关根本进不了企业集团的大门,只有
国税总局统一组织才得以进行。
《5》。国企的官员是官商一体,其高管亦是高官,他们之中一些人在党是中央委员候补中央委
员,在政府属于部长级或副部长级,他们现在对社会政治经济的发展方向和政策的决策起着导向或
主导的作用。现在人大和政协已成为带着“先进代表”桂冠的富豪和贪官的俱乐部。
『但真正值得关注的,还是围绕着中央经济工作会议,围着明年经济和社会发展的政策,展开
的争论,特殊利益集团及其代言人,再次全面施展其能量,试图影响政策的制定。诸如中国经济是
否出现“拐点”,是否面临通胀,应否纠正“国进民退”,该不该拿出退市安排,结构如何调整,如何
增收入扩内需等尖锐的议题,都没有拿出答案。』 [2]
因此,国有企业,特别是国有垄断企业,如国家银行、中石油、中石化等,是中国 重要
复杂 难解决的问题,它不仅是重大的经济问题,也是重大的政治和社会问题。而且,大部分人们
思想中存在着毛泽东时代对公有制迷信的流毒,误认为国有企业的资产属于全体国民,也有自己的
一分。
《6》。国有垄断企业是产生贪腐主要源头,特别是国有银行是连接官商贪腐的主要链条。今后只
有打破国企垄断,才能使中小企业发展壮大成为国民经济的基础,现在的关键和紧迫的任务在于大
力扶植私有企业特别是私有银行。从长远来看,应该根据国情和需要,逐步将国有企业,转变或转
卖为私有企业,使政府与产生利润的企业完全脱钩,完成政企分开和官商分开的彻底转型。在转变
或转卖过程中,要有效地防止损害职工的权益和高层的贪腐。
《7》。国有垄断企业是 5 高 2 低 2 无的企业:5 高是高工薪、高红利、高贪腐、高浪费、[12] 高消
耗、2 低是低效率、低产出,2 无是无品牌无核心技术。中央纪委书记贺国强表示,反贪行动的重
点应该放在中央直属部门。中国国有媒体去年报道说,从 1998 年到 2006 年间的类似的全国性打击
腐败运动中,共查出官员贪污人 民币 1,406 亿元人民币(合 205 亿美元)。在这类案件中,主要是
官员们贪污挪用公款。贺称这是孳生腐败的土壤。
『至于越来越多的中国企业进入了世界 500 强,我们必须看看都是一些什么样的企业,都是垄
断国有企业!这决非中国人民之福,而是中国人民之祸。这些垄断巨头对于民营企业产生了巨大的
挤出效应,导致民营企业哀鸿遍野。而垄断的国有企业低效率、高浪费甚至高腐败难以避免,譬如
中石油、中石化的效率只有世界同类同规模企业的 1/23,中石油团购住房,中石化一盏灯 156 万,
中石化原老总陈同海平均每天消费 4 万多元,挥金如土,腐败不堪,等等。所以,世界还没有一个
国家依靠国有垄断实现了现代化的,相反,斯大林和希特勒虽然通过国有垄断实现了暂时的经济超
高速增长,但是他们 终不但与现代化无缘,而且给民众带来了巨大的祸害。要知道,现代化国家
无一不是具有强大的竞争性的私人企业,中国也不可能违背经济学规律如科斯定律而创造另类的奇
迹。目前我们只是在经济发展水平非常低而且由于人口众多、经济规模非常大的情况下,依靠国有
垄断实现了暂时的 GDP 增长而已,而经济结构的低级化、产品低端化、国有企业没动力创新、民
营企业被挤压没资金没能力创新、特权垄断造成腐败与两极分化、没有核心技术、缺乏品牌等问题
将永远困扰中国。且不说美国垄断了世界 好的大学、研究所,美国的制度和文化具有自我调适、
自我纠错、不断创新、不断改善的能力,单从经济维度来看,中国离美国也还相差十万八千里。
(胡星斗中国问题学、弱势群体经济学网站:www.huxingdou.com.cn)』

Academia arena ,2010;2(3)
28
《8》。垄断不除产能过剩就难以根治。国有垄断企业是高贪腐高浪费高消耗和低产出低效率的企
业。而国有垄断企业的现任高管们几乎都在为了自己任期内的政绩和权利,大搞重复建设,恶性竞
争,造成产能过剩。比如钢铁企业,对澳大利亚的高级铁矿石不能共同抵制,使外国公司可自由的
抬高价格,对各自产品为了快速销售,又竞相压低价格。所以造成中国在国外“买什么,什么
贵”,“卖什么,什么贱”的现实。现在政府以发展高科技为名,动辄盲目地化数千亿元到处兴建
高铁,到处炫耀中国高铁的公里数将达到世界的 1/2,问题在于;这些高铁的巨额建设费除了
(10~20)%可能落入贪腐的高管的腰包之外,除了京沪高铁之外,其它的高铁恐怕都会与上海磁
悬浮铁路一样,可能成为永无经济效益的摆设,新运行的武广高铁的空置率达到 40%。如果高铁
继续以现有的速度发展,其收入将不足以支付债务利息。这其实就是高贪腐高浪费的形象工程,就
是一种产能过剩。
《9》。国有垄断企业中的高层是形成现今中国权贵垄断资本特殊利益集团的主要成员,其中的许
多中上层人物是买办卖国贼,他们中的一些人的发家都靠暗中向外国公司或国家出卖政治经济利益
或机密。已揭老底和被处死的姬鹏飞的儿子姬胜德就是其中之一。商务部的周京毅案也是一例。
2009 年,美国国会通过议案指责美国公司向中国中石油等 3 大公司行贿,中国政府调查后,否认了
美国的指责。老百姓要相信谁呢?这个集团中有许多人可能是裸官,和陈水扁一样,将大量非法获
得的财产转移到他们外国的亲属。因此,这些人都是国家的蛀虫和内奸。
【三】。所谓的公有制或者国有制,现在事实上已都演变成比封建制度好不了太多的家族
式的“特殊利益集团”的集体占有制, 《1》。现在的国有企业实在是政府用大量纳税人的钱将企业的资产和资金无赏的短期轮流地承包
给某些特殊的权贵或买办精英,然后任由他们挥霍巧取豪夺。这种与国家将土地承包给农民还不相
同,农民在土地上还要投资,自负盈亏。而国企的这些高层官员不带给企业一分钱,赚了多落入他
们的腰包,亏了由政府买单,他们完全都是在空手套白狼。绝大多数人都是为了大捞一把然后走
人,将财富转移并移民到国外。这就是为什么太子太妹们不愿意自己创业,而都愿意跑到国企当头
头的原因。据报道,2009 年,中国到美国的投资移民增加了 1倍。他们赚钱越多,跑得越多。
《2》。国有企业的高管都是太上皇。『我们厂区的领导是地道的太上皇,在厂内差不多可以呼风
唤雨为所欲为。在那里没有任何正义良知,一切唯领导的马首是瞻。我们单位稍微有点姿色的女职
工,几乎都和领导有一腿。多数是主动投怀送抱,少数是领导利用职权逞强弄到手的,就算中央首
长也不一定有我们领导风流快活。拍马屁的不仅仅是没廉耻的女人,知识分子也一样不甘示弱。单
位评工程师、高工论文全靠抄袭,每篇论文都要把领导的名字挂在前面。』 [3] 使人异于奴隶的核
心价值正是言论自由和财产权。人必须先有财产权才能保障其他权利和自由,这也完全符合经济地
位决定政治地位和文化精神需要的理论。而贫困的底层大众只能忍受宰割。
《3》。国有企业的高层是特殊利益集团的主要成员,他们疯狂地贪腐和捞钱。『我在几家大国企
干过,情况都差不多,都是‘不赚钱’而‘在捞钱’。国企除了垄断行业外,基本上多处于实质上的亏
损状态,多靠贷款拔款维持。垄断大企业虽然眼前在大赚特赚,但本质上不是通过自己的业务“赚钱”,而是变相“捞钱”。因为垄断,就可无限制提高价格获取超额垄断利润,就象石油价格一样,
吃亏的是平 民百姓,依旧是在向人民大众‘捞钱’……』 [3]
《4》。国有企业对底层员工的压榨似于血汗工厂。『别以为只有沿海的私营企业存在‘血汗工
厂’,国有企业就一定注重职工福利。我们公司也是知名的国有大企业,可一样存在无限制剥削工
人的‘包身工’现象。 领导们的待遇和职工相比就象赤道和南极相差那么巨大,实际收入差距不是几
倍而是几十倍甚至几百倍的悬殊!那些资历较老的工人的工资福利也许还过得去,可对资历浅的工
人则是赤裸裸的血汗压榨,并且根本没有地方可以申诉。只因冲着‘国企’名头寄希望于未来,希望
将来有机会‘论资排辈’,他们才忍气吞声往前苦熬。 我们单位的一个新项目招徕的新工人一个月就
给 400 块钱,然后加班加点 ,一年到头难得有几天休息时间,如果出了差错就使劲地扣钱……』 [3]

Academia arena ,2010;2(3)
29
《5》。在垄断的国有企业和部门,到处都是独立王国,大王国内套小王国。各种大小独立王国都
为了本单位和部门的利益互相斗争扯皮内耗,建立保护区和势力范围,以掠取更多的人力、财力、
物力以自肥。在垄断的国有企业里,政经合一 ,大官大富,小官小富。这还不算大官大贪,小官
小贪。因此, 『今年以来,与特殊利益集团相关联的争论、事件,可谓层出不穷,遍地开花,从
地方政府大开涨戒,从水到电等公用事业大加价,到垄断集团玩弄油荒、气荒之术,逼宫涨价;再
到巨型国企和地方政府联手炒地,“地王”频现, 后是竞争性行业中,出现了“国进民退”潮。这一
切,都被认为是特殊利益集团的翻云覆雨。』[2] 。 《6》。国企高管是“官”身,地位高,后台硬,政府不好管,也管不了。由于国企高管往往是自定
薪酬等原因,难以控制他们的个人工资和红利总量。其一,要解决国企的垄断特权。国资委所管辖
的央企中,垄断行业占据了半壁江山。国企高薪的主要原因在于垄断,因此,针对国企的工资改
革,重点要针对垄断,但现在的改革一直没有勇气打破垄断,这导致一些国企依然垄断着,高管们
依然享受着高薪。其二,要约束国企高管的权力。国企高薪一方面是作为垄断行业的平均工资过
高,另一方面是高管工资过高。尽管有关方面早在 2003 年就开始治理国企高管“违规薪酬”,党
纪、政令出了不少,但效果怎么样大家都知道。
【四】。分析和结论:中国现在已处在社会政治经济发展的“拐点”,今后将何去何从?
由于现在有些现政府的高官们争权势,表正统,又纷纷地“久有凌云志,重上井冈山”,这说明当
今中国社会政治经济的发展不仅面临“拐点”和“临界点”,而且也面临歧路、倒退和危机。现在
中国贫富悬殊已造成了严重的对立,又刮起了一股“国进民退”的歪风,“特殊利益集团”疯狂扩
权和捞钱,左右政府的政策,企图退回到毛泽东式社会主义的老路。中国将何去何从?
《1》。垄断资本主义是 坏的资本主义,其扩张和恶性膨胀到在社会经济生活中起决定作用时就
是帝国主义,帝国主义是寄生、腐朽、垂死的垄断资本主义。按照列宁的观点,帝国主义是无产阶
级革命的前夜。因此,中国现在大力维护和发展的权贵和买办为首的国有垄断企业,搞“国进民
退”实际上就是在搞“国家垄断资本主义”。中国的国家垄断资本主义因为与政府权力直接结合,
能够操纵和控制政府权力和政策,而比私有垄断资本主义更贪婪、更具掠夺性,因而更危险。 第一次世界大战的暴发就是由于当时许多的的资本主义国家由自由资本主义发展成为垄断资本
主义,国际托拉斯为争夺殖民地而要求重新瓜分世界所引起。”希特勒的国家社会主义,其实质就
是国家垄断资本主义,导致第二次世界大战的发生。但是希特勒的上台是由于他大搞福利社会这一
非常超前的制度(二战后英法等欧洲国家才开始享受到),受到了德国当时劳工的普遍欢迎。纳粹
党是真正的社会主义者。特别是没收私人工厂,改组为国家工厂的行为,这是社会主义者常年的理
想。这与中国的“国进民退”歪风相符。二战后美国所发动的各次战争都是为了军火、石油、金融
等垄断集团的利益。 如果中国今后仍然长期坚持地继续无限地发展国有垄断企业,就是犯了方向路线的错误,它与
社会主义的原则—平等、公正、正义、和邓小平的共同富裕等观念完全背道而驰。只要回头看看上
面各节的事实和叙述,就完全可以看清中国现在国有垄断企业的真面目和本质。一旦中国的垄断资
本主义也扩张和恶性膨胀到在社会政治经济生活中起决定作用时,是不是也成为帝国主义?是不是
也成为无产阶级革命的前夜?列宁在《国家与革命》中解释“革命就是穷人反对富人的斗争”,是否
会因国家资本主义在中国的的恶性膨胀而发生革命?一些西方学者怀疑中国今后的“和平崛起”,
而散布“中国威胁论”,并非完全没有根据。
北京理工大学的胡星斗教授认为,中国的未来发展对中国自身,对世界的影响是什么,这关键
要看中国自己选择什么样的道路:『如果未来中国能够进行政治体制改革,如果能够在保护人权,
发展民主法治方面取得更大的进步,那么中国的崛起对世界是福;如果中国像目前这样,在法治
化、市场化方面反而有所倒退,那么中国的崛起有可能对世界是个祸,就像当年斯大林的崛起、甚
至希特勒的崛起 那样。』[4]
《2》。只有民营企业是中国未来的希望,具有强大的竞争性的私人企业是现代化国家的支柱。民
营企业的繁荣昌盛才是民富的根源,是产生中产阶级,扩大内需,持续扩大就业的主要来源,是社
Academia arena ,2010;2(3)
30
会稳定的基础。只有在全国城乡各处发展私人银行和私人企业才能 后使农村市镇化,政府应该根
据国情条件和需要将无必要的国有化企业在保障不损害职工利益的条件下转化为私有化和股份化企
业。首先应该将国有商店如旅馆百货市场等等值地转卖给私人企业。 国有企业和私人企业(也就是自由资本主义)的熟优熟劣,其实是不言自明的。如果用同等的
资金给国有企业和私人企业办相同的企业,使其互相竞争。肯定国有企业的纳税、就业人数和利润
均会少于私人企业。因为私有企业主会对自己企业的得失成败负完全的责任,而国家企业的高管
(特别是太子太妹和买办)几乎都是为了捞一把,即为了空手套白狼而来。
《3》。从长远看,只有党和政府转型,即只有从制度上彻底地将“政治经济分开”和“官商分
开”才是民富国强、社会政治经济稳定持续发展之正道。发展自由资本主义,让私人去经商赚钱,
政府成为公正廉明的执法者、管理者和服务者。现在中国这种亦官亦商的制度造成了“财富垄
断”、“官商勾结、权钱交易”和“贫富对立”。在改革开放的头 30 年,由于这种制度能够集中
全国的人力、财力、资源办大事,搞基层经济建设,使中国经济取得了 30 年的高速发展。但是,
在已形成权贵和买办“特殊利益集团”的条件下,今后如果仍然长期坚持实施这种制度,将国无宁
日,会形成一个分裂的社会。。要做到党政转型的先决条件是共产党需先转型,即由“一党专政”
党转型为执政党,从制度上和实际上改变“党大于法”和不“依法治国”的状况,从而改变官员
“权大于法”的现实状况。
《4》。回到上面所说的前提,如果要想中国今后做到“以人为本”、“稳定持续地发展” 、“民
富国强”、 “和谐社会”和“科学发展”,就不要“空话治国”,以造成“空话误国”。而要坚
持切实地、逐步有效地从制度上做到反对对“财富的垄断”和对“权力的垄断”。这是根本的唯一
出路,即给国企高管予以正确的定位—官商分离。如果国企高管是“官”,他们的工薪就不应该超过
高官员的工薪。如果他们不是官,是大款,不管他们是“红色”、“白色”、“黑色”,一律都
应该排除出党政高层,让他们在自己的职位上将企业做大做强,并接受政府执法机关的监督,无需
他们花费时间、精力和任务去制定维护和扩大他们自己利益政策和决策。没有必要给他们戴上“党
中央委员”、“先进代表”、“人大政协委员”等桂冠。
《5》。因此,中国今后经济发展的正确方向其实很简单,应该是:(a). 限制、反对、取消垄断的
国有企业和私有企业;使国有垄断企业逐步增加私有股份,使国有股份逐步减少到次要成分,使董
事会能够有效地按照法律和政策监督企业的管理。国家资金也要部分的购买私人垄断企业的股票,
还要依法分割其垄断。 (b).大力发展私有制的中小企业、服务业、特别是私人银行,即 大力发展
自由资本主义; (c).逐步完善基本的社会福利保障体制,使全体国民的生老病死、住房、教育、
工作等 7 大项逐步得到保障和逐步完善。
因此,中国只有从现在起,逐步切实地实行反对、打击、取消国有垄断企业和权贵买办的“特
殊利益集团”,彻底打破官商一体的少数家族“垄断财富”和“垄断权力”准封建制度,才能使社
会政治经济的发展拐回到“以人为本”和“科学发展”的正确道路上来。如果顽固地坚持现行的发
展模式走下去,而中途所遇到的危机不能使其拐弯和改变发展模式的话,10 年之后,中国可能发
展成为祸国殃民的国家(家族)垄断资本主义。 ====完====
参考文献: [1]. 总算闹明白了 :中央救市 4 万亿元部分竟是央企炒地本钱. 作者 香港特约记者 郑汉良 华盛顿人 于 2009-12-17 08:42 编辑 www.backchina.com [2].中国的困扰:普遍、庞大、凶猛的"特殊利益集团" 中评社 www.wenxuecity.com.2009-12-02 [3]。熊飞骏:国有企业内部的悲剧景观。http://www.kdnet.net。二 00 九年十月二十八日 [4].中国崛起惊天下, 是福是祸是真是假?信源:美国之音|2009-12-20| 网址: http://www.popyard.org

Academia arena ,2010;2(3)
31
The Real Estate in China before and after 2019
Dongsheng Zhang
Email: [email protected]
Abstract: This article describes the real estate in China before and after 2019. [Academia Arena, 2010;2(3):16-31] (ISSN 1553-992X).
Keywords: real estate; China; capitalism
12/23/2009
Academia Arena
http:/www.sciencepub.net/academia [email protected]
32
Regarding ultimate fate of our mother earth Manjunath. R. (Reader in physics)
#16, 8th Main road,
Shivanagar, Rajajinagar,
Bangalore-560010
Karnataka, India
Abstract: From past several centuries many scientists are struggling hard to understand the truth of ultimate fate of our mother earth . Most of the assumptions and predictions regarding the ultimate fate of our mother earth have been proved to be wrong .I have made an attempt to figure out the ultimate fate of our mother earth through a mathematically derived equation i.e R = c/ H cosec θ [ (ρ / ρ0 )^ 1/3 - 1] { where R=Radius of elliptical orbit in which earth moves around the sun, c= speed of light in vaccum (3*10^8m/s), H=present Hubble constant ( which is the function of time), ρ0 = present mass density of universe , ρ= later mass density of universe which vary with respect to time ‘t’. θ =angle between concepts d1 and d respectively}.The above expression was developed based on cosmological, astronomical and mathematical concepts.The above paper also describes about the variation of radius of earth’s elliptical orbit around the sun with mass density of infinite universe. [Academia Arena, 2010;2(3):32-40] (ISSN 1553-992X).
Keywords: Angle, Density, Radius
Introduction : The Universe comprises everything we perceive to physically exist, the entirety of space and time, all forms of matter and energy, and the physical laws and constants that govern them . It is believed that earth is only a part of our universe and only place in the Universe in which life is known to exist . As the result of our universe expansion distant galaxies are moving away from the earth. Moreover there is variation of mass density of infinite universe with respect to time due to the cause of expansion. Hence there is change in radius of earth’s elliptical orbit around the sun with mass density of infinite universe. Every beginning of nature’s creation has an end. Earth is created by law of nature and it will be destroyed by the nature itself. When the mass density of infinite universe remains constant i.e ρ / ρ0 = 1 (ρ = ρ0 ) ,then the value of radius of earth’s elliptical orbit around the sun will become 0 i.e R=0. The ultimate fate of earth depends totally upon the mass density of universe.The ratio ρ / ρ0 also varies with the value of θ.

Academia Arena
http:/www.sciencepub.net/academia [email protected]
33
Derivation:
A B
D
R S R
dd1
d
Figure1: Parallax method
D=distant galaxy S=sun.(center of the solar system). R=Radius of elliptical orbit in which earth moves around the sun. A and B are the position of earth at different instants of time respectively. d1=distance between sun and distant galaxy. d=distance between earth and distant galaxy. θ =angle between d1 and d respectively. From triangle SDB , tan θ=R/ d1 i.e d1=R / tan θ By appyling law of Pythogarous theorm to triangle SDB we get BD^2=DS^2+ SB^2 BD= d, DS= d1, SB= R i.e d ^2= d1^2+ R ^2 (As d1=R / tan θ ) Then the equation d ^2= d1^2+ R ^2 becomes d ^2= R ^2 /tan^2 θ + R ^2 d ^2= R ^2(1 /tan^2 θ + 1) ,as (1 /tan^2 θ + 1= cosec^2 θ ) The equation d ^2= R ^2(1 /tan^2 θ + 1) becomes d ^2= R ^2 cosec^2 θ i.e d = R cosec θ is obtained. According to Hubble law: Greater the distance of distant galaxy from the earth(observer on earth) ,greater is the velocity with which distant galaxy moving away from the earth (observer on earth) Hence mathematically represented by the equation v=H d where H=present Hubble constant ( which is the function of time) . v= velocity with which distant galaxy moving away from the earth (observor on earth) . d= distance of distant galaxy from the earth. As d = R cosec θ then the equation v=H d becomes v=H R cosec θ is obtained . Let us divide the above equation v=H R cosec θ by c where c= speed of light in vaccum (3*10^8 m/s) Then we get v/c=H R cosec θ /c is obtained.
If a source of the light is moving away from an observer, then red shift (z > 0) occurs; if the source moves towards the observer, then blue shift (z < 0) occurs. This is true for all electromagnetic waves and is explained by the
Academia Arena
http:/www.sciencepub.net/academia [email protected]
34
Doppler effect. Consequently, this type of red shift is called the Doppler red shift. If the source moves away from the observer with velocity v, which is much less than the speed of light (v << c), the red shift is given
(Since ) where c is the speed of light in vaccum. i.e v/c = Z (where Z=Red shift) i.e Z= H R cosec θ /c is obtained Another application of the z parameter is to imply the scale factor R of the universe at the time that light was emitted from a given observed galaxy The z parameter is related to R by the expression 1+Z=λ Observed / λ emitted = R0 /R = 1/R . Since the present scale factor of universe is taken as R0 =1 . The z parameter can also be used to assess the mass density compared to them mass density ρ0 at the present time. ρ = ρ0 / R^3 , we know mass density of universe vary with respect to time where ρ0 = present mass density of universe. ρ= later mass density of universe which vary with respect to time ‘t’ . As 1+Z = 1/R , Cubing of equation 1+Z = 1/R we get ( 1+Z)^3 = 1/R^3. The equation ρ = ρ0 / R^3 becomes ρ / ρ0 = 1/ R^3 i.e ρ / ρ0 = ( 1+Z)^3 is obtained. (ρ / ρ0 )^ 1/3 = ( 1+Z) , As ( Z= H R cosec θ /c ) . Equation (ρ / ρ0 )^ 1/3 = ( 1+Z) becomes (ρ / ρ0 ) ^1/3 = ( 1+ H R cosec θ /c) (ρ / ρ0 )^ 1/3 * c = ( c + H R cosec θ ) . H R cosec θ = (ρ / ρ0 )^ 1/3 c ‐ c . H R cosec θ = c [ (ρ / ρ0 ) ^1/3 ‐ 1] i.e R = c/ H cosec θ [ (ρ / ρ0 )^ 1/3 ‐ 1]. Where R=Radius of elliptical orbit in which earth moves around the sun. c= speed of light in vaccum (3*10^8m/s) H=present Hubble constant ( which is the function of time) ρ0 = present mass density of universe. ρ= later mass density of universe which vary with respect to time ‘t’. θ =angle between d1 and d respectively . By taking the the ratio (ρ / ρ0 ) =1 Hence Mass density of universe remains constant . then R = c/ Hcosec θ [ (1)^ 1/3 ‐ 1]. R = c/ H cosec θ [1 ‐ 1] . Since (1)^ 1/3 = 1 (cube root of 1 is 1) . i.e R = c/ H cosec θ [0] then R= 0 . Hence Radius of elliptical orbit in which earth moves around the sun is zero i.e R=0. As R= 0(distance between the earth and the sun is zero) .
Proof for the equation ρ = ρ0 / R^3
Please refer Doppler Red shift ( Google search )
At such large values of z, the redshift is mainly the cosmological redshift, and not a valid measure of the actual recessional velocity of the object with ... hyperphysics.phy-astr.gsu.edu/Hbase/astro/redshf.html - Cached - Similar

Academia Arena
http:/www.sciencepub.net/academia [email protected]
35
Result : When (ρ / ρ0 ) =1 i.e ( Mass density of universe remains constant ), then there is no distance between sun and earth .Thus our mother earth will come into an end( Earth and sun are close to each other).
Discussion and Conclusion : As we know our infinite universe is growing and expanding. Hence we can observe variation of mass density of universe with respect to time ’t’. Many questions like Does the universe expands forever or contracts …….come into our mind, when we think about our universe But the answer will again become a question itself. If the mass density of universe remains constant( mass density does not vary with time) then R=0 i.e there is no distance between sun and earth. If the collapse of earth towards the sun happens we are just a human being in front of nature who can do nothing but simply watch like a movie in an astonished way. Creation of earth took billions of years but destruction of earth will take only few seconds .There after deep silence remain in our universe . The value of ρ / ρ0 vary with the value of θ. For example : if θ= 0 degree then HRcosec θ /c +1= (ρ / ρ0 ) ^1/3 i.e (ρ / ρ0 ) ^1/3 = infinity i.e Z=infinity If θ= 90 degree then HR /c +1= (ρ / ρ0 ) ^1/3 i.e Z=HR/c ( Z= red shift) .
Additional information:
Does energy and impulse are interconvertable
Consider a photon of relativistic mass ‘m’ moving with speed ‘c’ is associated with the wavelength ‘λ’ is given by the relation λ=h/mc, Where h=planck’s constant (6.625*10^-34 JS).
According to wave theory, speed of the photon wave is given by c = λ /T, where T= time period.
By substitution of value of ‘c’ in the equation λ = h/mc, we get the expression m λ^2 = hT.
According to wave theory, as frequency of photon wave is given by f=1/T.
Then the equation m λ^ 2 = hT becomes f=h/mλ^2
De Broglie wavelength associated with the photon is given by λ= h/p,
thus the equation f=h/mλ^2 becomes f=p/mλ.
Angular frequency associated with the photon is given by ω= 2 πf.
By putting the value of f=p/mλ. in the above equation we get ω= 2 πp/mλ.
The above equation ω= 2 πp/mλ. can be applied to both photons and material particles like electron in motion. Debroglie wavelength associated with the electron is given by λ=h/mv
Where v=velocity of electron in motion
Then the equation ω= 2 πp/mλ becomes ω= 2 πpmv/mh i.e ω= 2 πpv/h.

Academia Arena
http:/www.sciencepub.net/academia [email protected]
36
Part: 2 Consider a electron of mass “me” at rest, total energy associated with the electron is given by “me c^2”. Suppose radiation of energy hf is incident on this electron at rest. Part of energy hf” is absorbed by electron and part of energy hf’ is scattered by electron . Absorbed energy hf” is converted to motion of electron, hence electron travels a distance ‘x’ in time ‘t’. let θ be the scattering angle.
Figure :1 –schematic diagram of scattering of energy of photon by electron
x= Linear displacement of electron
hf = Energy of incident radiation
hf’ = Energy of scattered radiation
θ = scattering angle
Consider a parallelogram ABCD constructed as shown in the figure 1.
Let AB=CD=x, AD=BC=hf, AC=hf’(opposite sides in parallelogram are equal)
Law of cosine is given by a^2=b^2+c^2-2bc cos θ. Let a = x, b=hf, c=hf’, cos A = cosθ.
By applying the law of cosine to the triangle ADC, we get
X^2=(hf)^2+(hf’)2-2(hf)(hf’) cos θ = 1
By law of conservation of momentum of photon.
We get →→→
+='" yyy
ppp where →→→
'",,
yyyppp be the momentum of incident, absorbed and scattered photon respectively.
Let us assume absorbed momentum of photon = momentem of electron
i.e. →→
= ppy"

Academia Arena
http:/www.sciencepub.net/academia [email protected]
37
Thus →→→
+='yy
ppp where →
p = momentum of electron
→→→
−='yy
ppp Squaring on the both sides we get
P^2= ⎟⎠⎞
⎜⎝⎛ −
→→
'yypp ^2, as (a-b)^2=a^2+b^2-2ab
Thus the above equation becomes p ^2=py ^2+py’ ^2-2 |→
p y . →
p y’|
According to dot product rule | →→
• ba |= |a||b|cosθ
Then we get p^2= py ^2+ py’ ^ 2-2| py | | py’ | cos θ
Let us multiply the above equation by c ^ 2we get
Where c = speed of light in vaccum (3* 10 ^ 8 m/s)
P ^2 c ^2 = py ^ 2c ^2 +py’ c^2-2| py | | py’ |c^2 cos θ
As we know frequency of photon is directly proportional to it’s momentum
i.e hf = pc thus the below equation is obtained
p ^2 c ^ 2= =(hf)^2+(hf’)2-2(hf)(hf’)cos θ = 2
By comparison of 1 and 2 we get x ^ 2 = p ^2 c^ 2
i.e x = pc (position of electron is defined as the function of it’s momentum)
As told earlier position of electron is defined as a function of it’s momentum i.e x = pc
Small change in momentum of electron causes small change in it’s position i.e. dx = dpc hence,
dp = dx/c
Newton second law of motion is mathematically represented by equation F=dp/dt
Where F = force exerted by photon
dp = Small change in momentum of electron with respect to time
As dp = dx/c then the above equation becomes F= dx/dtc.
as velocity of electron is defined as v = dx/dt.
Then F =v/c is obtained

Academia Arena
http:/www.sciencepub.net/academia [email protected]
38
Force exerted by photon is defined as function of velocity of electron
As impulse exerted by photon is mathematically given by I = F dt.
then the equation F= dx/dtc becomes Fdt = dx/c
i.e I =dx/c
Impulse exerted by photon is defined as function of change in position of electron
At point A and B mass of electron is me i.e total energy associated with electron is mec^2. (As electron is at rest at point A and B) But in between point A and B mass of electron is mc^2 (since electron is in motion in between point A and B ) Hence Total energy of electron in motion is mathematically given by E= mec^2+hf’ (As absorbed energy adds up to rest mass energy ) where E= total energy of electron in motion hf’=absorbed energy of photon mec^2=rest mass energy of electron As x=pc (position of electron is defined as the function of its momentum) As absorbed momentum of photon equals the momentum of electron i.e py’’= p then x= py’c py’c=hf’then x=hf’ then the equation E= mec^2+hf’ becomes equation E= mec^2+x=3 According to Einstein equation E= mec^2+Ek=4 By camparison of 3and 4 we get Ek = x i.e kinetic energy of electron = position of electron . mc^2= mec^2+x , let us multiply the equation by c^2 then we get m = me +x/c^2 . Thus m approaches me by the factor x/c^2 i.e relativistic variation of mass of electron with respect to its position Small change in kinetic energy of electron causes small change in its position i.e d Ek = dx i.e I =dx/c i.e I= d Ek/c i.e d Ek=Ic
According to Work energy theorm Work done on particle equals change in kinetic energy of particle i.e W= d Ek i.e W= Ic Work done on particle involves storage of energy in particle i.e W=Ea where Ea= Energy stored in particle. Ea =Ic ,energy stored in particle is defined as a function of impulse applied on the particle Thus Ea a I (as c is constant ) i.e Impulse and energy are interconvertable.
Result: Energy is in direct measure of impulse applied is given by relation Ea =Ic.
Relativistic variation of mass of particle with respect to its position is given by the relation m = me +x/c^2
For example: Foot ballplayer applies a very large force on football in very short time ( very large force applied on foot ball in short time is impulse) thus foot bal l player loses some energy in the form of impulse applied by the player.Foot ball gains energy in the form of impulse applied on it .Thus impulse and energy are interconvertable

Academia Arena
http:/www.sciencepub.net/academia [email protected]
39
2) Proof for Einstein predicted formula E=tc As x = pc (position of electron is defined as the function of its momentum)
As momentum of electron can be given by p= m v then the equation x = pc becomes x=(m v)c i.e x/v=mc According to Newton v=x/t i.e Equation x/v=mc becomes t = mc ( m= relativistic mass of electron) According to Einstein E=mc^2 hence E=(mc)c becomes E=t c
Energy= time * speed of light in vaccum
Acknowlegement:
I would like to express my deep gratitude to all those who gave me the possibility to complete this thesis. My sincere thanks to the Lord Ganesha, Editor of “Nature and science” journal, my physics teachers, & parents.
Correspondance to:
Manjunath. R.(Reader in physics)
#16,8th Main road,
Shivanagar, Rajajinagar,
Bangalore-560010
Karnataka, India
Contact: res -080-65960971
mob: 91-9008487836 [email protected]
References:
1) Doppler red shift (hyperphysics.phy-astr.gsu.edu/Hbase/astro/redshf.html - Cached - Similar)i.e Google search. 2) Hubble law From (Wikipedia, the free encyclopedia). 3) Red shift (From Wikipedia, the free encyclopedia).
4) Parallax (From Wikipedia, the free encyclopedia). 5) Pythogarous theorm (From Wikipedia,the free encyclopedia).

Academia Arena
http:/www.sciencepub.net/academia [email protected]
40
6) Universe (From the free Wikipedia encyclopedia).
7) Trignometry (From the free Wikipedia encyclopedia).
8) Gravitation (From the free Wikipedia encyclopedia).
Date of submission: 26.1.2010

Academia Arena 2010:2(3)
http://www.sciencepub.net/academia [email protected]
41
SORBENT CAPACITIES AND INTENSITIES OF
THERMOCHEMICALLY CRACKED SHEA NUT SHELLS FOR
THE REMOVAL OF WASTE WATER DYESTUFF
Itodo A. U.1 and Itodo H. U. 2
1Department of Applied Chemistry, Kebbi State University of Science and Technology, Aliero, Nigeria
2Department of Chemistry, Benue State University, Makurdi, Nigeria
Abstract: The sorbent capacities and intensities of activated carbon by one-way thermochemical pyrolysis of shea nut shells were studied on waste water dye removal and the results are presented in this paper. The relationship between the ordinary (kf), maximum (qm) ,and theoretical saturation capacities (qD ) were also investigated to follow the order ; qm > qD > kf. H3PO4 catalyzed sorbent at a longer activation dwell time, SS/A/15 presented a higher adsorption capacities (qm=6.024 mgg-1,qD=4.189 mgg-1 and kf = 0.628 ) and higher sorption intensity (1/n =0.714) ,than the other 3 series.The high % dye removal (%RE up to 84.80%), adsorption normalcy (1/n <1 and RL<1) and good applicability (R2 >0.869) are critical for considering shea nut shells as precursor for generating low cost active biosorbents. [Academia Arena 2010;2(3):41-50]. (ISSN 1553-992X).
Keywords: Adsorption capacities, intensities, Dye, Shea nut shells, waste water
1. INTRODUCTION
Textile, just like plastic and paint industries is known to utilize a great deal of water and thus releases large quantities of waste water from different stages in the dyeing process (Hameed and Hakimi,2008) some stages requiring water utilization includes scouring and rinsing, bleaching, dyeing and printing (USEPA, 1991). Effluent derived from the textile and dyestuff activities can provoke serious environmental damage on neighboring water receptor bodies and the ever increasing populace. The main threat is the toxin, chlorolignin and dark coloration (Hameed, 2009)
Various treatment technologies have been developed
for purification of waste water. The most commonly
used methods includes chemical precipitation,
solvent extraction, oxidation reduction, electro
dialysis, electrolyte extraction, reverse osmoses, ion
exchange, evaporation concentration adsorption,
filtration etc. Among these methods, adsorption has
evolved as the optimum choice (Mohan and Signh,
2001). Activated carbon includes wide range of
amorphous carbon based material prepared to exhibit
a high degree of porosity and an extended inter-
particulate surface area (Zahangir et al., 2008). These
qualities impart activated carbon with excellent
adsorbent characteristics that make it useful for
filtration, purification, deodorization, decolorization
and separation (Zahangir et al., 2008).
Adsorption on activated carbon has long been
recognized to be one of the most effective methods
for removal of organic compounds, including
dyestuff from aqueous solutions. Agriculture waste

Academia Arena 2010:2(3)
http://www.sciencepub.net/academia [email protected]
42
such as oil palm nut shells, rice husks, olive waste
cakes, coconut shells and guava seeds have be
reportedly used (Rahman et al., 1997 Rahman et al .,
2000; Rahman et al 2002 ) .wastes of animal origin
such as human hair, cow biosolids, poultry litter,
blood, Fish, etc. were also reported (Itodo et
al.,2008).
Adsorption isotherms can be generated based on
numerous theoretical explanations. The simplest
model that can be used to describe monolayer
adsorption is the Langmuir equation (Meghea et al.,
1998). The Langmuir equation is based on kinetic
approach and assumes a uniform surface, a single
layer of adsorbed material and constant temperature.
This model is useful when there is a strong specific
interaction between the surface and the adsorbate so
that a single adsorbed layers forms and no indication
of formation of multilayer adsorption. The driving
force is the concentration of adsorbate in the fluid
and the area or amount of bare surface (Chilton et al.,
2002). Hameed, 2009 presented a linearized form of
the Langmuir equation as ;
1/qe =1/kaqmCe +1/qm --- -------- ----(1)
Where qm (mgg-1) and ka (L/mg) are
Langmuir constant related to the maximum
adsorption capacity and energy of adsorption
respectively. These constants are calculated from the
plot of 1/qe verses 1/Ce (Hameed,2009).
Mattson and mark (1971): in Chilton et al.,
2002 described Freundlich model as the most popular
adsorption model for a single solute system. This
model is an empirical equation based on the
distribution of solute between the solid phase and the
aqueous phase at equilibrium. The bases of the
Freundlich equation is given as equation (2)
x/m = kCe 1/n ------- ----------- ------ (2)
where, for the purpose of this research, x is
the amount of dye adsorbed (mg), m is the weight of
sorbent or sorbent dose (g) , x/m = qe is the amount of
dye adsorbed by a unit mass of sorbent, Ce (mgl-1) is
the equilibrium concentration of dye in solution while
k and n are empirical constant equation 2 can further
be rearranged as equation 3
log qe = log kf + (1/n) log Ce --------(3)
this empirical equation has no bases in theory but
made two assumptions which are (i) it assume
heterogeneous surface energies (Hameed et al., 2006)
that is, exponential variation in site energies (ii) it
assumed that surface adsorption is not the rate
limiting step. (Chilton et al., 2002). kf (mgg-1(1mg-1)n
is the Freundlich constant implying the adsorption
capacity (Hameed et al, 2006) one most important
parameters in equation (3) above is the 1/n value. 1/n
ranging between 0 and 1 is the measure of the
adsorption intensity or surface heterogeneity. surface
becomes more heterogeneous as 1/n gets closer to
zero. It describe adsorption as either normal (1/n <1)
or as a cooperate adsorption (1/n >1) (Hameed et al.,
2006). Chilton et al., 2002 argued that large values
for 1/n indicate a larger change in effectiveness over
different equilibrium concentrations and that when
1/n > 1.0 the change in adsorbed concentration is
greater than the change in solute concentration.
Generally the higher the qe value at a specified
concentration, the more preferred is the biosorbent
for that application (Chilton et al., 2002).Chen et al
.,(1997) added that adsorption isotherms expressed as
Freundlich isotherm constant are a better measure of
the adsorption properties of biosorbent than the one –

Academia Arena 2010:2(3)
http://www.sciencepub.net/academia [email protected]
43
point tests , such as iodine, molasses or tannin
numbers (chen et al ., 1997).
Other types of commercial dyes have been worked
upon. The removal of methylene blue and malachite
green by agro waste was reported by Guo et al.,
(2003), Garg et al., (2004), however, relatively little
or no work has been reported on the adsorption of
industrial dye from dyeing waste water onto
chemically catalyzed shear butter shells. In this
present work, we reported our evaluation on the
feasibility of using shea nut shell activated carbon,
studying its adsorption properties for removal of
industrial dyestuffs from waste water. This paper
therefore, presents three adsorption isotherms (R-D,
Langmuir and Freundlich isotherms) generated for
shea nut shells (sorbent) and dyeing waste water
(sorbate) system. The purpose of the study was to
evaluate their adsorption capacities which are
quantified as saturated (qD), maximum (qm) and
ordinary Freundlich (Kf) adsorption capacities, with
the adsorption intensity (1/n) as it relates to the use of
shea nut shells bio adsorbent for industrial waste
water treatment.
2. Materials and Methods
Exhausted and deseeded shea nut shells, obtained
from Rikoto, zuru in Kebbi state, Nigeria was used as
raw material for the production of activated carbons
via thermochemical activation.
Industrial dyeing waste water was procured in plastic
container from Chellco textile industries, Kaduna
without further treatment. 1000 mgg-1 concentration
brix was prepared from the dye waste water
concentrate from which working standard were
prepared.
The apparatus and experimental methods in this
work are similar to those for chemical activated with
ZnCl2 as reported previously by Tsai et al., 2001) for
thermochemical activation. Initial weight of the
grinded pretreated shear butter shell was measured
into crucibles and mixed with 3cm3 of 1M activating
agent (H3PO4 and ZnCl2). The mixture was allowed
to stand for one hour and then fired in a furnace at
800o C for 5 minutes and 15 minutes series, (Alam et
al .,2007) the samples were both acid and water
washed to remove residual ash and chemicals
respectively (Itodo et al., 2008).This is followed by
oven drying at 110oC overnight and stored for
further analysis (Tsai et al, 2001)The generated
samples (biosorbents) were separately labeled as
SS/A/5, SS/A/15, SS/Z/5 and SS/Z/15 implying shea
nut shell, activated with either H3PO4 (A) or Zncl2
(Z) at 5 minutes or 10 minutes dwell time.
2.1Adsorption Study
The adsorption capacities of biosorbent produced
form shea nut shells was measured under the effect of
contact time, nature of activating agent and initial dye
concentration. A concentrate which was obtained
from mild temperature evaporation of the dye waste
water in an oven to a constant weight was used to
prepare a 1000mgl-1 stock from which 10- 50 mgl-1
working dye standard solutions were prepared. 10
cm3 of each dye sample was interacted with 0.1g of
biosorbent and allowed to equilibrate for one hour
(Turoti et al., 2007). The mixture was then filtered,
using a Wattman number 42 filter paper after which
the residual dye concentration (ce) in the filtrates
were measured using Jenway 1600
spectrophotometer at room temperature (300.15k)
which was set at a predetermined wavelength of 640
nm.

Academia Arena 2010:2(3)
http://www.sciencepub.net/academia [email protected]
44
The amount of dye absorbed and % dye removal
were calculated form the difference between the
initial concentration and equilibrium concentration as
shown in equation(4) and (5) respectively
qe=(Co-Ce) v/m ------- --------- ------ (4)
% RE = (Co-Ce /Co) x 100 -- ------- ----------- ---- (5)
Where qe is the amount of dye adsorbed per unit mass
of adsorbate (mgg-1).It is a measure of adsorption
capacity. Co and Ce are the initial and equilibrium dye
concentration respectively (g) and v (L) is the
adsorbent dosage and volume of dye solution
respectively (Zahangir et al., 2008).
3.Results and Discussions
Figure (1) present the percent dye removal at different initial dye concentration for one hour equilibration time.
F ig ure 1:P erc entag e dye removal onto ac id and s alt c atalyzed s hea nut s hell ac tivated c arbons
0
50
100
%RE
% RE f0r S S /A/5/C o 82.4 79.84 75.94 69.065 64.902
% RE for S S /A/15/C o 84.8 80.65 78.197 79.138 74.172
% RE for S S /Z /5/C o 59.6 54.03 44.36 45.32 33.144
% RE for S S /Z /15/C o 76.8 73.385 60.903 54.678 41.06
10 20 30 40 50
C o (mg/l)
The % dye removal by the four sorbent series follows
the order, SS/A/15 > SS/A/5 > SS/Z/15 >SS/Z/15.
Results in this study revealed that biomass activated
at a longer dwell time (15 minutes) gave higher
percents dye uptake (74.172-84.800 %). ZnCl2 is a
less favorable activating agent especially when
cracking or pyrolysis is done at short dwell time. This
however could be linked to a lesser developed pore
size associated to short activation time and also due
to steric hindrance, which may results from the nature
of activating agent as well as activation time. Values
obtained for SS/Z/5 (33.144-59.600%) are lower
compared to the values (41.06-76.80%) of the same
sample (SS/Z/15) activated at longer time.
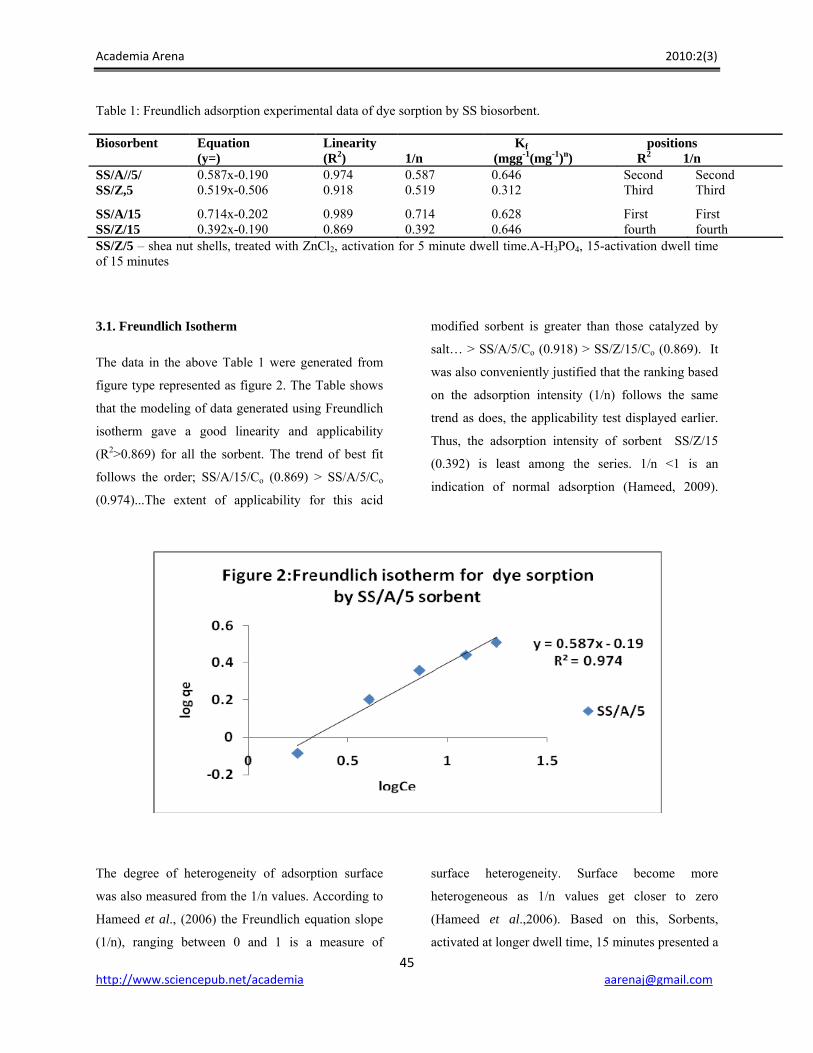
Academia Arena 2010:2(3)
http://www.sciencepub.net/academia [email protected]
45
Table 1: Freundlich adsorption experimental data of dye sorption by SS biosorbent.
Biosorbent Equation (y=)
Linearity (R2)
1/n
Kf
(mgg-1(mg-1)n) positions R2 1/n
SS/A//5/ 0.587x-0.190 0.974 0.587 0.646 Second Second SS/Z,5 0.519x-0.506 0.918 0.519 0.312 Third Third
SS/A/15 SS/Z/15
0.714x-0.202 0.392x-0.190
0.989 0.869
0.714 0.392
0.628 0.646
First fourth
First fourth
SS/Z/5 – shea nut shells, treated with ZnCl2, activation for 5 minute dwell time.A-H3PO4, 15-activation dwell time of 15 minutes
3.1. Freundlich Isotherm
The data in the above Table 1 were generated from
figure type represented as figure 2. The Table shows
that the modeling of data generated using Freundlich
isotherm gave a good linearity and applicability
(R2>0.869) for all the sorbent. The trend of best fit
follows the order; SS/A/15/Co (0.869) > SS/A/5/Co
(0.974)...The extent of applicability for this acid
modified sorbent is greater than those catalyzed by
salt… > SS/A/5/Co (0.918) > SS/Z/15/Co (0.869). It
was also conveniently justified that the ranking based
on the adsorption intensity (1/n) follows the same
trend as does, the applicability test displayed earlier.
Thus, the adsorption intensity of sorbent SS/Z/15
(0.392) is least among the series. 1/n <1 is an
indication of normal adsorption (Hameed, 2009).
The degree of heterogeneity of adsorption surface
was also measured from the 1/n values. According to
Hameed et al., (2006) the Freundlich equation slope
(1/n), ranging between 0 and 1 is a measure of
surface heterogeneity. Surface become more
heterogeneous as 1/n values get closer to zero
(Hameed et al.,2006). Based on this, Sorbents,
activated at longer dwell time, 15 minutes presented a

Academia Arena 2010:2(3)
http://www.sciencepub.net/academia [email protected]
46
more heterogeneous surface. This finding could be
linked to the nature of activating agent, since SS/Z/5
is next to SS/Z/15 in surface heterogeneity.
Kf, is the Freundlich constant which denote
or depicts the adsorption capacity, unit in mgg-1
(1mg-1)n of adsorbent. It is defined as the adsorption
or distribution coefficient and represents the quantity
of dye adsorbed onto the sorbent for the a unit
equilibrium concentration. Biomass, activated with
ZnCl2 at a longer dwell time presented a higher
adsorption capacity, SS/Z/15 (0.646) as does the
sample with H3PO4 at shorter dwell time SS/A/5
(0.646). It thus, follows that for acid and salt catalysis
in generation of high capacity biosorbent, biomass
require a shorter and longer activation dwell time
respectively.
3.2. Langmuir Isotherm
Good linearity and applicability of the Langmuir
model was evidenced by high R2 values (≤ 0.979) for
all the samples as shown on figure 3 and presented on
table 2.
The Langmuir constant, relating to the maximum
adsorption capacity (qm) was investigated. Sorbent,
SS/A/15 gave the highest value for maximum
adsorption capacity (6.124 mgg-1). This is in
agreement with the highest adsorption capacity value
present by acidic sorbents from the Freundlich
constants (kf = 0.646). This work uncovered the fact
that the maximum adsorption capacity of any series
(obtained from the Langmuir relationship) should be
higher than their corresponding adsorption capacities
values (kf) from the Freundlich isotherm. This can be
recalled by comparing table 1 and 2 with qm and (kf)
values as; 5. 102 (0.646), 2.611 (0.312), 2.801(0.626)
and 6.024 (0.646) for sorbents SS/A/5, SS/Z/5,
SS/A/15 and SS/Z/15 respectively.

Academia Arena 2010:2(3)
http://www.sciencepub.net/academia [email protected]
47
Table 2: Langmuir isotherm experimental data for dye uptake by SS biosorbent
Biosorbent Equation (y=)
Linearity (R2)
qm(mgg-1)
Ka(Lmg-1) RL position qm
SS/A//5/ 1.743x+0.196 0.989 5.102 0.112 0.152 second SS/Z,5 5.348x+0.383 0.983 2.611 0.072 0.217 fourth
SS/A/15 SS/Z/15
1.562x+0.166 2.123x+0.357
0.991 0.979
6.024 2.801
0.106 0.168
0.158 0.106
First third
SS/Z/5 – shea nut shells, treated with ZnCl2, activation for 5 minute dwell time.A-H3PO4, 15-activation dwell time of 15 minutes
Table 2 also revealed the values of the Langmuir
constants, ka (Lmg-1) which directly affects the
energy of adsorption (Hameed, 2009). Sorbent with
high energy related value, ka on table 2 presented low
adsorption intensity as it was deduced from the
Freundlich constant on table 1. The Ka and (kf) values
include 0.168 (0.628) and 0.112 (0.646) for SS/A/15
and SS/A/5 respectively.
The feasibility of the adsorption process was
tested from the RL magnitude given as equation 6 as;
RL = 1/ (1+Ka Co) ------- ------ ----- (6)
Where RL is the essential of the Langmuir equation
used in testing adsorption feasibility. Ka is the
Langmuir constant related to energy of adsorption
(Lmg-1) and Co is the highest initial dye
concentration among the series of different sorbents
concentrations (Monika et al., 2009) adsorption could
be linear, unfavourable, favorable or irreversible
depending on whether the values of RL = 1, >1, <1
and RL = 0 respectively. (Monika et al., 2009). This
research presented values (0.106-0.257) which
justifies favorable adsorption (0 < RL <1).
3.3. Rudishkevich Dubinin Isotherm
A third capacity parameter called theoretical
adsorption capacity (qD) was evaluated from the
Rudishkevich Dubinin isotherm model, simply
denoted as R-D model (figure 4) and known to be
more general than both the Langmuir isotherm as its
deviation is not based on ideal assumption such as
equipotential of sorption sites, absences of steric
hindrance between sorbed and incoming particles and
surface homogeneity (Monika et al., 2009).
Academia Arena 2010:2(3)
http://www.sciencepub.net/academia [email protected]
48
Just like the Freundlich adsorption capacities (kf), it
was revealed that the theoretical adsorption capacity
(qD) from the R-D isotherm were also lower in
magnitude than the Langmuir maximum adsorption
capacity (qm). Table 3 presented a higher qD values
(4.169 mgg-1) for SS/A/15. This value is higher as
does its corresponding qm value (6.024 mgg-1) for the
same sorbent on Table 2.
Table (3): Rudishkevich Dubinin adsorption experimental data of dye sorption by SS biosorbent.
Biosorbent Equation (y=)
Linearity (R2)
qD(mgg-1) positions R2 qD
SS/A//5/ -3.383x+0.539 0.988 3.622 first second SS/Z,5 -5.808x+0.308 0.962 2.032 third fourth
SS/A/15 SS/Z/15
-3.300x+0.620 -3.150x+0.384
0.944 0.984
4.189 2.421
Fourth second
First third
SS/z/5 – shea nut shells, treated with ZnCl2, activation for 5 minute dwell time.A-H3PO4, 15-activation dwell time of 15 minutes
The other qm values were also higher than their
corresponding qD and kf evaluated for the entire
sorbent series. A summary of the 3 types of sorption
capacities obtained from different isotherms and their
quantitative trend in this analysis is as represented on
Table 4.
Table 4: comparison of the normal; theoretical saturation and maximum adsorption capacities of dye uptake by SS Biosorbent.
Biosorbent Kf(mgg-1(mg-1)n) qD(mgg-1) qm(mgg-1) Trend position SS/A//5/ 0.646 3.622 5.102 qm> qD> Kf second SS/Z,5 0.312 2.032 2.611 qm> qD> Kf fourth SS/A/15 SS/Z/15
0.628 0.646
4.189 2.421
6.024 2.801
qm> qD> Kf qm> qD> Kf
First third
Kf= Freundlich normal adsorption capacity, qD = R-D theoretically saturation adsorption capacity, qm = Langmuir maximum adsorption capacities. SS/z/5 – shea nut shells, treated with ZnCl2, activation for 5 minute dwell time.A-H3PO4, 15-activation dwell time of 15 minutes
Conclusion
Highlights of results presented in this works shows
that shea nut shell is a potentially low cost precursor
for generation of activated biosorbent, giving up to
84% dye removal. The isothermal evaluation gave
isotherm experimental data that agrees with those of
researches reviewed earlier. To this regards,
adsorption falls within favorable limits as confirmed
from the Freundlich constants (1/n <1) and the
essentials of Langmuir model (RL<1). Applicability
of the three models follows the trend; Langmuir (R2=
0.979-0.991) > R-D (R2 = 0.944 – 0.988) >
Freundlich (0.869-0.989). Both capacities, the normal
Freundlich, Langmuir maximum and R-D theoretical
adsorption capacities as well as the adsorption
intensities also agrees well with those if similar
research. A critical comparative study showed that
for all the series of the adsorption study, the values of
the maximum saturation capacity (qm) > theoretical
adsorption capacities > normal adsorption capacity
(kf). The three values for SS/A/15 include 6.024mgg-
Academia Arena 2010:2(3)
http://www.sciencepub.net/academia [email protected]
49
1, 4.189mgg-1 and 0.628 mgg-1 respectively. The same
trend is applicable to the other biosorbent series.
Acknowledgements:
Authors are grateful to the Chellco Textiles, Nasarawa, Kaduna for the free supply of adsorbate (Dye), Malam Ahmed Bodinga of Agric Laboratory of Usmanu Danfodiyo University,Sokoto, Nigeria for his contribution
Corresponding Author:
Dr. Itodo Udoji Adams
Department of Applied Chemistry,
Kebbi state University of Science and Technology,
P.M.B 1144, Aliero, Kebbi state
Nigeria.
E-mail: [email protected]
TEL: +2348073812726, +2348039503463
References
[1] Alam MZ, Muyibi SA, Mariatul FM, Radziah W. Activated carbon derived from oil palm empty fruit bunches. Journal of environmental science. 2007;30: 315 – 321
[2] Chen SH, Clayton W. Application of Elovic equation to the kinetics of phosphate release and adsorption on soil. J. soil Sc. Soc. Am. 1980; 44 (1): 265-268.
[3] Chilton N, Jack N, Losso N, Wayne E, Marshall R. Freundlich adsorption isotherm of Agricultural by product based powered Activated carbon in Geosmin water system. Bioresoruce Technology 2002; 85 (2): 131-135
[4] Garg V, Amita M, Kumar R, Gupta R. Basic dye (Methylene blue) removal from simulated waste
water by adsorption using Indian rosewood saw dust. Dye and pigment 2004; 63 (1):243-250
[5] Guo J, Lau A. Microporous activated carbons prepared from Palm shell by thermal activation and their application to SO2 adsorption. Journal of Colloid and Interface Science 2002;251(2): 242-247.
[6] Hameed BH, Din AM, Ahmad AL. Adsorption of methylene blue onto Bamboo based activated carbon: kinetics and equilibrium studies. Hazardous materials. 2006;137(3):695- 699
[7] Hameed BH, Hakimi H. utilization of durian peels as low cost sorbent for removal of acid dyes. Biochem. Eng. Journal. 2008;39: 338 – 343.
[8] Hameed BH. Evaluation of papaya seed as a non conventional low cost adsorbent for removal of MB. Hazardous materials 2009 ;162:939-944.
[9] Itodo UA, Abdulrahman FW, Hassan LG, Maigandi SA. Adsorption capacities and intensities of chemically modified carbon animalis and Activated carbon: A comparative study. International journal of pure and applied science. 2008;1(2) :214-221
[10] Mattso H, Mark D. activated carbon. Marcel Dekker inc. New York, 1971
[11] Rahman AI, Ismail J, Osman H. effect of HNO3 and digestion on organic materials and silica in rice husks. J. mater chem. 1997;8: 12 -15.
[12] Meghea A, Rehner H, peleanu I. Test – fitting on adsorption isotherms of organic pollutants from waste water on activated carbon. J; Radionuclear chem. 1998; 229(2): 105 – 110.
[13] Mohan D, singh K. Single and multicomponent adsorption of Cd and Zn using activated carbon derived from Bagasse. Water Research Journal 2001; 36(9): 2304 – 2311.
[14] Monika, J; Garg, V; Kardirvelu, k. (2009), Chromium (VI) removal from aqueous solution,

Academia Arena 2010:2(3)
http://www.sciencepub.net/academia [email protected]
50
using sunflower stem waste. J. Hazardous materials 162:365 – 372.
[15] Rahman AI, Ismail J, Osman H. effect of HNO3 and digestion on organic materials and silica in rice husks. J. mater chem. 1997;8: 12 -15.
[16] Rahman, AI; Ismail; J and H. Osman studies on Zn (11) ion adsorption by rice husks digested with HNO3. Malaysian J. chem. 2002; 2(1): 12 – 15.
[17] Tsai W, Chang C, Wang Y, Chang C, Chien F, Sun H. preparation of activated carbon from corn cob catalyzed by potassium salts and subsequent gasification with CO2. Bioresource Technology. 2001; 78 (2): 203-208.
[18] Turoti M, Gimba C, Ocholi O, Nok A. Effect of different Activation Methods on the Adsorption Characteristics of Activated Carbon from Khaya Senegalensis Fruits and Delonix Regia pods. Chemclass Journal 2007; 4 : 107 – 112.
[19] USEPA. source reduction of chlorinated solvent in textile manufacturing. Bul. Toxic substances control, U.S Env. Prot. agency recycled Cincinnati, 1999; OH 45268.
[20] Zahangir A, Suleyman A, Noraini K. Production of activated carbon from oil palm empty fruit Bunch for Zn removal. Bul.conference proceedings 12th int.water Tech conf. IWTC12 Egypt. 2008; 373-383
8/02/2010

Academia Arena 2010:2(3)
http://www.sciencepub.net/academia [email protected]
51
ACTIVATION CHEMISTRY AND KINETICS OF SHEA NUT SHELL BIOSORBENTS FOR TEXTILE WASTE WATER
TREATMENT Itodo A.U. 1 and Itodo H.U.2
1Department of Applied Chemistry, Kebbi State University of Science and Technology, Aliero, Nigeria.
2Department of Chemistry, Benue State University, Makurdi.
ABSRACT: Phosphoric acid (H3PO4) and Zinc chloride (ZnCl2) catalyzed Shea nut shells, subjected to a one way activation scheme was employed to study the adsorption kinetics and mode of diffusion of industrial dye uptake. Thermodynamics data obtained in this study indicate that the sorption of dye spontaneously increases with time and decreases after equilibration was reached. The adsorption follows the pseudo second order kinetic model which gave the least % SSE (0.449-1.348), best linearity (R2=0.998-0.999) and closer agreement between the experimental and calculated qe values (qe exp., 96.985/qe cal., 100.00).Mode of transport deviate from the intraparticle diffusion model. According to this study, percent dye removal coupled with the close proximity of generated data to those reviewed in literatures, is an indication that Shea nut shells could compare, to a good extent with commercial activated carbon for organic dye removal from dyestuff waste water. [Academia Arena 2010;2(3):51‐60]. (ISSN 1553‐992X).
Key Words: Activation Chemistry, Kinetics, Shea nut, Biosorbents, Textile Wastewater
1. INTRODUCTION:
Waste water treatment is a sure way of reducing environmental degradation posed by agricultural, industrial and human activities (Abdul and Abemagba, 2005). One of the major causes of environmental pollution is industrial effluent. Effluent discharged from dyeing industries is highly colored; of low BOD are high COD. The disposal of this colored water can be toxic to aquatic life (Kardirvelu et al, 2003). The dyes upset the biological activities in water bodies, poses health threat since they are mutagenic and carcinogenic and can cause severe damage including kidney dysfunction, reproductive system, liver, brain and CNS malfunctioning (Kardirvelu et al, 2003),
Many conventional methods such as chemical oxidation, coagulation, precipitation as well as biological techniques can be used for removal of dyes and metal ions from aqueous solutions. Among many
new technologies is the utilization of plant residues as adsorbents (McKay et al, 1987). A wide variety of carbons have been prepared from agricultural wastes. These includes peanut hulls, baggage pith, wood products, corn cob coir pith, fish waste etc (McKay et al., 1987) Kardirvelu et al., 2003, Abdul and Aberuagba, 2005; Itodo et al., 2008). Commercially available activated carbon is expensive especially in countries where economy plays a very big role. It is therefore better to find low cost precursors to be used as adsorbent. This present article reports the feasibility of Shea nut shells as potentially low cost adsorbent material for the removal of dyestuff with more emphasis on the activation chemistry and kinetics of adsorption.
2.MATERIALS AND METHODS
Adsorbates used were Chellco textile industrial dye waste water collected at the effluent reservoir at the

Academia Arena 2010:2(3)
http://www.sciencepub.net/academia [email protected]
52
main factory site, Kaduna – Nigeria. The waste water concentrate was diluted to the required concentration as earlier described by Kardirvelu et al., 2002. And used for the study. A 1000mg/l concentration was first prepared and from which series of working concentrations (10-50 mgl-1) were obtained. Shea nut shells was procured from Rikoto Zuru emirate of Kebbi state, Nigeria, the samples were washed and oven dried at 110o C before activation, Using the one way thermochemical activation scheme as earlier described by Turoti et al., 2007. The thermochemical activation is process that depends upon the action of inorganic chemical compounds such as ZnCl2 and H3PO4 used in this research to dehydrate the organic molecules during pyrolysis (another name for cracking, carbonization or calcinations). In this study, 3g of the pretreated and grinded Shea nut shells was mixed with 3cm3 1molar activation agents. The mixture was allowed to stand for one hour before igniting in a furnace fired at 800 o C for a five minute and 10 minutes dwell time (Turoti et al., 2007).
2.1Activation chemistry
Thermal conversion process involves 3 stages (Paul, 1998).
2.1.1 Combustion: this is a complete thermal oxidation of the Shea nut shells. At this stage, there is still adequate oxygen in the system to allow breakage of carbon bonds. During reduction of carbonaceous materials, excited oxygen molecule reacts with carbon until the entire available bond is broken. This process is exothermic (Paul, 1998)
C(S) + O2 (g) → CO2 (g) ---------- (i)
2H2 + O2 (g) → 2H2O(g) ---------- (ii)
N2 + 2O2 (g) → 2NO2(g) ------- (iii)
S + O2 (g) → SO2 (g) ---- - (iv)
Equation I - iv revealed that the primary emission of combustion are CO2(g), H2O(g), NO2(g), SO2(g) and Co(g).
2.1.2 Gasification: if the amount of oxygen in the combustion chamber were reduced to below the amount required for combustion, the process is termed gasification. This thermal system leads to a partial burning by forcing carbon molecules to pair with limited (only one) oxygen molecule and thus, increase the production of carbon monoxide (Co)
C + CO2 → 2CO(g) - - (v) Endothermic
C + 1/2O2 → CO(g) - (vi) Endothermic
C + H2O → C0(g) + H2(g) -- (vii) Endothermic
C + 2H2 → CH4 (g) - -(viii) Exothermic
CO + H2O → CO2(g) + H2(g) - - (ix) Exothermal
This system is also exothermic and self sufficient the net process is endothermic for gasification process (Tchobanoglous et al, 1993)
2.1.3 Pyrolyzation (thermal distillation): in this stage, the remaining char from gasification, can be manipulated through a combination of thermal cracking and condensation reaction in the absences of oxygen. This highly endothermic reaction required extensive external energy. distillation of char or pyrolysis yield two usable by–products,(a) combustible gas, mainly saturated hydrocarbon (methane) and (b) activated carbon (Tchobanoglous 1993 ).
Equation representing complete pyrolysis is given as (x).
3(C6H10O5) → 8H20(g) + C6H8O(s) + 2CO(g) + 2CO2(g)
+CH4(g)+H2(g)+7C(s). ---------- (x)
Pyrolising units are designed to achieve temperature ranging from 315o C to 925 o C. Harvesting of the useful off gases from pyrolysis of municipal solid waste has not been successful because of difficulties obtaining pure final gas, the technical complexity of the system and financial consideration for strict heating control (Cheremisinoff et al., 1978).
2.1.4 Cooling: carbon is allowed to return to ambient (surrounding) temperature. Experimental results revealed that carbon proceed at high Toc with rapid

Academia Arena 2010:2(3)
http://www.sciencepub.net/academia [email protected]
53
cooling adsorb basic material more rapidly as does, the slower cooled carbon for removal of acidic substances. As cooling proceed slowly, oxygen came in contact with surface of carbon, forming chemically – attractive oxide groups (Paul, 1998)
The use of activating agent is for pore size development. The area occupied by the activating agent remains as developed pores after the washing process to remove the residual chemical. Such chemical is capable of producing the hot spot adsorption area in charcoal as shown below
4 HNO3 + 3C → 2H2O(g) +2NO(g) + 2NO2(g) + CO2(g)
+ 2CO(g) ------- ----- ------ (xi)
The water vapor produces the hot spot adsorption area (Kong, 1996).
2.2. Batch mode adsorption studies
the entire experiment was carried out at room temperature, 27 ± 20 c. 10 milliliter dye solution
(1000mgl-1) and 0.1g adsorbate ( < 2.0mm aperture size) were taken into a 25 ml Erlenmeyer flask and sealed. The samples were allowed to equilibrate at predetermined time (15, 30, 45… and 90 minutes). The absorbance values of the dye solution before and after treatment were measured, using Jenway 610 model spectrophotometer at the pre-determined maximum wavelength (640nm). The experiment was conducted in triplicate (Hameed et al., 2006; Hameed, 2009).
3.0.RESULTS AND DISCUSSION
Figure 1a shows removal of dye by various sorbents as a function of initial dye concentration .Acid (H3PO4) catalyzed sorbents proves to present higher percent dye removal. This is pronounce for the carbon activated at longer time,(SS/A/15/Co: 74.172 -84.80%).The 10mgl-1 concentration dyes were the most adsorbed (59.60 -84.80%) compared to the 50mgl-1 dye solutions (33.144-74.172%).This could be linked to the less and a more competition for adsorption sites in the former and later cases respectively
.

Academia Arena 2010:2(3)
http://www.sciencepub.net/academia [email protected]
54
Figure 1b represents the effects of contact tine on dye uptake. Quantitative removal of most of the dye was obtained at a short time (15 – 60 minutes) . This is in agreement with the work by Kardirvelu et al., 2002. The equilibrium time was deduced from the least absorbance (high adsorption) values for each series. This term is a very useful parameter for waste water treatment. It gave the corresponding equilibrium concentration (Ce) and amount of adsorbed per unite dose of adsorbent (qe). Figure 1b, with an auto
appended table showed a gradual increase of % removal with time. Occurrence at 90 minutes contact time is an indication of slight desorption for most of the series, % dye removal ranges between 94.724 – 97-99, 93.467- 92.714, 75. 182 – 98. 985 and 96. 482- 97. 489% for SS/A/5, SS/Z/5, SS/A/15 and SS/Z/15 sorbent respectively. The lower and higher ranges are values for 90 minutes interaction (with extent of slight desorption) and 60 – 75 minutes interaction, which are evidence of equilibration.
The percent dye removal (% RE) was calculated for each run by following the expression in equation (1) below:
RE (%) =( (Ci – Ce)/Ci ) × 100 -------- (1)
While the adsorption capacities of the adsorption for each concentration of dye at equilibrium were calculated using equation (2)
qe (mgg-1 ) = (Ci – Ce) V/m ------------ (2)
Where Ci and Ce (mgl-1) were the initial and final concentration of dye solution, qe (mgg-1) is the
amount of dye adsorbed per unit mass of adsorbent which is also a measure of adsorption capacity. V is the volume of dye solution (dm3) while m is the carbon dose (g) (Monika et al., 2009)
Figure 2 represents the thermodynamic equilibrium constant (kc) and Gibbs free energy (∆G) values for sorption of dye onto SS biosorbent. The change in Gibbs free energy was investigated, using equation 3 and 4 below (Dakiky et al., 2002)
∆G = -RT ln Kc ------------ (3)
Kc = ca/ce ------------- (4)

Academia Arena 2010:2(3)
http://www.sciencepub.net/academia [email protected]
55
Where Kc is the equilibrium constant, Ca and Ce are the solid and equilibrium phase concentrations in mg/g and mgl-1 respectively. T is the temperature in Kelvin while R is the gas constant.
As the contact time increases, ∆G values becomes more negative, an indication of increase spontaneity with increase in kc (the ratio of the adsorbed concentration and equilibrium concentration). The characteristic decrease of kc and ∆G values at 75 minutes is an indication that equilibration limit has been exceeded. SS/A/5/t gave a higher kc value (98.502), and signifies more adsorption onto the solid phase.
3.1. Batch kinetic study
Two kinetic and one transport models were used to test the adsorption process of dye uptake. The pseudo first order equation given by Lagergren and svenska was described (Hameed et al., 2006) as equation 5a
Ln (qe-qt) = ln qe – k1t --------------- (5a)
And also by Namasivayan and kavitha, (2007) as equation 5b
Log (qe - qt) = log qe – (k1/2.303) t. -------- (5b)
Where qe and qt are the amount of dye adsorbed at equilibrium and time, t (min), respectively and K1 is the rate constants for first order model (min-1). Values of k1 were obtained from plot type in Figure 3 which all gave the typical pseudo first order kinetic experimental data on Table 1

Academia Arena 2010:2(3)
http://www.sciencepub.net/academia [email protected]
56
Table 1: Pseudo first order experimental data of dye uptake by acid and salt catalyzed SS bio adsorbents.
Sorbents Equation(y=) R2 K1(min-1) qecal.(mg/g) qe exp.(mg/g) % SSE SS/A/5/t SS/Z/5/t SS/A/15/t SS/Z/15/t
-0.009x+0.581 -0.013x+0.821 -0.010x+0.860 0.013x+0.821
0.974 0.737 0.955 0.736
0.021 0.030 0.023 0.030
3.811 6.622 7.244 6.628
97.990 96.985 98.995 97.487
42.118 40.412 41.032 40.633
SS/A/5 – Shea nut shells, treated with, H3PO4activated for 5 minute dwell time. SS/z/15 – Shea nut shells, treated with ZnCl2, activated for 15 minute dwell time.
Generated data were also tested using the pseudo second order kinetic model as expressed by (Hameed, 2009) as equation 6a and b.
t/qt = 1/h + (1/qe) t ---- ----- ----- (6a)
h is the initial adsorption rates given as equation (6b)
h= k2qe2 --------- (6b)
where k2 (gmg-1min) is the rate constant of the second order adsorption.
A plot of t/qt versus t (fig 4) gives a linear relationship which the slope (qe) and intercept,k2 are determined(Table1)

Academia Arena 2010:2(3)
http://www.sciencepub.net/academia [email protected]
57
Table 2: Pseudo second order experimental data of dye uptake by acid and salt catalyzed SS bio adsorbents.
Sorbents Equation(y=) R2 K2(gmg-1min) qecal.(mg/g) qe exp.(mg/g) % SSE
SS/A/5/t SS/Z/5/t SS/A/15/t SS/Z/15/t
0.010x+0.003 0.010x+0.002 0.010x+0.012 0.010x+0.005
0.999 0.998 0.999 0.999
0.033 0.050 0.008 0.020
100.00 100.00 100.00 100.00
97.990 96.985 98.995 97.487
42.118 40.412 41.032 40.633
SS/A/5 – Shea nut shells, treated with, H3PO4activated for 5 minute dwell time. SS/z/15 – Shea nut shells, treated with ZnCl2, activated for 15 minute dwell time.
The two models were compared for their fitness for industrial dye uptake by four series of Shea nut shells activated biosorbent. Accepted kinetic model for a given adsorption is characterized by three common validity test;
(i) A good and high correlation coefficient, R2 indicating the applicability and reliability of a given model.
(ii) A close agreement between the calculated and experimental qe values.
(iii) The accepted model must have the least values for the sum of error squares (% SSE), which is determined as equation 7
SS E (%) =√ ∑ (qe.exp. - qe cal.)2/N ---- ---- (7)
Where N is the number of data points.
(Hameed 2009; Hameed et al., 2006; Namasivayan and kavitha, 2007).
Findings from this study showed that the data range for pseudo second order kinetics plots falls within the ranges; R2 =0.998 – 0.999, % SSE = 0.449- 1348 and qe cal: qe exp = 100: 96. 985 – 98. 995. This values are more favorable in justifying the adsorption of dye onto SS biosorbent as following second order kinetic model than the pseudo first order model, whose corresponding data include 0.736 – 0.974, 40. 412 – 42.118 and 100:3.811 – 7.244 for R2, % SSE and qe cal: exp respectively. The rate of dye sorption by acid treated SS/A/5/t,(0.033) is about 2 times slower than that of SS/Z/5/t,(0.050) while SS/Z/15/t, adsorb 2 times faster,(k2=0.020) compared to its corresponding acid catalyzed biosorbent (K2=0.008) units in gmg-
1min.This could be linked to a higher mesopore created by the ZnCl2 modified biosorbent.
The transport process was studied, using the intraparticle diffusion model. This model was design to investigate the mechanism of dye adsorption. The intraparticle plot is an empirical found functional

Academia Arena 2010:2(3)
http://www.sciencepub.net/academia [email protected]
58
relationship, common to adsorption process where sorption varies almost directly with square root of
time (t1/2) instead of contact time (t) as presented in Figure 5.
According to the theory proposed by Weber and Morris (1963): in Hameed, 2009. The equation is given as 8
qt = kid t1/2 + Ci ------- ----- ------ (8)
where kid (mgg-1 min1/2) is the rate constant of stage i, which is obtained from the straight line plot of qt versus t1/2. Ci is the intercept.
Disregarding the linearity (high R2 value) of the intraparticle diffusion plot, the sorption mechanism assumes this model if the following conditions are met:
(i) High R2 values to ascertain applicability (ii) traight line which passes through the origin for the plot area qt vs. t1/2.
(iii)Intercept Ci < 0. A validity test which deviates from (ii) and (iii) above shows that the mode of transport is affected by more than one process (Hameed, 2009).
Results in this analysis gave a good linearity (R2 = 0.766 – 0.948), with an excessively high Ci values (88.64 – 93.41) as displayed on Table 3 .The plot straight lines does not pass through the origin (Figure 5). It does imply that sorption mechanism is not by intraparticle diffusion. This studies is in good agreement with the kinetic test of methylene blue removal by papaya seed (Hameed, 2009) and Bamboo based activated carbon (Hameed et al., 2006) which all modeled into the pseudo second order kinetics.

Academia Arena 2010:2(3)
http://www.sciencepub.net/academia [email protected]
59
Table 3: Intraparticle diffusion model experimental data of dye uptake by acid and salt catalyzed SS bio adsorbents.
Sorbents Equation(y=) R2 Kid(min1/2) Ci SS/A/5/t SS/Z/5/t SS/A/15/t SS/Z/15/t
0.486x+93.41 0.762x+89.57 0.926x+91.07 0.952x+88.64
0.766 0.843 0.948 0.931
0.486 0.762 0.926 0.952
93.410 89.570 91.070 88.640
SS/A/5 – Shea nut shells, treated with, H3PO4activated for 5 minute dwell time. SS/z/15 – Shea nut shells, treated with ZnCl2, activated for 15 minute dwell time.
CONCLUSION:
This present study revealed the feasibility of shear butter shells as an effective biomass for dye uptake bio-adsorbent with relatively high percent dye removal.
The absorption kinetic data does not follow the first order but can be predicted by the pseudo second order kinetic model, having fulfilled the validity tests. The R2 values of intraparticle diffusion plots and their very high intercept Ci>>0 proves that adsorption mechanism is governed by more than one process and not by intraparticle diffusion.
Acknowledgements:
Authors are grateful to the Chellco Textiles, Nasarawa, Kaduna for the free supply of adsorbate (Dye), Malam Ahmed Bodinga of Agric Laboratory,Usmanu Danfodiyo University,Sokoto, Nigeria for his contribution
Corresponding Author:
Dr. Itodo Udoji Adams
Department of Applied Chemistry,
Kebbi state University of Science and Technology,
P.M.B 1144, Aliero, Kebbi state
Nigeria
E-mail: [email protected]
TEL: +2348073812726, +2348039503463
References.
[1] Abdul A, Aberuagba F. Comparative study of the Adsorption of Phosphate by Activated Carbon from Corncobs, Groundnut shell and Rice-husk. A.U.J.T. 2005; 9 (1): 59 – 63
[2] Cheremisinoff PN, Ellerbusch F. Carbon Adsorption Handbook. An Arbor Science Publisher Inc, Michigan ,1978; 241 – 279.
[3] Dakiky M, Khamis M, Manassra A; Mereb, M. Selected adsorption of Cr (Vi) in industrial waste water using low cost Abundantly available adsorbent. Advances in environmental research 2002; 6 (4): 533-540
[4] Hameed BH, Din AM, Ahmad AL. Adsorption of methylene blue onto Bamboo based activated carbon: kinetics and equilibrium studies. Hazardous materials. 2006;137(3):695- 699
[5] Hameed BH. Evaluation of papaya seed as a non conventional low cost adsorbent for removal of Methylene Blue. Hazardous materials 2009 ;162:939-944
[6] Itodo UA, Abdulrahman FW, Hassan LG; Maigandi. Adsorption capacities and intensities of chemically modified carbon animalis and Activated carbon: A comparative study. Int. journal of pure and applied science.2008;1(2) :214-221
[7] Kardirvelu M, Palanival M, Rajeswari S. Activated carbon from an agricultural by product, for

Academia Arena 2010:2(3)
http://www.sciencepub.net/academia [email protected]
60
the treatment of dyeing industry waste water. Bioresource Technology 2000; 74 (3) : 263- 265
[8] Kardirvelu M, kavipriya M, karthika C, Radhika V, pattabhis N. utilization of various agricultural wastes for activated carbon preparation and application for removal of dyes. Bioresource Tech. 2003;87(1) : 129 – 132.
[9] Kong Y, cha Y, Production of activated carbon from coal chars using microwave energy. Chem. Eng. Comm. 1996; 140: 87 -110.
[10] Mckay G, Geundi E, Nassar M. equilibrium studies during the removal of dyestuffs from equeous solutions using biogases pitch. Water res. 1987; 21: 1513 – 15 20.
[11] Monika J, Garg V, Kardirvelu k. Chromium (VI) removal from aqueous solution, using sunflower stem waste. J. Hazardous materials 2009;162:365 – 372.
[12] Namarsivayan C, Kavitha D. Removal of Congo red from water by adsorption onto activated carbon
prepared from Coir pith. .Dye and pigments. 2007;54:47-58.
[13] Paul I. Re-use of Coconut residues as activated carbon for domestic water purification. MSc. Thesis. Faculty of Humboldt state university 1998; 66-70.
[14] Tchobanoglous G, Hilary T, and vigil S.:in paul (1998), water quality, 1st Ed. Addison Wesley publishing. Readings, Massachusetts: 1993; 160-179
[15] Turoti M, Gimba C, Ocholi O, Nok A. Effect of different activation methods on the adsorption characteristic of activated carbon from Kyaya Senegalensis fruits and Delonix Regia pods. Chemclass Journal 2007;1:107-112
[16] Weber WJ. physiochemical processes for water quality control. Wiley inter.science, London, 1972; 199 – 245.
8/02/2010

Academia arena
http:/www.sciencepub.net/academia [email protected]
61
Tangential acceleration of emitted photon from the star Manjunath. R. (Reader in physics)
#16, 8th Main road,
Shivanagar, Rajajinagar,
Bangalore-560010
Karnataka, India
Abstract : It is shown that the equation for the calculation of tangential acceleration of emitted photon from the star accounts for the potential energy of gravitational field of star .The above equation aT=kEg ( k = proportionality constant ,aT = tangential acceleration of emitted photon from the star, , Eg= potential energy of gravitational field of star) was developed based on the quantum mechanical concepts , gravitational concepts and classical mechanical concepts .The new mathematical model allows to calculate tangential acceleration of emitted photon from the star . The above equation also describes the variation of tangential acceleration of emitted photon with the potential energy of gravitational field of the star. [Academia Arena 2010;2(3):61‐64]. (ISSN 1553‐992X).
Key words: Force, photon, gravity, speed of light , acceleration
A star is a massive, luminous ball of plasma that is held together by gravity and it emits energy in the form of radiation . According to Boltzmann’s law, Energy of emitted thermal radiation by star is directly proportional to it’s absolute temperature .
E=KT (1)
Here K = Boltzmann constant, T = temperature of star , E= Energy of emitted radiation .
Energy can be emitted or absorbed ,they do so in the form of small packets of energy called photons . Although photons have zero rest mass ,it possess energy and momentum during its motion .Total energy of an object during its motion is also referred as “Relativistic mass” and it depends on the observer's frame of reference. Relativistic mass of photon can be given by m=E/C ^2 i.e E=mC^2 (2)
In physics, the concept of force is used to describe an influence which causes a free massive body to undergo an acceleration. Force is an external agency that is responsible for motion of every object in this universe . Force that moves photon can be given by F= mC^2/ λ i.e mC^2 = F λ (3) Here λ =Debroglie wavelength associated with the emitted photon , C= Speed of light in vaccum . Relativistic mass of photon emitted from the star (hot body) is directly proportional to its absolute temperature.
KT = mC^2 (4) Debroglie wavelength assosiated with the emitted radiation can be given by λ=h/mc
KT = F λ (5)
KT = F h/mC (6)

Academia arena
http:/www.sciencepub.net/academia [email protected]
62
F= (KC/h ) * mT (7)
Let us take (KC/h ) = e , where e = proportionality constant . The value of e was found to be 6.249*10^18 m/Ks^2 .
F= e mT (8)
Here F = Force that moves photon , T=Temperature of star, m = Relativistic mass of photon .
Since photon in motion has mass, it has the center of mass as well .Work is performed by the tangential component of force . According to Newton’s law of motion , force that produces tangential acceleration in photon of mass m can be given by
F= m aT 9)
Here aT = tangential acceleration of emitted photon from the star
By comparison of (8) and (9) we get
aT = e T (10)
Hence tangential acceleration of emitted photon from the star varies directly with the Temperature of star. Newton’s law of gravitation layed the ground work for the astronomical ideas for centuries to come.
The Schwarzschild radius (sometimes historically referred to as the gravitational radius) is a characteristic radius associated with every quantity of mass. It is the radius of a sphere in space, that if containing a correspondingly sufficient amount of mass (and therefore, reaches a certain density), the force of gravity from the contained mass would be so great that no known force or degeneracy pressure could stop the mass from continuing to collapse in volume into a point of infinite density: a gravitational singularity (colloquially referred to as a black hole). The term is used in physics and astronomy, especially in the theory of gravitation, and general relativity.
When the Schwarzschild radius has been attained ,the object will have a strong gravitational field that it will prevent even light from escaping out of its influence .
Rg =2GM/C^2 (11)
Here G= universal gravitational constant, M= mass of star, C= speed of light in vaccum, Rg = gravitational radius .
Let us divide the above equation by m ,where m= Relativistic mass of photon.
Rg /m=2GM/mC^2 (12)
As we know KT = mC^2 then
Rg = 2GMm / KT (13)
Here K= Boltzmann constant
As tangential acceleration of emitted photon from the star can be given by aT = e T then T= aT / e
Rg = 2GMme / K aT (14)

Academia arena
http:/www.sciencepub.net/academia [email protected]
63
aT = (GMm / Rg )* ( 2e/ K) (15)
Let us take ( 2e/ K) = k , Here k = proportionality constant
The value of k was found to be 9.04*10^41m/Js^2 .
aT = (GMmk / Rg ) (16)
Gravitational energy is the potential energy associated with gravitational force. If an object falls from one point to another inside a gravitational field, the force of gravity will do positive work on the object and the gravitational potential energy will decrease by the same amount . Potential energy of gravitational field of star can be given by
Eg = GMm / Rg (17)
Here Eg = potential energy of gravitational field of the star ,M= Mass of star, Rg = gravitational radius, m= relativistic mass of photon ,G = universal gravitational constant
Thus the equation (16) becomes aT = k Eg (18)
Here k = proportionality constant (9.04*10^41m/Js^2 ) .
aT = tangential acceleration of emitted photon from the star .
Eg = potential energy of gravitational field of the star.
If potential energy of gravitational field of the star increases then tangential acceleration of emitted photon from the star also increases by the same degree.
Does Relativistic mass of photon affected by gravity ?
Although photon has zero rest mass (Photon can never be at rest in any frame of reference ) but it possess momentum and energy during its motion.Energy carries mass along with it . Hence photon’s energy is a measure of mass known as “Relativistic mass” .
Consider a trapped photon escapes from the gravitational field of blackhole .then we observe difference in frequency( Energy) i.e frequency ‘f ’ of photon has decreased . As f a m(Frequency of photon is directly proportional to its Relativistic mass) then there is change in relativistic mass of photon. Part of the energy of trapped photon is utilized to do work against gravitational field of black hole . Thus the Relativistic mass of photon is affected by gravity of black hole .
Conclusion : As Potential energy of gravitational field of the star varies directly with the tangential acceleration of emitted photon from the star i.e aT a Eg . According to equation aT = k Eg , tangential acceleration of photon should be greater then the Potential energy of gravitational field of the star to overcome the gravitational force of star. If potential energy of gravitational field of the star increases then tangential acceleration of emitted photon from the star also increases by the same degree. The value of tangential acceleration of emitted photon can be calculated using the value of potential energy of gravitational field of the star.

Academia arena
http:/www.sciencepub.net/academia [email protected]
64
Acknowlegement:
I would like to express my deep gratitude to all those who gave me the possibility to complete this thesis.
Correspondance to :
Manjunath. R.(Reader in physics)
#16,8th Main road,
Shivanagar, Rajajinagar,
Bangalore-560010
Karnataka, India
References :
1) Star (From Wikipedia,the free encyclopedia)
2) Classical mechanics (From Wikipedia,the free encyclopedia)
3) Thermal radiation(From Wikipedia,the free encyclopedia)
4) Gravitation (From Wikipedia, the free encyclopedia)
5)Mass –energy equivalence(From Wikipedia,the free encyclopedia).
6)Newton ‘s law of motion (From the free Wikipedia encyclopedia)
7) Newton‘s law of Gravitation (From the free Wikipedia encyclopedia)
8) Gravitational radius of blackhole : www.journaloftheoretics.com/Articles/4-1/Kanarev-GravRadBH.pdf - Similar
9) Schwarzschild radius (From the free Wikipedia encyclopedia)
Date of submission: 9.2.2010

Academia Arena 2010;2(3)
http://www.sciencepub.net/academia [email protected] 65
Screening Six Cultivars of Cowpea (Vignia unguiculata (L.) Walp for Adaptation to Soil Contaminated with Spent Engine Oil
Agbogidi, O. M.
Faculty of Agriculture,Delta State University,Asaba Campus,Delta State, Nigeria.
[email protected], 07038679939 Abstract: Field experiments were carried out in 2007 and 2008 growing seasons at the Delta State University, Asaba Campus teaching and Research Farm to screen six cultivars ( ) of cowpea for adaptation to soil contaminated with spent engine oil. 0 (control), 25, 50, 75 and 100ml of the oil served as the treatments. The experiment was arranged in a randomized complete block design with four replications. The results showed that cowpea cultivars grown in 25ml of spent engine oil gave consistently significant higher (P≤0.05) values than the control and the other treatments (50, 75 and 100ml) of the spent oil plant height, leaf area, number of leaves, stem diameter, days to 50% flowering, member of nodes on main stem, number of branches, and number and length of penducle. The results also showed that as from the 50ml of oil application to soil, all the traits examined showed significant reductions (P≥ 0.05) when compared to their controls however, TVx3226 and IT84S – 2246-4 were higher in performance whereas, IT890.699 and IT870- 941-1, showed the lowest inhibitory effect. The current study has demonstrated that spent engine oil has a highly significant effect of reducing the growth characteristics of the six cultivars of cowpea examined. [Academia Arena 2010;2(3):65-75]. (ISSN 1553-992X). Keywords: Screening, cowpea cultivars, adaptation, spent engine oil. 1. Introduction Cowpea is a popular leguminous stable food in Nigeria (Adelaja, 2000; Adaji et al., 2007). It is cultivated and used fresh in derived savannah and rainforest belts thus it is available throughout the year either as vegetable or as a pulse (Singh and Rachie, 1985; Asumugha, 2002; Olapade et al., 2003) Asumugha (2002) maintained that cowpea is the most extensive consumed in various ways especially in the form of Akana and moin- moi which are very popular breakfast and snack foods. Philip (1999) and Olaleke et al, (2006) maintained that cowpea contains moisture (4.0), ash (37.1), crude fat (31.3), crude fibre (24.0), crude protein (75.3), carbohydrate by difference (828), fatty acids (25) and energy mjkg-1 (6.5193), a let of minerals including Na, K, Na K, Mg, Ca, P, Cap, Co, Fe, Pb, Cu, Mn, Cd, Zn and Cr.
Cowpea belongs to the family fabaceae and sub-family Faboideae. Cowpea is of major importance to the live hoods of millions of relatively poor people in less developed countries of the tropics. In fresh form, the young leaves, immature pods and peas are used as vegetable while several snacks and main dishes are prepared from the grain (Kwartang and Towler, 1994). Islam et al. (2006) noted that cowpea is more tolerant to drought, water logging infertile soils and acid stress than common beans. Islam et al. (2006) further maintained that west and central Africa is the leading cowpea producing regions in the world. Nigeria still depends largely on crude oil and its refined
products for her income earnings. Spent lubricating oil has been reported to be a major and most common soil contaminant from engines and other machinery in Nigeria (Aneliefo and Edegbai, 2000). The in discriminate disposal of spent oil into open vacant plots and farms, gutters and water drains is an environmental risk both to ground water, plants and other organisms. The effects of oil in soil include depression and inhibition of plant growth, by interfering with the soil- water- plant interrelationships (Agbogidi and Ejemete, 2005; Agbogidi and Dolor, 2007). Although researches have been carried out on the effects of spent engine oil the growth of crop plants (Anoliefo and Vwioko, 1995; Wang et al., 2000, Odjegba and Sadiq, 2002; Nwadinigwe and Uzodimina, 2005; Vwioko and Fashemi, 2005, Agbogidi and Nweke, 2006; Sharifi et al., 2007; Smith et al., 2007). Information on the effects of spent oil on the growth of cowpea is however, scarce. This study has been designed to screen six cultivars of cowpea for adaptation to soil contaminated with spent engine oil with a view to selecting and recommending the tolerant cultivars to farmers especially in the oil producing areas of Nigeria. The study also has the advantage of affording plant breeders the opportunity of searching for ways of improving cowpea production in oil- producing areas. This is because; successive cultivation of cowpea beyond the present limits in Nigeria requires the discovery and selection of cultivars that are tolerant to oil effects.

Academia Arena 2010;2(3)
http://www.sciencepub.net/academia [email protected] 66
Materials and Methods
The study was conducted during the 2007 and 2008 growing seasons at latitude 60141N and longitude 60491E at the Delta State University Research farm, Asaba, Nigeria (Asaba Meteorological Office, 2008). The six cultivars of cowpea-(IT80D- 699), IT82 (e-18), IT84S- 2246- 4, TVx3236, IT90K–277-2 and IT870- 941- 1) were purchased as a single batch from International Institute for Tropical Agriculture (IITA), Ibadan (Onne station), Oyo State, Nigeria while the spent engine was from 10 different motor mechanic workshops in Asaba, Delta State. The site was ploughed by a tractor, harrowed after one week and the land was measured with tape and mapped out with pegs. Each plot measured 5m in length and 3m in width. The space between the plots is 1.5m. A planting space of 60 x 30cm was used following the procedure of Remison (1978). Two seeds from each cowpea cultivar were sown in each plot. Seedlings were thinned to one at two weeks after planting (WAP) when they were fully established. Regular weeding was ensured before plant maturity insect pests were controlled with Karate 2.5 EC at 2 weeks after seedling emergence and thereafter, at 10days interval following the procedure of Awe (2008). 0 (control), 25, 50, 75 and 100ml of oil per stand of the cowpea served as the treatments. Spent engine oil application (ring application) was done at 3 weeks after seedling emergence. The experiment was arranged in a randomized complete block design (RCBD) with four replications subsequent examination followed. Growth indices measure were plant height, leaf area, number of leaves, stem diameter, number of branches, number of nodes on main stem, number of penducle, length of peduncles and days to 50% flowering. Plant height was measured with a meter rule at the distance from soil level to terminal bud. Number of leaves was by visual counting of the leaves per cowpea plant. Leaf area (cm2) was determined by tracing the margins of the leaf on a graph paper and the total area/ plant was obtained by counting the number of 1- cm square (Bamidele and Agbogidi, 2000). The stem diameter was measured at 2cm above soil level with venire calipers. Data on number of branches/ plant, number of nodes/ plant, number and length of peduncles were collected at maturity before senescence by visual counting. Data obtained on each trait were subjected to a single factor analysis of variance (ANOVA) while the significant means were separated with the Duncan’s multiple range tests (DMRT) using SAS (1996).
Results and Discussion
The results obtained for the growth characteristics and morphological characteristics of the six cowpea cultivars are presented in Tables 1 and 2 and 3 respectively. The results showed that cowpea seeds from TVx3236 cultivars and IT84S-2246-4 grown in 25ml of spent engine old gave consistently significant higher values than the control, and the other treatments (50, 75 and 100ml of SEO). Treatments 0 and 25ml of the oil produced significantly higher (P≤ 0.05) plant height, leaf area, number of leaves, stem diameter, number of branches, number of nodes, number and length of peduncles than those of the higher treatments. Plants grown in 25ml of the SEO contaminated soil flowered earlier than those in the control and the higher treatments. Generally, the various responses of the cowpea cultivars to the contaminant was observed to be dose dependent although an increase in the various traits was observed in the cultivars exposed to 25ml of the SED indicating growth stimulation at this level of oil treatment. Anoliefo and Vwioko (2005), Sharifi et al. (2007) separately studied various plant species to soil contaminated with spent lubricating oil and reported growth enhancement (fertilizer effect) at 1% concentration when compound with the control. Agbogidi and Bamidele (2007) noted that small amount of hydrocarbon in substrates can enhance growth media and indirectly growth characteristics. The observed better performance of cowpea cultivars TVx 3236 and IT84S-2246-4 than the other cultivars indicates species dependent quality of oil effects. Anoliefo and Edegbai (2000) reported that Solanum melongena was more tolerant to spent lubricating oil than S. incanum. Similarly, Sharifi et al. (2007) noted that Medicago truncatula is the most tolerant plant species among the six species examined. Vwioko and Fashemi (2005) had earlier reported stimulation of growth in the germination and growth characteristics at 1% w/w spent lubricating oil in soil for Ricinus communis seedling while growth in higher concentrations (2, 3, 4, 5 and 6%w/w) exhibited depression in growth. The study has also showed that as from 50ml of oil application to soil all, the traits examined showed significant reductions (P ≥ 0.05). Reduction in the characteristics Bamidele and Agbogidi (2000) had also reported growth enhancement for aquatic macrophytes at low concentration exposed to the water soluble components of crude petroleum oil.

Academia Arena 2010;2(3)
http://www.sciencepub.net/academia [email protected] 67
Table 1. Plant height (cm) and leaf area (cm2) of the six cultivars of cowpea as affected by SEO
Cowpea cultivar Plant height/ oil level
0 25 50 75 100 Means
1WAOA
IT81D-699 20.1 21.7 10.6 18.7 18.4 19.7e
IT82 (e-18) 22.4 22.6 21.4 21.0 20.6 21.6a
IT84S-2246-4 24.6 25.6 24.2 23.0 22.1 23.9b
TV x 3236 25.7 25.8 24.6 24.4 24.0 24.9a
IT90K -277-2 21.2 21.6 21.0 20.6 20.3 20.9d
IT870-941-1 20.3 20.6 20.0 19.4 18.6 19.8e
Means 22.4b 23.0a 21.8c 21.2d 20.7e
2WAOA
IT81D-699 40.3 41.0 40.1 39.6 38.4 39.9
IT82 (e-18) 46.7 46.9 46.3 43.7 40.1 44.7
IT84S-2246-4 56.7 56.9 56.4 56.2 55.6 56.4
TV x 3236 58.4 58.8 58.9 57.7 56.2 58.0
IT90K- 277-2 46.7 46.9 46.2 45.2 45.0 46.0
IT870-941 45.6 45.8 45.1 44.7 43.1 44.9
Means 49.1b 49.4a 48.8c 47.9d 46.4e
3WAOA
IT81D-699 56.4 56.5 56.2 56.0 53.1 55.6d
IT82 (e-18) 56.9 57.4 57.1 56.8 55.1 56.7d
IT84S-2246-4 70.3 70.7 70.5 70.2 70.0 70.3b
TV x 3236 74.8 74.4 74.4 74.4 73.2 74.3a
IT90K-277-25 7.6 57.7 57.3 56.8 56.3 57.1c
IT870-941-1 57.2 57.3 57.0 56.3 56.1 56.8d
Means 62.2b 62.4a 62.1b 61.8c 60.6d

Academia Arena 2010;2(3)
http://www.sciencepub.net/academia [email protected] 68
Cowpea cultivar Leaf area/ oil level
0 25 50 75 100 Means
1WAOA
IT81D-699 40.2 41.6 40.1 40.0 39.1 40.2e
IT82 (e-18) 42.2 43.6 42.0 41.7 41.6 42.2c
IT84S-2246-4 48.6 49.7 48.0 47.8 46.9 48.6b
TV x 3236 49.725.7 50.8 49.3 49.2 49.0 49.6a
IT90K -277-2 41.6 41.9 41.3 41.0 40.7 41.5d
IT870-941-1 41.6 42.5 41.0 41.2 41.4 41.5d
Means 43.9b 45.0a 43.6c 43.8d 43.3d
2WAOA
IT81D-699 56.1 56.7 56.0 55.0 55.0 55.8d
IT82 (e-18) 57.7 57.9 57.1 57.0 56.1 57.2c
IT84S-2246-4 62.0 63.1 59.4 58.7 57.6 58.2b
TV x 3236 64.4 65.2 63.7 63.3 63.0 63.9a
IT90K- 277-2 54.4 55.1 54.6 54.2 53.8 54.4d
IT870-941 53.7 54.3 53.0 53.1 53.0 53.4e
Means 58.1b 58.7a 57.3c 56.9d 56.4e
3WAOA
IT81D-699 57.4 58.3 57.2 57.0 56.1 56.6
IT82 (e-18) 59.9 60.3 59.0 57.6 55.4 58.3
IT84S-2246-4 64.6 65.9 63.4 63.2 62.1 63.8
TV x 3236 65.9 66.3 65.2 64.6 62.9 65.8
IT90K-277-25 56.1 56.7 55.0 53.7 51.6 54.6

Academia Arena 2010;2(3)
http://www.sciencepub.net/academia [email protected] 69
IT870-941-1 54.9 55.4 53.2 52.7 51.6 54.6
Means 59.7b 60.5a 58.8c 58.1d 56.8e
Means in the same column with different letters and with the same MAP are significantly different at P≤0.05 using DMRT. WAOA= Week after oil application
Table 2. Number of leaves and stem diameter (cm) of the six cultivars of cowpea as affected by spent engine oil
Cowpea cultivar Number of leaves/ oil level
0 25 50 75 100 Means
1WAOA
IT81D-699 6.6 6.8 6.6 6.3 6.1 6.5c
IT82 (e-18) 6.5 6.7 6.4 6.2 5.7 6.3d
IT84S-2246-4 7.4 7.7 7.3 7.0 7.0 7.3b
TV x 3236 7.5 7.9 7.5 7.2 7.1 7.4a
IT90K-277-25 6.3 6.5 6.2 6.0 5.8 6.2e
IT870-941-1 6.4 6.5 6.1 5.9 5.6 6.1e
Means 6.8b 7.0a 6.7b 6.4c 6.2d
2WAOA
IT81D-699 7.4 7.6 7.3 7.0 6.4 7.1c
IT82 (e-18) 7.3 7.7 7.2 7.0 6.5 7.1c
IT84S-2246-4 9.4 9.8 9.2 9.0 8.3 9.1b
TV x 3236 9.6 10.4 9.6 9.2 9.0 9.5a
IT90K-277-25 7.3 7.5 7.2 7.1 6.5 7.1c
IT870-941-1 7.3 7.6 7.1 6.7 6.4 7.0c
Means 8.1b 8.4a 7.9c 7.7d 7.2e
3WAOA
IT81D-699 7.5 7.6 7.0 6.8 6.2 7.0c
IT82 (e-18) 7.5 7.6 7.0 6.7 6.1 7.0c
IT84S-2246-4 9.4 9.6 9.2 9.0 8.5 9.1b

Academia Arena 2010;2(3)
http://www.sciencepub.net/academia [email protected] 70
TV x 3236 9.6 9.9 9.3 9.1 8.6 9.3a
IT90K-277-25 7.4 7.5 7.0 6.6 6.4 7.0c
IT870-941-1 7.3 7.4 7.0 6.5 6.3 6.9c
Means 8.1b 8.3a 7.8c 7.5d 7.0e
Cowpea cultivar Stem diameter /oil level
0 25 50 75 100 Means
1WAOA
IT81D-699 1.3 1.5 1.2 1.0 0.9 1.2c
IT82 (e-18) 1.4 1.6 1.3 1.0 0.9 1.2c
IT84S-2246-4 1.6 1.8 1.5 1.4 1.2 1.5b
TV x 3236 1.7 1.9 1.6 1.5 1.3 1.6a
IT90K-277-25 1.2 1.3 1.1 1.0 0.9 1.1d
IT870-941-1 1.1 1.2 1.0 0.8 0.7 1.0d
Means 1.4b 1.6a 1.3b 1.1c 1.0c
2WAOA
IT81D-699 1.4 1.6 1.5 1.3 1.0 1.4c
IT82 (e-18) 1.6 1.7 1.5 1.2 1.0 1.4c
IT84S-2246-4 1.9 2.0 1.9 1.4 1.1 1.7b
TV x 3236 2.0 2.1 2.0 1.0 1.3 1.8a
IT90K-277-25 1.4 1.3 1.2 1.0 0.8 1.1d
IT870-941-1 1.3 1.4 1.2 0.9 0.7 1.1d
Means 1.6b 1.7a 1.6b 1.2c 1.0d
3WAOA
IT81D-699 1.5 1.7 1.4 1.2 1.1 1.4d
IT82 (e-18) 1.7 1.8 1.6 1.4 1.1 1.5c
IT84S-2246-4 2.1 2.2 1.9 1.5 1.2 1.8b
TV x 3236 2.2 2.4 2.0 1.6 1.4 1.9a
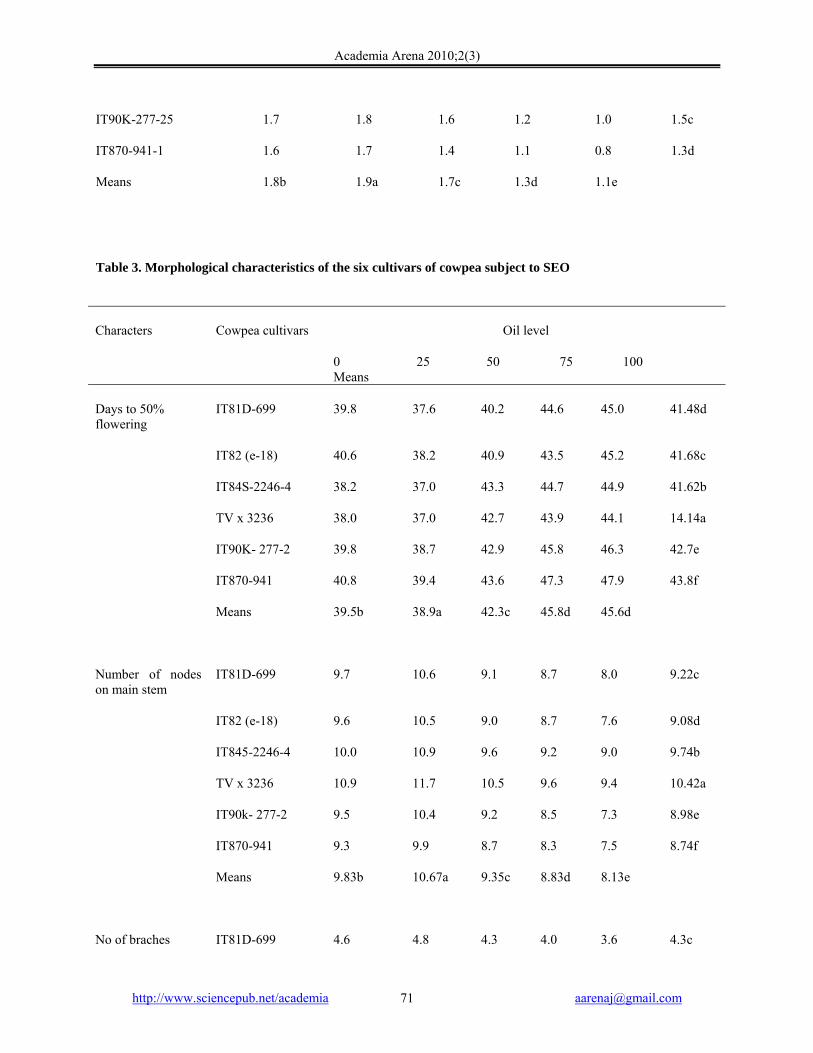
Academia Arena 2010;2(3)
http://www.sciencepub.net/academia [email protected] 71
IT90K-277-25 1.7 1.8 1.6 1.2 1.0 1.5c
IT870-941-1 1.6 1.7 1.4 1.1 0.8 1.3d
Means 1.8b 1.9a 1.7c 1.3d 1.1e
Table 3. Morphological characteristics of the six cultivars of cowpea subject to SEO
Characters
Cowpea cultivars Oil level
0 25 50 75 100 Means
Days to 50% flowering
IT81D-699 39.8 37.6 40.2 44.6 45.0 41.48d
IT82 (e-18) 40.6 38.2 40.9 43.5 45.2 41.68c
IT84S-2246-4 38.2 37.0 43.3 44.7 44.9 41.62b
TV x 3236 38.0 37.0 42.7 43.9 44.1 14.14a
IT90K- 277-2 39.8 38.7 42.9 45.8 46.3 42.7e
IT870-941 40.8 39.4 43.6 47.3 47.9 43.8f
Means 39.5b 38.9a 42.3c 45.8d 45.6d
Number of nodes on main stem
IT81D-699 9.7 10.6 9.1 8.7 8.0 9.22c
IT82 (e-18) 9.6 10.5 9.0 8.7 7.6 9.08d
IT845-2246-4 10.0 10.9 9.6 9.2 9.0 9.74b
TV x 3236 10.9 11.7 10.5 9.6 9.4 10.42a
IT90k- 277-2 9.5 10.4 9.2 8.5 7.3 8.98e
IT870-941 9.3 9.9 8.7 8.3 7.5 8.74f
Means 9.83b 10.67a 9.35c 8.83d 8.13e
No of braches IT81D-699 4.6 4.8 4.3 4.0 3.6 4.3c

Academia Arena 2010;2(3)
http://www.sciencepub.net/academia [email protected] 72
IT82 (e-18) 3.8 4.0 3.6 3.5 3.0 3.6e
IT84S-2246-4 5.6 5.8 5.2 4.6 3.9 5.0b
TV x 3236 7.8 8.0 7.7 5.8 6.3 7.3a
IT90K- 277-2 4.2 4.6 4.0 3.2 2.8 3.8d
IT870-941 4.1 4.5 3.8 3.1 2.6 3.6e
Means 5.0b 5.3a 4.8c 4.1d 3.1e
Number of peduncles
IT81D-699 7.1 7.4 7.0 6.3 6.2 6.8c
IT82 (e-18) 7.2 7.5 6.2 6.4 5.2 6.4d
IT84S-2246-4 8.6 8.8 7.4 7.2 7.0 7.8a
TV x 3236 8.7 8.9 7.9 7.7 7.4 7.8a
IT90K- 277-2 7.3 7.5 7.0 6.4 6.3 6.9b
IT870-941 7.4 7.6 7.0 6.4 6.3 6.9b
Means 7.7b 8.0a 7.1c 6.7d 6.4e
Length of peduncles
IT81D-699 9.4 9.6 9.3 9.0 9.3 9.3d
IT82 (e-18) 9.7 9.7 9.3 9.2 9.1 9.3d
IT84S-2246-4 12.7 12.7 10.9 10.4 10.3 11.2b
TV x 3236 12.9 12.9 11.4 10.9 10.6 11.5a
IT90K- 277-2 9.9 9.9 9.4 8.7 8.5 9.2d
IT870-941 9.9 9.9 9.5 9.4 9.2 9.5c
Means 10.3b 10.8a 10.0c 9.6d 9.5d
Means in the same column and within the same parameter with different letter are significantly different at P≤ 0.05 using DMRT. REFERENCES Adaji, M.J., Olufaja, O.O and Aliyu, L. (2007). Effect of intra-row spacing and stand density on the
growth and yield of cowpea (Vigna unguculata (L.) Walp). In: Olufaja, O.O., Omokore, D.F., Akpa, G.N and Sanni, S.A. (eds.). Proceedings of the 41st Annual

Academia Arena 2010;2(3)
http://www.sciencepub.net/academia [email protected] 73
Conference of the Agricultural Society of Nigeria (ASN) held at the Institute for agricultural Research, Samaru, Ahmadu Bello University, Zaria between 22nd and 26th October, 2007. Pp 153 – 157. Adams, G. and Duncan, H. (2002). Influence of diesel fuel on seed germination. Environmental Pollution 10: 363 – 370. Agbogidi, O.M. and Dolor, D. E. (2007). An assessment of the growth of Irvingia gabonensis (Aubry-Lecomte Ex O’ Rorte) Bail seedlings as influenced by crude oil contamination of soil. Asian Journal of Plant Sciences 2: 1287-1292. Agbogidi, O.M. and Ejemete, O. R. (2005). An assessment of the effects of crude oil pollution on soil properties, germination and growth of Gambaya albida (L.). Uniswa Research Journal of Agriculture, Science and Technology 8 (2): 148-155. Agbogidi, O.M. and Nweke, F.U. (2005). Effects of crude oil polluted soil on the performance of okra (Abelmoschus esculentus) Moench in Delta State. African Journal of Natural Sciences 8: 31-35. Agbogidi, O.M. and Eshegbeyi, O.F. (2006). Performance of Dacryodes edulis (Don. G. Lam. H.J.) seeds and seedlings in a crude oil contaminated soil. Journal of Sustainable Forestry 22 (3/4): 1-14. Agbogidi, O.M., Eruotor, P.G. and Akparobi, S.O. (2006a). Effects of soil contaminated with crude oil on the germination of maize (Zea mays L). Nigerian Journal of Science and Environment 5: 1-10. Agbogidi, O.M., Eruotor, P.G., Akparobi, S.O. and Nnaji, G.U. (2007). Heavy metal content of maize (Zea mays L) grown in soils contaminated with crude oil. International Journal of Botany 3(4): 385-389. Agbogidi, O.M., Onosode, A.T. and Okonta, B.C. (2006b). Susceptibility of Dennettia tripetala (Bak.) F. seeds to crude oil. Journal of Food, Agriculture and Environment 4(2): 350-352. Agbogidi, O. M. and Nweke, F.U. (2006). Screening five cultivars of soya bean (Glycine max (L) Merr.) for adaptation in soils contaminated with crude oil. Proceedings of the 40th Annual Conference of the Agricultural Society of Nigeria held at the University of Agriculture, Umudike, Abia State, and 16th -20th October, 2006. Pp 570-572.
Agbogidi, O. M. and Ofuoku, A.U. (2005). Response of sour sop (Annona muricata Linn.) to crude oil levels. Journal of Sustainable Tropical Agricultural Research 16: 98-102. Adelaja, S.O. (2000). Development and evaluation of some quality parameter of cowpeas (Vigna unguiculata snack). In: Nkama, L., Jideani, J.A. and Ayo, J.A. (eds.). Proceedings of the 24th Annual Conference of NIFST held at Bauchi, Bauchi State between 20th and 24th November, 2000. Pp 258 – 259. Adeniji, T.O. (2007). Studies on grain yield stability in cowpea (Vigna unguiculata (L.) Walp). In: Olufaja, O.O., Omokore, D.F., Akpa, G.N and Sanni, S.A. (eds.). Proceedings of the 41st Annual Conference of the Agricultural Society of Nigeria (ASN) held at the Institute for agricultural Research, Samaru, Ahmadu Bello University, Zaria between 22nd and 26th October, 2007. Pp 25 – 28. Adepoju P.A. and Marcus, A.A. (2000). Effect of Processing on the quality and acceptability of two varieties of cowpea flour. In: Nkama, L., Jideani, J.A. and Ayo, J.A. (eds.). Proceedings of the 24th Annual Conference of NIFST held at Bauchi, Bauchi State between 20th and 24th November, 2000. Pp 327 – 328. Anoliefo, G. O and Vwioko, D. E. (1995). Effect of spent lubricating oil on the growth of Capsicum annum L. Lycopersicon esculentum Miller. Environmental Pollution 88:361-364. Anoliefo, G. O. and Edegbai, B. O. (2000). Effect of spent engine oil as a soil contaminant on the growth of two egg plant species, Solanum melongena L. and S. incanum L. Journal of Agriculture, Forestry and Fisheries 1:21-25. Anoliefo, G. O. and Vwioko, D. E. (2001). Tolerance of Chromolaena odorata (L) K. and R. grown in soil contaminated with spent lubricating oil. Journal of Tropical Bioscience 1(1):20-24. Asumugha, V.U (2002). Sensory and functional properties of dry vegetable cowpea product (Akara). In: Ubbaonu, C.N., Eke, O.S. and Uzomah, A. (eds.) Proceedings of the 26th Annual Conference of the Nigerian Institute of Food Science and Technology (NIFST) held at the Federal University of Technology, Owerri, Imo State between 4th and 8th of November, 2002. Pp 66 – 67.
Academia Arena 2010;2(3)
http://www.sciencepub.net/academia [email protected] 74
Atuanya, E.I. (1987). Effect of waste engine oil pollution on physical and chemical properties of soil: a case study of waste oil contaminated Delta Soil in Bendel State. Nigeria Journal of Applied Science 5:155 – 176. Awe, O.A. (2008). Preliminary evaluation of three Asian yards long bean cowpea lines in Ibadan, south western Nigeria. In: Proceeds of the 42nd Annual Conference of ASN held at Ebonyi State University, Abakaliki, Nigeria between 19th and 23rd of October, 2008. Pp 246 – 249. Bamidele, J. F. and Agbogidi, O.M. (2000). Toxicity of Odidi petroleum oil and its water soluble fraction on three aquatic macrophytes. Nigerian Journal of Science and Environment. 2:113-121. Benka-Coker, M.O. and Ekundayo, J.A. (1995). Effect of an oil spill on soil physicochemical properties of a spill site in the Niger Delta area of Nigeria. Environmental Monitoring and Assessment 36:93- 104. Benka – Coker, M. O. and Ekundayo, J. A. (1997). Applicability of evaluating the ability of microbes isolated from an oil spill site to degrade oil. Environ. Monitor. Assess. 45: 259 – 272. Duke, J.A. (1981). Vigna unguiculata (L) Walp. In: Dark, C.B. (ed.). Legumes of world economic importance. Plenum Press, New York. Pp 303 – 305. Gill, L.S., Nyawuame, H. G. K. and Ehikhametalor, A. O. (1992). Effect of crude oil on the growth and anatomical feature of Chromolaena odorata (L.) K and R. Chromolaena odorata Newsletter 6:95-98. Heashaw, F.O., Awonorin, S.O. and Odunowo, F.M (2002). Functional properties of frozen cowpea paste: effects of freezing temperature. In: Ubbaonu, C.N., Eke, O.S. and Uzomah, A. (eds.) Proceedings of the 26th Annual Conference of the Nigerian Institute of Food Science and Technology (NIFST) held at the Federal University of Technology, Owerri, Imo State between 4th and 8th of November, 2002. Pp. 15 – 16. Islam, S., Cowmen, R.C. and Garner, J.O. (2006). Screening for tolerance of stress temperature during germination of twenty-five cowpea (Vigna unguiculata L. Walp) cultivars. Journal of Food, Agric and Environment 4(2):189 – 191. Lambot, C. (2003). Industrial potential of cowpea. In: Fatukun, C.A., Taranwall S.A., Singh, B. Bo., Kormawa P.M. and Tamo, M. (eds.) Challenges and
Opportunities for enhancing sustainable cowpea production IITA, Ibadan. Pp 367 – 375. Lauriault, L. Furrow-irrigation effects on cowpea for edible dry beans, Southern, High Plains, USA, New Mexico Agricultural Experiment State, Research, 757:1–6. Nwadinigwe, A.O. and Uzodimma, N.S. (2005). Effects of petroleum spills on the germination and growth of groundnut (Arachis hypogaea L.). Journal of Biological Research and Biotechnology 3(2): 101 – 105. Odjegba, V.J. and Sadiq, A.O. (2002). Effects of spent engine oil on the growth parameters, chlorophyll and protein levels of Amaranthus hybridus L. The Environment 22:23 – 28 Ojimelukwe, P.C. (2002). Changes induced by infestation on source chemical properties of cowpea seeds. Plant Foods for Human Nutrition 57:129 – 140. Olaleke, A.O., Olorunfemi, O. and Akintayo, T.E. (2006). Compositional evaluation of cowpea (Vigna unguiculata) and scarlet runner bean (Phaseolus coccineus) varieties grown in Nigeria. Journal of Food, Agriculture and Environment 4 (2): 39 – 43. Olapade, A.A., Okafor, G.I., Olatunfi, O. and Ozumba, A.U. (2000). Characteristics of common Nigerian Cowpea (Vigna unguiculata L. Walp) seed varieties. In: Nkama, L. Jideani, V.A. and Ayo, J.A. (eds.). Proceedings of the 24th Annual NIFST Conference held at the Federal Polytechnic, Bauchi Between 20th and 24th of Nov., 2000 Pp. 182 – 184. Olapade, A.A. Ugokwe, P.U., Ozumba, A.U. and Solomon, H.M. (2002). Assessment of Premix for moin-moin and akara 1: effect of added ingredient on functional properties of cowpea (Vigna unguiculata) flour. In: Ubbaonu, C.N., Eke, O.S. and Uzomah, A. (eds.) Proceedings of the 26th Annual Conference of the Nigerian Institute of Food Science and Technology (NIFST) held at the Federal University of Technology, Owerri, Imo State between 4th and 8th of November, 2002. Pp. 68 – 70. Omotugba, T., Babasanya, B., Omodona, S., Amusa, K., Zungun, A.A., Olufemi S.O. and Apene, E. (2008). Adoption of recommended practices among cowpea farmers in Kachia Local Government Area, Kaduna State. In: Ezike, K. N. N., Osakwe, I. I., Ekwu, L.G., Utobo, E and Mba, C. N. (eds.). Proceedings of the 42nd Annual Conference of the Agricultural Society of Nigeria held in Abakaliki, Ebonyi State, between 19th and 23rd of October, 2008. Pp. 46 – 950.

Academia Arena 2010;2(3)
http://www.sciencepub.net/academia [email protected] 75
Onisore, J.K. and Mohamrned, B.T. (2007). Effect of sowing date on cowpea in Iloin. In: Olufaja, O.O., Omokore, D.F., Akpa, G.N and Sanni, S.A. (eds.). Proceedings of the 41st Annual Conference of the Agricultural Society of Nigeria (ASN) held at the Institute for agricultural Research, Samaru, Ahmadu Bello University, Zaria between 22nd and 26th October, 2007. Pp 158 – 161. SAS (1996). SAS User’s guide statistics version 5, SAS institute Inc., Raleigh, N.Y., USA. Sharifi, M., Sadeghi, Y. and Akharpour, M. (2007). Germination and growth of six plant species on contaminated soil with spent oil. International Journal of Environmental Science and Technology 4(4): 463 – 470. Siddiqui, S. and Adams, W.A. (2002). The fate of diesel hydrocarbons in soils and their effects on the germination of perennial ryegrass. Environmental Toxicology 17(1): 49-62.
Singh, S. R. and Rachie, K. O. (1985). Cowpea research and utilization. John Wiley and Sons, New York. Smith, M.J., Flowers, T.H., Duncan, H.J., and Alder, J. (2006). Effects of polycyclic hydrocarbons on
germination and subsequent growth of grasses and legumes in fleshly contaminated soil and soil with aged PAHs residues. Environmental Pollution 141:519-525. Terge, K. (1984). Effect of oil pollution in the germination and vegetative growth of five species of vascular plants. Oil and Petroleum Journal 2:25-30. Turk, K.J., Hall, A.E. and Asbell, C.W. (1980). Brought adaptation of cowpea 1: Influence of drought on seed yield. Agronomy Journal 72: 413 – 420. Vwioko, D.E. and Fashemi, D.S. (2005): Growth response of Ricinus cummunis L. (castor oil) in spent lubricating oil polluted soil. Journal of Applied sciences and Environmental Management 9 (2): 73 – 79. Vwioko, D.E., Anoliefo, G.O. and Fashemi, S.D. (2006). Metal concentration in plant tissue of Ricinus communis L. (Castor oil) grown in soil contaminated with spent lubricating oil. Journal of Applied Science and Environmental Management 10(3): 127– 134. Wang, J. Jia, C.R. Wong, C.K. and Wong, P.K. (2000). Characterization of polycyclic aromatic hydrocarbons created in lubricating aromatic hydrocarbons created in lubricating oil. Water, Air and Soil Pollution 120:381 – 396.
PAPER ID-1192, DATE-06/10/2009

Academia Arena 2010;2(3)
http://www.sciencepub.net/academia [email protected] 76
Dynamic Simulation for Domestic Solid Waste Composting
Processes
Beidou Xi 1, *, Zimin Wei 1, 2, Hongliang Liu 1
1. Chinese Research Academy of Environmental Sciences, Beijing 100012, China
2. Northeast Agriculture University, Harbin, Heilongjiang 150030, China [email protected], [email protected]
Abstract: Modeling composting processes is the prerequisite to realize the process control of composting. In this paper, a simulation model for domestic solid waste composting processes was developed based on microbial process kinetics, mass conservation equation, energy conservation equation and water balance. Differential equations describing microbial, substrate, oxygen concentrations, moisture content and temperature profiles were derived. Considering that several factors (temperature, oxygen, moisture and FAS) in the process interacted to composting processes, microbial biomass growth kinetics was described. In order to verify the model, a series of aerobic composting experiments on domestic solid wastes were conducted. Temperature, moisture, microbial biomass growth, oxygen consumption rate and the concentrations of organic components were monitored in the composting processes and also simulated with the developed model. The simulation results were well consistent with the experimental results. It also could be seen from the model that the efficiency of composting processes could be raised and aeration requirements could be reduced by controlling the oxygen concentration in the exhaust air within a proper range. When the range is 8% to 12%, the aeration requirements reduced 79.61%. This result was verified by the composting experiment. When initial moisture content was higher than 66% or lower than 33%, it would significantly reduce the rate of substrate degradation. It indicated the effect of initial moisture content on the composting processes was significant. A simple sensitivity analysis demonstrated that two key parameters in composting modeling to determine were maximum specific growth rate ( maxμ ) and yield coefficient (YY/S). Therefore, the composting processes could be optimized by the application of the developed simulation model. [Academia Arena 2010;2(3):76-89]. (ISSN 1553-992X).
Key words: dynamic simulation; model; composting; domestic solid waste 1. Introduction
The biochemical and physical characteristics of solid wastes (e.g., constituents, pH, and moisture) and operating conditions of solid waste composting (e. g., carbon to nitrogen ratio, aeration rate, reaction temperature and pressure) impose significant effects on an ecological succession of microorganisms (Vallini, 1993; Huang, 2000). Although relationships between these factors have been stressed, it is often difficult to synthesize such a large volume of materials. Generally, the factors that affect composting processes, such as temperature and oxygen availability, are controlled to maintain a relatively better growth environment for microorganisms during the process of composting. Analytical and numerical modeling of the composting process could be used as a tool to analyze composting system performance under different operating scenarios.
Modeling composting processes is the prerequisite to realize the process control of composting. Over past years, there have been many approaches (Miller, 1996) which have been used to investigate composting processes: (Hammelers, 1993; Stombaugh, 1996; Agamuthu, 1999) considered growth rates of microorganisms and used the Monod equation to simulate the composting processes (Keener, 1993; Haug, 1993) made emphasis on the thermodynamic and kinetic changes taking place during composting processes. Mohee and White (1998) developed a dynamic simulation model to present biodegradation processes in composting based on the knowledge of the physical and chemical changes occurring in the processes. Hamoda et al. (1998). Wang and Li (2000) also conducted a number of works on the modeling for composting processes. Bari et al. (2000) studied a

Academia Arena 2010;2(3)
http://www.sciencepub.net/academia [email protected] 77
kinetics analysis of forced aeration composting processes operated under different aeration modes.
However, at the present, most of the existing composting systems are static control systems and the underlying biological portion of the process has been neglected. At the same time, the states of solid waste are various in different periods due to the dynamic features and the living environment of microorganisms is also incessantly changing due to the increase of metabolizing production and consumption of biochemical reaction. These inherent complicated processes are insurmountable for design of cost-effective composting system. So, the present models exist some limitation for real composting processes to determine optimal operation conditions. Thus, it is necessary to integrate the intrinsic rate equations with fundamental microbial kinetics to produce a dynamic model of the process. The dynamic simulation model would be more robust than current empirical models. It should consider more complete complexities process of composting and supply interactive relationship of temperature, oxygen, FAS, moisture and microbial biomass growth to instruct the design of composting system and determine the optimal operation conditions for the process.
The primary objective of this study is to develop an integrated simulation model, which can be used for engineering analysis and design. The dynamic kinetics of the whole composting processes and all key factors, which limit the kinetics, will be considered. The model describes substrate degradation, microbial growth, moisture change, oxygen concentration and aeration on-off situation as a function of substrate and oxygen concentration in the exhaust air, compost temperature and moisture content. Realistic economic aeration will be included to evaluate and optimize a rotation vessel composting process with the numerical simulation results. At the same time optimal composting conditions will be identified.
2. Development of dynamic composting of processes simulation model
Most modern municipal solid waste composting operations emphasize the enhancement of decomposition rate of the organic matter as well as the economic operating cost. This can be achieved once the composting process kinetics is well understood. Based on microbial process kinetics, mass conservation equation, energy conservation equation and water balance, differential equations describing microbial,
substrate, oxygen concentrations, moisture content and temperature profiles are derived. Then a simulation model for domestic solid waste composting processes is developed. The process is shown in Figure 1. 2.1 Kinetics of composting processes
The complex and dynamic interactions within bioconversion are a fundamental component for developing a proper composting process. Thermal/physical/chemical interactions must be considered completely in biological and physical composting processes in the simulation modeling. The Monod equation is the most popular kinetic expression applied to modeling biodegradation. The Monod equation expresses the microbial growth rate as a function of nutrient that limits growth. The expression is of the same form as the Michaelis-Menton equation for enzyme kinetics is derived empirically. The limiting nutrient can be a substrate, electron acceptor, or any other nutrient such as nitrogen or phosphorous that prevents the cells from growing at their maximum rate. The nutrient limitation is expressed in the form of a Monod term multiplying the maximum growth rate. The Monod equation (藤田賢二, 1993) is:
⎟⎠⎞
⎜⎝⎛
+==
SKcXSX
dtdX
maxμμ (1)
where: μ = specific growth rate (1/h) X = biomass concentration (m/l3) S = substrate concentration (m/l3) = maximum specific growth rate
(1/h) Kc = half saturation constant (value of S at which
μ is ½ maxμ m/l3) In this model, X represents total microbial
biomass concentration including mesophlic and thermophilic bacteria, fungi and actinomycetes, etc.
Endogenous decay consists of internal cellular reactions that consume cell substance. The endogenous decay term is also sometimes conceived of as a cell death rate or maintenance energy rate and represents cells in the death period of the microbial growth cycle. Endogenous decay is described by adding a decay term to the Monod expression:
bXSKcX
SXdtdX
−⎟⎠⎞
⎜⎝⎛
+== maxμμ (2)
where b is the endogenous decay rate constant (1/h).
maxμ

Academia Arena 2010;2(3)
http://www.sciencepub.net/academia [email protected] 78
The substrate ( S ) is assumed to be the substrate utilization which is determined by dividing the Monod expression by a yield coefficient, sxY / , the yield coefficient must also be determined experimentally. Substitution of the yield coefficient into the Monod expression for microbial growth results in the following expression for substrate utilization:
XYb
SKcXSX
YX
YdtdS
sxsxsx //
max
/
+⎟⎠⎞
⎜⎝⎛
+−=−=μμ (3)
The constant quotient max // x sYμ is often called k , the maximum specific substrate utilization rate. and
// x sb Y is called dk , so that the Monod equation for substrate utilization becomes:
XkSKcX
SXXkdtdS
d+⎟⎠⎞
⎜⎝⎛
+−= ' (4)
Following Haug (1993), the composite degradation constant is represented by multiplicative factors for temperature, oxygen, free air space and moisture content as:
2
'OFASmoistureT kkkkkk ⋅⋅⋅⋅= (5)
where Tk is the temperature correction, Moisturek is the moisture content correction, F A SK is the free airspace correction and 2Ok is the oxygen concentration correction. The effects of them are concerned as follows:
(1) The temperature correction Tk
According (藤田賢二, 1993), the relationship between microbial specific growth rate μ and temperature of compost bulk is presented by equation 6
(when 60, =≤ MM TTT ℃), equation 7 (when 80, =≤≤ LLM TTTT ℃), when .0,0, ==≥ TL kTT μ
⎭⎬⎫
⎩⎨⎧
+−
+−== )
2731
2731(exp
SA
A
sT TTR
Ekμμ (6)
ML
L
MT TT
TTk−−
==μμ (7)
where: Sμ =microbial specific growth rate at preference temperature (1/h)
T = temperature of compost bulk (ºC) AE = activate energy of compost bulk (J/mol)
R = universal gas constant (J/(model·K))
(2) The moisture content correction Moisturek Through experiments, the relationship between
microbial maximum specific growth rate and water content in compost bulk is identified as follows. When water content w is lower than the critical value
aw , which is essential for microbial growth, 0,0 == moisturekμ . When w is greater than aw ,
wKwwk
a
amoisture +
−==
maxμμ . When w is greater than
60%, 12
2
max wwww
wKwwk
a
amoisture −
−+−
==μμ .
Here 1 260% and 80%w w= = w1 is the optimum moisture and w2 is the highest
moisture above which composting can’t carry out.
(3) The free airspace correction F A SK Free air space (FAS) is important in composting
processes, because it is correlated with oxygen transfer. The FAS correction is given as (Hang, 1993).
]4945.3*675.23[11
+−+= FASFAS e
k (8)
Because composting particles constantly consolidate, FAS in reality decreases with time. However, FAS is left constant because the interaction of particles and moisture which affects FAS through the composting processes on beyond the scope of this study.
FASk

Academia Arena 2010;2(3)
http://www.sciencepub.net/academia [email protected] 79
(4) The oxygen concentration correction
2Ok
Oxygen concentration could be limited by diffusion the particle matrix of solid waste. Because the effect of particle size is difficult to model, a more simplified approach was adopted. Haug (1993) assumed that particle sizes are sufficiently small to avoid oxygen transport limitations and got a Monod-type expression shown as follows to model oxygen limitation.
⎟⎟⎠
⎞⎜⎜⎝
⎛+
=2
2
%%
2 OVolKOVolk
oO
(9)
The 2%OVol is the percentage of oxygen in the incoming air. Because the substrates are well mixed, oxygen levels in the FAS between composting particles should be in the same range. So, it is assumed that the oxygen concentration in the FAS in the vessel is the same as the residual oxygen concentration in the exhaust gas. The half velocity coefficient OK is calculated through the relationship between the velocity and the oxygen concentration in the exhaust gas and get a value of 2.0%. In reality, oxygen concentration will be considerably above 6% to keep the reactor from becoming facultative or anaerobic. But when particle thickness on the order of 1.0 cm would appear to present large diffusion resistances that would tend to dominate the process kinetics. So the particle correction should be
concerned. Then the experiential equation is given as follows.
particleo
O kOVolK
OVolk ⋅⎟⎟⎠
⎞⎜⎜⎝
⎛+
=2
2
%%
2 (10)
Where particlek is an experiential coefficient (the range is 0 to 1). The value of particlek will be adjusted according the composting particle size.
2.2 Conservation equation 2.2.1Mass conservation equation
Figure 2 shows the conceptual diagram of mass balance of composting processes from time 1−t to time t during an operation process. Microorganisms ( X ) take organic substance ( S ) in solid waste as nutrients for growth. Microbial activities also result in the change of moisture (water content W ) in solid waste. The mass balances are expressed as
tt SSdtdS
−= −1 tt XXdtdX
−= −1 tt WWdt
dW−= −1
where S = the mass of organic substance (m) X = the mass of microorganisms (m) W = the mass of water in the reactor (m) t = the time period (h)
Mass conservation Monod kinetics water balance
energy conservation
Temperature, air flow organic and inorganic
matter content, moisture content, microbial mass, air
fl d
Model development (Process kinetics analysis)
Input variables Output Coefficient parameter
Simulation MSW composting processes
Case study and modeling validation
Optimization simulation model
Figure 1. The process of developing simulation model for MSW composting
WXS ΔΔΔ , , 1
1
1
−
−
−
t
t
t
WXS
t
t
t
WXS

Academia Arena 2010;2(3)
http://www.sciencepub.net/academia [email protected] 80
Figure 2. Conceptual diagram of mass balance of composting processes.
2.2.2 Water balance and moisture content correction
There are positive relationships between water evaporation rate, water content and rate of air supply. The conservation equations of water in the reactor of solid waste compost are as follows:
MWjq
dtdW λ−= (11)
s
s
ppp
j−
=04.22
18 (12)
where: q = flow rate of air supply (l3/h) λ = saturation ratio of vapour M =mass of compost bulk, equals
UWXS +++ , U is the humus content (m) j = saturate water vapour content (kg/Nm3)
sp = saturation vapour pressure (Pa) 0p = air pressure (Pa)
The relationship between saturation vapour pressure and air pressure can be described by the following equation (13):
)exp(0 DT
BApps
+−= (13)
where BA, and D are experiential constants. Based on Xi Beidou (2002), A = 11.961, B = 3993.7 and D = 233.9.
2.2.3 Energy conservation Assuming the energy conservation is expressed by thermal balance during solid waste composting processes, energy conservation equation is presented by equation (14) as follows:
⎥⎦⎥
⎢⎣⎢ +−−+−+=++ )()()( 21 dt
dXdtdSC
dtdWCKFqCTT
dtdWh
dtdX
dtdSh
dtdTMC swaac (14)
where: cC = heat capacity of compost bulk (kJ/
(kg·℃))
1h = heat quantity generated by unit dry organic (kJ/kg)
2h = potential heat of water evaporation (kJ/kg) T = temperature of compost bulk (℃)
aT = temperature of inflow air (℃)
q = rate of air supply (m3/h) wC = heat capacity of water (kJ/ (kg·℃))
aC = heat capacity of air (kJ/ (kg·℃)) sC = heat capacity of volatile organic
K = the thermal conductivity coefficient of compost facilities (kJ/(m2·h·℃))
F = total thermal dispersion area of compost facility (m3)
On the left hand side of equation (14), dtdTMCc
is the heat quantity change due to temperature change of compost bulk and )(1 dt
dXdtdSh + is the energy
variation from microbial growth and organic biodegradation process. On the right hand side,
dtdWh2 is the energy transported by water
evaporating and
⎥⎦⎥
⎢⎣⎢ +−−+− )()(
dtdX
dtdSC
dtdWCKFqCTT swaa is the
energy variation due to temperature change of air, water, and volatile organic and system heat loss. The thermal conductivity coefficient of compost facility is calculated as follows:
∑++
=
21
111
γδγLF
FK n (15)
where:
nF = total surface area of compost reactor 1γ = the thermal conductivity coefficient
between outside wall of reactor and ambient surroundings (kJ/ (kg·℃))
2γ =the thermal conductivity coefficient between inside wall of reactor and compost bulk (kJ/ (kg·℃))
δ = the thermal conductivity coefficient of reactor wall
L = thickness of reactor wall 3. Result Analysis 3.1 Pilot-scale experiment
A schematic diagram of the pilot-scale rotation reactor is showed in Figure 3. The reactor was designed to accelerate the composting process by optimizing temperature and air flow, to verify the results of simulation model. The modes of aeration studied were up flow through PVC tubing filled gas chamber below a fine mesh screen near the bottom of

Academia Arena 2010;2(3)
http://www.sciencepub.net/academia [email protected] 81
the reactor. Solid wastes temperature sensors were used for temperature measurements. The leachate of the system would be captured and recycled through the chamber rotation. This not only prevents the composts from drying out, but also prevents the removal of any bacteria, microorganisms that are essential to the process. Outlet vent installed an O2-H2S measuring apparatus: MD-520E instrument and CO2 analyzer: LX-710.
1
2
8
5
34 6
7
Figure 3 Schematic diagram of experimental reactor. 1. main body; 2. axis; 3. gas flow meter; 4. electromotor; 5. control system; 6. air feedsystem; 7. temperature equipment; 8. gas analyzer.
The initial moisture content of the compost
mixtures was around 60.0% (g H2O/g wet solids). The organic substrate of raw materials was 35.0%. Each pilot-scale composting tests was performed according to the conditions of simulation model. At the first time, the air flow was constant at 0.02 m3/(h·kg). At the optimum condition, air flow was controlled and outlet oxygen concentration remains between 10 to 18%. This air flow served an additional service in keeping the reactor constantly aerated.
The solid wastes around 150 g were sampled to measure substrate concentration, moisture content, volatile solids at three points in the reactor. Moisture content was measured by oven drying at 101� for 24 h until a constant weight was obtained. Volatile solids content was determined by combusting samples at 550� for at least 6 h in a muffle furnace. Total nitrogen content was determined using the
kjeldahl method while Carbon was determined using TOC analyzer.
Composite samples are processed for microbial count. The dilution plate is used to estimate the number of actinomycetes, bacteria and fungi in the samples. Mesophilic and thermophilic microbial strains are obtained by plating samples taken during composting progress in cultivating the plates at 30 and 60℃, respectively. Mesophiles and thermophiles are isolated and maintained on trytone soy agar (TSA) and peptone agar (PA), respectively. Isolates are obtained by streaking out all the colonies of a spread plate within a sector containing 40 colonies. All isolates are tested for a number of properties on identical media, at 30 and 60℃.
A basal agar (BA) contained 0.1% peptone (Difco), 0.1% yeast extract (Difco) and 1.5% agar. Test substrates were added to BA as follows: starch (0.5%), gelatine (1%), carboxymethyl cellulose (CMC, 1%), Chitin (swollen precipitated substrate, 30 ml/liter, and Tween 80 (1%) with CaCl2·2HO2
(0.01).
3.2 Validations of Parameters Coefficient and parameter values were
estimated from experimental data and the literature (Hang, 1993). For example, For hydrocarbon compounds, heat quantity generated by unit organic in compost bulk, 1h is 17.4 MJ/kg. For protein, 1h is 23.4 MJ/kg. And for fat, 1h is 39.3 MJ/kg. According to the composition of solid waste used in pilot scale model, 1h for organic substance in this study is selected as 17.6 MJ/kg. Potention thermal of water evaporation is 2.44 MJ/kg. Heat capacity of water, compost bulk and air, wC , cC and aC , are 4.2, 2.1 and 2.1 kJ/(kg·�), respectively.
Under the condition of 55% water content, 60�, 0.02 m3/(h·kg)air flow rate, microbial maximum specific grow rate is 0.18 (1/h); OK =0.066; aK is among the range of 0.02 to 0.07, in this study, aK =0.04. For the pilot scale model, temperature of compost bulk, AT , is 60� and activate engery of compost bulk, AE , is 29 kJ/mol. 3.3 Validation Simulation model
Three scenarous are investigated with the simulation model. The first simulation investigated the interactions between substrate concentration, microbial biomass growth, oxygen concentration

Academia Arena 2010;2(3)
http://www.sciencepub.net/academia [email protected] 82
temperature and moisture content within the composter using a constant aeration rate. The second set of simulations using the roatation composter set-up, the aeration rate was controlled by the oxygen concentration in outlet exhust gas.
3.3.1 Predicted composter performance for a constant aeration rate
With developed dynamic simulation model, variations of compost indexes, such as compost bulk, organic components in compost bulk, mass of microorganisms, water content and temperature in the reactor and oxygen concentration in out air flow, are listed in Table 1 . The data of Table1 showed that most of compost indexes were decreased during the composting processeses except for temperature and mass of microorganisms. Temperature of compost bulk increased rapidly at the early stage, then kept stable. In the later stage of composting processeses, temperature declined gradually and the oxygen concentration in air outflow kept stable. It showed that function of air supply in this period was mainly cooling compost bulk. The mass of microorganisms kept increasing during composting processeses. The simulation results were consistent with the real experimental results (Table 1 and Figures 4 to 7) except that the error of temperature simulation was a little bit high. Reduction rates of solid waste were 60.36% and 50.08% through numerical model simulation and pilot scale experiments. Simulation result of organic substance degradation was 27.1%, while experimental result was 39.7%. Water content decrease of simulation was 37.13% and experimental result was 30.5%. The retention time of temperature above 55� was 156 hours for simulation result, however, it was 72 hours for experimental result. The reason of high temperature simulation error is perhaps the heat loss due to incomplete insulative reactor.
3.3.2 The aeration rate was controlled by the oxygen concentration in exhust gas
The simulation result of variations of compost indexes, are listed in Table 2. With developed dynamic simulation model, Air flow was adjusted so that outlet oxygen concentration in the exhaust gas remained a proper range to optimize the aeration costly. When the oxygen concentration was controlled the range from 10% to 18%, At the same
conditions, the experimental results are shown in Figure 8.
Comparison among simulation and experimental results showed that the developed model could well simulate solid waste composting processes. Therefore, it could be used to instruct the design of optimal operation. The developed model may be used to simulate the efficiency and cost of compost processes 5nder different operation conditions. In this study, tHe air supply approach was adjusted and the developed model was then used to simulate the compost efficiency. It was identified, when composting pRocesses was on the way of iNtermittent operation, startinG air supply when oxygen concentration in air outflow lower than 10% and stopping air supply wheN oxygen concentration higher than 18%, composting processes was very cost-effective. With this condition, running pilot scale experiment results in consistent reduction rate of organic substance (Figure 8). At the same time, oxygen supply was reduced 40% so that the cost of system operation was saved greatly. Thus, it is necessary to optimize the aeration mode to enhance the degradation rate of composting process and reduce air flow.
3.4 Sensitivity analysis
A simple sensitivity analysis was performed to evaluate the relative importance of selected model parameters. The parameter values examined were maximum specific growth rate μmax, half velocity constants for both degradable substrate ( cK ) and oxygen ( OK ), yield coefficient (Y ), initial biomass concentration (X0), initial moisture content (W0) and temperature (Temp0). These parameters were run in the simulation program and all other parameters were set at their default values. Then each parameter was decreased to 60%, 40% and 25% of its default value and then increased by 20%, 40% and 60% of its default value over a 10-day simulation period. As each parameter was varied, all other parameters were maintained at their default values. All parameter values used are shown in Table 3. Results from this analysis are shown graphically in Figures 10 and Figures 11.

Academia Arena 2010;2(3)
http://www.sciencepub.net/academia [email protected] 83
Table 1. Simulation results with developed model
Time (h)
Total weight of compost bulk (kg)
Substrate (%)
Microbial (%)
Water content (%)
T (ºC) O2 concentration in
out flow (%) 0 100.00 35.00 1.00 55.00 22.0 20.90
24 97.65 33.94 1.97 54.87 53.88 17.79 48 88.73 33.34 4.18 52.34 67.54 14.77 72 79.64 33.10 6.68 48.92 67.57 15.08 96 71.28 32.74 9.58 45.05 67.15 15.53 120 63.85 32.23 12.86 40.81 66.45 16.04 144 57.44 31.53 16.44 36.36 65.47 16.59 168 52.09 30.60 20.22 31.90 64.12 17.15 192 47.76 29.47 24.00 27.69 62.25 17.72 216 44.40 28.18 27.57 23.97 59.35 18.37 240 42.36 27.21 30.07 21.47 47.53 19.64 264 41.39 26.62 31.39 20.25 37.23 20.19 288 40.80 26.23 32.23 19.48 31.85 20.40 312 40.35 25.93 22.89 18.88 29.08 20.51 336 39.97 25.69 33.44 18.35 27.37 20.58 360 39.64 25.51 33.91 17.87 26.11 20.64
0102030405060
0 48 96 144 192 240 288 336
Time (h)
Wat
er c
onte
nt (%
) Experimental resultsSimulation results
0
10
20
30
40
0 48 96 144 192 240 288 336
Time (h)
Subs
trate
con
cent
ratio
n
Experimental results
Simulation results
Figure 4. Comparison of simulation and experimental Figure 5. Comparison of simulation and experimental
results of water content results of substrate concentration
01020304050607080
0 48 96 144 192 240 288 336
Time (h)
Tem
pera
ture
(ºC
)
Experimental resultsSimulation results
0
5
10
15
20
25
0 48 96 144 192 240 288 336
Time (h)
Oxy
gen
conc
entra
tion
(%)
Experimental resultsSimulation results
Figure 6. Comparison of simulation and experimental Figure 7. Comparison of simulation and experimental results of temperature results of oxygen concentration

Academia Arena 2010;2(3)
http://www.sciencepub.net/academia [email protected] 84
Table 2. Simulation results under designed operation condition
Time (h) Total weight of
compost bulk (kg) Substrate
(%) Microbial
(%) Air supply
time (h) Oxygen
concentration (%) 0 105 33.33 0.95 0 20.90
24 102.67 32.34 1.85 12.90 14.67 48 93.30 31.65 4.0 36.90 14.94 72 83.44 31.43 6.45 60.90 15.22 96 74.35 31.11 9.33 84.90 15.64 120 66.25 30.63 12.61 108.90 16.13 144 59.24 29.95 16.25 132.90 16.65 168 53.37 19.03 20.15 156.90 17.19 192 48.62 27.87 24.12 180.90 17.73 216 44.91 26.53 27.93 195.90 7.36 240 42.60 25.46 30.70 200.90 15.80 264 41.51 24.79 32.18 203.70 15.84 288 40.84 24.33 33.14 205.51 10.38 312 40.33 23.97 33.88 207.00 28.65 336 39.91 26.69 34.52 208.10 10.90 360 39.53 23.45 35.07 209.20 12.92
Table 3. Parameter values used in sensitivity analysis Change in Parameter analysis
Parameter Unit Percentage -60 -40 -20 Default 20 40 60
S0 % 140 210 280 350 420 490 560 W0 % 220 330 440 550 660 770 880
Temp0 ℃ 8.8 13.2 17.6 22 26.4 30.8 35.2 X0 g/kg 4 6 8 10 12 14 16
maxμ h-1 0.072 0.108 0.144 0.18 0.216 0.252 0.288 Kc g/kg 9.6 14.4 19.2 24 28.8 33.6 38.4 KO kg/m3 0.017 0.0264 0.0528 0.066 0.0792 0.0924 0.1484 Yx/s kgx/kgs 0.2 0.3 0.4 0.5 0.6 0.75 0.9

Academia Arena 2010;2(3)
http://www.sciencepub.net/academia [email protected]
85
0
10
20
30
40
50
60
70
0 24 48 72 96 120 144 168 192 216 240 264 288 312 336 360Ti me (h)
Varia
tion
of c
ompo
st in
dex
Wat er cont ent (%)
Subst r at e (%)Temper at ur e ( ºC)
Oxygen concent r at i on (%)
Figure 8. Experimental results under designed operation
The output values examined were the total material reduction (kg), the total percent reduction in readily degradable substrate (ΔS, %) during the 10-day simulation, the maximum biomass concentration at any time (Xmax). The maximum compost temperature (Tmax,℃) at any time, air flow quantity and moisture content during the 10 day simulation. In Figure 10 and Figure 11 the effects of changes in each parameter value on these four outputs are shown. For instance as varied from 0.072 to 0.288h-1, Xmax increased from 6.721 to10.141 (kg/m3).
The sensitivity analysis demonstrated that several factors in the process (oxygen, biomass concentration, temperature, and moisture) interacted to control the rates of reactions. So, the interpretation of the results was not always straight forward because of these multiple interactions. For example, as YX/S increased, fairly large increases in Xmax corresponding decrease in Tmax, (Figures 10c and 10d). As
maxμ increased and KC decreased, Tmax (Figure 10 d) increased; however, Xmax (Figure 10 c) and dS/dt (Figure 10b) have little changed. The slightly higher rates of substrate degradation at the increased μmax values were terminated much earlier due to low moisture levels. The decreased sensitivity of these outputs was due to limits placed on the growth process by the oxygen concentration, FAS, moisture and temperatures. Even more pronounced interactions were observed in the effect of increased μmax or YX/S
on the total reduction in substrate (Figure 10b). The maximum total substrate degradation (22.6%) occurred at the values of μmax =0.18h-1 and YX/S=0.6.
As μmax decreased from its default value by 60%, a decrease in X of only 50.2% occurred because growth was inhibited somewhat by reduced oxygen levels, higher temperature and reduction of moisture. Similarly, a decrease in the maximum rate of substrates gradation was observed, but it was decreased by only 6.75%. The higher temperature when μmax was decreased 60% (68.2 vs. 60.1℃) caused more rapid drying.
Changes in Kc or Ko had very little effect on the Total materials reduction of composting (Figure 10a), total substrate reduction (Figure 10b), maximum biomass (Figure 10c) and maximum compost temperatures (Figure 10d). Again, the air flow quantity and 10-day moisture content were regulated by changes in substrate and temperature levels. Higher values of Kc and Ko or lower values in slightly effect composting processes.
Changes in the initial biomass concentrations (Xo) and initial temperature had extremely small effects (Figures 10a through 11f) on the magnitudes of the output values examined (less than 2%); however, to different values of Xo, the times at which the maximum values were achieved shifted. For example, the maximum compost temperature occurred at 108 h for Xo=0.004 kg/m3 and at 60 h for Xo=0.01 kg/m3.
Changing the initial moisture content (W0) from 22% to 71.5 resulted in major changes in all output variables except maximum temperature which only decreased from 69.2℃ to 65.8℃ (Figure 110 d). However, the maximum temperature occurs in 240 h. The effect of initial moisture content on the composting processes is shown in more detail in Figures 10f. Slighter high moisture content than default provided more optimal conditions (Figures 11f) during the time periods when rapid composting was occurring, but when it comes over 66%, the rate of substrate degradation decrease. Particularly, when moisture content is more than 71.5%, the composting processes are impossible. As W0 decreased from its default value by 60%, the total substrate use and the Xmax are 2.123% and 0.0365 kg/m3, respectively. This moisture depletion caused the durations of these higher rates to be shorter and the total substrate degradation was lower.
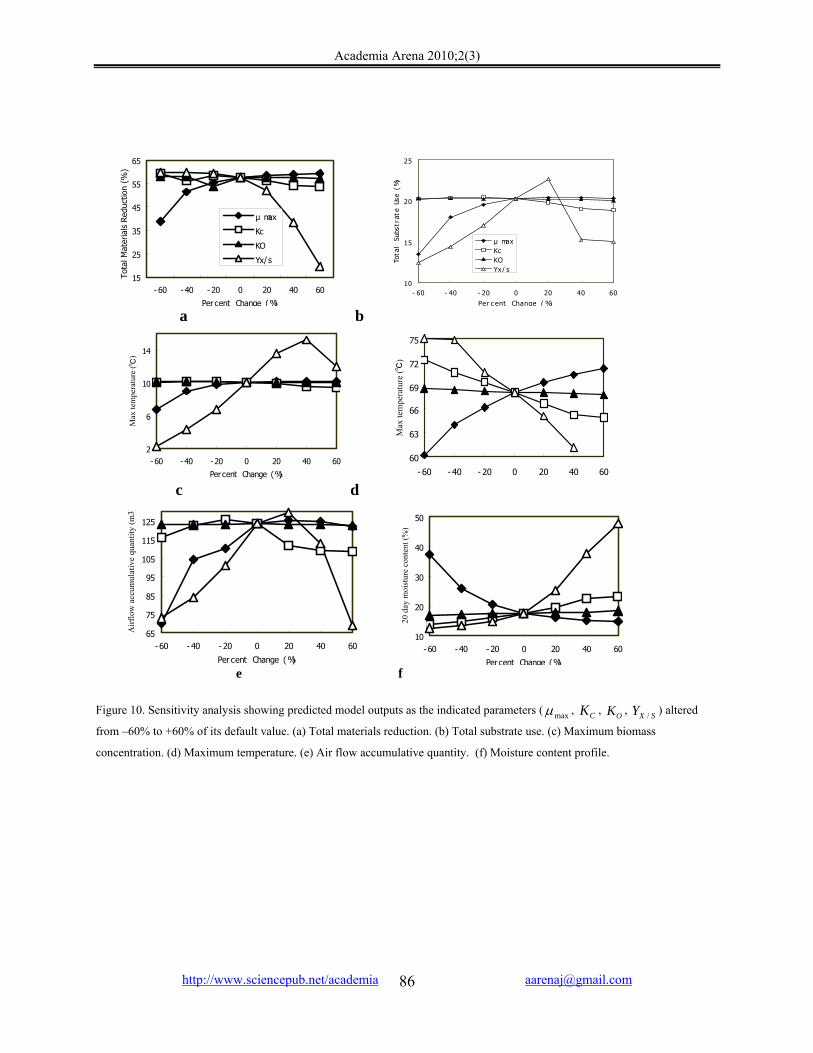
Academia Arena 2010;2(3)
http://www.sciencepub.net/academia [email protected]
86
15
25
35
45
55
65
-60 -40 -20 0 20 40 60
Per cent Change (%)
Tota
l Mat
eria
ls R
educ
tion
(%)
μ max
Kc
KO
Yx/s
10
15
20
25
- 60 - 40 - 20 0 20 40 60Per c ent Change ( %)
Tota
l Su
bstr
ate
Use
(%)
μ maxKcKOYx/ s
a b
2
6
10
14
-60 -40 -20 0 20 40 60
Per cent Change (%)
Max
tem
pera
ture
( ℃)
60
63
66
69
72
75
- 60 - 40 - 20 0 20 40 60
Max
tem
pera
ture
(℃)
c d
65
75
85
95
105
115
125
-60 - 40 - 20 0 20 40 60
Per cent Change (%)
Airf
low
acc
umul
ativ
e qu
antit
y (m
3)
10
20
30
40
50
-60 -40 -20 0 20 40 60
Per cent Change (%)
20 d
ay m
oist
ure
cont
ent (
%)
e f
Figure 10. Sensitivity analysis showing predicted model outputs as the indicated parameters ( maxμ , CK , OK , SXY / ) altered
from –60% to +60% of its default value. (a) Total materials reduction. (b) Total substrate use. (c) Maximum biomass
concentration. (d) Maximum temperature. (e) Air flow accumulative quantity. (f) Moisture content profile.

Academia Arena 2010;2(3)
http://www.sciencepub.net/academia [email protected]
87
15
25
35
45
55
65
-60 -40 -20 0 20 30 40Per cent Change (%)
Tota
l Mat
eria
ls R
educ
tion
(%)
W0Temp0X0
10
15
20
25
-60 -40 -20 0 20 30 40Per cent Change (%)
Tota
l Sub
stra
te U
se (
%)
a b
0
5
10
15
-60 -40 -20 0 20 30 40 60Per cent Change (%)
Max
Bio
mas
s (k
g/m
3)
65
66
67
68
69
70
-60 -40 -20 0 20 30 40Per cent Change (%)
Max
tem
pera
ture
()
℃
c d
90
100
110
120
130
140
- 60 - 40 - 20 0 20 40 60Per cent Change ( %)
Airf
low
acc
umul
ativ
equ
antit
y (m
3)
15
20
25
30
-60 -40 -20 0 20 40 60Per cent Change (%)
20 d
ay m
oist
ure
cont
ent
(%)
e f Figure 11. Sensitivity analysis showing predicted model outputs as the indicated parameters(W0, Temp0, X0) altered from –60% to +60% of its default value. (a) Total materials reduction. (b) Total substrate use. (c) Maximum biomass concentration. (d) Maximum temperature. (e) Air flow accumulative quantity. (f) Moisture content profile.

Academia Arena 2010;2(3)
88
4. Conclusions In this study, a dynamic model was developed
to simulate composting processes of solid waste based on the thermodynamics and kinetics of microbial growth. The model provided an excellent vehicle for explaining and demonstrating the complex interactions which occur in the composting processes. Variations of compost indexes, such as substrate degradation, temperature fluctuations, moisture exchanges, and oxygen concentration were simulated for a readily composted input mixture. The model could be used to optimize operational parameters. For example, it was used to develop different aeration regimes through controlling the oxygen concentration in exhaust air to optimize the composting processes and reduce the air flow. Another component should be controlled is the initial moisture content, the effect of initial moisture content on the composting processes was significant. If the initial moisture content was too high or too low, it would reduce the rate of substrate degradation. Particularly, when moisture content was more than 71.5% or lower than 33% the composting processes was impossible. The simulation result was consistent with results of pilot scale experiment. It was found that function of air supply in the later stage was mainly cooling compost bulk. Developed numerical model could be used to help identifying more cost-effective operation condition for composting processes. Adjusting operation conditions through changing key factors, optimal operation condition could be determined through comparing the results of numerical simulation. In this study, the optimal way of air supply was designed with the help of numerical model. Real experimental results showed that it could reduce 79.61% of oxygen supply with the same compost efficiency. Therefore, developed numerical model is of great significance to instruct the operation of real composting processes and reduce the operation cost.
Acknowledgement:
Foundation item: The National “973” of China (No.: 2002C410800-07) and The National “973” of China (No.: 2002CB412302).
Correspondence to: Beidou Xi, Zimin Wei Chinese Research Academy of Environmental Sciences Beijing 100012, China Telephone: 01186-10-8491-3946 Cellular phone: 01186-130-3103-8107;
01186-131-4100-9271 Emails: [email protected]; [email protected] References [1] Vallini G, Pera A, Valdrighi M, Cecchi F. Process
constraints in source-collected vegetable waste composting. Wat Sci Technol 1993;28(2):229-36.
[2] Huang JS, Wang CH, Jih CG. Empirical Model and Kinetic Behavior Thermophilic Composting of Vegetable Waste. Journal of Environmental Engineering 2000; 126(11):1019-25.
[3] Miller F. Composting of municipal solid waste and its components. Microbiology of Solid Waste. CRC Press: 1996:116-45.
[4] Hammelers H. A Theoretical Model of Composting Kinetics. Science and Engineering of Composting. The Ohio State University. 1993:37-58.
[5] Haug RT. Development of Simulation Models, In: The Practical Handbook of Compost Engineering, Lewis Publishers 1993:385-436.
[6] Hamoda MF, Abu HA, Newham J. Evaluation of municipal solid waste composting kinetics. Resources, Conservation and Recycling 1988; 23(1): 209-23.
[7] Mohee R, White RK. Simulation Model for Composting Cellulosic (Bagasse) Substrates. Compost Science & Utilization 1998; 6(2): 82-92.
[8] Agamuthu P. Kinetic Evaluation of Composting of Agricultural Wastes. Environmental Technology 2000; 21(1):185-92.
[9] Quazi H, Bari AK, Tao G. Kinetic analysis of forced aeration composting—Reaction rates and temperature. Waste manage Res 2000; 18:303-12.
[10] Stombaugh DP, Nokes SE. Development of a Biologically Based Aerobic Composting Simulation Model. Transactions of ASAE 1996; 39(1):239-50.
[11] Keener H, Marugg C, Hansen RC, Hotink H. Optimizing the Efficiency of the Composting

Academia Arena 2010;2(3)
89
processes. Science and Engineering of Composting 1993; The Ohio State University: 59-94.
[12] Wang HT, Li YS. Simulation model of dynamic aerobic compost and the application. China
Environmental Science 2001 (in Chinese);21(3): 240-4.
[13] 藤田賢二. コソポスト化技术. 技 堂出版报 , 1993:4.
11/5/2009

Acaedmia Arena; 2010;2(3) 孙纯武
http://www.sciencepub,net/academia [email protected] 90
创 立 统 一 场 论
孙纯武 江苏省扬州三力电器集团
中国江苏省扬州市西湖镇 59 号 电话: 0514 一 82822538 邮编 225008; 电子信箱: [email protected]; 博客: http://yzscw.blog.163.com
摘要: 自然科学里有许多难题困扰着科学家,爱因斯坦却把思维定制在寻找统一引力、电磁力、强作用力、弱
作用力的场, 所以他也无法先创立出统一场论。再来分析论叙是谁质量大,统一了这些力而进化出新物质。
因此,创立统一场论和图型及公式,得到正确认识自然界起因和运动后能量多少的能力, ,去造福人类。
[Academia Arena 2010;2(3):90-100]. (ISSN 1553-992X).
[关键词]: 统一场论,椭圆图图解及公式、统一场论的应用
Abstract: There are many problems disturbing the scientists in the field of natural science. But Einstein focused his thinking on searching for fields of unified gravity, electromagnetic force, strong force, and weak force, so he could not take the lead in creating the Unified Field Theory to analyze which one is of greater quality, and what has integrated all these forces to create new substances. As a result, creating the Unified Field Theory, its graphics and formulas to clearly get to know the causes of nature and the ability of energy-change after movement is of vital importance to the depiction and redesign of both evolution models of celestial bodies and all other things, so as to benefit the humankind. [Academia Arena 2010;2(3):90-100]. (ISSN 1553-992X).
Keywords: unified gravity; electromagnetic force; strong force; weak force
统一场论就是将事物形成和运动发展时的形态,浓缩到椭圆图形中去。并在图中各个位置设置各种数据,
加以理论说明. 教会您灵活运用它去设、解、论各种问题。首先让你理解什么是统一场,如像图中各种力面
场上的质量,在同一个场所上运动却复制出不同能量。 并发生了谁的活体质量大,谁就是统一的场。所以,
将质量交换出能量的场所,在设、解、论如星系、星球、原子、植物种子、动物细胞,一个国家及一个人等事
物时。 也可先把这个活体结构,定位看成是统一场的统一体。以后再来论叙一个质量是怎样在这个活体场
上运动,才产生出如引力、电磁力、强作用力、弱作用力等太极子物理来。 什么是统一的场功能。将占有和消耗能量多的中心物体, 如地球的自转极、原子的中心、一个国家的中
央政府或一个人等事物,看成是统一的场。这样,就能对周围各个位置上如星球质量大小、运动速度快慢、距
离星系中心远近等,做出准确的数学解释。 这个场是以向心运动形成,场的质量由周围场力面上向心力能量多少决定。它的功能用来把周围的物体,
定位和在运动极限中统一作用,并为周围物体提供或遗传智慧能量。
因此,时间和空间就从这时开始,如万有引力等,相继在一定自旋推挤摩擦中产生。也随着自旋的消失,
时间和空间就从这时结束。

Acaedmia Arena; 2010;2(3) 孙纯武
http://www.sciencepub,net/academia [email protected] 91
什么是统一场论?例如星球在星系中心一边运动快, 另一边却运动的慢等问题论证时,就取其是发生在
统一场上问题和论证过程所采用的方法叫统一场论。它是由统一场论、椭圆图及设题解题公式所组成,论述
万物运动发生在统一场上的难题。 椭圆图大圆圈的大小,是表示一个统一场物体的大小,。 图中小圆圈的空穴,在星系中心称黑洞空穴。似杠杆的力臂长短,或女性的子宫,或电脑复印机及工具、
武器等,经过系统加速运动, 通过它将质量复制出更多能量。如汽油经过转化质量就不存在。所以,将小圆
圈空穴及工具等,称质量再生场。是被用来复制出更多能量。 它有统一质量标准,场的质量越大。如离心力越大, 或空穴偏得越大,或人们手中使用大质量的工具、
兵器等,为它们复制出的能量就越多。 反之, 每当场或向重力面场向心力面场上运动时,越向上旋转运动就越慢,复制出的能量就越少等问题。
图中空穴中的物质等,也可认为做功物。它每被系统运动到某种场时,质量越大,复制出的能量就越多;
质量小或离心力小时,被复制出的能量就越少,或产生出合成进化就少。因此,它的运动, 既受周围环境、
工具、兵器等的影响,也受本身质量的制约。并且它不能独立对自己复制能量。
椭圆图那六种(相对数)不同质量力面场,它表示万物及一个人等运动规律的时间,是作一元复始有序
运动。而数字是表示它们在每一个发展过程中, 做出了多少能量的的空间是无序运动。并且这六种场同质
量再生场和统一的场中心一样,也有大中小三种质量。另一张图是表示它们在各种空间中,拥有的向心力和
离心力推挤摩擦,就是周易八卦的所渭阴爻和阳爻等技法。设解论事物时就要像周易预测或中医那样,将自
旋的各种数椐多少,结合起来用才能得到正确结果。
.图大圆圈最上部, 表示一个事物质量运动时间的开始,或是在这样条件下运动合成的物体, 它没有什么
能量变化,就统一用物理名词,称它为磁吸引力面场。它复制的能量 1,匀速运动。
图突出上部一面,表示从上向下运动,它复制做出的能量 2。称它为扩张力面场,
在它下部 ,加速惯性将质量复制出更多能量, 如使地球椭圆度大。称它为强作用力面场,或称再生力
面场,它复制出的能量 3。
总之,在这边都是加速运动,有一股惯性推力。
图最下部为磁排斥力面场,表示一个质量运动到这种场、或时间,它自旋最慢时向心力占上风,自旋
最快时离心力占上风,复制出能量已减少为 2。(在实际操作时应把它定位随着速度加快,它在 2 以上递增
能量,如有些质量大的苹果内就被复制出两个种子,妇女怀孕多胎),会发生意外事故。
图的另一面是从下向上运动,复制出的能量已减少到 1。在惯性中做降速运动,称它重力面场。
而在这种场上部,质量完全失去做功能力, 被摩擦力、引力等消耗能量,更使它作向心运动。因此,称
向心力面场,也可称弱作用力面场,复制做出的能量 0。 总之,在这边都是做降速运动,有一股向心拉力。就发生如收缩或退化等一元复始事出现。 当然,它们做出的能量已作连续向心加速运动,使这个合力组织结构空穴中心的物体质量,被自旋的离心
力抛出去复制出更多能量做功。如果进行第二次运动计算或论述,应将系统总质量来乘加速惯性抛出去做功
的质量大小、距离中心远近所得到的能量后,再按这个新数字去依次一一进行相乘惯性能,就可知这种各种
场上一次次进化的能量,便使转速逐步加快,如发生了膨胀、光电磁或元素质量,似在椭圆图所在各种场位
置上,被不断加速推挤摩擦发热的温度高低,也做出周期性的能量进化,或发生不匀速运动等问题。 因被复制出能量多的物体,不在沿消耗能量少的如椭圆运动,发展向消耗能量多的圆圈运动时,(实构成
了如多维空间圆球运动时)如夸克就复制不出更多能量,便又向椭圆运动,又在向心力作用下使它能量被加
速复制提升,当它进入中心时,立刻使空穴中气体或物质,被它质量大的高温度蓝光等,产生出新的如团体或
新的元素。或进入空穴中心,失去了被系统加速复制出更多自旋能量位置。就被质量大的摩擦力、引力等,
统一了由自旋强度发散出的如电磁力、强作用力、弱作用力、引力。或事物进化的周期结束。

Acaedmia Arena; 2010;2(3) 孙纯武
http://www.sciencepub,net/academia [email protected] 92
以上图是揭开了事物微观世界作椭圆运动,称向心运动而得到了向心力,使进入中心物质得到了系统
自旋的离心力被抛出去做功,自然界万物就是以这两种简单不同推挤摩擦力表叙,才使统一场上各种场力面
上的物体,无论在时间,还是在空间就有进化发展的自旋能量了,进而才逐步产生出如引力,电磁力、强作
用力、弱作用力等问题。这样再来结合利用如太极子物理学等对它们的各种表叙,及结合以上各种数据灵活
运用它, 就能去设、解、论万物或发生的不同随机问题和自圆其说了。
统一场论除了用椭圆图来解开万物它们的过去,还是现在, 及将来,都是在运动中被复制出的能量多少,
产生出统一椭圆球结构模型下,才进行了一元复始的进化运动外,去设题解题规律。还设立
max
Kg≠m·a2·t
Min
定见式公式启发您运用它去配合设题解题。公式从直观上杠杆形,还让您联想万物的质量,运动后不代表就
做出是多少的能量。
“≠”告知设题解题人,质量在系统内运动速度中,复制能量的极限问题。有了这个极限,就可以知道事
物生老病死和不匀速周期快慢的时间,并设计出了三种约定:①“m”表示合成初(期)的质量,或指历史
的过去,“t”表示合成后所做出的能量的多少,或指现在的质量。 “kg”表示不同场合、不同条件,不同
结果,或指它将来的质量。②无论过去、现在及将来,无论是星系还是原子, 是动物还是植物,是宏观还是
微观。“≠”给出了它们都存有两种如快和慢的不同矛盾,构成矛盾进化发展的是速度的快慢,调和矛盾的
是时间。
因此, 在一个结构中,它们都共同遵守如质量、加速度和时间以及在什么样环境等几个要素去设题解题;
③“≠”也表示出在自转极两边运动有快慢的存在,及运动复制后发散出如光子、电子等不同问题,因此,
就要用不同的形式去论叙, 或用不同的公式去计算。t(时间)表示因为质量再生场的存在,才使事物运动
后复制做出能量的多少。和自转极、再生场及各种力面场,各自以什么样的质量大小进行合成去复制能量。
有了这些条件的存在,就让你联想到它们运动起来后的质量,所被复制做出的能量有三种情况岀现最多
或最少:一是自转加速的快慢,复制出能量有最多或最少的变化;二是在自转极两边不同环境运动的快慢,
会导致复制做出的能量有最多或最少的变化;三是质量在速度极限时被统一前后的快慢,复制发出的能量也
有最多或最少的变化等。并且,它们之间关系是互动随机中形成统一。其中如果有一个场力面运动的质量,
合成进化复制出不同能量,都会带动其它各种场上千变万化的无统一定局走势,就使自然界新物种、新事物
不断出现一样。就要一一去重新论叙,或用不同的公式去计算。或各事各论叙。或同样事采取不同设解论。
因此,公式就像中国象形文字那样,既包含哲理,又包含用公式来启示引导读者发出各联想,准确无误
地去跟踪测量计算它们,一个个在不同场力面环境结构中,如是谁做出的功多少,超出系统质量承受力,发
生了如“电磁力”、核子(质子、中子)之间的“强作用力”和原子衰变时的“弱作用力”等的统一原因。
或根据定见式精神,去设这个事物理的数学方程去一一计算各种力的大小、强度等物理量来解开难题。
所以说,有了统一场论和椭圆图中那么多克星数据,教您设题解题,研究者心境自明,就可将各种难题
模仿设计出自己的图形数据,或将难题填入图内相应位置,再来理清它们属什么性质,或存在于什么样运动
结构中发生的问题。如是直线运动,还是在斜面上作椭圆运动;这样就能对它们运动,作全面、系统、有联
系、有发展的眼光,来论证如星球在星系这个统一场上运动,所发散出的各种不同随机问题。也能简单快捷
地方法去论快或慢的问题。同时,对牛顿、爱因斯坦质量转换能量观及量子论,超弦论等各种理论,也作了
归纳和科学按排灵活运用。明确了谁的质量大或是方法得当,谁就是在这个自旋的统一场上是统一的场。

Acaedmia Arena; 2010;2(3) 孙纯武
http://www.sciencepub,net/academia [email protected] 93
今后,统一场论这个万能理论和椭圆图,一旦得到人们的认同,将会去建立起更雄伟的,如钢筋混凝
土的框架结构新的哲学和物理学等科学大厦,去设题解题。并会引领人们将质量存放进一个系统内去复制出
更多再生能量,一个科学大发展的道德化新时代,去造福人类。
统一场论的应用
下面来看统一场论是怎样去设题解题的,在此仅作简单表述,举一反三,具体请看统一场论 45 篇系列
中的文章,如《伟大宇宙母亲大分娩》,及利用这个理论配合王锡玉解 162 道难题等自圆其说。来帮助您进
一步理解统一场论的科学价值。
掌握要领例题一:在统一场论的物理公式中,设出质量在速度中复制能量的极限,并在 t 时间时各自存
在最大或是最小的那一种质量进行合成。统一的场就用中央政府,质量再生场就用经济政策,各个场力面就用
各种质量思想人群。在同一时间开始运动时, 它们是以什么样质量出现合成和运动呢? 是一、二、三种质量
中的哪一种?如果每一种场它们都以最大质量三出现,设原始类复制出能量为一、进步类为二、先进类为三,
摇摆不定投机类为二、落后类为一、困难类为零来构成了一个椭圆运动体系。当先进有经营管理能力有资金
的人场办工厂、办公司,好比是在质量再生扩张力面场、再生力面场上, 经过加速和一段时间的运动,如用数
字表示三乘三乘二、三乘三乘三, 他们分别做出能量是十八和二十七;而经济政策再生能量三和没有经营管
理能力、缺少资金的人场靠打工去挣钱,这时就好比是在重力面场、向心力面场上运动,他们没有暗能量、
暗物质的帮助,经过一年时间的运动后,如用数字表示,他们经济上的积累是三乘三乘一、三乘三乘零, 他们
分别得到的能量是九和零。从统一场论中知道,这些人群各经一年年的能量积累,它的质量已被这个运动的
合力组织结构,在惯性中进化不守恒加大了。
因此,今后各自将能量钱去发散出感兴趣的事。假定原始类去搞土地出售、出租,进步类将钱投房地
产开发,先进类将更多钱除了作房地产开发,还发展其它项目,摇摆不定投机类市场什么赚钱就做什么生意。
如收、卖房地产赚钱,落后类和困难类将积累钱去购房屋自己居住,一个循环发展的消费链。
由于市场运动发展和各种人群发展速度不同,原始类、落后类和困难类将积累钱去购房屋,是跟不上物
价的上涨,就出现供大于求或对社会的不满情绪。因此,质量大的中央政府,首先要根据事件是在计划经济还
是在市场经济结构中运行,它们发展时的运动速度和组织结构,及政策或策略是否损害共同利益,超出自身一
定承受能力的比例关系,也就是超出最大或最小极限时,才要随机地利用不同智慧,如政策、法令,或在自身
运动能量结构中调整,去统一它的不合理的力。如在市场经济结构中运动,比较复杂,就要综合治理,因为它
的危害性同高额运行的股票是双胞胎。一个掏空企业利润空间,一个是掏空社会各空间。所以要将违法出租
和出售土地、违法搞房地产的单位或个人、用余利买卖房地产、银行内不负责任贷款、调高低收入人群工资、
对困难户购房补贴、及对潜在如低价拍卖公有制房产,支付高价拆迁费等等问题进行综合治理。让事物内部各
组织结构,在强大的运动或精神运动造势中及法治制度化中,产生凝聚力的统一。这样就能像椭圆图六种力
面场那样有一定规律,既相适应、又相矛盾的相对有序,和谐不规则合力运动速度中搞房地产。但绝不是将事
物或事件在运动发展中,被视作和圈定或调节为没有一定比例、没有一定矛盾、没有一定差别的同一和单调
运动或无政府政策管理发展形态中搞房地产。
如果中央政府不能及时制定出什么新的政策,或强制统一不了那些质量小而方法得当的人和事,就缺
少了民心的向心力,社会将向不安定发展。
掌握要领例题二:为什么星系两边出现不同一运动速度的旋臂?这要将研究的难题即实证,快和慢放在椭
圆图结构快和慢的位置上,首先从直觉、顿悟出发就能找到你所需要解决快慢问题的原因来。一颗颗星球质
量大小已造成星系倾斜度大小不同,它改变了一颗颗星球在围绕星系中心周围运动时所作出的能量多少的常
态。如一些质量小的星球,或己从扩张力面场、再生力面场运动到重力面场、向心力面场上的一些质量大的
星球,它们是从星系斜面下作向上运动。由于这两种场内均有一股向心拉力,这时星球内星核被复制做出的
自转能量就减少。因此,星系中心这边向上运动的一颗颗星球,自转被重力、摩擦力引力等统一,使它在惯
性中降速逐步向星系中心质量大收缩弯曲形成了密度波,来获得向心力和相互利用斥力推拉前进。而另一边
Acaedmia Arena; 2010;2(3) 孙纯武
http://www.sciencepub,net/academia [email protected] 94
星球是在星系斜面上作向下运动,有一股加速惯性推力帮助, 使星球内做功的星核,如地球的地核在系统中运
动,每被离心力发生膨胀向外位移运动一步自旋, 就可通过空穴一边似杠杆力臂,在加速惯性中复制出更多
能量。就对地幔再生力面场内壁岩石施力越多,也就加大了球体域面上地壳小活动板块活动和运动的能量。
同时地核里面有些小颗粒物质,就像被滚雪球似地,被旋转复制成大大小小的火山蛋球体,它们铁的质量被
离心力和向心力推挤摩擦不断加工,使它们同地核一样也产生了磁性铁球。不断受离心力推动,随着地核运
动发生漂升不在沿椭圆图上消耗能量少的椭圆运动,发展向消耗能量多的圆圈运动。
因此,这时自旋就被统一的场中心质量大的摩擦力、引力、重力等统一了强度,使它发生了收缩向上中心
球形加速运动,呈空 8 字形向南北极作螺旋式上下旋转循环运动。并同地幔一块块的板块, 被地壳运动的向心
力,以及地核的离心力推挤摩擦发热不断加工,一些地幔板块也产生了磁体。由于它们是连续运动,使南北
极球体上下处,不断受到磁体的光临积累,就产生了南北极的磁场;也就是由如太极子电子等速度快慢和分布
的数量多少,铺设了一条所谓磁场高速公路通道,产生出质量大小的电流等。地幔那白天一块块板块结合处
突出下垂时空出的空间,却造成了天空磁层多个大空洞(可参观永动机内部结构);而地壳周围一块块活动
板块一端,朝太阳一面白天也在向外突出下垂加速运动时产生出光子,夜间在向内收缩弯曲做降速运动时产
生出电子,这种球体两边一块块小活动板块,有规律地左右依次运动于南北极磁场上,就拉断了由地核旋转
运动和地幔板块所作椭圆运动的磁感应线。因此,就能从机械能转换成电流加大加快自转能力了。当然,原
子内电子是作向心力, 光子质子作离心力,使两个物体互相摩擦时,那个物体的原子核束缚电子本领弱,它的
一些电子就会转移到另一个物体上,失去电子的物体因缺少电子而带正电, 得到了电子的物体因为有了多余
电子而带等量的负电。所以,当发生电子自转加速和复制出能量多少不同时,就出现星系两边有一边运动快
和一边运动慢的不匀速现象。
就是说,星系两边不同一的运动速度的旋臂, 一方面因星系一边有拉力,另一边有推力, 复制出的能
量就不同。其次一方面星系两边星球质量不同造成的,如一边是暗星,它们处于质量进化的早期,自转速度
较慢。另一边白矮星是质量进化的后期, 它们合成进化复制,和再合成进化复制出的能量就多,自转速度必
然要快;另一方面是由于星系中心周围各种场力面质量不同,迫使各种星球在各自环境中运动,被复制出不
同能量,就发生运动速度的快慢。另外,星球倾斜极的度数大小,也决定星球质量在速度中复制能量极限的
多少,同时还会出现星系中心两边有不同的不匀速周期的快和慢现象,以及做出的椭圆运动轨道,和倾斜极
的度数大小不同等问题。而这种系统中的难题,如果用现有物理理论和定律,就不能解释清楚了。
古人认为宇宙只呈现出一团混沌而为一的元气状态,即太极起源。1932 年勒梅特提出了现代宇宙大爆炸
理论,但他们都看到真理的曙光,可就是不能说清问题。因此用统一场论来创立新的宇宙模型 。
今天宇宙已有大分娩、大进化、大爆炸、大塌缩(或是大蒸发)的四种质量起源, 在此只讨论宇宙最
初一种大分娩起源。宇宙混浊时期弥漫气体在空中扩散时,或是宇宙气体虽是随机地,但总体上发生了湍流
如椭圆图所示,磁吸引力面场上气体,从上向下向扩张力面场、再生力面场上运动。由于这两种场上有一股
加速惯性推力, 使它们不断地在加速惯性中将质量复制出了更多再生能量或是势能,气体便越过了磁排斥力
面场,向重力面场、向心力面场上向上冲击运动, 反而受到这两种场上相反拉力,使气体逐步加大收缩弯曲
作椭圆运动。(因这股湍流两边也有质量大小如像人两条腿有长短一样。)这种椭圆运动在物理上称向心运
动, 因此得到了向心力向中心加速自旋。它好比乒乓球从一米的高度往下落,每次反弹损失三十厘米后,但
这个高度还是超过了一米高的圆心半径五十厘米。所以,气流每次以不断缩小的环流越过中心高度,作连续
螺旋式向中心加速旋转, 进入中心气体在加速惯性中划出了小圆圈空穴,(也就是科学家所说如星系中心的
黑洞空穴那样,它由太极子聚合成)。在这个空穴中,实际又产生了两种场,一个是在椭圆壳体中心形成,
它的能量是以向心力为中心的统一的场。一个在不对称的椭圆内壁空穴运动场所中心形成质量再生场, 它的
能量是以离心力为中心。
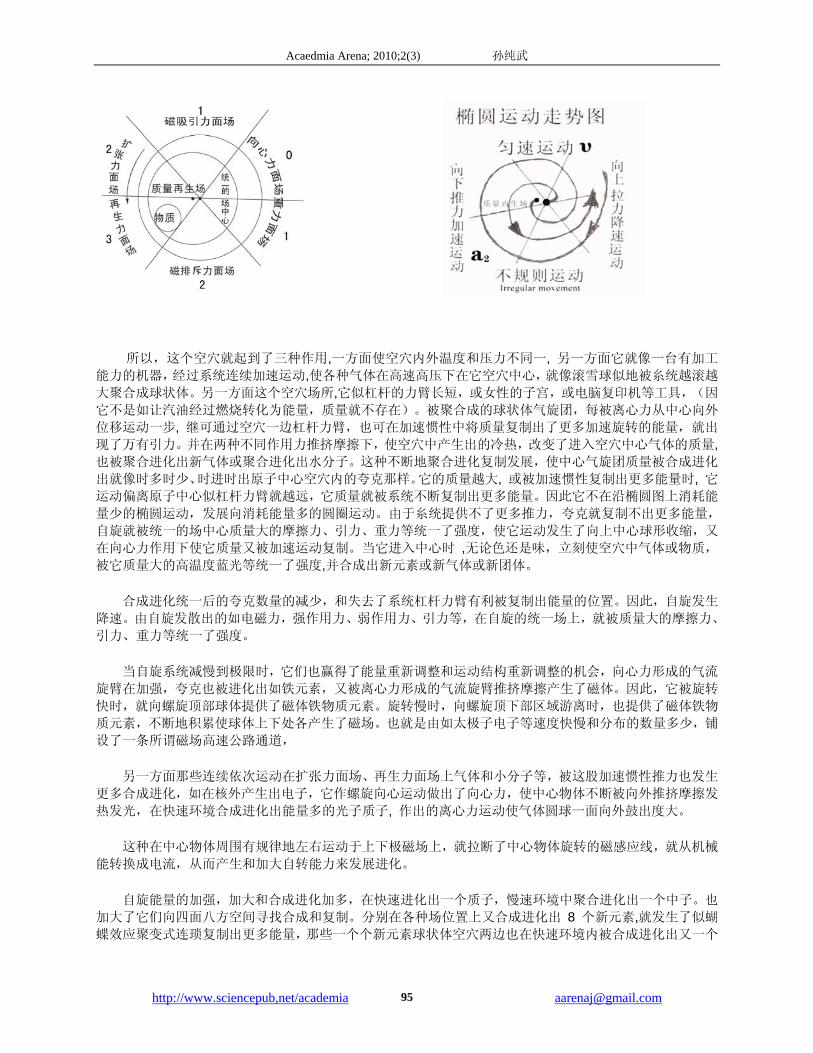
Acaedmia Arena; 2010;2(3) 孙纯武
http://www.sciencepub,net/academia [email protected] 95
所以,这个空穴就起到了三种作用,一方面使空穴内外温度和压力不同一, 另一方面它就像一台有加工
能力的机器,经过系统连续加速运动,使各种气体在高速高压下在它空穴中心,就像滚雪球似地被糸统越滚越
大聚合成球状体。另一方面这个空穴场所,它似杠杆的力臂长短,或女性的子宫,或电脑复印机等工具,(因
它不是如让汽油经过燃烧转化为能量,质量就不存在)。被聚合成的球状体气旋团,每被离心力从中心向外
位移运动一步, 继可通过空穴一边杠杆力臂,也可在加速惯性中将质量复制出了更多加速旋转的能量,就出
现了万有引力。并在两种不同作用力推挤摩擦下,使空穴中产生出的冷热,改变了进入空穴中心气体的质量, 也被聚合进化出新气体或聚合进化出水分子。这种不断地聚合进化复制发展,使中心气旋团质量被合成进化
出就像时多时少、时进时出原子中心空穴内的夸克那样。它的质量越大, 或被加速惯性复制出更多能量时, 它运动偏离原子中心似杠杆力臂就越远,它质量就被系统不断复制出更多能量。因此它不在沿椭圆图上消耗能
量少的椭圆运动,发展向消耗能量多的圆圈运动。由于糸统提供不了更多推力,夸克就复制不出更多能量,
自旋就被统一的场中心质量大的摩擦力、引力、重力等统一了强度,使它运动发生了向上中心球形收缩,又
在向心力作用下使它质量又被加速运动复制。当它进入中心时 ,无论色还是味,立刻使空穴中气体或物质,
被它质量大的高温度蓝光等统一了强度,并合成出新元素或新气体或新团体。
合成进化统一后的夸克数量的减少,和失去了系统杠杆力臂有利被复制出能量的位置。因此,自旋发生
降速。由自旋发散出的如电磁力,强作用力、弱作用力、引力等,在自旋的统一场上,就被质量大的摩擦力、
引力、重力等统一了强度。
当自旋系统减慢到极限时,它们也赢得了能量重新调整和运动结构重新调整的机会,向心力形成的气流
旋臂在加强,夸克也被进化出如铁元素,又被离心力形成的气流旋臂推挤摩擦产生了磁体。因此,它被旋转
快时,就向螺旋顶部球体提供了磁体铁物质元素。旋转慢时,向螺旋顶下部区域游离时,也提供了磁体铁物
质元素,不断地积累使球体上下处各产生了磁场。也就是由如太极子电子等速度快慢和分布的数量多少,铺
设了一条所谓磁场高速公路通道,
另一方面那些连续依次运动在扩张力面场、再生力面场上气体和小分子等,被这股加速惯性推力也发生
更多合成进化,如在核外产生出电子,它作螺旋向心运动做出了向心力,使中心物体不断被向外推挤摩擦发
热发光,在快速环境合成进化出能量多的光子质子, 作出的离心力运动使气体圆球一面向外鼓出度大。
这种在中心物体周围有规律地左右运动于上下极磁场上,就拉断了中心物体旋转的磁感应线,就从机械
能转换成电流,从而产生和加大自转能力来发展进化。
自旋能量的加强,加大和合成进化加多,在快速进化出一个质子,慢速环境中聚合进化出一个中子。也
加大了它们向四面八方空间寻找合成和复制。分别在各种场位置上又合成进化出 8 个新元素,就发生了似蝴
蝶效应聚变式连琐复制出更多能量,那些一个个新元素球状体空穴两边也在快速环境内被合成进化出又一个

Acaedmia Arena; 2010;2(3) 孙纯武
http://www.sciencepub,net/academia [email protected] 96
新元素,慢速环境内运动也被合成进化出一个新元素, 成 16、32、64 等等成倍发展进化。物体就更加膨胀,
各种合成进化就增多。
夸克这样无休止复制出更多的能量促使它们合成进化, 使内部矛盾加剧, 强作用力越强,弱作用力越弱。
阻挡了周围向心力能量气流输入, 使快速环境元素发展越来越快、慢速环境内元素越来越慢,两极分化互相
争夺气源。同时空穴中心物体在加速运动中大量流失了能量, 因此就失去合力做功作用,最终被质量大的摩擦
力引力分裂死亡,使宇宙最初起源过程结束。
虽然原始宇宙在笫一过程中,仅以一边向心运动得到向心力, 使系统中物体得到离心力抛出去,自然界
万物就是以这两种简单不同推挤摩擦表叙发展了自己, 虽只合成进化出一些小分子物质等,但它改变了宇宙
中仅有气体运动的旧面貌, 也为创造各种新事物提供或遗传了模范作用。如那些聚合出的暗物质等,置又在
所仅有的一些原始条件下,也是先做向心运动中,进入中心就像滚雪球似地,在涡旋中心空穴或称黑洞空穴
中,越聚合越大旋转复制成为球状体,称暗星球。由于自然界没有任何一种物质聚合后, 能使交界处没有空
穴和内部没有空穴。有了空穴和内部空穴, 就有内外温差和气压的不统一, 外部就会源源不断将气流和小分
子物质向暗星球空穴内扩散输送。进入空穴中的一些小分子物质, 也发生了湍流向中心加速,就能在加速惯
性中复制出更多摩擦发热的热能,产生出原子连琐核聚变反应,立即使星体中心质量引力加大,温度暴升,使
原有物质包括存在星体周围一簇簇、一块块物体都被它气化,发生塌缩和收缩,进化成红巨星椭圆体液态球。
有了这个红巨星液态球,就有了这个球体内相对层次和不同的功能分工, 就在这些相对层次中复制出不
同能量,
红巨星壳体上部是色球层,它是被如黑子从日核旁,被离心力推挤摩擦加速运动到色球层时,已使色球
层聚变出 1500 万度高温。这样就来专门采集宇宙和光球中氢物质,加工聚合成氦不断往中心加速输送;在
它下面是光球层,是被气化的一些原来易燃物质和氦颗粒物体,它被复制出的温度只有 6000 度,这个层次
就像组成流水线生产的输送带,储存和输送着供色球在扩张力面场再生力面场聚合的物资,还负责提供对流
层降温降压的通道。它喷出的气流穿透活动缝口,会使色球层的边界不光滑,呈锯齿状。
在光球的下层是对流层,专门负责将日核的高温和核幅射物质进行调节降温、降压,也就是当日核偶然
内部复制能量到极限时,发生的核聚变大爆发所释放的能量,立即向光球外排泄,以便保持对流层的温、压
相对平衡,同时对流层还起上传下达作用。既要接收从色球聚合后的重物质,如氦或米粒状等坠落光球后,又
从光球直接输送到对流层,也要接受从子午线中间往两端位移运动,合久必分、分久必合的黑子等物质回归
到球体内各自位置工作。并将有些物质通过向心力输送给中介层加工使用的椭圆壳体运动环境。(见下图)
对流层下面是中介层,向心来的物体到了这里运动更加快,而中心物体被离心力向外运动是从初加速。
它主要功能负责,将那些米粒状和一颗颗氦之类物质,在中介层或进日核内部空穴后,就象滚雪球,将不同
时期、不同能量产生的物质进行合成或组合。使组合的球体周围一层层和一处处有不同质量的外壳了。正如

Acaedmia Arena; 2010;2(3) 孙纯武
http://www.sciencepub,net/academia [email protected] 97
人们所说:外面一层包裹着,内部得到降温,有一个稍黑的心,称黑子。日核的功能负责统一和复制出新能
量,去解决自转能量的多少和统一各作用力问题,如碳、氦等物质,被它质量大推挤摩擦发出的高温,进行
了高级聚合加工出新物体。其次,被聚合出的氦颗粒物质等物体,它们也是根据各自质量被运动在球体各层
次、各种力面场位置来协助日核做功自转。
以上是太阳的各个结构的功能作用,当太阳进化到红巨星时,复制出的能量已每约 27 天有一个自转一
圈,平均约 11 年半使太阳黑子出现不准确合久必分,分久必合周期变化。(最少 7 点 5 年, 最多 17 年的位
移运动周期。 同时,太阳还围绕自己倾斜极和银河系作不匀速运动,使宇宙发生了不断膨胀。
因此,下面先谈红巨星时期,一、太阳表面氢是如何聚变,二、太阳黑子三种运动形式,三、光球是如
何运动,四、日核的功能和作用。在这里首先要说清自转的能量来源与太阳燃烧所需要的能量来源是两个范
畴。如科学家认为是收缩或核反应是太阳的能源,但它不能说明了就是自转能源,包括牛顿企图用上帝给它
第一次推动力等假说,仍无法自圆其说解释清楚自转不匀速现象。因此,这些假说就是不合理的。
从统一场论我们知道太阳进化和自转的快慢,是由周围向心力能量多少所决定。就首先谈色球这个采集
加工场的工作,你看《宇宙新概念》,赵江南编著是 4 个氢核合成 1 个氦核的聚变反应,这种反应称为质子-质子循环,又称为氢燃烧。这过程在太阳中进行的是如下的质子-质子循环的
1H+1H→2H+e++中微子 2H+1H→3He+光子 3He+3He→4He+1H+1H
式中左上角的数值表示原子核的质量。1H 是质子,因为氢核是由一个质子组成的,所以 1H 就是氢核,2H是氢同位素氘的核,3He 是氦同位素的核,4He 是氦核。在 4 个氢核变成一个氦核的过程中,损失了 0.7%的
质量,这个质量转变成光子和中微子的能量和热能。 做个简单的计算,一克氢变成氦损失 0.007 克质量,由质能公式知相应的能量为: E=mc2=0.007×10-3×(3×108)2=6.3×10¹¹(焦) 所以太阳每秒钟消耗的氢质量为: 3.6x10,26 M ---- ≈ 6.0×10¹⁴ (gram) =6×10⁸ (ton)
6.3x10,11
即 6 亿吨。若太阳最初全部由氢组成,那么太阳全部氢变为氦时所放出的能量为: E=0.7%M⊙c2=0.007×1.99×1030×(3×108)2=1.25×1044 焦 可见太阳维持目前这种辐射的时间为:
10,,44
T --- ≈ 10×1018 (秒) ≈ 1,011 (年)
10,,26
当然这种计算结果是极其粗糙的。但我们只要在深层次中计算时考虑到椭圆图各个面运动变化及同周边
环境影响的数据结合,就知太阳每秒钟只能将 420 万吨氢聚合成氦,一天在扩张力面场,再生力面场上产生
1373696800 吨作螺旋椭圆式往中心加速坠落。由于太阳直径 140 万千米, 半径 70 万 千米,偏心约 2000千米,太阳内物质密度约每立方厘 6 克左右, 就可算出太阳除去自身能量消耗外,每次多余自我复制出加
速运动约 300 万吨做功能量,存放在日核质量再生场这个杠杆力臂上,当经过扩张力面场、再生产力面场时,
就被加速惯性推力复制出再生能量就多,便使太阳这面也就是朝地球一面,被两种不同作用力推挤摩擦发热
的光和热就多。当这些物体从下向上运动到如椭圆图所指,重力面场、向心力面场上冲击运动时,反而受向
心拉力,物体运动不得不逐步向心收缩弯曲,以达到加速旋转运动。因此,太阳另一面温度就低甚至也有黑
夜。
当那些物质被加速运动到日核处时,,也被复制出 1500 万度高温。将日核周围物质进行了转化或被复制
出新物体。

Acaedmia Arena; 2010;2(3) 孙纯武
http://www.sciencepub,net/academia [email protected] 98
那些小分子物质或新物体在光球内被旋转被聚合复制时,就像胎儿一天天长大一样,不断地同光球内一
些原有物质,如氮颗粒物体进行合成,先结合成小结合体或条状体后,又进化成米粒状(当然被气化的原始物
质也会形成条状块块),一些被聚合成米粒状氦,必将其它物质包在空穴中心,周围包裹既使外壳有所降温,
也使它中心得到了降温。这个结构的形成,意味着一个小生命的诞生,它们在光球层内,会向那些质量大的
黑子群靠拢游离运动。因那些经日核聚合复制加工成质量大的黑子,最大的黑子群有地球直径的十多倍,最
小的黑子直径也有 2500 多千米,由于它中心在被聚合复制时也包裹着多种高级物质,而且壳体也形成了像
地球运动的层次的球体组织结构,已在不停地作涡流式旋转,当它们从日核旁加速运动到光球层,也在加速
惯性中进行质量再生,当这些小米粒状物质或低质量黑子进入高质量群中,会随着黑子群运动加快,引力加
强,一些低级米粒状物质或小黑子,就会被黑子在质量大时发出的核聚变能量气化了,直接加速穿透坠入对
流层,中介层时能量也得到了提升,直至有些被日核的能量转化或复制,使日核温度大大提高,或壮大了日
核质量为结束。
另一种高质量的黑子,由于复制能量极限所致,在惯性中也向太阳两端极处似 8 字形位移退缩,向对流
层、中介层还原加速进日核旁。日核周围不但有原始的大量各种物质,如氦、碳、镁、铁之类坠落存留在日
核旁,而且还有不断产生合成进化出的新物质,甚至有组合成复合型物质元素,由于太阳进化的质量还处于
低级阶段,因此,这些黑子球核内也有空穴,在这个空穴中,实际也产生了两种场,也就像地球那两个极一
样,
就像美国科学家发现夸克那样,夸克之间越接近统一场中心,强作用力越弱,当夸克之间非常接近时,
强作用力就会非常之弱,以至于它们完全可以作为自由粒子活动,这种现象叫作“渐近自由”,即渐过不缚性。
与此相反,当夸克运动的距离离统一的场中心越远,强作用力就越强,使黑子在自组织结构中, 不断复制出
了自转运动、位移运动,以及在太阳球体内时隐时现的作合久必分、分久必合的周期运动的能量。因黑子外
壳一边是加速,另一边是慢速,所以运动起来后在太阳内就做合久必分、分久必合椭圆运动了
如在这个自转位移运动过程中,黑子出现了两种现象,一是由于逐步离开中介层,温度的不断减低,使
黑子内空穴在不断地增大。空穴增大,使夹在自转极一边的碳原子球体之类物质, 就像以上宇宙起源那样过
程, 被离心力不断向外推挤, 使周围如电子向原子核靠近一样, 向心力就大,复制能量就多,产生出电流就大,
自转就加快,离心力也随之加大,使太阳内环流也在扩大,强作用力与弱作用力就不协调,因而导致自转极和
倾斜极在改变。随着倾斜极角度的改变大,迫使太阳自转加快和椭圆体更加扩大。椭圆度的扩大,又必然使
球体内部空间增大,使米粒状和黑子球壳体内受压力更加减少,也就形成了它们内部空穴扩大。二是当碳的
质量除了原子聚变反应外,也通过空穴这个似杠杆力臂复制出更多再生能量,也随着速度和时间及空穴不断变
化,被不匀速摩擦发热的多少,就产生出各种不同元素和周期。因此,那些被聚合出的物质极限如铝、铜、
铁,它们熔化的临界与色球约 1500 万度高温的距离就不同,这种自然递增能量又使自转也在逐步加快,当
到达光球层后,它们质量大已发展向消耗能量多的圆周运动。由于它被复制不出更多能量。或质量大时将光
球层内物质进行聚变,聚变后使黑子内部空穴大大缩小,因而失去做功能量。当然,绝大多数高质量黑子,
位移运动到光球扩张力面场再生力面场时,它们的自转速度最快速,它们的引力会把一些低质量的特别是米
粒状物体,就像卫星似地,吸引混合在它们周围,往往引力或辐射等作用力,使它们质量得到新的捕获提升。
那为什么太阳黑子会出现时多时少现象呢?前面讲到黑子在娘胎中已组合成自我复制能量的组织结构
体系,通常黑子在光球层最快每秒钟位移运动约 2000 米,而在中介层位移运动十分慢,平均值每秒钟约 130米。这些黑子在太阳上部,是从自转极下部向对流层、光球层处位移运动,而在太阳下部,那些黑子也是从
自转极下部出发向对流层、光球层表面如像地球的赤道方向位移运动,由于太阳直径约 140 万千米,而且它
们两者都以螺旋椭圆从自转极旁从慢逐步向快往光球层加速位移运动,以后在能量极限时被合成后降速,又从
光球层从慢向快往日核自转极处,作空 8 字型一元复始位移运动(由于不会制图,图示红箭头)。这两股黑
子出发地不同,位移运动中速度或路线也略有差异,同时也受到色球氢聚合的速度大气候等影响,使这些黑
子不能形成同一时间,同一地点,同一自然现象,它们之间各种反应配合协调得好,它们自转不匀速的周期
最快 7 点 5 年就形成黑子多且大和一些自然现象多的环境。而当黑子不能同一时间到达目的地时,就使两者
力量在球内做功不能成合力,输出的功能大大减低,它们约需 17 年加速时间,黑子方呈现在太阳表面最多。

Acaedmia Arena; 2010;2(3) 孙纯武
http://www.sciencepub,net/academia [email protected] 99
除了以上因素造成黑子时多时少现象,其次还有黑子自身质量决定它的不匀速周期长短,也是一个重要
方面。例如当大量的黑子进入低温的光球层,由于自转加快,离心力不断增大,使氦颗粒组合成的黑子壳体
抗拒不了离心力作用,外壳的一边也就是椭圆重力面场、向心力面场处,那些氦颗粒物质受离心力控制不依次
下落,就收缩不到原来椭圆位置作消耗能量多的圆周运动,就失去偏心的空穴了,及电子也降低向心力,作
出磁性也降低。尽管运动速度还在惯性中加快,但在空穴中做功的碳之类物质,失去了周围小分子物质的反
作用力推挤摩擦合成;二是向斜面上运动, 有反作用拉力, 使空穴中碳之类物质聚合成的球状体,不断在惯性
运动中向统一场中心位移靠近,产生出电流就减弱。并且, 不规则合力环境也遭到了破坏,如一些气体和高
温,不但被高速离心力拥挤到黑子外壳两边,而且气体和高温在运动中大量流失,一些也逃散到黑子壳外。
必然被质量大的摩擦力、引力、重力等统一,,使黑子内引力、电磁力、强作用力、弱作用力和各个场的功能
也减弱。
自转的降速,却使黑子在无功能补充和无法降低能量消耗的相对惯性运动静置环境中,逐步降慢到极限
时,也赢得了能量重新调整和运动结构重新调整的机会,这时黑子外壳一边重力面场、向心力面场上运动的
小分子物质、气体等随着离心力降低, 它们又在被向心拉力作向内收缩弯曲运动。恰到好处对向上运动,降
低了能量消耗,相互利用斥力推拉前进,反阻推空穴中碳之类球体物质向再生力面场一边偏斜。从而能够形
成新的加速运动做功,产生出新的各种自然现象了。
下面再谈光球这个活动外壳和日核,也同黑子一样的运动表叙。如日核铁的质量经离心力、向心力摩擦
不断加工,使它在太阳中介层内壁空穴底层被作螺旋式运动,另一方面太阳周围斜面上一个个小分子物质和
黑子等,运动在扩张力面场,质量再生力面场被加速惯性推力,便圆球鼓出度高大;另一面在斜面上重力面
场、向心力面场上的一个个活动板块和小分子物质等等,又逐步随着向上运动受向心拉力影响,又在惯性运
动中依次向内收缩弯曲作降速运动。这样日核周围物质连续有规律地左右运动于上下极磁场上,就拉断了铁
质日核旋转的磁感应线,另一方面振动的物体推挤摩擦力所作出的能量,使周围原子中的电子做向心力运动向
原子核靠近距离的大小,决定了原子核和电子它们在受两种不同作用力下产出的电流多少。太阳就从机械能中
转换成电流来发展进化了。所以说,这个球体的无形有极质量大的统一的场中心,总是在周围能量达到极限
时,用摩擦力、引力、向心力等来调节控制加速造成的能量极限反常现象,使它们矛盾双方联为一体,互为
条件,使对立面在相互依存的统一体中得以存在和发展。它使矛盾双方互相贯通,规定着事物发展的基本趋势。
它使矛盾双方相互吸取有利于自身发展的因素,使太阳在一级级地向高级进化发展。
以上所说太阳进化各过程,就像由星球运动构成的星系,各自质量先构成了统一体旋涡式运动,以后向
椭圆式棒旋式一级一级地去合成进化复制,和再合成进化再复制发展,也将自己推向了三种死亡的归宿。一
种归宿:当太阳进化到白矮星时,由氦颗粒组合成的光球外壳质量已进化到可塑性壳体,封密了黑子球进入
光球层内。当黑子运动到光球外壳最薄处,黑子旋转快就像一天天长大的胎儿停留在子宫内一样,不断吸收、
和被复制出强大能量的生命力,会使最薄处壳体球中下部一面逐步被顶了凸起,就像女人怀孕时的大肚子似
地。如当双方超过极限,光球最薄处被逐步顶了凸破,一个个就从光球壳体内,如米粒状和黑子在自转强大
的作用力下,突破光球壳体鱼贯而出,分娩出若干个不同质量的子星球,如地球、月球之类星球。你看第谷
和开普勒等天文学家发现天鹅座中的网络状星云,300000 年前一次超新星爆炸后,遗留下大约 150 个行星状
星云,这些车轮胎的气体环就预示那些有分娩能力,一颗颗从这里离开去寻找更大引力星结伴后的行星遗影,
而这个球的壳体就像一种动物分娩时,没有产道死了的母体那样, 被漂浮在太空中,蟹状星云的壳体也就是
其中一例。
太阳第二种归宿,恒星进化的后期,质量大会将一些质量小的星吸入, 或发生意外事故,就像人类生病那
样的大爆炸归宿。
笫三种 太阳质量增大到如铁原子时,不在沿消耗能量少的椭圆运动,或由于星系边缘没有原始的基本物
质,向更多更高质量物质进行补充合成,无法使失去空穴的铁质核心空穴扩大。因此,就失去进化再生功能。
就像人类基因那两个打不开的旋臂一样,星球就失重向星系中心快速落去。或被其它星系中较强引力的星吸
入,发生又一种以大塌缩引起的大爆炸。在这种巨大爆炸能量中,使太阳内如黑子等物体得到催生,从而在
大爆炸或大蒸发中诞生出若干个如地球、月球之类不能燃烧的固体星球,其余一切失去引力的星球物质或气

Acaedmia Arena; 2010;2(3) 孙纯武
http://www.sciencepub,net/academia [email protected] 100
体物质又被引力返依原处,回到太空中或被离心力形成的星系中心黑洞空穴中,各按自己前生质量,又被合成
进化出新的高质量恒星,或在星际物体大聚合过程中产生出大进化的新星体,如慧星、木星等。
综上所述,谁都无从知道太阳在什么时间归宿,又以什么样形式归宿,因此,这些黑子中心周围物质来
源,也无统一质量标准,各活动板块内就存在不同矿物质,所以宇宙中不论哪一类星球,各自质量和形成星
球的条件不同,各自的转速也就不同了。例如,地球月球,它们在恒星母体内形成时,所受时间和物质的质
量不同,它们脱离恒星母体后,在宇宙中退化后就有点差别。那些一颗颗如米粒状组成的外壳在宇宙风蚀、
退化成若干个月球环形山,而地球受日月之精华、天地之甘露,在明和暗、干与湿、冷与热、对热与环流、
环境污染及转速快等不规则合力运动中,加大加快各种气体运动合成和进化,在这些山峦和海底以及板块活
动缝岩石空腔中进化出植物和生命。因此,各自在自己的倾斜极轨道上运行,不会轻易发生碰撞。星系是张
图纸,是恒星进化这支笔画膨胀的。太空中只有行星退化,才会逐步损失质量而越绕越小,向引力大的星靠近。
我并将有核聚变的恒星为母星类起源,表层是固体的行星为子星类起源;由星际物体大进化的星,如木星慧星
称克隆类起源,其中是大分娩、大进化起源相似、结果不同。而大爆炸、大塌缩因果不同,结果相同的这四种
宇宙模型今天将同时存在,共同来解释宇宙起源。
参考文献:
1.美国阿西摩夫著,王涛、黔冬等译,.《宇宙、地球和大气》《自然科学基础知识》第一分册,科学
出版社 1976 年。
2.陈聚全、陈江兰编,《哲学自学考试辅导与训练》,华中理工大学出版社。
3 熊承堃 刘良俊 著《太极子物理学初论》。重庆出版社
及 30 年后 2007 年春节后才看了香港人写的奇门遁甲书使我增添了智慧和力量。
鸣谢:南京大学外国语学院杨琳小姐及扬州大学政治教育专业 2007 年毕生徐敬翻译英文
作者简介:孙纯武(1948 年-),男(汉族) ,扬州市,主要从事研究自然科学等; 作者声明:我保证是此作品的著作权人, 单位名称、江苏省扬州三力电器集团 通信地址、中国江苏省扬州市西湖镇 59 号 电话 0514 一 82822538 邮编 225008 电子信箱: [email protected] 我的博客 http://yzscw.blog.163.com
因只有[[统一场论]]框架符合法国科学家拉普拉斯所言:我们必须把目前的宇宙状态看作它以前的状态的结
果,以及以后发展的原因,如果有一种智慧了解它的实体各自的位置,如果它还伟大得足以分析所有这些事物,
它就能用一个单独公式概括出宇宙万物的运动,从最大的天体到最小的原子,都毫无例外,而且对于未来就像
对于过去那样,都能一目了然。正如爱因斯坦所希望的,在统一场论中用定律联系起来的对象,并不是几率,而
是所考察的事实。统一场论无论在哲学还是物理是个美的象征。
所以用椭圆图去解开万物是个伟大发现,为什么中国期刊不能来论述推荐?当然我一切靠永动机去征服人。
没有永动机我就写不出论文,否则爱因斯坦不是笨蛋。 1/20/2010

Academia Arena, ISSN 1553-992X, http://www.sciencepub.net/academia, [email protected]
http://www.sciencepub.net/academia/ [email protected]
Academia Arena (Academ Arena) ISSN 1553-992X
学术争鸣
Call for Papers Academia Arena is published bi-linguistically with English and Chinese for the scientists and Engineers by Marsland Press in USA. The journal founded in January 1, 2009 aims to present an arena of science and engineering. The Editor-in-Chief, Associate Editors-in-Chief and Editors have backgrounds in Philosophy, Science, Technology, Cosmology, Mathematics, Physics, Chemistry, Biology, Medicine, Civil, Electrical, Mechanical Engineering, etc. Papers submitted could be reviews, objective descriptions, research reports, opinions/debates, news, letters, and other types of writings. All manuscripts submitted will be peer-reviewed and the valuable manuscripts will be considered for the publication after the peer-review. 学术争鸣于2009年元月1日在美国纽约马斯兰德出版社发刊,主要目标为提供科学家与工程师及社
会工作者学术辩论的发表园地,专业领域包含哲学、科学、技术、宇宙学、数学、物理、化学、
生物学、医学、土木、电机、化工、机械工程,等,编辑群将以最专业客观的立场为所有投稿作
者服务。
Here is a new avenue to publish your outstanding reports and ideas.
Papers in all fields are welcome, including articles in natural science and social science.
Please send your manuscript to: [email protected]
For more information, please visit: http://www.sciencepub.net/academia
Marsland Press PO Box 180432 Richmond Hill, New York 11418, USA Telephone: (347) 321-7172 E-mail: [email protected]; [email protected] Emails: [email protected]; [email protected] Website: http://www.sciencepub.net/academia
9 771553 992005
ISSN 1553-992X
Academia Arena
Volume 2, Number 3 (Cumulative No.9) March 1, 2010 ISSN:1553-992X
Copyright © 2010 Marsland Press
Marsland PressPO Box 180432 Richmond Hill, New York 11418, USA
Websites:http://www.sciencepub.net/academiahttp://www.sciencepub.net
Emails: [email protected] [email protected]
Phone: (347) 321-7172
Cover design: MA,Hongbao
Photograph: YOUNG, Mary