volume 2, issue 3, march issn no: - 2456- 2165
TRANSCRIPT

Volume 2, Issue 3, March – 2017 International Journal of Innovative Science and Research Technology
ISSN No: - 2456- 2165
IJISRT17MA18 www.ijisrt.com 20
Optimization of Wire-EDM Parameters To
Calculate MRR and Measure Surface Finish On
SS410
Magesh.M1 , Jyothiraj.k2 , Janarthanan.G3, Keerthivasan.C4, P. Sivaraman5
UG Student1,2,3,4 , Assistant Professor5
Department of Mechanical Engineering1,2,3,4,5
Panimalar Engineering College, Chennai, Tamilnadu, India
Abstract - Wire Electro Discharge Machining (WEDM) process plays a significant role to cut complex and
intricate shapes of components in all conductive materials. In order to improve the machining economics and the
product accuracy of wed med parts a suitable modeling is essential. In this direction, several researchers have
attempted previously. In this present analysis to predict the performance characteristics namely the Material
Removal Rate (MRR) and surface roughness a general purpose statistical software, MINITAB was applied.
Stainless Steel (ss410) material was selected as work material to conduct experiments. A 0.25 mm diameter Brass
wire was applied as tool electrode to cut the material. Experiments were planned as per Taguchi’s orthogonal
array. Each experiment has been performed under different cutting conditions of pulse on time, off-time, wire
speed, wire tension, dielectric pressure and current. In each experiment the performance characteristics such as
material removal rate and surface roughness were carefully measured.
INDEX TERMS:- Material Removal rate, Surface roughness, Brass wire, WEDM, Taguchi’s Orthogonal Array (OA).

Volume 2, Issue 3, March – 2017 International Journal of Innovative Science and Research Technology
ISSN No: - 2456- 2165
IJISRT17MA18 www.ijisrt.com 21
CHAPTER 1
INTRODUCTION
The history of EDM Machining Techniques goes as far back as the 1770s when it was discovered by an
English Scientist. However, Electrical Discharge Machining was not fully taken advantage of until 1943 when
Russian scientists learned how the erosive effects of the technique could be controlled and used for machining
purposes. When it was originally observed by Joseph Priestly in 1770, EDM Machining was very imprecise and
riddled with failures. Commercially developed in the mid 1970s, wire EDM began to be a viable technique that
helped shape the metal working industry we see today. In the mid-1980s.The EDM techniques were transferred
to a machine tool. This migration made EDM more widely available and appealing over traditional machining
processes.
The new concept of manufacturing uses non-conventional energy sources like sound, light, mechanical,
chemical, electrical, electrons and ions. With the industrial and technological growth, development of harder
and difficult to machine materials, which find wide application in aerospace, nuclear engineering and other
industries owing to their high strength to weight ratio, hardness and heat resistance qualities has been witnessed.
New developments in the field of material science have led to new engineering metallic materials, composite
materials and high tech ceramics having good mechanical properties and thermal characteristics as well as
sufficient electrical conductivity so that they can readily be machined by spark erosion. Non-traditional
machining has grown out of the need to machine these exotic materials. The machining processes are non-
traditional in the sense that they do not employ traditional tools for metal removal and instead they directly use
other forms of energy. The problems of high complexity in shape, size and higher demand for product accuracy
and surface finish can be solved through non-traditional methods. Currently, non-traditional processes possess
virtually unlimited capabilities except for volumetric material removal rates, for which great advances have
been made in the past few years to increase the material removal rates. As removal rate increases, the cost
effectiveness of operations also increase, stimulating ever greater uses of nontraditional process. The Electrical
Discharge Machining process is employed widely for making tools, dies and other precision parts.
EDM has been replacing drilling, milling, grinding and other traditional machining operations and is now a
well established machining option in many manufacturing industries throughout the world. And is capable of
machining geometrically complex or hard material components, that are precise and difficult-to-machine such

Volume 2, Issue 3, March – 2017 International Journal of Innovative Science and Research Technology
ISSN No: - 2456- 2165
IJISRT17MA18 www.ijisrt.com 22
as heat treated tool steels, composites, super alloys, ceramics, carbides, heat resistant steels etc. being widely
used in die and mold making industries, aerospace, aeronautics and nuclear industries. Electric Discharge
Machining has also made its presence felt in the new fields such as sports, medical and surgical instruments,
optical, including automotive R&D areas.
1.1 INTRODUCTION TO WIRE EDM:
In recent years, the technology of Wire Electrical Discharge Machining (WEDM) has been improved
significantly to meet the requirements in various manufacturing fields, especially in the precision die industry.
WEDM is a thermo electrical process in which material is eroded from the work piece by a series of discrete
sparks between the work piece and the wire electrode (tool) separated by a thin film of dielectric fluid
(demonized water) that is continuously fed to the machining zone to flush away the eroded particles. A small
diameter wire ranges from 0.05 to 0.3mm is applied as tool electrode. The wire is continuously supplied from
the supply spool through the work piece, which is clamped on the table by the wire traction rollers. A gap of
0.025–0.05mm is maintained constantly between the wire and work piece. A collection tank, which is located at
the bottom, is utilized to collect the used wire. The schematic diagram of WEDM is shown in Fig.1
Fig 1.1. Detail of WEDM cutting gap
1.2 PROCESS PARAMETERS:
Significant machining parameters affecting the performance measures are identified as pulse off time,
peak current, pulse on time, flow rate and wire tension. The effect of each control factor on the performance

Volume 2, Issue 3, March – 2017 International Journal of Innovative Science and Research Technology
ISSN No: - 2456- 2165
IJISRT17MA18 www.ijisrt.com 23
measure is studied individually using the plots of signal to noise(S/N) ratio. The study demonstrates that the
WEDM process parameters can be adjusted so as to achieve better metal removal rate, surface finish, wear ratio
and dimensional deviation.
1.3 TAGUCHI’S PRINCIPLE:
Taguchi methods are statistical methods developed by Genichi Taguchi to improve the quality of
manufactured goods, and more recently also applied to engineering, biotechnology, marketing and advertising.
Taguchi employs design experiments using specially constructed table, known as "Orthogonal Arrays (OA)" to
treat the design process, such that the quality is build into the product during the product design stage.
Orthogonal Arrays (OA) are a special set of Latin squares, constructed by Taguchi to lay out the product design
experiments. By using this table, an orthogonal array of standard procedure can be used for a number of
experimental situations. The results obtained from the orthogonal array are then analyzed to achieve the
following objectives:
To estimate the contribution of individual quality influencing factors in the product design stage.
To gain the best, or optimum, condition for a process, or a product, so that good quality characteristics
can be sustained.
To approximate the response of the product design parameters under the optimum conditions.
1.3.1 APPLICATION OF ORTHOGONAL ARRAY
Taguchi's Orthogonal Array (OA) analysis is used to produce the best parameters for the optimum
design process, with the least number of experiments. The OA manages to transform a quality concept into the
product design. The OA method is able to treat quality influencing factors at discrete levels, and often this
method save time, and indirectly reduces the cost of hardware testing.
Thus, the OA is usually applied in the design of engineering products, test and quality development, and process
development. All applications involved have a common objective that is to use Taguchi's OA method to build
the quality into a product at the initial design stage.

Volume 2, Issue 3, March – 2017 International Journal of Innovative Science and Research Technology
ISSN No: - 2456- 2165
IJISRT17MA18 www.ijisrt.com 24
CHAPTER 2
EXPERIMENTAL DETAILS
2.1 WORK PIECE MATERIAL:
In metallurgy, stainlesssteel, also known as inoxsteel or inox from French inoxydable (inoxidizable),
is a steel alloy with a minimum of 10.5% chromium content by mass. Stainless steel is notable for its corrosion
resistance, and it is widely used for food handling and cutlery among many other applications. Stainless steel is
used for corrosion-resistant tools such as this nutcracker. Stainless steel does not readily corrode, rust or stain
with water as ordinary steel does. However, it is not fully stain-proof in low-oxygen, high-salinity, or poor air-
circulation environments. There are various grades and surface finishes of stainless steel to suit the environment
the alloy must endure. Stainless steel is used where both the properties of steel and corrosion resistance are
required.
Stainless steel differs from carbon steel by the amount of chromium present. Unprotected carbon
steel rusts readily when exposed to air and moisture. This iron oxide film (the rust) is active and accelerates
corrosion by making it easier for more iron oxide to form. Since iron oxide has lower density than steel, the film
expands and tends to flake and fall away. In comparison, stainless steels contain sufficient chromium to
undergo passivation, forming an inert film of chromium oxide on the surface. This layer prevents further
corrosion by blocking oxygen diffusion to the steel surface and stops corrosion from spreading into the bulk of
the metal. Passivation occurs only if the proportion of chromium is high enough and oxygen is present.

Volume 2, Issue 3, March – 2017 International Journal of Innovative Science and Research Technology
ISSN No: - 2456- 2165
IJISRT17MA18 www.ijisrt.com 25
2.1.1 CHEMICAL COMPOSITION
The following table shows the chemical composition of Stainless steel 410.
ELEMENT CONTENT (%)
Carbon 0.15max
Chromium 011.5-13.5
Iron Balance
Manganese 11max
Phosphorus 0.04max
Silicon 1max
Sulphur 0.03max
Table2.1 Chemical properties
2.1.2 PHYSICAL PROPERTIES
The following table shows the physical properties of Stainless steel 410.
PROPERTIES METRIC
Density 7750 Kg/
Melting Point 1460°C
Specific Gravity 7.7
Electrical Resistivity 57 Ω⋅cm
Table 2.2 Physical properties

Volume 2, Issue 3, March – 2017 International Journal of Innovative Science and Research Technology
ISSN No: - 2456- 2165
IJISRT17MA18 www.ijisrt.com 26
2.1.3 MECHANICAL PROPERTIES
The following table shows the mechanical properties of Stainless steel 410.
PROPERTIES METRIC
Ultimate Tensile Strength 75000 PSI
Poisson ratio 0.24
Elastic modulus 29 X 106 PSI
Table 2.3 Mechanical properties
2.2 HEAT TREATMENT
The safe scaling temperature for continuous service is 1200ºF (649ºC). Carpenter Stainless Type 410, in both
the annealed and heat-treated conditions, provides good corrosion resistance to mild atmospheres.
Fig 2.1 Stainless steel 410

Volume 2, Issue 3, March – 2017 International Journal of Innovative Science and Research Technology
ISSN No: - 2456- 2165
IJISRT17MA18 www.ijisrt.com 27
2.3 MACHINE SPECIFICATIONS:
The Stainless steel 410 was the target material used in this investigation. Experiments were performed using an
Electronic wire cut electric discharge machine. The machine used for machining was YCM 500. A small
diameter wire ranges from 0.05 to 0.3 mm is applied as tool electrode A gap of 0.025 to 0.05 mm is maintained
constantly between the wire and work-piece. A collection tank which is located at the bottom is utilized to
collect the wire after machining was performed. several researchers have attempted intelligent modelling and
optimization techniques to improve the performance characteristics of WEDM.
Fig 2.2 Experimental Setup.
2.3.1 MACHINE TOOL
The specifications of the Machine tool are as follows,
The element zinc is added to copper to produce brass EDM wire, which is the most common EDM wire in use
today. Brass wires for EDM are typically an alloy between 63/37 (American and European) to 65/35 (Asian),
Cu/Zn ratio. Zinc has a lower melting/vaporization point which make it a better electrode material than copper,
so the more zinc in the surface of an EDM wire, the faster it will cut. However, manufacturing difficulties arise
when the volume of zinc approaches 40% and its crystalline structure changes to a gamma phase, causing the
wire to become very brittle and difficult to draw. However, there are two wires being produced with 60/40
Cu/Zn content for faster cutting speeds.
Volume 2, Issue 3, March – 2017 International Journal of Innovative Science and Research Technology
ISSN No: - 2456- 2165
IJISRT17MA18 www.ijisrt.com 28
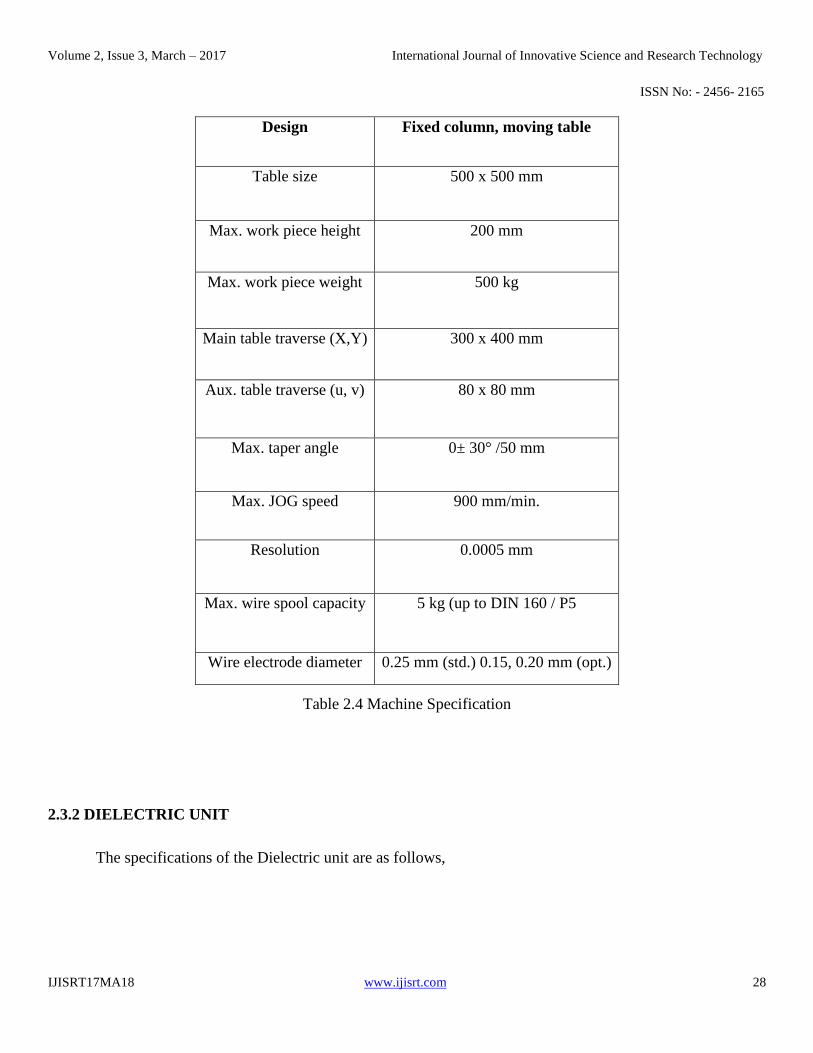
Table 2.4 Machine Specification
2.3.2 DIELECTRIC UNIT
The specifications of the Dielectric unit are as follows,
Design Fixed column, moving table
Table size 500 x 500 mm
Max. work piece height 200 mm
Max. work piece weight 500 kg
Main table traverse (X,Y) 300 x 400 mm
Aux. table traverse (u, v) 80 x 80 mm
Max. taper angle 0± 30° /50 mm
Max. JOG speed 900 mm/min.
Resolution 0.0005 mm
Max. wire spool capacity 5 kg (up to DIN 160 / P5
Wire electrode diameter 0.25 mm (std.) 0.15, 0.20 mm (opt.)

Volume 2, Issue 3, March – 2017 International Journal of Innovative Science and Research Technology
ISSN No: - 2456- 2165
IJISRT17MA18 www.ijisrt.com 29
Dielectric fluid De ionized water
Tank capacity 50 Liters
Filtration Mineral bed
Cooling system 1700 k Cal.
Table 2.5 Dielectric unit specification.
2.3.3 PULSE GENERATOR
Pulse generator type ELPULS-40 A DLX
CNC Controller EMT 100W-5
Controlled axes X,Y,u,v simultaneous
Interpolation Linear & Circular
Least input increment 0.001 mm
Least command input (X,Y,u,v) 0.0005 mm
Max. Programmable dim. (X,Y,u,v) ± 99999.999 mm
Input power supply 3 phase, AC, 415 V , 50 Hz
Connected load 10 kVA
Average power consumption 6 to 7 kVA
Table 2.6 Pulse generator specification.

Volume 2, Issue 3, March – 2017 International Journal of Innovative Science and Research Technology
ISSN No: - 2456- 2165
IJISRT17MA18 www.ijisrt.com 30
2.4 WIRE EDM CONDITION
The Wire-EDM conditions are as follows.
Table 2.7 Wire cut EDM Conditions.
2.5 MACHINE COMPONENTS:
2.5.1 TOOL:
The work piece and the wire represent positive and negative terminals in a DC electrical circuit, and are always
separated by controlled gap, constantly maintained by the machine.
As the machine advances the wire through the work piece, it cuts a slot slightly larger than the wire diameter
The ideal wire electrode material for this process has three important criteria:
high electrical conductivity
sufficient mechanical strength
optimum spark and flush characteristics.
WORK CONDITION DESCRIPTION
Wire Brass (diameter of 0.25mm)
Stainless steel Rectangular shape (100mm*100mm*6mm)
Pulse ON(T ON) 7-13 µs
Pulse OFF(T OFF) 12-14 µs
Wire Tension 10 N
Dielectric fluid De-ionized water

Volume 2, Issue 3, March – 2017 International Journal of Innovative Science and Research Technology
ISSN No: - 2456- 2165
IJISRT17MA18 www.ijisrt.com 31
Fig 2.3 Wire EDM Tool
Mechanical strength, typically stated as tensile strength in PSI, needs to be sufficient to maintain wire
straightness, with minimal vibration.
The ability of the wire material to enhance spark formation and the flushing process has become increasingly
important with the growing need for both higher productivity and accuracy
2.5.2 COPPER WITH BRASS COATING:
Copper was the original material first used in wire EDM. Although its conductivity rating is excellent, its low
tensile strength, high melting point and low vapor pressure rating severely limited its potential. Brass EDM wire
is a combination of copper and brass typically alloyed in the range of 63–65% Cu and35–37% br.
The addition of brass provides significantly higher tensile strength, a lower melting point and higher vapor
pressure rating, which more than offsets the relative losses in conductivity. Brass quickly became the most
widely used electrode material for general purpose wire EDM. It is now commercially available in a wide range
of tensile strengths and hardness. Since brass wires cannot be efficiently fabricated with any higher
concentration of zinc, the logical next step was the development of coated wires sometimes called plated or
“stratified” wire. They typically have a core of brass or copper, for conductivity and tensile strength and are
electroplated with a coating of pure or diffused zinc for enhanced spark formation and flush characteristics.
Originally called “speed wire” due to their ability to cut at significantly higher metal removal rates, coated wires
are now available in a wide variety of core materials, coating materials, coating depths and tensile stress.
Volume 2, Issue 3, March – 2017 International Journal of Innovative Science and Research Technology
ISSN No: - 2456- 2165
IJISRT17MA18 www.ijisrt.com 32
2.5.3 WIRE PATH:
When wire EDM was first introduced, copper wire was used on the machines because it conducted electricity
the best. But as speeds increased, its limitations were soon discovered. The low tensile strength of copper wire
made it subject to wire breaks when too much tension was applied. A good portion of the heat from the EDM
spark was transferred to the wire and carried away from the work zone instead of using that heat to melt and
vaporize the work piece. There is a vast array of wires to choose from with brass wire normally being used
however, molybdenum, graphitized, and thick and thin layered composite wires are available for different
applications. Needs for various wires include: optimizing for maximum cutting speeds, cutting large tapers,
(soft brass) or cutting thick work.
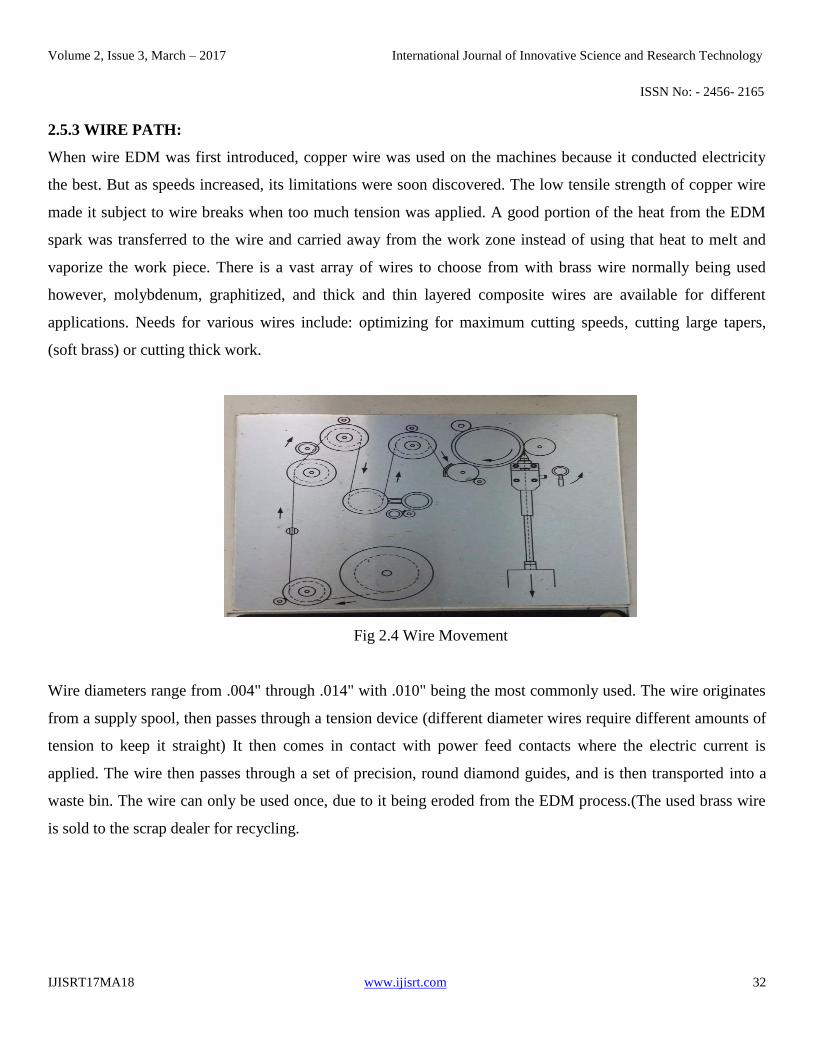
Fig 2.4 Wire Movement
Wire diameters range from .004" through .014" with .010" being the most commonly used. The wire originates
from a supply spool, then passes through a tension device (different diameter wires require different amounts of
tension to keep it straight) It then comes in contact with power feed contacts where the electric current is
applied. The wire then passes through a set of precision, round diamond guides, and is then transported into a
waste bin. The wire can only be used once, due to it being eroded from the EDM process.(The used brass wire
is sold to the scrap dealer for recycling.

Volume 2, Issue 3, March – 2017 International Journal of Innovative Science and Research Technology
ISSN No: - 2456- 2165
IJISRT17MA18 www.ijisrt.com 33
2.6 IMPLEMENTATION OF TAGUCHI METHOD ON WIRE ELECTRICAL DISCHARGE
MACHINING (WEDM)
In this study the relationship between control factors & responses like Material Removal Rate, Surface finish
and Dimensional deviations are established. The Taguchi method is used to formulate the experimental layout,
to analyze the effect of each parameter on the machining characteristics, and to predict the optimal choice for
input. Various important input combinations as formulated by Taguchi, is worked out in a wire electric
discharge machine. Calculated results and lab results are tabulated as shown below, so that the best output’s can
be found.
2.6.1 L16 ORTHOGONAL ARRAY (8 Parameters and two levels)
The Taguchi orthogonal array of four levels is shown in the tabular column. Taguchi
methods are statistical methods developed by Genichi Taguchi to improve the quality of manufactured goods,
and more recently also applied to engineering, biotechnology, marketing and advertising.
Taguchi employs design experiments using specially constructed table, known as "Orthogonal Arrays
(OA)” or otherwise known as Fractionalized Factorial Method.
The number of degrees of freedom was calculated from the number of parameters identified and their
number of levels of variation.
In the Taguchi method, most all of the observed values are calculated based on ‘the higher the better’
and ‘the smaller the better’. Thus in this study, the observed values of MRR, Ra and Cs were set to maximum,
intermediate and minimum respectively.
In this study, Taguchi method, a powerful tool for parameter design of performance characteristics was
used to determine optimal machining parameters for minimum surface roughness and maximum MRR in
WEDM.

Volume 2, Issue 3, March – 2017 International Journal of Innovative Science and Research Technology
ISSN No: - 2456- 2165
IJISRT17MA18 www.ijisrt.com 34
By this, the process parameters which influence the products are separated into two main groups: control factors
and noise factors. Four important machining parameters were used as control factors and each parameter was
designed for four levels and orthogonal array was chosen for the experiments and the results are presented in
below Table.
Table 2.8 Orthogonal Array for Taguchi design
EXP. No C 1 C 2 C 3 C 4 C 5 C 6 C 7 C 8
1 1 1 1 1 1 1 1 1
2 1 1 1 2 1 2 2 2
3 1 1 2 1 2 1 2 2
4 1 1 2 2 2 2 1 1
5 1 2 1 1 2 2 1 2
6 1 2 1 2 2 1 2 1
7 1 2 2 1 1 2 2 1
8 1 2 2 2 1 1 1 2
9 2 1 1 1 2 2 2 1
10 2 1 1 2 2 1 1 2
11 2 1 2 1 1 2 1 2
12 2 1 2 2 1 1 2 1
13 2 2 1 1 1 1 2 2
14 2 2 1 2 1 2 1 1
15 2 2 2 1 2 1 1 1
16 2 2 2 2 2 2 2 2

Volume 2, Issue 3, March – 2017 International Journal of Innovative Science and Research Technology
ISSN No: - 2456- 2165
IJISRT17MA18 www.ijisrt.com 35
2.6.2 SURFACE ROUGHNESS TESTER
The Surface roughness of Specimen is checked by Surface roughness tester. Its Specification are given
below
Table 2.9 Surface roughness tester Specification
2.7 DESIGN OF EXPERIMENTS:
Design of experiments is a powerful analysis tool for modeling and analyzing the influence of process variables
over some specific variable, which is an unknown function of these process variables. The most important
stages in the design of experiment lie in the selection of the control factors. Combining the experiment design
theory and the quality loss function concept proposed by Taguchi in the 1960s is widely used to solve and
improve industrial product quality and reliability.
The experimental layout for the machining parameters using the orthogonal array was used in this study. This
array consists of four control parameters and four levels. An orthogonal array gives a more reliable estimate of
Measuring range 17.5mm
Measuring Speed 0.25mm/s
Detector range -200µm to 160 µm
Measuring force 4mN
Stylus tip radius 5 µm
Data Storage Memory Card
Conical Taper angle
Drive Unit Standard type
Power Supply Ni-MH battery

Volume 2, Issue 3, March – 2017 International Journal of Innovative Science and Research Technology
ISSN No: - 2456- 2165
IJISRT17MA18 www.ijisrt.com 36
the factor effects with fewer tests compared to traditional methods. The process parameters along with their
values at four levels are given in Table.
2.7.1 INPUT PARAMETERS:
S.No OV TOFF TON SV WT WA F WF
1 12 11 14 40 8 4 4.5 2
2 12 11 12 40 12 2 10 2
3 12 3 14 45 8 2 10 2
4 12 3 12 45 12 4 4.5 2
5 8 11 14 45 12 4 10 2
6 8 11 12 45 8 2 4.5 2
7 8 3 14 40 12 2 4.5 2
8 8 3 12 40 8 4 10 2
9 8 3 12 45 12 2 10 4
10 8 3 14 45 8 4 4.5 4
11 8 11 12 40 12 4 4.5 4
12 8 11 14 40 8 2 10 4
13 12 3 12 40 8 4 4.5 4
14 12 3 14 40 12 4 10 4
15 12 11 12 45 8 4 10 4
16 12 11 14 45 12 2 4.5 4
Table 2.10 Input parameters

Volume 2, Issue 3, March – 2017 International Journal of Innovative Science and Research Technology
ISSN No: - 2456- 2165
IJISRT17MA18 www.ijisrt.com 37
Fig 2.5 Clamping of Work Piece
2.8 FORMULAE USED:
Changes in the electrode weight, material weight and elapsed time were recorded after each machining test. The
MRR was evaluated for each cutting condition by measuring the average amount of material removed and the
required cutting time.
Material Removal Rate (MRR) = KTVmm3/min
Where K=Kerf, k=0.25+2(0.05) =0.35mm
T=thickness=12.43mm
Kerf k=D+2G
D=dia of wire=0.25mm
G=wire-work gap(or spark gap) =0.05mm
Volume 2, Issue 3, March – 2017 International Journal of Innovative Science and Research Technology
ISSN No: - 2456- 2165
IJISRT17MA18 www.ijisrt.com 38
CHAPTER 3
RESULTS AND DISCUSSIONS
S.No OV
(V)
TOFF
(μs)
TON
(μs)
SV
(V)
WT
(N)
WA
F
mm2/min
WF
m/min
MRR
mm3/min
Ra
(μm)
1 12 11 14 40 8 4 4.5 2 5.747167 2.81
2 12 11 12 40 12 2 10 2 7.868002 2.92
3 12 3 14 45 8 2 10 2 5.838011 2.691
4 12 3 12 45 12 4 4.5 2 6.013657 2.619
5 8 11 14 45 12 4 10 2 7.836008 2.412
6 8 11 12 45 8 2 4.5 2 8.849749 2.828
7 8 3 14 40 12 2 4.5 2 5.098674 2.47
8 8 3 12 40 8 4 10 2 4.984026 2.686
9 8 3 12 45 12 2 10 4 5.880663 2.257
10 8 3 14 45 8 4 4.5 4 5.76375 2.544
11 8 11 12 40 12 4 4.5 4 7.816191 2.63
12 8 11 14 40 8 2 10 4 6.819885 2.969
13 12 3 12 40 8 4 4.5 4 5.828248 3.091
14 12 3 14 40 12 4 10 4 5.943935 2.571
15 12 11 12 45 8 4 10 4 8.509975 2.374
16 12 11 14 45 12 2 4.5 4 8.644712 2.752
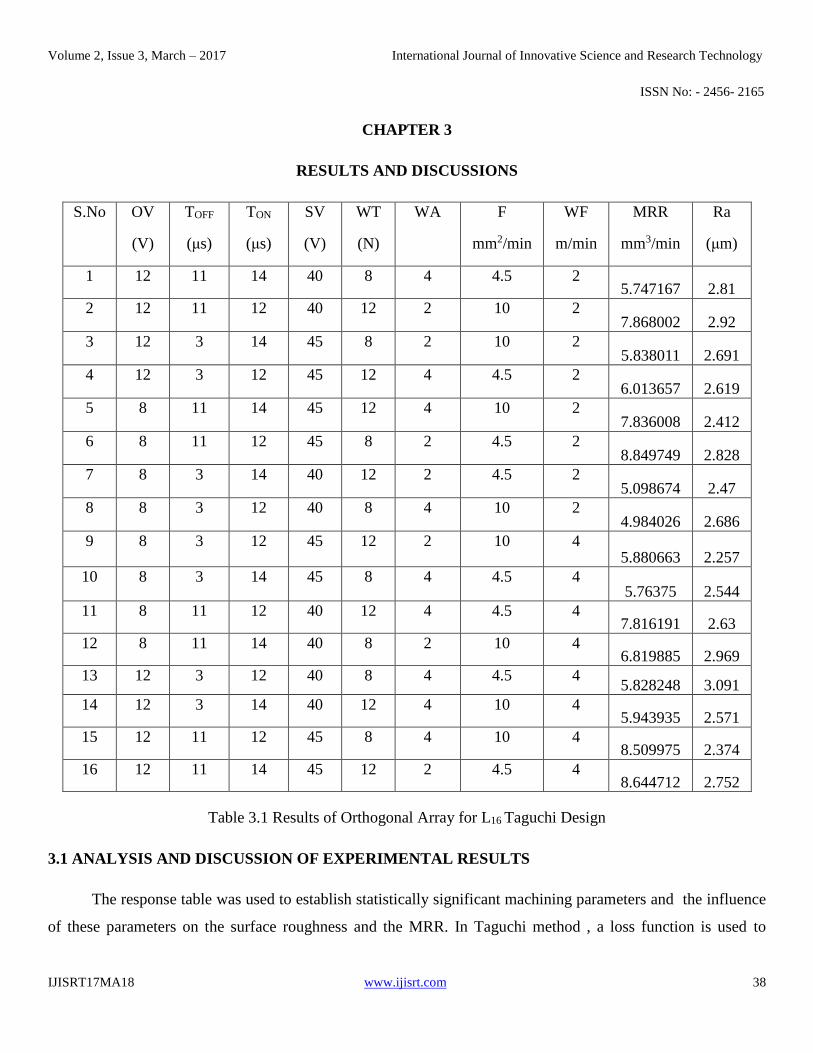
Table 3.1 Results of Orthogonal Array for L16 Taguchi Design
3.1 ANALYSIS AND DISCUSSION OF EXPERIMENTAL RESULTS
The response table was used to establish statistically significant machining parameters and the influence
of these parameters on the surface roughness and the MRR. In Taguchi method , a loss function is used to

Volume 2, Issue 3, March – 2017 International Journal of Innovative Science and Research Technology
ISSN No: - 2456- 2165
IJISRT17MA18 www.ijisrt.com 39
calculate the deviation between the experimental value and the desired value. This loss function is further
transformed in to a signal-to-noise (S/N) ratio. There are several S/N ratios available depending on the type of
characteristics; lower the better (LB), nominal is the best (NB), and higher is better (HB). In WEDM, the lower
surface roughness and higher MRR are indication of better performance. For the HB and LB, the definitions of
the loss function (L) for machining performance results (MRR, surface roughness) of n repeated number are,
)3(/1
)2(/1/1
1
2
1
2
n
i
SFLB
n
i
MRRHB
YnL
YnL
Where YMRR and YSF are the response for material removal rate and surface finish respectively and n denotes
the number of experiments. The S/N ratio can be calculated as a logarithmic transformation of the loss function
as shown below:
S/N ratio for MRR = -10 log 10 (LHB) (4)
S/N ratio for SF = -10 log 10 (LLB) (5)
Regardless of the category of the performance characteristics, greater S/N values correspond to a better
performance. Therefore, the optimum level of the machining parameters is the level with the greatest S/N ratio
value. By applying these Equations from (2) to (5), the S/N ratio values for each experiment of L16 (Table 4)
was calculated (Table Based on the analysis of S/N ratio, the optimal machining performance for the MRR
from means graph was obtained.
The optimum machining performance for the surface finish was obtained at 120 µsec. pulse-on time , 54
µsec. pulse- off time , 7 wire tension and 70% Cutting speed. Based on the above results the optimal cutting
conditions obtained for surface finish are A2B3C2D1.

Volume 2, Issue 3, March – 2017 International Journal of Innovative Science and Research Technology
ISSN No: - 2456- 2165
IJISRT17MA18 www.ijisrt.com 40
LEVEL OV ON OFF SV WT WA F WF
1 16.32 16.30 16.73 16.52 16.13 16.53 16.58 16.57
2 17.14 17.16 16.73 16.95 17.33 16.94 16.88 16.90
Delta 0.82 0.86 0.00 0.43 1.20 0.41 0.30 0.33
Rank 3 2 8 4 1 5 7 6
Table 3.2 Response Table for Signal to Noise Ratios for MRR
LEVEL OV ON OFF SV WT WA F WF
1 -8.544 -8.534 -8.51 -8.232 -8.822 -8.757 -8.223 -8.307
2 -8.417 -8.427 -8.444 -8.730 -8.140 -8.205 -8.733 -8.655
Delta 0.127 0.107 0.074 0.498 0.681 0.553 0.515 0.348
Rank 6 7 8 4 1 2 3 5
Table 3.3 Response Table for Signal to Noise Ratios for Ra
Fig 3.1 Taguchi analysis on MRR.

Volume 2, Issue 3, March – 2017 International Journal of Innovative Science and Research Technology
ISSN No: - 2456- 2165
IJISRT17MA18 www.ijisrt.com 41
Fig 3.2 Taguchi analysis on Ra
From the response table we can infer that wire tension influence the parameters to the most critical level in
MRR. Following that order pulse ON time and OFF time influences them in the next level. So the optimized
order of the parameters in the calculation of MRR is A2B2C2D2E2F2G2H2. The optimized values are,
PARAMETERS OV ON OFF SV WT WA F WF
OPTIMIZED
VALUES
8 11 12 45 12 2 5 4
Table 3.4 Optimized Values for MRR
Also from the response table of surface roughness, wore tension influences the most and then comes the water
flow and pulse ON and OFF time parameters. The ordered and the optimized values for the surface roughness is
A1B1C1D2E1F1G2H2.

Volume 2, Issue 3, March – 2017 International Journal of Innovative Science and Research Technology
ISSN No: - 2456- 2165
IJISRT17MA18 www.ijisrt.com 42
PARAMETERS OV ON OFF SV WT WA F WF
OPTIMIZED
VALUES
12 7 14 45 8 4 5 4
Table 3.5 Optimized Values for Ra
Fig.3.3 Normal probability plot, randomness, experimental run and histogram for residual plots for means of
Ra.

Volume 2, Issue 3, March – 2017 International Journal of Innovative Science and Research Technology
ISSN No: - 2456- 2165
IJISRT17MA18 www.ijisrt.com 43
Fig.3.4 Normal probability plot, randomness, experimental run and histogram for residual plots for means of
MRR.

Volume 2, Issue 3, March – 2017 International Journal of Innovative Science and Research Technology
ISSN No: - 2456- 2165
IJISRT17MA18 www.ijisrt.com 44
CHAPTER 4
CONCLUSION
4.1. CONCLUSION
This paper has presented an investigation on the optimization and the effect of machining parameters on
the MRR and the surface finish in WEDM operations. The effect of various machining parameter such as
pulse on time, pulse off time, wire tension, and Cutting speed has been studied through the machining of
SS410 steel. The level of importance of the machining parameters on the MRR and the surface finish was
determined by using Response table Method, the highly effective parameters on both the MRR and the surface
finish were found, as pulse on time, wire tension and delay time more than the other parameters. An optimum
parameter combination for the maximum MRR and minimum surface roughness was obtained by using the
analysis. The confirmation tests indicated that it is possible to increase MRR and decrease surface roughness
significantly by using the proposed statistical technique. The experimental results confirmed the validity of the
used Taguchi method for enhancing the machining performance and optimizing the machining parameters in
WEDM operations.

Volume 2, Issue 3, March – 2017 International Journal of Innovative Science and Research Technology
ISSN No: - 2456- 2165
IJISRT17MA18 www.ijisrt.com 45
REFERENCES
1) Kim. I.S, Son. K.J, Yang. Y.S, (2003) Sensitivity analysis of process parameters in GMA welding processes
using a factorial design method. International Journal of Machine Tools and Manufacturing. Vol. 43, Issue 8,
pp: 763-709.
2) Palanikumar K, Karunamoorthy L, Karthikeyan R, (2007) Assessment of factors influencing surface
roughness on the machining of Al/Sic particulate composites. Materials and Design, Vol. 28, Issue 5, pp: 1584–
1591.
3) Kanagarajan, D. Karthikeyan. R., Palanikumar. K. and Sivaraj. P, (2008) Influence of process parameters on
electric discharge machining of WC/30%Co composites, Proceedings of Institution of Mechanical Engineers,
Part B: Journal of Engineering Manufacture. Vol. 222, pp: 807-815.
4) Hamdi Aouici , Mohamed Athmane Yallese, KamelChaoui, Tarek Mabrouki, Jean-François Rigal (2012)
Analysis of surface roughness and cutting force components in hard turning with CBN tool: Prediction model
and cutting conditions optimal. Measurement. Vol.45, Issue 3, pp: 344– 353.
5) Muthuraman.V and Ramakrishnan.R,Soft modeling of wire electrical discharge machining of WC-Co
composite, Advanced Materials Research, Vol.335-336 (2011),
pp.535-540.