volume 17, issue 12, december 2016 a publication … · volume 17, issue 12, december 2016...
TRANSCRIPT

Volume 17, Issue 12, December 2016 Stansberry’s Investment Advisory | 1
Electricity is No. 1.
No other modern human invention has created more wealth. Electricity made vast amounts of energy transportable. Running a close second is the germ theory of disease and its leading application, antibiotics.
These two innovations, more than any others, established modern life as we know it. These technologies gave man dominance over nature. Suddenly, across entire cities, humans could turn night into day with the flip of a switch. And we could control nature’s most deadly and virulent pathogens. Both of these innovations came into widespread use about 100 years ago. That’s when the average life expectancy began to increase, doubling in just a few decades. And that’s when true poverty was virtually eliminated from the Western developed world.
Dozens of other critical inventions over the last 100 years or so have also contributed to man’s increasing primacy over nature. Our list includes: semiconductors, the internal combustion engine, the Haber-Bosch process of making fertilizer, the Bessemer process for making steel, nuclear fission, and polymerase chain reaction (a key enabling technology of biotech). We’ve written about virtually all of these technologies over the years. Understanding them is essential to understanding how wealth is created.
But more than all those... at No. 3 on our list... we’d rank the Internet as the most powerful invention of modern times after electricity and penicillin (antibiotics).
And no other innovation in history created so much wealth, so quickly...
Today, the 10 largest Internet companies: Amazon, Google, Facebook, Tencent, Alibaba, Baidu, Priceline, eBay, JD.com, and Expedia have combined annual revenues of around $350 billion. The combined value of their stock is an astounding $1.9 trillion. Basically, none of these businesses existed 20 years ago.
To understand the secret behind how the Internet works and why it generates so much wealth so quickly, you have to know two things.
First, the Internet enables instant communication between a virtually unlimited number of people or computers (“nodes” in network-speak) on the same channel.
IN THIS MONTH’S ISSUE:
• From College Prank to the Most Powerful Network in the World
• Turning Computer Theory into a Cash Machine
• One of the Fastest-Growing Capital-Efficient Businesses in the World
• How to Prosper in Good Times and Lose Less When the Market Tanks
• Portfolio Update
Volume 17, Issue 12, December 2016 A publication from
STANSBERRY RESEARCH1125 N. Charles Street
Baltimore, MD 21201
1-888-261-2693
www.stansberryresearch.com
Editor Porter Stansberry
Analysts
Brett Aitken Bryan Beach Mike DiBiase John Engel Alan Gula Dave Lashmet Bill McGilton Bill Shaw David Xia
Investment AdvisoryS TA N S B E R RY ’ S
The Secret to Understanding Internet Wealth

2 | Stansberry Research Volume 17, Issue 12, December 2016
A simple example of the benefits of this incredible technical achievement is so-called “chat rooms.” This is where hundreds (or thousands) of people can have a simultaneous conversation, in real time. Here at Stansberry Research, we use chat room software called Slack that enables our entire company to communicate in real time, all across the world, in a two-way channel. Everyone is able to speak to everyone else, at the same time.
Amazon, in a more sophisticated use of this same attribute, uses the Internet to sell unbelievable amounts of merchandise to people, all around the world, simultaneously.
And the second aspect of the Internet that investors must understand is called “Metcalfe’s Law.” Metcalfe’s Law isn’t a technical algorithm, like Moore’s Law (which describes the doubling of computing power over time). It doesn’t describe anything about how the internet functions or how it grows. Metcalfe’s Law isn’t about technology. It’s about economics.
And nothing is more important for investors to understand...
METCALFE’S LAW
Long before personal computers and wireless phones, the scientists at the University of Hawaii had an unusual problem.
In 1968, there was only one computer on the Hawaiian Islands, in Oahu. Anyone who needed a computer to study big data sets had to get on a plane or a boat and travel to Oahu. This was obviously not convenient, and it made the expense of having a large computer much harder to optimize.
To solve the problem, Dr. Norman Abramson, a Harvard- and Stanford-educated physicist and electrical engineer, proposed using low-cost commercial radio equipment to transmit data to and from the mainframe. Rather than plugging directly into the mainframe via cables, users on other islands could “plug in” via radio signals. Dr. Abramson called the system “ALOHAnet.”
If you’ve ever used a radio frequency, like a CB radio or a walkie-talkie, you know that if multiple users are broadcasting at the same time, it can be impossible to understand anything that’s being said. That’s one reason the Federal Communications Commission regulates
radio transmissions and frequencies. Using standard radio equipment, multiple users can’t use the same channel at the same time. If they do “cross talk,” it creates a jumble of signals and the result is just noise.
Thus, the major engineering challenge Dr. Abramson faced was figuring out how to eliminate cross talk. One known solution was to simply assign fixed time periods for various users (nodes). But that would have been like trying to herd cats. It just wasn’t a viable solution. So rather than trying to avoid signal interference, Dr. Abramson and his team decided to make the network itself impervious to multiple signal interference.
Two problems had to be solved. First, they had to make sure that the various users weren’t inadvertently all sending signals at exactly the same time. And second, they had to figure out how to ensure that all of the sent data had been received.
Dr. Abramson and his team solved the problem of signals colliding by breaking each signal into a “packet” of information. Algorithms could then determine if the entire message was received. If the message was received correctly, a confirmation message was sent and the transmission was complete. But if a confirmation wasn’t received, then the packet of data would be re-sent.
And the secret genius to the system, the real reason it worked so well, was this: Packets were always re-sent after a random waiting period. This kept the network from jamming up, as messages were sent at random intervals.
When Robert Metcalfe read about ALOHAnet, it was a sensation in tech circles. He was so fascinated by it, he traveled to Hawaii to study it and even wrote a few bug fixes for the code. His work on ALOHAnet helped earn Metcalfe a PhD in computer science from Harvard... and set him on his course in life.
In 1973, at his first job at Xerox’s PARC research facility in Palo Alto, California, Metcalfe wanted to demonstrate the usefulness of networking groups of computers together. He built his own network equipment to link a group of personal computers to a single printer. He called his solution the “Ethernet,” even though it was built using cables, because it had been inspired by the ALOHAnet radio network.
At the time, no one understood how useful computers could be if they were linked. But Metcalfe was right. The

Volume 17, Issue 12, December 2016 Stansberry’s Investment Advisory | 3
ability to use multiple computers simultaneously on the same channel proved incredibly valuable. Applications for his Ethernet grew like wildfire.
A few years later, Metcalfe founded his own company, 3Com, to develop and sell Ethernet equipment around the world. These local networks became the foundation for the Internet we know today, and 3Com became a major computer-peripheral company, with 12,000 employees. Hewlett-Packard later bought it for almost $3 billion.
How did Robert Metcalfe know that linking computers together would prove to be so valuable? Because of his experience in the 1970s with personal computers. More than probably anyone else in the world, Metcalfe knew how personal computers would change the world and how much better they could perform when linked together. In 1980, as he was launching 3Com, he gave a series of lectures about computer networks and how they grow in value. He hypothesized that the value of a computer network would grow by the square of its nodes. Thus, a computer that was linked to a printer and three other computers, for example, wasn’t just more useful in an arithmetic way (1+1+1+1+1=5), it was geometrically more valuable (5x5=25).
These ideas haven’t been “proven” in any systematic way, but plenty of real-world evidence shows the “network effect” is real. Economists have studied the network effect for a long time, going back to the early 1900s, when Theodore Vail, the president of Bell Telephone, was campaigning for a legal monopoly of the phone system.
As the Internet emerged in the mid-1990s, several companies quickly took advantage of these dynamics. The best example is probably eBay. As the “first mover” in the online auction space, eBay attracted a critical mass of buyers and sellers, making the company virtually impossible to compete against. Unlike Amazon, eBay didn’t have to spend a fortune building warehouses either. Today, eBay is worth more than $30 billion, has almost $10 billion in revenues ... and doesn’t merchandise anything. The value of eBay is created purely by the number of nodes (users) of its network. The company is an almost pure expression of Metcalfe’s Law.
But there’s an even larger and more valuable online network. This network demonstrates the awesome power of Metcalfe’s Law with even greater efficiency. This new computer network was commercialized in the last decade. But it’s already worth more than $300 billion – making it the largest, fastest accumulation of wealth in history.
We believe it’s only just begun.
THE WORLD’S MOST VALUABLE NETWORK
The hacker called it “Facemash.”
It was basically a stunt. He hacked into the online yearbooks of various female dorms and social clubs at Harvard University. He wrote computer code to put the pictures of the women up on a website, two at a time. The viewer was then to select which woman was more attractive. Tallying the votes, the hacker was able to archive a group of the most attractive college students at Harvard.
It was a fun (if obnoxious) game for college kids to play. It attracted a lot of attention. Getting access to the website was a kind of status symbol that proved you were “connected” in tech circles. Soon, though, access spread... and crashed the Harvard student network. The hacker was charged with breach of security, copyright violations, and violating students’ privacy.
That was the first indication that Facemash was on to something huge.
Facemash was re-launched as thefacebook.com a few months later in February 2004. It had 5,000 account requests in its first month and was no longer rating co-eds, but allowed users to post profiles of themselves. By the end of that spring, it had 200,000 accounts at six Ivy League schools and all Boston colleges. By the end of the first year, there were 1 million accounts. And the site changed its name to just “Facebook.”
You probably know what happened next.
In an unprecedented demonstration of the network effect, college students around the country signed up for access to this network. A high school version was launched in September 2005. And then Facebook began allowing employees from the most desirable corporations to join, like Apple and Microsoft.
In 2006, Facebook opened to the public (anyone over the age of 13). In just two years, it had built the most desirable social network in the world, wiping out its only competitor, MySpace. A year later, just three years after its launch, Microsoft would invest $240 million in the company to buy 1.6% of its shares, valuing the business at $15 billion.

4 | Stansberry Research Volume 17, Issue 12, December 2016
By July 2010, just six years after its launch, Facebook had more than 500 million users. It reached the 1 billion user mark in 2012, just eight years after its launch. The company’s initial public offering (IPO) in the same year valued the company at $100 billion – the largest IPO valuation in history.
For most investors, Facebook’s rapid rise since its IPO (the stock has tripled) and large current market capitalization ($350 billion) are negatives. They see an expensive stock and figure that sooner or later it’s heading for a fall.
But they don’t understand the network effect. They don’t yet understand that Facebook’s size is what makes it so valuable. And they don’t understand how that value is going to continue to grow, rapidly, for a long, long time.
The Internet is the world’s third-most important modern invention. The ability for all of us to communicate in real time over the same channel is an invention of immense scope. The potential value of a global network, linking every individual in the world, is mind-boggling.
KNOWING YOUR LIKES = MONETIZING THE NETWORK
As you may remember, Facebook wasn’t always poised for domination. From 2005 to 2007, MySpace was the largest social media website in the world. At the time, MySpace was owned by Rupert Murdoch’s News Corp. But MySpace made several fatal mistakes. It loaded its webpages with as many ads as possible, right from the start, making the site slow and difficult to use. In other words, it tried to monetize its users too soon... at the expense of the users’ experience.
MySpace also didn’t do a good job of policing its website. It allowed the use of aliases, so people could hide behind fake names. It grew into a seedy site, known for pornographic content, spam, and phishing. Advertisers retreated.
As anyone who has seen the movie The Social Network can tell you, Facebook founder Mark Zuckerberg took a completely different approach... He waited until after his website reached critical mass before monetizing it.
Facebook wasn’t cluttered with advertisements. It was safe and clean, and it gave users a much better experience. By 2008, the number of Facebook users surpassed MySpace users.
But during this period without much revenue, the company had to front the cost of Internet servers – and eventually server “farms.”
When the time was right, Zuckerberg chose an advertising model to generate the revenues that would pay for all those servers. Facebook charged firms for the right to access its free users. This user base is extremely valuable because Facebook knows a lot about them. It knows who they are, where they are, and what they like.
Plus, Facebook added a simple one-directional opt-in feature for businesses: a “Like” button. You’d think this would be useless, but it’s hugely popular... and important.
See, if Facebook can figure out you are 45 years old and that you “like” BMWs, Gerber baby bottles, and Giant- brand bicycles... then it knows you are a perfect match for a targeted advertisement for a coupon for a premium child’s car seat. It’s not a gaudy ad. Just a simple message in the corner of your screen: “The Safest Car Seats Around.” An ad doesn’t mean you will buy it. But you are much more likely to if you are 45, and you like cars and baby bottles.
Google does the same thing with targeted advertising, but it only gets your search history as data. Meanwhile, Facebook has everything: all your friends, all your captions, all their captions, and everyone’s photos. This makes Facebook a powerful tool to conquer an advertiser’s greatest fear: Wanamaker’s Dilemma.
John Wanamaker was a 19th-century businessman who built a group of popular department stores in Philadelphia. Frustrated with competing against Sears, Roebuck and Co.’s store-to-farm catalog, Wanamaker famously com-plained in 1886: “Half my advertising is wasted. But I don’t know which half!”
The problem, in a nutshell, is figuring out where to target your ads to get the highest rate of response. And a few simple pictures on Facebook from a few million people is not going to solve that.
Except, Facebook isn’t a few million people. It’s a few BILLION people. And it’s still growing at close to a million new users every day.
In 2010, Facebook had 500 million users. All free. The map on Page 5 shows all their social connections. The brightest spots mark the highest concentration of connections. It’s basically a map of the highly developed urban world. But this is also a fixed-point map, based on houses. It did not match our social world after the iPhone.
The iPhone needed a 3G cellular network to move large amounts of data wirelessly. When that happened, smartphones became web-browsing tools.

Volume 17, Issue 12, December 2016 Stansberry’s Investment Advisory | 5
This was trouble for Facebook. By 2012, 80% of U.S. mobile-phone users had access to a 3G (or faster) network. But by its IPO the same year, Facebook had close to zero revenue from mobile users.
Part of the reason was screen size. The normal Facebook page didn’t scale down to early smartphones. That made it difficult to place the ads effectively. Speed was the other reason, prior to the advent of 3G networks, mobile devices were too slow to load Facebook’s website (or most anyone else’s for that matter.)
Nevertheless, by 2012, mobile networking was exploding... and Facebook needed to react. The company caught a couple of breaks. The new 4G networks helped, as did “smarter” smartphones with bigger screens and improved cameras. Together, all four technical advances have made a late-model smartphone a lot more like an older PC... In other words, Facebook compatible.
Still, Facebook needed to lead the way into smartphones, not just follow. So...
FACEBOOK GOES ON A SPENDING SPREE
In 2012, Facebook spent $1 billion to buy rival social media site Instagram. Instagram has a simple, effective, person-to-person picture-sharing service built for smartphones. At the time, it only had 30 million users – compared with Facebook’s 900 million. But it was growing like mad. It expanded to 100 million active users by 2014. Today, it boasts 500 million, making it the eighth-largest social networking site in the world.
An “active user” is anyone who logs into the account at least once a month. Of those users, 300 million log in every day... That’s a bit less than the U.S. adult population.
And it’s nothing compared with the WhatsApp instant messaging platform. Facebook paid roughly $22 billion for WhatsApp in 2014...
At the time, WhatsApp had 400 million users. Today, it has more than a billion mobile users, second only to Facebook’s 1.8 billion users. (Facebook’s other messaging app, Messenger, is the third-largest social networking app in the world). But WhatsApp isn’t contributing any revenue yet. It’s still growing... along with its potential.
Pundits hate this lag. We don’t know why. It’s the exact same strategy Zuckerberg used with Facebook... He’s never in a hurry to monetize.
A dozen years ago, Facebook had 500,000 accounts... Since then, Facebook has added roughly 1.7 billion unique monthly users... more than 1 billion of whom are daily users. In fact, the average Facebook user spends 20 minutes on this application PER DAY. And that’s growing...
If you compare the next map with the earlier one, you can see how the interconnection of Facebook users have grown.
(Notice the giant “black hole” northeast of India. That’s China. More on that later).
Using Facebook has a cumulative effect because the service stores your social memories. Ultimately, that’s what photographs do – freeze a moment. Now, Facebook stores a decade of moments.
During the heyday of Madison Avenue, in the 1950s and 1960s, legendary ad man David Ogilvy taught young

6 | Stansberry Research Volume 17, Issue 12, December 2016
copywriters to write long advertisements. When asked who would read a page-long advertisement, written in small print, Ogilvy would reply, “Everyone.” In fact, he’d say he could write an entire 250-page book that he guaranteed virtually everyone in America would be willing to read. “What do you think the title of the book would be?” he’d ask. Silence would follow. Then, Ogilvy would give away the only real secret to advertising: “All About You.”
Facebook is a living, breathing book. And it’s all about you, the user. That makes it endlessly fascinating for virtually everyone.
In the software world, the “stickiness” of an application is basically how likely you are to come back to it. Facebook is the ultimate “sticky” app. And for some users, this can be all-consuming.
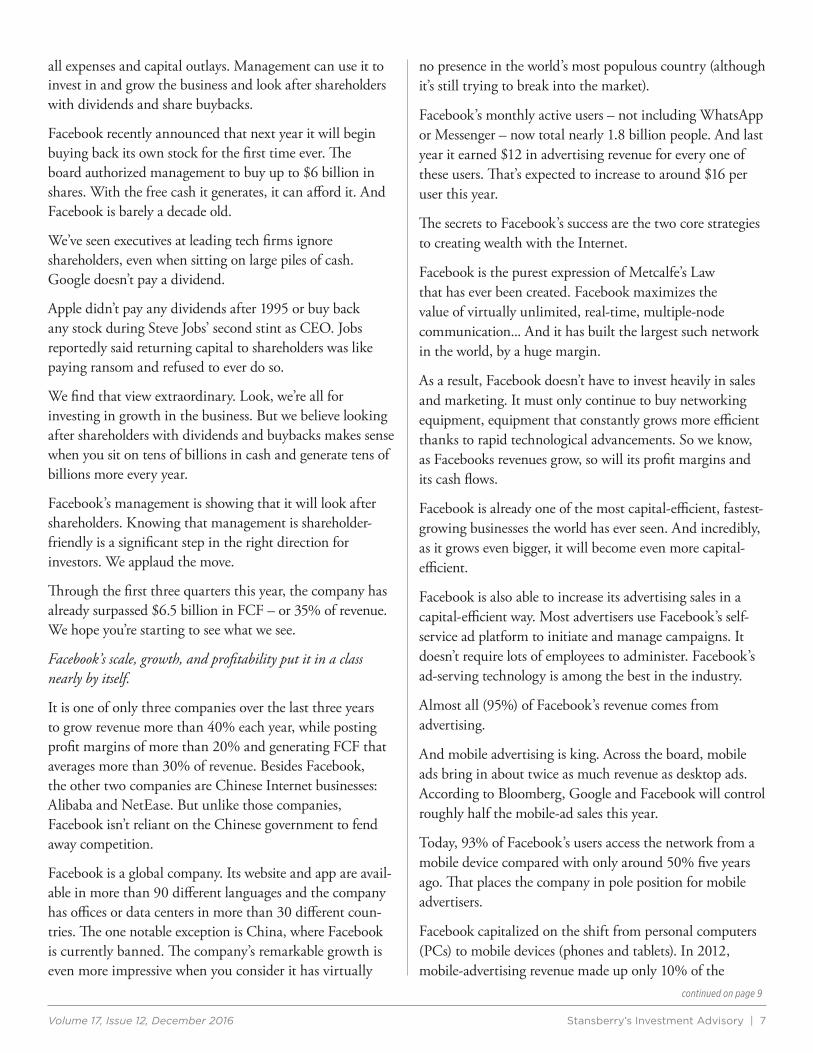
The value – $350 billion and counting – that Facebook has created is the best example yet of the “network effect” created by the Internet. We can see it in the steady growth of Facebook’s ad revenue, as more people stay more time. And we can see it in any of Facebook’s quarterly or annual statements when it reports average revenue per user (ARPU). (For more details, see Page 8.)
This is an unusual metric for measuring Facebook. It was developed for cellular carriers and cable companies... both of which charge users directly. But Facebook is free. So are Instagram and WhatsApp. Instead, it’s the advertisers that pay to have access to the data about Facebook users. And they’ve been spending more and more every year to selectively target Facebook’s users.
That’s how Facebook capitalizes on Metcalfe’s Law – the network effect – the more users, the more valuable their data are to advertisers.
And when you look at the company’s numbers, we think you’ll see that Facebook is...
AN INCREDIBLE, CAPITAL-EFFICIENT, CASH-GENERATING MACHINE
Facebook’s balance sheet is in pristine condition.
The company has no long-term debt. Zero. And it has $26 billion of cash and securities. That’s more cash than soda giant Coca-Cola has. Only 12 nonfinancial companies in the world have more cash than Facebook. That immense pile of cash allows the company to continue investing in
its cloud-storage and server-farm infrastructure or make additional strategic acquisitions as opportunities arise.
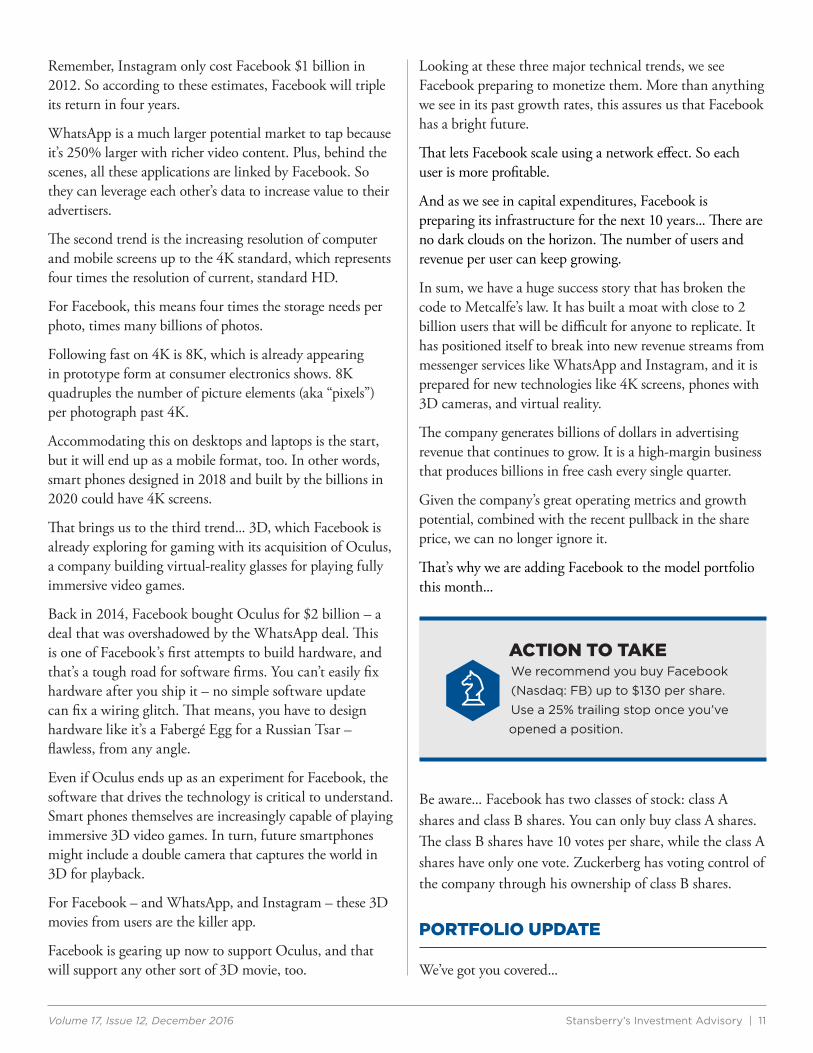
In 2011, the year before its IPO, Facebook generated around $3.7 billion in sales. Last year, revenue was just shy of $18 billion. That’s 383% growth in four years, or 48% per year. And it keeps growing. This year, the company will top more than $27 billion in sales – 52% higher than last year.
That’s the kind of growth Amazon was regularly posting five years ago. But unlike many growth companies (including Amazon), Facebook actually makes money... lots and lots of it.
And the best part is that it’s a highly scalable business. While revenues have been growing at staggering rates... margins and profits have been growing even faster. The company reported profit margins of 20% last year. And it’s on target to increase those to more than 30% for 2016.
Those numbers are outstanding. But longtime subscribers know we care most about how much cash the business generates. As we like to say, you can’t fake cash.
Last year, Facebook generated $8.6 billion in operating cash flow, or “cash profits” – roughly 48% of revenue. And it’s improving. So far this year, it has turned an impressive 52% of every dollar in sales into cash profits. In other words, Facebook keeps more than half of every dollar of revenue as cash profits.
But cloud storage and server farms are expensive. So far this year, it has spent $3.2 billion on capital expenditures (capex) and will likely spend more than $5 billion next year. Still, it grows sales, profits, and cash flows at a much faster rate.
Even after capex, the company made more than $6 billion in free cash flow (FCF) last year, 34% of its revenues. FCF is what’s left after management pays everything... including
Volume 17, Issue 12, December 2016 Stansberry’s Investment Advisory | 7
all expenses and capital outlays. Management can use it to invest in and grow the business and look after shareholders with dividends and share buybacks.
Facebook recently announced that next year it will begin buying back its own stock for the first time ever. The board authorized management to buy up to $6 billion in shares. With the free cash it generates, it can afford it. And Facebook is barely a decade old.
We’ve seen executives at leading tech firms ignore shareholders, even when sitting on large piles of cash. Google doesn’t pay a dividend.
Apple didn’t pay any dividends after 1995 or buy back any stock during Steve Jobs’ second stint as CEO. Jobs reportedly said returning capital to shareholders was like paying ransom and refused to ever do so.
We find that view extraordinary. Look, we’re all for investing in growth in the business. But we believe looking after shareholders with dividends and buybacks makes sense when you sit on tens of billions in cash and generate tens of billions more every year.
Facebook’s management is showing that it will look after shareholders. Knowing that management is shareholder-friendly is a significant step in the right direction for investors. We applaud the move.
Through the first three quarters this year, the company has already surpassed $6.5 billion in FCF – or 35% of revenue. We hope you’re starting to see what we see.
Facebook’s scale, growth, and profitability put it in a class nearly by itself.
It is one of only three companies over the last three years to grow revenue more than 40% each year, while posting profit margins of more than 20% and generating FCF that averages more than 30% of revenue. Besides Facebook, the other two companies are Chinese Internet businesses: Alibaba and NetEase. But unlike those companies, Facebook isn’t reliant on the Chinese government to fend away competition.
Facebook is a global company. Its website and app are avail-able in more than 90 different languages and the company has offices or data centers in more than 30 different coun-tries. The one notable exception is China, where Facebook is currently banned. The company’s remarkable growth is even more impressive when you consider it has virtually
no presence in the world’s most populous country (although it’s still trying to break into the market).
Facebook’s monthly active users – not including WhatsApp or Messenger – now total nearly 1.8 billion people. And last year it earned $12 in advertising revenue for every one of these users. That’s expected to increase to around $16 per user this year.
The secrets to Facebook’s success are the two core strategies to creating wealth with the Internet.
Facebook is the purest expression of Metcalfe’s Law that has ever been created. Facebook maximizes the value of virtually unlimited, real-time, multiple-node communication... And it has built the largest such network in the world, by a huge margin.
As a result, Facebook doesn’t have to invest heavily in sales and marketing. It must only continue to buy networking equipment, equipment that constantly grows more efficient thanks to rapid technological advancements. So we know, as Facebooks revenues grow, so will its profit margins and its cash flows.
Facebook is already one of the most capital-efficient, fastest-growing businesses the world has ever seen. And incredibly, as it grows even bigger, it will become even more capital-efficient.
Facebook is also able to increase its advertising sales in a capital-efficient way. Most advertisers use Facebook’s self-service ad platform to initiate and manage campaigns. It doesn’t require lots of employees to administer. Facebook’s ad-serving technology is among the best in the industry.
Almost all (95%) of Facebook’s revenue comes from advertising.
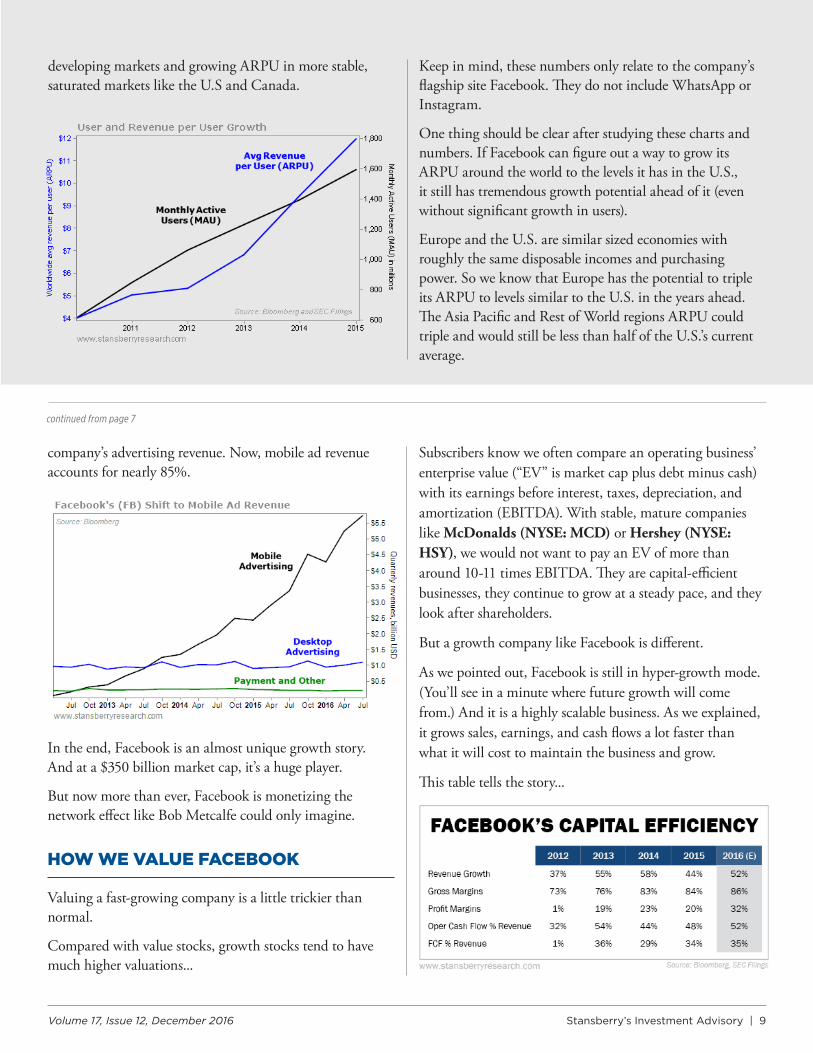
And mobile advertising is king. Across the board, mobile ads bring in about twice as much revenue as desktop ads. According to Bloomberg, Google and Facebook will control roughly half the mobile-ad sales this year.
Today, 93% of Facebook’s users access the network from a mobile device compared with only around 50% five years ago. That places the company in pole position for mobile advertisers.
Facebook capitalized on the shift from personal computers (PCs) to mobile devices (phones and tablets). In 2012, mobile-advertising revenue made up only 10% of the
continued on page 9

8 | Stansberry Research Volume 17, Issue 12, December 2016
Most of Facebook’s active users are outside the U.S. and Canada.
Asia Pacific (excluding China) is Facebook’s largest region with 629 million monthly active users (MAU). The “Rest of World” – which includes Africa, Latin America, and the Middle East – is second-largest with 587 million active users. Europe is third with 342 million users. The U.S. and Canada combine for fourth with 229 million. But…
Users don’t translate to revenue equally. When it comes to
revenue, the story is almost completely reversed. Despite making up only 14% of Facebook’s active users, the U.S. and Canada generate half of its revenues.
The reason is simple: The U.S. and Canada generate far higher average revenue per user (“ARPU”) than other regions. Last year, the ARPU in the U.S. and Canada was $41.65. That was 11 times more than in the Rest of World region ($3.74 per user) and eight times greater than in the Asia Pacific region ($5.45 per user). It’s three times more than in Europe ($14.38 per user).
Breaking Down Facebook’s Revenue Growth Potential
Despite having the highest ARPU of all regions, Facebook has been able to grow this average the fastest in the U.S. and Canada. ARPU grew in the U.S. and Canada 45% last year. By comparison, it grew by 24% in Europe, 22% in Asia Pacific and 12% in Rest of World. And U.S./Canada ARPU is on pace to grow the most again this year.
Meanwhile, the number of monthly active users is growing fastest in Asia Pacific and the Rest of World regions. These regions are growing around 15% annually compared with around 7% in Europe and 5% in the U.S. India and Brazil saw some of the biggest increases in MAU last year.
Facebook’s strategy seems to be growing MAU in
Volume 17, Issue 12, December 2016 Stansberry’s Investment Advisory | 9
developing markets and growing ARPU in more stable, saturated markets like the U.S and Canada.
Keep in mind, these numbers only relate to the company’s flagship site Facebook. They do not include WhatsApp or Instagram.
One thing should be clear after studying these charts and numbers. If Facebook can figure out a way to grow its ARPU around the world to the levels it has in the U.S., it still has tremendous growth potential ahead of it (even without significant growth in users).
Europe and the U.S. are similar sized economies with roughly the same disposable incomes and purchasing power. So we know that Europe has the potential to triple its ARPU to levels similar to the U.S. in the years ahead. The Asia Pacific and Rest of World regions ARPU could triple and would still be less than half of the U.S.’s current average.
company’s advertising revenue. Now, mobile ad revenue accounts for nearly 85%.
Subscribers know we often compare an operating business’ enterprise value (“EV” is market cap plus debt minus cash) with its earnings before interest, taxes, depreciation, and amortization (EBITDA). With stable, mature companies like McDonalds (NYSE: MCD) or Hershey (NYSE: HSY), we would not want to pay an EV of more than around 10-11 times EBITDA. They are capital-efficient businesses, they continue to grow at a steady pace, and they look after shareholders.
But a growth company like Facebook is different.
As we pointed out, Facebook is still in hyper-growth mode. (You’ll see in a minute where future growth will come from.) And it is a highly scalable business. As we explained, it grows sales, earnings, and cash flows a lot faster than what it will cost to maintain the business and grow.
This table tells the story...
In the end, Facebook is an almost unique growth story. And at a $350 billion market cap, it’s a huge player.
But now more than ever, Facebook is monetizing the network effect like Bob Metcalfe could only imagine.
HOW WE VALUE FACEBOOK
Valuing a fast-growing company is a little trickier than normal.
Compared with value stocks, growth stocks tend to have much higher valuations...
continued from page 7

10 | Stansberry Research Volume 17, Issue 12, December 2016
So we look at a different metric when valuing Facebook.
Facebook’s trailing price-to-earnings (P/E) ratio is 45, which on the surface... is very high. But since its earnings are growing so fast, Facebook has a much more reasonable forward P/E ratio. Based on 2017 earnings per share (EPS) estimates, Facebook’s P/E ratio is 22. And its two-year forward P/E ratio is just 18 (using a blended ratio of 2018 and 2017 estimated EPS).
One way we value hypergrowth companies like Facebook is to compare its two-year forward P/E ratio to its long-term EPS growth rate. This type of ratio is called the P/E to growth ratio, or simply the “PEG ratio.”
A PEG ratio of 1 suggests a stock is fairly valued. A ratio greater than 1 indicates that it’s overvalued and less than 1 implies it’s reasonably priced for its growth.
For example, a company expected to grow earnings at a rate of 30% per year would have a PEG ratio of 1 if its P/E ratio was 30. (P/E ratio of 30 divided by 30 percent earnings growth.) If instead its stock traded at a P/E ratio of 45, its PEG ratio would then be 1.5. (P/E ratio of 45 divided by 30 percent earnings growth.) That indicates the stock is expensive. If its P/E ratio was only 20, its PEG ratio would be 0.67, indicating that the stock was underpriced.
For Facebook’s long-term EPS growth rate, we used an estimate of 25%. At that rate, Facebook’s EPS will triple in five years. (Given the upside potential of Instagram and WhatsApp that we’ll explain in a minute, we believe that this is a conservative estimate.)
Using this growth estimate, Facebook’s two-year forward PEG ratio is below 0.75. So Facebook is reasonably priced when you take its growth into consideration. The chart
shows Facebook’s two-year forward PEG ratio since its IPO.
So why are we recommending it today?
Yes, the stock is up 300% since its IPO. But Facebook has turned Metcalfe’s Law into an earnings machine... It treats shareholders well by buying back shares... Its shares are fairly priced for growth... And most important, earnings growth will continue. Let’s explain how...
FACEBOOK CAN MONETIZE MOBILE VIDEO CALLING
As we explained, Facebook is planning on spending more than $5 billion on acres of cloud storage and server farms next year. This means Facebook is preparing for more minutes of time and bigger images per user. In other words, Facebook is building out its network to prepare for three emerging tech trends:
1. Secure mobile video calls
2. Ultrahigh-definition (so-called “4K”) images on the desktop
3. 3D images on smartphones
The first of these trends, secure mobile video calls, just rolled out a few weeks ago on WhatsApp.
Technically these are end-to-end encrypted video calls, which are secure calls (that may include mobile payments) to and from businesses. These won’t be spam calls. You would only be contacted by firms that you already do business with. Facebook will enforce this because it wants to keep users happy. Still, it’s much easier to get businesses to pay to reach secure WhatsApp users (all 1 billion of them). Today, this is not yet a business.
WhatsApp users currently deploy the new WhatsApp technology to make free video calls with functionality not available with other free services like FaceTime (Apple) or Skype (Microsoft). Zuckerberg is following his trusted “wait to monetize” model. It worked for Facebook. And it worked for Instagram.
Facebook did not start monetizing Instagram until late last year. And already, according to Credit Suisse estimates, Instagram accounts for 10% of Facebook’s revenue. Credit Suisse also estimates Instagram will be worth $3.2 billion once 2016 numbers are tallied.
Volume 17, Issue 12, December 2016 Stansberry’s Investment Advisory | 11
Remember, Instagram only cost Facebook $1 billion in 2012. So according to these estimates, Facebook will triple its return in four years.
WhatsApp is a much larger potential market to tap because it’s 250% larger with richer video content. Plus, behind the scenes, all these applications are linked by Facebook. So they can leverage each other’s data to increase value to their advertisers.
The second trend is the increasing resolution of computer and mobile screens up to the 4K standard, which represents four times the resolution of current, standard HD.
For Facebook, this means four times the storage needs per photo, times many billions of photos.
Following fast on 4K is 8K, which is already appearing in prototype form at consumer electronics shows. 8K quadruples the number of picture elements (aka “pixels”) per photograph past 4K.
Accommodating this on desktops and laptops is the start, but it will end up as a mobile format, too. In other words, smart phones designed in 2018 and built by the billions in 2020 could have 4K screens.
That brings us to the third trend... 3D, which Facebook is already exploring for gaming with its acquisition of Oculus, a company building virtual-reality glasses for playing fully immersive video games.
Back in 2014, Facebook bought Oculus for $2 billion – a deal that was overshadowed by the WhatsApp deal. This is one of Facebook’s first attempts to build hardware, and that’s a tough road for software firms. You can’t easily fix hardware after you ship it – no simple software update can fix a wiring glitch. That means, you have to design hardware like it’s a Fabergé Egg for a Russian Tsar – flawless, from any angle.
Even if Oculus ends up as an experiment for Facebook, the software that drives the technology is critical to understand. Smart phones themselves are increasingly capable of playing immersive 3D video games. In turn, future smartphones might include a double camera that captures the world in 3D for playback.
For Facebook – and WhatsApp, and Instagram – these 3D movies from users are the killer app.
Facebook is gearing up now to support Oculus, and that will support any other sort of 3D movie, too.
Looking at these three major technical trends, we see Facebook preparing to monetize them. More than anything we see in its past growth rates, this assures us that Facebook has a bright future.
That lets Facebook scale using a network effect. So each user is more profitable.
And as we see in capital expenditures, Facebook is preparing its infrastructure for the next 10 years... There are no dark clouds on the horizon. The number of users and revenue per user can keep growing.
In sum, we have a huge success story that has broken the code to Metcalfe’s law. It has built a moat with close to 2 billion users that will be difficult for anyone to replicate. It has positioned itself to break into new revenue streams from messenger services like WhatsApp and Instagram, and it is prepared for new technologies like 4K screens, phones with 3D cameras, and virtual reality.
The company generates billions of dollars in advertising revenue that continues to grow. It is a high-margin business that produces billions in free cash every single quarter.
Given the company’s great operating metrics and growth potential, combined with the recent pullback in the share price, we can no longer ignore it.
That’s why we are adding Facebook to the model portfolio this month...
ACTION TO TAKEWe recommend you buy Facebook
(Nasdaq: FB) up to $130 per share.
Use a 25% trailing stop once you’ve
opened a position.
Be aware... Facebook has two classes of stock: class A shares and class B shares. You can only buy class A shares. The class B shares have 10 votes per share, while the class A shares have only one vote. Zuckerberg has voting control of the company through his ownership of class B shares.
PORTFOLIO UPDATE
We’ve got you covered...

12 | Stansberry Research Volume 17, Issue 12, December 2016
Every Stansberry’s Investment Advisory recommendation is handpicked to fulfill a role in our well-diversified portfolio. The capital-efficient and insurance stocks form the backbone of our strategy – these are companies we hope to hold on to forever. Then, we pile into our “macro” recommendations when we see an undeniable economic trend playing out. (The “energy export” theme of 2012-2013 is a classic example.)
And as we head into the ninth inning of a bull market rally, it’s important to load the portfolio with both speculations and short positions as well...
As our colleague Steve Sjuggerud has pointed out on many occasions, the tail end of a bull market is the best time to make gobs of money. That’s why, in 2016, we’ve picked more speculations than usual. We don’t want to miss out on the outsized gains the market offers as the public greedily bids up shares. Of course, we don’t want to be 100% long when the bull market ends... so we’ve also added 10 short positions in the past year alone.
Our objective is to design a “hedged” portfolio that will prosper when times are good and mitigate losses when the market tanks. The past three weeks provide a perfect illustration of our hedged portfolio in action.
As we went to press last month, Hillary Clinton’s election win was a foregone conclusion. Nobody thought Donald Trump had a chance. And according to almost every market pundit, a Trump upset would crush the markets. A week before the election, MIT Professor Simon Johnson echoed conventional wisdom in an article posted on the MarketWatch website:
A big adverse surprise – like the election of Donald Trump in the U.S. – would likely cause the stock market to crash and plunge the world into recession.
Our Stansberry’s Investment Advisory team made no such predictions.
We didn’t know who would win. And we certainly didn’t know how the market would react. What we did know is that we’d spent several years building a portfolio that can both prosper in good times and absorb market shocks.
As it turns out, Simon Johnson and the other pundits were dead wrong. At least so far. The S&P 500 has surged about 5% since we last published, including a 4% move in the
17 trading sessions since the election. That’s a big move for such a short period of time.
How did our Investment Advisory portfolio do? Our portfolio is also up 5% since our last publication. This is an outstanding result, considering our portfolio held 10 “hedged” holdings and was therefore significantly less volatile than the overall market. In fact, looking at various scenarios, we estimate that in a bear market selloff of 20%, our portfolio would “only” drop 7%-10%. In other words, our Stansberry’s Investment Advisory portfolio is half as volatile as the overall market.
This demonstrates the power of a hedged portfolio. If the market surges... you win. If the market tanks... you lose less.
Post-election trading sessions provide an interesting case study in how this works. Our capital-efficient stocks are up around 4% since our last issue – roughly in line with the market. Our insurance holdings, however, did much better. Bill Berkley, founder of longtime portfolio holding W.R. Berkley (NYSE: WRB), recently told rating agency A.M. Best that he feels the Trump administration will be “positive for the industry.” The market agrees. Our insurance holdings are up 9% since the election.
In the past month, our speculations are up more than 30% on average, driven largely by Fannie Mae (OTC: FNMA) and Freddie Mac (OTC: FMCC) – more on those in a moment. Meanwhile, our hedged positions... including all of our shorts as well as the PIMCO 25+ Year Zero Coupon U.S. Treasury Index Fund (NYSE: ZROZ), NovaGold Resources (NYSE: NG), and the Central Fund of Canada (NYSE: CEF)... are down an average of 10%.
The past three weeks provide a perfect example of the power of a hedged portfolio. Some monster gains (thanks largely to speculations), offset by losses in hedged positions, can lead to healthy gains... even in the most volatile markets.
Of course, in order to keep the “ideal mix” in our portfolio, we sometimes have to trim positions.
It has been a tough year for organic grocer Whole Foods Market (Nasdaq: WFM). Last year, for the first time since 2009, Whole Foods’ same-store sales fell. Larger competitors like Wal-Mart and Kroger increased their offerings of organic groceries at lower prices.
When we originally recommended Whole Foods, we thought the plan to open smaller “365 by Whole Foods

Volume 17, Issue 12, December 2016 Stansberry’s Investment Advisory | 13
MDT). We actually think Medtronic will prosper if Trump follows through on his pledge to scrap Obamacare. But we’re going to honor the 10% Medtronic trailing stop, which was triggered on November 14. We’ll book a 42% gain on the position.
On November 14, we also stopped out of our short position in refinery operator Tesoro (NYSE: TSO) with a 1% loss. Tesoro will purchase Western Refining (WNR) for $6.4 billion. The deal gives Tesoro access to refineries in the Permian Basin. The stock spiked on the news, triggering our trailing stop.
Regardless, Tesoro faces strong headwinds. The amount of money Tesoro can make buying crude oil and turning it into refined products like gasoline is shrinking... rapidly. Per barrel, Tesoro’s refining margins went from $19.43 last year to $9.08 this quarter. Still, we must respect our stops. If you haven’t already, buy, to cover, shares of Tesoro.
On November 23, Stansberry Digest editor Justin Brill dedicated a significant portion of his issue to our Fannie Mae and Freddie Mac positions, covering the stocks’ meteoric rise since Trump’s election. Shares are up around 160% since our last publication. We don’t have space to reprint the entire commentary here, but every Investment Advisory subscriber can access the write-up online. If you missed it, here’s a brief update...
The market is re-pricing the Trump administration’s potential to take a different approach to the controversial “net worth sweep” amendment we covered in detail back in May. Under an amendment to the 2008 bailout, profits from the two government-sponsored entities “sweep” to the U.S. Treasury. So far, close to $200 billion has swept to the Treasury.
We are among the many commentators who believe this sweep is illegal. Shareholders continue to battle the net- worth sweep in court. We’re still waiting for a decision from the D.C Circuit Court. With the possibility that the new administration will take a different approach, a negative decision is no longer as decisive. We now have more ways for this to work in our favor. Treasury nominee Steven Mnuchin recently came out in support of getting Fannie and Freddie out from government control, which sent shares soaring further. With the giant move up, let’s protect those gains and apply a 50% trailing stop on the position. Hold shares of Fannie Mae and Freddie Mac.
Market” stores would help the company regain its footing. So far, the company has opened three of the stores, to mixed results.
The company’s strategy isn’t working as fast as we hoped. Comparable-store sales fell 2.6% last quarter, the fifth consecutive quarter of same-store sales declines. Management is now actually predicting same-store sales declines next year (-2% to 0%). That’s not what we wanted to hear. On top of that, gross margins fell for a second straight quarter, suggesting that Whole Foods has been forced to compete on price.
The company recently announced some management changes – co-CEO Walter Robb and CFO Glenda Flanagan are retiring after serving for more than 25 years at the company. This gives us a clue that things aren’t going well behind closed doors.
In hindsight, when we added Whole Foods to our “capital efficient” portfolio, we underestimated the impact of Wal-Mart and Kroger entering the organic market.
We’re not betting against the Whole Foods turnaround... It may well work out. Whole Foods is a solid company, and we had hoped to hold our shares forever. But we don’t think turnarounds are appropriate for our capital-efficient portfolio, so this month we recommend you SELL your shares of WFM. We’re booking a final loss of 8% in a little less than a year.
After a tough couple of months for our PIMCO 25+ Year Zero Coupon U.S. Treasury Index Fund (NYSE: ZROZ), we’ve decided to close out the position. Treasury bond prices have plummeted recently (meaning yields have spiked), with the yield on the 30-year Treasury bonds jumping from less than 2.4% in early October to more than 3% today. Bond sentiment is low right now, but bond yields could keep moving higher. That would cause our positon to continue to sell off. We don’t like giving back gains... But remember, we recommended the position as a portfolio hedge. It served that purpose well over the past year. And it cost us nothing. We’ve received $3.81 in dividends since opening the position. We’ll close the position relatively flat for the 16 months we held it. We recommend you SELL your shares of ZROZ.
We also stopped out of a couple of stocks this month. In March, we decided to protect some of our gains by tightening the stop loss on some of our recommendations – including medical-device maker Medtronic (NYSE:

14 | Stansberry Research Volume 17, Issue 12, December 2016
Many readers noticed a big drop in Biogen (Nasdaq: BIIB) shares – which went down about 10% at one point last Wednesday. We recommended Biogen back in October based on the huge potential we see in its Alzheimer’s drug.
Last Tuesday, Big Pharma rival Eli Lilly (LLY) announced it is abandoning its own experimental Alzheimer’s drug, Solanezumab. Lilly’s drug failed for the second time in late Phase III trials.
We see this as a boon for Biogen. It’s one less potential competitor in the future. Yet Lilly’s failure hurt Biogen’s share price – at least temporarily. But the market doesn’t understand what’s happening here. Not all Alzheimer’s antibody drugs are the same.
As we explained in October, Biogen’s drug clears amyloid plaque. It targets the big insoluble clumps of protein. In contrast, Lilly’s drug tried to stop amyloid plaque from ever forming. Lilly targeted the free-floating form of amyloid, which circulates around the brain in healthy folks, too – because it’s a natural antibiotic.
We know Biogen’s method works better from looking at the published clinical data.
We shared that evidence in October. Biogen’s drug BIIB-037 eliminated plaques and stopped cognitive decline. To date, there’s no other experimental Alzheimer’s treatment that has displayed such promising results.
And we expect more of the same from Biogen.
At a December 9 conference in San Diego, Biogen will reveal 24-month treatment results on BIIB-037 from the Phase Ib “Prime” trials. We hope to see Biogen’s middle dose of 6 mg work as well as the high dose to eliminate plaque and stop the progression of Alzheimer’s. If that happens, we expect a surge in shares will more than make up for recent losses.
Despite the recent losses, our Biogen pick is near the breakeven point since our recommendation. Biogen (Nasdaq: BIIB) remains a buy.
The other recommendation from the October issue – our short of the most highly leveraged rental-car companies – is already showing great results...
Last month, Hertz Global (NYSE: HTZ), the largest publicly traded car-rental company in the world, saw its share price collapse by more than 50% in the first few hours of trading following its latest earnings release.
Hertz’s third-quarter earnings disappointed investors. The company also cut its annual earnings forecast, blaming it on a drop in the value of its used cars. It warned it might have to write down the value of its used-car fleet further next quarter.
We warned that falling used-car prices could be the catalyst for the collapse of these companies:
When subprime borrowers start defaulting, the used-car market will be flooded with inventory. Used-car prices will collapse. Avis’ and Hertz’s $26 billion used-car inventory will be worth far less, which will make them even more dependent on the debt markets to feed an even larger appetite for cash.
This is already starting to happen.
These companies have to spend billions of dollars every quarter replacing their cars. They partially pay for these massive ongoing purchases by selling their older used cars. It’s a critical source of their working capital. Lower prices for used cars means the companies are even more dependent on debt to fuel their business. If the debt market dries up, these companies will collapse. That’s what happened to both companies back in 2009. Ratings agency Moody’s recently downgraded its outlook on Hertz to negative. Downgrades make debt more expensive. Higher interest rates could easily wipe out the razor-thin profit margins of these companies.
Not everyone agrees with us. Famed activist investor Carl Icahn, Hertz’s largest shareholder, used the collapse to more than double his stake. He bought another 16.3 million shares and now owns 35% of the company. We think he’s making a huge mistake.
Hertz’s stock is down roughly 30% since releasing earnings. We shorted Hertz and Avis Budget (Nasdaq: CAR) in a single combined position. So far we’re up 11% on the combined position in two months. You should continue to hold short shares of both companies.
Moving on to the merger and acquisitions market...
Shareholders of electric-car maker Tesla Motors (Nasdaq: TSLA) and solar-panel company SolarCity (Nasdaq: SCTY) formally approved the merger of the two publicly traded companies controlled by Elon Musk. The deal closed last month. The market didn’t think much of the deal.

Volume 17, Issue 12, December 2016 Stansberry’s Investment Advisory | 15
Shares of Tesla are around 17% lower today than when they first announced the merger back in June.
Tesla ended up paying around $2.1 billion for SolarCity, more than twice its book value and three times its revenues. Tesla’s purchase accomplished nothing more than saving SolarCity from bankruptcy.
SolarCity is in much worse financial shape than Tesla, which should only hasten Tesla’s demise. Tesla will now assume SolarCity’s $3.5 billion of debt, adding to its own $2.7 billion-and-growing pile of debt. In SolarCity’s last reported quarter as a stand-alone public company, its free cash flows were negative for the 12th consecutive quarter. Free cash flows were negative $1.7 billion over that span.
And things are only looking bleaker for the solar company following Trump’s election... The new president and a Republican-controlled Congress could repeal the federal tax credits set to expire in 2019. SolarCity’s entire business model depends on these credits. This is Tesla’s problem now.
SolarCity shareholders received 0.11 shares of Tesla for every SolarCity share they owned, around $21 per share. Going forward, for the SolarCity half of our combined short position, we’ll use the market price of Tesla times the conversion ratio of 0.11.
By now, your broker should have closed out of your SolarCity position and settled in cash or replaced your SolarCity position with an equivalent amount of Tesla shares sold short. It depends on how many shares of Tesla were available to short at your particular brokerage, your position size, your account size, and whether your broker considers Tesla “hard to borrow.”
So, there are a variety of factors at play, and it will depend on your individual situation. The important thing is to take a look at your account and make sure your position is squared. If you have any questions, you should contact your broker for details.
The combined short position is up 12%. You should continue to hold short your shares of Tesla
Good investing,
Porter Stansberry with Brett Aitken, Bryan Beach, Mike DiBiase, John Engel, Alan Gula, Dave Lashmet, Bill McGilton, Bill Shaw, and David Xia December 2, 2016.