volume 15(3) journal of accounting and finance
TRANSCRIPT

Jo
urn
al o
f Acco
un
ting
an
d F
inan
ce V
olu
me 1
5(3
) 2015
Volume 15(3) 2015
Journal of
Accounting and Finance
Using Maximum Entropy Outlier Analysis to Identify
Multinational Corporation Tax Havens 11
Daniel L. Friesner, Andrew M. Brajcich
The Influence of a Professional Staff on Automatic Revocation of Tax-Exempt Status 27
Daniel Neely, John M. Trussel
Do Tweets Matter for Shareholders? An Empirical Analysis 39
Brittany Cole, Jonathan Daigle, Bonnie F. Van Ness
Accrual Earnings Management Prior to Delisting 53
Linda Campbell, Linxiao Liu, Kasey Martin
Principal Trading, Price Improvement and Liquidity
Provision in a Non-Anonymous Market 64
D. Alasdair S. Turnbull
The Maturity Drivers of Corporate Capital Structure of Private/Unlisted Companies 78
Guido Max Mantovani
Understanding the Impact of Business Complexity on Executive
Management Characteristics and Firm Performance 99
Pamela E. Queen, Olukemi Fasipe
Transfer Pricing and Comparables: Public Finance
Pressures and a Corporate Tax Audit 114
António Martins
Instructional Case—Hypo Corporation: A Quasi-Experimental
Study of Students’ Perceptions 124
Charles E. Stahl, III, Greg R. Dunning
Volatility in the Indian Financial Market Before,
During and After the Global Financial Crisis 141
Praveen Kulshreshtha, Aakriti Mittal
NorthAmerican
Business Press
brought to you by COREView metadata, citation and similar papers at core.ac.uk
provided by Archivio istituzionale della ricerca - Università degli Studi di Venezia Ca' Foscari

Journal of
Accounting and Finance
North American Business Press
Atlanta – Seattle – South Florida - Toronto


Journal of Accounting and Finance
Dr. Samanthala HettihewaCo-Editor
Dr. Christopher WrightCo-Editor
Dr. David SmithEditor-In-Chief
NABP EDITORIAL ADVISORY BOARD
Dr. Nusrate Aziz - MULTIMEDIA UNIVERSITY, MALAYSIADr. Andy Bertsch - MINOT STATE UNIVERSITYDr. Jacob Bikker - UTRECHT UNIVERSITY, NETHERLANDSDr. Bill Bommer - CALIFORNIA STATE UNIVERSITY, FRESNODr. Michael Bond - UNIVERSITY OF ARIZONADr. Charles Butler - COLORADO STATE UNIVERSITYDr. Jon Carrick - STETSON UNIVERSITYDr. Min Carter – TROY UNIVERSITYDr. Mondher Cherif - REIMS, FRANCEDr. Daniel Condon - DOMINICAN UNIVERSITY, CHICAGODr. Bahram Dadgostar - LAKEHEAD UNIVERSITY, CANADADr. Anant Deshpande – SUNY, EMPIRE STATEDr. Bruce Forster - UNIVERSITY OF NEBRASKA, KEARNEYDr. Nancy Furlow - MARYMOUNT UNIVERSITYDr. Mark Gershon - TEMPLE UNIVERSITYDr. Philippe Gregoire - UNIVERSITY OF LAVAL, CANADADr. Donald Grunewald - IONA COLLEGEDr. Russell Kashian - UNIVERSITY OF WISCONSIN, WHITEWATERDr. Jeffrey Kennedy - PALM BEACH ATLANTIC UNIVERSITYDr. Dean Koutramanis - UNIVERSITY OF TAMPADr. Malek Lashgari - UNIVERSITY OF HARTFORDDr. Priscilla Liang - CALIFORNIA STATE UNIVERSITY, CHANNEL ISLANDSDr. Tony Matias - MATIAS AND ASSOCIATESDr. Patti Meglich - UNIVERSITY OF NEBRASKA, OMAHADr. Robert Metts - UNIVERSITY OF NEVADA, RENODr. Adil Mouhammed - UNIVERSITY OF ILLINOIS, SPRINGFIELDDr. Shiva Nadavulakere – SAGINAW VALLEY STATE UNIVERSITYDr. Roy Pearson - COLLEGE OF WILLIAM AND MARYDr. Veena Prabhu - CALIFORNIA STATE UNIVERSITY, LOS ANGELESDr. Sergiy Rakhmayil - RYERSON UNIVERSITY, CANADADr. Fabrizio Rossi - UNIVERSITY OF CASSINO, ITALYDr. Ira Sohn - MONTCLAIR STATE UNIVERSITYDr. Reginal Sheppard - UNIVERSITY OF NEW BRUNSWICK, CANADADr. Carlos Spaht - LOUISIANA STATE UNIVERSITY, SHREVEPORTDr. Ken Thorpe - EMORY UNIVERSITYDr. Calin Valsan - BISHOP'S UNIVERSITY, CANADADr. Anne Walsh - LA SALLE UNIVERSITYDr. Thomas Verney - SHIPPENSBURG STATE UNIVERSITY

Volume 15(3)
ISSN 2158-3625
Authors have granted copyright consent to allow that copies of their article may be made for personal or internal use. This does not extend to other kinds of copying, such as copying for general distribution, for advertising or promotional purposes, for creating new collective works, or for resale. Any consent for republication, other than noted, must be granted through the publisher:
North American Business Press, Inc.
Atlanta - Seattle – South Florida - Toronto
©Journal of Accounting and Finance 2015
For submission, subscription or copyright information, contact the editor at:
Subscription Price: US$ 310/yr
Our journals are indexed by UMI-Proquest-ABI Inform, EBSCOhost, GoogleScholar, and listed with Cabell's Directory, Ulrich's Listing of Periodicals, Bowkers Publishing Resources, the Library of Congress, the National Library of Canada. Our journals have been accepted through precedent as scholarly research outlets by the following business school accrediting bodies: AACSB, ACBSP, & IACBE.

This Issue
Using Maximum Entropy Outlier Analysis to Identify
Multinational Corporation Tax Havens ................................................................................................. 11
Daniel L. Friesner, Andrew M. Brajcich
In many practical applications of finance and accounting, reporting mean or total values mask many
underlying trends in data, especially when the researcher or manager is interested in understanding how
specific observations relate to the data. If researchers or managers are interested in these trends, using
inferential statistics that focus on measures of central tendency may not allow for identification of these
relationships. This paper uses maximum entropy techniques drawn from ecology literature to provide a
robust framework to make empirical inferences about particular groups of observations, which we refer
to as “influential observations”. The framework may be applied to individual-level data as well as
aggregate data. It is also relatively simple to implement using Excel or similar programs. We apply the
technique to data furnished by the IRS for 2008, which describes the levels of multinational corporation
subsidiary development in a given country. We use the empirical framework to identify those countries in
which multinational corporations are establishing corporate subsidiaries to avoid paying U.S. federal
income tax.
The Influence of a Professional Staff on Automatic Revocation of Tax-Exempt Status .................... 27
Daniel Neely, John M. Trussel
The US Congress passed the Pension Protection Act of 2006 (PPA) that automatically revokes the tax-
exempt status of any organization that does not file with the IRS for three consecutive years. Some
organizations subsequently refiled with the IRS following such revocation. This study focuses on the
factors associated with refiling subsequent to automatic revocation of the tax-exempt status. We find that
those that refile have better reputations, are in better financial condition and are less likely to have
professional employees than those that do not refile. These findings suggest that compliance with IRS
filing requirements is conditioned on having professional employees.
Do Tweets Matter for Shareholders? An Empirical Analysis .............................................................. 39
Brittany Cole, Jonathan Daigle, Bonnie F. Van Ness
We identify the 215 members of the S&P 500 that operate corporate Twitter accounts. We find that both
the number of daily tweets and the number of months a firm tweets is positively correlated with excess
returns. These results indicate that tweeting is associated with positive returns to shareholders, and that
tweeting and experience tweeting together can positively influence market activity.
Accrual Earnings Management Prior to Delisting................................................................................. 53
Linda Campbell, Linxiao Liu, Kasey Martin
Surprisingly, compared to going public, delisting is far less studied though it is of utmost interest to
management, investors and creditors of the affected firms. We investigate whether a pending delisting is a
potential incentive for earnings management - specifically, whether firms that delist from a major stock
exchange manage earnings using discretionary accruals in the year prior to delisting. Our results suggest
that involuntarily delisted firms engage in earnings management prior to delisting and use more positive
discretionary accruals to boost their reported earnings than do voluntarily delisted firms.

Principal Trading, Price Improvement and Liquidity
Provision in a Non-Anonymous Market ................................................................................................. 64
D. Alasdair S. Turnbull
We model principal trading by upstairs market makers and find that it supplies significant liquidity and
price improvement to the market. First, clients more frequently submit orders to firms that do upstairs
principal trading. Second, these firms provide liquidity to clients that is unavailable in the consolidated
limit order book. Principal trades are, on average, ten times larger than the depth available on the book.
Third, when brokerage firms participate as principals, they give price improvement to more than 60% of
client orders. The principal trading decision is affected by fixed trading costs and the liquidity of the
security.
The Maturity Drivers of Corporate Capital Structure of Private/Unlisted Companies .................... 78
Guido Max Mantovani
This paper investigates whether debt quality matters and the role of debt maturity choice. Shortening
maturity incentivizes more liquid, less productive, investments and it increases the probability of default.
This paper presents an empirical analysis of a sample of Italian unlisted companies between 2005 and
2009. Two subsets are identified, controlling if companies disappeared in 2011. Comparing results from
the two subsets we find: (i) proof of endogenous bankruptcy but generated by creditors; (ii) evidence of
impacts from debt maturity on performance; (iii) significant relations between maturity and size; (iv) a
specific contribution of debt maturity to the tax shield.
Understanding the Impact of Business Complexity on Executive
Management Characteristics and Firm Performance ........................................................................... 99
Pamela E. Queen, Olukemi Fasipe
This paper examines correlation between powerful top executives and firm performance in the context of
complex business environments. Business complexity challenges managers. It demands powerful CEOs to
have dominance to resolve disputes, allocate resources, and make final decisions on matters of
disagreement. At other times, powerful top management teams are essential to collaborate and share
decision-making tasks, especially in environments with less clarity, more uncertainty, fast-flux, and
dynamic changes. In complex business environments, our findings support management structures with
competent management teams that can quickly adapt to changing environments and can better position
the firm for growth and expansion.
Transfer Pricing and Comparables: Public Finance
Pressures and a Corporate Tax Audit................................................................................................... 114
António Martins
Tax administration is a key player in reaching public finance revenue goals. In some circumstances, tax
auditors respond to incentives that a performance measuring system sets up. An adversarial and
contentious relationship with taxpayers can develop if such systems are not properly managed. In
Portugal, after the public finance crisis and the international bailout in 2011, tax administration became
pressured to increase audits and revenue collection. In some cases, an overzealous audit behavior
followed from such organizational strategy. This is the topic addressed by the paper, based on a case
study where a significant tax adjustment was made based on what we consider shaky economic and legal
grounds. It is, in our view, a typical example of an overzealous tax audit, based less on sound economic
or legal reasons, and more on tax auditors’ propensity to reach auditing goals in a politically charged
environment.

Instructional Case—Hypo Corporation: A Quasi-Experimental
Study of Students’ Perceptions .............................................................................................................. 124
Charles E. Stahl, III, Greg R. Dunning
The purpose of this article, the third in this series of five articles, is to present a quasi-experimental study
of student perceptions of the hypothetical instructional case, the Hypo Corporation case. This article will
present the statistical tests of the students’ perceptions of the case with relevant student comments about
the case, thusly, testing the effectiveness of the case. The fourth article is a replication of this study both
in the United States and Canada and the fifth article will present the recommended solution to the case.
Volatility in the Indian Financial Market Before,
During and After the Global Financial Crisis ...................................................................................... 141
Praveen Kulshreshtha, Aakriti Mittal
The ARCH/GARCH time series models are employed to examine the volatility in the Indian financial
market during 2000-14, by using all eight Indian stock indices, i.e. BSE SENSEX, BSE 100, BSE 200,
BSE 500, CNX NIFTY, CNX 100, CNX 200 and CNX 500. The impact of the global financial crisis on the
volatility of returns is analyzed by splitting the time series into three phases: the pre-crisis period (2000-
06), the crisis period (2007-10) and the post-crisis period (2011-14). The best fitted model is used to
predict the conditional variance of the differenced series of returns, which is found to be stationary.


GUIDELINES FOR SUBMISSION
Journal of Accounting and Finance(JAF)
Domain Statement
The Journal of Accounting and Finance (JAF) is dedicated to the advancement and dissemination of research across all the leading fields of financial inquiry by publishing, through a blind, refereed process, ongoing results of research in accordance with international scientific or scholarly standards. Articles are written by business leaders, policy analysts and active researchers for an audience of specialists, practitioners and students in all areas related to financial and accounting in business and education. Studies reflecting issues concerning budgeting, taxation, process, investments, regulatory procedures, and business financial analysis are suitable themes. JAF also covers theoretical and empirical analysis relating to financial reporting, asset pricing, financial markets and institutions, corporate finance, and corporate governance. Articles of regional interest are welcome, especially those dealing with lessons that may be applied in other regions around the world.
Submission Format
Articles should be submitted following the American Psychological Association format. Articles should not be more than 30 double-spaced, typed pages in length including all figures, graphs, references, and appendices. Submit two hard copies of manuscript along with a disk typed in MS-Word.
Make main sections and subsections easily identifiable by inserting appropriate headings and sub-headings. Type all first-level headings flush with the left margin, bold and capitalized. Second-level headings are also typed flush with the left margin but should only be bold. Third-level headings, if any, should also be flush with the left margin and italicized.
Include a title page with manuscript which includes the full names, affiliations, address, phone, fax, and e-mail addresses of all authors and identifies one person as the Primary Contact. Put the submission date on the bottom of the title page. On a separate sheet, include the title and an abstract of 100 words or less. Do not include authors’ names on this sheet. A final page, “About the Authors,” should include a brief biographical sketch of 100 words or less on each author. Include current place of employment and degrees held.
References must be written in APA style. It is the responsibility of the author(s) to ensure that the paper is thoroughly and accurately reviewed for spelling, grammar and referencing.

Review Procedure
Authors will receive an acknowledgement by e-mail including a reference number shortly after receipt of the manuscript. All manuscripts within the general domain of the journal will be sent for at least two reviews, using a double blind format, from members of our Editorial Board or their designated reviewers. In the majority of cases, authors will be notified within 45 days of the result of the review. If reviewers recommend changes, authors will receive a copy of the reviews and a timetable for submitting revisions. Papers and disks will not be returned to authors.
Accepted Manuscripts
When a manuscript is accepted for publication, author(s) must provide format-ready copy of the manuscripts including all graphs, charts, and tables. Specific formatting instructions will be provided to accepted authors along with copyright information. Each author will receive two copies of the issue in which his or her article is published without charge. All articles printed by JAF are copyrighted by the Journal. Permission requests for reprints should be addressed to the Editor. Questions and submissions should be addressed to:
North American Business Press
301 Clematis Street, #3000
West Palm Beach, FL USA 33401
866-624-2458

The Maturity Drivers of Corporate Capital
Structure of Private/Unlisted Companies
Guido Max Mantovani
Ca’ Foscari University, Venice and Treviso
This paper investigates whether debt quality matters and the role of debt maturity choice. Shortening
maturity incentivizes more liquid, less productive, investments and it increases the probability of default.
This paper presents an empirical analysis of a sample of Italian unlisted companies between 2005 and
2009. Two subsets are identified, controlling if companies disappeared in 2011. Comparing results from
the two subsets we find: (i) proof of endogenous bankruptcy but generated by creditors; (ii) evidence of
impacts from debt maturity on performance; (iii) significant relations between maturity and size; (iv) a
specific contribution of debt maturity to the tax shield.
INTRODUCTION
Leveraging is increasingly thought of as the devil. The high leveraging that has spread to all the areas of the economic system has contributed to the high volatility that underpins the years of the recent financial crisis. Thus, leverage reduction is commonly believed to be the unique solution to exiting the crisis. Corporations are no exception to this rule: high corporate leveraging generates bankruptcy procedures that have reduced economic welfare and generated further corporate distress through a stagnating loop. Small and medium enterprises (SMEs) have been particularly hit by this loop as a consequence of their lower bargaining power in fund-raising transactions.
Leverage analysis is typically focused on the quantity of debt, whatever the framework of the analysis. At a more academic level, there is a need to understand both the absolute amount of debt capital raised and its level relative to equity capital. This approach aims to solve the capital structure puzzle. At a more practical level, however, the focus is on the methodology of leverage computation, i.e. whether to have recourse to book or market values. These being very different, the results derived from the two computational approaches may strongly bias any following decisions. In particular, the higher the goodwill embedded in equity market values, the wider the gap in the leverage ratios computed according to the two possible methodologies. The book value only methodology for computing leverage is particularly diffused in standard banking practices to determine the merit of SMEs in terms of credit. In the case of unlisted companies (as SMEs generally are), such an approach cannot be mitigated by the evidence from comparable market values of equity. This overestimates the leverage ratio and reduces capital attraction, while regulatory approaches such as the Basel II Accord and the forthcoming Basel III tend to exacerbate this bias. This status of artificial capital rationing generates a paradox: the stronger the constraint to adopt book values, the higher the computed leverage and the lower new capital allowances. Companies are then forced to restructure their liabilities by adding new equity and using flows to pay
78 Journal of Accounting and Finance Vol. 15(3) 2015
back the existing debt rather than investing to improve corporate performance. In this way, (asset side) value creation is missed as the most powerful tool to control the leverage explosion!
This paper suggests that debt quality matters too and that debt maturity is one of the inner qualitative points of the capital structure analysis. At the corporate level, the maturity mismatch results in widespread unexpected risk. Shortening the maturity of financial liabilities incentivizes more liquid asset investments, usually those that are less productive. At the same time, the shorter the maturity of debt, the higher the probability of corporate default, given the duration of the assets. Since the seminal work of Modigliani and Miller (1958), the qualitative duration of debt has been neglected in favor of considering irredeemable debts (i.e., consols): debt is supposed to perpetuate according to the quality of assets. This means that the duration puzzle of the debt is supposed to be solved by financial markets through their perfect efficiency and completeness – very far away from true in the case of private companies, particularly SMEs. Even the best financial advisory practices are no exception to the above theoretical bias: both in the case of book value analysis, as the debt-to-equity ratio computation is usually not distinguished by debt maturity, and market value levels, as the practice of deleveraging beta usually supposes debt to be perpetual.
Only very recent approaches have demonstrated that by arranging the qualitative profiles of debts it is possible to relate the impact of debt maturity to corporate performance (e.g., Harris and Raviv 1991). Vice-versa, some drivers of corporate performance seem to impact maturity choices, as Guedes and Opler (1996) demonstrate for a wide range of bonds and notes. A seminal work by Leland and Toft (1996) rules out that debt maturity is a driver of the leverage puzzle due to “endogenous bankruptcy” (i.e., an agency approach to risk sharing). Hence, the two-fund separation theorem is overcome by considering debt quality through its maturity.
Leland and Toft’s (1996) approach is the starting point in this paper to gain a better understanding of whether: (i) there is a particular relationship between debt maturity and firm performance; (ii) SMEs have special requirements according to the qualitative profile of their financial debts; (iii) it is possible to increase competitive performance by adjusting the maturity of debt.
The paper is organized as follows. In section 2, a review of the possible drivers of corporate debt maturity is presented according to the suggestions in the financial literature. Possible differences in corporate debt maturity characterizing SMEs are also focused on in this section. In section 3, a model based on Leland and Toft’s (1996) approach is proposed to capture the determinants of debt maturity in private unlisted companies, particularly SMEs. Section 4 deploys some empirical evidence from the Italian case, as the high density of fully private/unlisted SMEs makes Italy an optimal forum in which to test the model. Section 5 concludes by proposing improvements to financial practice and further research activities.
THE DEBT MATURITY PUZZLE: A LITERATURE REVIEW
The capital structure puzzle has been analyzed in considerable depth in the literature; the main focus has always been to discover the determinants of the debt-to-equity ratio. This focus has represented the strength of the research (being very practical), but at the same time is the source of its weakness (it does not consider the qualitative aspects of the puzzle). The maturity of debt is one of the topics analyzed most recently, both in terms of exogenous determinants such as the maturity structure of Government Bonds (see, e.g., Greenwood, Hanson, and Stein 2010), and in terms of endogenous drivers such as corporate risk, as shown by Leland and Toft (1996) in their seminal paper. The debt maturity puzzle is usually made up of four questions, each of which is addressed in turn below.
RQ1: is there any special relationship between debt maturity and capital structure?
The initial question concerning debt maturity was posed by Flannery (1986). He finds that if capital market investors and firm insiders possess the same information about a company's prospects, its liabilities will be priced so that the firm is indifferent to the composition of its financial liabilities (at least
Journal of Accounting and Finance Vol. 15(3) 2015 79

under certain, well-known circumstances). However, if firm insiders are systematically better informed than outside investors, they will choose to issue those types of securities with maturity that the markets overvalue the most.
The existence of the relation discussed here is initially considered in Leland (1994). He examines debt values and capital structure in a unified analytical framework and derives closed-form results for the value of long-term risky debt and for optimal capital structure. In particular, he develops an original closed-form solution for the value of debt and for optimal capital structure when the firm asset value follows a diffusion process with constant volatility. The results indicate that collateralized debt values and unprotected investment-grade debt values behave very close to what is expected by the model. Unprotected junk bonds exhibit quite different behavior. In this paper, Leland does not depict the endogenous bankruptcy model, even if his conclusions concerning bond protection are coherent with further papers proposing it. The complete model of endogenous bankruptcy is proposed in Leland and Toft (1996). In this article, they examine the optimal capital structure of a firm that can choose both the amount and maturity of its debt. Bankruptcy is determined endogenously. The paper develops a model of optimal leverage and risky corporate bond prices for arbitrary debt maturity. An empirical model is presented to support the theoretical premise.
A possible evolution of the Leland and Toft (1996) model is presented by Hilberink and Rogers (2002). The authors aim to demonstrate that credit spreads do reach zero as maturity approaches zero; the results are consistent with suggestions from practice. They take Leland’s (1994) approach for a firm with a constant debt structure and extend it by incorporating downward jumps in the value of the firm’s assets. They find that the different behavior of the yield spreads at zero is the principal point of difference between Leland’s conclusion and theirs. The results are qualitatively similar, even if the authors use a “delicate” model without a specific panel of firms.
More recently, Chen and Kou (2009) have analyzed the endogenous bankruptcy puzzle and propose a two-sided jump model for credit risk by extending Leland’s original model. Their new model shows that jump risk and endogenous default can have a significant impact on credit spreads, optimal capital structure, and the implied volatility of equity options. The authors give a proof of a version of the smooth-fitting principle under the jump model, justifying a conjecture first suggested by Leland and Toft (1996) under the Brownian motion.
RQ2: is there any particular link between debt maturity and operating performance?
Harris and Raviv (1991) present a deep and systematic analysis of the “state of the art” in the academic evolution of research concerning capital structure and the non-applicability of Modigliani and Miller’s (1958, 1963) approach. Harris and Raviv’s (1991) paper surveys capital structure theories based on agency costs, asymmetric information, product/input market interactions, and corporate control considerations. The authors uncover the inner implications of the models surveyed, and all these results are collected and compared to the available evidence.
In Whited (1992), the possibility of specific behavior decisions for debt maturity are determined. The paper presents evidence that problems of asymmetric information in debt markets affect unhealthy firms’ ability to obtain outside finance, and consequently their allocation of real investment expenditure over time. Berens and Cuny (1995) point out that a firm’s value typically reflects its growing stream of earnings, while current debt reflects the non-growing stream of interest payments. A proof of this hypothesis can be found in the empirical analysis of their paper, which shows how nominal firm growth (i.e., inflation plus real growth) distorts the debt ratio and the measure of tax shielding.
The relation between business performance and debt maturity is examined in particular depth in Guedes and Opler (1996), who show that corporate performances impact maturity choices by analyzing a wide range of bonds and notes, and Ozkan (2000), who provides an empirical analysis of the determinants of a firm’s debt maturity structure for a sample of 429 UK firms. The evidence provided supports the hypothesis that firms with greater growth opportunities embedded in their investments tend to use short-term debt. Furthermore, larger firms have more long-term debts. Less support is provided for the view
80 Journal of Accounting and Finance Vol. 15(3) 2015

suggesting the use of corporate debt maturity to signal information to the market; there is no clear evidence for a negative correlation between taxes and debt maturity. The results also suggest that firms have long-term target ratios and adjust to the target ratio relatively fast.
Yi (2005) suggests that firms need to choose both the debt-to-equity ratio and the maturity of their debts to achieve the optimal capital structure. In this paper, the author reviews the various theoretical and empirical studies related to debt maturity structure and classifies the theoretical models of debt maturity structure into four groups. He analyzes the relationship between debt maturity structure and other features, and he finds that only agency problems can be solved by maturity choices. Other puzzles, such as signaling effects, tax effects, and debt valuation, cannot be explained by maturity choices.
RQ3: does company size matter in the two previous relations?
Hoven-Stohs and Mauer (1996) propose an approach to debt maturity that differs from that of Leland and Toft (1996). They find that larger companies with less risky and longer maturity assets prefer use more long-term debt than others. There is an inverse relation between the effective tax rate and the maturity of the debt. An inverse relationship is even found between the unexpected events related to earnings and the maturity of the debt, as is clear evidence of the existence of an inverse relationship between the duration of debt and growth opportunities, with companies rated very high or very low using more short-term debt.
The issue of adverse selection is particularly analyzed in Goswami (2000). Although the research relates to larger companies rather than SMEs, it indicates the optimality of short-term financing as a vehicle for mitigating the adverse selection problem. The author considers the impact of information asymmetry regarding the maturity structure of cash flows on the debt maturity decision. He also shows that adverse selection may induce some mismatching of debt maturity and asset maturity when transaction costs are significant. When firms have private information regarding the maturity of the firms’ assets, the choice of long-term debt is the dominant financing mode to dilute the impact of transaction costs. The author models the effects of informational asymmetries concerning asset maturity on the debt maturity choice in a very similar concept to endogenous bankruptcy. Firms with investment opportunities that have a positive net present value project generating cash flows only at the end of the time period analyzed. The theoretical results are supported by the empirical findings.
Berger et al. (2006) analyze panel data on over 6,000 commercial loans to small businesses from 53 large U.S. banks. They test the implications of Flannery’s (1986) model concerning the effects of risks and asymmetric information in determining debt maturity. Berger et al. (2006) find that the low-risk firms included in the panel tend to have significantly shorter debt maturities than other firms and these maturities tend to increase significantly when informational asymmetries are reduced. The latter result also suggests a strong quantitative role for asymmetric information in the determination of debt maturity. High-risk firms do not have significantly different maturities than intermediate-risk firms.
As far as the Italian context is concerned, Magri (2006) tests different theories concerning debt maturity. The equilibrium share of debt maturity is positively influenced by firm size, tangible assets and age. In Italian firms, debt maturity is inversely correlated to leverage.
RQ4: is there a tax bias in choosing debt maturity?
Since Modigliani and Miller’s (1958) work, tax distortion has been recognized as a determinant of capital structure choices. Several authors cited in the previously reported literature have sought a definitive conclusion on this issue, but their findings are usually redundant. This paper makes another attempt aims to investigate the possible effect of tax distortion and find possible relationships with capital structure choices, particularly concerning the connection between firm size and the tax shield value.
Journal of Accounting and Finance Vol. 15(3) 2015 81

PROPOSAL OF A MODEL TO SUPPORT CORPORATE DEBT MATURITY POLICIES
The maturity of any funding solution is truly irrelevant only in a very efficient and complete financial system. In this case, corporations are simply required to be selectors of investment projects with a positive net present value. Then, the financial markets will solve any duration mismatching in cash flows by funding the required gap. In analytical terms, this means that the present value of corporate assets equals the sum of any contingent financial claim as depicted in equation (1). The only constraint is V>B in order to avoid the default zero.
= + subordinated to >
where: V = the enterprise value; B = the debt value; S = the equity value.
V, B and S are the present values of any possible mix of expected free cash flows satisfying the V>B constraint. This means that no special restrictions are required either for cash flows or time maturity as explained in equation (2):
(1 + )=
(1 + )+
(1 + ) , , >
where: FCFO denotes the free cash flows from operations, FCFD the cash flows for debt service, and FCFE the free cash flows to equity; k = the weighted cost of average capital (WACC); rd = the cost of debt capital; re = the cost of equity capital.
Debts are negotiated according to their capability to reduce the cost of capital. Debt maturity is irrelevant as the absolute quantity of debt is fixed (at B). The mathematics of this are shown in equation (3) in the case of two maturity horizons:
= (1 + )
=(1 + )
+1 +
> and [min( )]
where: rx = the cost of debt capital in the first stage (1< t y = the cost of equity capital in the second stage (t > x).
I refer to this approach as an extended Modigliani and Miller (M&M) model, as it adds the irrelevance of the maturity of debt (i.e., a debt quality component) for the value of corporate investmentsto the irrelevance of the quantity of debt (i.e., leverage ratio). According to this approach: (i) the debt maturity puzzle is solved by the markets; (ii) transaction costs (including taxes) are irrelevant in relation to the capital structure and no maturity arbitrages are given; (iii) the probability of default is exogenous, i.e., it is driven only by the business risk that could drive V below B. The cost of debt (rd) is related only to the probability of default as reported in equation (4):
= [prob( < )] = [var( )]
where: var(V) is the variance of the value of corporate assets.
Herein, the separation theorem is fully applied: no financial policy can impact the enterprise value. In fact, the enterprise value pre-exists any decision, whereas choices about quantities in capital structure (i.e., debt-to-equity ratio) and qualitative capital structure decisions (i.e., debt maturity) are driven only by arbitrage opportunities (i.e., no impact from adjusting or agency costs). Even corporate size has no
(4)
(3)
(2)
(1)
82 Journal of Accounting and Finance Vol. 15(3) 2015

consequences for capital structure decisions. This is indeed an ideal model, but I shall refer to it in the further analysis to focus on the main gaps versus reality.
---§--- Market inefficiencies can exert an impact on true capital structure decisions, so the irrelevance of debt
maturity must be reconsidered, just as in the orthodox M&M approach. Information asymmetries, transaction and agency costs, the probability of default and the bargaining power of small companies may link business value and debt maturity.
The case of information asymmetries is the easiest to formalize. Debt funders prefer to add higher information risk premia to the cost of debt capital funding less predictable cash flows. The higher risk premium in the case of longer maturities (Mantovani 2011) tends to shorten the duration of debt and to increase liquidity constraints. Moreover, WACC increases because of the higher embedded risk premium and the default probability, a direct consequence of the higher probability of a mismatch between corporate cash flow and cash required for the repayment of debt (i.e., FCFO<FCFD).
Returning to the two maturities model depicted in equation (3) and supposing the second horizon to be hit by higher information risk, the value of B is defined by equation (5):
=(1 + )
=(1 + )
+(1 + + )
If the information risk premium (IRP) is positive, *
dr >rd will always be true. Accordingly, the only
way to compress rd is to reduce the overall debt duration by lightening the weight of the debt of the second period. Given a fixed IRP according to a specific level of market risk aversion, the overall duration should possibly reduce to the first time horizon.
This impacts the capital structure, reducing B to the lower B* level, alternatively through: (i) the reduction of the quantity of debt (i.e., the B/S ratio) so that V>B* and an optimal default probability is restored; (ii) the reduction of debt maturity in order to pay the lowest cost of debt (rd rx), but at the same time increasing the probability of default generated by a mismatch in cash flow (i.e. FCFO<FCFD) in the x-horizon; (iii) payment of higher interest rates in longer maturity debt and a higher probability of default due to a mismatch of cash flow on the y horizon. An increase in WACC will follow for all previous solutions, together with further impacts due to agency problems. True managerial behavior, such as underinvestment, “milking” solutions and efficiency rebounds of corporate operating costs due to the debt burden could impact WACC through the emergence of indirect bankruptcy costs.
The transaction costs could be relevant. A larger dimension of the transaction could dilute the real incidence of costs in arranging the negotiation, as some of these costs are unrelated to the total amount and are mainly committed to other spent resources, such as time (e.g., legal costs), the number of transactions (e.g., fixed taxes), etc. This contributes to the generation of a size-specific capital rationing effect that may impact WACC, particularly for SMEs. For these firms specific information asymmetries usually contribute to increase the absolute level of transaction costs, increasing even more the previously depicted effects over debt maturity.
Company size can determine bargaining power in financial transactions. Bigger companies could prefer to obtain short term debt in order to reduce interest payments and to exploit their bargaining power. Such bargaining power could be generated by real business performance. Better return-to-risk companies could benefit from maturity reduction and even use the debt maturity policy to signal their strength to financial markets.
In terms of equation (4), we conclude that:
= [ ; prob( < )] = [ ; / ; var( ) ; ; ] (6)
(5)
Journal of Accounting and Finance Vol. 15(3) 2015 83

I refer to this as the Harris and Raviv (H&R) approach as these two authors (in 1991) made a greater contribution to resolving the puzzle.
---§--- None of the previous models consider relations between asset volatility and capital structure decisions
because they assume that default may arise from Var(V), which pushes V below B, and the consequent decision of creditors to ask a Court to decree the company in default. Var(V) depicts only the exogenoussources of the risk of corporate default. In fact, endogenous sources are considered in Leland and Toft’s (1996) approach (L&T).
In their model, endogenous bankruptcy occurs when the shareholders decide to generate a company default by aborting the equity contribution to hedge the mismatch in corporate cash flows. This decision might arise each time the FCFO is insufficient to cover the due FCFD; the equity owners could avoid contributing the difference if the expected corporate return on equity (ROE) is lower than the equity cost of capital. Please note that this condition could happen even if V>B (i.e., without the exogenous default conditions).
The L&T approach can be formalized in relation to equation (2) considered from the flow-to-equity view and supposing that at time t=x the conditions for endogenous bankruptcy are deployed (but V>B):
=(1 + )
=(1 + ) (1 + )
=
=(1 + )
+(1 + )
+(1 + ) (1 + )
+(1 + )
+(1 + )
New equity capital will flow to the company if and only if equation (8) is satisfied at time x:
= =(1 + ) (1 + )
=(1 + )
0
Debt maturity design contributes to reducing endogenous bankruptcy because of the control of the mismatch in cash flow. The previous equations can be synthesized considering a threshold level of the enterprise value (V*) under which the endogenous bankruptcy occurs. Such a value must also be compared to the par value of debt (D). If V* is very much below D, as represented in (9), it is possible that endogenous default will be avoided:
< <
In fact, a low level of V* will still incentivize equity owners to fund the company given a certain level of debt-to-equity ratio and of debt maturity. Please note that default is avoided even if the potential condition (V<D) is deployed, and the longer the debt maturity, the more likely this situation. If the debt maturity of D reduces to zero, endogenous bankruptcy could take place even in the case of V>D, should
the S be insufficient in terms of acquired potential flow to equity as depicted in equation (8).
INSIGHTS INTO DEBT MATURITY: THE ITALIAN CASE
This study tests the actual capability of the above models to detect the determinants of corporate debt maturity through an empirical analysis of a sample made up of Italian corporations. The choice of the Italian economic system is due to the high incidence of “fully private SMEs” (including family firms) within the economic system and the relevance of high growth companies among these. This empirical research is constrained by the prescription of the Italian Law, which states that only incorporated
(9)
(8)
(7)
84 Journal of Accounting and Finance Vol. 15(3) 2015

companies have to submit their annual financial statements in the Official Public Registry, a regulated public database. Sole entrepreneurs and partnerships are not obliged to do so. Nevertheless, for the smallest companies, it is mandatory to provide financial statements to the tax authorities, whereas it is necessary (only) to disclose statements to banks. Neither tax authorities nor banks can disseminate subjective corporate data due to the restrictions of the Italian Data Protection Law; they can only provide aggregate data. Very small firms represent a huge quota of Italian entrepreneurial activities, but being outside the scope of duties of the Official Public Registry cannot be analyzed hereafter. According to the European Law, mandatory financial statements are differentiated in the case of smaller companies, which are entitled to deploy simplified annual reports (i.e., short-form) rather than the full report. As per corporate liabilities, the short-form statements do not split analytic figures for commercial and financial debts. These figures are only indicated in the annex, which is usually not included in the public electronic database. When transparently reported, debts are split in terms of their maturities into three categories: less than one year, one to five years, and more than five years. As commercial debts usually have shorter maturities, the analysis here should not be biased by this limitation in the Official Public Registry database.
The sample was sourced from the AIDA Bureax Van Dijck database, which includes the main Italian company profiles obtained from the (compulsory) Official Public Registry. The sample was selected according to three main characteristics of the companies: (1) they had a turnover in 2009 greater than two million euros; (2) they had a continuous track of financial reports for the fiscal years 2005–2009, thus including 2008, the year of the financial crisis, to avoid any sample bias due to the crisis; (3) they prepared full financial reports in any of the fiscal years considered. No particular restrictions were included for manufacturing industries. The resulting sample is made up of 489 companies, each showing five figures for any data, i.e., 2,445 observations. This number is small if compared to the total amount of Italian companies. The enormous cut in figures is a direct consequence of the condition of having detailed financial statements for the entire five-year time horizon, a necessary condition to have data concerning the maturity composition of the financial debts.
For each of the 489 companies included in the sample, we focus on the debt maturity structure by splitting out the total amount of financial liabilities (TFL) between debts that mature within the next fiscal year (TFLST) and those that mature over (TFLLT) (1). A synthetic index of the maturity structure of the debts is computed according to equation (12):
=+
Finally, we compute the survival ratio of the 489 companies according to the inclusion of the 489 companies in the same database at the end of 2011. At that time, 462 companies from the sample were still “active,” while 27 companies (5.52% of the entire sample) were no longer included in the database due to liquidation or bankruptcy. The empirical analysis is then conducted by comparing the evolution of “W” in the two subsets (462-active and 27-lost) to verify, ex-post, the true potential impacts of the debt maturity drivers in the two sets of companies with different survival capabilities.
RQ1. The Impact of Debt Maturity on the Leverage Ratio
First, the relation between debt quality (i.e., W) and debt quantity (i.e., L) is examined through a simple linear regression for the entire set. To avoid any scale and inflation bias, leverage is considered to be the ratio between the total amount of financial debts (TFL) and corporate turnover (REV) as shown in equation (13):
= (13)
(12)
Journal of Accounting and Finance Vol. 15(3) 2015 85

The choice of this particular configuration of L is also due to the decision to avoid relying on equity as it can strongly diverge from its market value, thus biasing the computed leverage. This evidence is particularly true when: (i) SMEs have particular relevance in the sample (as in the Italian case); (ii) intangibles and human capital can significantly determine the value of shares (as in the case of growing SMEs); (iii) accounting principles are fragile in determining the value of growth opportunities (as in the European rules).
Table 1 depicts the regression results for the entire sample. The evidence is clear: the extended M&M approach seems to be true as no significant relations emerge (R-squared is next to zero).
TABLE 1
REGRESSION OF W OVER L: RESULTS FOR THE ENTIRE SAMPLE
Coefficient Std. Error t-Statistic Probability
Constant 0.246695 0.013334 1.850.114 0
Slope 0.000125 0.000445 0.281251 0.7786
R-squared 0.000162 Mean dependent variable 0.246986
Adjusted R-squared -0.001891 S.D. dependent variable 0.293691
S.E. of regression 0.293968 Akaike info criterion 0.393392
Sum squared residual 4.208.524 Schwarz criterion 0.410538
Log likelihood -9.418.424 Hannan-Quinn criterion 0.400126
F-statistic 0.079102 Durbin-Watson statistic 1.692.000Probability (F-statistic) 0.778637
The regressive model in Table 1 is unsupportable: neither the slope coefficient nor the equation as whole depict low probabilities of the rejection of results. The evidence depicted in Table I could be biased by the methodological choices of the L computation. In fact, companies that generate profits mainly through capital gains in their assets (i.e., real estate and building societies) could show a very high L index because of low revenues. Within the 489 sample, we observe:
12 companies (2.45% of the sample) have L
50 companies (10.22% of the sample) have 1.00<L<10.00 (average=2.67);
57 companies (11.66% of the sample) are unlevered (L=0 and W=0).
Table 2 presents the regression results for the 439 (=489-50) companies for which L<1, the typical critical threshold of the leverage ratio that Italian banking practices consider.
The empirical evidence in the case of Table 2 is also clear, but opposite to that in Table I: strong relationships now emerge. Indeed, R-squared is at the 0.13 level and would be even lower (to 0.08) should we exclude the L=0/W=0 cases. The supportability of the entire regression now becomes very strong; all the probabilities for rejection are zero levelled (the same would occur in the case of the exclusion of the L=0/W=0 cases). The evidence from Tables I and II let us conclude that the quantity of debt (L) is indeed influenced by maturity quality (W), but this happens mainly in an indirect way. In fact, the gap in the supportability of the regressions in the two tables let us conclude that the relationship exists only in the case of company profits driven by sales (i.e., those having a higher exogenous bankruptcy risk). For those companies with incomes driven by capital gains (i.e., those with higher endogenous risk), the relation does not fit.
86 Journal of Accounting and Finance Vol. 15(3) 2015

TABLE 2
REGRESSION OF W OVER L: RESULTS FOR L<1
Coefficient Std. Error t-Statistic Probability
Constant 0.131622 0.016506 7.973.931 0
Slope 0.450717 0.05423 8311245 0
R-squared 0.136495 Mean dependent variable 0.222981
Adjusted R-squared 0.134519 S.D. dependent variable 0.277333
S.E. of regression 0.258006 Akaike info criterion 0.132879
Sum squared residual 2.908.987 Schwarz criterion 0.151487
Log likelihood -2.716.698 Hannan-Quinn criterion 0.140221
F-statistic 6907679 Durbin-Watson statistic 1.955.283Probability (F-statistic) 0
---§--- The time evolution of W is then examined for the two subsets. Table 3 depicts the paths of the
average W together with their standard deviations.
TABLE 3
TIME PATH OF W
2005 2006 2007 2008 2009
462-active subset
average W 46.43% 44.18% 42.06% 50.72% 49.48%
std. deviation 33.84% 33.45% 33.52% 32.51% 32.26%
27-lost subset
average W 50.92% 41.40% 41.68% 45.91% 37.03%
std. deviation 21.03% 28.48% 22.18% 25.99% 23.72%
According to Table 3, the 462-active firms show time-stable weights (W) for long-term financial debts. This changes from 46.43% in 2005 to 49.48% in 2009; the standard deviations are constant round 33%. In the same period, figures of the 27-lost group decreased from 50,92% (i.e., higher than the other group) to 37.03% (i.e., considerably lower than the other group). The standard deviations are still stable for this second subset, but the level is approximately 22%, i.e., approximately two thirds that of the main group.
All the above data are statistically significant. Such empirical evidence suggests that when a company is approaching liquidation, its founders prefer to shorten debt duration, but the stable standard deviations (and the gaps between the data of the two subsets) invite further analysis. Table 4 reports more detailed descriptive statistics for W evolution over time, showing the frequencies of companies that have increased and decreased W values over the entire the time horizon of the analysis; the frequency of companies with zero-W evidence is reported separately. The results are unexpected.
Journal of Accounting and Finance Vol. 15(3) 2015 87

TABLE 4
SAMPLE AND SUB-SAMPLE STATISTICS
Set
active lost Complete
A Increasing W corporations 117 9 126
% 25.32% 33.33% 25.77%
B Reducing W corporations 161 5 166
% 34.85% 18.52% 33.95%
C Zero W corporations 123 7 130
% 26.62% 25.93% 26.58%
B+C Short-term maturity-based corporations 284 12 296
% 61.47% 44.44% 60.53%
D Corporations with insufficient data 61 6 67
% 13.20% 22.22% 13.70%
Total 462 27 489
The 462-active group includes 61 companies (13.20%) that did not declare enough data to complete the computations and are thus excluded from the analysis. The remaining 401 companies include 123 companies (26.62%) that had no long-term debt at all (W=0), 161 companies (34.85%) that reduced W in the five-year period, and 117 companies (25.31%) that increased the relative weight of long-term debt in the 2005–2009 period.
The 27-lost group includes six companies (22.22%) that did not declare enough data to complete the computations and thus are excluded from the analysis. For the remaining 21 companies, seven firms (25.93%) had no long-term debt at all, five companies (18.52%) reduced W, and nine companies (33.33%) increased the relative weight of long-term debt.
Statistics for the two subsets show clear homogeneous evidence only for the no long-debt companies (26.62% vs. 25.93%). Hence, it is intriguing to observe that the “active” group has a higher frequency of W-decreasing companies (34.85% vs. 18.52%). Furthermore, the 27-lost group reports a higher frequency of W-increasing companies (33.33% vs. 25.31%). The overall evidence is then redundant as the frequencies in Table 4 do not prove the time evolution of average-W in the two subsets as reported in Table 2 (showing the opposite average trend). This means that there is something more related to the impending disappearance of the company that may impact the maturity choices actually adopted by these firms.
---§--- As a third point in the capital structure puzzle, proposition II in the M&M model is verified. A
regression between W and the ROE and the tax burden at the corporate level ( ) was run, but gives no significant results.
RQ2. The Impact of Debt Maturity on Corporate Performance
According to the endogenous bankruptcy hypothesis, the longer the debt maturity the stronger the corporate performance should be. In fact, longer maturity should entitle companies to engage in long-term investments, i.e., those with higher return-to-risk ratios. Moreover, longer maturity allows duration matching between operative cash flows and those of debt servicing. Such a prescription is coherent with the average statistics of the 27-lost subset, as reported in Table 4: the reduced weight of long-term debt for such companies may indeed anticipate their exit from the database by 2011. However, the conclusions of the same model are not consistent with the evidence from the frequencies: Why can one third of them increase the W quota? The explanation might be found in those theoretical approaches suggesting that
88 Journal of Accounting and Finance Vol. 15(3) 2015

strongly performing companies prefer to shorten their debt maturity to reduce the cost of debt capital and to negotiate new bank relationships at their convenience.
This is why we investigate the relationships between the relative weight of long-term debt and the business performance for the entire sample according to three performance indicators:- The return on capital (ROC), computed as the ratio between the operative income (EBIT) and the
operative invested capital, net of the commercial debts. We deduct the commercial debts from the operative invested capital to detect the amount of capital requirements to be funded by equity and financial debts. In the Italian case, the working capital strongly increases the need for operative capital (on average, it doubles financial needs), and commercial debts have strong relevance in hedging working capital absorption;
- The return on sales (ROS), computed as the ratio between operative income (EBIT) and corporate revenues. This indicator is less dependent on the accounting standards adopted by the company to compute the operative investments. Moreover, better than others, it lets us understand the business model of the company at the commercial level (i.e., without considering capital rotation). The reduction in ROS should indicate more liquid (i.e., short-term) financial requirements;
- The added value per worker (AVW), computed as the ratio between the company added value (being the EBITDA plus the cost of wages) and the number of people employed in the company. Such an indicator contributes to better understanding of the “value for money” of the production proposed by the business model of the company. The higher the AVW the longer should be the duration of the investments.
All of these being one-period indicators, the results are controlled using the evidence concerning the growth ratio of revenues for the entire five-year period, i.e., 2005–2009.
Table 5a shows statistics for the 27-lost companies. For each of the three clusters reported in Table 5, it reports the frequency of companies according to the number of improved indicators. The 27-lost group seems to support the extended M&M approach: half the companies that allow W computation do not improve on any performance indicator (11 to 21). The same is the case for firms with insufficient data (3 to 6).
TABLE 5
STATISTICS ON LONG-TERM CORPORATE PERFORMANCE
5a the "27-lost" sub-sample
# of increased performance indicators
0 1 at least 1 2 3 27-lost
A Increasing W corporations 6 3 1 1 1 9% 22.22% 11.11% 3.70% 3.70% 3.70% 33.33%
B Reducing W corporations 2 3 1 2 0 5% 7.41% 11.11% 3.70% 7.41% 0.00% 18.52%
C Zero W corporations 3 4 2 0 2 7% 11.11% 14.81% 7.41% 0.00% 7.41% 25.93%
B+C Short-term maturity-based corporations 5 7 3 2 2 12% 18.52% 25.93% 11.11% 7.41% 7.41% 44.44%
D Corporations with insufficient data 3 3 1 2 0 6% 11.11% 11.11% 3.70% 7.41% 0.00% 22.22%
Total14 13 5 5 3 27
51.85% 48.15% 18.52% 18.52% 11.11% 100.00%
Journal of Accounting and Finance Vol. 15(3) 2015 89
5b the "active" sub-sample
# of increased performance indicators sample
0 1 at least 1 2 3 active
A Increasing W corporations 21 96 39 28 29 117% 4.55% 20.78% 8.44% 6.06% 6.28% 25.32%
B Reducing W corporations 35 126 55 37 34 161% 7.58% 27.27% 11.90% 8.01% 7.36% 34.85%
C Zero W corporations 25 98 44 31 23 123% 5.41% 21.21% 9.52% 6.71% 4.98% 26.62%
B+C Short-term maturity-based corporations 60 224 99 68 57 284% 12.99% 48.48% 21.43% 14.72% 12.34% 61.47%
D Corporations with insufficient data 19 42 23 13 6 61% 4.11% 9.09% 4.98% 2.81% 1.30% 13.20%
Total100 362 161 109 92 462
21.65% 78.35% 34.85% 23.59% 19.91% 100.00%
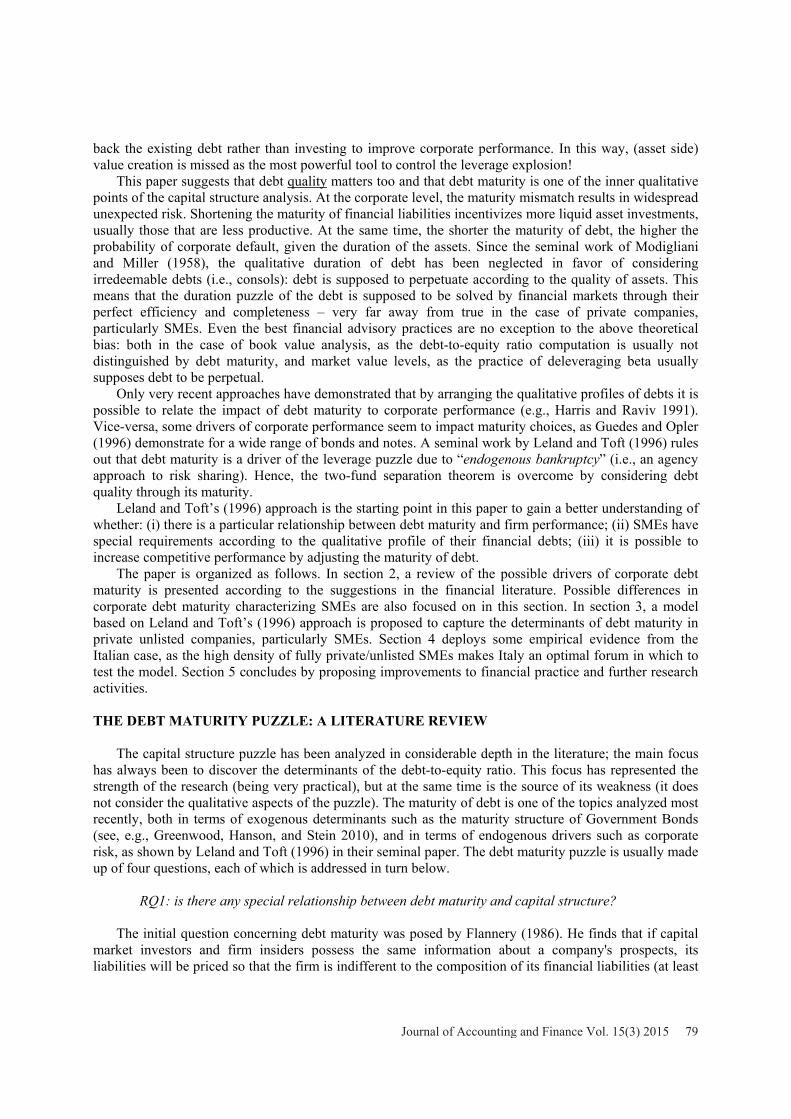
A more careful analysis of Table 5 shows clear, but unexpected, evidence for this subset: operating performance is related to debt maturity… but in the opposite direction than expected by the endogenous bankruptcy hypothesis! In fact, (i) the worst performing companies (i.e., those that do not improve on indicators) are mainly concentrated in the W-increasing group (6 to 11); (ii) 10 companies with increased performance typically reject long-term debt (4 companies) or reduce it (6 companies). This second point proves the alternative theory stating that shorter debt maturities are chosen in the case of stronger operative performance due to the higher bargaining power of such companies in the financial markets.
In Table 5b, the frequency of companies improving on at least one indicator is 78.35%. The reduced incidence of the declining performance firms (21.65%) is consistent with the survival constraint used to choose the group. Other aspects of the empirical evidence are of interest:
- 82.05% of the 117 companies increasing debt maturity (i.e., 96 firms) improve their operating performance during the period 2005–2009;
- 78.26% of the 161 companies decreasing debt maturity (i.e., 126 firms) improve their operating performance in the same period;
- 79.67% of the 123 companies with no long-term debt (i.e., 98 firms) improve their operating performance in the same period;
- 68.85% of the 61 companies with insufficient data to compute W (i.e., 42 firms) improve their operating performance in the period analyzed.
The 462-active subset seems to support the L&T approach: the best performers tend to increase their debt maturity to support the sustainability of their business model. However, information risk due to disclosure strategies (Bagnoli and Mantovani 2013) emerges: unclear reports reduce the opportunity to acquire long-term debt. According to Bagnoli and Mantovani (2012), information risk is higher in the case of strong growth opportunities. This is why the information risk bias is controlled in Table 4, splitting the results in Table 5 according to the growing ratios of revenues.
90 Journal of Accounting and Finance Vol. 15(3) 2015

TABLE 6
GROWTH RATIO OF REVENUES
462-active group 27-lost group+W
-W
+W
-W
average five-year growth 29.21% 17.58% 13.11% 18.44%
Frequency of growth… # % # % # % # %
<0% 21 17.95% 57 20.07% 5 55.56% 2 16.67%
0–20% 59 50.43% 139 48.94% 1 11.11% 6 50.00%
25–50% 14 11.97% 44 15.49% 2 22.22% 3 25.00%
50–100% 12 10.26% 27 9.51% 1 11.11% 1 8.33%
>100% 9 7.69% 12 4.23% 0 0.00% 0 0.00%
n.c. 2 1.71% 5 1.76% 0 0.00% 0 0.00%
total 117 100.00% 284 100.00% 9 100.00% 12 100.00%
The five-year average growth of the 462-active subset is higher for the W-increasing companies, outperforming the W-decreasing firms (29.21% average growth vs. 17.51%). This result is expected, but unexpectedly, the opposite emerges in the 27-lost subset (13.11% vs. 18.44%). This evidence suggests a fourth theoretical approach to explain W policies: increasing debt maturity is a way to reduce default probability… and to shift the endogenous bankruptcy choice from equity to debt! This is an
unexpected use of the L&T proposal but very consistent with the evidence in the previous tables, particularly as far as the following are concerned: (i) the redundancy of the frequencies in Table 4 vs. the time evolution of average W reported in Table 2; (ii) the results in Table 5a concerning the worst performing companies in the 27-lost subset, which increase W, thus inverting the relation between debt maturity and operating performance.
RQ3. The Relation Between Company Size and Debt Maturity
Table 7 reports statistics related to the company dimension vs. changes in W.
TABLE 7
SIZE DIMENSION OF THE SAMPLE
462-active group 27-lost group+W
-W
+W
-W
Revenues # % # % # % # %
EUR 2–10 million 51 43.59% 102 35.92% 5 55.56% 4 33.33%
EUR 10–25 million 37 31.62% 94 33.10% 3 33.33% 7 58.33%
EUR 25–50 million 14 11.97% 42 14.79% 1 11.11% 1 8.33%
over EUR 50 million 15 12.82% 46 16.20% 0.00% 0.00%
Total 117 100.00% 284 100.00% 9 100.00% 12 100.00%
The evidence is particularly strong: W-increasing companies are mainly SMEs (i.e., with annual revenues lower than 25 million euros). In the 462-active group 75.21% of the 117 W-increasing companies are SMEs (i.e., 88 units); micro-firms (with annual revenues of less than 10 million euros) comprise 43.59%. The incidence of SMEs in the W-reducing companies is 69.01% (196 units vs. 284), while micro-firms represent 35.92%. Similar results can be found in the 27-lost subset, with eight SMEs increasing W for a subset of nine units and 11 SMES decreasing W for a subset of 12 units.
Journal of Accounting and Finance Vol. 15(3) 2015 91

The huge number of small companies per capita that have recourse to longer debt maturity is not proved by the capital flow figures. Table 8 compares average W computed for the entire 489 sample by weighting either the absolute company frequency or the relative debt capital figures.
TABLE 8
W EVOLUTION IN THE FIVE YEARS OF ANALYSIS
W
2009 2008 2007 2006 2005
Capital average 48.88% 50.43% 42.04% 44.02% 46.70%
Per capita average 29.76% 28.99% 30.37% 29.30% 29.19%
The evidence is clear: The long term trend of W is similar, but higher flows of long-term debts are allocated to large companies even if the (per capita) number of contracts is more diffused in small companies. This evidence suggests a couple of conclusions: (i) the transaction costs of financial contracts over-impact the convenience of negotiating longer maturity debts; (ii) the Italian case depicts a clear crowding-out effect in the capital allocation of longer maturity debt between SMEs and other larger companies. Both conclusions can be proved by the concentration curve of both short maturity (TFL_BT) and long maturity (TFL_MLT) debts in Figure 1.
FIGURE 1
CONCENTRATION OF CORPORATE DEBTS
The high concentration of short maturity debt confirms the impact of transaction costs diverting capital from SMEs; meanwhile the even higher concentration of long maturity debt supports the crowding-out effect that benefits bigger companies. At this point, the quest is to find out whether such a concentration is due market inefficiencies (transaction costs matter) or to performance gaps (performance opportunities, like growth, matter). The first case should confirm the extended M&M approach, whereas the second would support the L&T approach.
92 Journal of Accounting and Finance Vol. 15(3) 2015

Table 9 depicts the average W for the different clusters of ROC for the entire 489 sample. The table is based on the persistency of ROC: the threshold level is required to be reported for any of the five fiscal years in 2005–2009.
TABLE 9
W EVOLUTION VS. CORPORATE ROC
Section 1: per capita average W
# average 2005 2006 2007 2008 2009
Sample 489 29.6% 29.8% 29.2% 30.4% 29.3% 29.2%
ROC>8% 51 27.8% 29.2% 25.7% 27.8% 27.9% 28.6%
ROC>5% 87 26.6% 26.9% 25.9% 26.9% 25.6% 27.6%
ROC>3% 123 28.8% 29.2% 26.9% 28.8% 27.6% 31.3%
ROC>0% 237 29.1% 30.6% 28.5% 29.9% 27.3% 29.0%
ROC<0% 37 24.8% 24.7% 24.6% 29.3% 23.8% 21.3%
Section 2: capital weight average W
# average 2005 2006 2007 2008 2009
Sample 489 46.4% 46.7% 44.0% 42.0% 50.4% 48.9%
ROC>8% 51 18.9% 17.9% 22.7% 18.1% 16.9% 18.8%
ROC>5% 87 25.1% 23.6% 22.5% 29.8% 27.8% 21.7%
ROC>3% 123 40.1% 40.8% 34.5% 37.0% 41.7% 46.6%
ROC>0% 237 42.1% 41.3% 35.9% 37.3% 45.8% 50.0%
ROC<0% 37 53.7% 42.0% 62.1% 77.4% 71.7% 15.5%
In section I of Table 9, the level of (frequency-averaged)W is independent of ROC, while in section II, the level of (capital-averaged)W is strongly dependent on ROC. The relationship is negative: the higher the ROC, the lower W. This evidence supports the hypothesis of stronger bargaining power for high ROC companies that prefer to divert to short maturity debt, thus gaining flexibility and reducing the cost of debt. Gaps in the figures reported in the two sections confirm that bigger companies are those with higher bargaining power. Long maturity debt is accessible for SMEs with high levels of persistent ROC, but no opportunities to negotiate a lower cost of debt capital are allowed through short-term debt. This supports the hypothesis of endogenous bankruptcy being driven by the debt owners.
Table 10 depicts the average W for the different clusters of growth for the entire sample.In this table, opposite results are shown in the two sections. The figures of the frequency-averaged W
reported in section I are lower than those of the capital-averaged W reported in section II. This evidence supports the point that growing opportunities are mainly financed through long maturity debt only in bigger companies. For SMEs, growing opportunities are mainly funded through short-term debt, possibly to control the agency and information costs that may arise. At the same time, high-growth SMEs have short maturity debt that increases their probability of default and of endogenous bankruptcy driven by debt capital.
Journal of Accounting and Finance Vol. 15(3) 2015 93

TABLE 10
W EVOLUTION VS. CORPORATE GROWTH
Section 1: per capita average W
# average 2005 2006 2007 2008 2009
g>0% 81 37.9% 35.2% 32.9% 41.6% 39.9% 40.0%
g>3% 55 37.0% 34.0% 34.2% 44.2% 36.1% 36.7%
g>5% 49 34.2% 30.8% 31.2% 42.0% 31.1% 36.0%
g>10% 31 30.8% 25.6% 28.4% 40.2% 25.4% 34.3%
g>15% 19 35.7% 34.0% 35.7% 43.0% 25.4% 40.3%
g>100% (except 2009) 3 59.6% 51.8% 53.7% 56.6% 56.4% 79.3%
Section 2: capital weight average W
# average 2005 2006 2007 2008 2009
g>0% 81 59.3% 52.4% 56.1% 66.6% 61.3% 60.2%
g>3% 55 55.6% 52.7% 54.6% 70.1% 64.1% 63.1%
g>5% 49 70.5% 65.4% 56.7% 73.2% 68.7% 66.6%
g>10% 31 55.6% 65.9% 30.6% 60.6% 61.1% 60.0%
g>15% 19 70.5% 82.7% 34.0% 76.7% 79.0% 80.4%
g>100% (except 2009) 3 79.1% 79.3% 80.5% 73.6% 83.1% 78.9%
Cross-analyzing the results of Table 10 and Table 11 allows us to develop further conclusions. It is well known that companies with high growth opportunities usually have lower current returns (i.e., the higher “g” the lower ROC and vice-versa). These companies require long maturity funding to avoid duration mismatching between assets and liabilities, and reduce the probability of default. The Italian case depicts an inefficient market due to the corporate dimension:
- SMEs with high ROC (and lower “g”?) are forced to fund through long maturity debt and pay higher interest rates, whereas those with high “g” are forced to fund through short maturity debt. In both cases, endogenous bankruptcy is driven by debt capital;
- Bigger companies can always benefit from their bargaining power, both in the case of low ROC and low “g,” through obtaining longer maturities. In both cases, endogenous bankruptcy conforms to the classic L&T model or is perhaps forced by shareholders.
The common source of this inefficiency is simple: the Italian debt market is lazy in detecting affordable growth ratios and the persistency of corporate performance (Mantovani, 2014).
RQ4. Tax Shields and Debt Maturity Policies
The Italian case is very special in terms of corporate taxation, which is why it could be of interest to learn from its empirical evidence. The tax burden at the corporate level is very high. The nominal corporate tax rate is 27.5% (the legal corporate tax rate since 2008; previously it was 33%), but the real tax rate is usually considerably higher. The gap between the real and nominal tax rate is due to a very complex system of computing taxable incomes. This system aims to prevent companies deducting costs that are unrelated to the core business, but the convoluted system produces a real increase in the tax burden. This is why the ratio between the taxes exposed in profit and loss sheets and corporate earnings before tax is usually higher than 27.5%.
94 Journal of Accounting and Finance Vol. 15(3) 2015

Two Italian tax rules contribute to increasing the real tax rate still further:
1. IRAP taxation. IRAP is a special 3.9% tax (since 2008; previously 4.25%) that is added to the ordinary Italian corporate tax. What is very particular (indeed, astonishing) is the taxable income for computing the IRAP tax: the sum of EBIT and paid wages. IRAP is a tax designed to discourage leveraging, but is in essence a tax on the cost of workers and thus may produce tax burdens even in the case of company losses.
2. The anti-thin capitalization rule. This rule prevents companies deducting huge amount of paid interest for tax purposes by fixing the maximum amount at 30% of ROL (computed as the sum of EBITDA and the paid leases). This rule has been introduced mainly to discourage leveraging, especially in SMEs.
The distortion of the system is intuitive: the tax burden becomes high and volatile. It therefore presents an extraordinary ground to verify any relationship between the tax burden and debt maturity. Table 11 depicts the average value of W for corporations with a five-year average tax burden higher than 33% (i.e., greater than the sum of the average corporate tax rate and the average IRAP tax rate).
TABLE 11
W EVOLUTION VS. TAX BURDEN
Sample Average 2009 2008 2007 2006 2005
Average Wfull-489
46.41% 48.9% 50.4% 42.0% 44.0% 46.7%
Average 45.87% 69.51% 40.03% 87.64% 4.27% 27.90%
Average Wt >33% - 176
33.13% 38.0% 37.3% 28.1% 33.7% 28.5%
Average 71.73% 80.95% 69.69% 64.63% 70.03% 73.36%
The evidence confirms the theory: In the 176 subset of higher tax-burdened firms (i.e., greater than 33%) the W level is persistently below the average. The results in Table 11 could be biased by the anti-thin capitalization rule. Here, interest deduction is to be considered similar to a put option having a strike price at 30% of the ROL (Mantovani 1996). This suggests controlling the dynamics of W according to an index of capacity (IC) of interest deduction. The index is computed only for companies with a positive ROL according to equation (14):
=1
. if 0.3
0 if > 0.3
where: INT = paid interests.
Table 12 shows the average level of W for companies allowing IC computation (484 vs. 489). W averages are based both on company frequency (section I) and on capital weight (section II) to control for any distortion due to SME data.
The evidence is clear: The higher IC, the lower W, meaning that when companies have the capacity to deduct interest, they prefer short maturity debt. No differences are found in the case of SMEs. Two comments help to explain this evidence: (i) the IC volatility suggests using short maturity debt as a “pay-as-you-go” solution to take advantage of the tax shield from debt for any corporate dimension; (ii) a high IC is usually generated by high operative returns, i.e., the same driver that shortens debt maturity.
(14)
Journal of Accounting and Finance Vol. 15(3) 2015 95

TABLE 12
W EVOLUTION VS. CORPORATE IC INDEX
Section 1: per capita average W
# average 2005 2006 2007 2008 2009
Sample 484 29.6% 29.8% 29.2% 30.5% 29.4% 29.2%
IC=0 42 42.7% 45.1% 41.9% 44.6% 40.1% 41.5%
0<IC<25 73 30.9% 28.6% 31.7% 33.2% 32.4% 28.5%
25<IC<50 89 27.2% 29.5% 26.3% 27.9% 27.0% 25.4%
50<IC<75 97 27.2% 28.2% 28.7% 29.9% 23.7% 25.3%
75<IC<98 117 28.6% 25.5% 26.0% 27.7% 31.0% 32.9%
98<IC<100 33 16.1% 27.9% 13.5% 12.4% 11.3% 15.4%
n.c. 33 28.5% 31.8% 27.4% 25.4% 31.1% 26.6%
Section 2: capital weight average W
# average 2005 2006 2007 2008 2009
Sample 484 46.5% 46.7% 44.1% 42.1% 50.5% 48.9%
IC=0 42 65.2% 73.8% 65.2% 51.7% 65.9% 69.2%
0<IC<25 73 39.0% 41.9% 41.3% 41.1% 41.7% 28.8%
25<IC<50 89 42.8% 37.9% 33.4% 40.3% 50.7% 51.8%
50<IC<75 97 42.7% 31.6% 34.5% 48.7% 47.3% 51.5%
75<IC<98 117 30.5% 36.6% 31.9% 23.6% 31.9% 28.4%
98<IC<100 33 21.3% 7.5% 15.0% 18.6% 16.9% 48.4%
n.c. 33 42.3% 19.3% 61.0% 23.9% 54.9% 52.4%
CONCLUDING REMARKS
The initial aim of the paper was to carry out an empirical check of the Leland and Toft (L&T) model using the Italian case. A sample was extracted according to the availability of the entire set of detailed financial reports for the period 2005–2009. Two sub-sets were identified, separating out the companies no longer included in the source database in 2011. By comparing the results from the two subsets, the study sought to find insights that could better contribute to insulating the endogenous bankruptcy phenomena proposed by the L&T approach. The emerging complexity of the Italian case suggested deepening the analysis to identify a wider number of drivers of debt maturity policies.
The resulting aim of the paper became the opportunity to find new insights concerning the debt maturity puzzle, particularly in the case of unlisted/private companies. The same leverage quantity might impact in very different ways according the qualitative profile of the firm in terms of debt maturity. Debt maturity can stimulate unexpected impacts over several drivers of the operating performance. The endogenous bankruptcy approach is empirically proven, but the concept of endogeneity is to be extended to the firm’s stakeholders, particularly long-term funders (banks). This is why the corporate dimension matters (i.e., bargaining power) for capital structure decisions that are related to the business model (i.e., growth options, current returns, and the value content of corporate products).
Four points lead us to the following conclusions: 1. Debt maturity impacts the capital structure choices of private firms. The results suggest that the
endogenous bankruptcy hypothesis of the L&T approach is confirmed, but they also suggest the inversion of the endogenous role, especially for SMEs: the creditors are the inner decision makers
96 Journal of Accounting and Finance Vol. 15(3) 2015

of the endogenous default. In fact, the empirical evidence suggests that they are the true crafters of the debt maturity to avoid default according to their needs.
2. There is a link between debt maturity and operating performance. According to Harris and Raviv (1991), we find that higher operating profitability reduces debt maturity, while higher growth ratios support maturity extensions. We conclude that long-term finance can support the value of growth opportunities. The inner relief of short debt in Italian banking activity contributes to explaining lower persistence in growth ratios. The evidence suggests that no incentives to widen maturity exist, even for equity owners of growing companies, as no excess returns emerge in ROE.
3. Company size matters. The empirical evidence detects high concentrations of debt capital deploying a bargaining advantage for bigger companies due to the impact of the costs of financial transactions. Long-term debt is more concentrated than short-term debt. Bigger companies prefer to use their bargaining power either to reduce the cost of equity capital or to fund growth opportunities at their convenience. Longer debt maturity for SMEs is concentrated in the case of higher returns on invested capital. Perhaps banks prefer longer maturity for these very competitive companies to avoid expensive continuous negotiation of smaller contracts.
4. The tax shield concept is to be revised according to debt maturity. Longer maturity reduces the value of tax shields, ceteris paribus. Surprisingly, the Italian empirical evidence suggests that the corporate tax rate is not the inner driver. The index of capacity (IC) of interest deductions is instead more relevant. The higher and the more volatile the IC, the higher the tax opportunity to reduce debt maturity. In fact, short-term debt use gives the company the required flexibility to ride the implied option embedded in the tax shield that is generated from thin capitalization rules.
The specifics of the Italian case seem to support only some evidence of inefficiency. The Italian debt market is redundant as it prefers to allocate longer maturity debt in extreme cases both for SMEs and for bigger companies. In the case of SMEs, banks seem to give long maturity credit allowances when (i) the endogenous probability of default needs to be reduced, and (ii) the current return is high but growth options are not. In the case of bigger companies, the debt allocation primarily reflects the bargaining power of the company, whereas less relevance is given to the quality of the investments. Probably, both cases suggest that the Italian inefficiency is mainly due to lazy approaches to corporate financial analysis and the bulk use of rating instruments that miss the firm-specific determinants of debt maturity. Comparing the Italian evidence to other international data on the one hand, and the evidence of listed companies on the other hand is then the next research step to gain more insights into the maturity drivers of corporate debt.
ENDNOTES
(1) This simplified split is the only possibility in view of the mandatory deployment of financial statements by Italian law.
REFERENCES
Bagnoli, C. & Mantovani, G. M. (2013). Voluntary Disclosure Strategies and the Cost of Capital of Italian Blue Chips. The Journal of Business Economics and Finance 1: 49–94.
Berens, J. L. & Cuny, C. J. (1995). The Capital Structure Puzzle Revisited. The Review of Financial
Studies 8: 1185–1208.Berger, A. N., Espinosa-Vega, M. A., Scott Frame, W. & Miller, N. H. (2006). Debt Maturity, Risk and
Asymmetric Information. The Journal of Finance 60: 2895–2923.Chen, N. & Kou, S. G. (2009). Credit Spreads, Optimal Capital Structure, and Implied Volatility with
Endogenous Default and Jump Risk Mathematical Finance. Vol 19, 343-378, 2009Datta, S., Iskandar-Datta, M. & Raman, K. (2005). Managerial Stock Ownership and the Debt Maturity
Structure of Corporate Debt. The Journal of Finance 60: 2333–2350.
Journal of Accounting and Finance Vol. 15(3) 2015 97

Flannery, M. J. (1986). Asymmetric Information and Risky Debt Maturity Choice. Journal of Finance 41: 19–37.
Goswami, G. (2000). Asset Maturity, Debt Covenant and Debt Maturity Choice. The Financial Review
35: 51–68.Greenwood, R., Hanson, S. & Stein, J. C. (2010). A Gap-Filling Theory of Corporate Debt Maturity
Choice. The Journal of Finance 65: 993–1028.Guedes, J. & Opler, T. (1996). The Determinants of Maturity of Corporate Debt Issues. The Journal of
Finance 51: 1809–1833.Harris, M. & Raviv, M. (1991). The Theory of Capital Structure. The Journal of Finance 46: 297–355.Hilberink, B. & Rogers, L. C. G. (2002). Optimal Capital Structure and Endogenous Default. Finance and
Stochastics 6: 237–263.Hoven-Stohs, M. & Mauer, D. C. (1996). The Determinant of Corporate Debt Maturity Structure. The
Journal of Business 69: 279–312.Leland, H. E. (1994). Corporate Debt Value, Bond Covenants and Optima Capital Structure. The Journal
of Finance 49: 1213–1252.Leland, H. E. & Toft, K. B. (1996). Optimal Capital Structure, Endogenous Bankruptcy and the Term
Structure of Credit Spreads. The Journal of Finance 51: 987–1019.Magri, S. (2006). Debt Maturity of Italian Firms. Temi di discussione del Servizio Studi – Banca d’Italia,
No. 574.Mantovani, G. M. (1996). Nuovo regime fiscale delle operazioni di finanziamento ‘triangolare’ e di
conduit banking e politiche finanziarie delle imprese italiane. Rivista Milanese di Economia 58 : 52–66, Cariplo-Laterza (ISSN 0392-9728)
Mantovani, G. M. (2011). The Information Risk Drivers. A Long-Term Analysis to Support a Risk Premia Modeling. Quarterly Journal of Finance and Accounting 50: 145–199.
Modigliani, F. & Miller, M. (1958). The Cost of Capital, Corporate Finance, and the Theory of Investment. American Economic Review 48: 261–297.
Modigliani, F. & Miller, M. (1963). Corporate Income Taxes and the Cost of Capital: A Correction. American Economic Review 53: 433–443.
Nam, C. W. & Radulescu, D. M. (2004). Does Debt Maturity Matter for Investment Decisions? CESifo Working Paper No. 1124.
Ozkan, A. (2000). An Empirical Analysis of Corporate Debt Maturity Structure. European Financial
Management 6: 197–212.Whited, T. M. (1992). Debt, Liquidity Constraints and Corporate Investment: Evidence from Panel Data.
The Journal of Finance 47: 1425–1460.Yi, J. (2005). A Study on Debt Maturity Structure. The Journal of American Academy of Business 7: 277–
285.
ACKNOWLEDGEMENT
My thanks go to Professor Chrysto Pirinsky from George Washington University for his comments and discussion of the first draft during the 2013 FMA Conference in Chicago, and to Professor Andrea Moro, University of Cranfield (UK), for further comments on the second draft. I received insightful comments and suggestions during the research from Professor Dr. Hans-Peter Burghoff, University of Hoenheim (D), and Professor Loriana Pelizzon, University of Frankfurt and Ca’ Foscari University, (I-Treviso). Special thanks to Professor Ludovica Staderini-Giacomazzi, found back after 30 years but still crafting my basic knowledge and pushing my research spirit toward the future. Finally, thanks to the Trustees of the Teofilo Intato Foundation for the wide support in my research activities and to all the fellow researchers who contribute to the research activities at “Progetto-0-9 Research Centre” in Treviso. The responsibility for this paper is to be attributed fully to the author.
98 Journal of Accounting and Finance Vol. 15(3) 2015