volume 10 number 45 7 december 2019 pages 10449–10656
TRANSCRIPT

rsc.li/chemical-science
ChemicalScience
ISSN 2041-6539
EDGE ARTICLEOliver Trapp et al.Identifying high-performance catalytic conditions for carbon dioxide reduction to dimethoxymethane by multivariate modelling
Volume 10 Number 45 7 December 2019 Pages 10449–10656

ChemicalScience
EDGE ARTICLE
Ope
n A
cces
s A
rtic
le. P
ublis
hed
on 2
4 O
ctob
er 2
019.
Dow
nloa
ded
on 3
/20/
2022
1:1
7:04
AM
. T
his
artic
le is
lice
nsed
und
er a
Cre
ativ
e C
omm
ons
Attr
ibut
ion
3.0
Unp
orte
d L
icen
ce.
View Article OnlineView Journal | View Issue
Identifying high-
Department Chemie, Ludwig-Maximilians-U
81377 Munchen, Germany. E-mail: oliver.tr
† Electronic supplementary informationmultivariate modelling procedure, additiDOI: 10.1039/c9sc04591k
Cite this: Chem. Sci., 2019, 10, 10466
All publication charges for this articlehave been paid for by the Royal Societyof Chemistry
Received 11th September 2019Accepted 23rd October 2019
DOI: 10.1039/c9sc04591k
rsc.li/chemical-science
10466 | Chem. Sci., 2019, 10, 10466–1
performance catalytic conditionsfor carbon dioxide reduction to dimethoxymethaneby multivariate modelling†
Max Siebert, Gerhard Krennrich, Max Seibicke, Alexander F. Siegleand Oliver Trapp *
In times of a warming climate due to excessive carbon dioxide production, catalytic conversion of carbon
dioxide to formaldehyde is not only a process of great industrial interest, but it could also serve as a means
for meeting our climate goals. Currently, formaldehyde is produced in an energetically unfavourable and
atom-inefficient process. A much needed solution remains academically challenging. Here we present
an algorithmic workflow to improve the ruthenium-catalysed transformation of carbon dioxide to the
formaldehyde derivative dimethoxymethane. Catalytic processes are typically optimised by
comprehensive screening of catalysts, substrates, reaction parameters and additives to enhance activity
and selectivity. The common problem of the multidimensionality of the parameter space, leading to only
incremental improvement in laborious physical investigations, was overcome by combining elements
from machine learning, optimisation and experimental design, tripling the turnover number of 786 to
2761. The optimised conditions were then used in a new reaction setup tailored to the process
parameters leading to a turnover number of 3874, exceeding by far those of known processes.
Introduction
In this century, our ecosystem faces severe problems such asglobal warming, environmental pollution and resource depletion.The negative impact of humankind as well as its responsibility insolving these problems can no longer be ignored.1,2 Besides thenecessity for future-oriented global politics,3,4 both the scienticcommunity and the chemical industry must provide answers tocrucial questions regarding sustainable process development,alternative energies as well as recycling of waste and pollutants.5–9
In this context, more efficient techniques must be developed andapplied in research to reduce time, cost and resources.10–12
In catalytic investigations, system optimisation is typicallyapproached by one-factor-at-a-time (OFAT) methods, succes-sively screening along one parameter axis. Once optimised,a parameter is kept constant for the subsequent experiments. Inthis univariate analysis, variables are treated as being inde-pendent of each other. Beside the vast number of experimentsthat must be performed, local maxima with higher perfor-mances might be missed. Consequently, algorithm-basedscreening and optimisation techniques have been among thefastest growing research areas in recent years.13–24 Considering
niversitat Munchen, Butenandtstr. 5-13,
(ESI) available: Synthetic procedures,onal tables, catalysis data, R-code. See
0474
the interactions of parameters, optimised results can be ach-ieved with minimal experimental effort.25,26
Recently, we applied a univariate optimisation approachincluding several hundred catalytic reactions to improve theselective ruthenium-catalysed transformation of carbon dioxide todimethoxymethane (DMM) reaching a turnover number (TON) of786 (Scheme 1).27,28 The product DMM itself is a high value feed-stock for biofuels, but can also be hydrolysed yielding formalde-hyde and methanol or directly employed as a formaldehydesynthon.29,30 Beside the desired product, only methyl formate (MF)was formed with TONs of up to 1290 (Scheme 1).27 Previously, twostudies on the selective hydrogenation of CO2 by the group ofKlankermayer showed the formation of DMM and MF by usinga homogeneous ruthenium catalyst31 with TONs of 214 and 104 ora cobalt catalyst32 with TONs of 157 and 37, respectively. Furtherselective reductions toward the formaldehyde oxidation state werereported utilising hydroboration,33–37 hydrosilylation,38,39 and frus-trated Lewis pairs,40,41 however, being mainly of academic interestdue to the stoichiometric use of reducing reagents.
Scheme 1 Reductive transformation of CO2 towards the formalde-hyde oxidation level yielding methyl formate (MF) and dimethoxy-methane (DMM).
This journal is © The Royal Society of Chemistry 2019
Edge Article Chemical Science
Ope
n A
cces
s A
rtic
le. P
ublis
hed
on 2
4 O
ctob
er 2
019.
Dow
nloa
ded
on 3
/20/
2022
1:1
7:04
AM
. T
his
artic
le is
lice
nsed
und
er a
Cre
ativ
e C
omm
ons
Attr
ibut
ion
3.0
Unp
orte
d L
icen
ce.
View Article Online
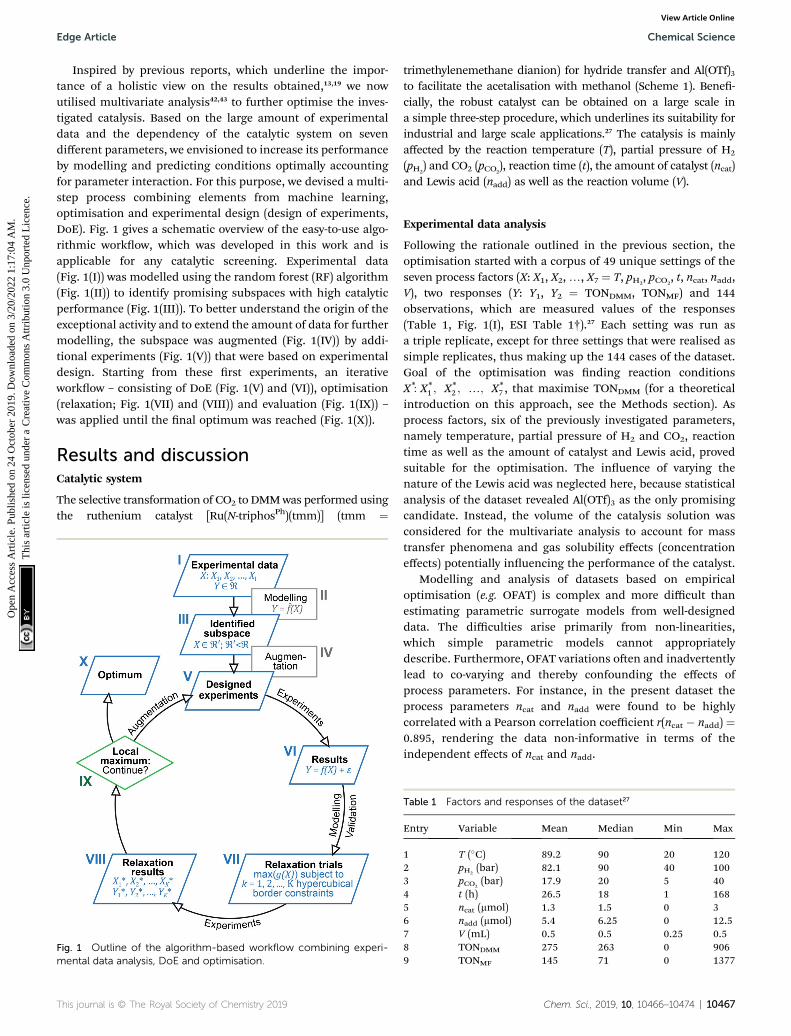
Inspired by previous reports, which underline the impor-tance of a holistic view on the results obtained,13,19 we nowutilised multivariate analysis42,43 to further optimise the inves-tigated catalysis. Based on the large amount of experimentaldata and the dependency of the catalytic system on sevendifferent parameters, we envisioned to increase its performanceby modelling and predicting conditions optimally accountingfor parameter interaction. For this purpose, we devised a multi-step process combining elements from machine learning,optimisation and experimental design (design of experiments,DoE). Fig. 1 gives a schematic overview of the easy-to-use algo-rithmic workow, which was developed in this work and isapplicable for any catalytic screening. Experimental data(Fig. 1(I)) was modelled using the random forest (RF) algorithm(Fig. 1(II)) to identify promising subspaces with high catalyticperformance (Fig. 1(III)). To better understand the origin of theexceptional activity and to extend the amount of data for furthermodelling, the subspace was augmented (Fig. 1(IV)) by addi-tional experiments (Fig. 1(V)) that were based on experimentaldesign. Starting from these rst experiments, an iterativeworkow – consisting of DoE (Fig. 1(V) and (VI)), optimisation(relaxation; Fig. 1(VII) and (VIII)) and evaluation (Fig. 1(IX)) –was applied until the nal optimum was reached (Fig. 1(X)).
Results and discussionCatalytic system
The selective transformation of CO2 to DMMwas performed usingthe ruthenium catalyst [Ru(N-triphosPh)(tmm)] (tmm ¼
Fig. 1 Outline of the algorithm-based workflow combining experi-mental data analysis, DoE and optimisation.
This journal is © The Royal Society of Chemistry 2019
trimethylenemethane dianion) for hydride transfer and Al(OTf)3to facilitate the acetalisation with methanol (Scheme 1). Bene-cially, the robust catalyst can be obtained on a large scale ina simple three-step procedure, which underlines its suitability forindustrial and large scale applications.27 The catalysis is mainlyaffected by the reaction temperature (T), partial pressure of H2
(pH2) and CO2 (pCO2
), reaction time (t), the amount of catalyst (ncat)and Lewis acid (nadd) as well as the reaction volume (V).
Experimental data analysis
Following the rationale outlined in the previous section, theoptimisation started with a corpus of 49 unique settings of theseven process factors (X: X1, X2,., X7 ¼ T, pH2
, pCO2, t, ncat, nadd,
V), two responses (Y: Y1, Y2 ¼ TONDMM, TONMF) and 144observations, which are measured values of the responses(Table 1, Fig. 1(I), ESI Table 1†).27 Each setting was run asa triple replicate, except for three settings that were realised assimple replicates, thus making up the 144 cases of the dataset.Goal of the optimisation was nding reaction conditionsX*: X*
1 ; X*2 ; .; X*
7 , that maximise TONDMM (for a theoreticalintroduction on this approach, see the Methods section). Asprocess factors, six of the previously investigated parameters,namely temperature, partial pressure of H2 and CO2, reactiontime as well as the amount of catalyst and Lewis acid, provedsuitable for the optimisation. The inuence of varying thenature of the Lewis acid was neglected here, because statisticalanalysis of the dataset revealed Al(OTf)3 as the only promisingcandidate. Instead, the volume of the catalysis solution wasconsidered for the multivariate analysis to account for masstransfer phenomena and gas solubility effects (concentrationeffects) potentially inuencing the performance of the catalyst.
Modelling and analysis of datasets based on empiricaloptimisation (e.g. OFAT) is complex and more difficult thanestimating parametric surrogate models from well-designeddata. The difficulties arise primarily from non-linearities,which simple parametric models cannot appropriatelydescribe. Furthermore, OFAT variations oen and inadvertentlylead to co-varying and thereby confounding the effects ofprocess parameters. For instance, in the present dataset theprocess parameters ncat and nadd were found to be highlycorrelated with a Pearson correlation coefficient r(ncat � nadd) ¼0.895, rendering the data non-informative in terms of theindependent effects of ncat and nadd.
Table 1 Factors and responses of the dataset27
Entry Variable Mean Median Min Max
1 T (�C) 89.2 90 20 1202 pH2
(bar) 82.1 90 40 1003 pCO2
(bar) 17.9 20 5 404 t (h) 26.5 18 1 1685 ncat (mmol) 1.3 1.5 0 36 nadd (mmol) 5.4 6.25 0 12.57 V (mL) 0.5 0.5 0.25 0.58 TONDMM 275 263 0 9069 TONMF 145 71 0 1377
Chem. Sci., 2019, 10, 10466–10474 | 10467

Chemical Science Edge Article
Ope
n A
cces
s A
rtic
le. P
ublis
hed
on 2
4 O
ctob
er 2
019.
Dow
nloa
ded
on 3
/20/
2022
1:1
7:04
AM
. T
his
artic
le is
lice
nsed
und
er a
Cre
ativ
e C
omm
ons
Attr
ibut
ion
3.0
Unp
orte
d L
icen
ce.
View Article Online
Next, the problem for these datasets is nding an appro-priate functional representation, f (), of the target response asa function of the process factors Xi, that is TONDMM ¼f(T,pH2
,pCO2,t,ncat,nadd,V) + 3, without making any prior
assumptions about the analytical form of the ‘true’ function f().Here, we used RF as a powerful non-linear and easy-to-usemethod for the empirical model building of complex datasets(Fig. 1(II)).44,45
The RF models describe 79% of the responses' variance onaverage (R2(TONDMM) ¼ 0.83; R2(TONMF) ¼ 0.74), which isa good result given the heterogeneous nature of the dataset.Further, tuning the RF hyperparameters using 10-fold crossvalidation with consecutive blocks (mtry* ¼ 2 with R2 ¼ 0.83)revealed that the default RF hyperparameters describe the dataappropriately. The effect structure of the models can beconveniently explored by plotting the RF model predictions f (X)against the process factors X1, X2,., X7. Fig. 2 shows the effectsof the process parameters T, pCO2
, ncat and nadd, given themedian values pH2
¼ 90 bar, t ¼ 18 h and V ¼ 0.5 mL, asa conditional trellis plot.
As a tree-based ensemble method, RF splits and mean-aggregates the experimental space into hyperrectangles, the
Fig. 2 Trellis plot of the random forest predictions f(T,pH2,pCO2
,t,ncat,nadmax(TONDMM) in the experimental data (Table 1, entry 8) and the modesmaller than the range of the empirical data.
10468 | Chem. Sci., 2019, 10, 10466–10474
consequence being that the RF model surface becomes non-smooth (Fig. 2). This property of RF is a particular strengthwhen it comes to identifying promising domains of the exper-imental space and was another motivation for choosing RF asmodelling technique.
Evidently, ncat and nadd exert strong non-linear, step likenegative effects on the process performance (TONDMM),dividing the ncat � nadd space into domains of differentperformance. The pressure, pCO2
, reveals a positive andtemperature, T, a small convex effect, both, however, negligiblecompared to the dominant effects of ncat and nadd. At this point,the erroneous impression may arise that the heuristic inter-pretation of the experimental data could lead to a furtherimprovement by a trivial reduction of the amount of catalyst,which is oen reduced to minimise catalyst deactivation.However, a closer look at the experimental data shows thata reduction in the amount of catalyst without changing otherparameters leads to a decrease in catalytic activity with respectto DMM. This case shows exemplarily how important multi-variate analytical methods can be, because they can easilyidentify complex correlations of process parameters that are notdetectable by a univariate analysis of the scientist.
d,V) with pH2¼ 90 bar, t ¼ 18 h and V ¼ 0.5 mL. Note the difference of
l. The RF values are predictions causing the range of the z-axis to be
This journal is © The Royal Society of Chemistry 2019
Edge Article Chemical Science
Ope
n A
cces
s A
rtic
le. P
ublis
hed
on 2
4 O
ctob
er 2
019.
Dow
nloa
ded
on 3
/20/
2022
1:1
7:04
AM
. T
his
artic
le is
lice
nsed
und
er a
Cre
ativ
e C
omm
ons
Attr
ibut
ion
3.0
Unp
orte
d L
icen
ce.
View Article Online
With the condition TONDMM > 400 deduced from the land-scape of TONDMM over ncat � nadd (Fig. 2), a subset of 26 obser-vations with 9 unique settings was selected from the data(Fig. 1(III)). In this subset, the parameters T, pH2
, pCO2and t were
found constant at T ¼ 90 �C, pH2¼ 90 bar, pCO2
¼ 20 bar and t ¼18 h, thereby suggesting to conditionally optimise ncat, nadd and Vrst, while keeping T, pH2
, pCO2and t constant for the time being.
First DoE
These 9 candidate points (identied unique settings mentionedabove) were subsequently augmented by an additional numberof 6 points to fully support all second order effects of ncat, naddand V (Fig. 1(IV)). The intention behind this augmentation wasto render the formerly confounded effects of ncat and nadd esti-mable as well as, assuming high complexity, to allow for inter-actions and non-linearities of the process parameters as a solidbasis for further optimisation (Fig. 1(V)).
The 6 augmentation trials were realised as triple replicates inthe lab, added to the 9 settings already available and theresponses (TONDMM, TONMF) were modelled as a function of theleast square parameters with stepwise ordinary least squares(OLS; Fig. 1(VI)). Both models accurately describe the datawithin the replication error and explain 91% (R2(TONDMM) ¼0.91; DF ¼ 37) and 97% (R2(TONMF) ¼ 0.97; DF ¼ 35) of theresponses' variance with DF denoting the degrees of freedom(number of data points minus number of estimated modelparameters).
The local effects of ncat, nadd and V are depicted in Fig. 3A asresponse surface trellis plot. Again, there is a strong negativeeffect for ncat along with positive effects for nadd and V. Togetherwith the positive, synergistic effect between nadd and V, theeffect structure suggests to decrease ncat and to increase naddand V to further maximise the catalytic performance beyond thebest result of the rst DoE (Fig. 4A, entry 4).
First relaxation
To optimise towards the direction of maximal improvement,following the procedure outlined in the Methods section [eqn(5)], the experimental space was relaxed with 10% step size. Thetriple obtained from relaxing the design space together with theachieved experimental results are listed in Fig. 4B (Fig. 1(VII)and (VIII); see the Methods section).
The joint condition max(TONDMM), max(TONMF) was bestmet by the 20% relaxation trial (Fig. 4B, entry 2), and the factorsetting n*cat ¼ 0:075 mmol, n*add ¼ 3:576 mmol and V* ¼0.550 mL thus became the reference point for further optimi-sation. The 30% relaxation trial was very poor, indicating thata local maximum had been exceeded (Fig. 4B, entry 3). Thepronounced drop in activity, resulting most likely from thereduced catalyst loading, indicates a molecular deactivationpathway of the catalytically active species due to potentialinhibitors, such as carbon monoxide, moisture and oxygen,which are probably present in low concentrations.
At this point, there were two alternatives to proceed: (1)create an experimental design around n*cat, n
*add and V* to fully
identify the topology around the relaxation point at the desired
This journal is © The Royal Society of Chemistry 2019
resolution (complexity). (2) Consider n*cat ¼ 0:075 mmol,n*add ¼ 3:576 mmol and V* ¼ 0.550 mL as locally optimal andswitch to optimising the candidates T, pH2
, pCO2and t, which
had so far been kept constant.The poor outcome of the third relaxation trial (Fig. 4B, entry
3) showed that not much was to be expected from exploring thethree-dimensional environment of the 20% relaxation trial anyfurther. Therefore, option 2 was chosen and the 20% relaxationtrial became the reference point for optimising the candidatesT, pH2
, pCO2and t.
Second DoE
A small linear design [eqn (2)] with 5 runs in the ranges listed inFig. 4C was created with the reference point n*cat ¼ 0:075 mmol,n*add ¼ 3:576 mmol and V* ¼ 0.550 mL, T* ¼ 90 �C,p*H2
¼ 90 bar, p*CO2¼ 20 bar bar, t* ¼ 18 h at the design centre
as replicate (Fig. 1(V); see the Methods section). The experi-ments were realised in the lab as triple replicate to providea measure of accuracy (Fig. 1(VI)).
The measured responses (TONDMM, TONMF) were linearlymodelled as a function of the process parameters with stepwiseOLS. The models explain 92% (R2(TONDMM) ¼ 0.92; DF ¼ 16)and 78% (R2(TONMF)¼ 0.78; DF¼ 18) variance of the responsesthus indicating a large signal-to-noise ratio for TONDMM and toa lesser extent for TONMF.
Fig. 3B shows the linear effects of the process parameters onTONDMM as trellis response surface plot. The factors T and pH2
both have strong positive effects on TONDMM, whereas t revealsonly a small positive and pCO2
a moderate negative effect onTONDMM. Optimal conditions were found in the upper le paneland these are the conditions of the top candidate found in thedesign list with T, pH2
, t at the upper and pCO2at the lower
bound, yielding respective TONs for DMM and MF of 2610 and2356 (Fig. 4C, entry 4).
Second relaxation
Following eqn (5), the experimental space was relaxed in 25%and 50% steps and the relaxation trials were experimentallyrealised in the lab (Fig. 4D and 1(VII); see the Methods section).
Again, we saw a small improvement of the 25% relaxationtrial (Fig. 4D, entry 1) compared with the best candidate fromthe second DoE (Fig. 4C, entry 4), whereas the 50% relaxationcandidate performed comparatively poorly (Fig. 4D, entry 2;Fig. 1(VIII)). With these relaxation trials, we reached the tech-nical limits of our setup regarding hydrogen gas pressure, andtherefore, the conditions of the 25% relaxation experiment canbe considered locally optimal given the constraints of technicalfeasibility (Fig. 1(IX) and (X)). We would like to point out thatthe catalytic conditions optimised by the here presentedstrategy may still represent a local maximum. Modication ofthe catalyst and the additive might also result in furtherimprovement, but as demonstrated in this work the identica-tion of high-performance catalytic conditions should bea prerequisite for a design strategy of new catalysts.
A complete overview of the results obtained at each step ofthe optimisation project is given in Fig. 4E, overall tripling the
Chem. Sci., 2019, 10, 10466–10474 | 10469
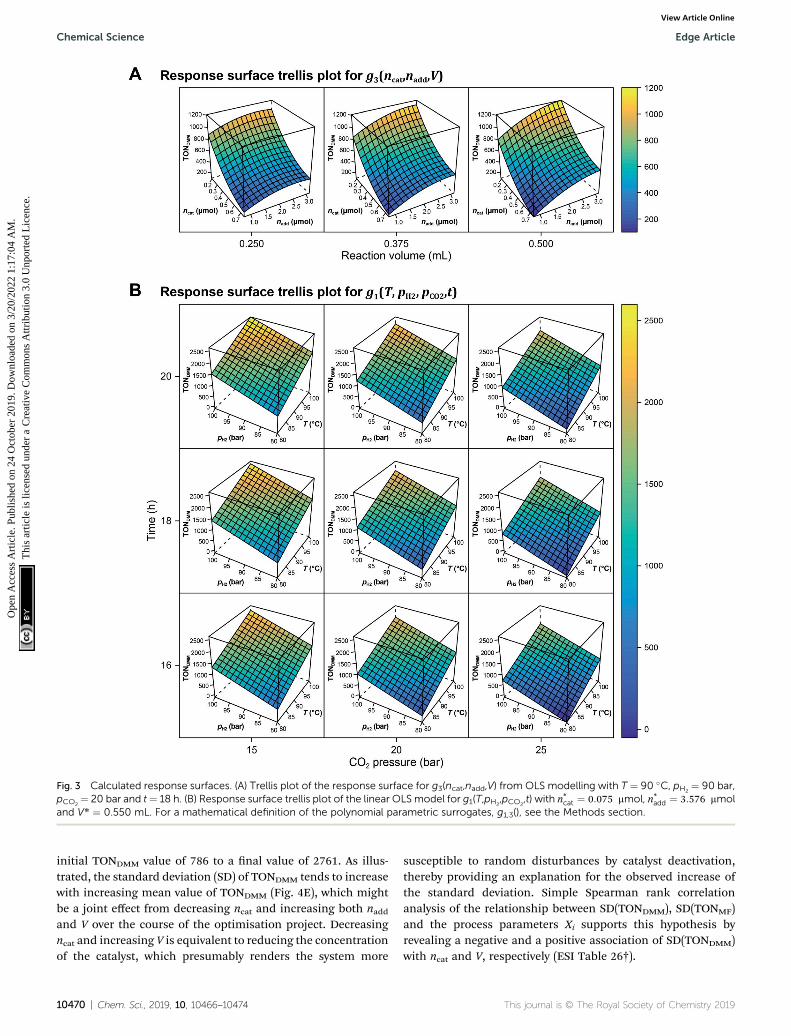
Fig. 3 Calculated response surfaces. (A) Trellis plot of the response surface for g3(ncat,nadd,V) from OLS modelling with T ¼ 90 �C, pH2¼ 90 bar,
pCO2¼ 20 bar and t¼ 18 h. (B) Response surface trellis plot of the linear OLS model for g1(T,pH2
,pCO2,t) with n*cat ¼ 0:075 mmol, n*add ¼ 3:576 mmol
and V* ¼ 0.550 mL. For a mathematical definition of the polynomial parametric surrogates, g1,3(), see the Methods section.
Chemical Science Edge Article
Ope
n A
cces
s A
rtic
le. P
ublis
hed
on 2
4 O
ctob
er 2
019.
Dow
nloa
ded
on 3
/20/
2022
1:1
7:04
AM
. T
his
artic
le is
lice
nsed
und
er a
Cre
ativ
e C
omm
ons
Attr
ibut
ion
3.0
Unp
orte
d L
icen
ce.
View Article Online
initial TONDMM value of 786 to a nal value of 2761. As illus-trated, the standard deviation (SD) of TONDMM tends to increasewith increasing mean value of TONDMM (Fig. 4E), which mightbe a joint effect from decreasing ncat and increasing both naddand V over the course of the optimisation project. Decreasingncat and increasing V is equivalent to reducing the concentrationof the catalyst, which presumably renders the system more
10470 | Chem. Sci., 2019, 10, 10466–10474
susceptible to random disturbances by catalyst deactivation,thereby providing an explanation for the observed increase ofthe standard deviation. Simple Spearman rank correlationanalysis of the relationship between SD(TONDMM), SD(TONMF)and the process parameters Xi supports this hypothesis byrevealing a negative and a positive association of SD(TONDMM)with ncat and V, respectively (ESI Table 26†).
This journal is © The Royal Society of Chemistry 2019

Fig. 4 Optimisation summary. Process parameters and TONs for DMM andMF at different optimisation steps: (A) first DoE. (B) First relaxation (10,20 and 30%). (C) Second DoE. (D) Second relaxation (25 and 50%). (E) Scatter plot TONMF versus TONDMM summarising the outcome of theoptimisation project. The results of each optimisation step are marked according to the colour code. Replication studies (RS): the circled datapoints label the best hit of the first relaxation and the respective replication trials in the second DoE (RS1) as well as the best hit of the second DoEand the respective replication trials in the second relaxation (RS2).
Edge Article Chemical Science
Ope
n A
cces
s A
rtic
le. P
ublis
hed
on 2
4 O
ctob
er 2
019.
Dow
nloa
ded
on 3
/20/
2022
1:1
7:04
AM
. T
his
artic
le is
lice
nsed
und
er a
Cre
ativ
e C
omm
ons
Attr
ibut
ion
3.0
Unp
orte
d L
icen
ce.
View Article Online
Another interesting result in Fig. 4E refers to the indepen-dent replication error. The linear design of the second DoEincludes two independent settings of the 20% reference ascentre points with each point measured as triple replicate (ESITables 11 and 17†). This sextet from the second DoE (Fig. 4C,entry RS1) excellently matches the 20% relaxation triple (Fig. 4B,entry 2) indicating good repeatability and reliability of thesystem (Fig. 4E, ESI Tables 27 and 28†). In a similar way, thebest candidate from the second DoE (Fig. 4C, entry 4) has beenindependently replicated when running the second relaxationsequence (Fig. 4D, entry RS2) and both replicates turned out
This journal is © The Royal Society of Chemistry 2019
identical within the experimental error (Fig. 4E, ESI Tables 29and 30†).
Technical adaption
The results of the non-biased mathematical modellingapproach presented in this study revealed that a better catalyticperformance is inter alia strongly correlated to a combination oflower catalyst loadings and higher reaction volumes. Theheuristic interpretation of this nding indicates that the poorsolubility of hydrogen gas in methanol and mass transfer mightbe limiting factors within our experimental setup. We antici-pated that a larger reaction volume, a higher surface to volume
Chem. Sci., 2019, 10, 10466–10474 | 10471

Chemical Science Edge Article
Ope
n A
cces
s A
rtic
le. P
ublis
hed
on 2
4 O
ctob
er 2
019.
Dow
nloa
ded
on 3
/20/
2022
1:1
7:04
AM
. T
his
artic
le is
lice
nsed
und
er a
Cre
ativ
e C
omm
ons
Attr
ibut
ion
3.0
Unp
orte
d L
icen
ce.
View Article Online
ratio and improved mixing would lead to better mass transferand thus designed an experimental setup accordingly toenhance the catalytic performance. With this upscale autoclave,the TON for DMM increased to 3874, while the TON for MFreached a value of 1445, resulting in a higher selectivity towardDMM (ESI Table 21†). The result of this technical adaptionshows that while the reaction is already optimised to a highdegree with respect to reaction parameters, further improve-ments can be expected by focusing on engineering aspects ofthe reaction setup.
Conclusion
We demonstrated the power of multivariate optimisation forcatalytic processes over the usually applied cumbersome one-factor-at-a-time method. In the homogeneously catalysedtransformation of CO2 to DMM (dimethoxymethane) and MF(methyl formate) using the ruthenium-triphos complex [Ru(N-triphosPh)(tmm)], the TON (turnover number) for DMM wasdrastically increased to 2761 (with it: TONMF 1769) by an easy-to-use algorithmic workow combined with only a small numberof catalytic experiments. Given the complexity of the trans-formation, which depends on seven parameters, conventionalOFAT screening techniques would have been very costly andtime-consuming, with uncertain outcome.
Starting from catalytic data using RF (random forest) forempirical model building, an experimental subspace wasidentied and subsequently augmented to render the effects ofa rst set of three process factors estimable. Modelling andoptimisation, followed by relaxation led to a sequence ofrelaxation trials with one candidate assumed to be locallyoptimal. With this candidate as reference, a linear design of theremaining four variables yielded another substantial improve-ment. Relaxation of the second design further enhanced thecatalytic performance, thereby reaching the technical limits ofthe setup.
The optimised conditions were used in a specicallydesigned experimental setup and the highest TON for DMM of3874 (with it: TONMF 1445) was obtained, which is, to the best ofour knowledge, the by far highest value reported in the inves-tigated catalysis.
MethodsTheoretical introduction
Experimental design (design of experiments, DoE) methods canbe used to study the joint effects of several parameters X: X1, X2,., XI on response Y.26,42,43 This can formally be written as:
Y ¼ f(X) + 3 (1)
f() denotes the true, however unknown function, linking theresponses Y with the process conditions X: X1, X2, ., XI,whereas 3 is a random element taken from a normal distribu-tion with variance s2, 3 � N(0,s2) to account for experimentaluncertainties. Conceptually, nature evaluates in an experimentthe function f() known to her only at reaction conditions X, then
10472 | Chem. Sci., 2019, 10, 10466–10474
adds some random noise 3 and returns the experimental resultsY [eqn (1)].
Under the weak assumption that f() is smooth and contin-uous, f() can be locally approximated as polynomial parametricsurrogates, g1,2,3(), of increasing complexity, formally:
f ðXÞy g1ðX Þ ¼ a0 þX
i
aiXi (2)
f ðXÞy g2ðX Þ ¼ a0 þX
i
aiXi þX
j. i
aijXiXj (3)
f ðX Þy g3ðX Þ ¼ a0 þX
i
aiXi þX
i
aiiX2i þ
X
j. i
aijXiXj (4)
These are linear [eqn (2)], bilinear [eqn (3)] or quadratic [eqn(4)] parametric surrogates of the true function f(). With theexperimental values Y, X1, X2, ., XI available, the unknownparameters ai, aii, aij can be estimated from the data usingordinary least squares (OLS).46
Given process factors X1, X2,., XI, their ranges Xi ˛ {LB,UB}with LB, UB denoting the lower and upper bounds of theprocess factors Xi and, depending on the expected complexity,the parametric form of the surrogate model, the design points X(experimental design) optimally supporting the chosen modelcan be calculated. However, in an early project phase it is oenunclear which factors Xi and ranges should be chosen and whatlevels of complexity must be assumed for the domain underinvestigation. Therefore, DoE can benet from experimentaldata analysis, with the latter helping to answer the questionsarising in the former.
Aer rst optimisation by an experimental design,ascending in the direction of maximal improvement can beeasily achieved by increasing (relaxing) the experimental spacein discrete steps and by solving a maximisation problem subjectto a sequence of hypercubical constraints, that is
max(g(X)) subject to LB � kDX < X < UB + kDX (5)
with DX being the step size of the relaxation, here taken to be10% of the initial factor ranges, that is DX ¼ 0.1[UB � LB], andLB, UB denoting the lower and upper bounds of the processfactors Xi. Varying k ¼ 1, 2, ., K leads to a sequence of relax-ation trials X*
1 ; X*2 ; .; X*
K to be realised in the lab.
Additional information
The detailed description of all experiments, the performedmultivariate analysis, the spectroscopic data of compounds aswell as the NMR spectra of compounds and catalysis samplescan be found in the ESI.† In order to improve comprehensi-bility, simplied names were used in some cases rather thanusing exact IUPAC names.
All calculations were done using the statistical soware R.47
Random forest modelling was performed with the R-package‘randomForest’.48 Experimental designs were calculated withthe D-optimal criterion of the function optFederov() in the R-package ‘AlgDesign’.49 Optimisation was achieved with the
This journal is © The Royal Society of Chemistry 2019

Edge Article Chemical Science
Ope
n A
cces
s A
rtic
le. P
ublis
hed
on 2
4 O
ctob
er 2
019.
Dow
nloa
ded
on 3
/20/
2022
1:1
7:04
AM
. T
his
artic
le is
lice
nsed
und
er a
Cre
ativ
e C
omm
ons
Attr
ibut
ion
3.0
Unp
orte
d L
icen
ce.
View Article Online
augmented Lagrange method from the R-package ‘Rsolnp’.50
Graphics were produced with the R-package ‘lattice’.51
All catalyses and the corresponding analyses were performedfollowing a procedure previously reported by our group.27 Thecatalysis was also performed in the absence of a catalyst, a co-catalyst or both to demonstrate the need of the catalyticsystem for the formation of DMM and MF. In all cases, nosignicant conversions for both of these compounds wereobserved (ESI†).
Reproduction of modelling results
The R-code used as well as the catalytic data analysed (Excelsheet) are available online. The multivariate analysis can bereproduced by following the instructions in the ESI.†
Author contributions
M. Siebert and G. K. designed the experiments. M. Siebertperformed the experiments. G. K. performed computer model-ling and analysis of the data. All authors contributed to theinterpretation of the data. The manuscript was co-written by M.Siebert and G. K. and all authors contributed to the manuscript.O. T. supervised the project.
Conflicts of interest
There are no conicts to declare.
Acknowledgements
Generous nancial support by the German Federal Ministry ofEducation and Research (BMBF) within the funding initiative‘CO2Plus – Stoffliche Nutzung von CO2 zur Verbreiterung derRohstoasis’ is gratefully acknowledged. We thank A. Closs, A.Schreieck and P. Laloire for fruitful discussions.
References
1 P. J. Crutzen, Nature, 2002, 415, 23.2 J.-L. Martin, V. Maris and D. S. Simberloff, Proc. Natl. Acad.Sci. U. S. A., 2016, 113, 6105–6112.
3 T. Sterner, E. B. Barbier, I. Bateman, I. van den Bijgaart,A.-S. Crepin, O. Edenhofer, C. Fischer, W. Habla,J. Hassler, O. Johansson-Stenman, A. Lange, S. Polasky,J. Rockstrom, H. G. Smith, W. Steffen, G. Wagner,J. E. Wilen, F. Alpızar, C. Azar, D. Carless, C. Chavez,J. Coria, G. Engstrom, S. C. Jagers, G. Kohlin, A. Lofgren,H. Pleijel and A. Robinson, Nature Sustainability, 2019, 2,14–21.
4 Y. Geng, J. Sarkis and R. Bleischwitz, Nature, 2019, 565, 153–155.
5 W. Keim, in Carbon Dioxide as a Source of Carbon: Biochemicaland Chemical Uses, ed. M. Aresta and G. Forti, Springer,Dordrecht, 1st edn, 1987, DOI: 10.1007/978-94-009-3923-3.
6 M. Aresta, in Carbon Dioxide as Chemical Feedstock, ed. M.Aresta, Wiley-VCH, Weinheim, 2010.
7 E. J. Beckman, Nature, 2016, 531, 180–181.
This journal is © The Royal Society of Chemistry 2019
8 R. A. Sheldon, Green Chem., 2016, 18, 3180–3183.9 J. A. Martens, A. Bogaerts, N. De Kimpe, P. A. Jacobs,G. B. Marin, K. Rabaey, M. Saeys and S. Verhelst,ChemSusChem, 2017, 10, 1039–1055.
10 Y. Gil, M. Greaves, J. Hendler and H. Hirsh, Science, 2014,346, 171–172.
11 M. I. Jordan and T. M. Mitchell, Science, 2015, 349, 255–260.12 G. Rothenberg, Catalysis: Concepts and Green Applications,
Wiley, Weinheim, 2017.13 M. S. Sigman, K. C. Harper, E. N. Bess and A. Milo, Acc. Chem.
Res., 2016, 49, 1292–1301.14 M. H. S. Segler, M. Preuss and M. P. Waller, Nature, 2018,
555, 604–610.15 C. W. Coley, W. H. Green and K. F. Jensen, Acc. Chem. Res.,
2018, 51, 1281–1289.16 H. Gao, T. J. Struble, C. W. Coley, Y. Wang, W. H. Green and
K. F. Jensen, ACS Cent. Sci., 2018, 4, 1465–1476.17 D. T. Ahneman, J. G. Estrada, S. Lin, S. D. Dreher and
A. G. Doyle, Science, 2018, 360, 186–190.18 J. M. Granda, L. Donina, V. Dragone, D.-L. Long and
L. Cronin, Nature, 2018, 559, 377–381.19 C. B. Santiago, J.-Y. Guo and M. S. Sigman, Chem. Sci., 2018,
9, 2398–2412.20 S. Zhao, T. Gensch, B. Murray, Z. L. Niemeyer, M. S. Sigman
and M. R. Biscoe, Science, 2018, 362, 670–674.21 A. F. Zahrt, J. J. Henle, B. T. Rose, Y. Wang, W. T. Darrow and
S. E. Denmark, Science, 2019, 363, eaau5631.22 J. P. Reid and M. S. Sigman, Nature, 2019, 571, 343–348.23 A. V. Brethome, R. S. Paton and S. P. Fletcher, ACS Catal.,
2019, 9, 7179–7187.24 P. S. Gromski, A. B. Henson, J. M. Granda and L. Cronin, Nat.
Rev. Chem., 2019, 3, 119–128.25 G. E. P. Box, W. G. Hunter and J. S. Hunter, Statistics for
Experimenters, John Wiley & Sons, New York, 1st edn, 1978.26 G. E. P. Box, W. G. Hunter and J. S. Hunter, Statistics for
Experimenters: Design, Innovation, and Discovery, John Wiley& Sons, Hoboken, 2st edn, 2005.
27 M. Siebert, M. Seibicke, A. F. Siegle, S. Krah and O. Trapp, J.Am. Chem. Soc., 2019, 141, 334–341.
28 M. Seibicke, M. Siebert, A. F. Siegle, S. M. Gutenthaler andO. Trapp, Organometallics, 2019, 38, 1809–1814.
29 S. Dabral and T. Schaub, Adv. Synth. Catal., 2019, 361, 223–246.
30 R. Sun, I. Delidovich and R. Palkovits, ACS Catal., 2019, 9,1298–1318.
31 K. Thenert, K. Beydoun, J. Wiesenthal, W. Leitner andJ. Klankermayer, Angew. Chem., Int. Ed., 2016, 55, 12266–12269.
32 B. G. Schieweck and J. Klankermayer, Angew. Chem., Int. Ed.,2017, 56, 10854–10857.
33 S. Bontemps, L. Vendier and S. Sabo-Etienne, Angew. Chem.,Int. Ed., 2012, 51, 1671–1674.
34 S. Bontemps, L. Vendier and S. Sabo-Etienne, J. Am. Chem.Soc., 2014, 136, 4419–4425.
35 G. Jin, C. G. Werncke, Y. Escudie, S. Sabo-Etienne andS. Bontemps, J. Am. Chem. Soc., 2015, 137, 9563–9566.
Chem. Sci., 2019, 10, 10466–10474 | 10473
Chemical Science Edge Article
Ope
n A
cces
s A
rtic
le. P
ublis
hed
on 2
4 O
ctob
er 2
019.
Dow
nloa
ded
on 3
/20/
2022
1:1
7:04
AM
. T
his
artic
le is
lice
nsed
und
er a
Cre
ativ
e C
omm
ons
Attr
ibut
ion
3.0
Unp
orte
d L
icen
ce.
View Article Online
36 A. Aloisi, J.-C. Berthet, C. Genre, P. Thuery and T. Cantat,Dalton Trans., 2016, 45, 14774–14788.
37 M. R. Espinosa, D. J. Charboneau, A. Garcia de Oliveira andN. Hazari, ACS Catal., 2019, 9, 301–314.
38 T. T. Metsanen and M. Oestreich, Organometallics, 2015, 34,543–546.
39 P. Rıos, N. Curado, J. Lopez-Serrano and A. Rodrıguez, Chem.Commun., 2016, 52, 2114–2117.
40 Y. Jiang, O. Blacque, T. Fox and H. Berke, J. Am. Chem. Soc.,2013, 135, 7751–7760.
41 F. A. LeBlanc, W. E. Piers and M. Parvez, Angew. Chem., Int.Ed., 2014, 53, 789–792.
42 G. E. P. Box and N. R. Draper, Empirical Model-Building andResponse Surfaces, John Wiley & Sons, New York, 1987.
43 D. C. Montgomery, Design and Analysis of Experiments, JohnWiley & Sons, New York, 3rd edn, 1991.
44 L. Breiman, Mach. Learn., 2001, 45, 5–32.
10474 | Chem. Sci., 2019, 10, 10466–10474
45 T. Hastie, R. Tibshirani and J. Friedman, The Elements ofStatistical Learning, Springer-Verlag, New York, 2nd edn,2009.
46 A. Sen and M. Srivastava, Regression Analysis, Springer-Verlag, New York, 1990.
47 R Core Team, R: A Language and Environment for StatisticalComputing, R Foundation for Statistical Computing,Vienna, Austria, 2017, https://www.R-project.org/.
48 A. Liaw and M. Wiener, R News, 2002, 2, 18–22.49 B. Wheeler, AlgDesign: Algorithmic Experimental Design, R
package version 1.1-7.3, 2014, https://CRAN.R-project.org/package¼AlgDesign.
50 A. Ghalanos and S. Theussl, Rsolnp: General Non-LinearOptimization, R package version 1.16, 2015, https://CRAN.R-project.org/package¼Rsolnp.
51 D. Sarkar, Lattice, Springer-Verlag, New York, 2008.
This journal is © The Royal Society of Chemistry 2019