volume 03 july 2014 number 01 - gla...
TRANSCRIPT

Volume 03 July 2014 Number 01
Importance of Services in Organised Retail -
An Empirical Study
Volatility Forecast of BSE Ltd., Broad Indices
Analysis of it Infrastructure as A Factor Affecting
E-Commerce and Its Impact on Consumer Satisfaction
Impact of Social Networking on Employee Engagement
at Workplace: an Empirical Study Based on it
Industry in India
Impact of The Economic Crisis on Corporate
Financial Reporting: Stakeholders’ Perceptions
Causal Loop Modeling of Macroeconomic
Determinants of Stock Market Volatility
Abhaya Ranjan Srivastava
Dr. Saumya Singh
Dr. Anand Mohan Agrawal
Dr. Y. V. Ramana Murthy
Dr. K. Kameshwari
Dr. Shailendra Kumar, Vikalp
Shubham Arya, Shreyash Bharadwaj
Bhavya Mathur
Divyanhsu Ojha
Dr. Shailendra Kumar
Hina Agarwal
Sonam Bhadauriya
Recognised by UGC Under Section 2(f)

Executive Editor
Keeping an eye on Kaleidoscopic range of issues influencing the business management and administration Prastuti - Journal of Management and Research forays into the realm of advances and amelioration being made in the field of management practices and studies. It provides a podium for the dissemination and experimentation for practices and policies of the business management and administration. Prastuti (ISSN 2320-2262) is published biannually in January & July by the Institute of Business Management, GLA University, Mathura.
GLA University of PRASTUTI, Journal of Management & Research assumes no responsibility for the views expressed or information furnished by the authors.
Please direct all the manuscripts, editorial correspondence and subscriptions by D.D. payable at Mathura to the EDITOR-IN-CHIEF, PRASTUTI, Journal of Management & Research, Institute of Business Management, GLA University, Mathura-281406, Ph. No.: +91-5662-250718, E-mail: [email protected]
Vol. 03 - No. 01 © 2014 Institute of Business Management, GLA University, Mathura
Prof. D.S. Chauhan, Vice-Chancellor, GLA University
Prof. Anand Mohan Agrawal
Dr. Ankit Saxena

Editor’s Preface
The world economic spectrum has gone under tremendous transformation in
last few months in all aspects. The world economy is in the progression of resurgence,
combating the several issues like international terrorism and inter-continental political
issues. In India, we witnessed a historical political transformation. As always, the
hopes from the new government are elevated and next few years are quite challenging
for Indian economy.
Coming to the current issue of this journal, I am pleased to inform that, we have
published six quality research publications spreading different functional areas of
Management domain. The papers have approached to various domains of economy.
Srivastava et. al. in their contribution entitled “Importance of Services in
Organised Retail – An Empirical Study” have derived that services provided to
customers are one very essential factor which leads to more number of customers to an
organisation. Jharkhand a comparatively new state is also witnessing a significant shift
from unorganised retailing to organised retailing. The study aims to assess the
importance of service in attracting and increasing customers for the organised retail
outlets. Need for good service as an important factor in increasing and attracting
customers to the organised retail outlets cannot be negated and the same has been seen
expressed by the respondents in this study.
Murthy Y. V. R and Kameshwari K. in their empirical work entitled “Volatility
Forecast of BSE Ltd., Broad Indices” have underlined that volatility plays a very
important role in any financial market around the world. This research attempts to
present risk metrics which helps to manage risks such as to measure the difference in
actual and expected volatility which can act as an effective hedging tool, portfolio
diversification and overall risk management.
Kumar et. al. in “Analysis of IT Infrastructure as a Factor Affecting E-Commerce
and its Impact on Consumer Satisfaction”, have correctly stated that the economic
reforms of 1991 have completely changed the scenario in which business is being done
in India. The advancement in Information Technology (IT) also helps the e-commerce
to grow rapidly. This paper extends the research on e-commerce in India. The paper
uses a survey based approach to draw the conclusions. Using data from 300
respondents, they concluded that Internet unavailability, slow access of internet,
security concerns and the transaction process are the major concerns exist. The paper
shows the impact of these factors on consumer satisfaction on e-commerce.

Mathur et. al. in their research on a quite contemporary emerging phenomena
viz. “Impact of Social Networking on Employee Engagement at Workplace: An
Empirical Study Based on IT Industry in India” have derived that organizations across
the globe struggling with how best to introduce social networking tools - blogs, micro
blogs like Twitter, Collaboration platforms like Facebook to internal audiences. Social
networking has always been stated for distracting employees but with its proper and
regulated use, it can have the obverse effect. This paper examines, explores and gains a
quantitative insight of the same in detail and establishes that employee engagement is
a function of use of social networking at workplace. People often make use of social
networking to gain work related ideas, enhance accuracy in decision making and as a
medium of knowledge and information sharing.
Hina Agarwal in her research paper entitled “Impact of the Economic Crisis on
Corporate Financial Reporting: Stakeholders’ Perceptions” underlines that in the age
of globalization, no country can remains isolated from the fluctuations of world
economy. Heavy losses suffered by major International Banks affect all countries of the
world as they have their investment interest in almost all countries. This study aimed
to stand on the opinions of relevant stakeholders in the field of corporate financial
reporting practices after economic crisis in India. In the opinion of stakeholders there is
need to apply global reporting practices to smoothen the corporate’s working and for
making the system more transparent.
Sonam Bhadauriya in her contribution entitled “Causal Loop Modeling of
Macroeconomic Determinants of Stock Market Volatility” explores logically
structured framework for interrelationship among the stock market returns and the
macroeconomic determinants via a causal loop diagramming. Stock market dynamics
or volatility refers to the variation in the stock price changes during a period of time.
The volatility of stock market indicators goes beyond anyone’s reasonable
explanations. The modeling of stock market volatility is one of the key areas of present
financial research as stock market is the main determinant of economic development of
a country.
I take this opportunity to invite all the professionals, researchers and
academicians to send their conceptual or empirical papers, case studies and book
reviews for publishing in this journal. Finally, I thank all the reviewers for their time
and valuable suggestions and also congratulate all the contributors for their research.
Anand Mohan AgrawalEditor-in-ChiefPrastuti
Contents
1. Importance of Services in Organised Retail - An Empirical Study 01-07
Abhaya Ranjan Srivastava, Dr. Saumya Singh, Dr. Anand Mohan Agrawal
2. Volatility Forecast of BSE Ltd., Broad Indices 08-34
Dr. Y. V. Ramana Murthy, Dr. K. Kameshwari
3. Analysis of it Infrastructure as A Factor Affecting E-commerce and
its Impact on Consumer Satisfaction 35-45
Dr. Shailendra Kumar, Vikalp, Shubham Arya, Shreyash Bharadwaj
4. Impact of Social Networking on Employee Engagement at Workplace:
An Empirical Study Based on it Industry in India 46-52
Bhavya Mathur, Divyanhsu Ojha, Dr. Shailendra Kumar
5. Impact of The Economic Crisis on Corporate Financial Reporting:
Stakeholders’ Perceptions 53-63
Hina Agarwal
6. Causal Loop Modeling of Macroeconomic Determinants of
Stock Market Volatility 64-71
Sonam Bhadauriya


Retailing is one of the most active and attractive sector of the last decade. While retailing itself has been present through history in our country, it is only the recent past that has witnessed so much dynamism in India. Organised retail has been preferred by customers because of various features such as variety, ambience, convenience, better services, etc. Services provided to customers are one very essential factor which leads to more number of customers to an organisation. Since their starting organised retailers have used customer service as one of the important tool to attract new and retain existing customers. Jharkhand a comparatively new state is also witnessing a significant shift from unorganised retailing to organised retailing.
This study aims to assess the importance of service in attracting and increasing customers for the organised retail outlets. A total of seven statements signifying services have been considered in the study. The various services focussed in the study are – the faster billing procedures, better customer relationship management practices, free gift packaging facility, free alteration, child care facility, exchange facility and personal attention to customers.
Keywords: Organised Retail, Services, Customer Relationship Management Practices
Importance of Services in Organised Retail - An Empirical Study
Abstract
Preamble
Retailing is one of the most active and attractive sector
of the last decade. While retailing itself has been present
through history in our country, it is only the recent past
that has witnessed so much dynamism in India. The
world ‘retail’ means selling directly to customers in small
quantities as demanded by them. In India for
generations the nearby grocery stores were the
convenient options for the customers to purchase goods
for themselves. As organised retailing ventured in the
Indian market it changed the buying patterns of the
Indians. Over the past few years there has been a
proliferation of organised retail players from abroad.
Existing players have been trying to increase their
presence in the retail market. A number of large
domestic business groups such as Tata, Reliance, ITC,
RPG, Raheja and Piramal have setup malls and built
businesses within retail. Organised retailers provide
many distinctive advantages as compared to the
traditional retailers like - pleasant ambience,
convenience, variety, good infrastructure, better
services etc.
India has been ranked on fourteenth position on the
Global Retail Development Index in the AT Kearney
Report 2013 and fourth in Asia. As an affect of the global
slowdown India’s growth rate has slipped to 5 percent
from a 10 year average of 7.8 percent. On the GRDI
India’s position has gone down by nine spots in
comparison to the ranking of 2012 but it still holds a
strong position. The world's largest developing markets -
particularly the BRIC nations (Brazil, Russia, India, and
China) still allure the largest global retailers because of
the anemic growth in European and North American
markets. But it has become tough for them to have a
Abhaya Ranjan Srivastava*Dr. Saumya Singh**
Dr. Anand Mohan Agrawal***
*Assistant Professor, Department of Management, Birla Institute of Technology, Lalpur, Ranchi**Associate Professor, Department of Management Studies, ISM Dhanbad***Pro Vice Chancellor, GLA University, Mathura
01
global expansion strategy in retail. Every market has its
own characteristics which require unique strategies for
success. The GRDI 2013 report highlights that global
retailers have become more cautious and have taken a
step back from aggressive expansion.
India still remains a high-potential market with an
accelerated retail market growth of 14 to 15 percent by
2015. India’s GDP growth rate of 6 to 7 percent, the rising
disposable income particularly of the Indian middle-class
and the rapid urbanisation signifies the retail growth in
India. The changes made in the FDI regulations in October
2012 by the Government of India indicate a positive
environment for the international retailers and retail
growth in general. Organised retail share in India is still
around 5percent which indicates a room of high growth
opportunity for the organised retailers. Retailers are
presently expanding their presence in tier 2 and tier 3
cities because the cost of real estate has skyrocketed in
the metro areas. Metro, Bharti-Walmart and Carrefour
have increased their presence in these markets.
Jharkhand also witnessed the entry of some of the retail
chains like- Spencer, Reliance, Big Bazaar and Vishal
Megamart Most of these started with multiple number of
outlets but all of them could not sustain. Closure of some
of the retail outlets in Jharkhand sent a warning signal to
the existing ones and also to those who were looking to
enter in this market. It has become now clear to the retail
players that only opening the stores will not lead to
success rather one has to catch the pulse of the market
and act accordingly within time. The companies have to
be update and upgrade them with the latest
developments to be successful. This study was conducted
in Jharkhand witnessing the changes going in its retail
market. Before moving further let us have a brief look on
the factors advocated as important by researchers in the
past.
Price: It is one of the most important factors for Indian
consumers in their purchase decision. Organised retailers
have large presence due to which they achieve economies
of scale in their operations. So they are able to offer
products at cheaper rates as compared to the traditional
retailers. This has helped them in attracting new
customers and retaining the existing ones.
Variety: Another strong point of organised retailers has
been variety which is much higher as compared to the
traditional retailers. The availability of products even in
various sizes and quantities has increased their customer
base. Nuclear families, bachelors and persons living alone
away from their family prefer retail outlets because they
are able to buy products in small and varied quantities.
Brand Image: Their brand image has also helped in getting
more customers. Entry of international players and big
business houses in the retail sector has increased the
confidence of the customers in their purchases. The
customer feeling of getting reasonable or better quality,
equal treatment and the confidence of not getting
cheated has definitely increased their customer base.
Convenience: Proper locations, long opening hours, pick
and choose facility and pleasant ambience has added
convenience in shopping to the Indian consumers and is
leading to more customers for the organised retailers.
Promotions: Ability to advertise which is not possible
with the neighbourhood stores has differentiated them
and attracted customers. Use of technology to inform
customers by sms, e-mail has helped them to inform
customers in advance about their new schemes and
offers. This has made their promotional efforts more
attractive and organised as compared to the traditional
retailers.
Different Payment Options: The option of paying in cash
or through debit & credit cards has also attracted more
customers. The choice of not carrying cash while
purchasing has increased convenience and safety to the
customers. This has also led to more impulse and
unplanned purchases by customers thus increasing the
share of organised retailers in the Indian retail.
Infrastructure: Shopper friendly store design, air
conditioned environment, trolleys, big size stores have
resulted in a good infrastructure which has brought
customers in organised retail outlets. This is definitely
distinctive and attractive as compared to the traditional
retailers. In this infrastructure Customers never feel
bored or tired while purchasing leading to higher
purchases by them.
02
Prastuti: Vol. 3, No. 1, July 2014

Importance of Services in Organised Retail - An Empirical Study
03
Service: Services provided to customers are one very
essential factor which leads to more number of customers
to an organisation. As customers one can easily deduce
that customer service provided by the organised retailers
have been better as compared to the traditional retailers
in India. Since their starting organised retailers have used
customer service as one of the important tool to attract
new and retain existing customers. Organised retailers
have also used technology as a tool to differentiate their
services as compared to the traditional retailers. Use of
optical scanners at billing counters has made the billing
process faster. They have used the services not only to
differentiate but also to add value in the shopping
experience of the customers. Provision of free alterations
in garments, personal attention provided to customers by
sales staff to help and assist if required has definitely
added higher value in the shopping experience.
The Indian customers are very busy in their office & house
hold activities due to which they are in lack of time
particularly in big cities. The services offered by the
organised retailers has not only taken care for this rather
they have also tried that the customers do their
purchasing in less time with ease and comfort. Availability
of prams in bigger outlets has increased the ease in
purchasing. Free alteration, free gift packaging, etc. are
some of the other services which are distinctive when we
compare them with the traditional retailers.
Literature Review
The emergence of retailing in India has more to do with
the increasing purchasing power of the buyers, especially
in the post liberalization era (Prakash, 2007). An
improvement could be seen in the quality of life of urban
Indian consumers. The growing affluence of the Indian
middle class, a flood of imported products in the fashion
and food categories, the increasing space for groceries
and the emergence of a new breed of entrepreneurs are
drivers of boom in retail sector of India. (Krishnan &
Venkatesh, 2008). Upsurging Consumerism, changing
lifestyle, increasing access to information and ever
improving technology, made the last decade observe an
enormous development in the retail sector around the
globe (Lahiri & Samanta, 2010). Customers receive
relational benefits from service relationships (Gwinner,
Gremler, & Bitner, 1998). Good service and good selling
help in retaining, enhancing and cementing relationship
resulting in relationship management which finally leads
to competitive advantage for the firm (Kar & Nanda,
2011).
Good Customer Service attracts more customers and
increases consumer satisfaction (C & Hariharan, 2008).
Organised retailer should implement various value-added
services to provide pleasant shopping experiences to
consumers (Ramanathan & Hari, 2011). The authors
indicate that alert staff helps in building this relationship
by being courteous and giving personal attention to the
customers. More than 60 percent of the customers
perceive that customer service to be good in the
organised retail outlets (Dalwadi, Rathod, & Patel, 2010).
CRM practices have gained attention from both
academics and practitioners in the recent years due to the
intense competition in the retail market. The product-
centric business has transformed into a customer-centric
business in this intense competitive environment (Prasad
& Aryasri, 2008). Regular entry of new retailers could be
seen with new formats. The present models which are
successful highly in certain parts of the country are only
moderately successful in other areas. Better services are
used as one of the important driver to bridge this gap
(Krishnan & Venkatesh, 2008). Organised retailers have
tried to meet the expectations of the customers by
providing superior products and services.
Billing system acts as one of the important determinants
for preference of Mega Marts (Sonia, 2008). Use of optical
scanners at billing counters has made the billing process
faster. This has facilitated in completing the purchasing
exercise faster for the customers in today’s busy life. They
have used the services not only to differentiate but also to
add value in the shopping experience of the customers.
Fast processing is welcomed and appreciated by the
modern housewives (Krishnan & Venkatesh, 2008). Old
customers enjoy interactions and prefer those retail
stores where they receive special assistance services like
valet parking, carry-out assistance and delivery assistance
(Das, 2011). Technology would be the primary driver in
future for differentiating services. Application of
technology will revamp the stores and the shopping
experience for the customers (Misra & Khan, 2008). To
date there is a lack of studies that examine the various
aspects of service that are important for customer
retention (Zeithmal, 2000). Since still there is lack of
studies justifying the role of services, more work is
required to be carried out in this direction.

Prastuti: Vol. 3, No. 1, July 2014
04
Research Methodology
This study tries to assess the importance of service in
attracting and increasing customers for the organised
retail outlets in Jharkhand. The present study was carried
out using stratified purposive sampling. Questionnaires
were distributed to 550 people in the districts of Ranchi,
Dhanbad and Jamshedpur of Jharkhand. A total of 465
filled questionnaires were received. A five point likert
scale was used in the questionnaire to know the ratings of
the respondents. Seven statements have been
considered to represent Services in this study. The various
services variables focussed in the study are - the billing
procedures are faster, customer relationship
management practices are good, free gift packaging
facility, free alteration, child care facility, exchange facility,
and personal attention to customers.
The respondents had varied preferences regarding the
customer services offered by the organised retailers. SPSS
17 was applied to analyse the data collected for the study.
It identified the relative impact levels and the KMO and
Bartlett’s test of Sphericity. Communality method of
principal Component Extraction was done to identify the
key factors contributing to the effectiveness of organised
retail. Expert’s opinion was also taken in the designing of
questionnaire.
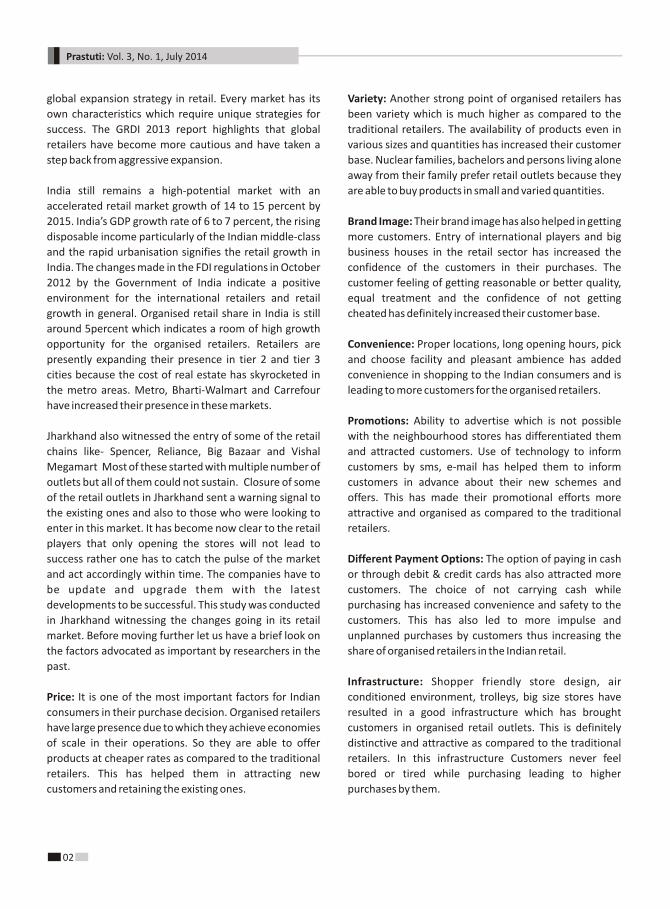
Discussion of Research Findings
Table 1 presents the percentage of responses on all the 7
statements representing service. Customers have
indicated that all the seven service variables are
important and have shown their preference. Child care
facility has not received a good response because it is not
available at all the retail outlets. But this service variable
has received a substantial response which indicates it as
an important. Child care facility can act as a distinguishing
service variable which adds comfort to the purchasing so
it needs to be improved to increase the customer
satisfaction.
Cronbach’s Alpha: A value of 0.628 for Croanbach Alpha
indicates the reliability of the construct.
KMO Measure of Sampling Adequacy: As the KMO test
value is 0.646 which is more than 0.5 it indicates that we
can go for factor analysis.
Bartlett’s Test of Sphericity: Since the Chi-Square value is
higher, i.e. - 379.729 and significance level is 0.000 it
means we can definitely go for factor analysis.
Table 4 shows the 7 variable which are representing the
different services offered to consumers. These 7 variables
were put for factor analysis and have resulted into
extraction of two factors. The first factor consists of
4variables and has been named as ‘Basic Services’ and the
second factor consists of 3 variables and has been named
as ‘Extra Services’. The extracted factors support the
researches done in past. This justifies the contributions of
the earlier researches which say that service is one of the
important determinants in the success of organised retail.
Previous studies by Gwinner, Gremler, & Bitner (1998),
Prasad & Aryasri (2007), C & Hariharan (2008), Dalwdi,
Rathore, & Patel (2010), Karadeniz (2010), Kar & Nanda
(2011), Ramanathan & Hari (2011), support this view. Let
us have a brief look on the extracted factors.
Basic Services: This has emerged as the dominant factor
in case of services. It contains the variables which are
definitely demanded by customers. Most of the
customers feel that Customer Relationship Management
practices are good but because of the regular inflow of
new schemes floated by new and existing players the
updating and upgradation in Customer Relationship
Management practices are constantly desired. Customers
feel that the billing procedures are not fast although
application of technology is used by organised retailers in
the billing process. It signifies that organised retailers
need to improve on this service variable if they want to
use it as a differentiated service over traditional retailers.
The efforts of the staff have been appreciated as a service
element by the respondents which convey a positive
feeling towards organised retailers and would ensure a
promising future for them. The Exchange facility provided
by the organised retailers is a very important service
feature in terms of the value it holds in the minds of the
customers. A time period is specified in the bill provided
to the customers during which they can come and
exchange their products.
Extra Services: The service variables representing this
factor are not provided by all retailers. Unorganised
retailers generally do not provide them and is also not
available with all organised retailers. Free gift packaging if
provided by all the organised retailers would act as a
service element to bring more customers. This is already

Importance of Services in Organised Retail - An Empirical Study
05
acting as a positive element for those who are providing
it. Free Alteration is provided by almost all organised
retailers but by only few unorganised retailers provide it.
It has created a positive impact as a service element. In
cases where customers are purchasing during vacations
or outside their home town it has emerged important
because in lack of time they could get their products
altered in the showrooms of the same company in any city
of India. Child care facility is a distinguishing service
feature provided by the organised retailers which has
added value in their service basket and also made the
purchasing comfortable for the customers. Availability of
prams in retail outlets, proper washroom facility
especially for small kids, etc. are a part of this. It should be
treated as an important element of service for increasing
the customer base
Conclusions
Need for good service as an important factor in increasing
and attracting customers to the organised retail outlets
cannot be negated and the same has been seen expressed
by the respondents in this study. A good service has its
own benefits for any business be it a retail business or any
other. Factor analysis applied to the service variables has
grouped the seven variables into two factors. These
factors have been named as ‘BASIC SERVICES’ and ‘EXTRA
SERVICES’.
Recommendations
Based on the results of the present research the following
recommendations could be made:
• Service is an important factor which influences the
purchase from organised retail outlets. In this
changing environment having a uniform service
strategy throughout the stores in India would not be
possible so organised retailers should try to
customise their services to the local needs which are
unique. This could be achieved by developing a
deeper insight about consumer preferences.
• Out of the two factors extracted the factor ‘Basic
Services’ has emerged as the dominant factor but
the second factor ‘Extra Services’ also needs
reasonable attention by the organised retailers to be
successful.
Limitations
As all studies have suffers limitations the present study
also has certain limitations. This analysis is based on the
questionnaires which were filled by respondents in
Jharkhand only. A bigger sample and broader market
coverage would help in generalising the results for the
whole of India.
Appendix
Table 1: Percentage response on Statements/Variables
Statements/ Variables Strongly Agree Agree Not Known Disagree Strongly Disagree
The billing procedures are faster 12.1% 42.3% 3.5% 36.3% 5.7%
Customer Relationship Management practices are good
7.0% 63.2% 13.9% 13.9% 2.0%
Personal Attention to customer 13.2% 42.7% 13.7% 26.9% 3.5%
Exchange facility 16.3% 54.4% 16.3% 11.9% 1.1%
Free Gift Packaging 7.5% 35.5% 16.7% 33.3% 7.0%
Free Alteration 10.4% 58.4% 14.8% 13.0% 3.5%
Child care facility 6.2% 22.3% 25.1% 35.7% 10.8%
Statements/ Variables Components (Loading Criteria>0.4)
1 2
Personal Attention to Customers 0.483
Customer Relationship Practices are good 0.769
Exchange Facility 0.674
The billing procedures are faster 0.510
Child Care facility 0.568
Free Alteration 0.687
Free Gift Packaging Facility 0.846
Kaiser-Meyer-Olkin Measure of Sampling Adequacy
Bartlett’s Test of Sphericity !pprox. Chi -Square
Df
Sig.
0.646
379.729
464
0.000
Cronbach’s Alpha N of Items
0.628 7
N %
Cases Valid
Excluded
Total
465
0
465
100.0
0.0
100.0
Prastuti: Vol. 3, No. 1, July 2014
06
Table 2: Case Processing Summary
Table 3: Reliability Statistics
Table 3: KMO and Bartlett’s Test
Table 4: Rotated Component Matrices of 7 Variables
Extraction Method: Principal Component Analysis; Rotation Method: Varimax with Kaiser Normalization; a. Rotation Converged in 3 Iterations.
Table 5: Naming of the extracted Factors (Loading Criteria>0.4)
Factor No. Statements/ Variables Factor Loading Naming of Factors
1 Personal Attention to Customers 0.483 Basic Services
Customer Relationship Management Practices are good 0.769
Exchange Facility 0.674
The billing procedures are faster 0.510
2 Child Care facility 0.568 Extra Services
Free Alteration 0.687
Free Gift Packaging Facility 0.846

Bibliography
• C, A., & Hariharan, G. (2008, February). Profile and
Perception of Retail Customers-An Empirical Study in
Palakkad District. Indian Journal of Marketing,
24-29.
• Dalwadi, R., Rathod, H. S., & Patel, A. (2010, April-
August). Key Retail Store Attributes Determining
Consumers' Perceptions: An Empirical Study of
Consumers of Retail Stores Located in Ahmedabad
(Gujrat). SIES Journal of Management, 7(1), 20-34.
• Das, G. (2011, July). Effect of Retail Sales Promotion
on Buying Behaviour of Customers: An Empirical
Study. Indian Journal of Marketing, 25-35.
• Gwinner, K. P., Gremler, D. D., & Bitner, M. J. (1998).
Relational Benefits in Services Industries: The
Customer's Perspective. Academy of Marketing
Scince, 26(2), 101-114.
• Kar, S. K., & Nanda, S. (2011). Relationship Marketing
and Indian Shoppers. The IUP Journal of Marketing
Management, X(4), 7-32.
• Karadeniz, M. (2010). The Relationship marketing
Approach and Strategiesin Retailing Management to
Constitute Customer andBrand Loyalty. Journal of
Naval Science and Enginerring, 6(1), 15-26.
• Krishnan, N. V., & Venkatesh, S. P. (2008, March).
Challenges of Merchandising Strategies in Fashion
Retailing - A Study on Private Labels Vs
Manufactured Brands. Indian Journal of Marketing,
14-21.
• Lahiri, I., & Samanta, P. K. (2010). Factors Influencing
Purchase of Apparels from Organized Retail Outlets.
The IUP Journal of Marketing Management, IX(1&2),
73-87.
• Misra, A., & Khan, M. Y. (2008, March). FDI in
Retailing. Indian Journal of Marketing, 22-29.
• Patil, P. P., & Vedak, V. (2011, February). The Private
Label: Retailer's Value Proposition and Strategic Tool
of Differentiation. Indian Journal of Marketing,
54-60.
• Prakash, N. (2007). Retailing Revolution in India-An
Overview. The Management Accountant, 42(10),
764-66.
• Prasad, J. S., & Aryasri, A. R. (2008). Study of
Customer Relationship Marketing Practices in
Organised Retailing in Food and Grocery Sector in
India: AnEmpirical Analysis. VISION-The Journal of
Business Perspective, 12(4), 33-43.
• Ramanathan, V., & Hari, K. (2011, December). A
Study On Consumer Perception About Organized Vs
Unorganized Retailers at Kanchipuram, Tamil Nadu.
Indian Journal of Marketing, 11-23.
• Sonia. (2008). Customer Perception Towards Mega
Mart. Services Marketing, 6(4), 38-48.
• Zeithmal, V. A. (2000). Service Quality, Profitability
and the Economic Worth of the Customers: What we
Know and What we Need to Learn. Journal of
Academy of Marketing Sciences, 28(1), 67-85.
• http://www.grdi.atkearney.com/accessed on 2013-
01-2012
• http://www.grdi.atkearney.com/accessed on 2013-
11-28
Importance of Services in Organised Retail - An Empirical Study
07

Volatility plays a very important role in any financial market around the world. Accurate forecasting of volatility is essential for taking wise and timely decisions for transacting financial products and to manage other financial applications. The goal of any volatility model is to be able to forecast volatility. In this paper “VOLATILITY FORECAST OF BSE LTD. BROAD INDICES”, focuses on volatility forecasting through three widely used time series volatility models namely, the Historical Variance, time series of univariate data, the Generalized Autoregressive Conditional Heteroscedastic Model (GARCH) and the Risk Metrics, Exponential Weighted Moving Average (EWMA) . The characteristics of these volatility models are explored using monthly data on the BSE broad indices for a period of 4 years. (Jan 2010 to Jan 2014). “VOLATILITY FORECAST OF BSE LTD. BROAD INDICES”, analysis through GARCH(1,1) of BSE S&P, BSE MIDCAP, BSE SMALL CAP, BSE 100, BSE 200 and S&P 500 have shown the volatility ranging from 1.52 to 6.87%, whereas the same indices through Exponential Generalized Autoregressive Conditional Heteroscedastic Model (EGARCH )model has shown the volatility range from 4.55 to 10.59%.
Keywords: Volaitity forecast, BSE broad indices, Time series, Generalized Autoregressive Conditional Heteroscedastic Model (GARCH), Risk metrics, Exponential Weighted Moving Average (EWMA)
Volatility Forecast of BSE Ltd., Broad Indices
Abstract
Introduction
The paper entitled “VOLATILITY FORECAST OF BSE LTD.
BROAD INDICES” attempts to present the volatility
forecast of the BSE broad indices for a period of one year
from Jan 2014. The six BSE broad indices are widely
chosen by the investors and forecasting volatility for the
same carries significance for investment decisions.
Hence the study is focused on forecasting the volatility of
BSE S&P SENSEX, BSE SMALL CAP INDICES, BSE MID CAP
INDICES, BSE 100, BSE 200 AND BSE 500 INDICES. BSE
was established in 1875, BSE Ltd. (formerly known as
Bombay Stock Exchange Ltd.), which is presently Asia’s
first Stock Exchange and one of India’s leading exchange
groups. Over the past 137 years, BSE has facilitated the
growth of the Indian corporate sector by providing it an
efficient capital-raising platform. More than 5000
companies are listed on BSE making it world's No. 1
exchange in terms of listed members. The companies
listed on BSE Ltd command a total market capitalization
of USD 1.32 Trillion as of January 2013. It is also one of
the world’s leading exchanges (3rd largest in December
2012) for Index options trading (Source: World
Federation of Exchanges).
Research Methodology
• Source of Data: The data is collected from the
bseindia.com and analyzed by using the NUMXL
software Excel addin.
• Objective: To find out the BSE broad indices
volatility.
• Study period: Period of 4 years from 2010 January
to 2014 January is taken.
• Techniques used:
• Log returns: log returns are calculated for the
Dr. Y. V. Ramana Murthy*Dr. K. Kameshwari**
*Asstt Prof, Centre for Management Studies, NALSAR University of Law, Hyderabad. E-mail: [email protected]**Asstt Prof, Integral Institute of Advanced Management, Visakhapatnam, AP, India. Email:[email protected]
08

monthly returns which can provide better values
distribution prices between January 2010 and July
2014.
• WMA: A Weighted Moving Average (WMA) assigns a
weighting factor to each value in the data series
according to its age. The most recent data gets the
greatest weight and each price value gets a smaller
weight as it counts backward in the series.
• EWMA: is computed to estimate the next-day (or
period) volatility of a time series and closely track the
volatility as it changes. EWMA is basically a special
form of an ARCH() model where the ARCH order is
equal to the sample data size and the weights are
exponentially declining at rate throughout time.
(lambda 0.94).
• Correlogram: To find out the ACF and PACF to
understand the lag order position and decide the
model.
• EGARCH (1,1): Volatility forecasting through
econometric models have gained wide popularity.
Egarch analysis, the exponential general
autoregressive conditional Heteroscedasticity
(model by Nelson (1991) is another form of the
GARCH model . The exponent ia l genera l
autoregressive conditional heteroskedastic (E-
GARCH) model by Nelson (1991) is another form of
the GARCH model. Formally, an EGARCH(p,q):
Where:
is the time series value at time t.
is the mean of GARCH model.
is the model's residual at time t.
is the conditional standard deviation (i.e. volatility)
at time t.
is the order of the ARCH component model.
are the parameters of the ARCH
component model.
is the order of the GARCH component model.
are the parameters of the GARCH component
model.
are the standardized residuals:
is the probability distribution function for .
Currently, the following distributions are supported:
Normal distribution P_{\nu} = N(0,1)
Student's t-distribution
Generalized error distribution (GED)
The E-GARCH model differs from GARCH in several ways.
For instance, it used the logged conditional variances to
relax the positiveness constraint of model coefficients.
EGARCH (p,q) model has 2p+q+2 estimated parameters.
EGARCH_VL (alphas, betas, innovation, v)
Alphas are the parameters of the ARCH(p) component
model (starting with the lowest lagi).
Betas are the parameters of the GARCH(q) component
model (starting with the lowest lag).
Innovation is the probability distribution model for the
innovations/residuals (1=Gaussian, 2=t-Distribution,
3=GED). If missing, a gaussian distribution is assumed.
1 Gaussian or Normal Distribution (default)
2 Student's t-Distribution
3 Generalized Error Distribution (GED)
V is the shape parameter (or degrees of freedom) of the
innovations/residuals probability distribution function.
The EGARCH long-run average log variance is defined as:
Where:
Gaussian distributed innovations/shocks:
GED distributed innovations/shocks.
09
Volatility Forecast of BSE Ltd., Broad Indices

is the probability distribution function for .
Normal distribution:
Student's t-distribution:
Generalized error distribution (GED):
Review of Literature
Padhi (2005) explained the stock market volatility at the
individual script level and at the aggregate indices level.
The empirical analysis has been done by using ARCH,
GARCH model and ARCH in Mean model and it is based on
daily data for the time period from January 1990 to
November 2004. The analysis reveals the same trend of
volatility in the case of aggregate indices and five different
sectors such as electrical, machinery, mining, non-
metallic and power plant sector. The GARCH (1, 1) model
is persistent for all the five aggregate indices and
individual company. Karmakar (2006) measured the
volatility of daily stock return in the Indian stock market
over the period of 1961 to 2005. Using GARCH model, he
found strong evidence of' time varying volatility. He also
used the TGARCH model to test the asymmetric volatility
effect and the result suggests the asymmetry in volatility.
Rao, Kanagaraj and Tripathy (2008) attempts to
determine the impact of individual stock futures on the
underlying stock market volatility in India by applying
both GARCH and ARCH model for a period of seven years
from June 1999 to July 2006. This study includes stock of
10 companies i.e Reliance, SBI, TISCO, ACC, MTNL, TATA
Power, TATA Tea, BHEL, MAHINDRA & MAHINDRA and ITC.
The results suggest that stock future derivatives are not
responsible for increase or decrease in spot market
volatility and conclude that there could be other market
factors that have helped the increase in Nifty volatility.
Vuyyuri and Roy (2003) modelled the monthly volatility of
market indices (Sensex & S&PCNX-Nifty) of Indian capital
markets using eight different univariate models. Out-of-
sample forecasting performance of these models has
been evaluated using different symmetric, as well as
asymmetric loss functions. The GARCH (1, 1) model has
been found to be the overall superior model based on
most of the symmetric loss functions, though ARCH has
been found to be better than the other models for
investors who are more concerned about under
predictions than over predictions.
Student's t-Distributed innovations/shocks.
The time series is homogeneous or equally spaced.
The number of gamma-coefficients must match the
number of alpha-coefficients.
The number of parameters in the input argument - alpha -
determines the order of the ARCH component model.
The number of parameters in the input argument - beta -
determines the order of the GARCH component model.
GARCH MODEL (1,1):
An autoregressive moving average model (ARMA model)
is assumed for the error variance, the model is a
g e n e r a l i z e d a u t o r e g r e s s i v e c o n d i t i o n a l
heteroskedasticity (GARCH in Excel, Bollerslev(1986))
model.
Where:
is the time series value at time t.
is the mean of GARCH in Excel model.
is the model's residual at time t.
is the conditional standard deviation (i.e. volatility)
at time t.
is the order of the ARCH component model.
are the parameters of the ARCH
component model.
is the order of the GARCH component model.
are the parameters of the GARCH
component model.
are the standardized residuals:
10
Prastuti: Vol. 3, No. 1, July 2014

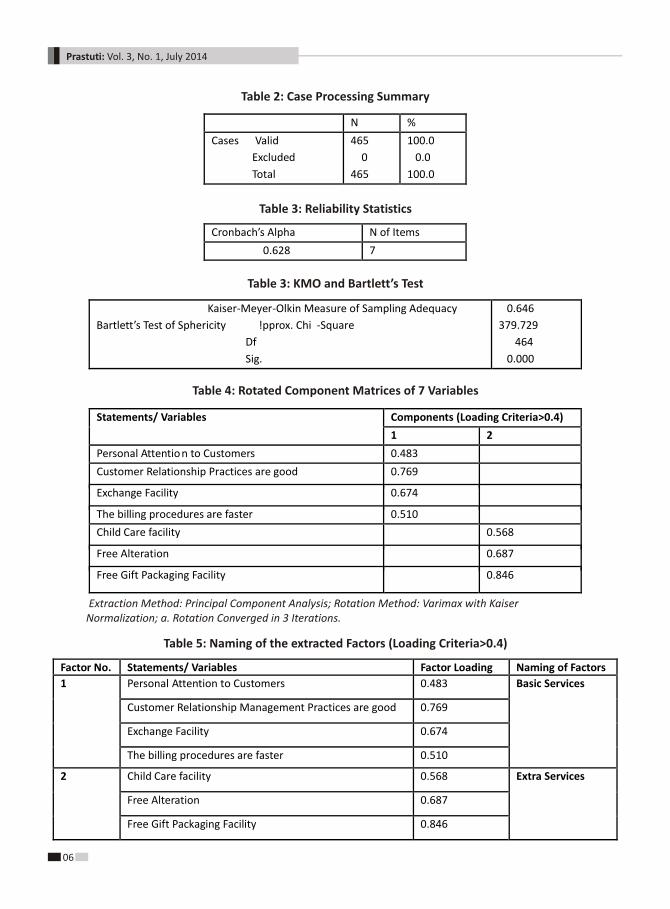
The data analysis is presented in the following order:
1. Tables showing monthly log returns of all six BSE
BROAD INDICES followed by graphs. WMA and
EWMA are calculated for finding out the stationarity.
2. Descriptive statistics of the selected sample.
3. Stationarity, distribution and Arch values are
computed to find out white noise, distribution and
arch effect.
4. Corrrelogram analysis is made to find the best fit
model.
5. Garch and EGARCH models are used and calibrated
to understand the goodness of fit.
6. Volatility forecasting is done through GARCH_vl and
EGARCH_vl functions.
7. Graphs are prepared to present the term structure
and standard deviation.
Month Open High Low Close % RET WMA EWMA
10-Jan 17,473.45 17,790.33 15,982.08 16,357.96 #N/A #N/A
10-Feb 16,339.32 16,669.25 15,651.99 16,429.55 0.44% #N/A
10-Mar 16,438.45 17,793.01 16,438.45 17,527.77 6.47% 0.44% 0.00%
10-Apr 17,555.04 18,047.86 17,276.80 17,558.71 0.18% 3.45% 3.02%
10-May 17,536.86 17,536.86 15,960.15 16,944.63 -3.56% 2.36% 2.12%
10-Jun 16,942.82 17,919.62 16,318.39 17,700.90 4.37% 0.88% 1.40%
10-Jul 17,679.34 18,237.56 17,395.58 17,868.29 0.94% 1.58% 2.01%
10-Aug 17,911.31 18,475.27 17,819.99 17,971.12 0.57% 1.47% 2.03%
10-Sep 18,027.12 20,267.98 18,027.12 20,069.12 11.04% 1.34% 1.92%
10-Oct 20,094.10 20,854.55 19,768.96 20,032.34 -0.18% 2.56% 2.54%
10-Nov 20,272.49 21,108.64 18,954.82 19,521.25 -2.58% 2.25% 3.12%
10-Dec 19,529.99 20,552.03 19,074.57 20,509.09 4.94% 1.77% 2.97%
11-Jan 20,621.61 20,664.80 18,038.48 18,327.76 -11.25% 2.06% 3.15%
11-Feb 18,425.18 18,690.97 17,295.62 17,823.40 -2.79% 0.95% 3.05%
11-Mar 17,982.28 19,575.16 17,792.17 19,445.22 8.71% 0.68% 4.18%
11-Apr 19,463.11 19,811.14 18,976.19 19,135.96 -1.60% 0.87% 4.23%
11-May 19,224.05 19,253.87 17,786.13 18,503.28 -3.36% 0.72% 4.48%
11-Jun 18,527.12 18,873.39 17,314.38 18,845.87 1.83% 0.73% 4.37%
11-Jul 18,974.96 19,131.70 18,131.86 18,197.20 -3.50% 0.52% 4.36%
11-Aug 18,352.23 18,440.07 15,765.53 16,676.75 -8.73% 0.15% 4.23%
11-Sep 16,963.67 17,211.80 15,801.01 16,453.76 -1.35% -0.62% 4.21%
11-Oct 16,255.97 17,908.13 15,745.43 17,705.01 7.33% -1.66% 4.62%
Table 1: BSE S&P INDEX
11
Volatility Forecast of BSE Ltd., Broad Indices

11-Nov 17,540.55 17,702.26 15,478.69 16,123.46 -9.36% -1.03% 4.53%
11-Dec 16,555.93 17,003.71 15,135.86 15,454.92 -4.23% -1.59% 4.71%
12-Jan 15,534.67 17,258.97 15,358.02 17,193.55 10.66% -2.36% 5.09%
12-Feb 17,179.64 18,523.78 17,061.55 17,752.68 3.20% -0.53% 5.09%
12-Mar 17,714.62 18,040.69 16,920.61 17,404.20 -1.98% -0.03% 5.56%
12-Apr 17,429.96 17,664.10 17,010.16 17,318.81 -0.49% -0.92% 5.44%
12-May 17,370.93 17,432.33 15,809.71 16,218.53 -6.56% -0.83% 5.30%
12-Jun 16,217.48 17,448.48 15,748.98 17,429.98 7.20% -1.10% 5.14%
12-Jul 17,438.68 17,631.19 16,598.48 17,236.18 -1.12% -0.65% 5.25%
12-Aug 17,244.44 17,972.54 17,026.97 17,429.56 1.12% -0.45% 5.37%
12-Sep 17,465.60 18,869.94 17,250.80 18,762.74 7.37% 0.37% 5.22%
12-Oct 18,784.64 19,137.29 18,393.42 18,505.38 -1.38% 1.09% 5.08%
12-Nov 18,487.90 19,372.70 18,255.69 19,339.90 4.41% 0.37% 5.21%
12-Dec 19,342.83 19,612.18 19,149.03 19,426.71 0.45% 1.52% 5.07%
13-Jan 19,513.45 20,203.66 19,508.93 19,894.98 2.38% 1.91% 5.01%
13-Feb 19,907.21 19,966.69 18,793.97 18,861.54 -5.33% 1.22% 4.85%
13-Mar 18,876.68 19,754.66 18,568.43 18,835.77 -0.14% 0.50% 4.74%
13-Apr 18,890.81 19,622.68 18,144.22 19,504.18 3.49% 0.66% 4.80%
13-May 19,459.33 20,443.62 19,451.26 19,760.30 1.30% 0.99% 4.66%
13-Jun 19,859.22 19,860.19 18,467.16 19,395.81 -1.86% 1.65% 4.58%
13-Jul 19,352.48 20,351.06 19,126.82 19,345.70 -0.26% 0.89% 4.44%
13-Aug 19,443.29 19,569.20 17,448.71 18,619.72 -3.82% 0.96% 4.34%
13-Sep 18,691.83 20,739.69 18,166.17 19,379.77 4.00% 0.55% 4.22%
13-Oct 19,452.05 21,205.44 19,264.72 21,164.52 8.81% 0.27% 4.21%
13-Nov 21,158.81 21,321.53 20,137.67 20,791.93 -1.78% 1.12% 4.19%
13-Dec 20,771.27 21,483.74 20,568.70 21,170.68 1.81% 0.60% 4.54%
14-Jan 21,222.19 21,409.66 20,343.78 20,513.85 -3.15% 0.72% 4.43%
12
Prastuti: Vol. 3, No. 1, July 2014

Table 2: BSE 100
Graph 1: BSE S&P INDEX
0
0.05
0.1
-5.00%
0.00%
5.00%
1 3 5 7 9 11 13 15 17 19 21 23 25 27 29 31 33 35 37 39 41 43 45 47 49
wma ewma
Month Open High Low Close % ret wma ewma
10-Jan 5,343.39 5,479.32 4,924.25 5,050.54 #N/A #N/A
10-Feb 5,021.36 5,145.20 4,856.17 5,079.94 0.58% #N/A
10-Mar 5,131.29 5,459.67 5,128.21 5,394.12 6.00% 0.58% 0.00%
10-Apr 5,423.04 5,551.48 5,316.13 5,439.84 0.84% 3.29% 2.71%
10-May 5,410.90 5,423.35 4,935.68 5,243.91 -3.67% 2.48% 2.03%
10-Jun 5,231.30 5,509.89 5,098.68 5,476.70 4.34% 0.94% 1.25%
10-Jul 5,447.33 5,644.63 5,400.14 5,542.87 1.20% 1.62% 1.90%
10-Aug 5,583.58 5,739.15 5,536.06 5,584.08 0.74% 1.55% 1.94%
10-Sep 5,612.42 6,230.59 5,606.04 6,163.86 9.88% 1.43% 1.84%
10-Oct 6,193.48 6,432.74 6,097.53 6,171.18 0.12% 2.49% 2.35%
10-Nov 6,229.05 6,491.89 5,747.61 5,962.87 -3.43% 2.23% 2.82%
10-Dec 5,967.21 6,201.86 5,787.93 6,191.51 3.76% 1.66% 2.66%
11-Jan 6,219.56 6,241.93 5,456.59 5,550.03 -10.94% 1.85% 2.91%
11-Feb 5,574.59 5,643.69 5,209.44 5,370.50 -3.29% 0.79% 2.82%
11-Mar 5,408.53 5,889.22 5,393.29 5,855.53 8.65% 0.46% 3.95%
11-Apr 5,858.31 5,989.65 5,753.91 5,795.29 -1.03% 0.68% 4.02%
11-May 5,817.32 5,825.72 5,403.47 5,638.16 -2.75% 0.53% 4.31%
11-Jun 5,644.23 5,694.20 5,275.65 5,686.26 0.85% 0.60% 4.19%
11-Jul 5,717.27 5,791.78 5,524.40 5,531.70 -2.76% 0.31% 4.15%
11-Aug 5,568.18 5,602.55 4,797.15 5,062.17 -8.87% -0.02% 4.02%
11-Sep 5,132.47 5,232.35 4,833.74 4,995.67 -1.32% -0.82% 3.98%
13
Volatility Forecast of BSE Ltd., Broad Indices

11-Oct 4,950.13 5,372.23 4,794.95 5,334.14 6.56% -1.75% 4.43%
11-Nov 5,295.02 5,349.84 4,651.21 4,831.73 -9.89% -1.21% 4.34%
11-Dec 4,938.91 5,093.14 4,516.41 4,598.21 -4.95% -1.75% 4.48%
12-Jan 4,616.42 5,215.05 4,560.67 5,202.65 12.35% -2.48% 4.94%
12-Feb 5,198.68 5,658.18 5,171.83 5,406.46 3.84% -0.54% 4.99%
12-Mar 5,393.04 5,520.13 5,155.64 5,315.15 -1.70% 0.06% 5.69%
12-Apr 5,320.66 5,411.04 5,177.60 5,268.41 -0.88% -0.81% 5.59%
12-May 5,296.69 5,302.89 4,811.28 4,942.13 -6.39% -0.79% 5.44%
12-Jun 4,931.16 5,283.02 4,786.41 5,279.22 6.60% -1.10% 5.28%
12-Jul 5,290.08 5,356.98 5,046.93 5,229.16 -0.95% -0.62% 5.36%
12-Aug 5,225.41 5,426.50 5,175.70 5,251.07 0.42% -0.47% 5.43%
12-Sep 5,260.07 5,733.12 5,200.44 5,701.39 8.23% 0.31% 5.28%
12-Oct 5,706.23 5,825.42 5,583.93 5,620.99 -1.42% 1.10% 5.13%
12-Nov 5,619.91 5,914.16 5,567.27 5,908.97 5.00% 0.44% 5.33%
12-Dec 5,910.31 6,010.14 5,881.67 5,975.74 1.12% 1.68% 5.18%
13-Jan 5,998.53 6,172.30 5,997.95 6,091.49 1.92% 2.18% 5.15%
13-Feb 6,094.62 6,117.33 5,698.19 5,720.10 -6.29% 1.31% 4.99%
13-Mar 5,723.61 5,988.12 5,595.58 5,678.70 -0.73% 0.47% 4.86%
13-Apr 5,694.03 5,969.74 5,490.97 5,941.35 4.52% 0.55% 4.99%
13-May 5,931.90 6,246.37 5,928.66 5,991.11 0.83% 1.00% 4.84%
13-Jun 6,015.01 6,015.01 5,546.07 5,802.30 -3.20% 1.60% 4.80%
13-Jul 5,799.54 6,067.37 5,630.83 5,707.16 -1.65% 0.79% 4.66%
13-Aug 5,737.99 5,773.14 5,116.81 5,447.15 -4.66% 0.73% 4.60%
13-Sep 5,470.19 6,095.95 5,321.17 5,723.40 4.95% 0.31% 4.49%
13-Oct 5,739.12 6,280.66 5,684.77 6,270.72 9.13% 0.03% 4.52%
13-Nov 6,270.99 6,330.48 5,973.17 6,177.75 -1.49% 0.91% 4.53%
13-Dec 6,177.55 6,399.06 6,133.37 6,326.72 2.38% 0.37% 4.88%
14-Jan 6,343.75 6,381.76 5,998.01 6,071.02 -4.13% 0.48% 4.75%
14
Prastuti: Vol. 3, No. 1, July 2014

0
0.02
0.04
0.06
-5.00%
0.00%
5.00%
1 3 5 7 9 11 13 15 17 19 21 23 25 27 29 31 33 35 37 39 41 43 45 47 49
wma ewma
Table 3: BSE 200
Graph 2: BSE 100
Month Open High Low Close %ret wma ewma
10-Jan 2,178.01 2,242.47 2,011.14 2,065.21 #N/A #N/A
10-Feb 2,053.93 2,103.13 1,990.25 2,071.72 0.31% #N/A
10-Mar 2,091.42 2,224.31 2,091.42 2,199.50 5.99% 0.31% 2.84%
10-Apr 2,210.53 2,267.07 2,175.22 2,230.17 1.38% 3.15% 2.84%
10-May 2,218.91 2,224.56 2,026.84 2,152.21 -3.56% 2.56% 2.33%
10-Jun 2,147.54 2,257.99 2,099.94 2,248.06 4.36% 1.03% 1.36%
10-Jul 2,237.38 2,319.47 2,219.05 2,281.63 1.48% 1.70% 2.06%
10-Aug 2,297.17 2,371.08 2,283.12 2,302.88 0.93% 1.66% 2.08%
10-Sep 2,313.81 2,557.24 2,313.75 2,530.47 9.42% 1.56% 1.97%
10-Oct 2,541.63 2,644.37 2,512.75 2,541.85 0.45% 2.54% 2.50%
10-Nov 2,562.44 2,671.95 2,354.94 2,451.45 -3.62% 2.31% 2.86%
10-Dec 2,453.00 2,538.19 2,366.71 2,533.90 3.31% 1.71% 2.64%
11-Jan 2,543.96 2,557.05 2,229.16 2,270.22 -10.99% 1.86% 2.91%
11-Feb 2,279.03 2,303.24 2,122.78 2,185.86 -3.79% 0.79% 2.75%
11-Mar 2,199.48 2,391.35 2,198.60 2,378.69 8.45% 0.45% 3.90%
11-Apr 2,379.69 2,441.31 2,349.55 2,363.68 -0.63% 0.65% 4.01%
11-May 2,371.58 2,375.99 2,204.88 2,301.65 -2.66% 0.48% 4.29%
11-Jun 2,303.82 2,319.15 2,155.87 2,314.65 0.56% 0.56% 4.16%
11-Jul 2,325.75 2,361.08 2,253.99 2,256.48 -2.55% 0.24% 4.11%
11-Aug 2,269.53 2,284.75 1,955.28 2,061.08 -9.06% -0.09% 3.98%
11-Sep 2,086.41 2,131.58 1,968.11 2,028.27 -1.60% -0.92% 3.92%
11-Oct 2,011.86 2,167.52 1,947.72 2,155.58 6.09% -1.84% 4.39%
15
Volatility Forecast of BSE Ltd., Broad Indices

11-Nov 2,141.49 2,163.27 1,880.74 1,953.03 -9.87% -1.37% 4.31%
11-Dec 1,991.63 2,053.99 1,819.80 1,850.89 -5.37% -1.89% 4.42%
12-Jan 1,857.46 2,102.54 1,835.84 2,097.94 12.53% -2.62% 4.87%
12-Feb 2,096.51 2,289.67 2,087.61 2,190.92 4.34% -0.66% 4.96%
12-Mar 2,186.05 2,237.66 2,092.37 2,157.89 -1.52% 0.02% 5.70%
12-Apr 2,161.45 2,197.57 2,100.07 2,136.82 -0.98% -0.81% 5.62%
12-May 2,148.08 2,150.62 1,953.17 2,003.10 -6.46% -0.84% 5.46%
12-Jun 1,998.91 2,139.50 1,940.89 2,138.10 6.52% -1.16% 5.30%
12-Jul 2,142.59 2,171.00 2,046.69 2,114.47 -1.11% -0.66% 5.39%
12-Aug 2,113.29 2,193.84 2,097.30 2,124.06 0.45% -0.54% 5.45%
12-Sep 2,126.75 2,320.21 2,106.35 2,307.58 8.29% 0.25% 5.29%
12-Oct 2,312.66 2,358.00 2,260.96 2,276.15 -1.37% 1.08% 5.15%
12-Nov 2,276.46 2,391.64 2,254.73 2,389.51 4.86% 0.45% 5.36%
12-Dec 2,391.68 2,436.97 2,384.74 2,424.38 1.45% 1.68% 5.21%
13-Jan 2,435.31 2,498.11 2,435.31 2,461.12 1.50% 2.25% 5.16%
13-Feb 2,463.69 2,471.54 2,299.53 2,307.98 -6.42% 1.33% 5.01%
13-Mar 2,311.98 2,412.78 2,253.50 2,287.96 -0.87% 0.43% 4.88%
13-Apr 2,295.20 2,399.33 2,215.44 2,388.98 4.32% 0.49% 5.01%
13-May 2,384.85 2,509.17 2,384.85 2,409.22 0.84% 0.93% 4.87%
13-Jun 2,416.46 2,416.46 2,223.69 2,323.83 -3.61% 1.54% 4.82%
13-Jul 2,324.56 2,419.77 2,238.98 2,270.93 -2.30% 0.69% 4.67%
13-Aug 2,285.47 2,295.98 2,041.82 2,167.96 -4.64% 0.59% 4.63%
13-Sep 2,177.15 2,417.42 2,121.30 2,281.93 5.12% 0.17% 4.53%
13-Oct 2,288.56 2,494.21 2,267.48 2,490.49 8.75% -0.09% 4.55%
13-Nov 2,492.65 2,515.46 2,383.74 2,463.86 -1.08% 0.75% 4.58%
13-Dec 2,467.32 2,547.57 2,449.47 2,530.58 2.67% 0.26% 4.89%
14-Jan 2,537.73 2,552.71 2,394.65 2,425.46 -4.24% 0.36% 4.75%
16
Prastuti: Vol. 3, No. 1, July 2014
Table 4: S&P 500
Graph 3: BSE 200
0
0.05
0.1
-5.00%
0.00%
5.00%
1 3 5 7 9 11 13 15 17 19 21 23 25 27 29 31 33 35 37 39 41 43 45 47 49
wma ewma
Month Open High Low Close % ret wma ewma
10-Jan 6,839.38 7,070.37 6,338.25 6,509.90 #N/A #N/A
10-Feb 6,477.83 6,639.59 6,280.99 6,518.38 5.97% #N/A
10-Mar 6,576.07 6,987.88 6,576.07 6,919.55 1.76% 5.97% 2.10%
10-Apr 6,952.74 7,140.21 6,863.81 7,042.68 -3.77% 3.87% 2.10%
10-May 7,009.94 7,028.13 6,396.74 6,782.37 4.47% 1.32% 4.51%
10-Jun 6,769.03 7,119.58 6,634.30 7,092.20 1.58% 2.11% 3.91%
10-Jul 7,061.59 7,321.41 7,009.83 7,205.22 1.17% 2.00% 3.92%
10-Aug 7,249.77 7,514.63 7,227.39 7,289.74 9.10% 1.86% 3.90%
10-Sep 7,322.52 8,064.87 7,322.52 7,984.45 0.65% 2.90% 3.10%
10-Oct 8,018.42 8,344.12 7,950.12 8,036.88 -4.00% 2.62% 3.55%
10-Nov 8,095.04 8,434.05 7,411.68 7,722.05 3.05% 1.88% 3.95%
10-Dec 7,726.39 7,975.22 7,421.12 7,961.06 -11.05% 2.00% 4.03%
11-Jan 7,989.28 8,038.74 6,999.44 7,128.29 -3.98% 0.81% 4.66%
11-Feb 7,152.97 7,222.02 6,647.92 6,850.40 8.22% 0.41% 5.56%
11-Mar 6,888.55 7,471.35 6,888.55 7,437.26 -0.14% 0.60% 5.27%
11-Apr 7,440.05 7,651.27 7,381.56 7,427.14 -2.64% 0.44% 5.44%
11-May 7,449.52 7,463.28 6,932.82 7,233.85 0.43% 0.54% 5.37%
11-Jun 7,240.14 7,291.32 6,789.01 7,265.32 -2.14% 0.20% 5.28%
11-Jul 7,296.61 7,417.00 7,103.90 7,111.31 -9.19% -0.11% 5.17%
11-Aug 7,148.11 7,197.91 6,165.06 6,487.22 -1.58% -0.97% 5.26%
11-Sep 6,559.20 6,711.06 6,208.73 6,385.76 5.74% -1.86% 5.59%
11-Oct 6,338.96 6,796.79 6,135.65 6,763.26 -10.04% -1.44% 5.37%
11-Nov 6,723.25 6,787.42 5,899.25 6,117.00 -5.69% -1.94% 5.52%
17
Volatility Forecast of BSE Ltd., Broad Indices

11-Dec 6,226.60 6,416.65 5,683.02 5,778.68 12.52% -2.67% 5.92%
12-Jan 5,797.33 6,562.69 5,734.21 6,549.31 4.60% -0.71% 5.80%
12-Feb 6,545.14 7,166.28 6,522.13 6,857.28 -1.43% 0.01% 6.37%
12-Mar 6,844.63 7,001.32 6,556.03 6,759.63 -0.91% -0.80% 6.28%
12-Apr 6,769.94 6,887.06 6,585.99 6,698.51 -6.45% -0.86% 6.11%
12-May 6,732.03 6,741.87 6,129.37 6,280.04 6.21% -1.18% 5.98%
12-Jun 6,268.76 6,686.19 6,088.62 6,682.47 -1.16% -0.70% 5.97%
12-Jul 6,695.99 6,797.05 6,407.78 6,605.70 0.40% -0.61% 5.99%
12-Aug 6,602.82 6,848.80 6,560.62 6,632.34 8.30% 0.18% 5.81%
12-Sep 6,640.17 7,243.40 6,582.88 7,206.51 -1.22% 1.01% 5.60%
12-Oct 7,221.74 7,364.54 7,070.76 7,118.77 4.85% 0.43% 5.78%
12-Nov 7,120.24 7,478.35 7,057.34 7,472.45 1.45% 1.67% 5.60%
12-Dec 7,480.17 7,627.07 7,460.59 7,581.57 1.10% 2.26% 5.53%
13-Jan 7,613.36 7,792.70 7,600.10 7,665.74 -6.77% 1.31% 5.36%
13-Feb 7,673.22 7,697.72 7,138.74 7,163.69 -1.11% 0.36% 5.24%
13-Mar 7,175.22 7,478.62 6,976.75 7,084.96 4.15% 0.39% 5.37%
13-Apr 7,105.97 7,413.56 6,872.16 7,385.25 0.76% 0.81% 5.21%
13-May 7,374.61 7,748.63 7,374.61 7,441.89 -3.80% 1.41% 5.13%
13-Jun 7,463.18 7,465.12 6,868.43 7,164.06 -2.52% 0.58% 4.99%
13-Jul 7,166.52 7,444.46 6,888.21 6,985.56 -4.56% 0.47% 4.95%
13-Aug 7,027.92 7,060.53 6,301.27 6,673.96 5.05% 0.05% 4.85%
13-Sep 6,700.73 7,413.62 6,539.15 7,019.96 8.68% -0.22% 4.83%
13-Oct 7,040.23 7,667.42 6,978.73 7,656.62 -0.77% 0.61% 4.83%
13-Nov 7,663.98 7,737.66 7,348.20 7,598.21 2.98% 0.14% 5.11%
13-Dec 7,609.06 7,862.72 7,558.21 7,828.34 -4.30% 0.27% 4.96%
14-Jan 7,850.35 7,902.67 7,401.20 7,499.02 #N/A 0.27% 4.86%
18
Prastuti: Vol. 3, No. 1, July 2014

Table 5: BSE MID CAP
Graph 4: S&P 500
0
0.05
0.1
-5.00%
0.00%
5.00%
10.00%
1 3 5 7 9 11 13 15 17 19 21 23 25 27 29 31 33 35 37 39 41 43 45 47 49
wma ewma
Month Open High Low Close % ret wma ewma
10-Jan 6,746.69 7,153.87 6,276.91 6,509.80 #N/A #N/A
10-Feb 6,499.97 6,730.62 6,294.53 6,397.82 6.19% 0.65%
10-Mar 6,429.54 6,839.83 6,429.54 6,806.18 5.41% 6.19% 0.39%
10-Apr 6,830.62 7,207.44 6,830.62 7,184.78 -4.99% 5.41% 3.94%
10-May 7,177.56 7,202.94 6,466.33 6,834.87 4.50% 0.21% 3.94%
10-Jun 6,830.92 7,198.91 6,734.06 7,149.21 3.55% 1.64% 3.78%
10-Jul 7,138.43 7,519.18 7,106.00 7,407.91 2.52% 2.12% 3.58%
10-Aug 7,438.57 7,918.03 7,438.57 7,596.84 6.22% 2.20% 3.52%
10-Sep 7,622.61 8,202.91 7,622.61 8,084.14 2.67% 2.87% 3.12%
10-Oct 8,112.29 8,521.43 8,112.29 8,302.56 -6.71% 2.84% 3.15%
10-Nov 8,302.56 8,791.10 7,339.55 7,764.02 0.50% 1.65% 3.82%
10-Dec 7,764.02 8,105.73 7,176.49 7,802.71 -12.75% 1.52% 4.38%
11-Jan 7,802.71 7,929.37 6,722.59 6,868.35 -7.48% 0.09% 5.06%
11-Feb 6,868.35 6,922.12 6,182.86 6,373.23 7.56% -0.60% 6.22%
11-Mar 6,373.23 6,894.10 6,373.23 6,873.40 3.16% 0.08% 6.09%
11-Apr 6,873.40 7,309.29 6,873.40 7,094.26 -2.63% -0.11% 6.08%
11-May 7,094.56 7,117.32 6,607.78 6,910.24 -0.82% 0.09% 6.01%
11-Jun 6,911.20 6,987.72 6,475.70 6,854.05 0.89% -0.35% 5.91%
11-Jul 6,854.13 7,115.91 6,854.13 6,915.31 -9.74% -0.57% 5.73%
11-Aug 6,915.46 6,987.82 6,014.18 6,273.60 -2.32% -1.59% 5.75%
11-Sep 6,273.56 6,534.66 6,066.34 6,129.59 2.71% -2.31% 6.09%
11-Oct 6,128.21 6,313.30 5,871.68 6,297.99 -11.25% -2.30% 5.89%
11-Nov 6,297.99 6,341.71 5,459.92 5,627.69 -9.16% -2.68% 5.90%
19
Volatility Forecast of BSE Ltd., Broad Indices

11-Dec 5,627.75 5,804.38 5,073.25 5,135.05 13.41% -3.49% 6.38%
12-Jan 5,135.05 5,895.72 5,101.95 5,871.70 8.41% -1.31% 6.43%
12-Feb 5,870.43 6,654.98 5,870.09 6,386.82 -0.64% 0.02% 7.04%
12-Mar 6,384.39 6,534.36 6,149.74 6,346.38 -0.48% -0.66% 7.13%
12-Apr 6,357.35 6,512.72 6,213.98 6,315.85 -6.68% -0.97% 6.92%
12-May 6,343.48 6,370.98 5,802.33 5,907.95 4.08% -1.31% 6.75%
12-Jun 5,907.96 6,156.07 5,734.24 6,153.72 -2.33% -0.90% 6.71%
12-Jul 6,169.76 6,362.03 5,877.38 6,012.28 -0.12% -1.17% 6.60%
12-Aug 6,014.73 6,208.92 5,936.51 6,005.02 9.56% -0.36% 6.42%
12-Sep 6,008.33 6,628.85 6,004.87 6,607.29 -0.63% 0.63% 6.19%
12-Oct 6,618.44 6,778.70 6,495.04 6,565.99 4.99% 0.35% 6.44%
12-Nov 6,569.64 6,910.65 6,530.06 6,901.99 3.01% 1.70% 6.23%
12-Dec 6,922.96 7,157.66 6,919.55 7,112.89 -2.02% 2.72% 6.14%
13-Jan 7,123.32 7,391.34 6,831.14 6,970.88 -10.08% 1.43% 6.00%
13-Feb 6,973.52 7,016.83 6,283.68 6,302.78 -2.58% -0.11% 5.89%
13-Mar 6,312.99 6,524.94 6,022.77 6,142.06 3.24% -0.27% 6.22%
13-Apr 6,157.61 6,368.11 6,029.10 6,344.04 0.71% 0.04% 6.06%
13-May 6,350.41 6,661.12 6,332.82 6,389.47 -6.88% 0.65% 5.93%
13-Jun 6,409.37 6,468.98 5,778.97 5,964.50 -7.33% -0.26% 5.77%
13-Jul 5,972.47 6,111.29 5,441.93 5,543.13 -4.48% -0.68% 5.84%
13-Aug 5,553.96 5,606.72 5,118.74 5,300.40 5.61% -1.04% 5.91%
13-Sep 5,312.48 5,744.17 5,269.87 5,605.98 8.57% -1.37% 5.82%
13-Oct 5,624.30 6,115.28 5,593.99 6,107.35 3.51% -0.60% 5.83%
13-Nov 6,117.51 6,355.01 6,063.27 6,325.58 5.83% -0.73% 6.03%
13-Dec 6,339.90 6,707.87 6,297.65 6,705.56 -6.11% -0.49% 5.90%
14-Jan 6,719.03 6,802.60 6,185.62 6,308.05 #N/A -0.49% 5.91%
20
Prastuti: Vol. 3, No. 1, July 2014

Table 6: BSE SMALL CAP
Graph 5: BSE MID CAP
0
0.1
-20.00%
0.00%
20.00%
1 3 5 7 9 11 13 15 17 19 21 23 25 27 29 31 33 35 37 39 41 43 45 47 49
wma ewma
% ret wma ewma
10-Jan 8,393.77 9,118.00 7,926.82 8,232.68 #N/A #N/A
10-Feb 8,248.53 8,631.19 7,973.57 8,067.40 5.19% #N/A 0.00%
10-Mar 8,085.87 8,634.96 8,085.87 8,497.43 8.02% 5.19% 1.41%
10-Apr 8,523.51 9,293.70 8,523.51 9,207.14 -7.44% 6.61% 3.50%
10-May 9,201.89 9,260.50 8,160.50 8,547.16 5.95% 1.93% 6.14%
10-Jun 8,555.98 9,132.52 8,451.15 9,071.20 3.02% 2.93% 5.85%
10-Jul 9,072.30 9,558.99 9,064.30 9,348.97 2.03% 2.95% 5.73%
10-Aug 9,375.33 10,022.13 9,375.33 9,540.56 7.13% 2.80% 4.98%
10-Sep 9,561.98 10,375.90 9,561.98 10,245.71 3.38% 3.41% 4.90%
10-Oct 10,268.65 10,918.41 10,268.65 10,597.59 -8.39% 3.41% 5.82%
10-Nov 10,597.59 11,366.68 9,233.62 9,744.71 -0.77% 2.10% 6.34%
10-Dec 9,744.71 10,229.86 8,617.43 9,670.31 -13.16% 1.81% 7.13%
11-Jan 9,670.31 9,920.58 8,333.93 8,477.82 -8.11% 0.45% 8.04%
11-Feb 8,477.82 8,551.45 7,471.77 7,817.32 4.48% -0.26% 7.79%
11-Mar 7,817.32 8,228.02 7,730.46 8,175.89 6.39% -0.32% 7.41%
11-Apr 8,175.89 8,976.17 8,175.89 8,715.31 -5.66% -0.46% 7.54%
11-May 8,713.47 8,744.52 7,999.23 8,235.72 -0.97% -0.31% 7.45%
11-Jun 8,237.06 8,381.73 7,753.00 8,156.60 1.81% -0.89% 7.17%
11-Jul 8,159.30 8,536.87 8,159.30 8,305.58 -15.24% -0.99% 7.37%
11-Aug 8,306.84 8,377.62 6,892.98 7,131.48 -3.57% -2.43% 8.00%
11-Sep 7,131.90 7,421.17 6,873.20 6,881.08 1.35% -3.32% 7.74%
11-Oct 6,879.21 6,997.39 6,638.86 6,974.61 -13.44% -3.49% 7.74%
11-Nov 6,974.90 7,007.29 5,914.55 6,097.26 -9.40% -3.91% 8.14%
21
Volatility Forecast of BSE Ltd., Broad Indices

11-Dec 6,099.34 6,248.81 5,460.31 5,550.14 15.23% -4.63% 7.96%
12-Jan 5,551.77 6,504.14 5,540.30 6,463.30 5.96% -2.26% 8.64%
12-Feb 6,464.29 7,263.11 6,464.29 6,859.97 -3.42% -1.09% 8.57%
12-Mar 6,870.15 6,914.90 6,434.17 6,629.38 2.02% -1.75% 8.30%
12-Apr 6,641.72 6,982.30 6,641.72 6,764.62 -7.58% -2.11% 8.14%
12-May 6,787.38 6,844.92 6,202.13 6,271.00 4.26% -2.27% 8.01%
12-Jun 6,283.46 6,547.61 6,132.10 6,543.75 -1.48% -1.84% 7.88%
12-Jul 6,552.00 6,870.17 6,355.15 6,447.89 -0.82% -2.11% 7.64%
12-Aug 6,456.47 6,687.31 6,336.09 6,395.09 9.29% -0.91% 7.35%
12-Sep 6,399.94 7,045.06 6,388.01 7,017.89 -0.41% 0.16% 7.53%
12-Oct 7,026.62 7,252.49 6,949.96 6,989.17 4.02% 0.02% 7.27%
12-Nov 6,993.11 7,287.09 6,975.15 7,275.65 1.42% 1.47% 7.12%
12-Dec 7,283.14 7,525.68 7,283.14 7,379.94 -4.23% 2.37% 6.94%
13-Jan 7,388.39 7,696.74 7,049.69 7,074.07 -13.09% 0.75% 6.87%
13-Feb 7,081.69 7,114.58 6,192.07 6,206.22 -6.69% -0.83% 7.32%
13-Mar 6,198.16 6,378.13 5,708.41 5,804.65 3.66% -1.11% 7.22%
13-Apr 5,812.49 6,137.88 5,812.49 6,021.16 -1.30% -0.97% 7.09%
13-May 6,027.98 6,243.54 5,935.92 5,943.46 -5.18% -0.45% 6.89%
13-Jun 5,950.67 6,018.92 5,544.60 5,643.52 -6.07% -1.23% 6.76%
13-Jul 5,647.85 5,787.89 5,257.96 5,311.06 -2.28% -1.62% 6.67%
13-Aug 5,328.60 5,407.88 5,085.56 5,191.25 5.16% -1.74% 6.47%
13-Sep 5,201.42 5,557.91 5,185.13 5,466.24 7.57% -2.08% 6.44%
13-Oct 5,489.69 5,905.11 5,468.09 5,896.11 3.39% -1.42% 6.57%
13-Nov 5,913.90 6,140.96 5,880.96 6,099.52 7.14% -1.47% 6.43%
13-Dec 6,117.84 6,567.03 6,117.84 6,551.13 -4.49% -0.99% 6.53%
14-Jan 6,570.08 6,716.80 6,164.27 6,263.35 #N/A -0.99% 6.53%
0
0.1
-20.00%
0.00%
20.00%
1 3 5 7 9 11 13 15 17 19 21 23 25 27 29 31 33 35 37 39 41 43 45 47 49
wma ewma
Graph 6: BSE SMALL CAP
22
Prastuti: Vol. 3, No. 1, July 2014

As shown in the above tables and graphs the BSE indices
exhibit both positive and negative values of the mean and
standard deviation but are significantly not different as
the p values are higher at 5% significance level. The table
below presents the descriptive statistics of the six indices
of BSE LTD.
Table 7: Descriptive Statistics of BSE Broad Indices
ave
rage
std
ev
skew
ne
ss
exce
ss
kurt
osi
s
me
dia
n
min
max
Q 1
:
Q 3
:
1 BSE S&P 0.00472
0.05
0.08
0.02
0.02%
-11.25%
11.04%
-2.64%
3.62%
P values 25.80% 41.79% 37.38%
2 BSE 100 0.003834
0.051378 0.12 -0.06 0.002684 -0.10938 0.123501 -0.02867 0.039679
P values 30.38%
38% 34%
3 BSE 200 0.00335
0.051418
0.09 -0.08 0.003817 -0.10988 0.125289 -0.02884 0.043246
P values 32.69%
41% 33%
4 S&P 500 0.002982
0.052057
0.04
-14% 0.004025 -0.11049 0.125184 -0.03202 0.04309
P values
34.82%
46%
30%
5 BSE MIDCAP
-0.0003
0.051418
-0.18
-0.60
0.004971
-0.12755
0.134055
-0.04735 0.042861
P values
48.66%
31.42%
14.42%
6BSE SMALL
CAP
-0.00539
0.067855
-0.26
-0.34
-0.0041
-0.15241
0.152317
-0.05419 0.043711
P values 29.45% 0.25 0.23
The table no. 7 presents the descriptive statistics of the
BSE Broad Indices. BSE S&P’s average is 0.05, standard
deviation is 0.05 and skewness is 0.08 and excess kurtosis
is positive which indicates distribution has a slightly
leptokurtic distribution. The BSE MID CAP AND BSE
SMALL CAP has shown negative averages and negative
excess kurtosis which indicates platykurtic distribution.
The remaining indices also have recorded positive mean
and negative mean values negative excess skewness and
are representing slightly platykurtic distribution. In sum,
it can be concluded that the data represents the
distribution is positively skewed and the density
distribution has negative excess kurtosis for all indices
selected in the sample except BSE S&P Sensex indices has
positive density distribution.
Table 8: showing stationarity, distribution and Arch effect
White-noise Normal Distributed ARCH Effect?
BSE S&P 2.16% 96.59% 74.31%
FALSE TRUE FALSE
BSE MIDCAP 25.26% 57.61% 75.13%
TRUE TRUE FALSE
BSE SMALL CAP 40.85% 64.97% 99.91%
TRUE TRUE FALSE
23
Volatility Forecast of BSE Ltd., Broad Indices

BSE 100 5.89% 91.97% 70.78%
TRUE TRUE FALSE
BSE 200 9.20% 93.79% 76.02%
TRUE TRUE FALSE
S&P 500 12.28% 93.38% 78.21%
TRUE TRUE FALSE
The distribution of the data is further analyzed for
studying the stationarity and trend. The reason for non
stationarity is the presence is trend and integration (Unit
root) between the observations themselves. Hence white
noise is tested and the results indicated significant serial
correlation for BSE S&P and the remaining have no serial
correlation. The data is normally distributed which is
proved through Jarque Bera test presented in the above
table. The arch effect of all the samples included in the
study reveals that there is no conditional heteroskedacity.
The correlogram analysis is made to find out the ACF and
PACF of the selected samples to fit in the appropriate
volatility forecasting model. The data has shown auto
correlation only for the first two lags, but however exhibit
no auto correlation which is evident from the arch effect.
The following tables are presented to visualize the ACF
and PACF values at different lag orders.
Table 9: Correlogram Analysis of BSE S&P
Lag ACF UL LL PACF UL LL
1 -15.63% 28.59% -28.59% -15.72% 28.59% -28.59%
2 -31.66% 28.90% -28.90% -34.58% 28.90% -28.90%
3 28.37% 29.91% -29.91% 18.76% 29.22% -29.22%
4 -15.64% 32.91% -32.91% -23.77% 29.55% -29.55%
5 -11.21% 35.28% -35.28% 0.88% 29.89% -29.89%
6 19.98% 36.24% -36.24% 1.45% 30.24% -30.24%
7 4.34% 36.95% -36.95% 15.19% 30.61% -30.61%
8 -9.38% 38.27% -38.27% -2.22% 30.99% -30.99%
9 0.35% 38.80% -38.80% -1.08% 31.38% -31.38%
10 8.66% 39.48% -39.48% 5.29% 31.79% -31.79%
Graph 7: PACF of BSE S&P
-100%
0%
100%
1 2 3 4 5 6 7 8 9 10
PACF
UL
LL
24
Prastuti: Vol. 3, No. 1, July 2014

Lag ACF UL LL PACF UL LL
1 -9.89% 28.59% -28.59% -9.97% 28.59% -28.59%
2 -32.17% 28.90% -28.90% -33.28% 28.90% -28.90%
3 20.37% 29.50% -29.50% 14.64% 29.22% -29.22%
4 -16.72% 32.60% -32.60% -30.31% 29.55% -29.55%
5 -6.74% 34.02% -34.02% 4.84% 29.89% -29.89%
6 16.75% 35.07% -35.07% -2.93% 30.24% -30.24%
7 3.50% 35.59% -35.59% 14.95% 30.61% -30.61%
8 -7.90% 36.66% -36.66% -7.54% 30.99% -30.99%
9 -1.98% 37.15% -37.15% -0.38% 31.38% -31.38%
10 12.16% 37.77% -37.77% 8.67% 31.79% -31.79%
-50%
0%
50%
1 2 3 4 5 6 7 8 9 10
ACF
UL
LLGraph 8: ACF of BSE S&P
Table 10: Correlogram Analysis of BSE 100
-100%
0%
100%
1 2 3 4 5 6 7 8 9 10
ACF
UL
LL
Graph 9: ACF of BSE100
Graph 10: PACF of BSE 100
-100%
0%
100%
1 2 3 4 5 6 7 8 9 10
PACF
UL
LL
25
Volatility Forecast of BSE Ltd., Broad Indices

-50%
0%
50%
1 2 3 4 5 6 7 8 9 10
PACF
UL
LL
-50%
0%
50%
1 2 3 4 5 6 7 8 9 10
ACF
UL
LL
Lag ACF UL LL PACF UL LL
1 -6.49% 28.59% -28.59% -6.55% 28.59% -28.59%
2 -31.42% 28.90% -28.90% -31.82% 28.90% -28.90%
3 17.64% 29.34% -29.34% 14.57% 29.22% -29.22%
4 -16.40% 32.32% -32.32% -30.78% 29.55% -29.55%
5 -6.11% 33.49% -33.49% 6.22% 29.89% -29.89%
6 15.10% 34.52% -34.52% -4.20% 30.24% -30.24%
7 3.59% 35.02% -35.02% 14.44% 30.61% -30.61%
8 -7.08% 35.97% -35.97% -8.71% 30.99% -30.99%
9 -2.55% 36.46% -36.46% 0.19% 31.38% -31.38%
10 11.93% 37.04% -37.04% 8.11% 31.79% -31.79%
Table 11: Correlogram Analysis of BSE 200
Graph 11: ACF of BSE 200
Graph No.12: PACF OF BSE 200
Lag ACF UL LL PACF UL LL
1 -4.53% 28.90% -28.90% -4.51% 28.90% -28.90%
2 -30.90% 29.22% -29.22% -31.05% 29.22% -29.22%
3 15.89% 29.61% - 14.26% 29.55% -29.55%
4 -16.65% 32.55% -32.55% -31.81% 29.89% -29.89%
5 -6.92% 33.58% -33.58% 4.93% 30.24% -30.24%
Table 12: Correlogram Analysis of S&P 500
26
Prastuti: Vol. 3, No. 1, July 2014

Lag ACF UL LL PACF UL LL
1 15.39% 28.90% -28.90% 15.38% 28.90% -28.90%
2 -24.64% 29.22% -29.22% -27.96% 29.22% -29.22%
3 -3.06% 30.20% -30.20% 6.70% 29.55% -29.55%
4 -17.38% 32.14% -32.14% -30.99% 29.89% -29.89%
5 -12.49% 32.55% -32.55% -3.02% 30.24% -30.24%
6 8.57% 33.64% -33.64% -3.30% 30.61% -30.61%
7 4.91% 34.40% -34.40% -1.49% 30.99% -30.99%
8 -8.72% 35.01% -35.01% -11.48% 31.38% -31.38%
9 -2.61% 35.53% -35.53% -4.14% 31.79% -31.79%
10 7.25% 36.17% -36.17% -0.45% 32.22% -32.22%
-100%
0%
100%
1 2 3 4 5 6 7 8 9 10
PACF
UL
LL
-100%
0%
100%
1 2 3 4 5 6 7 8 9 10
ACF
UL
LL
Graph 13: ACF of S&P 500
6 14.77% 34.64% -34.64% -5.20% 30.61% -30.61%
7 3.82% 35.17% -35.17% 10.43% 30.99% -30.99%
8 -7.54% 36.13% -36.13% -9.51% 31.38% -31.38%
9 -2.06% 36.63% -36.63% -0.23% 31.79% -31.79%
10 11.58% 37.24% -37.24% 6.67% 32.22% -32.22%
Graph 14: PACF of S&P 500
Table 13: Correlogram Analysis of BSE MID CAP
27
Volatility Forecast of BSE Ltd., Broad Indices
-100%
0%
100%
1 2 3 4 5 6 7 8 9 10
ACF
UL
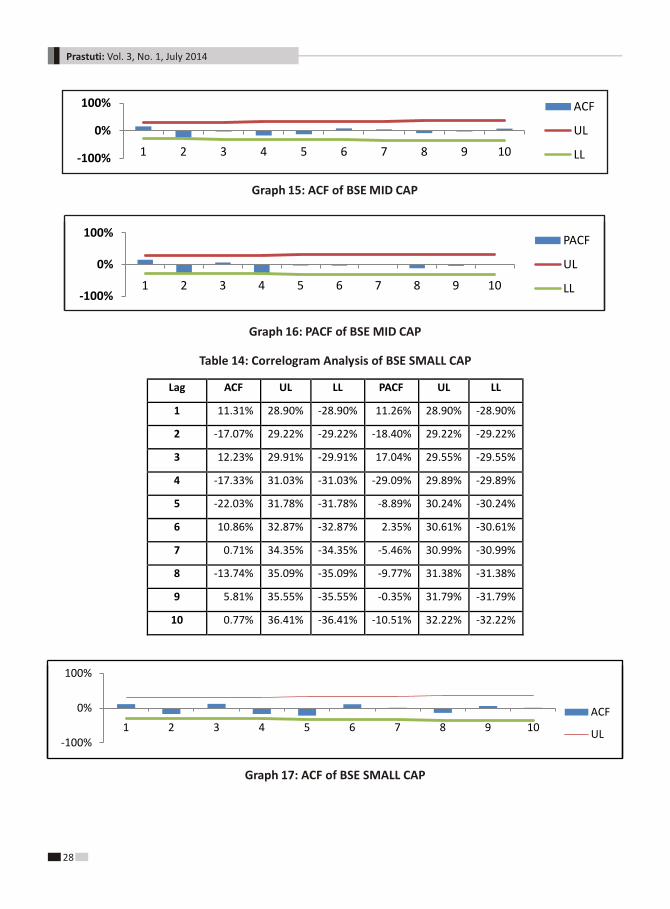
Lag ACF UL LL PACF UL LL
1 11.31% 28.90% -28.90% 11.26% 28.90% -28.90%
2 -17.07% 29.22% -29.22% -18.40% 29.22% -29.22%
3 12.23% 29.91% -29.91% 17.04% 29.55% -29.55%
4 -17.33% 31.03% -31.03% -29.09% 29.89% -29.89%
5 -22.03% 31.78% -31.78% -8.89% 30.24% -30.24%
6 10.86% 32.87% -32.87% 2.35% 30.61% -30.61%
7 0.71% 34.35% -34.35% -5.46% 30.99% -30.99%
8 -13.74% 35.09% -35.09% -9.77% 31.38% -31.38%
9 5.81% 35.55% -35.55% -0.35% 31.79% -31.79%
10 0.77% 36.41% -36.41% -10.51% 32.22% -32.22%
-100%
0%
100%
1 2 3 4 5 6 7 8 9 10
PACF
UL
LL
Graph 15: ACF of BSE MID CAP
-100%
0%
100%
1 2 3 4 5 6 7 8 9 10
ACF
UL
LL
Graph 16: PACF of BSE MID CAP
Table 14: Correlogram Analysis of BSE SMALL CAP
Graph 17: ACF of BSE SMALL CAP
28
Prastuti: Vol. 3, No. 1, July 2014

Table 15: Egarch (1,1) analysis
-100%
0%
100%
1 2 3 4 5 6 7 8 9 10
PACF
UL
LL
Graph 18: PACF of BSE SMALL CAP
BSE S&P Param Value Goodness-of-fit
µ -0.01 LLF AIC CHECK
á0 -1.46 84.05 -157.10 1.00
á1 -1.22
ã1 0.52
â1 0.60
BSE MIDCAP Param Value Goodness-of-fit
µ 0.00 LLF AIC CHECK
á0 -7.01 52.247947 -93.495894 1
á1 1.55
ã1 -0.13
â1 -0.28
BSE SMALL CAP Param Value Goodness-of-fit
µ -0.01 LLF AIC CHECK
á0 -7.05 52.61080854 -94.22161707 1
á1 1.24
ã1 -0.08
â1 -0.28
BSE 100 Param Value Goodness-of-fit
µ -0.01 LLF AIC CHECK
á0 -1.04 81.28203341 -151.5640668 1
á1 -1.00
ã1 0.26
â1 0.70
BSE 200 Param Value Goodness-of-fit
µ 0.00 LLF AIC CHECK
á0 -6.28 74.34 -137.69 1
á1 0.00
ã1 -0.56
â1 -0.06
S&P 500 Param Value Goodness-of-fit
µ 0.01 LLF AIC CHECK
á0 -1.03 80.77601833 -150.5520367 1
á1 -1.08
ã1 0.45
â1 0.69
29
Volatility Forecast of BSE Ltd., Broad Indices

Table 16: Showing the Residual Analysis
The above table no. 15 represents the EGARCH (1, 1)
model which is used to forecast the monthly volatility and
calibrated to find out the exact values. Though the alpha
and beta values are showing negative values but are still
considered for the test because the egarch after
calibration returned check value as 1.
BSE S&P AVG STDEV SKEW KURTOSIS Noise? Normal? ARCH?
0.12 1.13 -0.547 0.275051 TRUE TRUE FALSE
Target 0.00 1 0 0
SIG? FALSE FALSE FALSE FALSE
BSE MIDCAP AVG STDEV SKEW KURTOSIS Noise? Normal? ARCH?
0.03 0.817 -0.245 1.113813 TRUE TRUE TRUE
Target 0.00 1 0 0
SIG? FALSE TRUE FALSE FALSE
BSE SMALL CAP AVG STDEV SKEW KURTOSIS Noise? Normal? ARCH?
0.02 0.88 -0.32 0.816192 TRUE TRUE FALSE
Target 0.00 1 0 0
SIG? FALSE FALSE FALSE FALSE
BSE 100 AVG STDEV SKEW KURTOSIS Noise? Normal? ARCH?
0.19 1.022 -0.0016 -0.42858 TRUE TRUE FALSE
Target 0.00 1 0 0
SIG? FALSE FALSE FALSE FALSE
BSE 200 AVG STDEV SKEW KURTOSIS Noise? Normal? ARCH?
0.00 1 0.085 -0.07689 TRUE TRUE FALSE
Target 0.00 1 0 0
SIG? FALSE FALSE FALSE FALSE
S&P 500 AVG STDEV SKEW KURTOSIS Noise? Normal? ARCH?
-0.10 1.114 -0.0318 -0.62645 TRUE TRUE FALSE
Target 0.00 1 0 0
SIG? FALSE FALSE FALSE FALSE
The residual analysis has shown average and standard
deviations are not significantly different from zero and
the skewness is also not different from zero. The residuals
skewness also shows that the data is symmetrical. The
kurtosis figures in the residual analysis shows that the
tails are normal. So far, the residuals have shown a
Gaussian distribution. Examining the residual
interdependence concern among the variables, serial
correlation or linear first order dependence exhibited no
significant serial correlation. The second order
dependence (quadratic) shows insignificant correlation in
the squared residuals or absence of an arch effect. As a
result, the standardized residuals are independent and
identically Gaussian distributed. Thus, the EGARH model
assumption is met.
Table 17: Garch (1,1)
BSE S&P Param Value Goodness-of-fit
µ 0.0047 LLF AIC CHECK
á0 0.0029 75.48 -144.96 1
á1 0.0000
30
Prastuti: Vol. 3, No. 1, July 2014

Table 18: Showing the Residual Analysis (GARCH (1,1)
â1 0.0000
BSE MIDCAP Param Value Goodness-of-fit
µ -0.001 LLF AIC CHECK
á0 0.003 65.38783494 -124.7756699 1
á1 0.050
â1 0.112
BSE SMALL CAP Param Value Goodness-of-fit
µ -0.005 LLF AIC CHECK
á0 0.005 60.11 -114.21 1
á1 0.000
â1 0.000
BSE 100 Param Value Goodness-of-fit
µ 0.00380 LLF AIC CHECK
á0 0.00306 74.12374497 -142.2474899 1
á1 0.00000
â1 0.00000
BSE 200 Param Value Goodness-of-fit
µ 0.00330 LLF AIC CHECK
á0 0.00300 74.1574746 -142.3149492 1
á1 0.00000
â1 0.00000
S&P 500 Param Value Goodness-of-fit
µ 0.0051 LLF AIC CHECK
á0 0.0000 149.80 -293.59 1
á1 0.8706
â1 0.0450
BSE S&P AVG STDEV SKEW KURTOSIS Noise? Normal? ARCH?
0.00 0.93 0.08 0.02 FALSE TRUE FALSE
Target 0.00 1.00 0.00 0.00
SIG? FALSE FALSE FALSE FALSE
31
Volatility Forecast of BSE Ltd., Broad Indices
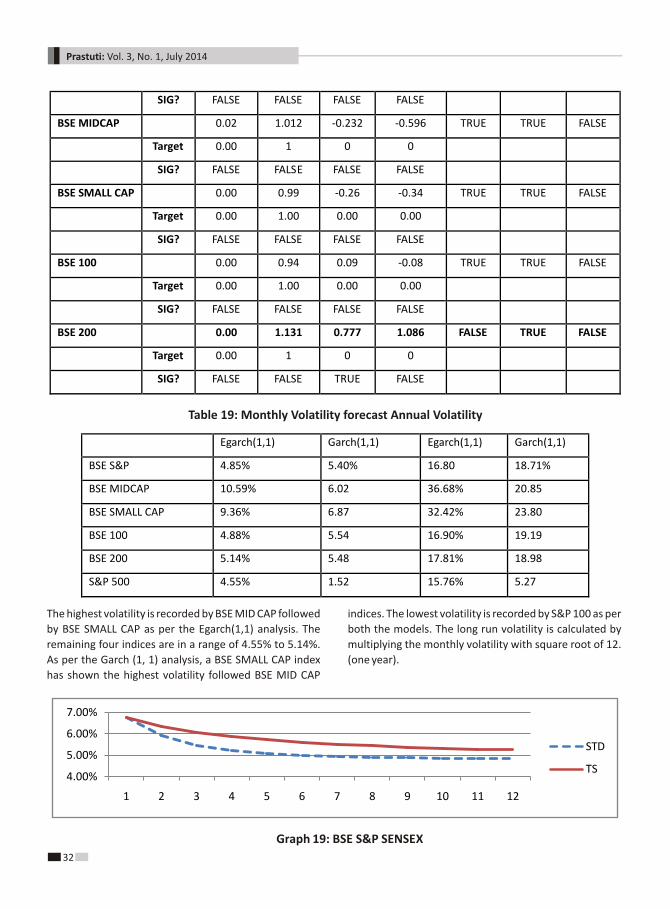
The highest volatility is recorded by BSE MID CAP followed
by BSE SMALL CAP as per the Egarch(1,1) analysis. The
remaining four indices are in a range of 4.55% to 5.14%.
As per the Garch (1, 1) analysis, a BSE SMALL CAP index
has shown the highest volatility followed BSE MID CAP
indices. The lowest volatility is recorded by S&P 100 as per
both the models. The long run volatility is calculated by
multiplying the monthly volatility with square root of 12.
(one year).
Table 19: Monthly Volatility forecast Annual Volatility
SIG? FALSE FALSE FALSE FALSE
BSE MIDCAP 0.02 1.012 -0.232 -0.596 TRUE TRUE FALSE
Target 0.00 1 0 0
SIG? FALSE FALSE FALSE FALSE
BSE SMALL CAP 0.00 0.99 -0.26 -0.34 TRUE TRUE FALSE
Target 0.00 1.00 0.00 0.00
SIG? FALSE FALSE FALSE FALSE
BSE 100 0.00 0.94 0.09 -0.08 TRUE TRUE FALSE
Target 0.00 1.00 0.00 0.00
SIG? FALSE FALSE FALSE FALSE
BSE 200 0.00 1.131 0.777 1.086 FALSE TRUE FALSE
Target 0.00 1 0 0
SIG? FALSE FALSE TRUE FALSE
Egarch(1,1) Garch(1,1) Egarch(1,1) Garch(1,1)
BSE S&P 4.85% 5.40% 16.80 18.71%
BSE MIDCAP 10.59% 6.02 36.68% 20.85
BSE SMALL CAP 9.36% 6.87 32.42% 23.80
BSE 100 4.88% 5.54 16.90% 19.19
BSE 200 5.14% 5.48 17.81% 18.98
S&P 500 4.55% 1.52 15.76% 5.27
Graph 19: BSE S&P SENSEX
4.00%
5.00%
6.00%
7.00%
1 2 3 4 5 6 7 8 9 10 11 12
STD
TS
32
Prastuti: Vol. 3, No. 1, July 2014

4.50%
4.70%
4.90%
5.10%
1 2 3 4 5 6 7 8 9 10 11 12
STD
TS
7.00%8.00%9.00%
10.00%11.00%
1 2 3 4 5 6 7 8 9 10 11 12
STD TS
9.00%
9.50%
10.00%
10.50%
11.00%
1 2 3 4 5 6 7 8 9 10 11 12
STD TS
Graph 20: BSE MIDCAP
Graph 21: BSE SMALL CAP
Graph 22: S&P500
Graph 23: BSE 100
4.70%
5.20%
5.70%
1 2 3 4 5 6 7 8 9 10 11 12
STD
TS
33
Volatility Forecast of BSE Ltd., Broad Indices

0.05141
0.051412
0.051414
0.051416
0.051418
0.05142
1 2 3 4 5 6 7 8 9 10 11 12
STD
TS
Conclusion
The analysis through GARCH (1,1) and EGARCH (1,1)
forecasted volatility of the selected BSE BROAD indices
and indicated BSE MIDCAP and BSE SMALL CAP has
highest volatility. GARCH (1,1) model has shown low
volatility than the EGARCH (1,1). Volatility forecasting
through econometric techniques presents the forecast
based on the past data, however, the volatility of stock
markets are affected by many exogenous variables which
are highly unpredictable. This analysis attempts to
present risk metrics which helps to manage risks such as
to measure the difference in actual and expected
volatility which can act as an effective hedging tool,
portfolio diversification and overall risk management.
References
• Deb, S. S., Vuyyuri, S and Roy, B. (2003), "Modelling
Stock Market Volatility in India: A Comparison of
Univariate Deterministic Models", ICFAI Journal of
Applied Finance, Vol. 9, No. 7, 19-33.
• Engle, R. (1982), "Autoregressive Conditional
Heteroscedasticity with Estimates of the Variance of
UK Inflation", Econometrica, Vol. 50, 987-1008.
• Mishra, P. K., K. B. Das, and B. B. Pradhan, (2009),
"Capital Market Volatility--An Econometric
Analysis", The Empirical Economics Letter, Vol. 8, No.
5, pp. 739-746.
• Nelson, D. B. (1991), "Conditional Heteroscedasticity
in Asset Returns: A New Approach", Econometrica,
Vol. 59, No. 2, 347-370.
• Liu, S. and Brorsen, B. (1995) Maximum
likelihoodestimation of a GARCH-stable model,
Journal of Applied Econometrics, 10, 273–85.
• Loudon, G., Watt, W. and Yadav, P. (2000) An
empiricalanalysis of alternative parametric ARCH
models, Journal of Applied Econometrics, 15,
117–36.
• Mandelbrot, B. (1963) The variation of certain
speculative prices, Journal of Business, 36, 394–419.
• McMillan, D., Speight, A. and Apgwilym, O. (2000)
Forecasting UK stock market volatility, Applied
Financial Economics, 10, 435–48.
• Nelson, D. (1991) Conditional heteroskedasticity in
asset returns: a new approach, Econometrica, 59,
349–70.
• Pagan, A. and Schwert, G. (1990) Alternative models
for conditional stock volatility, Journal of
Econometrics, 45, 267–90.
• Pena, J. (1995) Daily seasonalities and stock market
reforms in Spain, Applied Financial Economics,
5,419–23.
• Poon, S. and Granger, C. (2003) Forecasting financial
market volatility: a review, Journal of Economic
Literature, 41, 478–539.
• Siourounis, D. (2002) Modeling volatility and testing
for efficiency in emerging capital markets: the case
of the Athens stock exchange, Applied Financial
Economics, 12, 47–55.
• Yu, J. (2002) Forecasting volatility in the New Zealand
stock market, Applied Financial Economics, 12,
193–202.
Graph 24: BSE 200
34
Prastuti: Vol. 3, No. 1, July 2014

The economic reforms of 1991 have completely changed the scenario in which business is being done in India. The reform policies include opening-up for international trade and investment, deregulation, initiation of privatization, tax reforms, and inflation-controlling measures. This has been done to integrate the Indian economy with the world economy. The rise of business over the internet is one of the outcomes of such economic reforms. The advancement in Information Technology (IT) also helps the e-commerce to grow rapidly. This paper extends the research on e-commerce in India. We try to analyze how IT infrastructure acts as a barrier to e-commerce. The paper uses a survey based approach to draw the conclusions. Using data from 300 respondents, we came to the conclusion that Internet unavailability, slow access of internet, security concerns and the transaction process are the major concerns exist. The paper shows the impact of these factors on consumer satisfaction on e-commerce. Finally, we try to give some suggestions to improve the IT infrastructure so that e-commerce business can achieve their potential.
Keywords: E-commerce, IT Infrastructure, India, Internet.
Analysis of it Infrastructure As A Factor AffectingE-commerce and its Impact on Consumer Satisfaction
Abstract
Introduction
With the advancement in the Information Technology
and the explosive increase of Internet users, companies
all around the globe saw this development as an
opportunity to reach to their customers. They have been
shifting from the traditional offline mode of transaction
to the latest new online mode of transaction. The
concept of online transaction relates to e-commerce as a
practice of buying and selling products over the internet
(Lee, 2008). In the present era of Globalization and the
dot-com burst, E-commerce business has grown
significantly. The geographical distance between buyer
and seller offers no problem in doing business.
According to a survey the India’s e-commerce market is
of $16 billion in year 2013 and is expected to reach
Rs 1,07,800 crores (US$ 24 billion) by the year 2015 and
further expected to reach $56 billion in year 2023 as per
survey conducted by industry body ASSOCHAM [W1]. So
the e-commerce industry in India is growing day by day
on a rapid rate. India is currently third largest internet
user in the world and expected to become the second
with 243 million internet user by June, 2014 as per
report of I-Cube 2013 report [W2] (Internet and Mobile
Association of India (IAMAI) and IMRB International).
With the technological advancement in the Mobile
telephony the 3G and 4G services which provide a fast
access to the internet is also going to increase and also
going to increase the users day by day. By 2015 India 4G
services is projected to be 28 million source AVENDUS
[W3]. More is the users on Internet; more is the
opportunity for e-commerce.
E-commerce provides ease and convenience to the
users. Consumers can enjoy benefits such as availability
Dr. Shailendra Kumar*Vikalp**
Shubham Arya**Shreyash Bharadwaj**
*Assistant Professor, MSCLIS Divison, Indian Institute of Information Technology, Allahabad, UP. E-mail: [email protected]**Students, MBA, Indian Institute of Information Technology, Allahabad, UP. E-mail: [email protected], [email protected], [email protected] 35

of goods at lower cost, wider choice and more important
time safety. People can buy goods with a click of mouse
button without going to shops physically. Various online
services such as banking, ticketing (including airlines, bus,
railways), bill payments, hotel booking etc. also provides
tremendous benefit to the customers. E-commerce also
includes electronic advertising, electronic payment
system, electronic marketing, electronic customer
support service and electronic order and delivery.
Customer satisfaction must be the main focus of any
business now days. If the customer is not satisfied with
the interaction, he/she may lose faith and confidence on
e-commerce. They start avoiding visiting such websites.
Success of e-commerce business depends on how easily
the website can be accessed; how much reliable is the
server on which website is hosted; how much security
related issues are being taken care of; and most important
how much secure the transaction process is. Absence of
reliability and security make the websites vulnerable to
various e-attacks. Customer may feel shy to visit these e-
commerce websites and hence, the business gets
affected; the essence of e-commerce can never be
realized for both consumer and businessman. The
interaction with the websites according to a user
prospective relate to EES i.e. Effectiveness, Efficiency and
Satisfaction.
E-commerce and India
There are basically two types of e-commerce market
which can be classified as a) Business-to-Business (B2B)
and b) Business to-Consumer (B2C).
Business-to-Business (B2B):
In this type of market, the transactions happen between
organizations or businesses such as transaction between
manufacturer and wholesaler or between wholesaler and
retailer. It includes purchasing, procurement, retail
management, inventory management, payment
management, services and support etc. India’s largest
B2B portal Tradeindia, maintained by Infocom Network
Ltd, stated that e-commerce transactions in India show a
growth rate of 30 percent to 40 percent and will soon
reach the $100 billion mark. Seeing the growing Indian
market, many foreign branded companies are willing to
enter the market to take full advantage. Some of B2B
exchanges in India are tradeindia.com, Alibaba.com,
AuctionIndia.com, Indiamart.com, TeaAuction.com,
MetalJunction.com, Chemdex (www.chemdex.com),
Fastparts (www.fastparts.com), and FreeMarkets
(www.freemarkets.com) etc. [P1]
Business to-Consumer (B2C):
In this type of market, the transactions happen between
business and customer. The products are sold to the end
customer. It includes business such as e-retailing,
banking, tax payment, bill payment, hotel room booking,
entertainment, matrimonial sites, job sites, etc. Some of
B2C businesses in India are flipkart.com, jabong.com,
irctc.co.in, shaadi.com, makemytrip.com etc. [P1]
Customers are the backbone for the success of any
business. Any type of industry whether manufacturing or
service requires customers to sell their products or
utilizes their services in order to achieve the desired profit
target. India, the second fastest growing economy is also
the second most populous country in the world. Hence,
India offers a great opportunity for the e-commerce
market to grow and help in reviving the Indian economy.
The role of government is to provide a legal framework for
E Commerce so that basic rights such as privacy,
intellectual property, Prevention of fraud, consumer
protections etc are all taken care of. [P2]
Literature Review
The term IT INFRASTRUCTURE is defined in a standard
called Information Technology Infrastructure Library (ITIL)
v3 as a combined set of hardware, software, networks,
facilities, etc. (including all of the information
technology), in order to develop, test, deliver, monitor,
control or support IT services. Associated people,
processes and documentation are not part of IT
Infrastructure. [W4] Thus for our research, we link IT
infrastructure as follows:
36
Prastuti: Vol. 3, No. 1, July 2014

HARDWARE
NETWORK
SOFTWARE
FACILITIES
Speed or Slow Access of Internet
Low Network Connectivity
Absence of Virtual Keyboard
Security Issues
Server Reliability
Computer Illiteracy
Transaction Process
Expectation-Confirmation Theory (ECT) was proposed by
Oliver [1980] to study consumer satisfaction and
repurchase behavior. The ECT theory states that
consumers firstly form an initial expectation about any
product/service before purchasing. After some period of
consumption, they start building perceptions about the
performance of the consumed product/service. Next, the
consumers start deciding on their level of satisfaction.
The level of satisfaction is obtained by comparing the
actual performance of the product/service against their
initial expectation of the performance. Consequently,
satisfied consumers will form repurchasing intentions.
Jakob Nielsen [W5] the famous web usability consultant
finds satisfaction as one of the quality attribute of the
usability of websites for e-commerce:
Analysis of it Infrastructure As A Factor Affecting E-commerce and its Impact on Consumer Satisfaction
37
Tagrul U. Daim (2011) describes how IT infrastructure
refreshing can provide larger return on investment over
time.
Elizabeth Goldsmith and Sue L.T. McGregor (2000)
analyzed the impact of e-commerce on consumers, public
policy, business and education.
Arvind panagariya (1999) describes the opportunities
offered by e-commerce for the WTO and developing
countries.
Nir B.kshetri (2001) use three categories of feedback
systems–economic, sociopolitical and cognitive—to offer
a simple model of e-commerce barriers in the developing
world.
Mustafa I Eid (2011) examines the determinants of
customer satisfaction, trust and loyalty towards e-
commerce.

38
Research Methodology
A descriptive research design is used for the study. The
paper uses a survey based approach to draw the
conclusions. Random sampling has been done to collect
the data. Questionnaire was the instrument used for data
collection in order to understand the status of the subject
under study. The questionnaire consisted of 16 questions
being prepared in such a way that they enhance the
validity of responses. A five-point Likert-type scale (1 =
Strongly Disagree, 2 = Disagree, 3 = Neutral, 4 = Agree, and
5 = Strongly Agree) was used to reach the conclusion.
Firstly, we conducted an online survey through the
questionnaire in order to get responses from the
population. The questionnaire consisted of various
questions relevant to the subject under study.
Than we code the variables for performing Regression
analysis and Correlation analysis. The various variables
are coded as:
1) How was the interaction between you and online
shopping website As INTER_SHOP
2) “Speed or Slow Access of Internet” plays a vital role
in online shopping As SPEED_ROLE
3) “Low Network Connectivity” restrains the consumer
from online shopping As LOW_NETWORK
4) “Transactions process” should be very smooth and
transparent As TRANSAC_PROCESS
5) “Security issues” should be give higher priority than
any other feature As SECURITY
6) Does absence of “Virtual keyboard” makes you feel
unsecure while payments As VIRTUAL_KEYWORD
7) Number of feedbacks given by the consumer makes
the website trustable As FEEDBACK
Among the above variables INTER_SHOP that relates to
the customer satisfaction as how was the interaction
between customers and online shopping website is the
dependent variable.
While the other variables i .e. SPEED_ROLE,
LOW_NETWORK, TRANSAC_PROCESS, SECURITY,
VIRTUAL_KEYWORD and FEEDBACK that relates to the IT
infrastructure acts as an independent variables.
To assess the degree of correctness of the results,
questionnaire Reliability Analysis is done. Cronbach's
Alpha is the most common measure to determine the
reliability. It is used when the survey/questionnaire has
multiple Likert scale type questions and we want to
determine if the scale is reliable or not.
After performing the Reliability analysis we find that
Cronbach's alpha is 0.805, which indicates a high level of
internal consistency for our scale.
Secondly, we took an insight on how closely these
variables are associated with each other. Correlation
analysis is being performed on these variables to
determine the association between them. The Value of
the correlation coefficient is always between -1 and +1. A
correlation coefficient of +1 indicates that two variables
are perfectly related in a positive linear sense,as variable
X increases, variable Y increases. A correlation coefficient
of -1 indicates that two variables are perfectly related in a
negative linear sense, as variable X decreases, variable Y
decreases and a correlation coefficient of 0 indicates that
there is no linear relationship between the two variables.
Finally, we performed Regression analysis to analyze the
impact of these independent variables on the dependent
USABILITY
EFFICIENCY MEMORABILITY SATISFACTION LEARNABILITY ERRORS
Prastuti: Vol. 3, No. 1, July 2014

variable. Regression analysis is used to identify the
relationship between a dependent variable and one or
more independent variables. The results are interpreted
through the values of R squared (Coefficient of
determination), coefficients and the p-value obtained
from regression analysis.
Results and Interpretation
From the above analysis we find that our result is reliable.
The value of F is .076868 which is less than .10 at 90% level
of confidence.
The p-value is 0.076868 which is less than .1 means that
the speed and slow access of internet definitely has
impact on the customer satisfaction.
R Square is .011136 means that 1.136% of customer
satisfaction can be obtained by improving the speed and
slow access of internet.
From the coefficients, it is clear that for every percent
increase in speed of internet, customer satisfaction
increases by 10.05 %.
CORRELATION
Inter_shop Speed_role Low_network Transac_process Security Virtual_keyword Feedback
Inter_shop 1
Speed_role 0.105526145 1
Low_network 0.1211690 0.393929275 1
Transac_process 0.106287193 0.278562589 0.469044623 1
Security 0.121207779 0.318894617 0.738276985 0.73598141 1
Virtual_keyword -0.02987376 0.19058036 0.224715213 0.173430293 0.1945515 1
Feedback -0.00835337 0.204421236 0.062177255 0.062847007 0.0380863 0.029740042 1
REGRESSION
Impact of speed and slow access of internet on customer satisfaction
SUMMARY OUTPUT
Regression Statistics
R Square 0.011136
Standard Error
0.656716
Observations
282
ANOVA
df SS MS F Significance F
Regression 1 1.359867 1.359867 3.153127 0.076868*
Residual 280
120.7572
0.431276
Total 281 122.117
Coefficients
Standard Error
t Stat
P-value
Lower 95%
Upper 95%
Lower 95.0%
Upper 95.0%
Intercept
3.337694
0.238417
13.99937
4.05E-34
2.868376
3.807012
2.868376
3.807012
Speed_role 0.100572* 0.056638 1.775705 0.076868 -0.01092 0.212063 -0.01092 0.212063
*Significant at 90% level of confidence
39
Analysis of it Infrastructure As A Factor Affecting E-commerce and its Impact on Consumer Satisfaction

Impact of low network connectivity on customer satisfaction
SUMMARY OUTPUT
ANOVA
Coefficients
Standard Error
t Stat
P-value
Lower 95%
Upper 95%
Lower 95.0%
Upper 95.0%
Intercept 3.406591
0.17513367
19.45138
6.53E-54
3.061845534
3.75
3.0618
3.751337
Low_network 0.089077* 0.043609788 2.042597 0.042029 0.003232547 0.17 0.0032 0.174922
*Significant at 90% level of confidence
From the above analysis we find that our result is reliable.
The value of F is .04202 which is less than .10 at 90% level
of confidence.
The p-value is 0.042029 which is less than .1 means that
the low network connectivity definitely has impact on the
customer satisfaction.
R Square is .014682 means that 1.46 % of customer
satisfaction can be obtained by improving the network
connectivity.
From the coefficients, it is clear that for every percent
improvement in network connectivity, customer
satisfaction increases by 8.9 %.
Impact of Transaction Process on customer satisfaction
SUMMARY OUTPUT
ANOVA
Coefficients
Standard Error
t Stat
P-value
Lower 95%
Upper 95%
Lower 95.0%
Upper 95.0%
Intercept 3.359986
0.224455
14.96953
1.27E-37
2.918152
3.801819
2.918152
3.801819
Transac_process 0.09282* 0.051897 1.788657 0.074751 -0.00933 0.194984 -0.00933 0.194984
*Significant at 90% level of confidence
Prastuti: Vol. 3, No. 1, July 2014
Regression Statistics
R Square 0.014682
Standard Error
0.655537
Observations
282
df SS MS F Significance F
Regression 1 1.792915815 1.792916 4.172202 0.04202882*
Residual 280
120.3241055
0.429729
Total 281 122.1170213
Regression Statistics
R Square 0.011297
Standard Error
0.656662
Observations
282
df SS MS F Significance F
Regression 1 1.379552 1.379552 3.199293 0.07475*
Residual 280
120.7375
0.431205
Total 281 122.117

df SS MS F Significance F
Regression 1 0.108982 0.108982 0.250107 0.61739*
Residual 280
122.008
0.435743
Total 281 122.117
ANOVA
Regression Statistics
R Square 0.000892
Standard Error
0.660108
Observations
282
Coefficients
Standard Error
t Stat
P-value
Lower 95%
Upper 95%
Lower 95.0%
Upper 95.0%
Intercept 3.38572
0.185051
18.29613
9.84E-50
3.021452
3.749988
3.021452
3.749988
Security 0.08946* 0.043786 2.043259 0.041963 0.003275 0.175656 0.003275 0.175656
*Significant at 90% level of confidence
df SS MS F Significance F
Regression 1 1.794061 1.794061 4.174906 0.04196*
Residual 280
120.323
0.429725
Total 281 122.117
Impact of Security issues on customer satisfaction
From the above analysis we find that our result is reliable.
The value of F is .07475 which is less than .10 at 90% level
of confidence.
The p-value is 0.074751 which is less than .1 means that
the transaction process definitely has impact on the
customer satisfaction.
R Square is .011297 means that 1.129% of customer
satisfaction can be obtained by improving the transaction
process.
From the coefficients, it is clear that for every percent
improvement in the transaction process, customer
satisfaction increases by 9.28%.
41
Analysis of it Infrastructure As A Factor Affecting E-commerce and its Impact on Consumer Satisfaction
SUMMARY OUTPUT
Regression Statistics
R Square 0.014691
Standard Error
0.655534
Observations
282
ANOVA
From the above analysis we find that our result is reliable.
The value of F is .004196 which is less than .10 at 90% level
of confidence.
The p-value is 0.041963 which is less than .1 means that
the security issues definitely have impact on the customer
satisfaction.
R Square is .014691 means that 1.46% of customer
satisfaction can be obtained by improving upon the
transaction process.
From the coefficients, it is clear that for every percent
improvement in the security issues, customer satisfaction
increases by 8.94 %.
Impact of absence of virtual keyboard on customer satisfaction
SUMMARY OUTPUT

Coefficients
Standard
Error
t Stat
P-value
Lower 95%
Upper 95%
Lower
95.0%
Upper 95.0%
Intercept 3.779773
0.179307
21.07984
9.81E-60
3.426811
4.132735
3.426811
4.132734984
Feedback -0.00626* 0.044767 -0.13978 0.888932 -0.09438 0.081866 -0.09438 0.081865609
df SS MS F Significance F
Regression 1 0.008521 0.008521 0.019539 0.88893*
Residual 280 122.1085 0.436102
Total 281
122.117
Regression Statistics
R Square 6.98E-05
Standard Error
0.66038
Observations
282
Impact of customer feedback on customer satisfaction
Coefficients
Standard Error
t Stat
P-value
Lower 95%
Upper 95%
Lower 95.0%
Upper 95.0%
Intercept 3.813817
0.123398
30.90657
3.1E-92
3.570911
4.056723
3.570911
4.056723
Virtual_keyword -0.01699* 0.033971 -0.50011 0.617393 -0.08386 0.049881 -0.08386 0.049881
*Significant at 90% level of confidence
From the above analysis we find that the result is not
reliable. The value of F is .61739 which is greater than .10
at 90% level of confidence.
Hence we can say that the absence of virtual keyboard
does not pose any impact on the customer satisfaction
while transacting with the e-commerce websites.
*Significant at 90% level of confidence
From the above analysis we find that the result is not
reliable. The value of F is .88893 which is greater than .10
at 90% level of confidence.
Hence we can say that the feedbacks provided by the
users on the e-commerce websites do not pose any
impact on the customer satisfaction while interacting
with the e-commerce websites.
Findings
If we don’t know the problem, we can’t find the solution.
In order to satisfy the customer after they visit and
transact from any e-commerce website, companies must
focus on the problems the customer faced. The main
problem of the customer is regarding the payment. Hence
we try to find out the various problems regarding
payment in our research work.
From the data collected, the following are some of the
problems:
42
Prastuti: Vol. 3, No. 1, July 2014
SUMMARY OUTPUT
ANOVA

0
20
40
60
80
100
120
140
160
180
Some banks Credit/Debit
card accepted
Absence of virtual
keyboard
Different regulation regarding e signature
Server reliability
Series1
What are the problems customer face regarding payment?
It is essential for e-commerce companies to know about
the customers visit and buying pattern. Also they must
focus on the products which the customer usually buys.
In the discussion of customer satisfaction these things
should be keep in mind.
Clothing
Gadgets
Crockrey
Furniture
Electronics
Clothing
Gadgets
Crockrey
Furniture
Electronics
37%
26%
9%
8%
21%
0 44 88 132 176 220
What do you usually buy from online stores?
43
Analysis of it Infrastructure As A Factor Affecting E-commerce and its Impact on Consumer Satisfaction

Recommendations
The customer satisfaction is required for e-commerce
business to cherish. A satisfied customer would surely
visit the e-commerce website again. To satisfy the
customer:
1) E-commerce companies must refresh their IT
infrastructure.
2) Companies must focus on improving the Transaction
process on their websites.
3) Companies must have to choose the server which is
reliable and trustable.
4) E-commerce websites must be secured. A vulnerable
website may be attacked and can be hacked easily.
The role of government can prove to be very crucial in the
success of e-commerce in India. From the research it is
clear that low network connectivity and speed or slow
accesses of internet are among the crucial factors behind
the customer satisfaction. The government should focus
on the following areas:
1) Must aim to provide access of faster internet through
broadband and wi-fi channels.
2) Improving the mobile telephony services like 3G etc.
3) Improving the network connectivity in remote areas.
4) Investment in maintaining the network towers
throughout the country.
According to the 2011 Census data, only 3.1 percent of
total houses have Internet access in India. Chandigarh
(U/T) has the highest 18.8% of total households Internet
users, followed by NCT of Delhi (U/T) 17.6% and Goa
12.7%. Bihar has below 1% of total households Internet
users which is the lowest in India. Other states like
Maharashtra have 5.8%, Uttar Pradesh has 1.9% and West
Bengal has 2.2% of total households Internet density only.
[W6]
The government must target to increase the percent of
total houses that have internet access in India. For this a
lot of investment is needed in the IT field in improving the
IT infrastructure.
Conclusion
As per the research performed, Low network
connectivity, speed or slow accesses of internet,
transaction process and security issues relates to the
satisfaction of the customer. By improving on these
factors, more customer satisfaction can be achieved.
Efforts from both the e-commerce companies and the
government are required to work on these factors. IT
infrastructure refreshing is required. The e-commerce
business which is expected to reach Rs 1, 07,800 crores
(US$ 24 billion) by the year 2015 is one of the important
contributor to the economy of the nation. The focus of the
government must be to improve internet connectivity
and availability of network. They must also focus on
improving the IT education in our country. The U.P
government free laptop scheme can be seen as a step
towards making the state IT centric state and improving
the IT infrastructure in the state. It is essential for our
country to find the impact of e-commerce on their
economies and hence try to create a policy and
environment that favors the growth and development of
e-commerce.
44
Prastuti: Vol. 3, No. 1, July 2014

References
• Lee, I. (2008) “E-business models, services, and
communications”
• Tugrul U. Daim; Matthew Letts, Mark Krampits,
Rabah Khamis and Pranabesh Dash; Mitali Monalisa
and Jay Justice, USA (2011) IT infrastructure refresh
planning for enterprises: a business process
perspective.
• Godwin J. Udo, USA (2001) A survey study on privacy
and security concerns as major barriers for e-
commerce.
• Nir Kshetri, Barriers to e-commerce and competitive
business models in developing countries: A case
study (February) (2007).
• Voloper Creations Inc. (2008) e-commerce white
paper.
• Didar Singh (2002) Electronic Commerce: Issues Of
Policy And Strategy For India.
• [P1] Sarbapriya Ray (2011) Emerging Trend of E-
Commerce in India: Some Crucial Issues, Prospects
and Challenges.
• [P2] Shweta Sharma, Sugandha Mittal Prospects of
E-Commerce in India.
• Mustafa I. Eid (2011) Determinants of e-commerce
customer satisfaction, trust, and loyalty in Saudi
Arabia
• Arvind panagariya (1999) E-Commerce, WTO and
Developing Countries
• Elizabeth Goldsmith and Sue L.T. McGregor (2000) E-
commerce: consumer protection issues and
implications for research and education
Web References
• Associated Chambers of Commerce and Industry of
India (Assocham)
http://www.techgig.com/tech-news/editors-
pick/India-s-e-commerce-market-rose-88-in-2013-
Survey-20923
• http://www.iamai.in/PRelease_detail.aspx?nid=
3222&NMonth=11&NYear=2013
• htt p : / / w w w. a v e n d u s . co m / F i l e s / Fu n d % 2 0
Performance%20PDF/Avendus_ReportIndia%27s_
Mobile_Internet-2013.pdf
• http://en.wikipedia.org/wiki/ Information_
technology_management
• http://en.wikipedia.org/wiki/Jakob_Nielsen_%28
usability_consultant%29
• http://updateox.com/india/state-wise-internet-
users-in-india-census-2011/
45
Analysis of it Infrastructure As A Factor Affecting E-commerce and its Impact on Consumer Satisfaction

We’re aware about organizations across the globe struggling with how best to introduce social networking tools - blogs, micro blogs like Twitter, Collaboration platforms like Facebook to internal audiences. Social networking has always been stated for distracting employees but with its proper and regulated use, it can have the obverse effect. Whether it's Facebook or Twitter or any other social networking channel, these networks help in improving communication between an employer and the employees, as well as employees and their colleagues. Social networking provides a medium of receiving immediate feedbacks in forms of appreciation and criticism which can help employees engage with fellow team-mates and even customers.
Keywords: Social Networking, Employee Engagement
Impact of Social Networking on Employee Engagement at Workplace: An Empirical Study Based on IT Industry in India
Abstract
Introduction
William A Kahn (Kahn, 1990, pg 692, Academy of
Management Journal) while explaining engagement and
disengagement at work and the psychological conditions
involved explains that “people can use varying degrees
of their selves physically, cognitively, and emotionally in
work role performances, which has implications for both
their work and performances.” Employee engagement is
harnessing the organization member selves’ to their
work roles.
The psychical, emotional dimension deals with the
credence as well as perception of employees about their
workplace, its leaders and the work culture. It also takes
into account that whether the employees have a positive
or a negative proclivity towards the organization and its
leaders. The physical dimension of employee
engagement relates to the consistency of work and
effort maintained by the employees to perform their
roles.
Although it has been acknowledged that “employee
engagement is a multi-faceted construct”, as previously
suggested by (Kahn 1990), (Truss et al 2006) define
“employee engagement simply as ‘passion for work’, a
psychological state which encompasses the three
dimensions of engagement discussed by (Kahn 1990),
and captures the common theme running through all
the definitions” (CIPD report-Working Life: Employee
Attitudes and Engagement, (Truss et al 2006)).
We’re familiar to the fact that man is a social animal and
with the coming of age, the social networking going
online and virtual instead of the traditional and actual
face to face communication, had a huge impact on the
Bhavya Mathur*Divyanhsu Ojha**
Dr. Shailendra Kumar***
*&**Student, MBA (IT), Indian Institute of Information Technology, Allahabad, UP (India). Email: [email protected] & [email protected]***Asstt. Prof., MBA (IT), MSCLIS Division, Indian Institute of Information Technology, Allahabad, UP (India). Email: [email protected]
temperament of those working and particularly of those
working under stress.
Social networking involves the use of an online platform
or website that helps people to communicate, for a social
or organizational purpose, through a variety of services,
most of which are web-based. As this is a relatively new
phenomenon and there is no common international
regulatory body, it is difficult to find an official or
universally agreed definition (Broughton, Higgins, Hicks
and Cox, 2009).
However, Boyd and Ellison’s overview (Boyd and Ellison,
2007) of the comments on the particular communication
opportunities provided by social network sites:
“A form of real-time direct text-based communication
between two or more people using personal computers
or other devices (http://en.wikipedia.org/wiki/
Instant_messaging).
We define social network sites as web-based services that
allow Individuals to:
1. construct a public or semi-public profile within a
bounded system,
2. articulate a list of other users with whom they share
a connection, and
3. View and traverse their list of connections and those
made by others within the system. (Ellison N.B. &
Boyd D, 2013 (Chapter 8: Sociality through Social
Network Sites, Pg 1))
The nomenclature of these connections may vary from
site to site (Social Network Sites: Definition, History, and
Scholarship (Boyd and Ellison, Dec 2007), Pg 211). What
makes social network sites unique is not that they allow
individuals to meet strangers, but rather that they enable
users to articulate and make visible their social networks
(Social Networking Site For Self Portfolio: N. Sampath
Kumar, Chandran, Kumar, Karnavel, March 2013, Pg 2).
While social networking has implemented a wide variety
of technical features, their backbone consists of visible
profiles that display an articulated list of friends who are
also users of the system (A Proof-Carrying Code Based
Framework for Social Networking, Sorren C. Hanvey). The
public display of connections is an important component
of Social networking. Beyond profiles, Social networking
varies greatly in their features and user base. Some have
photo sharing or video-sharing capabilities; others have
built-in blogging and instant messaging technology
(Hybrid-Context instructional Model. The Internet and
the Classrooms: The Way Teachers Experience It, Udeme
T Ndon, Dec 2006, Pg 27).”
Review of Literature
Social networking establishes an open dialogue with
employees, solicits feedback and criticism, invites
interactions and discussions, and has a noticeable, active
senior leadership presence (Unleashing the Power of rdSocial Media Within Your Organization, 3 Employee
Engagement Study, Dec 2011, Page 3).
“Social media is defined as a web service that allow
individuals to construct a public or semi-public profile
within a system with definite boundaries, articulate a list
of other participants in the system whom they share a
connection and, view and explore their list of connections
and of those made by others in the system. The nature
and connection rules may vary from one service to the
other.” (Boyd DM, Ellison NB; 2007, page 2, Social
Network Sites: A De?nition)
Social networks are information-allied tools and
technologies that are used to share information and
expedite communications with internal and external
audiences. Some commonly used social networking
channels are Facebook, Twitter and LinkedIn, but social
networking can also be done in other varied forms which
may include online forums or communities, online
profiles, pictures and video uploads, E-mail. Social
networking also includes applications known as “Web
2.0,” a term encircling social mediums such as blogs,
texting, and other applications like Google Docs, Google
Blogs (BlogSpot).
Groups of interest in media that is predominantly social in
nature are found to facilitate efficient formation of
communities around a common interest such as career,
culture or politics. This involves “the interaction between
people, creating, sharing, exchanging and commenting in
virtual communities and networks (Toivonen S, 2007)”.
Various researches have advertised the benefits offered
by social networking at work place such as, effective
communication channels, efficient information and
47
Impact of Social Networking on Employee Engagement at Workplace: An Empirical Study Based on IT Industry in India

channels, mediums and ways with which people virtually
connect with each other are rapidly increasing. The pace
of communication has elevated to enormous proportions
and numbers. People find social networking as an easy
and a fine medium to keep track and pace with each
other’s lives. The use of social networking at workplace
among professionals has introduced a contemporary way
of communication which has led to efficient and effective
professional as well as personal information sharing. At
the corporate level, it’s necessary for businesses to be
agile to face the competition. And since communicating
and sharing information with people is fundamental to
the success of any business, businesses now days are
taking measures to employ tools that can provide that
competitive advantage.
This research paper will analyze the effects of use of social
networking at workplace and its ability to impact the
performance of an individual at workplace. It aims at
finding the overall relationship between the average time
spend by a person on any of the social networking sites
during working hours and their performance at the
workplace.
Objectives
1. To understand the relationship between Social
Networking and Employee Engagement in IT
industry.
2. To find out the impact of Social Networking on
Employee Engagement at Workplace in IT industry.
3. To provide suggestions for improving Employee
Engagement in IT industry.
Hypothesis
I. Null Hypothesis:
H : The use of social networking at workplace does 01
not drives employee engagement.
II. Null Hypothesis:
H : There is no difference in perception regarding 02
relationship between employee engagement and
use of social networking at various levels of
management.
III. Null Hypothesis:
H : There is no difference in perception regarding 03
knowledge sharing across the hierarchy, channels for
informal learning, development and improvement of soft
skills, job performance and satisfaction.
Direct and Indirect online and Direct and Indirect offline
network groups and the ties developed in that manner
have an impact on idea sharing and strengthening the
engagement of an employee at workplace and related
works.
However it is not identified how managerial evaluation of
job performance is affected by employee’s apprehension
about
• The use of social networking.
• Social networking as a platform for exchanging
information on personal levels.
• Regulated use of social networks at workplace.
• The affect of social networking on the behavioral
aspects of an individual at workplace.
Therefore, the use of social networking at workplace
poses similar risks to the reputation of individual as well
as the organization permitting the official use of social
networking.
Development Dimensions International (DDI, 2005, Pg
27) states “that a manager must do five things to create a
highly engaged workforce. They are:
1. Align efforts with strategy
2. Empower
3. Promote and encourage teamwork and
collaboration
4. Help people grow and develop
5. Provide support and recognition where appropriate”
Adam Wootton, director of social media and games at a
New York City based global professional services company
Towers Watson, says “social media can drive engagement
and productivity. If companies want to communicate with
their employees effectively, they need to meet the
employees on the same street they’re on. If employees
use these tools and techniques to communicate, they’re
going to react well to this media.” (Social media: A tool to
boost employee engagement, productivity, Amanda
McGrory-Dixon, April 19, 2013, Pg 1)
Communicating using the various forms of social
networking is not a new concept at the personal level. The
48
Prastuti: Vol. 3, No. 1, July 2014

relationship between employee engagement and
use of social networking at various work
specializations in an organization.
Research Methodology
A descriptive research design is used for the study, which
is a process of collecting data from the members of a
population in order to understand the status of the
subject under study with respect to one or more variables
to determine the frequency of occurrence or the extent to
which variables are related. Questionnaire was the
instrument used for data collection. The analysis uses
random sampling and can be considered a representative
of IT professionals working across India.
The questionnaire consisted of 15 questions being close-
ended to enhance validity of response. A 1-5 type Likert
scale was used to measure respondents’ agreement with
the concepts under investigation. Given below is a brief
description of the variables considered as dependent and
independent.
Dependent variable or the Y-variable as Employee
Engagement
Employee Engagement is defined by five variables that
are: Frequency of better ideas for work (IDEA),
Knowledge-sharing and training (SHARE), Effective
communication (COMM), Effectiveness in completion of
the task assigned (TASK), improved work related decision
making (WORK_DECISION).
Employee Engagement = f (Social Networking)
Independent or the X-variable as Social Networking
Coded as OFFICIAL, Social networking is defined and
analyzed on the basis of its frequency of use for official
purpose at workplace.
To assess the degree of correctness of the results
produced by the research tool i.e. the questionnaire
Reliability Analysis is done. Cronbach's alpha is a measure
of reliability. That determines the reliability of the scale
formed by multiple Likert questions.
For testing of Null Hypothesis I, Regression Analysis is
done. Regression Analysis is done to understand the
dependency of employee engagement on use of social
networking at workplace. The results will be interpreted
through the values of R squared (Coefficient of
determination), coefficients and the p-value obtained
from regression analysis.
For testing of Null Hypothesis II and Null Hypothesis III,
analysis is done by Single factor ANOVA which signifies
that the means of several populations is equal.
Single factor ANOVA is done to understand the
perceptions of relationship between social networking
and employee engagement at different levels of hierarchy
(Top Level, Middle Level, and Lower Level).
Also Single Factor ANOVA is used to understand the
relationship between Employee Engagement and use of
Social Networking at various work specializations in an
organization (Technical , Managerial).The Administrative
position is not taken into consideration due to lack of
responses from employees related to administration.
Results & Findings
The analysis is based on the data collected by a sample of
112 IT professionals working across India. The analysis is
done to assess the impact of use of social networking at
workplace on employee engagement.
Reliability Test Results
Table (1) shows the reliability statistics of the scale.
A Cronbach’s alpha (a) value greater than 0.6 is
acceptable which means that the scale is reliable.
Therefore from the value of cronbach alpha obtained
above i.e. 0.740, it can be inferred that the scale so
formed is reliable.
Regression Analysis for Hypothesis I
R square depicts how well the regression line
approximates the data points. Higher the R squared value,
better the model fits the data. The coefficient values
depict the strength and type of relationship the
independent variable has to the dependent variable.
Table 1: Reliability Statistics
Cronbach's Alpha
.740
49
Impact of Social Networking on Employee Engagement at Workplace: An Empirical Study Based on IT Industry in India

Table (2a) and Table (2b) show the regression statistics
obtained from the regression analysis.
From the results obtained in Table (2a) it can be seen that
R squared value is approximately 0.39 or 39 percent. This
explains approximately 39 percent of variation in the
dependent variable i.e. Employee Engagement.
From the results obtained in Table (2b) it can be seen that
value of coefficients is positive and p- value is 4.9956E-14
(less than 0.05) which signifies a statistically significant
relationship between independent and the dependent
variable which is positive. Therefore it can be concluded
that use of social networking at workplace drives
employee engagement in an organization.
Therefore, the null hypothesis (H ) is rejected.01
Single Factor Anova for Hypothesis II
Table (3a) shows the summary of results for single factor
anova to understand the perception of relationship
between employee engagement and use of social
networking at various levels of management. In single
factor anova if value of F is greater than the value of F-crit
(F>F-crit) the null hypothesis is rejected.
Table 2(a): Regression Statistics
Multiple R 0.630556818
R Square 0.397601901
Adjusted R Square 0.392125555
Standard Error 0.612331437
Observations 112
Table 3(b): Regression Statistics
Coefficient
Standard
Error t Stat P-value Lower 95%
Upper
95%
Lower
95.0%
Upper
95.0%
Intercept 1.497349 0.173302 8.640101 4.9956E-14 1.1539043 1.840793 1.153904 1.840793
Official 0.461234 0.054131 8.520769 9.299E-14 0.35395963 0.568508 0.35396 0.568508
Table 3(a): Anova Statistics
Source of Variation SS df MS F P-value F crit
Between Groups 1.322666667 2 0.661333333 0.905844156 0.416134056 3.354131
Within Groups 19.712 27 0.730074074
Total 21.03466667 29
From the results obtained above,
0.905844156(F) < 3.354131(F-crit)
Hence, the null hypothesis (H ) is accepted. This confirms 02
that there is no difference in perception of relationship
between employee engagement and use of social
50
Prastuti: Vol. 3, No. 1, July 2014

networking across the hierarchy (Top Level, Middle Level,
and Lower Level).
Single Factor Anova for Hypothesis III
Table (3b) shows the summary of results of single factor
anova to understand the perception of relationship
between employee engagement and use of social
networking at various work specializations in an
organization.
From the results obtained above,
0.042604 (F) < 4.042652 (F-crit)
Hence, the null hypothesis (H ) is accepted. This confirms 03
that there is no difference in perception of relationship
between employee engagement and use of social
networking at different work specializations (Technical,
Managerial) in an organization.
Thus, the objectives of finding the impact of use social
networking on employee engagement at workplace and
understanding the relationship between them is attained
by the above analysis and its result.
Suggestions
The third objective of our research is to provide
suggestions to improve employee engagement. Social
networking has become a significant part of our lives:
with an estimated 60% of all Internet users accessing
some form of social networking. In just 10 years Facebook
has grown from a few hundred users, to over 1.15 billion
active monthly users. (http://www.cipd.co.uk/hr-
resources/research/harnessing-social-media.aspx, CIPD,
2012). Social networking is an indispensable part of
today’s communication and collaborative technologies.
They can be effectively used for increasing employee
engagement, thereby making them more productive at
their workplace. Allowing employee to use social
networking at workplace can eventually benefit an
organization.
Given below are some suggestions which can help in
improving employee engagement with effective use of
social networking at workplace.
• Having an active social media presence allows
employees to "connect with customers and let them
find out what's being said in the public domain," says
Brian Platz, chief operating officer of Silk Road
Organizations. Through an effective usage of the
social networking, the internal social groups can be
connected. This gives a platform for sharing ideas,
suggestions and getting feedbacks which can be put
to a good use thereby increasing the accuracy of
targets to be accomplished.
• Use of Contemporary social communication tools
can help a lot in staffing where there are immediate
requirements.
• Being a custodian to employee communication, the
HR department should devise strategies wherein
they can apply social networking technologies in an
integrated way to give them a real meaning. Also
embedding the concept of social networking as an
integral part of the employee engagement strategy
is the next big thing.
• For effective use of social networking, organizations
should have social networking policies. The policies
should conform to the privacy, freedom of speech
and employment laws.
• The employment contracts can be incorporated with
clauses related to confidentiality, privacy,
authentication of usage and non solicitation
covenants.
Table 3(b): Anova Statistics
Source of
Variation SS df MS F P-value F crit
Between Groups 0.0288 1 0.0288 0.042604 0.837347 4.042652
Within Groups 32.448 48 0.676
Total 32.4768 49
51
Impact of Social Networking on Employee Engagement at Workplace: An Empirical Study Based on IT Industry in India

Conclusion
This research seeks to advance understanding of the
impact of social networking on employees at workplace in
IT industry across India.
Drawing from the fact, that with rapid advancement in
technology and the pace of life, the very concept of social
networking has obtained all together a different
dimension. From being offline in the past, the online form
of social networking has a relationship with employee
engagement; its impact on employee job performance is
a matter of concern.
This paper examines, explores and gains a quantitative
insight of the same in detail and establishes that
employee engagement is a function of use of social
networking at workplace. People often make use of social
networking to gain work related ideas, enhance accuracy
in decision making and as a medium of knowledge and
information sharing. It is also an efficient and useful
means of communication amongst people working in the
same place, at same or different levels of management.
References
• Adam Wootton, Director of social media and games
at Towers Watson, Social media: A tool to boost
e m p l o y e e e n g a g e m e n t , p r o d u c t i v i t y ”,
Benefitspro.com.
• “Soc ia l Media: Strategies for Employee
Engagement”, IRI Consultants.
• Kahn 1990, Frank et al 2004, “Employee
Engagement: A Literature Review”,
• Andrea Broughton, Tom Higgins, Ben Hicks and
Annette Cox, “Workplaces and Social Networking:
The Implications for Employment Relations”, (The
Institute for Employment Studies).
• Accord Management Systems. (2004), “Employee
Engagement Strategy: A Strategy of Analysis to
Move from Employee Satisfaction to Engagement”.
• Development Dimensions International (DDI):
International Journal of Business and Management
(2005), “Employee Engagement: The Key to
Improving Performance”.
• O'Reilly T (2005), “What Is Web 2.0?”
• Boyd DM, Ellison NB, J. Computer-Mediated
Communication. (2007), “Social network sites:
Definition, history, and scholarship.”
• Boyd and Ellison (2007), “Managing and Leveraging
Workplace Use of Social Media”, Journal of
Computer-Mediated Communication, SOCIETY OF
HUMAN RESOURCE MANAGEMENT.
• Toivonen S (2007), “Web on the Move Landscapes of
Mobile Social Media.” VTT Technical Research Centre
of Finland.
• MIS Quarterly, Xiaojun Zhang, “Explaining employee
job performance: The role of online and offline
workplace Communication networks”.
• Mayer Brown, “The Use of Social Media in
Workplace”.
• Workplaces and Social Networking: The Implications
for Employment Relations ,Andrea Broughton, Tom
Higgins, Ben Hicks and Annette Cox, 2009 (The
Institute for Employment Studies) Copyright © 2009
Acas.
• Psychological Conditions of Personal Engagement
and Disengagement at Work Kahn, William
A.,Academy of Management Journal; Dec 1990; 33,
4; ABI/INFORM Global.
• 3rd annual employee engagement study
UNLEASHING THE POWER OF SOCIAL MEDIA WITHIN
YOUR ORGANIZATION. By- Gagen Mac Donald, APCO
World Wide, Page 3, Engagement and Dialogue.
52
Prastuti: Vol. 3, No. 1, July 2014

Though no one likes or wants a recession. But, in the age of globalization, no country can remains isolated from the fluctuations of world economy. Heavy losses suffered by major International Banks affect all countries of the world as they have their investment interest in almost all countries. So, what is the reality for countries like India? This study aimed to stand on the opinions of relevant stakeholders in the field of corporate financial reporting practices after economic crisis in India. A questionnaire is structured and analyzed by principal component analysis. As a result of the economic downturn, the overall impact of the global financial crisis has been felt in India in terms of the corporate financial reporting is more susceptible. In the opinion of stakeholders there is need to apply global reporting practices to smoothen the corporate’s working and for making the system more transparent.
Impact of The Economic Crisis on Corporate Financial Reporting: Stakeholders’ Perceptions
Abstract
Preamble
The current crisis is different from the Great Depression
of the 1930’s. While the earlier downturns were the
result of a slowdown in demand, the crisis of 2008 has a
different basis. It originated not in a slowdown in
demand but a financial crisis which triggered a crisis of
trust between borrowers and lenders and therefore a fall
in the asset prices. This led to massive bankruptcies in
various financial and production units. Thus unlike an
earlier ones, it is a crisis created on the supply side.
Subsequently, it has also manifested itself as a demand
side problem with unemployment and housing
foreclosures rising in the US (Kapila, 2009).
A global recession is a period of global economic
slowdown. The International Monetary Fund (IMF) takes
many factors into account when defining a global
recession, it states that global economic growth of 3% or
less is "equivalent to a global recession". Recession is a
period of general economic decline, defined usually as a
contraction in the GDP for six months (two consecutive
quarters) or longer. Subprime mortgage is a class of
mortgage used by borrowers with low credit ratings.
Borrowers who use subprime loans generally do not
qualify for loans with lower rates because they have
damaged credit or no credit history, and are thus
considered risky by lending agencies. Because the
default risk for poor credit borrowers is greater than of
other borrowers, lenders charge a higher interest rate on
subprime loans. Depression can be explained as a bad,
depressingly prolonged recession in economic activity. A
slump is where output falls by at least 10%; a depression
is an even deeper and more prolonged slump (Kumar,
2011).
Hina Agarwal*
*Lecturer, Department of Commerce, Baikunthi Devi Kanya Mahavidyalaya, Agra University, Agra.Email: [email protected]
53

Recession, in lay-man terms, is the time when there is
economic decline, leading to a slowdown in trade and
economic activity. This is generally identified by a fall in
Gross Domestic Product (GDP) in two or more
consecutive quarters. Normally, when consumers lose
confidence in the growth of the economy and start to
spend less, there is a decrease in demand for goods and
services. This, in turn, leads to a decrease in production.
On the other hand, the profit margin of companies is due
to a rise in costs and they try cost cutting measures. The
equity / stock markets react negatively to this. A lay-off
(asking people to leave) leads to a rise in the
unemployment rate and a decline in real income (Sen &
Johnson, 2011).
The US has witnessed over 11 recessions so far, since the
end of the World War II. From 1930 to 1939, the US saw
the Great Depression, which began with the Wall Street
Crash of October, 1929 and rapidly spread worldwide.
Most analysts believe the causes to be the lack of high-
growth new industries, high consumer debt and bad loans
given out by banks and investors.
In 2008, defaults on sub-prime mortgages (home loan
defaults) led to a major crisis in the US. Banks had given
out loans without researching on the payback power of
the clients. With increasing defaulters, the banks went
into bankruptcy. It was called the sub-prime crisis since it
began from high risk debt offered to people with poor
credit worthiness or unstable incomes (Sen & Johnson,
2011).
Review of Literature
Barth and Landsman (2010) concluded that fair value
accounting played little or no role in the Financial Crisis.
They also concluded that because the objectives of bank
regulation and financial reporting differ, changes in
financial reporting needed to improve transparency of
information provided to the capital markets likely will not
be identical to changes in bank regulations needed to
strengthen the stability of the banking sector.
Pal (2010) explained the global economic crisis - due to its
unusual nature - has meant that auditors have to be very
aware of the prime importance of judging different risks
when assessing companies. This is especially true with
regards to the ‘going concern concept.’ The judgment of
these risks is a more complicated problem - and a serious
challenge for the auditor - during a period of crisis.
However, professional terms such as audit standards, the
principles of quality assurance, and methodological
recommendations are available. Therefore, any problems
can be solved though not easily.
Giannarakis and Theotokas (2011) evaluated the effect of
financial crisis in Corporate Social Responsibility (CSR)
performance. An empirical analysis is conducted, based
on companies that implement Global Report Initiatives
(GRI) reporting guidelines modifying the application level
in a point score system. Totally, 112 companies were
included in the GRI report list in 2007, pre-financial crisis,
2008, 2009 and 2010. The Wilcoxon signed rank sum test
is used in order to ascertain whether an economic
downturn affects CSR performance. Results indicate
increased CSR performance before and during the
financial crisis except for the period 2009-2010.
Companies increase their performance in order to regain
the lost trust in businesses. The study also promotes a
discussion with regards to a financial crisis and CSR
performance and reporting.
Alwan (2012) said that the accounting profession and its
standards have been affected and influenced the global
financial crisis that rocked the world, and clarify the issue
of the financial crisis and its impact on the accounting and
international accounting standards. He also
recommended that there should be sanctions on
companies that do not apply to international standards
with regard to accountability with a commitment to the
principle of reservation accounting because it helps in
minimizing the effects of the crisis. As well as the need to
adhere to the ethics of the profession of accounting and
the preparation of financial statements and reports in
accordance with the international standard for that.
Financial Crisis and Cor porate Financial Reporting
Although we have begun to emerge from the financial
crisis, there are many lessons yet to be learned from it.
The key, of course, is to draw the right lessons. And this is
no small feat. There remain marked differences in view
with respect to what went wrong during the crisis, what
problems need to be fixed and how to fix them. Indeed, as
we meet today, Legislature continues to deliberate
54
Prastuti: Vol. 3, No. 1, July 2014

Impact of The Economic Crisis on Corporate Financial Reporting: Stakeholders’ Perceptions
55
fundamental changes to the regulation and operation of
our financial system and markets. The stated objective of
this reform is to promote greater market resilience and
financial stability. Insofar as these reforms implicate the
quality, integrity and transparency of financial reporting,
the outcome of this debate will have potentially far-
reaching implications for the jobs that you do (Casey,
2009).
Casey (2009) has focused on three of the key lessons that
he think we can take away from the crisis, and that should
both inform policy makers' efforts at reform and caution
against legislative and regulatory responses that would
undermine the efficient functioning of our markets:
First, financial stability depends upon market confidence;
and investor confidence, in turn, depends upon the
transparency of financial statements.
Second, financial reporting and accounting standard
setting must remain focused on the needs of investors.
While there are many other important stakeholders that
rely on financial statement reporting, investors' interests
must remain paramount.
Third, financial reporting must remain relevant and
informative to investors, and should not impose
unnecessary or costly burdens that do not add to investor
understanding.
Problem of The Study
Corporate financial reporting is a means for an
organization to communicate its past actions and
proposed future plans to owners, investors or to the
society, as they are either the present or the potential
stakeholders in businesses. It is the process of
communicating both financial & non-financial
information relating to the resources & performance of a
company. The aim of corporate financial reporting is to
provide reports that are consistent and comparable, so
that the investors can take decisions in an informed
manner. In the recent past, a number of instances have
come to the force, where loopholes in the traditional
financial reporting system have been exploited to provide
misleading information to the investors, while hiding the
real financial position of the companies. There are
number of scandals take place such as Enron, Satyam
computers etc. The issue of corporate reporting for
greater transparency has come up in the wake of such
scandals & due to the process of globalization. The
inability to understand and deal with financial data is a
severe handicap in the corporate world.
Consider the international financial community to the
accounting profession as one of the causes of the global
crisis. From here we can say that the accounting
profession like other professions affected by the financial
crisis and is one of the main reasons behind this crisis,
here comes the research to study the stakeholders’ views
on corporate financial reporting after financial crisis.
There is clearly a problem of this study by answering the
following question: What is the impact of financial crisis
on stakeholders’ views about corporate financial
reporting?
Importance of The Study
The need is felt to find out the rules that are common and
global. And it gives the light to develop the new trends in
the field of corporate financial reporting. The issue of
complexity is one of the most important aspects in
financial reporting, and financial instruments are among
the most complex on which to report clearly. New
financial reporting mechanisms have been developed
with a view to providing relevant and reliable information
to the stakeholders which are not apply till now around
the world. So there is a need to develop & adopt the
standards & rules regarding corporate financial reporting.
Stakeholders in the business (whether they are internal or
external) seek information to find out three fundamental
questions. These are (i) How is the business doing? (ii)
How is the business placed at present? (iii) What are the
future prospects of the business? For outsiders, published
financial accounts are an important source of information
to enable them to answer the above questions.
Research Methodology
Research Objective: With the consideration of the above
three lessons the study aimed to “the stakeholders’
perceptions towards corporate financial reporting
practices after economic crisis in India”.
Research Method: The Indian corporate stakeholders’
population was studied in this work. For this,
questionnaire based on mainly 5 point likert scale (of one

Prastuti: Vol. 3, No. 1, July 2014
56
(1) to five (5) for the strongest disagree to the strongest
agree responses, respectively) questions, was structured.
The items requiring a descriptive response were avoided
simply because the respondents might not have the time
to give a response in text form. The collected data is
analyzed by using survey analysis techniques available in
software STATA 12.0 and the results are interpreted
accordingly.
The stakeholders include professionals as well as non-
professional (the owners, managers, customers,
suppliers, creditors, regulator, analysts and experts and
other members of the public). The stakeholders to Indian
quoted companies are effectively the population of the
country.
Research Sample: Primary data were collected and used
for the study and the sample was sixty six stakeholders
out of the numerous stakeholders’ population.
Research Tool: Principal Component Analysis
Principal components analysis is a quantitatively rigorous
method for achieving simplification. The method
generates a new set of variables, called principal
components. Each principal component is a linear
combination of the original variables. All the principal
components are orthogonal to each other so there is no
redundant information. The principal components as a
whole form an orthogonal basis for the space of the data.
The first principal component is a single axis in space.
When you project each observation on that axis, the
resulting values form a new variable. And the variance of
this variable is the maximum among all possible choices
of the first axis.
The second principal component is another axis in space,
perpendicular to the first. Projecting the observations on
this axis generates another new variable. The variance of
this variable is the maximum among all possible choices
of this second axis.
The full set of principal components is as large as the
original set of variables. But it is commonplace for the
sum of the variances of the first few principal components
to exceed 80% of the total variance of the original data. By
examining plots of these few new variables, researchers
often develop a deeper understanding of the driving
forces that generated the original data.
In the present section Principal Component Analysis
(PCA), a technique commonly used for data reduction
have used. It offers the solution for the problem of multi-
collinearity, the situation where the explanatory variables
are highly inter-correlated. The objective of PCA is to find
unit-length linear combination of the variables with the
greatest variance. In the analysis, first principal
component (PC) has maximal overall variance; the second
principal component has maximal variance among all unit
length linear combinations that are uncorrelated to the
first principal component; and the last principal
component has the smallest variance among all unit
length linear combinations of the variables.
These principal components represent the most
important directions of variability in a dataset. Given a
data matrix with p variables and n samples, the data are
first centered on the means of each variable. This ensures
that the cloud of data is centered on the origin of our
principal components. It neither affects the spatial
relationships of the data nor the variances along our
variables. The first principal component (Y ) is given by the 1
linear combination of the variables X , X ...X . 1 2 p
Symbolically,
The first principal component is calculated in such a way
that it accounts for the greatest possible variance in the
data set. Of course, one can make the variance of Y as 1
large as possible by choosing large values for the weights
a , a ...a . To prevent this, weights are calculated with 11 12 1p
the constraint that their sum of squares is 1. Thus,
The second principal component is calculated in the same
way, with the condition that it is uncorrelated with the
first principal component and that it accounts for the next
highest variance.
This process continues until a total of p principal
components have been calculated, where p is equals to
the original number of variables. At this point, the sum of
a112 + a12
2 + ... + a1p2 = 1
Y1 = a11X1 + a12X2 + … + a1pXp
Y2 = a21X1 + a22X2 + … + a2pXp
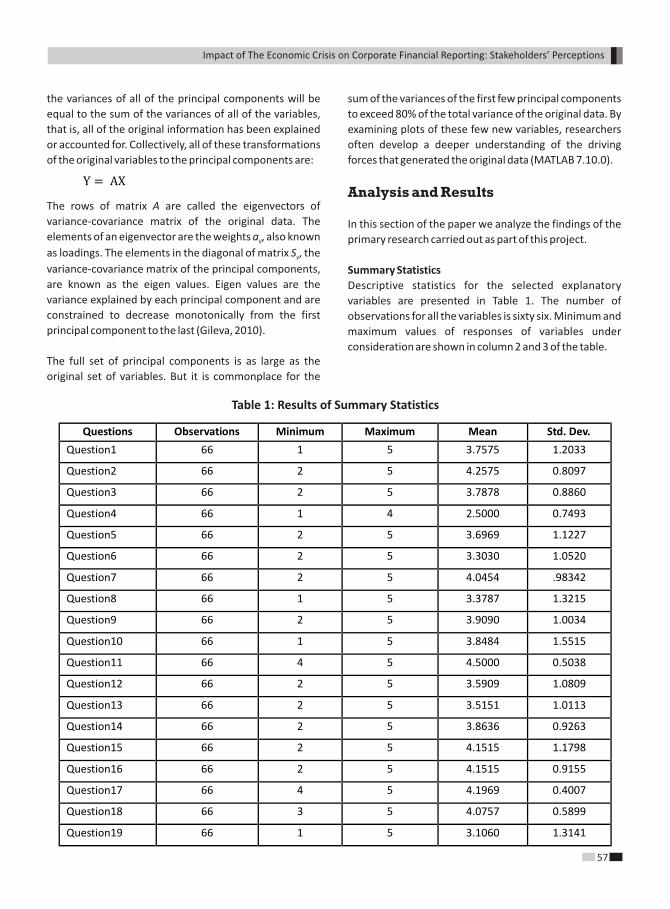
Impact of The Economic Crisis on Corporate Financial Reporting: Stakeholders’ Perceptions
57
the variances of all of the principal components will be
equal to the sum of the variances of all of the variables,
that is, all of the original information has been explained
or accounted for. Collectively, all of these transformations
of the original variables to the principal components are:
The rows of matrix A are called the eigenvectors of
variance-covariance matrix of the original data. The
elements of an eigenvector are the weights a , also known ij
as loadings. The elements in the diagonal of matrix S , the y
variance-covariance matrix of the principal components,
are known as the eigen values. Eigen values are the
variance explained by each principal component and are
constrained to decrease monotonically from the first
principal component to the last (Gileva, 2010).
The full set of principal components is as large as the
original set of variables. But it is commonplace for the
sum of the variances of the first few principal components
to exceed 80% of the total variance of the original data. By
examining plots of these few new variables, researchers
often develop a deeper understanding of the driving
forces that generated the original data (MATLAB 7.10.0).
Analysis and Results
In this section of the paper we analyze the findings of the
primary research carried out as part of this project.
Summary Statistics
Descriptive statistics for the selected explanatory
variables are presented in Table 1. The number of
observations for all the variables is sixty six. Minimum and
maximum values of responses of variables under
consideration are shown in column 2 and 3 of the table.
Y = AX
Table 1: Results of Summary Statistics
Questions Observations Minimum Maximum Mean Std. Dev.
Question1 66 1 5 3.7575 1.2033
Question2 66 2 5 4.2575 0.8097
Question3 66 2 5 3.7878 0.8860
Question4 66 1 4 2.5000 0.7493
Question5 66 2 5 3.6969 1.1227
Question6 66 2 5 3.3030 1.0520
Question7 66 2 5 4.0454 .98342
Question8 66 1 5 3.3787 1.3215
Question9 66 2 5 3.9090 1.0034
Question10 66 1 5 3.8484 1.5515
Question11 66 4 5 4.5000 0.5038
Question12 66 2 5 3.5909 1.0809
Question13 66 2 5 3.5151 1.0113
Question14 66 2 5 3.8636 0.9263
Question15 66 2 5 4.1515 1.1798
Question16 66 2 5 4.1515 0.9155
Question17 66 4 5 4.1969 0.4007
Question18 66 3 5 4.0757 0.5899
Question19 66 1 5 3.1060 1.3141

Prastuti: Vol. 3, No. 1, July 2014
58
Question20 66 2 5 3.4696 1.2180
Question21 66 1 5 3.7878 1.2590
Question22 66 2 4 3.4848 0.7492
Question23 66 1 4 2.8333 1.1446
Question24 66 2 5 4.0151 0.9363
The fourth column of the table records the arithmetic
mean value of the responses of each question, which
range between 2.5000 and 4.5000. Only two statement
i.e., Q4 (2.5000) and Q23 (2.8333) are less than the
study’s population mean of ‘3’. The means of the scores of
responses range between 2.5000 and 4.5000, only two
statement i.e., Q4 (2.5000) and Q23 (2.8333) are less than
the study’s population mean of ‘3’, which tend negative
stakeholder’s perceptions and indicate that they are
misled and not satisfied with the current pattern of
financial reporting. Stakeholders are agreed with eight
statements (Q2, Q7, Q11, Q15, Q16, Q17, Q18, and Q24)
as these mead scores ranging from 4.0151 to 4.5000. And
remaining fourteen statements have also the positive
impact on stakeholders and could be considered as
moderate when compared to a mean of there in a ‘1’ to ‘5’
range analysis.
The means of the responses concluded that stakeholders
are agreed with all the statements except Q4 and Q23,
after that, they are not satisfied with the current pattern
of the financial reporting. Variations in the responses,
expressed in terms of standard deviation is also highest
for Q10 (1.5515) and lowest for Q17 (0.4007). Results of
standard deviation also show that the responses are
highly varied, but, not negative.
Principal Component Analysis
In the present section Principal Component Analysis
(PCA), a technique commonly used for data reduction
have used. The results of ideas of Principal Component
Analysis applied on selected explanatory variables to
determine the factors that can explain the stakeholder’s
perceptions are shown in table 2.
Table 2 : Principal Component Analysis
Principal
Component
Eigenvalue Difference Proportion of
Variance
Cumulative Proportion
of Variance
1 7.1292 2.4382 0.2971 0.2971
2 4.6908 1.6134 0.1955 0.4925
3 3.0774 0.4398 0.1282 0.6207
4 2.6376 0.7949 0.1099 0.7306
5 1.8427 0.6396 0.0768 0.8074
6 1.2031 0.3891 0.0501 0.8575
7 0.8140 0.1154 0.0339 0.8915
8 0.6986 0.1188 0.0291 0.9206
9 0.5798 0.0781 0.0242 0.9447
10 0.5017 0.2207 0.0209 0.9656
11 0.2810 0.4380 0.0117 0.9773
12 0.2372 0.0563 0.0099 0.9872

The researchers have constructed each principal
component in such a way that their respective variance is
maximized. The Eigen values or variances of principal
components of the correlation matrix shown in the table
are ordered from largest to smallest. The Eigenvalues add
up to the sum of variances of the variables in the analysis
(Saxena and Bhadauriya, 2012). As the analysis is based
on correlation matrix, the variables are standardized to
have unit variance, and so the sum of eigenvalues is 24.
Impact of The Economic Crisis on Corporate Financial Reporting: Stakeholders’ Perceptions
59
13 0.1809 0.0549 0.0075 0.9948
14 0.1260 0.1259 0.0052 1.0000
Figure 1: Scree Plot of Eigen Values after Principal Component Analysis
The scree plot is proposed to be a useful tool for
visualizing the eigenvalues relative to one another, so that
you can decide the number of components to retain
(Stata Release, 12.0). The point of interest is where the
curve start flattens. It can be seen (fig. 1) that the curve
begins to flatten between questions 6 and 7. It can also be
noticed that question 7 has an eigen value of less than 1,
so only six factors can be retained. This is consistent with
Kaiser’s Rule (only factors having eigenvalues greater than
1 are considered as common factors) (Burns and Burns,
2008).
Figure 2: Scree Plot of Eigen Values with Class Interval limits after Principal Component Analysis

Prastuti: Vol. 3, No. 1, July 2014
60
A problem in interpreting the scree plot is that no
guidance is given with respect to its stability under
sampling. How different could the plot be with different
samples? The approximate variance of an eigenvalue ? ̂of
a covariance matrix for multivariate normal distributed
data is 2 ?^2=n. From this we can derive confidence
intervals for the eigenvalues. These scree plot confidence
intervals aid in the selection of important components
(see fig. 2). Despite our appreciation of the underlying
interpretability of the seventh component, the evidence
still points to retaining four or five principal components
(Stata Release 12).
Figure 3: Variance Explained by Principal Components
As shown in the table, Eigenvalue of first four principal
components (PC1 - 7.1292, PC2 – 4.6908, PC3 – 3.0774
and PC4 – 2.6376) is the maximum among all. These four
components individually explain 29.71 percent
(7.1292/24), 19.55 percent (4.6908/24), 12.82 percent
(3.0774/24) and 10.99 percent (2.6376/24) variance in
the total variance of all components. In total these
components explain 73.06 percent variance (29.71 +
19.55 + 12.82 + 10.99) of the total variance. This implies
that more than 70% of the variance is contained in first
four principal components (see fig. 3). These four
components are coordinated for choosing the main
variables among all 24 questions considered.
The results in Table 1 reveal the presence of four factors
with all 24 items of the stakeholder’s perceptions towards
corporate financial reporting practices. The eigenvalues
for the four factors are above 1 (given above). These four
factors explain a total of 73.06% of the variance.
Specifically, Factor 1 has fourteen significant loadings,
Factor 2 has twelve significant loadings, Factor 3 has
seventeen significant loadings and Factor 4 has fifteen
significant loadings respectively. Here same loadings lying
in two or more factors, so finally, the highlighted loadings
(see annexure) would be considered. Factor 1 has
fourteen significant loadings, Factor 2 has reduced to five
significant loadings, and Factor 3 considered four
significant loadings out of seventeen and Factor 4
considered no loading respectively. To end with, first
three factors has loaded because they cover all the 24
questions and factor 4 has eliminated.
Table 3: Factor Loadings
Var.
Principal
Component 1
Principal
Component 2
Principal
Component 3
Principal
Component 4
Unexplained
Variance
Unexplained
Variance
Q1 0.0366 -0.2765 0.0612 0.1926 0.5225 0.6203
Q2 0.0466 0.1548 -0.1896 -0.2887 0.5417 0.7615
Q3 0.0618 0.0478 0.3842 -0.1932 0.4093 0.5077

Impact of The Economic Crisis on Corporate Financial Reporting: Stakeholders’ Perceptions
61
Turning to an interpretation of independent dimensions
as given in Table 3, one can see that the first factor
delineates a cluster of relationships among the following
attributes; ‘Reading of the financial reports of the
company before investment’ (Q1), ‘Collection of the
information about companies from other sources
(brokers, friends, colleagues etc) except the financial
reports’ (Q2), ‘Financial reports give a true and fair view of
the financial position and performance of the entity’ (Q3),
‘Companies are worried about disclosing too much
information when it comes to segment reporting’ (Q8),
‘Control over accounting scams and scandals is the reason
of emerging demand for corporate financial reporting at
international level’ (Q10), ‘Attract the investors
internationally is the reason of emerging demand for
corporate financial reporting’ (Q11), ‘Credit rating would
be suitable for investors to invest in shares’ (Q12),
‘Companies release their reports timely’ (Q13), ‘Falsified
financial reporting affects negatively on economic picture
of company as well as country’ (Q15), ‘Consideration of
accounting policies for the selection of company for
investment’ (Q18), ‘Cut throat competition among
corporate is the reason of emerging demand for
corporate financial reporting’ (Q19), ‘Declaration of
corporate financial reports at the same date and time for
control the falsified presentation’ (Q20), ‘Effectiveness of
Return on Investment of previous years on investor’s
decision’ (Q21), and ‘Current pattern of corporate
financial reporting followed by companies’ (Q23). The
nature of the highly loaded variables on this factor
Q4 -0.0209 -0.1566 0.0093 0.3622 0.5356 0.8817
Q5 -0.0132 -0.1447 0.3764 -0.0809 0.4474 0.4647
Q6 -0.3248 -0.1282 0.0645 -0.0232 0.1564 0.1578
Q7 -0.2320 -0.2107 0.1362 0.2629 0.1685 0.3508
Q8 0.2545 -0.0422 -0.1364 0.2801 0.2657 0.4725
Q9 -0.0343 0.1485 0.4789 -0.1006 0.1557 0.1823
Q10 0.2440 -0.0003 -0.1932 0.2825 0.25 0.4605
Q11 0.2813 0.1557 0.2399 0.1066 0.1151 0.1451
Q12 0.0510 -0.0572 0.0880 0.4924 0.3027 0.9423
Q13 0.3174 0.1963 0.0034 0.0934 0.0779 0.1009
Q14 -0.2091 0.2312 -0.2171 0.1526 0.2310 0.2924
Q15 0.0043 0.3771 0.1488 0.1751 0.1837 0.2646
Q16 -0.0585 0.3358 0.0117 0.2238 0.3141 0.4462
Q17 -0.2750 0.1398 0.2477 0.1378 0.1302 0.1803
Q18 0.1978 -0.3006 0.1074 0.0161 0.2611 0.2618
Q19 0.3269 0.1395 -0.0782 -0.0620 0.1177 0.1278
Q20 0.2752 0.1011 0.1488 -0.1738 0.2642 0.3439
Q21 0.3538 -0.0639 -0.0194 -0.0493 0.0808 0.0872
Q22 -0.0024 -0.1324 -0.2183 -0.1329 0.7245 0.7711
Q23 0.2314 -0.2343 0.2723 0.0834 0.1141 0.1324
Q24 -0.0373 0.4202 0.0703 0.1397 0.0950 0.1465

Prastuti: Vol. 3, No. 1, July 2014
62
suggests that it can be named “disclosure of financial
information”. This “disclosure of financial information”
factor contributes around 30% of stakeholder’s
perceptions. Since Factor 1 has the highest eigenvalue
and variance, (eigenvalue = 7.1292, variance = 29.71%) it
necessarily represents the most important factor that has
influenced stakeholders to invest in Indian companies.
Interestingly, the results of the principal component
analysis in Table 2also reveal that the variables which
have loadings on the second factor are ‘Reporting based
on harmonized principles’ (Q9), ‘Disclosure of the
transactions and events that affect the company’s
economic position’ (Q14), ‘Effectiveness of legal structure
of the country on demand for and supply of quality of
reported financial information’ (Q16), ‘Consideration of
financial statements for the selection of company for
investment’ (Q17), and ‘Development of corporate
financial reporting practices is in right direction using IFRS
and XBRL’ (Q24). The combination of these variables can
be compositely grouped together under the proposed
heading of “appropriateness of financial information of
Indian companies”. As shown in Table 6.5, Factor 2
“appropriateness of financial information of Indian
companies” accounts for 19.55% of the total variance and
together with Factor 1 explains about 49.25% of the total
variance. All five variables are moderately correlated with
Factor 2 with factor loadings ranging from 0.0478 to
0.4202. It also suggests the appropriateness of financial
information as an instrument to strategically market the
securities of Indian companies to consumers and other
relevant stakeholders.
The third factor defining stakeholder’s perceptions
towards corporate financial reporting practices in India
relates to ‘No matters in the financial report that could be
considered to be misleading’ (Q4), ‘Relevance of
legislation and regulation related to financial reporting’
(Q5), ‘Satisfactorily resolution of noncompliance or
deficiencies in financial reporting practices by regulatory
agencies’ (Q6), ‘Necessity of reporting disclosure to meet
investor’s demand’ (Q7). For this factor, the suggested
name for it is “satisfaction with financial report” factor.
The results of the factor analysis ranked “satisfaction with
financial report” as the least important factor compared
with other variables, since it explains only 12.82% of the
total variance for the variables in the data set.
Table 4: Frequency Distribution: Factor 2 Variables – Degree of influence ofStakeholders’ Perceptions towards corporate financial reporting
Degree of Influence Value Q9 Q14 Q16 Q17 Q24
Not Important at all 1 13.23529 1.449275 1.492537 1.449275 0
Not Important 2 17.64706 13.04348 8.955224 0 10.14493
Cumulative % 17.91045 14.49275 10.44776 1.449275 10.14493
Important 4 51.47059 53.62319 41.79104 76.81159 40.57971
Very Important 5 16.17647 21.73913 40.29851 20.28986 33.33333
Cumulative % 80.59701 75.36232 82.08955 97.10145 73.91304
Neutral 3 1.470588 10.14493 7.462687 1.449275 15.94203
Mean Value 3.909091 3.863636 4.151515 4.19697 4.015152
Median Value 4 4 4 4 4
Mode Value 4 4 4 4 4

Impact of The Economic Crisis on Corporate Financial Reporting: Stakeholders’ Perceptions
63
Overall, the principal component analysis reveals an
important result indicating that appropriateness of
financial information of Indian companies factor was
considered as one of the important factors in making a
judgement and decision whether to make investment in
Ind ian companies . The ranking pos i t ion of
appropriateness of financial information of Indian
companies’ factor as the second most important factor.
Moreover, it is also expected that the proportion of
stakeholders influenced by this factor would be relatively
high. This is confirmed by figures on Table 4, whereby high
percentages of influence are evidenced for all the five
variables constituting under appropriateness of financial
information of Indian companies factors (Q9 = 80.60%,
Q14 = 75.36%, Q16 = 82.09%, Q17 = 97.10% and Q24=
73.91%).
Concluding Remarks
The paper was aimed to provide an initial insight to the
expectations of the different groups of shareholders on
corporate financial reporting practices by considering 24
fundamental factors regarding current reporting
practices.Addressing the objective of this paper might
increase the understanding of the attitude of different
stakeholders on the idea of financial reporting and its
disclosure within the annual report. This includes primary
(investors) as well as the secondary (public at large)
stakeholders' perceptions. The perceptions of
stakeholders were focused in this paper to identify the
most demanding group of stakeholders in expecting the
companies' actions in corporate financial reporting
disclosure practices. Besides that, this study can guide the
preparers of annual reports to improve on the quantity
and quality of the corporate financial reporting practices.
The regulators also can revalue the current practices of
corporate financial reporting in India and make it
mandatory for companies to disclose the relevant
reporting issues.
Thus a recession in one country will potentially have large
scale impacts on other countries to an extent not seen in
previous recession. The paper concludes that the regional
dimension provides an important and effective
framework – not just for mitigating the impact of the
current crisis but also for reducing the chances of similar
crises in the future
References
• Alwan, B. Mohammed (2012). Financial crisis and its
impact on accounting and international accounting
standards. Interdisciplinary Journal of Contemporary
Research In Business. 3(10), 998-1017.
• Barth, Mary E. and Landsman, Wayne R., (2010). How
did Financial Reporting Contribute to the Financial
Crisis? European Accounting Review 19(3), 399-423.
Rock Center for Corporate Governance at Stanford
University Working Paper No. 79. Available at SSRN:
http://ssrn.com/abstract=1601519
• Casey, Kathleen L. (2009). Lessons from the financial
crisis for financial reporting, standard setting and
rule making. Presented in financial executives
international's 28th annual current financial
reporting issues conference, New York, retrieved from
h t t p : / / w w w. s e c . g o v / n e w s / s p e e c h / 2 0 0 9 /
spch111709klc.htm
• Giannarakis, Grigoris and Theotokas, Ioannis (2011).
The effect of financial crisis in corporate social
responsibility performance. International Journal of
Marketing Studies, 3(1), 2-10.
• Gileva, T. (2010). Econometrics of crude oil markets,
Thesis submitted to the Department of Economics,
University of Paris.
• Kapila, Uma (2009). Indian economy: performance
and policies (9th ed.). New Delhi, Academic
Foundation.
• Kumar, Nidhi Arora (2011). Impact of global recession
on Indian it industry and effectiveness of e-business in
the era of recession. Global Journal of Business
Management and Information Technology. 1 (1), 9-
25.
• MATLAB 7.10.0 Release 2010
• Pal, Tibor (2010). The impact of the economic crisis on
auditing. European Integration Studies, Miskolc, 8(1)
131-142.
• Saxena, S. P. and Bhadauriya, S. (2012). Principal
component analysis of macroeconomic determinants
of stock market dynamics: some reflections from
national stock exchange of India ltd. Transformation
and survival of business organizations: challenges
and opportunities. 97-105.
• Sen, Sohini&Johnson, Shilpa (2011). Primer:
Recession and impact on India. Retrieved from
http://www.business-standard.com/article/
markets/primer-recession-and-impact-on-india-
111080800134_1.html

Stock market is one of the most important sources for companies to raise money. It allows businesses to be publicly traded, or raise additional capital for expansion by selling shares of ownership of the company in a public market. History has shown that the price of shares and other assets is an important part of the dynamics of economic activity, and can influence or be an indicator of social mood. An economy where the stock market is on the rise is considered to be an upcoming economy.
Stock market dynamics or volatility refers to the variation in the stock price changes during a period of time. The volatility of stock market indicators goes beyond anyone’s reasonable explanations. Generally, variations in stock market are caused by the fluctuations in the performance of the economy or the macroeconomic indicators of an economy. The modeling of stock market volatility is one of the key areas of present financial research as stock market is the main determinant of economic development of a country. The present paper is intended at developing a dynamic model of macroeconomic determinants of stock market volatility via a causal loop diagramming.
Keywords: Stock market volatility, macroeconomic determinants, causal loop diagram
Causal Loop Modeling of Macroeconomic Determinants of Stock Market Volatility
Abstract
Introduction
Understanding the stock market dynamics has long been
a topic of considerable interest to both policy makers
and market practitioners. Policy makers on one hand are
interested in the main determinants of stock market
volatility and in its spillover effects on real activity, on the
other, market practitioners are interested in the direct
effects time-varying volatility exerts on the pricing and
hedging of plain vanilla options and more exotic
derivatives. In both cases, forecasting stock market
volatility constitutes a formidable challenge but also a
fundamental instrument to manage the risks faced by
these institutions (Corradi & Distaso, 2009). The
volatility of stock market indicators goes beyond
anyone’s reasonable explanations; industry
performances, economic and political changes are
among the major factors that can affect the stock market
(Goonatilake&Herath, 2007).
Stock market volatility is affected both by micro and
macro variables. Micro variables generally include
corporate results announcements, business cycles,
financial Leverage etc and the macro variables may
include the indicators of country’s economy, such as
gross domestic production, inflation rate, foreign
investment etc. Impact of macroeconomic variables is
found to be more important because the stock
performance of a particular company is influenced by
micro variables but the macro variables drop impact on
the whole stock market behavior.
Economic theory suggests that stock prices should
reveal expectations about future corporate
performance, and corporate profits generally reflect the
Sonam Bhadauriya*
*Assistant Professor (Commerce), Department of Humanities, NIMS University, Jaipur (India) Email: [email protected]
64

level of economic activities. If stock prices accurately
reflect the underlying fundamentals, then they should be
employed as leading indicators of future economic
activities, and not the other way around. Therefore, the
causal relations and dynamic interactions among
macroeconomic variables and stock prices are important
in the formulation of the nation’s macroeconomic policy.
In an economy there can be a large number of
macroeconomic variables which cause stock market
vulnerability.
The objective of the paper is to construct the system
dynamic model via causal loop diagramming for provide
assistant to stock market practitioners as well as
investors. The paper is divided in five sections. First
section gives brief description of basic framework of the
paper. Section two presents review of specific studies
conducted on relationship between macroeconomic
indicators and stock market volatility, and also on the
basics of causal loop diagramming. In section three brief
description of research objective and research
methodology is presented. Fourth section is about the
summary of macroeconomic determinants of stock
market volatility. An attempt has been made to identify
interacting causal loops for stock market returns and its
macroeconomic determinants. The paper ends with fifth
section by giving concluding remarks.
Literature Review
The relationship between macroeconomic variables and
stock market returns is, by now, well-documented in the
literature. Maysami et al. (2004) examined the long-term
equi l ibr ium re lat ionships between se lected
macroeconomic variables and the Singapore stock market
index. They concluded that the causal relations and
dynamic interactions among macroeconomic
determinants of the economy and stock prices are
important in the formulation of the nation’s
macroeconomic policy. Aksoy & Leblebicioglu (2004)
successfully implemented a rule based fuzzy logic model
to forecast the monthly return of the ISE100 Index by
combining technical analysis, financial analysis and
macroeconomic analysis. Chowdhury et al. (2006)
examined how the macroeconomic risk associated with
industrial production, inflation, and exchange rate is
related and reflected in the stock market returns in the
context of Bangladesh. They concluded that there is
relation between stock market dynamics and
macroeconomic volatility. Engle & Rangel (2006)
developed a model that allows long horizon forecasts of
volatility to depend on macroeconomic developments,
and delivers estimates of the volatility to be anticipated in
a newly opened market.
Humpe & Macmillan (2007) examined whether selected
macroeconomic variables influenced stock prices in the
US and Japan. Adam et al. (2008) in his study found that
there is co-integration between macroeconomic variable
and Stock prices in Ghana indicating long run relationship.
Kumar (2009) investigated the relationship between
macroeconomic parameters like Exchange rate and
foreign institutional investment with stock returns in
India, in particular at National Stock Exchange. By using
granger causality test he found that exchange rate and
stock returns had no causality from either of the sides
whereas stock return was found to granger cause of FII
series. Ali et al. (2010) also investigated the causal
relationship between macroeconomic indicators and
stock exchange prices. They found co-integration
between industrial production index and stock prices, and
no causal relationship between macroeconomic
indicators and the stock prices in Pakistan.
Gileva (2010) investigated the dynamics of oil prices and
their volatilities through application of different
econometrical tools as principal component analysis for
finding out the fundamental factors contributing to this
process. Haron & Maiyastri (2004), Kerby & James (2004),
Liu & Jun (2011) and Loretan (1997) used multivariate
statistical methods such as principal component analysis
and discriminant analysis for determining fundamental
factors of stock market trends. They concluded that such
analysis can be used to reduce the effective
dimensionality of other scenario specification problems.
Several authors suggested to use causal loop
diagramming as the base for dynamic modeling
technique due to its ability to cater a modeling framework
that is causal and logically structured. Binder et al. (2004)
discussed how a Causal Loop diagram can be labeled and
structured incrementally in order to finally transform it
into a Stock and Flow diagram. And, also described a
general set of possible transformation steps and offered
guidance on when to choose which step. Schaffernicht
(2007) concentrated on dealing with causal links’ polarity.
65
Causal Loop Modeling of Macroeconomic Determinants of Stock Market Volatility

Then, revisited the traditional criticism of causal loop
diagrams and showed a way out; and also expressed
important information on causal loop diagramming.
Research Objective and Methodology
This paper is dedicated to the system dynamics modeling
of macroeconomic determinants of stock market
volatility via causal loop diagramming. The dynamic
system modeling is conducted by using the software
Vensim PLE v6.0. It is a visual modeling tool that allows to
conceptualize, document, simulate, analyze, and
optimize models of dynamic systems. Vensim provides a
simple and flexible way of buildings imulation models
from causal loop or stock and flow diagrams. This
software is capable of exploring thoroughly the behavior
of the model thatcan be simulated.
Macroeconomic Determinants of Stock Market Volatility
Every stock price moves for two possible reasons viz. news
about the company and news about the country. News
about the company are known as the micro variables (e.g.
results announcement, business cycle, financial leverage,
a product launch, etc.) and news about the country are
known as macro variables (e.g. a budget announcement,
nuclear bombs, inflation etc.) Impact of macroeconomic
variables is more important, because the stock
performance of a particular company is influenced by
micro variables but the macro variables drop impact on
the whole stock market behavior. On any one day, there
would be good stock-specific news for a few companies
and bad stock-specific news for others. The news that is
common to all stocks is news about macro economy.
Stock markets are barometers of the economy. It is
expected that the markets and their indicators, in the
form of indices, reflect the potential of the corporate
listed on them, and, in the process, the direction and
health of the economy. If a country’s economy is
performing well and expected to grow at a healthy rate,
the market is usually expected to reflect that.
An extensive review of literature has been conducted for
identifying the key macroeconomic variables of stock
market vulnerability and the fourteen variables are
selected for developing the causal model. Stock market
returns (SMR) are considered as the determining variable
and the selected determinants are Gross Domestic
Product (GDP), Index of Industrial Production (IIP),
Inflation (INF), Balance of Payments (BOP), Foreign
Exchange Reserves (FXRE), Foreign Exchange Rate (FXRA),
Repo Rate (RPR), Treasury Bills Rate (TBR), Prime Lending
Rate (PLR), Foreign Institutional Investments (FII), Trading
Volume (TRV), Market Capitalization (MCP), Crude Oil
Prices (CRO) and Gold Prices (GLD).
Causal Loop Diagram
Causal modeling is a form of System Dynamics (SD).
Causal modeling refers that the variables are linked by a
chain of events directly on its predecessor (Halper and
Perl, 2005). The real explanatory power of SD resides in
the shift from the linear causal chains to closed chains of
the positive and negative feedback loops. In this sense, SD
defines the so called Causal Loop Diagrams (CLDs) as
models of system that are abstract and simplified
representations of portion of reality (Cioni, 2009).
Causal Loop Diagrams are used to document the relevant
factors and the causal relationships between them. CLDs
consist two items, the first are the factors or variables and
second are the links connecting the factors. Any link has
annotations about its polarity and delay. The polarity tells
whether the dependency has positive polarity (if the
cause increases, the effect will also increase compared
with the situation where the cause did not change) or
negative polarity (if the cause increases, the effect will
decrease compared with the situation where the cause
did not change) (Binder et al., 2004). In simple words, a
“+” sign means that changes in first variable cause
changes “in the same direction” in the second variable
and a “” sign means that changes in the first variable cause
a change “in the opposite direction” in the second
variable. CLDs represent only the structure, the dynamics
of events have been abstracted away. Basically, these are
about what happens between events or variables as
cause and effect.
The sources of information used in different approaches
to manage the socio-economic and socio-technical
problems are multiple and can be broadly categorized
into three: mental, written/spoken and numerical.
Mental database present with every human being is
information rich and is the primary source of information.
The mental database contains all information on
66
Prastuti: Vol. 3, No. 1, July 2014

conceptual and behavioral information and technical
fronts. Causal loop diagramming is pragmatic from its
outset and has always been interested in causal beliefs
that people articulate from their mental database.
Causal Loop Diagram for Stock Market and its
Macroeconomic Determinants
Researcher used mental database supported by
scrutinized review of researches on stock market volatility
and macro economy for diagraming the CLD for modeling
stock market behavior due to macroeconomic
environment. The developed causal framework is
presented in the figure 1. The figure, the polarity of the
causal loops is indicated by the blue color at the top of the
arrows. The figure shows total fifteen variables (SMR,
GDP, IIP, INF, BOP, FXRE, FXRA, RPR, TBR, PLR, FII, TRV,
MCP, CRO and GLD) in its silhouette. In the diagram, all the
variables are interconnected by the causal loops
indicating negative or positive polarity. The matrix of
polarities is shown in the table 1 for giving some clarity in
the figure. The logical causal relationships among
selected variables are as follows:
Stock Market Returns (SMR): SMR is the main
determined variable of the model. It has three positive
causal links to FII, TRV and MCP with the positive
polarities. As FII, TRV and MCP are basically, the indicators
from stock market, they directly influenced by SMR. The
rising in the stock market index results in the boost up in
the number of investors, traded volume and also in the
market capitalization.
Gross Domestic Product (GDP): The causal loop diagram
shows that gross domestic product have six positive
causal links to SMR, IIP, INF, TRV, FII and MCP. Increased
GDP results into the higher employment opportunities,
increased their disposable income, higher consumer
spending and higher corporate profits. The increased
corporate profits in turn lead to increase in the
investment and production. Boom in GDP accompanied
by increased money supply in an economy though
enhance production of goods and services; but is likely a
cause inflation rise. The increased investment
opportunities may invite FII also. Thus, higher GDP is a
benign factor for the economy which has an overall
impact on all the companies in an economy. The market
capitalization of the companies is automatically increased
with the GDP growth. Further, boom in GDP also results in
the increased inflation as increase in money supply is a
likely cause to inflation.
Index of Industrial Production (IIP): Figure shows seven
positive causal links of IIP with SMR, GDP, BOP, FII, TRV,
MCP, CRO and negative link with INF. Relationships of
industrial production with inflation, stock market and
gross domestic product are very clear as all are the
outcomes of increased money supply and higher
consumer demand. Industrial production is the outcome
of increasing corporates’ profits and the corporates’
profits are the outcomes of increased industrial
production, which in turn has direct impact on the share
prices, trading volume and also the investments. Figure
also shows that the IIP cause to CRO, It means when
industrial production increases, the demand of crude oil
also increases, which results into higher crude oil prices in
the international market, rising industrial production and
the increased inflation.
Inflation (INF): Causality of INF are identified on the GDP,
IIP, CRO, GLD and SLV with the positive polarities.
Closeness in the relationship of INF with GDP and IIP is
discussed in above paragraphs. The prices of crude oil,
gold, silver, and inflation have cause and effect
relationship. Today, commodities like crude oil, gold and
silver are renowned as an effective tool to hedge against
inflation. Hence, inflation causes an increase in demand
for these commodities and thus leads to rise in their
prices.
Balance of Payments (BOP): Figure displays the positive
causal links of BOP with the variables FXRE and FII and
negative causal link with FXRA. Increased international
trade gives rise to currency flows in the country and
improves the position of RBI to hold more foreign
currency. Further, increased trade and forex reserves also
attract investors from foreign countries which again
strengthen the forex reserves position of the country and
ultimately the value of foreign currency gets increased.
Foreign Exchange Reserves (FXRE): Forex reserves have
negative causal relationship with FXRA and positive causal
link with FII. Forex reserves are instruments to maintain or
manage the exchange rate, while enabling orderly
absorption of international money and capital flows. In
brief, official reserves are held for precautionary and
transaction motives keeping in view the aggregate of
national interests, to achieve balance between demand
67
Causal Loop Modeling of Macroeconomic Determinants of Stock Market Volatility

for and supply of foreign currencies, for intervention, and
to preserve confidence in the country’s ability to carry out
external transactions. Foreign exchange reserves are
important indicators of ability to repay foreign debt and
for currency defence, and are also used to determine
credit ratings of the nations. Thus, sound foreign
exchange reserves position of the nation brings more
investments from the foreign investors.
Foreign Exchange Rate (FXRA): The causal loop diagram
displays the negative causal link of FXRA with IIP, BOP and
FXRE. It indicates that a move in exchange rate in terms of
dollar results in change in prices of imports and exports.
Further, when dollar appreciates against Indian Rupee,
the relative prices of exports to US increases as the import
prices for US consumers gets decrease. Such a rise in
exports and fall in imports reduces the current account
deficit. Increased rate of foreign exchange bound to the
domestic manufactures, who depends on the imported
raw material or necessities to reduce their imports and
the production level.
Repo Rate (RPR): The causal loop diagram shows that
Repo rate has two negative causal links to the IIP and INF.
When repo rate increases, interest rates on banks’
deposits also increase, and in turn banks raise the interest
rates on loans they offer to customers. The customers
then are dissuaded in taking credit from banks, leading to
a shortage of money in the economy and less liquidity.
Thus, on the one hand, it controls inflation is under limits
as there is less money to spend, growth suffers as
companies avoid taking new loans at high rates, leading to
a shortfall in production and expansion.
Treasury Bills Rate (TBR): TBR has also two negative
causal links to the IIP and INF. An increase in treasury bill
rate leads to higher interest rates which in turn may
reduce industrial production, performance and also the
reduction in general price level.
Prime Lending Rate (PLR): Causalities of PLR are
identified on the SMR, GDP and IIP with the negative
polarity. Economic theory says that the interest rate
channel affects the demand for goods and services.
Higher interest rates mean that the price of both financial
and real assets - shares, bonds, property, etc. - falls and
the present value of future returns drops. Further, higher
interest rates also lead to a reduction in household
consumption. When faced with dwindling wealth,
households become less willing to consume. A rise in
interest rates also makes it more expensive for firms to
finance investment. As a result, higher interest rates
normally curtail investment. If consumption and
investment fall, so does aggregate demand. Lower
aggregate demand results in lower resource utilization.
When resource utilization is low, prices and wages usually
rise at a more modest rate. However, it takes time before a
decline in resource utilization leads to a fall in inflation.
This is partly because wages do not change from month to
month but more seldom than that.
Foreign Institutional Investments (FII): FII has three
positive causal links to SMR, TRV and MCP, and a negative
causal link to BOP. FIIs usually pool large sums of money
and invest those in securities, real property and other
investment assets. As bulks of their investments are in the
stock market, the inflow and outflow of money by FIIs
affect stock market movement significantly and also the
trading volume and the market capitalization. Since, the
account of balance of payments is credited by the amount
of FII inflows, it has negative impact on the BOP.
Trading Volume (TRV): Causal loop diagram shows the
positive causal links of TRV with SMR and MCP. Trading
volume reflects the intensity of a stock, commodity or
index. Volume also provides an indication of the quality of
a price trend and the liquidity of a security or commodity.
High volume means greater reliance can be placed on the
movement in price than if there was low volume, because
heavy volume is the relative consensus of a large number
of participants. Increasing trading volume is the sign of
growth of the stock exchange and its market
capitalization.
Market Capitalization (MCP): The market capitalization
also is found to have two positive causal links with SMR
and FII. Market capitalization is the way to use the stock
price to determine the value of a company, and to know
how likely it is to grow. The investors use the figure of
market capitalization to determine the size of a company.
Normally, they are attracted with the growing trend of
market capitalization of a stock exchange.
Crude Oil Prices (CRO): Figure depicts four positive causal
links of CRO to SMR, INF, BOP and GLD. The crude oil prices
and inflation are often seen as being connected in a cause
68
Prastuti: Vol. 3, No. 1, July 2014

and effect relationship. As oil prices move up or down,
inflation follows in the same direction. The reason why
this happens is that oil is a major input in the economy - it
is used in critical activities such as fueling transportation
and heating homes - and if input costs rise, so should the
cost of end products, which raises prices and thus
inflation. Inflation causes an increase in demand for these
commodities and thus leads to a rise in their prices.
Hence, the profit margin of the crude oil based companies
increase with ultimately influence their market
performance and resulted in the growth in the overall
stock market performance.
The impact of oil price on gold price could be established
through the export revenue channel. In order to disperse
market risk and maintain commodity value, dominant oil
exporting countries use high revenues from selling oil to
invest in gold. Since several countries including oil
producers keep gold as an asset of their international
reserve portfolios, rising oil prices (and hence oil
revenues) may have implications for the increase of gold
prices. This holds true as long as gold accounts for a
significant part in the asset portfolio of oil exporters and
oil exporters purchase gold in proportion to their rising oil
revenues. Therefore, the expansion of oil revenues
enhances the gold market investment and this causes
price volatility of oil and gold to move in the same
direction. In such a scenario, an oil price increase leads to
a rise in demand and hence prices of gold. If there is hike in
the prices of crude oil in international market, then the
import prices for India automatically raised as India is one
of the major importer for crude oil market and it will
adversely affect the account of balance of payments.
Gold Prices (GLD): GLD has two positive causal links to
SMR and SLV with positive polarities. Gold prices are
highly dominated by the changes in the international
market and fluctuate in a very intensive manner with the
variations in the international commodity market.
Investors are mostly interested in the assets with low
price and high returns. Thus, when the gold prices are on
the increasing, they generally move their investments to
the stock market. Inflation channel is the best to explain
the linkage between gold and silver markets. A rise in gold
price leads to an increase in the general price level. When
the general price level or inflation goes up, the price of
silver, which is also a good, also increase. On the other
hand, gold and silver prices sometimes fluctuates due to
changes in demand for jewelry.
Conclusion
The paper presents a logically structured framework for
interrelationship among the stock market returns and the
macroeconomic determinants, which can be helpful for
additional researches for developing non-linear modeling
techniques such as System Dynamics, Fuzzy-Neural
Networks, Fuzzy Asymmetric GARCH model, Hidden
Markov Models, Wavelet Neural Networks etc.
Investment in stock market is a science wherein an
investor should carry out a detailed enquiry before
investing. The research is aimed at developing and
following a scientific approach to understand the
behavior of stock market. The paper could work as an
investment guide with comprehensive and in-depth
knowledge on stock market investing for them.
Understanding the role of economic indicators that
determine market performance as well as analysis of their
impact on the market, are essential skills for the finance
researchers. From time to time, domestic and
international economic data are released, which impact
the financial markets. This research makes available a
broad and wide description of macroeconomic indicators
impacting stock market behavior, interpretation of the
same and also the application of various techniques for
analyzing the impact.
References
• Adam, A. M, and Tweneboah, G. (2008). Do
macroeconomic variables play any role in the stock
market movement in Ghana?,"MPRA Paper 9357,
University Library of Munich, Germany, revised 2008
Online at http://mpra.ub.uni-muenchen.de/9357/.
• Aksoy, H., and Leblebicioglu, K. (2004). Modeling
ISE100 index through fuzzy logic, Eleventh Annual
MFS Conference Proceedings, Turkey.
• Ali, I., Rehman, K. U., Yilmaz, A. K., Khan, M. A., and
Afzal, H. (2010). Causal relationship between macro-
economic indicators and stock exchange prices in
Pakistan. African Journal of Business Management.
4(3), 312-319.
• Binder, T., Vox, A., Belyazid, S., Haraldsson, H., and
Svensson, M. (2004). Developing system dynamics
model from causal loop diagrams. In proceedings of
the 22nd International Conference of the System
Dynamics Society, Oxford, UK.
69
Causal Loop Modeling of Macroeconomic Determinants of Stock Market Volatility

• Chowdhury, S. S., Mollik, A. T. & Akhter, M.S. (2006).
Does predicted macroeconomic volatility influence
stock market volatility? Evidence from the
Bangladesh capital market, Working Paper,
Department of Finance and Banking, University of
Rajshahi, Bangladesh.
• Cioni, L. (2009). The good and the bad of system
dynamics. Draft paper, University of Pisa, Italy.
Retrieved from http://www.di.unipi.it/~lcioni/
listofpapers/2009.html.
• Engle, R. F. & Rangel, J. G. (2008).The Spline - GARCH
model for low frequency volatility and its global
macroeconomic causes, Review of Financial Studies,
21, 1187-1222.
• Gileva, T. (2010). Econometrics of crude oil markets,
Thesis submitted to the Department of Economics,
University of Paris.
• Goonatilake, R. & Herath, S. (2007). The volatility of
stock Market & News, International Research
Journal of Finance & Economics, 11.
• Halper, J. and Perl, J. (2005). Causes and
explanations: a structural-model approach. Part I:
Causes, British Journal of Philosophy of Science, 56,
843-887.
• Haron, K. & Maiyastri (2004).Principal component
analysis in modeling stock market returns,
Matematika, 20 (1), 31–41.
• H u m p e , A . & M a c m i l l a n , P. ( 2 0 0 7 ) .C a n
macroeconomic variables explain long term stock
market movements? A comparison of the US and
Japan, CDMA Working Paper No. 07/20.
• Kerby, A. & James, L. (2004).A multivariate statistical
analysis of stock trends, Joint Statistical Meetings,
Toronto, Ontario, Canada, August 8-12.
• Kumar, S. (2009).“Investigating Causal Relationship
Between Stock Return with Respect to Exchange Rate
And FII: Evidence from India”, Birla Institute of
Technology & Science, Pilani.
• Liu, H. & Jun, W. (2011).Integrating independent
component analysis and principal component
analysis with neural network to predict Chinese stock
market, Institute of Financial Mathematics and
Financial Engineering, College of Science, Beijing
Jiaotong University, Beijing, China.
• Loretan, M. (1997).Generating market risk scenarios
u s i n g p r i n c i p a l c o m p o n e n t s a n a l y s i s :
methodological and practical considerations,
Federal Reserve Board, March.
• Maysami, R. C., Lee, C. H. &Mohamad, A. H. (2004).
Relationship between macroeconomic variablesand
stock market indices: cointegrationevidence from
stock exchange of Singapore’s All-S sector indices,
Journal Pengurusan, 24, 47-77.
• Schaffernicht, M. (2007). Causality and diagrams for
system dynamics. Actas de la 50th International
Conference of the System Dynamics Society
Proceedings, Boston.
70
Prastuti: Vol. 3, No. 1, July 2014
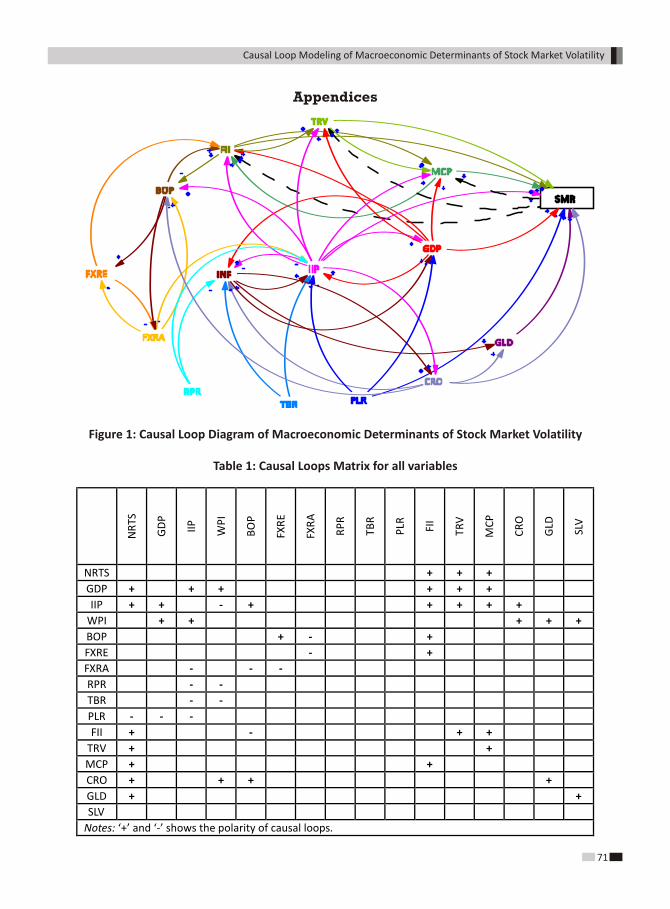
NR
TS
GD
P
IIP
WP
I
BO
P
FXR
E
FXR
A
RP
R
TBR
PLR
FII
TRV
MC
P
CR
O
GLD
SLV
NRTS + + +
GDP + + + + + +
IIP + + - + + + + +
WPI + + + + +
BOP + - +
FXRE - +
FXRA - - -
RPR - -
TBR - -
PLR - - -
FII + - + +
TRV + +
MCP + +
CRO + + + +
GLD + +
SLV
Notes: ‘+’ and ‘-’ shows the polarity of causal loops.
Appendices
Figure 1: Causal Loop Diagram of Macroeconomic Determinants of Stock Market Volatility
Table 1: Causal Loops Matrix for all variables
71
Causal Loop Modeling of Macroeconomic Determinants of Stock Market Volatility

72
Prastuti: Vol. 3, No. 1, July 2014

Guidelines for Submission of Manuscript
1. The whole manuscript is required to be in one MS-WORD file only which will start from the covering letter.
2. The author is advised to submit the complete manuscript as mere Abstract alone will not be considered for review.
3. Manuscript Title: The title of the paper should be in a 12 point Times New Roman font. It should be bold typed, centered and fully capitalized.
4. Author Name(s) & Affiliations: The Author(s) full name, designation, affiliation(s), address, mobile numbers, and e-mail address should be in italic & 11-point Calibri Font. It must be centered underneath the title.
5. Abstract: Abstract should be in fully italicized text, not exceeding 250 words. The abstract must be informative and explain the background, aims, methods, results and conclusion in a single paragraph. Abbreviations must be mentioned in full.
6. Keywords: Abstract must be followed by a list of keywords arranged in alphabetical order and separated by commas and full stops at the end.
7. Manuscript: It should be free from grammatical, spelling and punctuation errors and must be thoroughly edited. Avoid hybrid language and prefer British English. Use standard A4 paper with portrait setting. The text in 10 points Times New Roman should have single space with 1” margin set for top, bottom, left and right. The numbering of pages should be at the bottom (centre alignment).
8. Headings: All the headings should be in a 12 point Times New Roman Font. These must be bold-faced, aligned left.
9. Sub Headings: All the sub-headings should be in a 10 point Times New Roman Font. These must be bold-faced, aligned left.
10. Main Text: It should be in a 10 point Times New Roman Font, single spaced and justified. The manuscript should preferably not exceed 5,000 words. The main text should follow the following sequence:• Introduction• Review of Literature• Need / Importance of Study• Statement of the Problem• Objectives• Hypotheses• Research Methodology• Results and Discussion• Findings• Recommendations / Suggestions• Conclusions• Acknowledgements• References• Appendix / Annexure
11. Figures and Tables: These should be simple, crystal clear, centered, separately numbered & self explained, and titles must be above the table / figure. Sources of data should be mentioned below the table / figure.
12. Equations: These should be consecutively numbered in parentheses, horizontally centered with equation number placed at the right.
13. References: The authors are advised to follow APA style of referencing. The list of all references should be alphabetically arranged.


COPYRIGHT FORM
Date: ……../………./20…..…..
(dd / mm / yyyy)
I / We ………………………………………………………………………………………………………………………………………………… [Author(s) Name],
the copy right owner of article entitled …………………………………………………………………………………………………………………………….
………………………………………………………………………………………………………………………………………………….......................................
.……………..………………………………………………………………………………………………………………………………….......... (Title of Research
Article) do hereby submit the above said article and authorize you to publish the above mentioned article in your
publication viz. Prastuti - Journal of Management & Research.
I / We further state that:
• This said article authored by me/us is an original contribution and has not been plagiarized from any
source/individual. Wherever required I/We have taken permission from the copyright holder and acknowledged the
source.
• It does not infringe on the right of others and does not contain any defamatory or illicit statements.
• The work has been submitted only to ‘Prastuti – Journal of Management & Research’ and it has neither been
submitted for publication nor published elsewhere in any print/electronic form.
• I/We assign all the copyright of this article to the journal. I/We have not assigned copyright to publish this article to
any other journal.
• I/We agree that the sole and exclusive right in the whole copyright of the said paper is transferred to Prastuti –
Journal of Management & Research. This copyright transfer covers the exclusive right to reproduce and distribute
the contribution and its reproductions in offline/online form. I ensure that such rights for the above said article has
not been assigned to any other person/institute/publication.
• I/We agree to indemnify the Editors/Publisher of the journal against all claims or action arising from any breach of
warranty on my/our behalf in this agreement.
• In case of a multi-authored article, I/corresponding author have obtained permission to enter into agreement and
assign copyright from all the co-authors, in writing and all the co-authors have thoroughly read and agreed with
above warranties and authorization.
Prastuti - Journal of Management & Research(ISSN: 2320-2262)
Published bi-annually byInstitute of Business Management, GLA University, Mathura

Corresponding Author’s Name : .............................................................................................
Affiliation (Name & Address of Institute) : .............................................................................................
Corresponding Address of Author : .............................................................................................
.............................................................................................
E-mail ID : .............................................................................................
Contact Number : .............................................................................................
Signature (with Date) : .............................................................................................
Kindly fill this form and send it along with the hard copy of research article to the following address:
Dr. Ankit Saxena
Executive Editor, Prastuti
Institute of Business Management,
GLA University,
17 Km Stone, NH-2, Mathura – Delhi Road,
P.O. - Chaumuhan, Mathura (Uttar Pradesh)
PIN - 281406
Or Submit scanned copy of filled form to [email protected].
For any clarification, Feel free to Call 91-9760545367 / 9927660076.

SUBSCRIPTION FORM
Name : .................................................................................................................................................................................
Affiliation : ..........................................................................................................................................................................
..............................................................................................................................................................................................
Address for Correspondence: .............................................................................................................................................
..............................................................................................................................................................................................
..............................................................................................................................................................................................
..............................................................................................................................................................................................
E-mail id : ............................................................................................................................................................................
Contact Number(s) : ............................................................................................................................................................
Subscription Category: Institutions Teachers Scholars & Alumni Students
Other Individuals Foreign Nationals
Duration of Subscription:
1 Year 3 Years
Details of DD:
Name of Issuing Bank : ....................................................................................................
Issuing Bank Branch : ....................................................................................................
DD Number : ....................................................................................................
Amount : ....................................................................................................
Prastuti - Journal of Management & Research(ISSN: 2320-2262)
Published bi-annually byInstitute of Business Management, GLA University, Mathura


NOTE

NOTE


I'M A
dvt
g.9
31
24
31
40
9