volatility report 2014 - info.unit4.com · the annual crist|kolder volatility report of...
TRANSCRIPT

CRIST|KOLDER ASSOCIATES
Volatility Report 2014
CRIST|KOLDER Volatility Report
Table of Contents
2
Page 3 Report Methodology
Page 6 Report Highlights
Page 7 Executive Turnover
Page 15 C-Suite Career Paths
Page 24 Diversity Landscape
Page 33 Education Background
The annual Crist|Kolder Volatility Report of America’s Leading Companiesexamines the backgrounds and measures the turnover of C-Suite executivesin a portfolio of 669 of America’s leading companies from the Fortune 500and the S&P 500 Indexes.
Crist|Kolder Associates examine each of the portfolio companiesindividually, noting personnel and organizational changes in the CEO, CFO,and COO roles. Each executive’s background is explored, including the pathtaken to get to their current role: industry background, functional experience,and education. This includes demographic information such as age, gender,and race.
This is the eleventh year of the Crist|Kolder Volatility Report, thoughinformation for the report goes back to 1995. Data gathered for the Summer2014 release of the Crist|Kolder Volatility Report is through August 1, 2014and includes projections, based on current and historical trends, through theend of the year. The Winter release of the 2014 Crist|Kolder Volatility Reportavailable in January, will have full data through December 31, 2014.
Methodology
3

Methodology Notes
4
Technology 12%
Services 11%
Retail 10%
Industrial 18%
Healthcare 10%
Financial 15%
Energy 13%
Consumer 11%
Company Industry Breakdown
•2014 Fortune 500 and S&P 500 Companies (669 Total) -Companies Removed: 40-Companies Added: 41-Public Companies: 641-Private Companies: 28
•Data tracked January 1, 1995 through August 1, 2014
•Industries broken down by Fortune's classificationsystem and then grouped into designated largercategories based on SIC codes and judgment of
Crist|Kolder Associates.
Resources:•Board Analyst: www.boardanalyst.com•BusinessWeek: www.businessweek.com•Capital IQ: www.capitaliq.com•Factiva: www.factiva.com•Fortune: www.fortune.com•GMI Analyst: www.gmianalyst.com•Hoover’s Online: www.hoovers.com•Notable Names Database: www.nndb.com•Phone Conversations with Company Executives•SEC Filings: www.sec.gov/edgov.shtml•Yahoo Finance: www.finance.yahoo.com
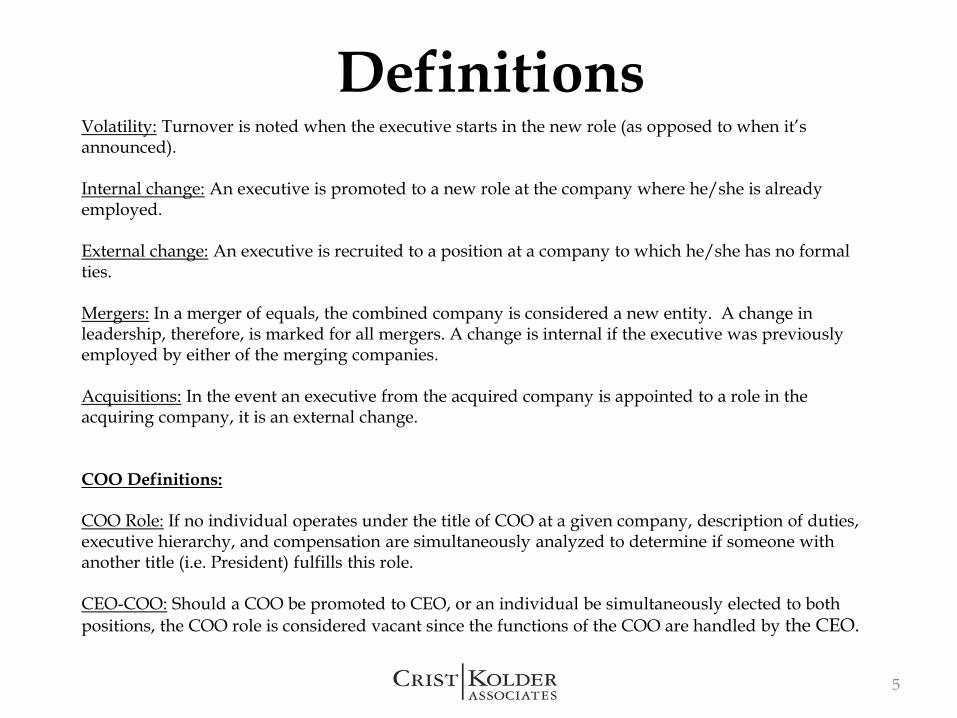
Volatility: Turnover is noted when the executive starts in the new role (as opposed to when it’s announced).
Internal change: An executive is promoted to a new role at the company where he/she is already employed.
External change: An executive is recruited to a position at a company to which he/she has no formal ties.
Mergers: In a merger of equals, the combined company is considered a new entity. A change in leadership, therefore, is marked for all mergers. A change is internal if the executive was previously employed by either of the merging companies.
Acquisitions: In the event an executive from the acquired company is appointed to a role in the acquiring company, it is an external change.
COO Definitions:
COO Role: If no individual operates under the title of COO at a given company, description of duties, executive hierarchy, and compensation are simultaneously analyzed to determine if someone with another title (i.e. President) fulfills this role.
CEO-COO: Should a COO be promoted to CEO, or an individual be simultaneously elected to both
positions, the COO role is considered vacant since the functions of the COO are handled by the CEO.
Definitions
5

Report Highlights
6
The following are some of the highlights from this year’s report:
• The number of female CEOs has nearly tripled in the last 10 years. (Page 29)
• The percent of female CEOs and CFOs continues to rise and is at an all time high. (Page 43)
• Over the past 10 years, the number of racially diverse CEOs has increased by over 100%. (Page 25)
• COO turnover is projected to rise, while CEO and CFO turnover are projected to drop. (Page 8)
• As the economy improves, CEO and CFO turnover trends are now moving in opposite direction of the
S&P 500 Index. (Page 11)
• The elimination of the COO position has stabilized; 36% of companies in both 2013 and 2014 have COOs.
(Page 14)
• International Universities have the highest number of CEOs by undergraduate degrees, while the Big
Ten Conference leads the number of CFOs. (Pages 32 and 33)
Executive Turnover
7
1995 1996 1997 1998 1999 2000 2001 2002 2003 2004 2005 2006 2007 2008 2009 2010 2011 2012 2013 2014*
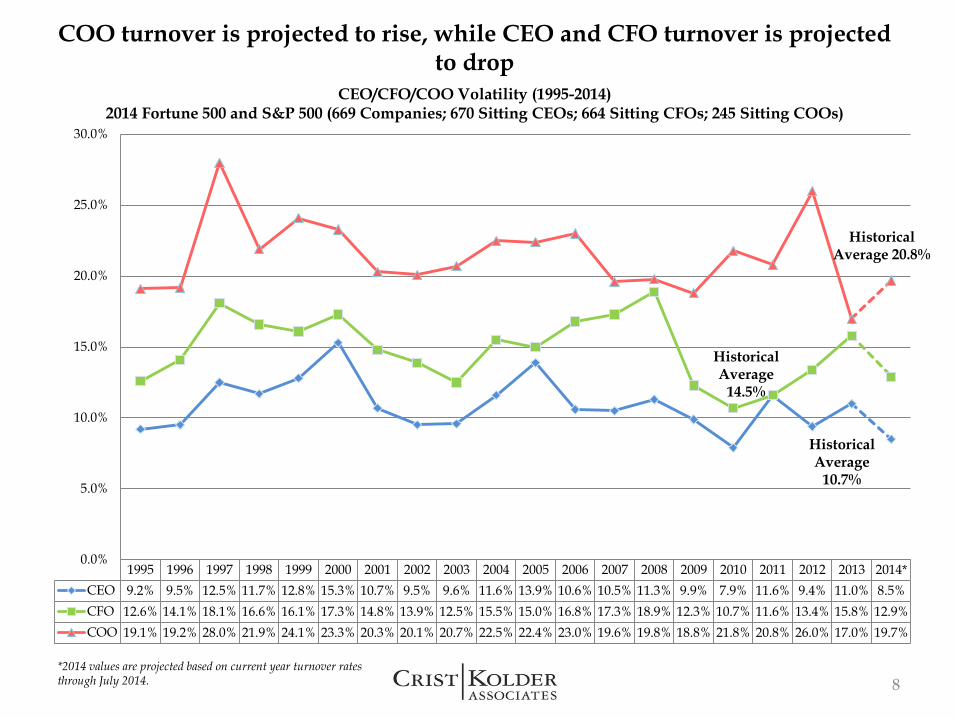
CEO 9.2% 9.5% 12.5% 11.7% 12.8% 15.3% 10.7% 9.5% 9.6% 11.6% 13.9% 10.6% 10.5% 11.3% 9.9% 7.9% 11.6% 9.4% 11.0% 8.5%
CFO 12.6% 14.1% 18.1% 16.6% 16.1% 17.3% 14.8% 13.9% 12.5% 15.5% 15.0% 16.8% 17.3% 18.9% 12.3% 10.7% 11.6% 13.4% 15.8% 12.9%
COO 19.1% 19.2% 28.0% 21.9% 24.1% 23.3% 20.3% 20.1% 20.7% 22.5% 22.4% 23.0% 19.6% 19.8% 18.8% 21.8% 20.8% 26.0% 17.0% 19.7%
0.0%
5.0%
10.0%
15.0%
20.0%
25.0%
30.0%
COO turnover is projected to rise, while CEO and CFO turnover is projected to drop
8
CEO/CFO/COO Volatility (1995-2014) 2014 Fortune 500 and S&P 500 (669 Companies; 670 Sitting CEOs; 664 Sitting CFOs; 245 Sitting COOs)
Historical Average
10.7%
Historical Average
14.5%
Historical Average 20.8%
*2014 values are projected based on current year turnover rates through July 2014.
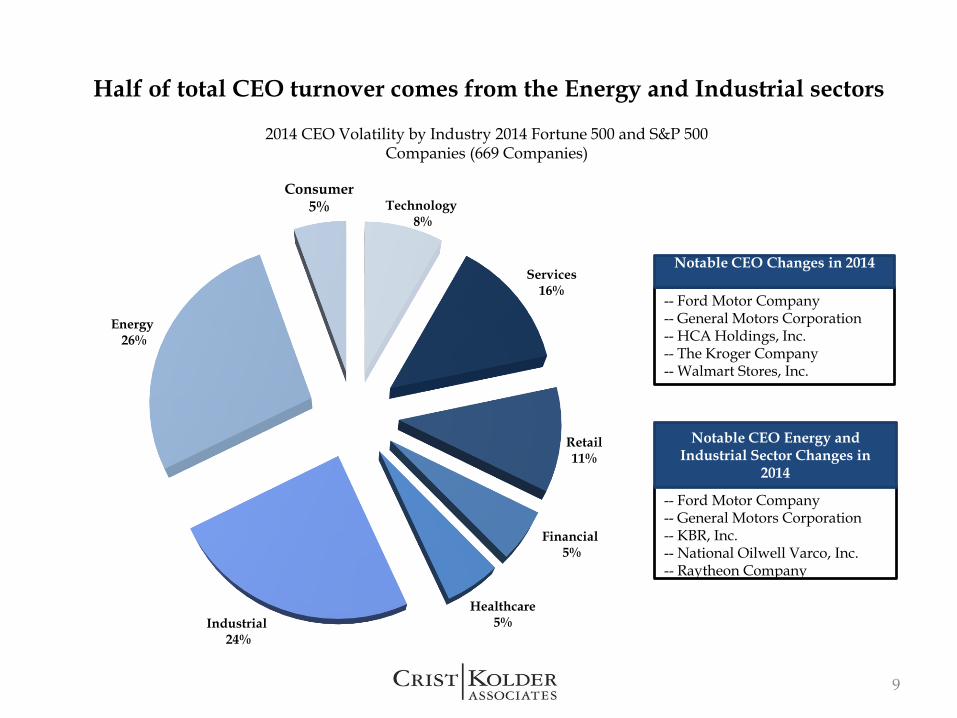
-- Ford Motor Company-- General Motors Corporation-- KBR, Inc.-- National Oilwell Varco, Inc. -- Raytheon Company
Notable CEO Energy and Industrial Sector Changes in
2014
-- Ford Motor Company-- General Motors Corporation-- HCA Holdings, Inc.-- The Kroger Company-- Walmart Stores, Inc.
Notable CEO Changes in 2014
Half of total CEO turnover comes from the Energy and Industrial sectors
9
Technology8%
Services 16%
Retail 11%
Industrial24%
Healthcare 5%
Financial5%
Energy26%
Consumer 5%
2014 CEO Volatility by Industry 2014 Fortune 500 and S&P 500 Companies (669 Companies)
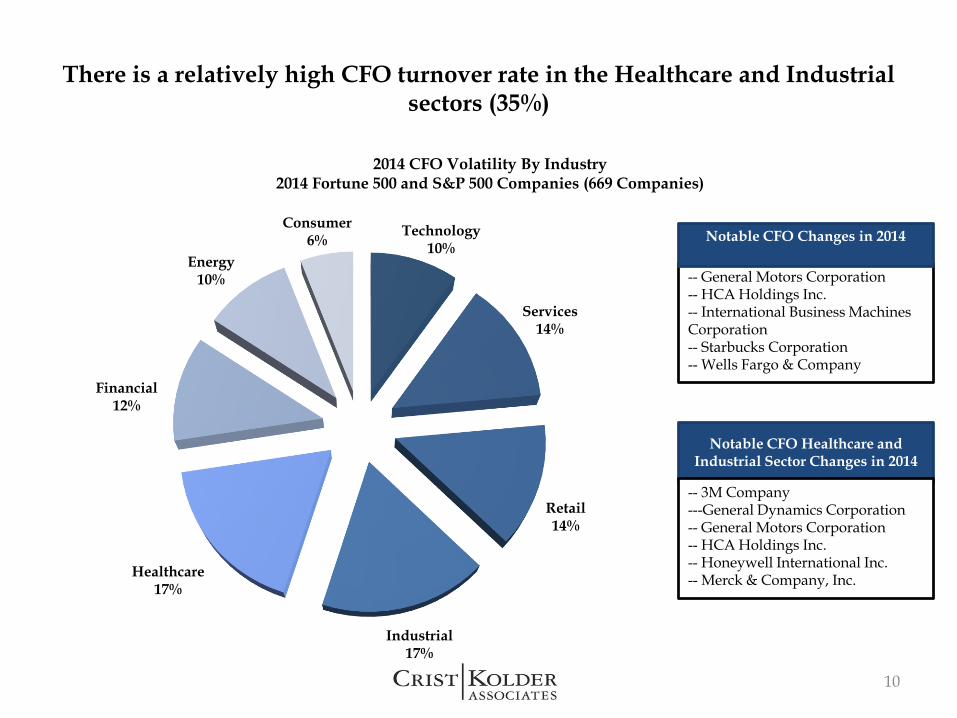
Technology10%
Services14%
Retail14%
Industrial17%
Healthcare17%
Financial12%
Energy10%
Consumer6%
2014 CFO Volatility By Industry2014 Fortune 500 and S&P 500 Companies (669 Companies)
-- General Motors Corporation-- HCA Holdings Inc.-- International Business Machines Corporation-- Starbucks Corporation-- Wells Fargo & Company
Notable CFO Changes in 2014
Notable CFO Healthcare and Industrial Sector Changes in 2014
-- 3M Company---General Dynamics Corporation-- General Motors Corporation-- HCA Holdings Inc.-- Honeywell International Inc.-- Merck & Company, Inc.
There is a relatively high CFO turnover rate in the Healthcare and Industrial sectors (35%)
10

In 2014, as the S&P 500 Index advanced, the percentage of CEO and CFO turnover decreased
11
Overall Volatility and S&P 500 Index* (1995 - 2014)2014 Fortune 500 and S&P 500 (669 Companies)
*Average Daily Close** Projected value for end of 2014
1995 1996 1997 1998 1999 2000 2001 2002 2003 2004 2005 2006 2007 2008 2009 2010 2011 2012 2013 2014**
S&P 500 Index 551.62 679.47 883.75 1098.23 1333.84 1423.95 1191.19 990.98 966.02 1130.25 1206.75 1307.23 1475.5 1241.22 937.92 1132.95 1268.21 1379.36 1580.03 1980.52
CEO/CFO Turnover 11.4% 12.5% 16.3% 15.8% 15.3% 17.5% 13.9% 12.6% 11.2% 14.9% 16.1% 14.2% 15.2% 15.9% 12.4% 9.8% 12.2% 11.9% 13.2% 10.7%
0
200
400
600
800
1000
1200
1400
1600
1800
2000
0.0%
2.0%
4.0%
6.0%
8.0%
10.0%
12.0%
14.0%
16.0%
18.0%
20.0%
22.0%
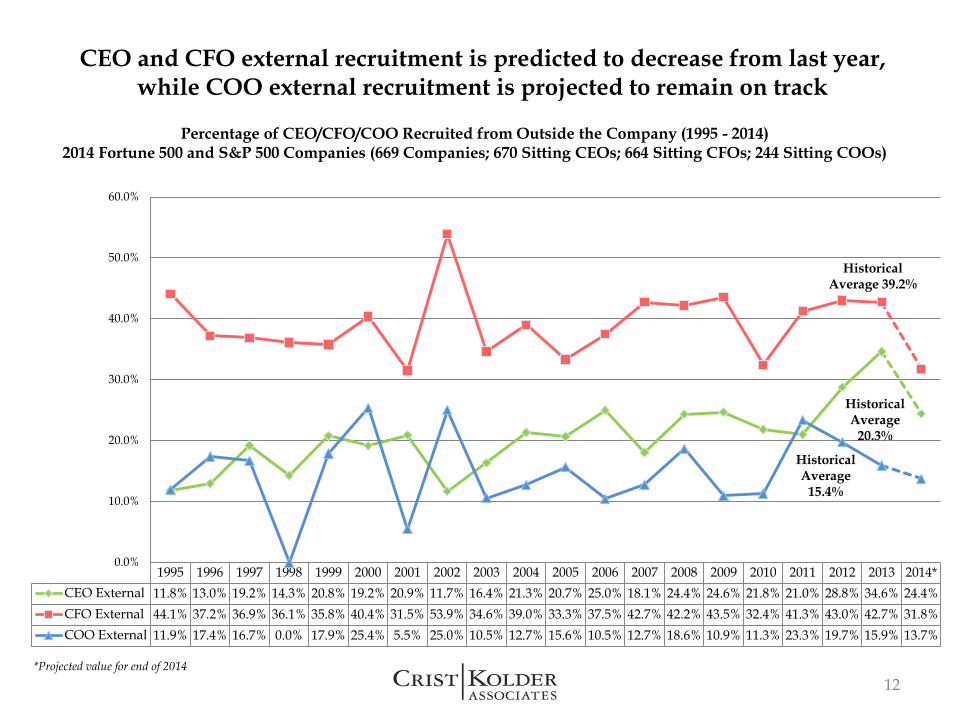
CEO and CFO external recruitment is predicted to decrease from last year, while COO external recruitment is projected to remain on track
12
Percentage of CEO/CFO/COO Recruited from Outside the Company (1995 - 2014)2014 Fortune 500 and S&P 500 Companies (669 Companies; 670 Sitting CEOs; 664 Sitting CFOs; 244 Sitting COOs)
*Projected value for end of 2014
1995 1996 1997 1998 1999 2000 2001 2002 2003 2004 2005 2006 2007 2008 2009 2010 2011 2012 2013 2014*
CEO External 11.8% 13.0% 19.2% 14.3% 20.8% 19.2% 20.9% 11.7% 16.4% 21.3% 20.7% 25.0% 18.1% 24.4% 24.6% 21.8% 21.0% 28.8% 34.6% 24.4%
CFO External 44.1% 37.2% 36.9% 36.1% 35.8% 40.4% 31.5% 53.9% 34.6% 39.0% 33.3% 37.5% 42.7% 42.2% 43.5% 32.4% 41.3% 43.0% 42.7% 31.8%
COO External 11.9% 17.4% 16.7% 0.0% 17.9% 25.4% 5.5% 25.0% 10.5% 12.7% 15.6% 10.5% 12.7% 18.6% 10.9% 11.3% 23.3% 19.7% 15.9% 13.7%
0.0%
10.0%
20.0%
30.0%
40.0%
50.0%
60.0%
Historical Average
20.3%
Historical Average 39.2%
Historical Average
15.4%
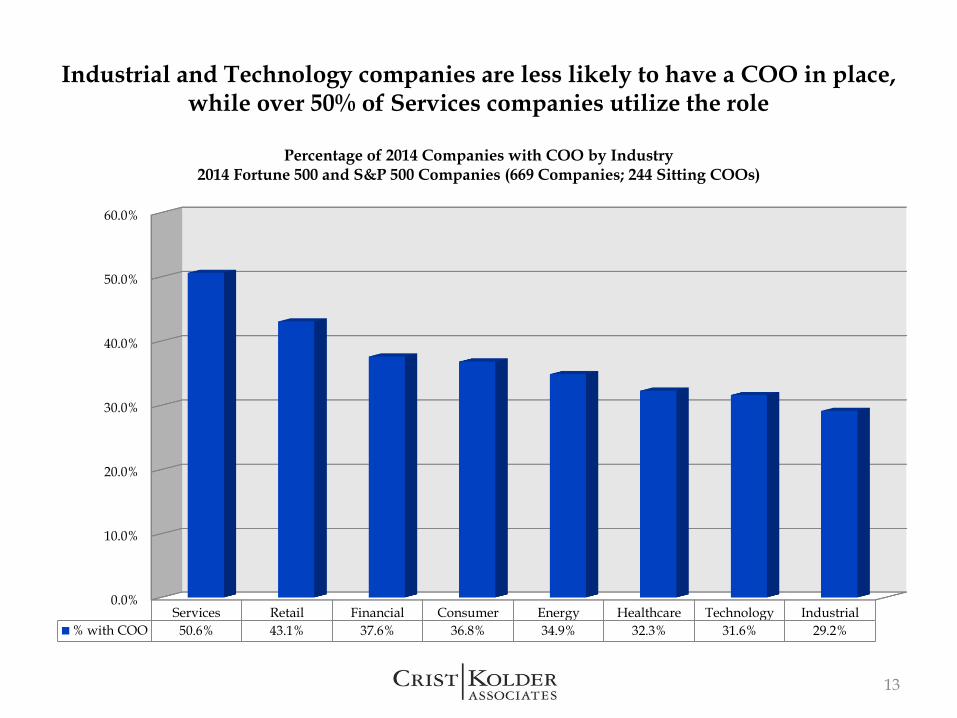
Industrial and Technology companies are less likely to have a COO in place, while over 50% of Services companies utilize the role
13
0.0%
10.0%
20.0%
30.0%
40.0%
50.0%
60.0%
Services Retail Financial Consumer Energy Healthcare Technology Industrial
% with COO 50.6% 43.1% 37.6% 36.8% 34.9% 32.3% 31.6% 29.2%
Percentage of 2014 Companies with COO by Industry2014 Fortune 500 and S&P 500 Companies (669 Companies; 244 Sitting COOs)
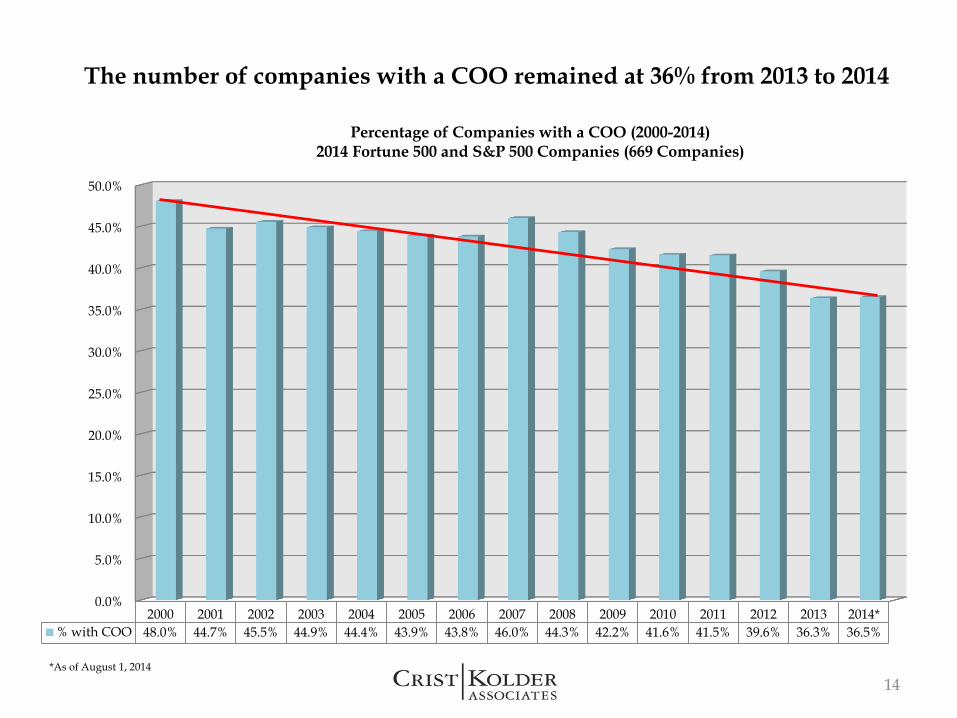
The number of companies with a COO remained at 36% from 2013 to 2014
14
0.0%
5.0%
10.0%
15.0%
20.0%
25.0%
30.0%
35.0%
40.0%
45.0%
50.0%
2000 2001 2002 2003 2004 2005 2006 2007 2008 2009 2010 2011 2012 2013 2014*
% with COO 48.0% 44.7% 45.5% 44.9% 44.4% 43.9% 43.8% 46.0% 44.3% 42.2% 41.6% 41.5% 39.6% 36.3% 36.5%
Percentage of Companies with a COO (2000-2014)2014 Fortune 500 and S&P 500 Companies (669 Companies)
*As of August 1, 2014
C-Suite Career Paths
15

Over 40% of all current CEOs come directly from the COO chair
16
Percentage of 2014 Sitting CEOs by Immediate Previous Position2014 Fortune 500 and S&P 500 (669 Companies; 670 Sitting CEOs)
•Operating Executive: President, Group President, VP/SVP/EVP Operations•CEO: Internally recruited CEOs a result of mergers•Other: i.e. Government Role, Private Equity, Management Consulting, Chairman
0.0%
5.0%
10.0%
15.0%
20.0%
25.0%
30.0%
35.0%
40.0%
45.0%
COO DivisionalPresident
OperatingExecutive
CEO CFO Founder Other Interim
% From Position 43.3% 19.6% 10.8% 10.7% 6.2% 5.5% 3.3% 0.6%

Internally promoted CEOs tend to come from the COO chair, while externally hired CEOs are usually recruited from another CEO role
17
2014 Sitting CEO Immediate Previous Role, Internal vs. External2014 Fortune 500 and S&P 500 (669 Companies; 670 Sitting CEOs)
•CEO: Internally recruited CEOs a result of mergers•Operating Executive: President, Group President, VP/SVP/EVP Operations•Other: Tax, Law, IT, etc.
0.0%
10.0%
20.0%
30.0%
40.0%
50.0%
60.0%
COO CEO DivisionalPresident
OperatingExecutive
Founder CFO Other
Internal 51.2% 3.8% 18.9% 9.6% 6.9% 6.7% 2.9%
External 16.4% 35.6% 22.6% 15.8% 0.0% 4.8% 4.8%
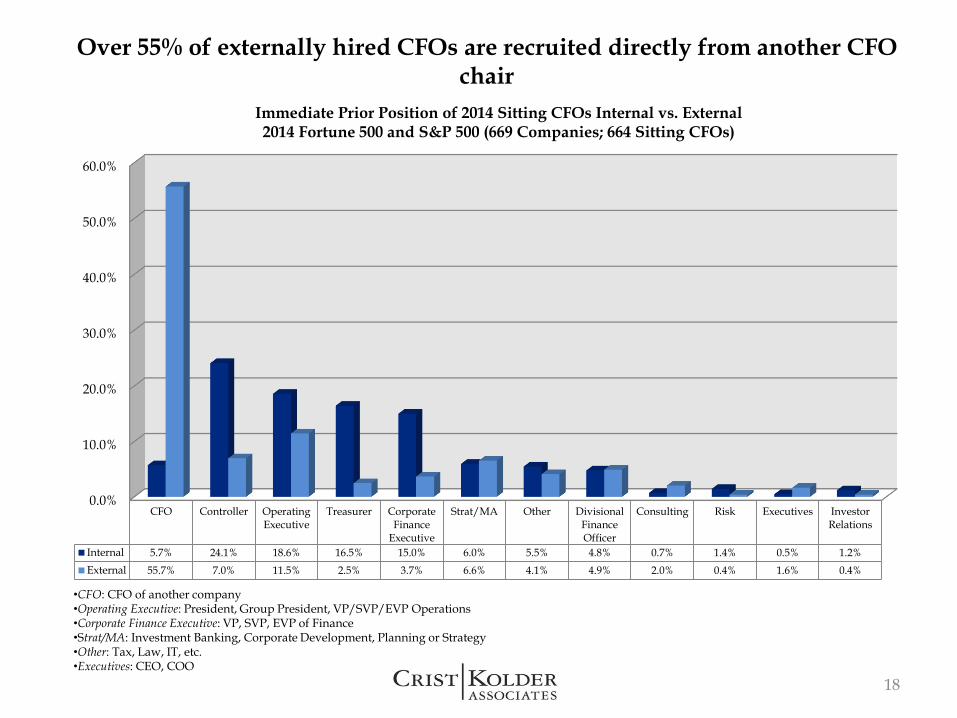
Over 55% of externally hired CFOs are recruited directly from another CFO chair
18
•CFO: CFO of another company•Operating Executive: President, Group President, VP/SVP/EVP Operations•Corporate Finance Executive: VP, SVP, EVP of Finance•Strat/MA: Investment Banking, Corporate Development, Planning or Strategy•Other: Tax, Law, IT, etc.•Executives: CEO, COO
Immediate Prior Position of 2014 Sitting CFOs Internal vs. External2014 Fortune 500 and S&P 500 (669 Companies; 664 Sitting CFOs)
0.0%
10.0%
20.0%
30.0%
40.0%
50.0%
60.0%
CFO Controller OperatingExecutive
Treasurer CorporateFinance
Executive
Strat/MA Other DivisionalFinanceOfficer
Consulting Risk Executives InvestorRelations
Internal 5.7% 24.1% 18.6% 16.5% 15.0% 6.0% 5.5% 4.8% 0.7% 1.4% 0.5% 1.2%
External 55.7% 7.0% 11.5% 2.5% 3.7% 6.6% 4.1% 4.9% 2.0% 0.4% 1.6% 0.4%

Over 40% of all sitting CFOs came directly from a CFO or Controller chair
19
Percentage of 2014 Sitting CFOs by Immediate Previous Position2014 Fortune 500 and S&P 500 (669 Companies; 664 Sitting CFOs)
•CFO: CFO of another company•Operating Executive: President, Group President, VP/SVP/EVP Operations•Corporate Finance Executive: VP, SVP, EVP of Finance•Strat/MA: Investment Banking, Corporate Development, Planning or Strategy•Other: Tax, Law, IT, etc.•Executives: CEO, COO
0.0%
5.0%
10.0%
15.0%
20.0%
25.0%
CFO Controller OperatingExecutive
Treasurer CorporateFinance
Executive
Strat/MA Other DivisionalFinanceOfficer
Consulting Risk Executives InvestorRelations
% From Position 24.1% 17.8% 16.3% 11.3% 11.0% 6.2% 4.5% 4.7% 1.2% 1.1% 0.9% 0.9%
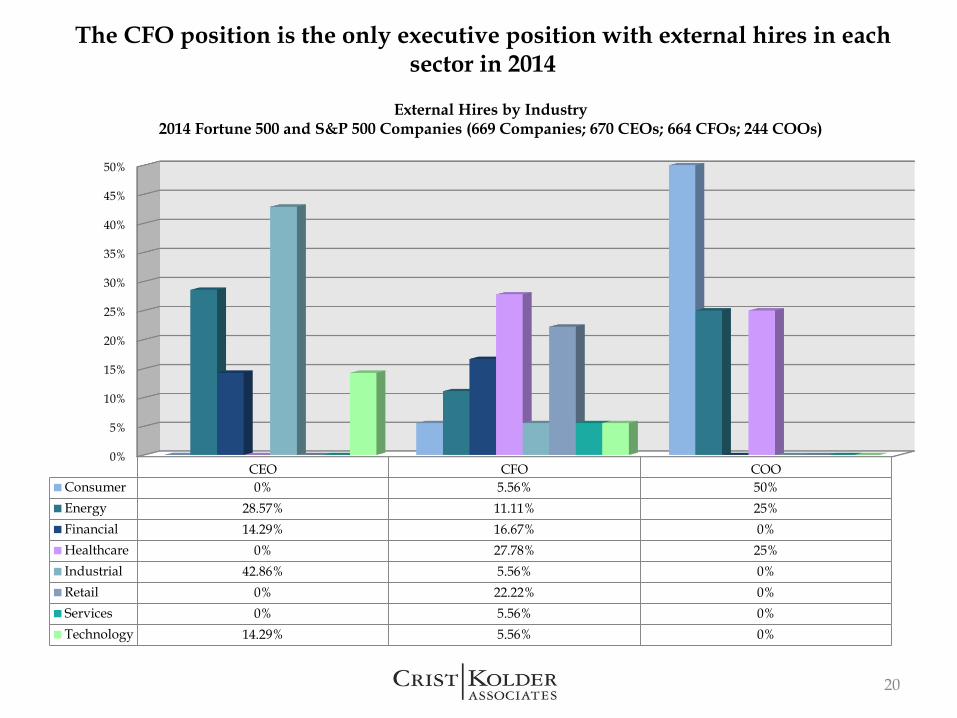
The CFO position is the only executive position with external hires in each sector in 2014
20
0%
5%
10%
15%
20%
25%
30%
35%
40%
45%
50%
CEO CFO COO
Consumer 0% 5.56% 50%
Energy 28.57% 11.11% 25%
Financial 14.29% 16.67% 0%
Healthcare 0% 27.78% 25%
Industrial 42.86% 5.56% 0%
Retail 0% 22.22% 0%
Services 0% 5.56% 0%
Technology 14.29% 5.56% 0%
External Hires by Industry2014 Fortune 500 and S&P 500 Companies (669 Companies; 670 CEOs; 664 CFOs; 244 COOs)
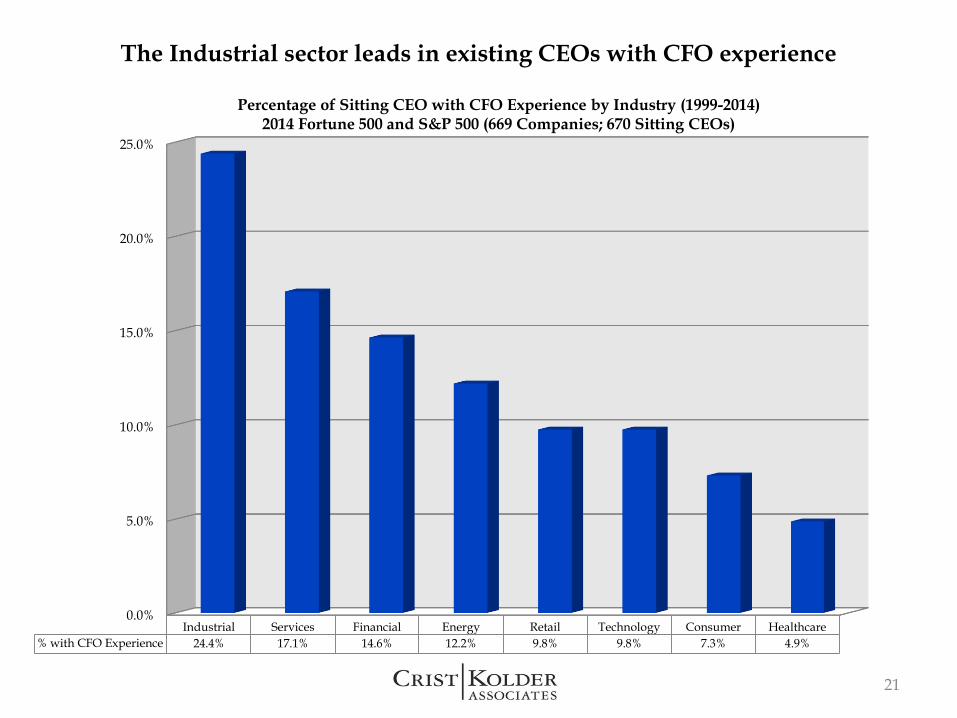
The Industrial sector leads in existing CEOs with CFO experience
21
Percentage of Sitting CEO with CFO Experience by Industry (1999-2014)2014 Fortune 500 and S&P 500 (669 Companies; 670 Sitting CEOs)
0.0%
5.0%
10.0%
15.0%
20.0%
25.0%
Industrial Services Financial Energy Retail Technology Consumer Healthcare
% with CFO Experience 24.4% 17.1% 14.6% 12.2% 9.8% 9.8% 7.3% 4.9%
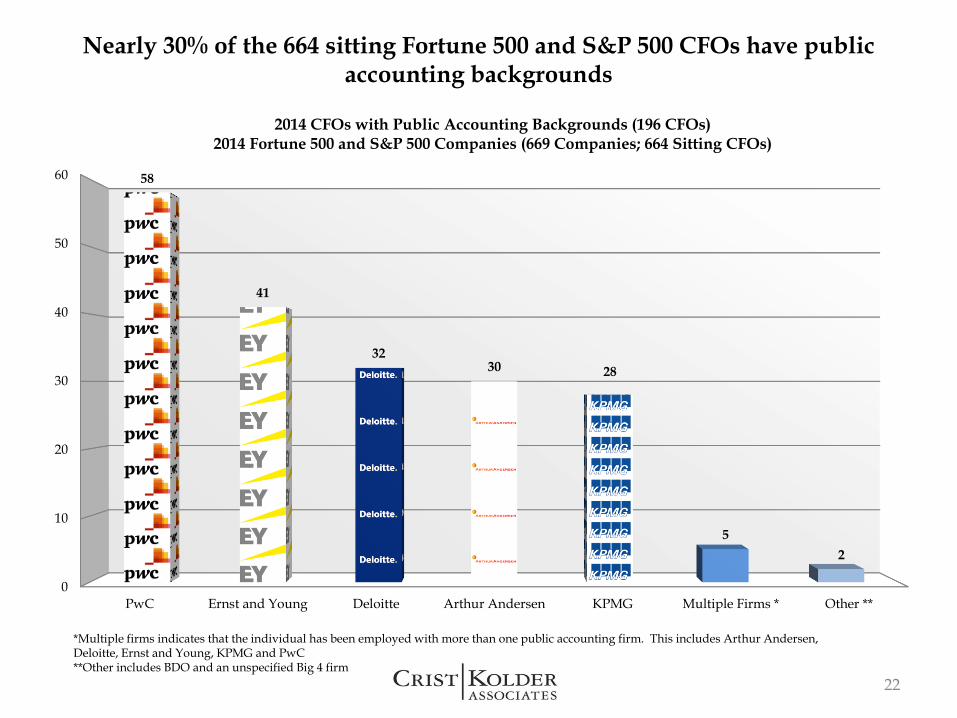
Nearly 30% of the 664 sitting Fortune 500 and S&P 500 CFOs have public accounting backgrounds
22
*Multiple firms indicates that the individual has been employed with more than one public accounting firm. This includes Arthur Andersen, Deloitte, Ernst and Young, KPMG and PwC**Other includes BDO and an unspecified Big 4 firm
0
10
20
30
40
50
60
PwC Ernst and Young Deloitte Arthur Andersen KPMG Multiple Firms * Other **
58
41
3230 28
5
2
2014 CFOs with Public Accounting Backgrounds (196 CFOs)2014 Fortune 500 and S&P 500 Companies (669 Companies; 664 Sitting CFOs)
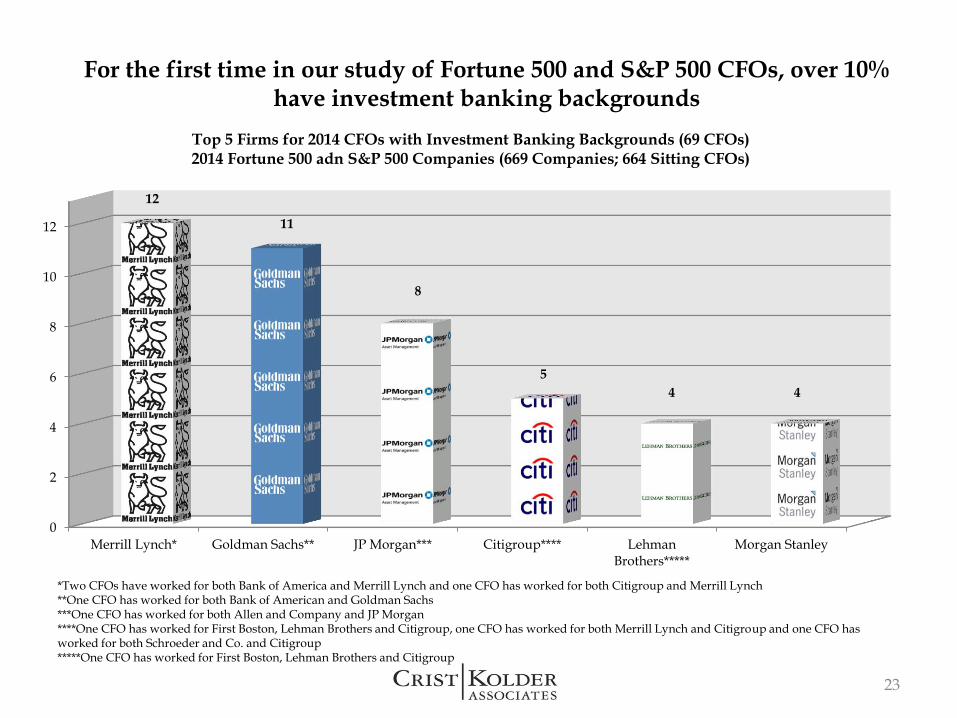
For the first time in our study of Fortune 500 and S&P 500 CFOs, over 10% have investment banking backgrounds
23
*Two CFOs have worked for both Bank of America and Merrill Lynch and one CFO has worked for both Citigroup and Merrill Lynch**One CFO has worked for both Bank of American and Goldman Sachs***One CFO has worked for both Allen and Company and JP Morgan****One CFO has worked for First Boston, Lehman Brothers and Citigroup, one CFO has worked for both Merrill Lynch and Citigroup and one CFO has worked for both Schroeder and Co. and Citigroup*****One CFO has worked for First Boston, Lehman Brothers and Citigroup
0
2
4
6
8
10
12
Merrill Lynch* Goldman Sachs** JP Morgan*** Citigroup**** LehmanBrothers*****
Morgan Stanley
12
11
8
5
4 4
Top 5 Firms for 2014 CFOs with Investment Banking Backgrounds (69 CFOs)2014 Fortune 500 adn S&P 500 Companies (669 Companies; 664 Sitting CFOs)

Diversity Landscape
24
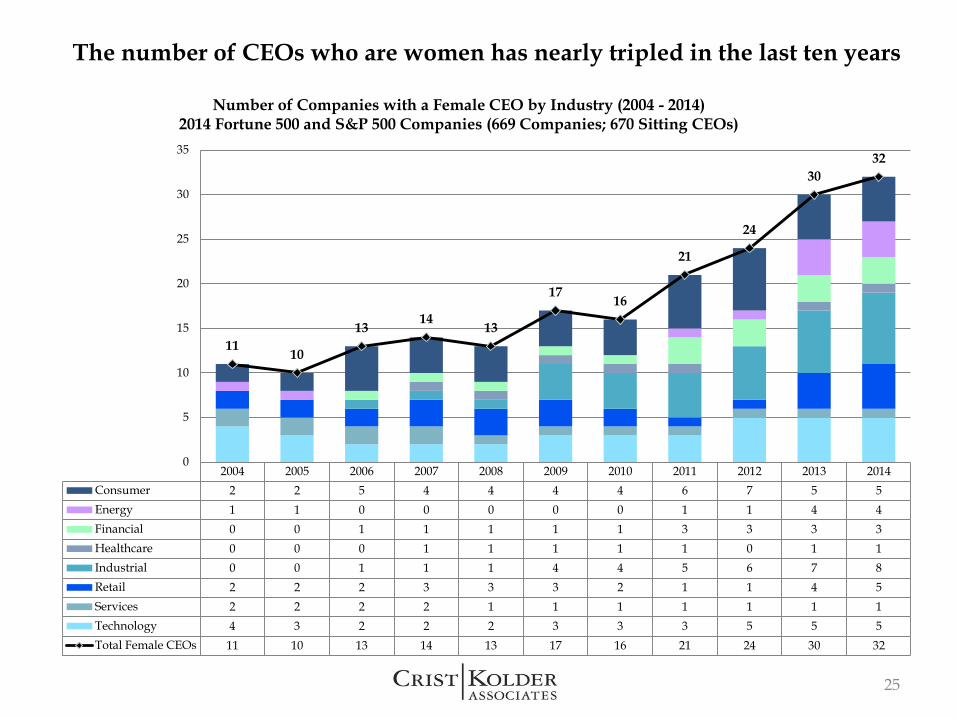
The number of CEOs who are women has nearly tripled in the last ten years
Number of Companies with a Female CEO by Industry (2004 - 2014)2014 Fortune 500 and S&P 500 Companies (669 Companies; 670 Sitting CEOs)
25
2004 2005 2006 2007 2008 2009 2010 2011 2012 2013 2014
Consumer 2 2 5 4 4 4 4 6 7 5 5
Energy 1 1 0 0 0 0 0 1 1 4 4
Financial 0 0 1 1 1 1 1 3 3 3 3
Healthcare 0 0 0 1 1 1 1 1 0 1 1
Industrial 0 0 1 1 1 4 4 5 6 7 8
Retail 2 2 2 3 3 3 2 1 1 4 5
Services 2 2 2 2 1 1 1 1 1 1 1
Technology 4 3 2 2 2 3 3 3 5 5 5
Total Female CEOs 11 10 13 14 13 17 16 21 24 30 32
1110
1314
13
1716
21
24
30
32
0
5
10
15
20
25
30
35
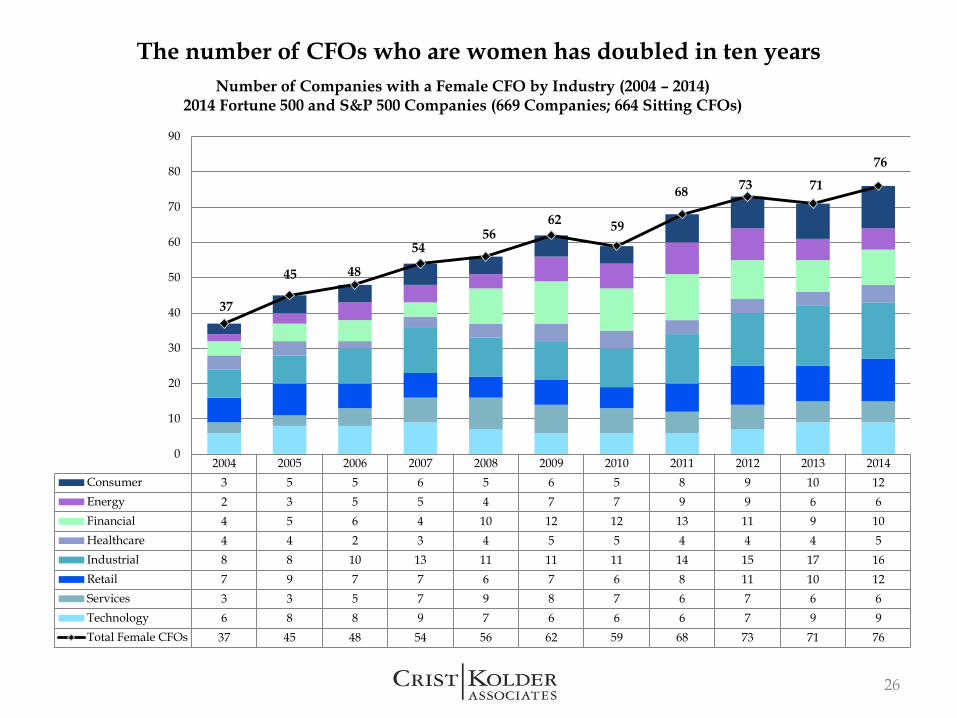
The number of CFOs who are women has doubled in ten years
Number of Companies with a Female CFO by Industry (2004 – 2014)2014 Fortune 500 and S&P 500 Companies (669 Companies; 664 Sitting CFOs)
26
2004 2005 2006 2007 2008 2009 2010 2011 2012 2013 2014
Consumer 3 5 5 6 5 6 5 8 9 10 12
Energy 2 3 5 5 4 7 7 9 9 6 6
Financial 4 5 6 4 10 12 12 13 11 9 10
Healthcare 4 4 2 3 4 5 5 4 4 4 5
Industrial 8 8 10 13 11 11 11 14 15 17 16
Retail 7 9 7 7 6 7 6 8 11 10 12
Services 3 3 5 7 9 8 7 6 7 6 6
Technology 6 8 8 9 7 6 6 6 7 9 9
Total Female CFOs 37 45 48 54 56 62 59 68 73 71 76
37
45 48
5456
6259
6873 71
76
0
10
20
30
40
50
60
70
80
90
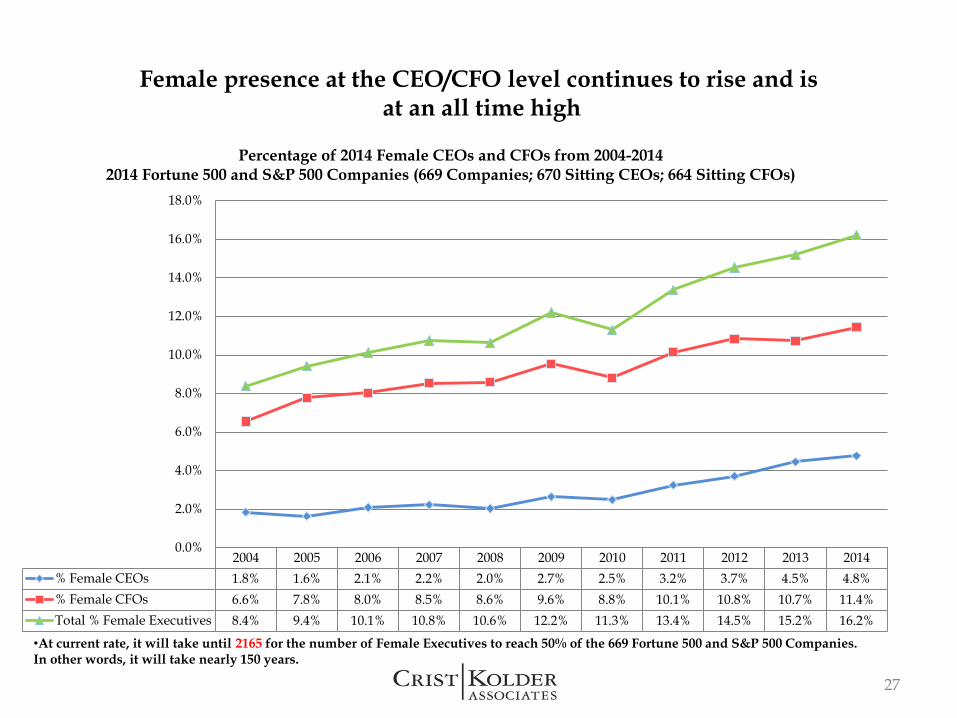
Female presence at the CEO/CFO level continues to rise and isat an all time high
27
2004 2005 2006 2007 2008 2009 2010 2011 2012 2013 2014
% Female CEOs 1.8% 1.6% 2.1% 2.2% 2.0% 2.7% 2.5% 3.2% 3.7% 4.5% 4.8%
% Female CFOs 6.6% 7.8% 8.0% 8.5% 8.6% 9.6% 8.8% 10.1% 10.8% 10.7% 11.4%
Total % Female Executives 8.4% 9.4% 10.1% 10.8% 10.6% 12.2% 11.3% 13.4% 14.5% 15.2% 16.2%
0.0%
2.0%
4.0%
6.0%
8.0%
10.0%
12.0%
14.0%
16.0%
18.0%
Percentage of 2014 Female CEOs and CFOs from 2004-20142014 Fortune 500 and S&P 500 Companies (669 Companies; 670 Sitting CEOs; 664 Sitting CFOs)
•At current rate, it will take until 2165 for the number of Female Executives to reach 50% of the 669 Fortune 500 and S&P 500 Companies. In other words, it will take nearly 150 years.

On average, Female CEOs, CFOs and COOs are more likely to hold an MBA than their male counterparts
28
0.0%
10.0%
20.0%
30.0%
40.0%
50.0%
60.0%
CEOs CFOs COOs
Female 43.8% 55.3% 50.0%
Male 42.3% 50.7% 33.9%
Percentage of 2014 Female Executives versus Male Executives with MBAs2014 Fortune 500 and S&P 500 Companies (669 Companies; 32 Female CEOs; 78 Female CFOs; 14 Female COOs)
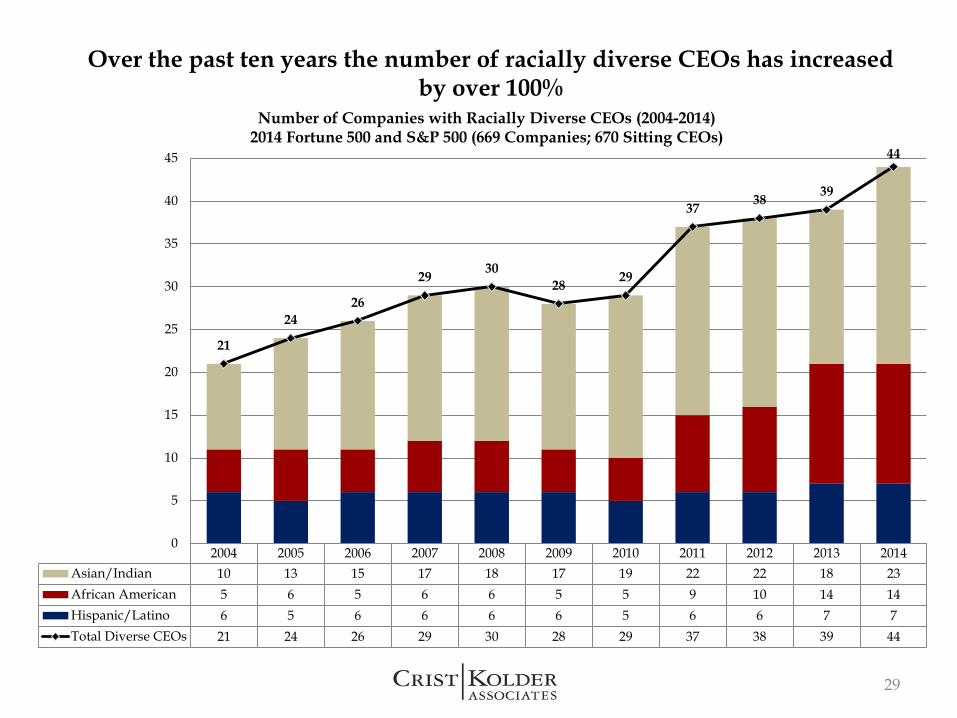
Over the past ten years the number of racially diverse CEOs has increased by over 100%
Number of Companies with Racially Diverse CEOs (2004-2014) 2014 Fortune 500 and S&P 500 (669 Companies; 670 Sitting CEOs)
29
2004 2005 2006 2007 2008 2009 2010 2011 2012 2013 2014
Asian/Indian 10 13 15 17 18 17 19 22 22 18 23
African American 5 6 5 6 6 5 5 9 10 14 14
Hispanic/Latino 6 5 6 6 6 6 5 6 6 7 7
Total Diverse CEOs 21 24 26 29 30 28 29 37 38 39 44
21
24
26
2930
2829
3738
39
44
0
5
10
15
20
25
30
35
40
45
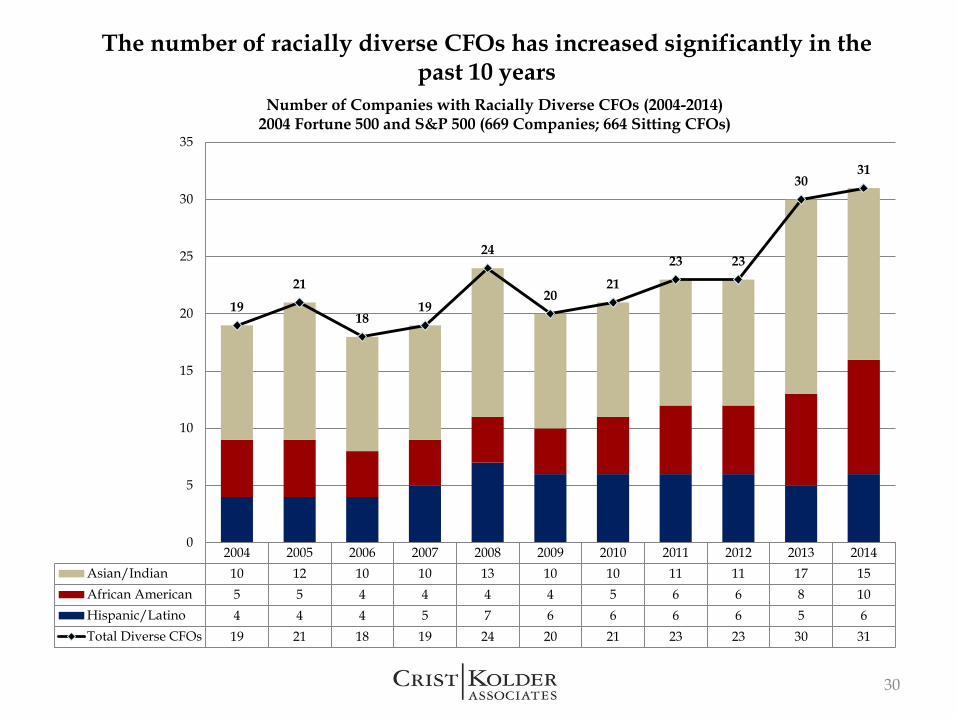
The number of racially diverse CFOs has increased significantly in the past 10 years
Number of Companies with Racially Diverse CFOs (2004-2014) 2004 Fortune 500 and S&P 500 (669 Companies; 664 Sitting CFOs)
30
2004 2005 2006 2007 2008 2009 2010 2011 2012 2013 2014
Asian/Indian 10 12 10 10 13 10 10 11 11 17 15
African American 5 5 4 4 4 4 5 6 6 8 10
Hispanic/Latino 4 4 4 5 7 6 6 6 6 5 6
Total Diverse CFOs 19 21 18 19 24 20 21 23 23 30 31
19
21
1819
24
2021
23 23
3031
0
5
10
15
20
25
30
35

The Technology sector has the greatest number of racially diverse CEOs
Number of Companies with Racially Diverse CEOs by Industry (2004 - 2014)2014 Fortune 500 and S&P 500 Companies (669 Companies; 670 Sitting CEOs)
31
2004 2005 2006 2007 2008 2009 2010 2011 2012 2013 2014
Consumer 5 5 4 4 4 4 4 5 4 4 4
Energy 1 1 1 1 1 1 1 0 0 0 1
Financial 3 2 2 4 6 4 6 6 6 6 6
Healthcare 3 3 4 3 3 3 2 5 6 7 8
Industrial 1 1 2 3 3 3 3 4 4 5 6
Retail 2 2 3 3 3 3 3 3 3 3 3
Services 0 1 1 1 1 1 1 3 4 4 5
Technology 6 7 8 10 9 9 9 11 11 10 11
Total Diverse CEOs 21 22 25 29 30 28 29 37 38 39 44
21 22
25
29 3028 29
37 38 39
44
0
5
10
15
20
25
30
35
40
45
50
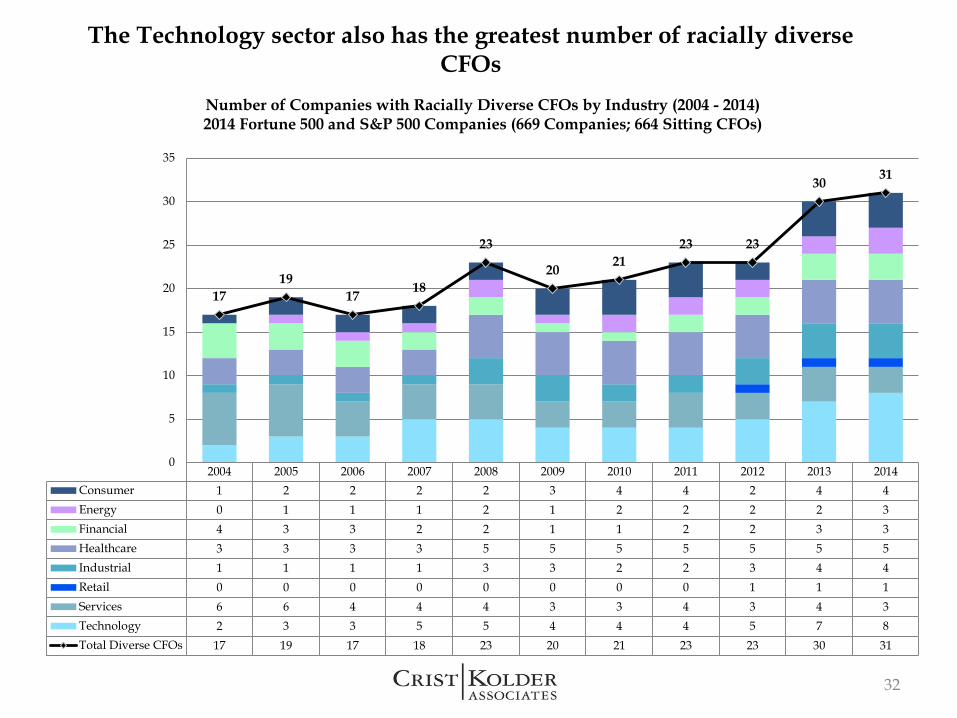
The Technology sector also has the greatest number of racially diverse CFOs
Number of Companies with Racially Diverse CFOs by Industry (2004 - 2014)2014 Fortune 500 and S&P 500 Companies (669 Companies; 664 Sitting CFOs)
32
2004 2005 2006 2007 2008 2009 2010 2011 2012 2013 2014
Consumer 1 2 2 2 2 3 4 4 2 4 4
Energy 0 1 1 1 2 1 2 2 2 2 3
Financial 4 3 3 2 2 1 1 2 2 3 3
Healthcare 3 3 3 3 5 5 5 5 5 5 5
Industrial 1 1 1 1 3 3 2 2 3 4 4
Retail 0 0 0 0 0 0 0 0 1 1 1
Services 6 6 4 4 4 3 3 4 3 4 3
Technology 2 3 3 5 5 4 4 4 5 7 8
Total Diverse CFOs 17 19 17 18 23 20 21 23 23 30 31
17
19
1718
23
2021
23 23
3031
0
5
10
15
20
25
30
35

Education Background
33
0
10
20
30
40
50
60
70
International Ivy League Big 10 Pacific 12 ACC SEC Big East Big 12 Mid-American
PatriotLeague
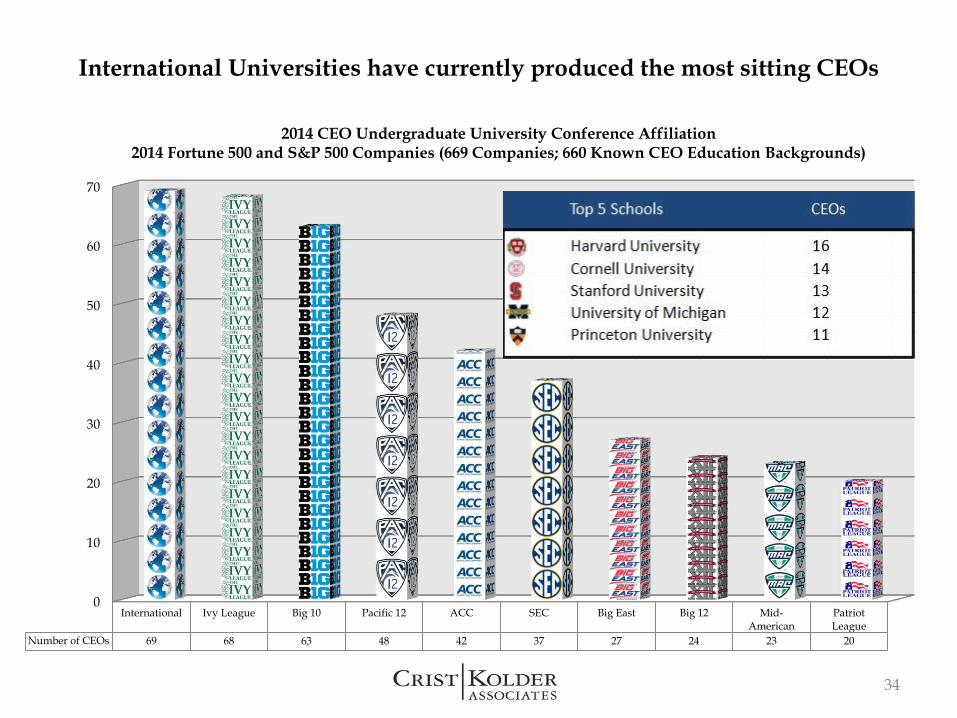
Number of CEOs 69 68 63 48 42 37 27 24 23 20
International Universities have currently produced the most sitting CEOs
34
2014 CEO Undergraduate University Conference Affiliation2014 Fortune 500 and S&P 500 Companies (669 Companies; 660 Known CEO Education Backgrounds)
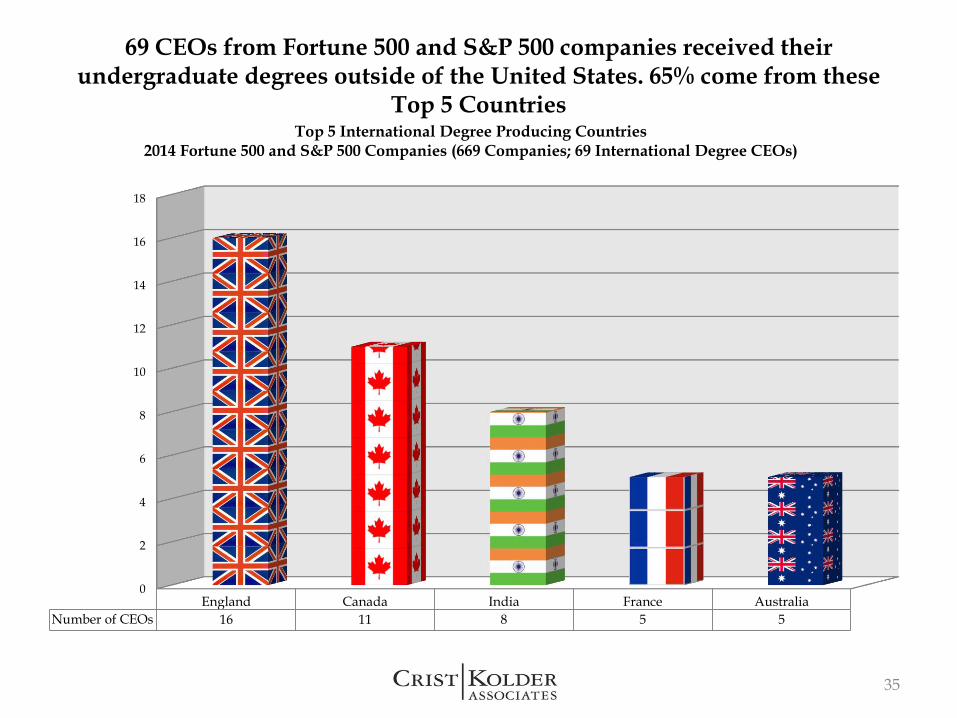
69 CEOs from Fortune 500 and S&P 500 companies received their undergraduate degrees outside of the United States. 65% come from these
Top 5 Countries
35
0
2
4
6
8
10
12
14
16
18
England Canada India France Australia
Number of CEOs 16 11 8 5 5
Top 5 International Degree Producing Countries2014 Fortune 500 and S&P 500 Companies (669 Companies; 69 International Degree CEOs)
0
10
20
30
40
50
60
70
80
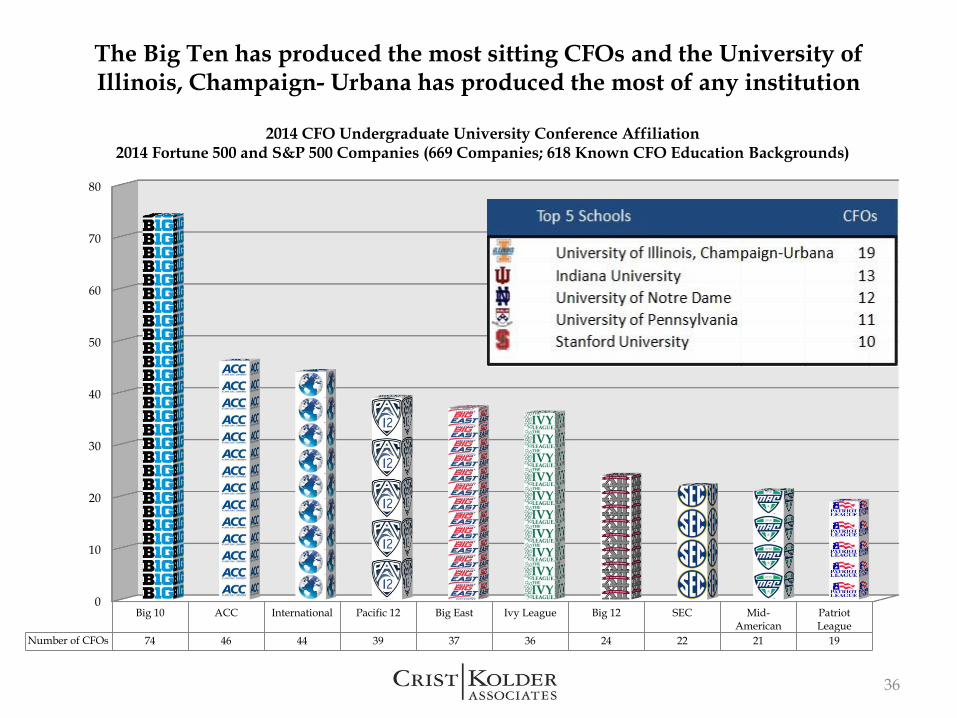
Big 10 ACC International Pacific 12 Big East Ivy League Big 12 SEC Mid-American
PatriotLeague
Number of CFOs 74 46 44 39 37 36 24 22 21 19
The Big Ten has produced the most sitting CFOs and the University of Illinois, Champaign- Urbana has produced the most of any institution
36
2014 CFO Undergraduate University Conference Affiliation2014 Fortune 500 and S&P 500 Companies (669 Companies; 618 Known CFO Education Backgrounds)
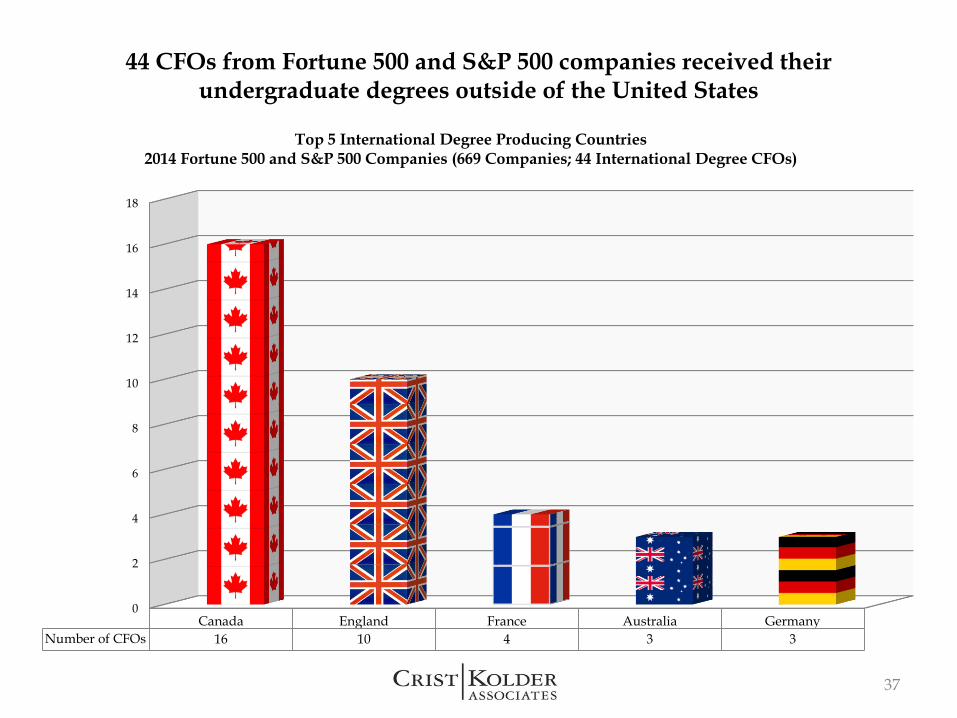
44 CFOs from Fortune 500 and S&P 500 companies received their undergraduate degrees outside of the United States
37
0
2
4
6
8
10
12
14
16
18
Canada England France Australia Germany
Number of CFOs 16 10 4 3 3
Top 5 International Degree Producing Countries2014 Fortune 500 and S&P 500 Companies (669 Companies; 44 International Degree CFOs)
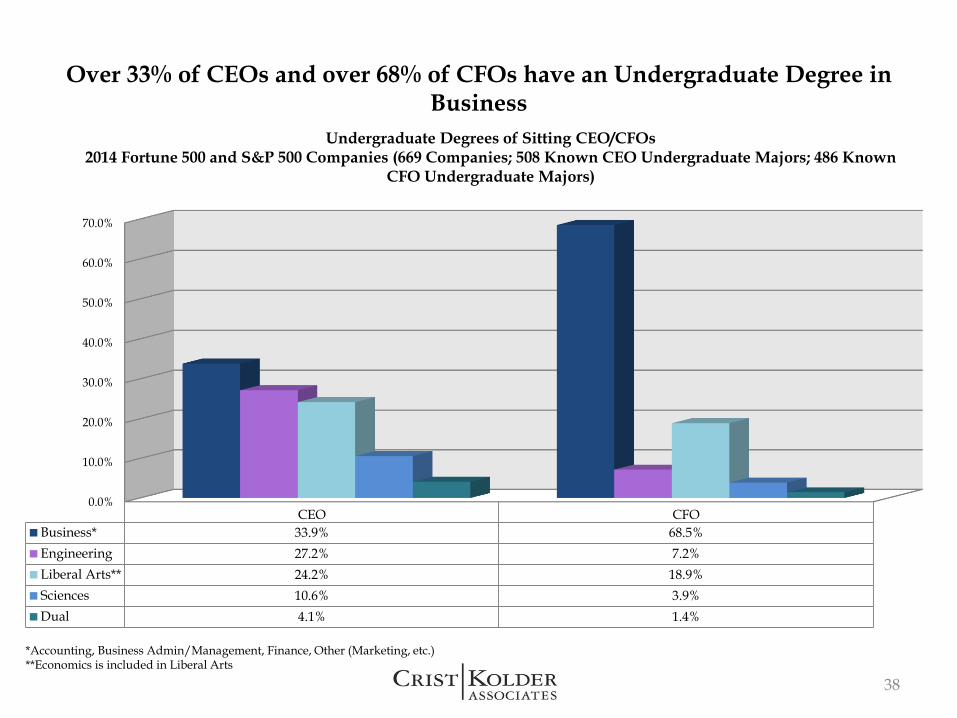
Over 33% of CEOs and over 68% of CFOs have an Undergraduate Degree in Business
38
*Accounting, Business Admin/Management, Finance, Other (Marketing, etc.)**Economics is included in Liberal Arts
Undergraduate Degrees of Sitting CEO/CFOs2014 Fortune 500 and S&P 500 Companies (669 Companies; 508 Known CEO Undergraduate Majors; 486 Known
CFO Undergraduate Majors)
0.0%
10.0%
20.0%
30.0%
40.0%
50.0%
60.0%
70.0%
CEO CFO
Business* 33.9% 68.5%
Engineering 27.2% 7.2%
Liberal Arts** 24.2% 18.9%
Sciences 10.6% 3.9%
Dual 4.1% 1.4%

Over 40% of CEOs with business-related undergraduate degrees majored in Business Administration/ Management, while over 50% of CFOs with
business-related undergraduate degrees majored in Accounting
39
Business Degrees by Major of Sitting CEO/CFOs2014 Fortune 500 and S&P 500 Companies (669 Companies; 508 Known CEO Undergraduate Majors; 486 Known CFO
Undergraduate Majors)
0.0%
10.0%
20.0%
30.0%
40.0%
50.0%
60.0%
CEO CFO
Business Admin/Management 42.2% 26.5%
Accounting 28.3% 51.2%
Finance 18.2% 20.5%
Other 11.2% 1.8%
40
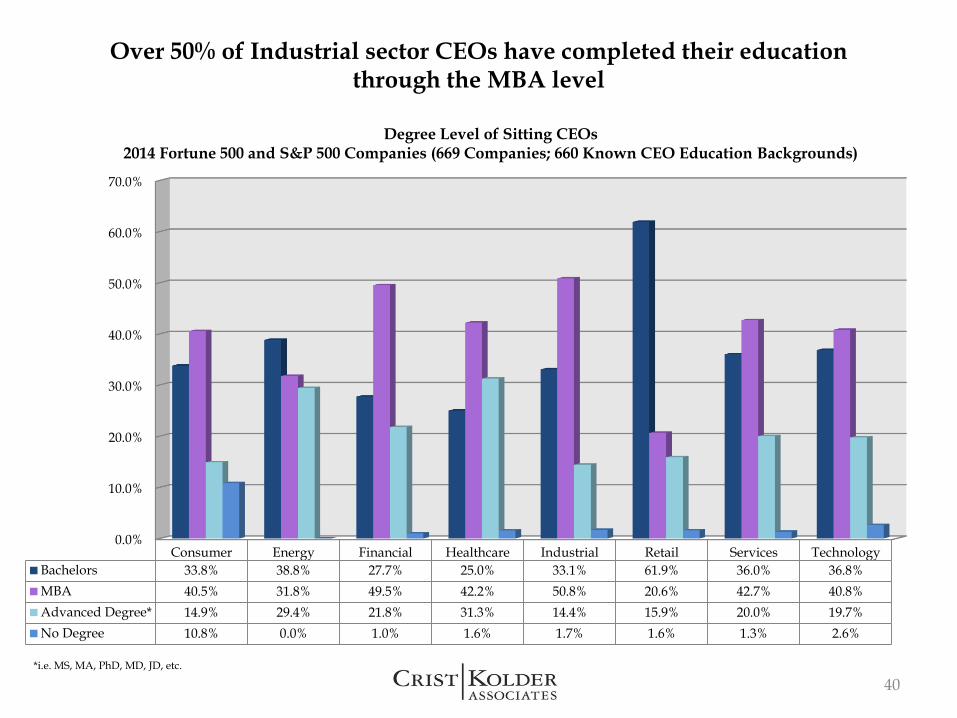
Over 50% of Industrial sector CEOs have completed their education through the MBA level
0.0%
10.0%
20.0%
30.0%
40.0%
50.0%
60.0%
70.0%
Consumer Energy Financial Healthcare Industrial Retail Services Technology
Bachelors 33.8% 38.8% 27.7% 25.0% 33.1% 61.9% 36.0% 36.8%
MBA 40.5% 31.8% 49.5% 42.2% 50.8% 20.6% 42.7% 40.8%
Advanced Degree* 14.9% 29.4% 21.8% 31.3% 14.4% 15.9% 20.0% 19.7%
No Degree 10.8% 0.0% 1.0% 1.6% 1.7% 1.6% 1.3% 2.6%
*i.e. MS, MA, PhD, MD, JD, etc.
Degree Level of Sitting CEOs2014 Fortune 500 and S&P 500 Companies (669 Companies; 660 Known CEO Education Backgrounds)

Over 60% of Retail sector CFOs have completed their education through the MBA level
41
0.0%
10.0%
20.0%
30.0%
40.0%
50.0%
60.0%
70.0%
Consumer Energy Financial Healthcare Industrial Retail Services Technology
Bachelors 53.6% 35.8% 36.3% 41.0% 34.8% 39.6% 36.8% 27.3%
MBA 40.6% 53.1% 54.9% 49.2% 57.1% 60.4% 52.9% 59.7%
Advanced Degree* 5.8% 11.1% 8.8% 9.8% 8.1% 0.0% 10.3% 13.0%
No Degree 0.0% 0.0% 0.0% 0.0% 0.0% 0.0% 0.0% 0.0%
Degree Level of Sitting CFOs2014 Fortune 500 and S&P 500 Companies (669 Companies; 618 Known CFO Education Backgrounds)
*i.e. MS, MA, PhD, MD, JD, etc.
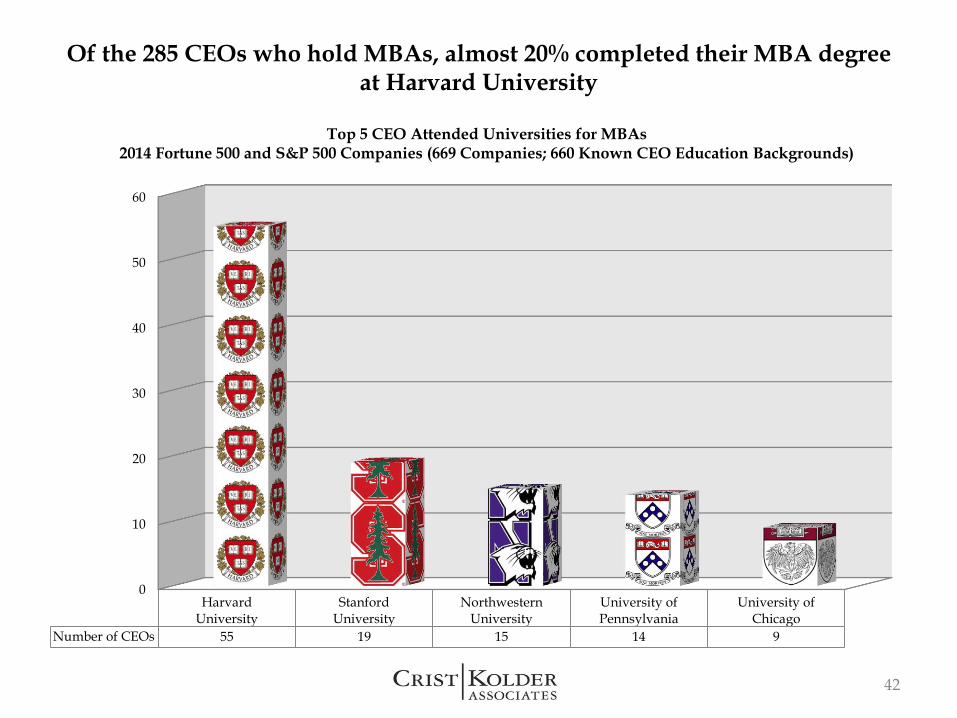
Of the 285 CEOs who hold MBAs, almost 20% completed their MBA degree at Harvard University
42
0
10
20
30
40
50
60
HarvardUniversity
StanfordUniversity
NorthwesternUniversity
University ofPennsylvania
University ofChicago
Number of CEOs 55 19 15 14 9
Top 5 CEO Attended Universities for MBAs2014 Fortune 500 and S&P 500 Companies (669 Companies; 660 Known CEO Education Backgrounds)
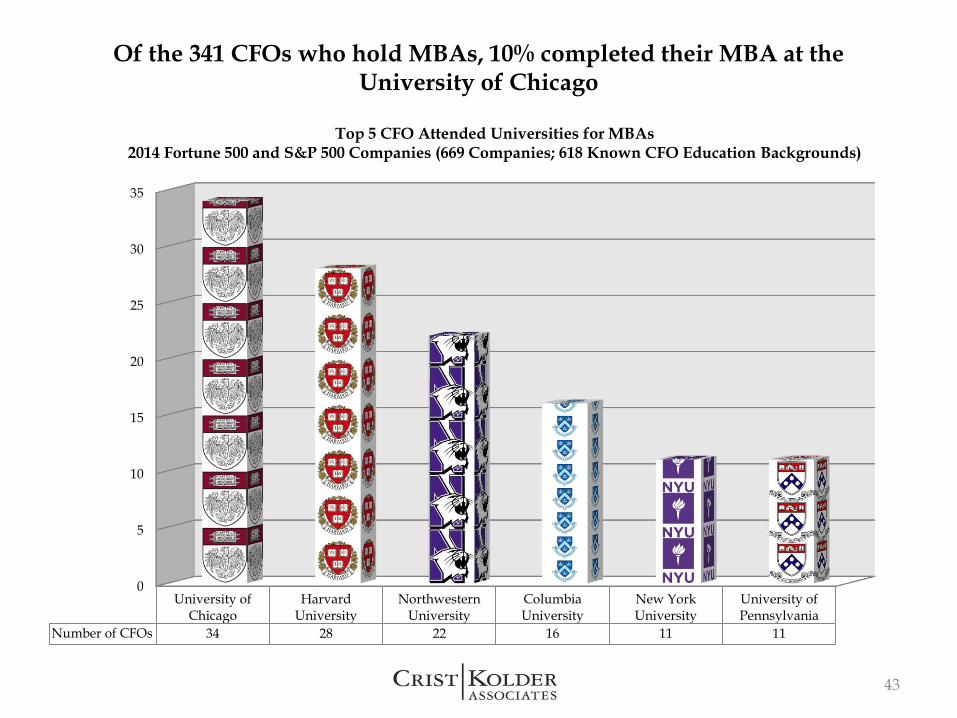
Of the 341 CFOs who hold MBAs, 10% completed their MBA at the University of Chicago
43
0
5
10
15
20
25
30
35
University ofChicago
HarvardUniversity
NorthwesternUniversity
ColumbiaUniversity
New YorkUniversity
University ofPennsylvania
Number of CFOs 34 28 22 16 11 11
Top 5 CFO Attended Universities for MBAs2014 Fortune 500 and S&P 500 Companies (669 Companies; 618 Known CFO Education Backgrounds)