vol.7, no.4, pp.273–285, december 2013 doi … · 1. introduction self-consolidating concrete...
TRANSCRIPT
An Experimental Study on Shear Strength of Chemically-BasedSelf-Consolidating Concrete
Mahdi Arezoumandi*, and Jeffery S. Volz
(Received September 7, 2012, Accepted August 8, 2013)
Abstract: An experimental investigation was conducted to compare the shear strength of full-scale beams constructed with
chemically-based, self-consolidating concrete (SCC) with conventional concrete (CC). This experimental program consisted of 16
rectangular beams (12 without shear reinforcing and 4 with shear reinforcing in the form of stirrups), 8 beams for each mix design.
Additionally, three different longitudinal reinforcement ratios were evaluated within the test matrix. The beam specimens were
tested under a simply supported four-point condition. The experimental shear strengths of the beams were compared with both the
shear provisions of selected standards (U.S., Australia, Canada, Europe, and Japan) and a shear database of CC specimens. This
comparison indicates that chemically-based SCC beams possess comparable shear strength as CC beams.
Keywords: admixtures, conventional concrete, longitudinal reinforcement ratio, self-consolidating concrete, shear strength,
experimental study.
1. Introduction
Self-consolidating concrete (SCC) is a highly workableconcrete that can spread under its own weight without seg-regation and bleeding. SCC was developed in Japan in theearly 1980s by Okamura and colleagues at Tokyo University(Ozawa et al. 1989). The motivation for this developmentwas a lack of skilled workers for compacting concrete tomake durable concrete structures (Daczko and Vachon2006).Like many new products, SCC was slow to gain popu-
larity. It was used for the first time on a large scale for theAkashi-Kaikyo bridge in Japan in 1998 (Okamura 1997). Itbegan to spread in Asian and European countries before theUnited States. It gained acceptance in the United Statesaround the year 2000 (Daczko and Vachon 2006).SCC has become more popular because of several
advantages. It reduces labor, equipment, job noise, and timeof construction. It also facilitates the filling of denselyreinforced sections and complex formworks (ACI 237R-07).Comprehensive research has been done on both fresh and
hardened properties of SCC, but relatively little researchhave been performed on the structural behavior of SCC.With regard to shear behavior, results from multiple
researchers have shown somewhat conflicting results. Daset al. (2005) found that SCC beams had higher shear strengthcompared to conventional concrete (CC). Wilson and Ki-ousis (2005) reported, however, that shear provisions withinthe American Concrete Institute (ACI 318) did not alwaysyield conservative results for SCC beams. Test results fromBurgueno and Till (2005), Bendert and Burgueno (2006a, b)showed that the shear behavior of both SCC and CC beamsare very similar to each other. In addition, the ultimate shearstrength of SCC and CC beams were almost the same.Hassan et al. (2008, 2010) and also Choulli and Mari (2005)reported there was no significant difference between theshear behavior of SCC and CC beams, and that the ultimateshear strength of SCC beams was only slightly lower thanCC beams. Dymond et al. (2007, 2009, 2010) tested a single,precast bulb-tee bridge girder and concluded that the theo-retical prediction of the simplified method was conservativecompared with experimental test results of the beam. Theseconflicting results may be attributed to the specific SCC mixdesigns for each study; limited information was provided oneach researcher’s SCC mix design. With aggregate interlockplaying such a critical role in shear behavior (Taylor 1970,1972, 1974), SCC mixes that rely on material-based chan-ges—higher paste contents and smaller rounded aggre-gates—may result in substantially reduced shear strength.There are three different approaches to developing an SCC
mix design. The first is material-based, the second ischemically-based, and the third is a hybrid of the first two.The first approach focuses on modifying the aggregate typesand amounts. Typically, the coarse aggregate content isreduced and also rounder aggregate is used to improve theflowability of the SCC mix. The main disadvantage of thisapproach is that with a lower coarse aggregate content,
Department of Civil, Architectural and Environmental
Engineering, Missouri University of Science and
Technology, Rolla, MO 65409, USA.
*Corresponding Author; E-mail: [email protected]
Copyright � The Author(s) 2013. This article is published
with open access at Springerlink.com
International Journal of Concrete Structures and MaterialsVol.7, No.4, pp.273–285, December 2013DOI 10.1007/s40069-013-0052-1ISSN 1976-0485 / eISSN 2234-1315
273
aggregate interlock, and as a result shear strength, isreduced. To avoid this issue, the second approach wasdeveloped and, in this approach, the coarse aggregate andpaste contents are kept the same as in a CC mix. To improvethe flowability and stability of this type of mix, high-rangewater-reducing admixtures (HRWRA) and viscosity-modi-fying admixtures (VMA) are used.All of the aforementioned previous research studied shear
behavior of SCC that used the first or third approaches formix design. This study presents the results of an experi-mental investigation that compares the shear strength of full-scale SCC beams—constructed with a chemically-basedmix—with shear provisions of the selected codes and a sheardatabase of CC specimens.
2. Experimental Program
2.1 Specimen DesignEight beams (six without shear reinforcing and two with
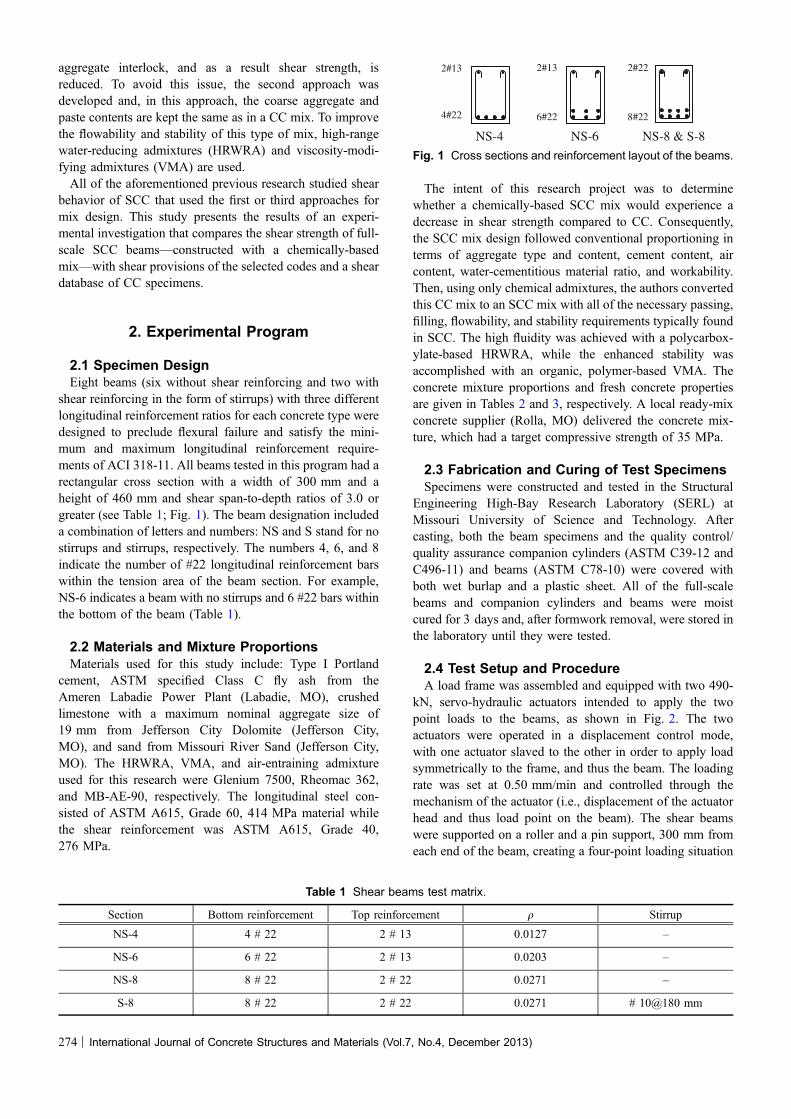
shear reinforcing in the form of stirrups) with three differentlongitudinal reinforcement ratios for each concrete type weredesigned to preclude flexural failure and satisfy the mini-mum and maximum longitudinal reinforcement require-ments of ACI 318-11. All beams tested in this program had arectangular cross section with a width of 300 mm and aheight of 460 mm and shear span-to-depth ratios of 3.0 orgreater (see Table 1; Fig. 1). The beam designation includeda combination of letters and numbers: NS and S stand for nostirrups and stirrups, respectively. The numbers 4, 6, and 8indicate the number of #22 longitudinal reinforcement barswithin the tension area of the beam section. For example,NS-6 indicates a beam with no stirrups and 6 #22 bars withinthe bottom of the beam (Table 1).
2.2 Materials and Mixture ProportionsMaterials used for this study include: Type I Portland
cement, ASTM specified Class C fly ash from theAmeren Labadie Power Plant (Labadie, MO), crushedlimestone with a maximum nominal aggregate size of19 mm from Jefferson City Dolomite (Jefferson City,MO), and sand from Missouri River Sand (Jefferson City,MO). The HRWRA, VMA, and air-entraining admixtureused for this research were Glenium 7500, Rheomac 362,and MB-AE-90, respectively. The longitudinal steel con-sisted of ASTM A615, Grade 60, 414 MPa material whilethe shear reinforcement was ASTM A615, Grade 40,276 MPa.
The intent of this research project was to determinewhether a chemically-based SCC mix would experience adecrease in shear strength compared to CC. Consequently,the SCC mix design followed conventional proportioning interms of aggregate type and content, cement content, aircontent, water-cementitious material ratio, and workability.Then, using only chemical admixtures, the authors convertedthis CC mix to an SCC mix with all of the necessary passing,filling, flowability, and stability requirements typically foundin SCC. The high fluidity was achieved with a polycarbox-ylate-based HRWRA, while the enhanced stability wasaccomplished with an organic, polymer-based VMA. Theconcrete mixture proportions and fresh concrete propertiesare given in Tables 2 and 3, respectively. A local ready-mixconcrete supplier (Rolla, MO) delivered the concrete mix-ture, which had a target compressive strength of 35 MPa.
2.3 Fabrication and Curing of Test SpecimensSpecimens were constructed and tested in the Structural
Engineering High-Bay Research Laboratory (SERL) atMissouri University of Science and Technology. Aftercasting, both the beam specimens and the quality control/quality assurance companion cylinders (ASTM C39-12 andC496-11) and beams (ASTM C78-10) were covered withboth wet burlap and a plastic sheet. All of the full-scalebeams and companion cylinders and beams were moistcured for 3 days and, after formwork removal, were stored inthe laboratory until they were tested.
2.4 Test Setup and ProcedureA load frame was assembled and equipped with two 490-
kN, servo-hydraulic actuators intended to apply the twopoint loads to the beams, as shown in Fig. 2. The twoactuators were operated in a displacement control mode,with one actuator slaved to the other in order to apply loadsymmetrically to the frame, and thus the beam. The loadingrate was set at 0.50 mm/min and controlled through themechanism of the actuator (i.e., displacement of the actuatorhead and thus load point on the beam). The shear beamswere supported on a roller and a pin support, 300 mm fromeach end of the beam, creating a four-point loading situation
Table 1 Shear beams test matrix.
Section Bottom reinforcement Top reinforcement q Stirrup
NS-4 4 # 22 2 # 13 0.0127 –
NS-6 6 # 22 2 # 13 0.0203 –
NS-8 8 # 22 2 # 22 0.0271 –
S-8 8 # 22 2 # 22 0.0271 # 10@180 mm
NS-4 NS-6 NS-8 & S-8
2#13
4#22
2#13
6#22
2#22
8#22
Fig. 1 Cross sections and reinforcement layout of the beams.
274 | International Journal of Concrete Structures and Materials (Vol.7, No.4, December 2013)
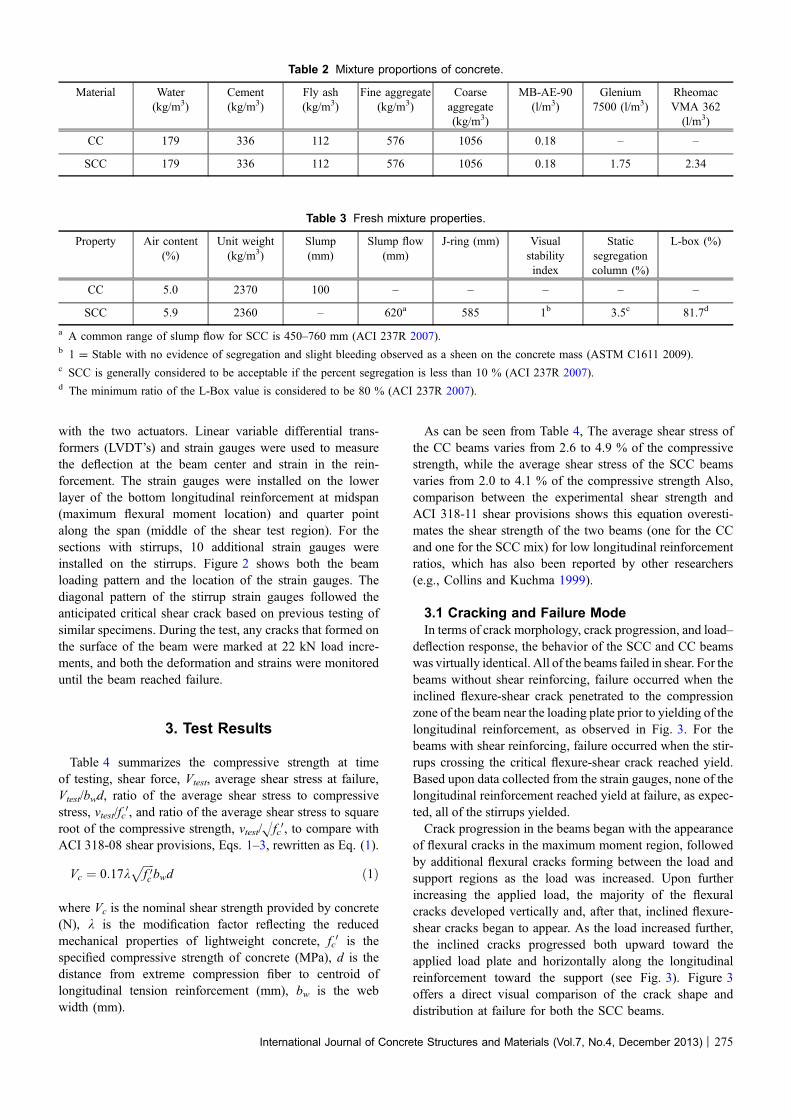
with the two actuators. Linear variable differential trans-formers (LVDT’s) and strain gauges were used to measurethe deflection at the beam center and strain in the rein-forcement. The strain gauges were installed on the lowerlayer of the bottom longitudinal reinforcement at midspan(maximum flexural moment location) and quarter pointalong the span (middle of the shear test region). For thesections with stirrups, 10 additional strain gauges wereinstalled on the stirrups. Figure 2 shows both the beamloading pattern and the location of the strain gauges. Thediagonal pattern of the stirrup strain gauges followed theanticipated critical shear crack based on previous testing ofsimilar specimens. During the test, any cracks that formed onthe surface of the beam were marked at 22 kN load incre-ments, and both the deformation and strains were monitoreduntil the beam reached failure.
3. Test Results
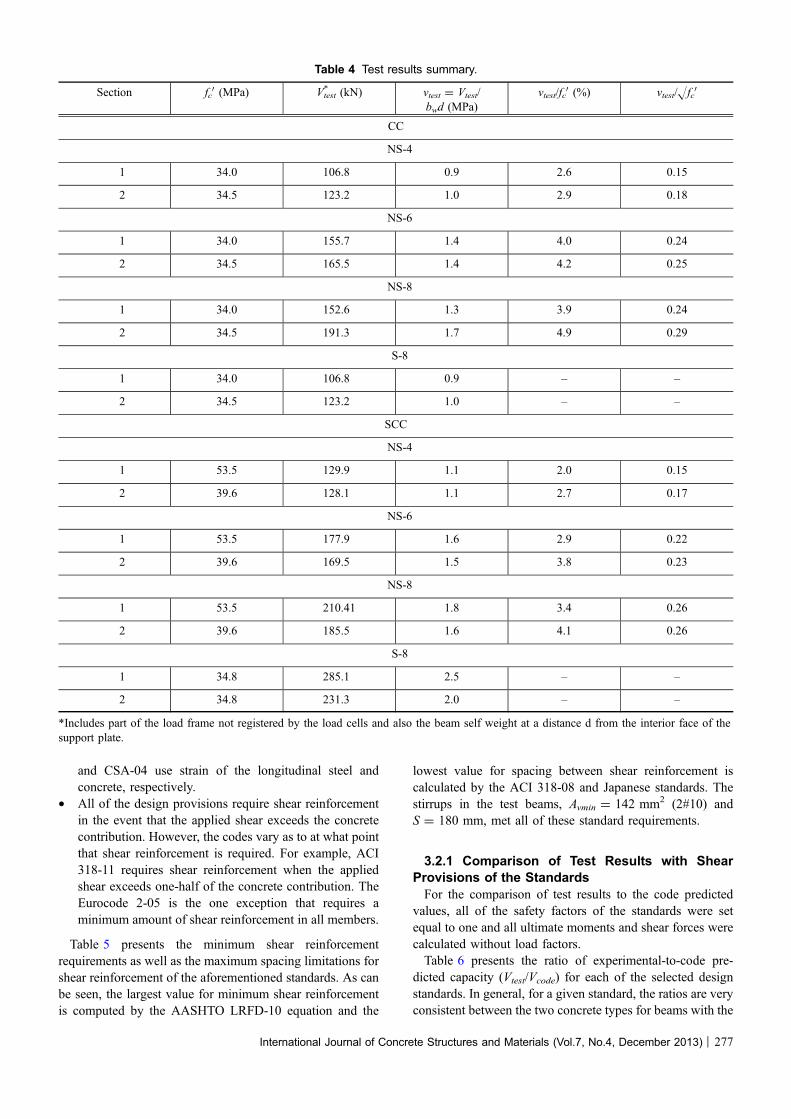
Table 4 summarizes the compressive strength at timeof testing, shear force, Vtest, average shear stress at failure,Vtest/bwd, ratio of the average shear stress to compressivestress, vtest/fc
0, and ratio of the average shear stress to squareroot of the compressive strength, vtest/Hfc
0, to compare withACI 318-08 shear provisions, Eqs. 1–3, rewritten as Eq. (1).
Vc ¼ 0:17kffiffiffiffi
f 0cp
bwd ð1Þ
where Vc is the nominal shear strength provided by concrete(N), k is the modification factor reflecting the reducedmechanical properties of lightweight concrete, fc
0 is thespecified compressive strength of concrete (MPa), d is thedistance from extreme compression fiber to centroid oflongitudinal tension reinforcement (mm), bw is the webwidth (mm).
As can be seen from Table 4, The average shear stress ofthe CC beams varies from 2.6 to 4.9 % of the compressivestrength, while the average shear stress of the SCC beamsvaries from 2.0 to 4.1 % of the compressive strength Also,comparison between the experimental shear strength andACI 318-11 shear provisions shows this equation overesti-mates the shear strength of the two beams (one for the CCand one for the SCC mix) for low longitudinal reinforcementratios, which has also been reported by other researchers(e.g., Collins and Kuchma 1999).
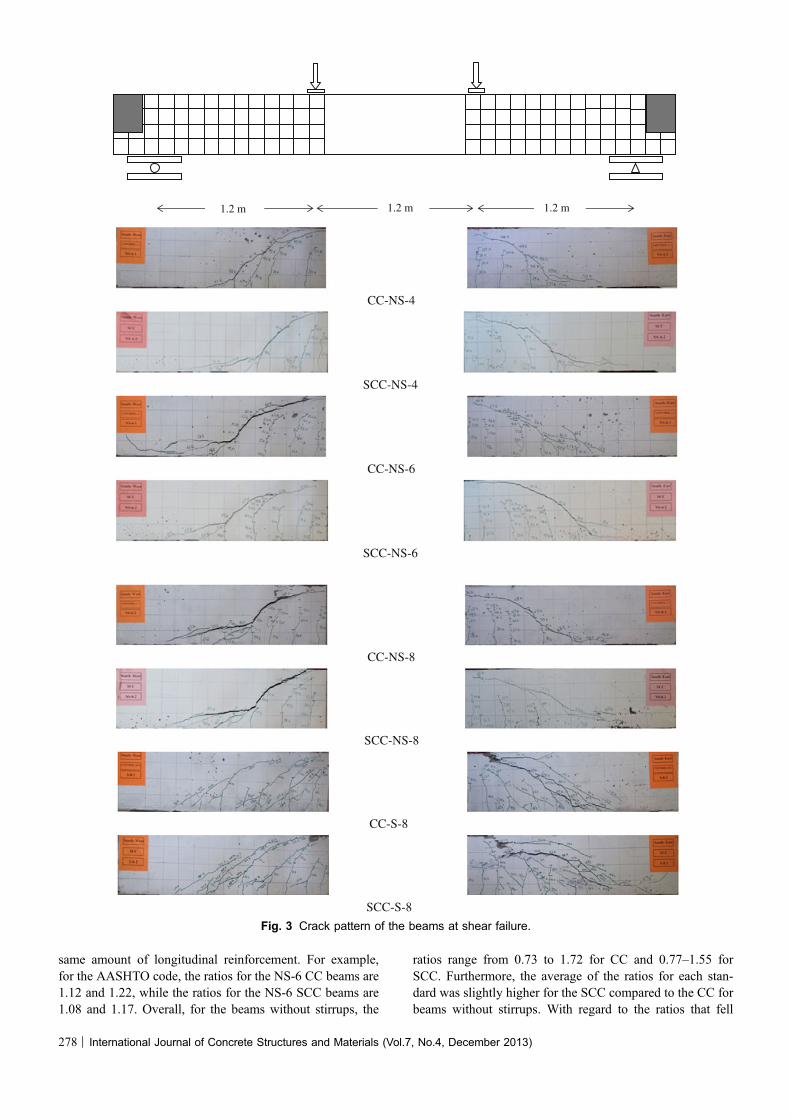
3.1 Cracking and Failure ModeIn terms of crack morphology, crack progression, and load–
deflection response, the behavior of the SCC and CC beamswas virtually identical. All of the beams failed in shear. For thebeams without shear reinforcing, failure occurred when theinclined flexure-shear crack penetrated to the compressionzone of the beam near the loading plate prior to yielding of thelongitudinal reinforcement, as observed in Fig. 3. For thebeams with shear reinforcing, failure occurred when the stir-rups crossing the critical flexure-shear crack reached yield.Based upon data collected from the strain gauges, none of thelongitudinal reinforcement reached yield at failure, as expec-ted, all of the stirrups yielded.Crack progression in the beams began with the appearance
of flexural cracks in the maximum moment region, followedby additional flexural cracks forming between the load andsupport regions as the load was increased. Upon furtherincreasing the applied load, the majority of the flexuralcracks developed vertically and, after that, inclined flexure-shear cracks began to appear. As the load increased further,the inclined cracks progressed both upward toward theapplied load plate and horizontally along the longitudinalreinforcement toward the support (see Fig. 3). Figure 3offers a direct visual comparison of the crack shape anddistribution at failure for both the SCC beams.
Table 2 Mixture proportions of concrete.
Material Water(kg/m3)
Cement(kg/m3)
Fly ash(kg/m3)
Fine aggregate(kg/m3)
Coarseaggregate(kg/m3)
MB-AE-90(l/m3)
Glenium7500 (l/m3)
RheomacVMA 362(l/m3)
CC 179 336 112 576 1056 0.18 – –
SCC 179 336 112 576 1056 0.18 1.75 2.34
Table 3 Fresh mixture properties.
Property Air content(%)
Unit weight(kg/m3)
Slump(mm)
Slump flow(mm)
J-ring (mm) Visualstabilityindex
Staticsegregationcolumn (%)
L-box (%)
CC 5.0 2370 100 – – – – –
SCC 5.9 2360 – 620a 585 1b 3.5c 81.7d
a A common range of slump flow for SCC is 450–760 mm (ACI 237R 2007).b 1 = Stable with no evidence of segregation and slight bleeding observed as a sheen on the concrete mass (ASTM C1611 2009).c SCC is generally considered to be acceptable if the percent segregation is less than 10 % (ACI 237R 2007).d The minimum ratio of the L-Box value is considered to be 80 % (ACI 237R 2007).
International Journal of Concrete Structures and Materials (Vol.7, No.4, December 2013) | 275
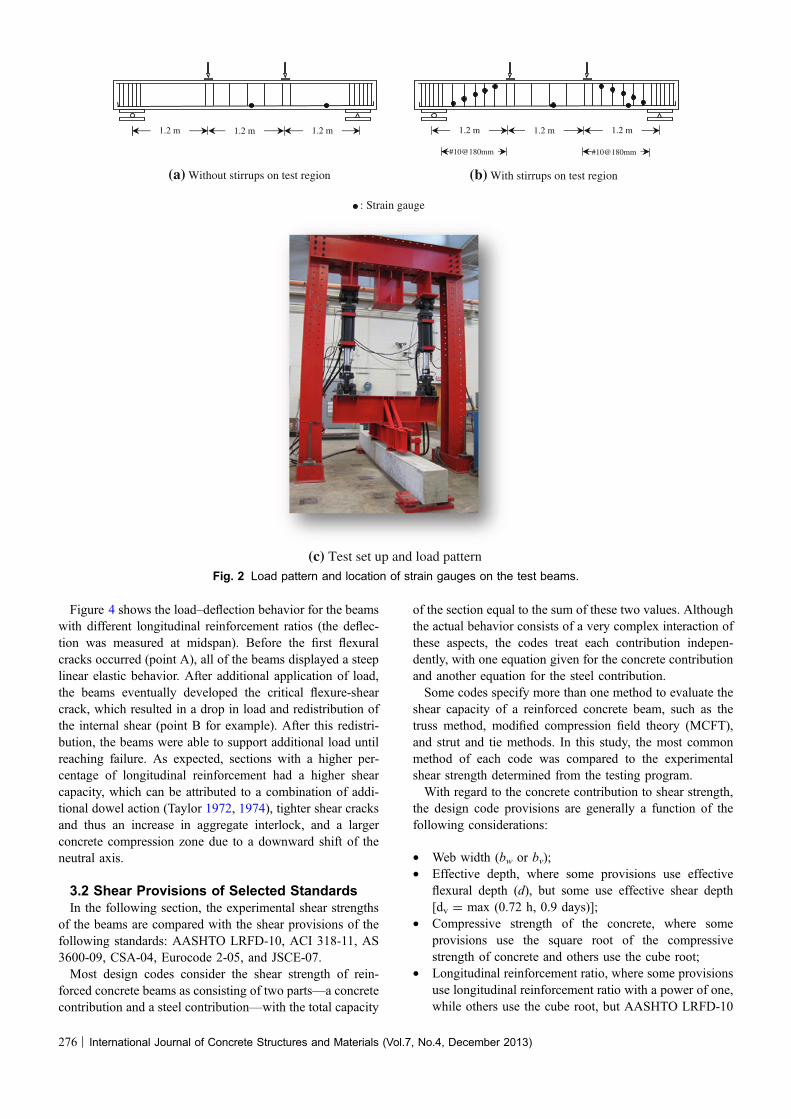
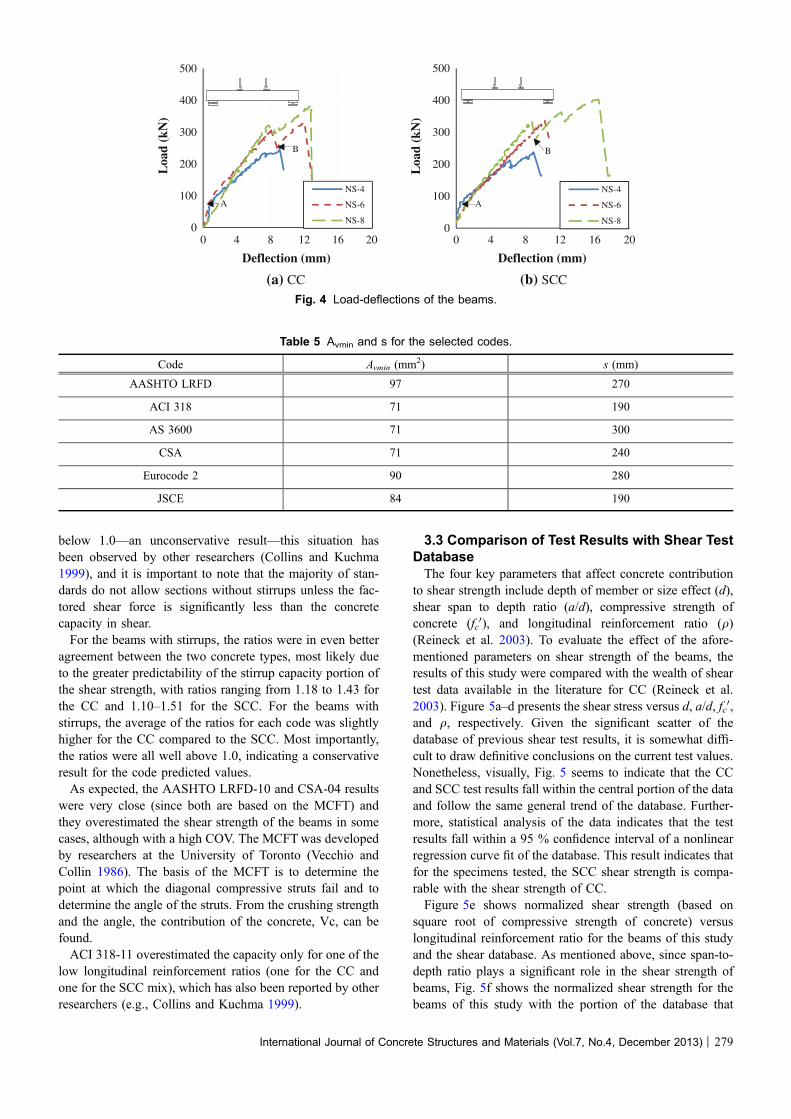
Figure 4 shows the load–deflection behavior for the beamswith different longitudinal reinforcement ratios (the deflec-tion was measured at midspan). Before the first flexuralcracks occurred (point A), all of the beams displayed a steeplinear elastic behavior. After additional application of load,the beams eventually developed the critical flexure-shearcrack, which resulted in a drop in load and redistribution ofthe internal shear (point B for example). After this redistri-bution, the beams were able to support additional load untilreaching failure. As expected, sections with a higher per-centage of longitudinal reinforcement had a higher shearcapacity, which can be attributed to a combination of addi-tional dowel action (Taylor 1972, 1974), tighter shear cracksand thus an increase in aggregate interlock, and a largerconcrete compression zone due to a downward shift of theneutral axis.
3.2 Shear Provisions of Selected StandardsIn the following section, the experimental shear strengths
of the beams are compared with the shear provisions of thefollowing standards: AASHTO LRFD-10, ACI 318-11, AS3600-09, CSA-04, Eurocode 2-05, and JSCE-07.Most design codes consider the shear strength of rein-
forced concrete beams as consisting of two parts—a concretecontribution and a steel contribution—with the total capacity
of the section equal to the sum of these two values. Althoughthe actual behavior consists of a very complex interaction ofthese aspects, the codes treat each contribution indepen-dently, with one equation given for the concrete contributionand another equation for the steel contribution.Some codes specify more than one method to evaluate the
shear capacity of a reinforced concrete beam, such as thetruss method, modified compression field theory (MCFT),and strut and tie methods. In this study, the most commonmethod of each code was compared to the experimentalshear strength determined from the testing program.With regard to the concrete contribution to shear strength,
the design code provisions are generally a function of thefollowing considerations:
• Web width (bw or bv);• Effective depth, where some provisions use effective
flexural depth (d), but some use effective shear depth[dv = max (0.72 h, 0.9 days)];
• Compressive strength of the concrete, where someprovisions use the square root of the compressivestrength of concrete and others use the cube root;
• Longitudinal reinforcement ratio, where some provisionsuse longitudinal reinforcement ratio with a power of one,while others use the cube root, but AASHTO LRFD-10
(a) Without stirrups on test region (b) With stirrups on test region
: Strain gauge
(c) Test set up and load pattern
1.2 m 1.2 m 1.2 m 1.2 m 1.2 m 1.2 m
#10@180mm #10@180mm
Fig. 2 Load pattern and location of strain gauges on the test beams.
276 | International Journal of Concrete Structures and Materials (Vol.7, No.4, December 2013)
and CSA-04 use strain of the longitudinal steel andconcrete, respectively.
• All of the design provisions require shear reinforcementin the event that the applied shear exceeds the concretecontribution. However, the codes vary as to at what pointthat shear reinforcement is required. For example, ACI318-11 requires shear reinforcement when the appliedshear exceeds one-half of the concrete contribution. TheEurocode 2-05 is the one exception that requires aminimum amount of shear reinforcement in all members.
Table 5 presents the minimum shear reinforcementrequirements as well as the maximum spacing limitations forshear reinforcement of the aforementioned standards. As canbe seen, the largest value for minimum shear reinforcementis computed by the AASHTO LRFD-10 equation and the
lowest value for spacing between shear reinforcement iscalculated by the ACI 318-08 and Japanese standards. Thestirrups in the test beams, Avmin = 142 mm2 (2#10) andS = 180 mm, met all of these standard requirements.
3.2.1 Comparison of Test Results with ShearProvisions of the StandardsFor the comparison of test results to the code predicted
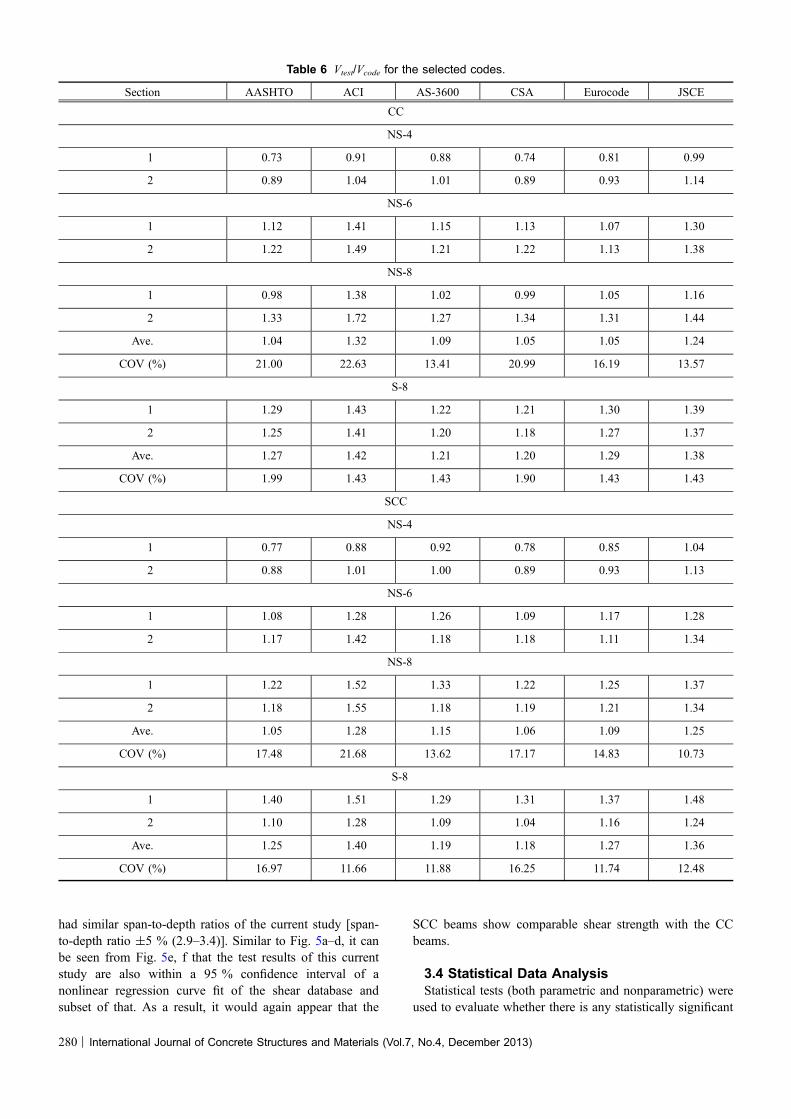
values, all of the safety factors of the standards were setequal to one and all ultimate moments and shear forces werecalculated without load factors.Table 6 presents the ratio of experimental-to-code pre-
dicted capacity (Vtest/Vcode) for each of the selected designstandards. In general, for a given standard, the ratios are veryconsistent between the two concrete types for beams with the
Table 4 Test results summary.
Section fc0 (MPa) Vtest
* (kN) vtest = Vtest/bwd (MPa)
vtest/fc0 (%) vtest/Hfc
0
CC
NS-4
1 34.0 106.8 0.9 2.6 0.15
2 34.5 123.2 1.0 2.9 0.18
NS-6
1 34.0 155.7 1.4 4.0 0.24
2 34.5 165.5 1.4 4.2 0.25
NS-8
1 34.0 152.6 1.3 3.9 0.24
2 34.5 191.3 1.7 4.9 0.29
S-8
1 34.0 106.8 0.9 – –
2 34.5 123.2 1.0 – –
SCC
NS-4
1 53.5 129.9 1.1 2.0 0.15
2 39.6 128.1 1.1 2.7 0.17
NS-6
1 53.5 177.9 1.6 2.9 0.22
2 39.6 169.5 1.5 3.8 0.23
NS-8
1 53.5 210.41 1.8 3.4 0.26
2 39.6 185.5 1.6 4.1 0.26
S-8
1 34.8 285.1 2.5 – –
2 34.8 231.3 2.0 – –
*Includes part of the load frame not registered by the load cells and also the beam self weight at a distance d from the interior face of thesupport plate.
International Journal of Concrete Structures and Materials (Vol.7, No.4, December 2013) | 277
same amount of longitudinal reinforcement. For example,for the AASHTO code, the ratios for the NS-6 CC beams are1.12 and 1.22, while the ratios for the NS-6 SCC beams are1.08 and 1.17. Overall, for the beams without stirrups, the
ratios range from 0.73 to 1.72 for CC and 0.77–1.55 forSCC. Furthermore, the average of the ratios for each stan-dard was slightly higher for the SCC compared to the CC forbeams without stirrups. With regard to the ratios that fell
CC-NS-4
SCC-NS-4
CC-NS-6
SCC-NS-6
CC-NS-8
SCC-NS-8
CC-S-8
SCC-S-8
0.3m1.2m 1.2m 1.2 m 1.2 m 1.2 m
Fig. 3 Crack pattern of the beams at shear failure.
278 | International Journal of Concrete Structures and Materials (Vol.7, No.4, December 2013)
below 1.0—an unconservative result—this situation hasbeen observed by other researchers (Collins and Kuchma1999), and it is important to note that the majority of stan-dards do not allow sections without stirrups unless the fac-tored shear force is significantly less than the concretecapacity in shear.For the beams with stirrups, the ratios were in even better
agreement between the two concrete types, most likely dueto the greater predictability of the stirrup capacity portion ofthe shear strength, with ratios ranging from 1.18 to 1.43 forthe CC and 1.10–1.51 for the SCC. For the beams withstirrups, the average of the ratios for each code was slightlyhigher for the CC compared to the SCC. Most importantly,the ratios were all well above 1.0, indicating a conservativeresult for the code predicted values.As expected, the AASHTO LRFD-10 and CSA-04 results
were very close (since both are based on the MCFT) andthey overestimated the shear strength of the beams in somecases, although with a high COV. The MCFTwas developedby researchers at the University of Toronto (Vecchio andCollin 1986). The basis of the MCFT is to determine thepoint at which the diagonal compressive struts fail and todetermine the angle of the struts. From the crushing strengthand the angle, the contribution of the concrete, Vc, can befound.ACI 318-11 overestimated the capacity only for one of the
low longitudinal reinforcement ratios (one for the CC andone for the SCC mix), which has also been reported by otherresearchers (e.g., Collins and Kuchma 1999).
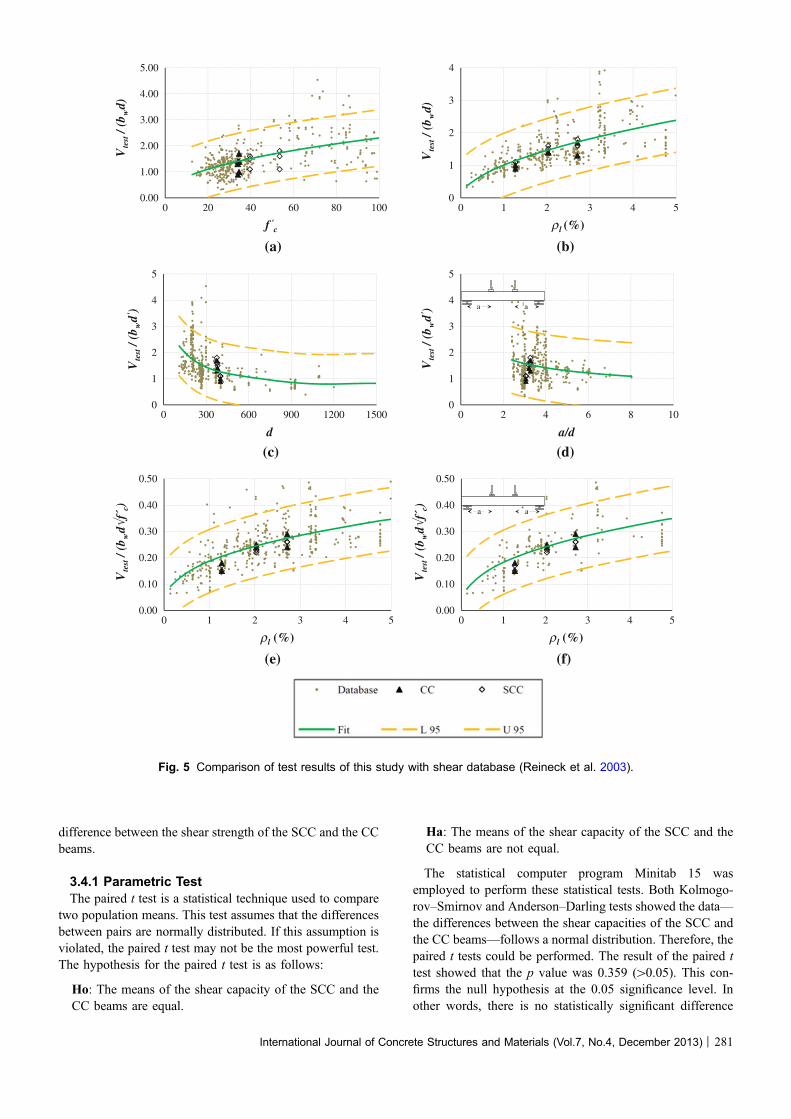
3.3 Comparison of Test Results with Shear TestDatabaseThe four key parameters that affect concrete contribution
to shear strength include depth of member or size effect (d),shear span to depth ratio (a/d), compressive strength ofconcrete (fc
0), and longitudinal reinforcement ratio (q)(Reineck et al. 2003). To evaluate the effect of the afore-mentioned parameters on shear strength of the beams, theresults of this study were compared with the wealth of sheartest data available in the literature for CC (Reineck et al.2003). Figure 5a–d presents the shear stress versus d, a/d, fc
0,and q, respectively. Given the significant scatter of thedatabase of previous shear test results, it is somewhat diffi-cult to draw definitive conclusions on the current test values.Nonetheless, visually, Fig. 5 seems to indicate that the CCand SCC test results fall within the central portion of the dataand follow the same general trend of the database. Further-more, statistical analysis of the data indicates that the testresults fall within a 95 % confidence interval of a nonlinearregression curve fit of the database. This result indicates thatfor the specimens tested, the SCC shear strength is compa-rable with the shear strength of CC.Figure 5e shows normalized shear strength (based on
square root of compressive strength of concrete) versuslongitudinal reinforcement ratio for the beams of this studyand the shear database. As mentioned above, since span-to-depth ratio plays a significant role in the shear strength ofbeams, Fig. 5f shows the normalized shear strength for thebeams of this study with the portion of the database that
(a) CC (b) SCC
0
100
200
300
400
500
0 4 8 12 16 20
Loa
d (k
N)
Deflection (mm)
NS-4
NS-6
NS-80
100
200
300
400
500
0 4 8 12 16 20
Loa
d (k
N)
Deflection (mm)
NS-4
NS-6
NS-8
B
A
B
A
Fig. 4 Load-deflections of the beams.
Table 5 Avmin and s for the selected codes.
Code Avmin (mm2) s (mm)
AASHTO LRFD 97 270
ACI 318 71 190
AS 3600 71 300
CSA 71 240
Eurocode 2 90 280
JSCE 84 190
International Journal of Concrete Structures and Materials (Vol.7, No.4, December 2013) | 279
had similar span-to-depth ratios of the current study [span-to-depth ratio ±5 % (2.9–3.4)]. Similar to Fig. 5a–d, it canbe seen from Fig. 5e, f that the test results of this currentstudy are also within a 95 % confidence interval of anonlinear regression curve fit of the shear database andsubset of that. As a result, it would again appear that the
SCC beams show comparable shear strength with the CCbeams.
3.4 Statistical Data AnalysisStatistical tests (both parametric and nonparametric) were
used to evaluate whether there is any statistically significant
Table 6 Vtest/Vcode for the selected codes.
Section AASHTO ACI AS-3600 CSA Eurocode JSCE
CC
NS-4
1 0.73 0.91 0.88 0.74 0.81 0.99
2 0.89 1.04 1.01 0.89 0.93 1.14
NS-6
1 1.12 1.41 1.15 1.13 1.07 1.30
2 1.22 1.49 1.21 1.22 1.13 1.38
NS-8
1 0.98 1.38 1.02 0.99 1.05 1.16
2 1.33 1.72 1.27 1.34 1.31 1.44
Ave. 1.04 1.32 1.09 1.05 1.05 1.24
COV (%) 21.00 22.63 13.41 20.99 16.19 13.57
S-8
1 1.29 1.43 1.22 1.21 1.30 1.39
2 1.25 1.41 1.20 1.18 1.27 1.37
Ave. 1.27 1.42 1.21 1.20 1.29 1.38
COV (%) 1.99 1.43 1.43 1.90 1.43 1.43
SCC
NS-4
1 0.77 0.88 0.92 0.78 0.85 1.04
2 0.88 1.01 1.00 0.89 0.93 1.13
NS-6
1 1.08 1.28 1.26 1.09 1.17 1.28
2 1.17 1.42 1.18 1.18 1.11 1.34
NS-8
1 1.22 1.52 1.33 1.22 1.25 1.37
2 1.18 1.55 1.18 1.19 1.21 1.34
Ave. 1.05 1.28 1.15 1.06 1.09 1.25
COV (%) 17.48 21.68 13.62 17.17 14.83 10.73
S-8
1 1.40 1.51 1.29 1.31 1.37 1.48
2 1.10 1.28 1.09 1.04 1.16 1.24
Ave. 1.25 1.40 1.19 1.18 1.27 1.36
COV (%) 16.97 11.66 11.88 16.25 11.74 12.48
280 | International Journal of Concrete Structures and Materials (Vol.7, No.4, December 2013)
difference between the shear strength of the SCC and the CCbeams.
3.4.1 Parametric TestThe paired t test is a statistical technique used to compare
two population means. This test assumes that the differencesbetween pairs are normally distributed. If this assumption isviolated, the paired t test may not be the most powerful test.The hypothesis for the paired t test is as follows:
Ho: The means of the shear capacity of the SCC and theCC beams are equal.
Ha: The means of the shear capacity of the SCC and theCC beams are not equal.
The statistical computer program Minitab 15 wasemployed to perform these statistical tests. Both Kolmogo-rov–Smirnov and Anderson–Darling tests showed the data—the differences between the shear capacities of the SCC andthe CC beams—follows a normal distribution. Therefore, thepaired t tests could be performed. The result of the paired ttest showed that the p value was 0.359 ([0.05). This con-firms the null hypothesis at the 0.05 significance level. Inother words, there is no statistically significant difference
(b)(a)
(d)(c)
(f)(e)
0.00
1.00
2.00
3.00
4.00
5.00
0 20 40 60 80 100
Vte
st /
(bwd)
f 'c
0
1
2
3
4
0 1 2 3 4 5
Vte
st /
(bwd)
ρ l (%)
0
1
2
3
4
5
0 300 600 900 1200 1500
Vte
st /
(bwd' )
d
0
1
2
3
4
5
0 2 4 6 8 10V
test
/ (b
wd' )
a/d
0.00
0.10
0.20
0.30
0.40
0.50
0 1 2 3 4 5
Vte
st /
(bwd √
f´c)
Vte
st /
(bwd √
f´c)
ρ l (%)
0.00
0.10
0.20
0.30
0.40
0.50
0 1 2 3 4 5
ρ l (%)
a a
a a
Fig. 5 Comparison of test results of this study with shear database (Reineck et al. 2003).
International Journal of Concrete Structures and Materials (Vol.7, No.4, December 2013) | 281
between the means of the normalized shear capacity of theSCC and CC beams tested in this investigation.
3.4.2 Nonparametric TestUnlike the parametric tests, nonparametric tests are refer-
red to as distribution-free tests. These tests have theadvantage of requiring no assumption of normality, and theyusually compare medians rather than means. The Wilcoxonsigned-rank test is usually identified as a nonparametricalternative to the paired t test. The hypothesis for this test isthe same as those for the paired t test. The Wilcoxon signedrank test assumes that the distribution of the difference of
pairs is symmetrical. This assumption can be checked; if thedistribution is normal, it is also symmetrical. As mentionedearlier, the data follows normal distribution and the Wilco-xon signed ranks test can be used. The p value for theWilcoxon signed rank was 0.363 ([0.05), that confirmed thenull hypothesis at the 0.05 significance level. Interestingly,the p values for both the paired t tests (parametric test) andthe Wilcoxon signed rank test (nonparametric test) are veryclose to each other.Overall, results of the statistical data analyses showed that
there is no statistically significant difference between themeansof the normalized shear capacity of the SCC and CC beams.
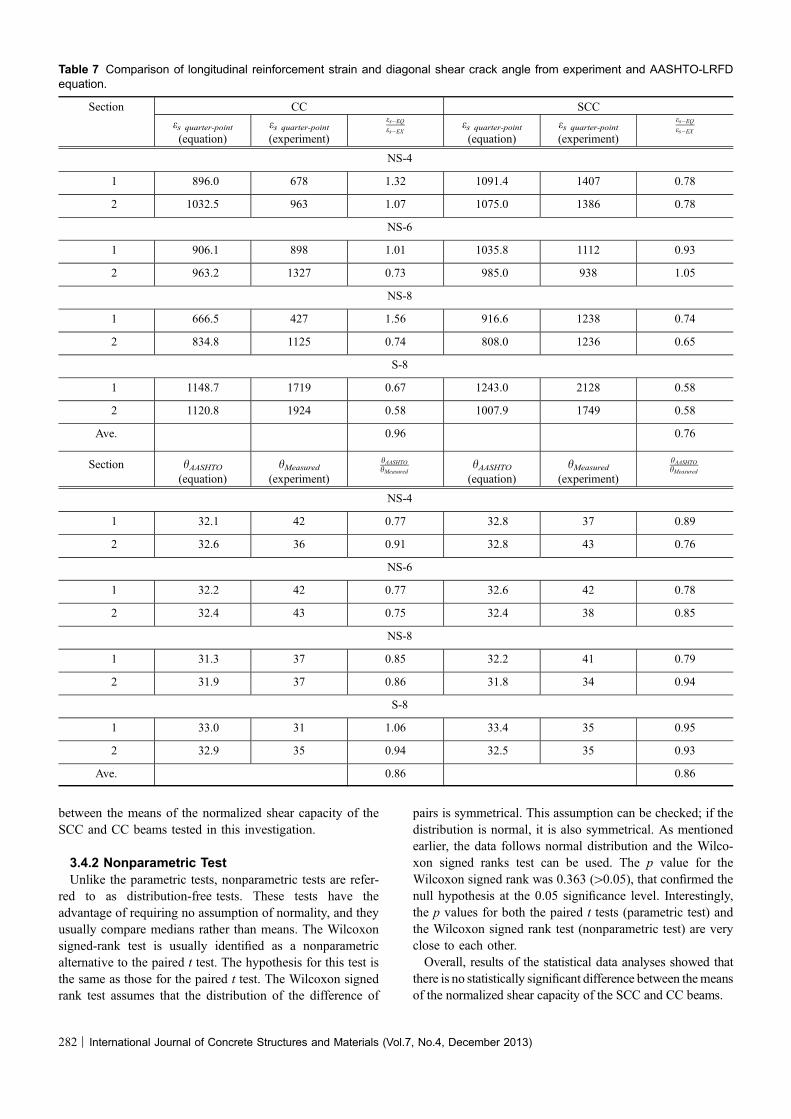
Table 7 Comparison of longitudinal reinforcement strain and diagonal shear crack angle from experiment and AASHTO-LRFDequation.
Section CC SCC
es quarter-point
(equation)es quarter-point
(experiment)
es�EQ
es�EXes quarter-point
(equation)es quarter-point
(experiment)
es�EQ
es�EX
NS-4
1 896.0 678 1.32 1091.4 1407 0.78
2 1032.5 963 1.07 1075.0 1386 0.78
NS-6
1 906.1 898 1.01 1035.8 1112 0.93
2 963.2 1327 0.73 985.0 938 1.05
NS-8
1 666.5 427 1.56 916.6 1238 0.74
2 834.8 1125 0.74 808.0 1236 0.65
S-8
1 1148.7 1719 0.67 1243.0 2128 0.58
2 1120.8 1924 0.58 1007.9 1749 0.58
Ave. 0.96 0.76
Section hAASHTO(equation)
hMeasured
(experiment)
hAASHTOhMeasured
hAASHTO(equation)
hMeasured
(experiment)
hAASHTOhMeasured
NS-4
1 32.1 42 0.77 32.8 37 0.89
2 32.6 36 0.91 32.8 43 0.76
NS-6
1 32.2 42 0.77 32.6 42 0.78
2 32.4 43 0.75 32.4 38 0.85
NS-8
1 31.3 37 0.85 32.2 41 0.79
2 31.9 37 0.86 31.8 34 0.94
S-8
1 33.0 31 1.06 33.4 35 0.95
2 32.9 35 0.94 32.5 35 0.93
Ave. 0.86 0.86
282 | International Journal of Concrete Structures and Materials (Vol.7, No.4, December 2013)
3.5 Comparison of Longitudinal ReinforcementStrains and Diagonal Shear Crack Angle fromExperiment with AASHTO LRFDAccording to the AASHTO LRFD-10 standard, strain in
the longitudinal tension reinforcement can be determined by
es ¼Muj jdv
þ Vuj j� �
EsAsð2Þ
where As is the area of non prestressed tension reinforcement(m2), dv is the effective shear depth (m), Es is the modulus ofelasticity of reinforcing bars (MPa), Mu is the factoredmoment at section (N.m), Vu is the factored shear force atsection (N), es is the strain in nonprestressed longitudinaltension reinforcement (m/m).Table 7 presents the tensile strain in the longitudinal ten-
sion reinforcement at the quarter-point of the span (middle ofthe shear test region) obtained from both the experiments(strain gauges) and also the AASHTO LRFD-10 equation.This AASHTO LRFD-10 equation underestimates the strainfor the SCC beams. The measured strains are based on theinstalled strain gages. Even with the potential for slightinaccuracies in the strain gage readings due to localizedcracking and the slight reduction in cross section required formounting the gages, the measured readings offer a valuablebasis of comparison with the AASHTO LRFD-10 equation.The concrete component of shear (Vc) is the sum of theresistance due to three shear mechanisms: uncracked con-crete, aggregate interlock, and dowel action. Higher strain inthe tension reinforcement means more dowel action andsince no significant difference was observed in the shearcrack patterns compared with CC beams, it may be con-cluded that the SCC beams have lower aggregate interlock.Authors suggest push-off specimen tests for future researchto evaluate aggregate interlock between the CC and SCCmix designs.The angle of the critical shear crack is an important design
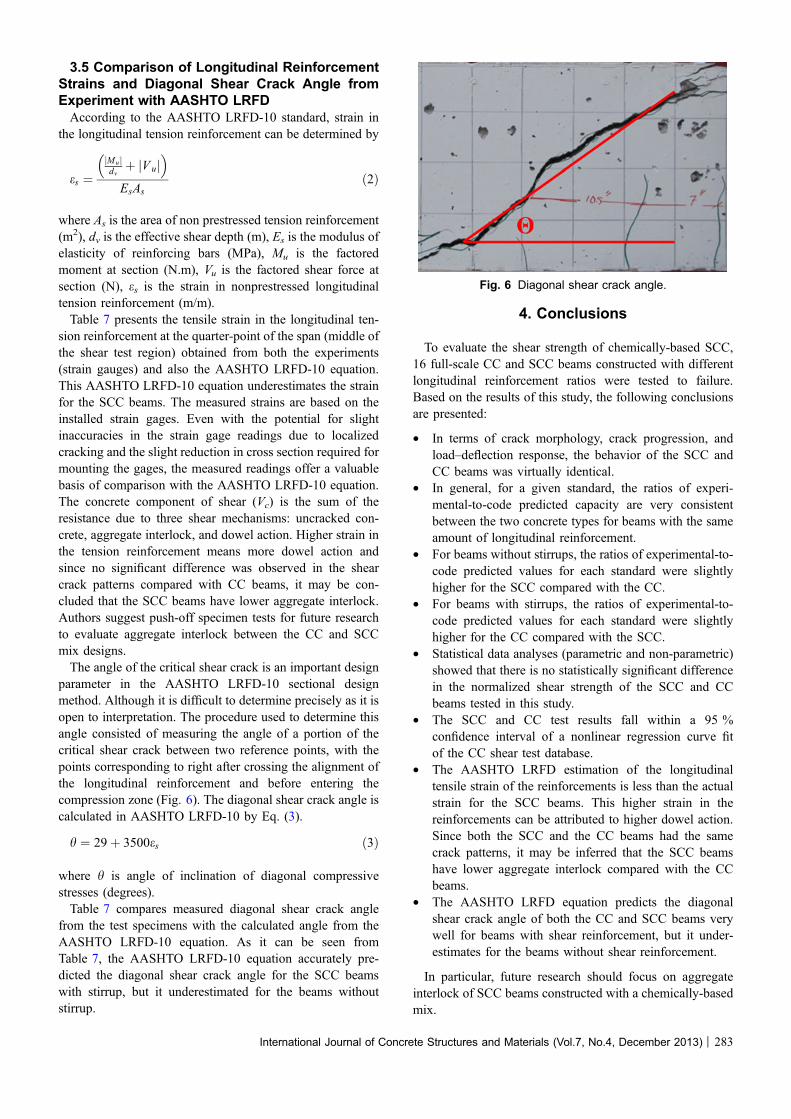
parameter in the AASHTO LRFD-10 sectional designmethod. Although it is difficult to determine precisely as it isopen to interpretation. The procedure used to determine thisangle consisted of measuring the angle of a portion of thecritical shear crack between two reference points, with thepoints corresponding to right after crossing the alignment ofthe longitudinal reinforcement and before entering thecompression zone (Fig. 6). The diagonal shear crack angle iscalculated in AASHTO LRFD-10 by Eq. (3).
h ¼ 29þ 3500es ð3Þ
where h is angle of inclination of diagonal compressivestresses (degrees).Table 7 compares measured diagonal shear crack angle
from the test specimens with the calculated angle from theAASHTO LRFD-10 equation. As it can be seen fromTable 7, the AASHTO LRFD-10 equation accurately pre-dicted the diagonal shear crack angle for the SCC beamswith stirrup, but it underestimated for the beams withoutstirrup.
4. Conclusions
To evaluate the shear strength of chemically-based SCC,16 full-scale CC and SCC beams constructed with differentlongitudinal reinforcement ratios were tested to failure.Based on the results of this study, the following conclusionsare presented:
• In terms of crack morphology, crack progression, andload–deflection response, the behavior of the SCC andCC beams was virtually identical.
• In general, for a given standard, the ratios of experi-mental-to-code predicted capacity are very consistentbetween the two concrete types for beams with the sameamount of longitudinal reinforcement.
• For beams without stirrups, the ratios of experimental-to-code predicted values for each standard were slightlyhigher for the SCC compared with the CC.
• For beams with stirrups, the ratios of experimental-to-code predicted values for each standard were slightlyhigher for the CC compared with the SCC.
• Statistical data analyses (parametric and non-parametric)showed that there is no statistically significant differencein the normalized shear strength of the SCC and CCbeams tested in this study.
• The SCC and CC test results fall within a 95 %confidence interval of a nonlinear regression curve fitof the CC shear test database.
• The AASHTO LRFD estimation of the longitudinaltensile strain of the reinforcements is less than the actualstrain for the SCC beams. This higher strain in thereinforcements can be attributed to higher dowel action.Since both the SCC and the CC beams had the samecrack patterns, it may be inferred that the SCC beamshave lower aggregate interlock compared with the CCbeams.
• The AASHTO LRFD equation predicts the diagonalshear crack angle of both the CC and SCC beams verywell for beams with shear reinforcement, but it under-estimates for the beams without shear reinforcement.
In particular, future research should focus on aggregateinterlock of SCC beams constructed with a chemically-basedmix.
Fig. 6 Diagonal shear crack angle.
International Journal of Concrete Structures and Materials (Vol.7, No.4, December 2013) | 283

Due to the limited nature of the data set regarding aspectratio, mix designs, aggregate type and content, etc. investi-gated, these results cannot be generalized and the researchersrecommend further testing to increase the database of SCCtest results.From a financial perspective, the SCC mixes cost
approximately 3 % more than the CC mixes due to the costof the chemical admixtures. The structural benefits of thistype of approach to SCC would need to be balanced againstthis additional material cost.
Acknowledgments
The authors gratefully acknowledge the financial supportprovided by the BASF and the National University Trans-portation Center at Missouri University of Science andTechnology (Missouri S&T). The authors would also like tothank the support staff in the Department of Civil, Archi-tectural and Environmental Engineering and Center forInfrastructure Engineering Studies at Missouri S&T for theirefforts. The conclusions and opinions expressed in this paperare those of the authors and do not necessarily reflect theofficial views or policies of the funding institutions.
Open Access
This article is distributed under the terms of the CreativeCommons Attribution License which permits any use,distribution, and reproduction in any medium, provided theoriginal author(s) and the source are credited.
References
American Concrete Institute ACI Committee. (2007). Self-
consolidating concrete ACI 237R-07. Farmington Hills,
MI: American Concrete Institute.
Bendert, D. A., & Burgueno, R. (2006a). Report on the
experimental evaluation of prestressed box beams for SCC
demonstration bridge. Research Report CEE-RR-2006-01,
Department of Civil and Environmental Engineering,
Michigan State University, East Lansing, MI.
Bendert, D. A., & Burgueno, R. (2006b). Report on the pro-
duction of prestressed box beams for SCC demonstration
bridge. Research Report CEE-RR-2006-02, Department of
Civil and Environmental Engineering, Michigan State
University, East Lansing, MI.
Burgueno, R., & Till, R. (2005). Special provision for produc-
tion of prestressed beams with self-consolidating concrete.
Internal Report, Michigan Department of Transportation,
Lansing, MI.
Choulli, Y. & Mari, A. R. (2005). Shear Behaviour of full scale
prestressed I beams made with Self Compacting Concrete:
Proceedings Second North American Conference on the
Design and Use of Self-Consolidating Concrete and the
Fourth International RILEM Symposium on Self-Com-
pacting Concrete (CD-ROM). Chicago, IL.
Collins, M. P., & Kuchma, D. (1999). How safe are our large,
lightly reinforced concrete beams, slabs, and footings? ACI
Structural Journal, 96(4), 482–490.
Daczko, J., & Vachon, M. (2006). ‘‘Self consolidating concrete
(SCC), significance of tests and properties of concrete and
concrete-making materials,’’ STP 169D (pp. 637–645).
West Conshohocken, PA: ASTM International.
Das, D., Kaushik, S. K., Gupta, V. K. (2005). Shear resistance
of self-compacting concrete: Proceedings Second North
American Conference on the Design and Use of Self-
Consolidating Concrete and the Fourth International RI-
LEM Symposium on Self-Compacting Concrete (CD-
ROM). Chicago, IL.
Dymond, BZ. (2007). Shear strength of A PCBT-53 girder
fabricated with lightweight, self-consolidating concrete.
MS Thesis, Virginia Tech, Blacksburg, VA.
Dymond, BZ., Roberts-Wollmann, CL., & Cousins, T. E.
(2009). Shear strength of a PCBT-53 girder fabricated with
lightweight, self-consolidating concrete. Rep. No. 09-
CR11, Virginia Transportation Research Council (VTRC):
Charlottesville, VA.
Dymond, B. Z., Roberts-Wollmann, C. L., & Cousins, T. E.
(2010). Shear strength of a lightweight self-consolidating
concrete bridge girder. Journal of Bridge Engineering
ASCE, 15(5), 615–618.
Hassan, A. A. A., Hossain, K. M. A., & Lachemi, M. (2008).
Behavior of full-scale self-consolidating concrete beams in
shear. Cement and Concrete Composites, 30(7), 588–596.
Hassan, A. A. A., Hossain, K. M. A., & Lachemi, M. (2010).
Strength, cracking and deflection performance of large-
scale self-consolidating concrete beams subjected to shear
failure. Engineering Structures, 32(5), 1262–1271.
Okamura, H. (1997). Self-compacting high-performance con-
crete, Concrete International, pp. 50–54.
Ozawa, K., Maekawa, K., Kunishima, M., & Okamura, H.
(1989). Development of high performance concrete based
on the durability design of concrete structures: Proceedings
of the Second East-Asia and Pacific Conference on Struc-
tural Engineering and Construction (EASEC-2). Vol. 1, pp.
445–450.
Reineck, K. H., Kuchma, D. A., Kim, K. S., & Marx, S. (2003).
Shear database for reinforced concrete members without
shear reinforcement. ACI Structural Journal, 100(2), 240–
249.
Taylor, H. P. J. (1970). Investigation of the forces carried across
cracks in reinforced concrete beams in shear by interlock of
aggregate. Cement and Concrete Association, London,
Technical report 42.447.
Taylor, H. P. J. (1972). Shear strength of large beams. Journal of
the Structural Division ASCE, 98(ST11), 2473–2489.
Taylor, H. P. J. (1974). The fundamental behavior of rein-
forced concrete beams in bending and shear American
Concrete Institute, Shear in Reinforced Concrete, SP-42,
pp. 43–77.
284 | International Journal of Concrete Structures and Materials (Vol.7, No.4, December 2013)
Vecchio, F. J., & Collin, M. P. (1986). The modified compres-
sion field theory for reinforced concrete elements subjected
to shear. ACI Structural Journal, 83(2), 219–223.
Wilson, N. D., Kiousis, P. (2005) High-strength SCC in shear:
Proceedings Second North American Conference on the
Design and Use of Self-Consolidating Concrete and the
Fourth International RILEM Symposium on Self-Com-
pacting Concrete. Chicago, IL.
International Journal of Concrete Structures and Materials (Vol.7, No.4, December 2013) | 285