vol. 8 no. 2 november, 2016 - atharva. 8 no. 2... · atharva college of engineering ground station,...
TRANSCRIPT

Vol. 8 No. 2 November, 2016Vol. 8 No. 2 November, 2016

th 17 Jan. 2015 “Putting India Back On A High Growth Trajectory”
rd Seminar Hall 3 Phase, AET campus, Malad(W)
Annual seminars-th12 Annual Conclave

Greetings !!!
In a short span of time , Atharva Group Of Institutes have pioneered number of initiatives in the sphere of education, setting up new standards and benchmarks of performance. We have a world class infrastructure and a culture of excellence, providing a most conducive learning environment.
Along with a robust infrastructure, an environment of learning we encourage, support and motivate initiatives in exploration, research , technology and innovation. Atharva College Of Engineering ground station, is one of the first functional station capable of receiving and processing data sent by “Pratham”, an IIT Bombay satellite successfully launched by ISRO. We have supported and motivated our ground station team.
Last year our PGDM students visited South Korea, this year they have visited China. Today we live in the VUCA world.(where volatility, uncertainty, complexity and ambiguity is constant)It is important to have a global outlook. Every professional should be comfortable with diversity.(diverse processes, diverse people, diverse cultures) Our management programmes are more industry focused with local and global perspectives. Atharva's B-school has been ranked among top 100 in the IIMS B-School survey 2015 by Higher education Business Today. We have also achieved milestones in Hotel Management and Catering Technology, Fashion, Information Technology, School Of Drama And Performing Arts, Film And Television etc. This Journal Of Management Research provides an insight into a wide range of topics of varied interests. We solicit your scholarly contributions of articles, research papers, case-studies in accelerating the process of learning. - Happy Reading
My Best Wishes To All!
1

Vol. 8 No. 2
November, 2016
In the current economy, the main objective of the modern progressive society is no longer limited to the fulfillment of the basic needs, but it has evolved into empowerment and further all inclusive growth and development of its human capital.
In today's knowledge -driven society and with the aging population in the developed countries, India with its huge youth population is expected to become global powerhouse of human capital by 2025.By focusing on training and quality vocational education and skilling, a quality source of skilled manpower can reap rich dividends for our nation.
With the new age disruptive technologies, Big Data has become an indispensible part of business. According to Mckinsey research ,US will experience an acute shortage of skilled data scientists. Data science professionals are crucial in adding value to businesses in domains like marketing, banking, manufacturing, retail etc In the Indian context, there is excitement in the companies about big data and data science within organizations.
Another buzzword in modern times is “Diversity” and organizations are trying to seek talented women , in order to correct the gender disparity ratio. It is the right time for experienced women on a break to make a comeback and aspire to be tomorrow's leaders.
This issue of 'ATHARVA” Journal provides a plethora of select thoughts to ruminate upon.
Wishing You All “HAPPY READING”!!!
2
Atherva Group of Institutes

1.
............... 4
2. Spectrum Sharing – A step towards Digital India
- Priyanka Kumari ................................................................................. 21
3. Women: Peace And Power
- Ms. Sushma Rani & Ajeet Kumar Mishra .... 28
4. Walkability of School Children in Borivali, Mumbai
- Sumant Sovani & Dr. Arun Bhole ................................................ 38
5.
............... 54
6.
............................................ 60
7.
.................................................................. 66
8. Women Empowerment in Modern India : Role of Law
- Dr. Chandrashekhar V. Joshi ................................................. 76
Consumer Perception towards Global products :
The magnitude of Trademark in the Global market place and
the creation of Brands - Ms. Nazima Munshi Kanse .
.....................
A Study on Market Share And Factor Influencing The Choice
Of Cellular Service Provider Among Young Age Group Of
Mumbai-Kandivali Suburb - Dr. Reshma Ashok Vaja
Indians And The Work Life Balance
- Dr. V. S. Kannan Kamalanathan
Impact of Global Slow Down on Manufacturing Sector in India
- Samita Sengupta
Vol. 8 No. 2 November, 2016
3

Consumer Perception towards Global products : The magnitude of Trademark in the
Global market place and the creation of Brands
Ms. Nazima Munshi Kanse
(Research Scholar,Asst.Prof.NMIMS , Mumbai)
ABSTRACT The term intellectual property refers broadly to the creations of the human mind. Intellectual property rights protect the interests of creators by giving them property rights over their creations. Modern business is more and more concerned about building and sustaining competitive brands as it their identity in the market and their corporate image is than based on them. Whereas the market players need to realize that a brand is nothing else but trademark which is a legal terminology given to it. Apple, Google, Microsoft, Coca-Cola, Vodafone - branded products can be seen everywhere around us, all the time. Each of these words reflects much more than what the mere word reflects. The words stand for a BRAND - a differentiator, a source of identity, a promise to the customer, in short - a perceptual entity rooted in reality. Brands have become increasingly important components of culture and the economy, now being described as cultural accessories and personal philosophies.
KEY WORDS: Intellectual Property, Trademarks, Brands, Consumer, Global, Market
Intellectual property protection has emerged as an important component of national economic policies. Governments face choices on how to design an IP system that best serves their policy objectives. They also need to respond to changes in technology and in business models that may challenge the status quo. WIPO seeks to contribute to a better understanding of the economic effects of different IP policy choices and to offer a first entry point for anyone seeking information on the economics of IP.
It can be seen from the brief of various IP Rights set above, there have been no clear guiding principles justifying the creation of new rights or the expansion of existing ones, and the boundaries between one right and another are sometimes defined. In the main, the rights have developed in response to a perceived market need, more often in response to continued lobbying than to academic argument.
Consumers tend to have strong preferences for which smart phones offers the best functionality, which airlines provide the best service, which fashion accessories garner the most attention from friends and colleagues. Brands are an important aspect of everyday life.
Brands help consumers to exercise their preferences in the marketplace. They come with a reputation for quality, functionality, reliability and other attributes, ultimately enabling
4

consumers to exercise choice in their decision-making. Equally important, they come with a certain image – whether for luxury, trendiness or social responsibility – which consumers care about, and which in turn influences decision-making on which goods and services consumers purchase.
Today, investments in intangible assets often exceed investments in physical assets at the company level and at the country level. These intangibles have become a primary source of value creation and wealth.
The importance of brands – and thus trademarks – as intangible assets is universally acknowledged by both business practitioners and the marketing literature. Research provides evidence for the positive impact of strong brands and customer loyalty on company value, revenues and profits. Good reputation and image builds customer loyalty and the ability to acquire a price premium. In addition, a company can use the reputational advantage of a brand not only to extract a premium price, but also to grow market share – and therefore its revenue stream – at the expense of its competitors.
All customer-facing aspects of a company's performance – including product quality, production innovation and the underlying technology, product design, product cost, managerial know-how, human capital in the company, research, service and other issues – have an impact on brand value, as well as on the company's image and reputation. The alignment of performance with customer expectations is central to maintaining brand value. One such example is the hotel industry, where reputation is built over a long period and is based on promotional efforts, and, importantly, is also based on excellence in management, operations and other business functions.
Customers will expect a certain quality level; if disappointed, this will have a negative impact on the brand value itself. A brand owner will have to closely monitor the use of his or her brands.
Trademark protection is traditionally justified as a means of protecting the trade with which the mark is associated, as an incentive to manufacturers to develop new guarantees (in economic terms) of quality and origin to consumers. Protection from confusion as to its origin is, thus in the interests of both the consumer and the manufacturer and is regarded as one of the central tenets of trademark protection. Brands like designs are social phenomena that have evolved as a consequence of developments in the marketplace. Whereas brands to marketers are an entity, as a collection of attributes each of which may to be protected by different IP rights. Where third parties seek to imitate aspects of a brand lawyers are left grappling for the rights out of traditions developed for completely different purposes. As we have seen, IP rights are very much the product of their own histories. Although trademark registration may initially have been designed to protect branded products the manner in which brands have developed; since 1875 has meant that there is now significant difference between a registered trademark and a branded product. The term “trademark” when referring to the specific instrument of intellectual property (IP) protection; the term “brand” is employed for more general discussions on the use of product and business identifiers in the market place
5

What is a brand? What is a trademark? Is there a difference?
Everyday discourse often treats the English terms “brand” and “trademark” as synonyms. Dictionary definitions of these two words confirm their close relation, but point to some differences.
The Agreement on Trade-Related Aspects of Intellectual Property Rights (TRIPS), as part of the agreement establishing the World Trade Organization (WTO), defines a trademark as a “any sign, or any combination of signs, capable of distinguishing the goods or services of one undertaking from those of other undertakings, shall be capable of constituting a trademark”.
The grant of exclusive rights, however, has to be balanced against society's desire for free and unfettered competition. If the balance is not right it can lead to cycles of over and under protection, which are they counterproductive. The statement of contention being that whether the balance is appropriate and thisneeds to be continually reviewed in the light of the 'economic needs of the country and the prevailing sense of what is justifiable'. It is with this in mind that we now turn to consider how brands are currently protected in practice in the UK.
The marketing literature and the business community in turn stress the distinct significance of brands. In particular, they emphasize the image and reputational value of brands. To the business community and to marketing scholars, a brand is clearly more than a trademark alone. Brands are not merely viewed as instruments for differentiation, but relate to consumer perceptions, determining brand loyalty, brand awareness and brand associations.
As for instance, defined a brand as a 'reputational asset' which has been 'developed over time so as to embrace a set of values and attributes', resulting in a 'powerfully held set of beliefs by the consumer' and a range of other stakeholders”. Brand value thus comprises the collection of past experiences and perceptions that the enterprise stands for, including for employees, customers, investors, suppliers and society as a whole. Brands thus distil the meaning and value of other intangible assets of the company into one meaningful identity.
http://www.wipo.int/export/sites/www/freepublications/en/intproperty/944/wipo_pub_944_2013.pdfThe Merriam-Webster Dictionary defines a “brand” as, among other things: “3 a (1): a mark made by burning with a hot iron to attest manufacture or quality or to designate ownership (2): a printed mark made for similar purposes: trademark 4a: a class of goods identified by name as the product of a single firm or manufacturer: make b: a characteristic or distinctive kind: 'a lively brand of theatre' c: brand name” It defines a “trademark” as:“1: a device (as a word) pointing distinctly to theorigin or ownership of merchandise to which it is applied and legally reserved to the exclusive use of the owner as maker or seller 2: a distinguishing characteristic or feature firmly associated with a person or thing 'wearing his trademark bow tie and derby hat'”.TRIPS, Section 2, Art. 15. See also (WIPO, 1993).Rodney Ryder, Trademarks, Advertising and Brand Protection, , 2006, MacMillan pg 85-86Faust, W.H., & Eilertson, A. (1994). “You've got a logo, you need a brand”. ABA Banking Journal, 86(86-88).Moore (2012) notes that a brand collects, assembles, associates and articulates the meaning from other intangibles of the firm “into a highly faceted and nuanced entity and complex identity that distils meaning and creates brand equity”.
6

As a consequence, multiple competencies and business functions at the company level – as opposed to marketing and advertising alone – contribute to brand value and brand.
Similarly, not only trademarks but also other IP forms, such as industrial designs, patents, copyrights and others, contribute to brand value.
Trademarks and the advertising of brands have an extensive, related history and have exerted authority on the way reputation and representations are built. Trademarks gratify the need for producers to recognize their products to the consumer, whereas advertising satisfies the craving of producers to make their products valued and demanded by consumers.
The use of distinctive signs existed in the ancient world, even when goods or services were acquired from local producers – and long before the rise of a formal, legally grounded trademark system. In fact, the use of distinctive, visual marks can be traced back thousands of years; they can be found on pottery, porcelain and swords dating from ancient Greece and the period of the Roman Empire, and also on goods produced by Chinese and Indian craftsmen in ancient times.
In addition to these early examples of the use of visual marks, one can identify three later timelines in history when distinctive marks were used extensively. The first of these was the Middle Ages, which saw the development of more intense long-distance cross-border trade. The second was the Industrial Revolution, which saw the creation of mass markets and the rise of advertising. The third timeline is today's globalized economy, spurred by a brand-driven market and the Internet.
Trademarks and the advertising of brands have a long, related history and have exerted influence on the way reputation and images are built. Trademarks satisfy the need for producers to identify their products to the consumer, whereas advertising satisfies the desire of producers to make their products valued and demanded by consumers. The use of distinctive signs existed in the ancient world, even when goods or services were acquired from local producers – and long before the rise of a formal, legally grounded trademark system. In fact, the use of distinctive, visual marks can be traced back thousands of years; they can be found on pottery, porcelain and swords dating from ancient Greece and the period of the Roman Empire, and also on goods produced by Chinese and Indian craftsmen in ancient times.
In the Middle Ages, the emergence of international trading networks, more complex distribution channels and intermediaries created the need to verify quality and to build trust through the use of signs associated with particular producers. In guilds in the Middle Ages, craftsmen and merchants affixed unique, observable traits to goods, in order to distinguish their work from the makers of low quality goods, and also in order to maintain trust in the guilds. In the absence of a formal trademark system, this allowed guilds to prevent the sale of low-quality products and to build a reputation for the guilds. Good reputations assuaged consumers' fears about purchasing products with hidden defects, and encouraged consumption of manufactured merchandise. The cost to counterfeiters of
7

copying products increased.
With industrialization, trademarks started to play an even more important economic role. While industrialization delivered benefits as a result of specialization and economies of scale, it also meant that consumers became even more distanced from producers than had been the case in Medieval times. With the addition of many more steps between producers and sellers, the greater transactional distance created increased incentives for producer identification. Gradually, the modern trademark system emerged; it contained provisions such as making it illegal to copy somebody else's trademark, and it also focused on preventing fraud.
th thDuring the 19 century and early 20 century – by which time 'marks of origin' had become a well-established practice – trademark laws were passed in a number of countries.
For policymakers, it is important to understand the ways in which branding activities interact with the broader economy. Branding investments affect consumer welfare and, in the long term, can influence the rate of economic growth. In addition, governments have some influence on the branding activities of companies – including through the protection of trademarks. In order to promote consumer choice and maintain vibrant competition in the marketplace, governments need to assess the effectiveness of existing policies and adapt them in light of the evolving needs of the marketplace and new evidence on the behaviour of companies and individuals.
This research article deals with it in three ways. First, it sets the scene by describing key trends and patterns of branding activity across the globe. Second, it reviews the role of trademarks – the form of intellectual property (IP) that protects the exclusivity of brands – and presents evidence informing trademark policy choices. Finally, it explores how branding activities affect market competition and innovation, thus relating branding to broader company. Globalization and technology have left their mark on branding.
While informal forms of branding already played some role in long-distance cross-border trade during the Middle Ages, it was the creation of mass markets during the Industrial Revolution that made branding a core element of economic activity. Overall, three interrelated trends stand out:
First, globalization and the rise of the Internet have prompted brands to more easily transcend national borders. At the same time, companies in low- and middle-income economies increasingly seek to develop their own brands – or to acquire them from abroad.
Second, today, rather than just advertising a product, companies work to create and deliver a “brand experience” for the consumer. Companies increasingly have to manage not only product quality, but also their reputation as good global citizens, paying attention to how socially and environmentally responsible they are perceived to be.
8

Third, brand communication takes place through a larger number of more fragmented, frequently changing and more interactive channels. In addition, the increasing availability of detailed customer data harbours the promise of more targeted and thus more efficient branding strategies.
Fourth, branding is no longer the purview of companies alone. Increasingly, individuals, civil society organizations, as well as governmental and intergovernmental organizations are adopting an active approach to branding.
A trademark is defined u/s 2(1) (zb) under The Trademarks Act, 1999. It can be understood as a sign capable of distinguishing the “goods” or “services” produced or provided by one enterprise from those of other enterprises. The concept of “goods” refers to products (for example shoes or computers) on which the trademark can be physically affixed, directly or by means of labels or packaging, while the notion of “services” refers to activities of an intangible nature (such as financial, banking, travel or advertising).
Any distinctive words, letters, numerals, drawings, pictures, shapes, colours, logotypes, labels or combinations used to distinguish goods or services may be considered a trademark. In some countries, advertising slogans are also considered trademarks and may be registered as such at national trademark offices. Thus the three main essentials of trademarks: i) it should be a mark; ii) it should be capable of being represented graphically; and iii) it should be capable of distinguishing the goods or services of one person from those of others.
Trademarks provided are merely the secondary identifiers of origin but granting exclusivity for such features by providing for their registration prevents the rival traders from making their product similarly attractive. It is to grant a limited, but nevertheless quite significant, form of monopoly over a selling feature. Additionally, the new trademark forms bear a high potential of innovative goods and services. Therefore, a growing market also needs an innovative interpretation of the law. A trademark instead facilitates the customers to identify product/services from one enterprise from that of others and the distinctive character of a mark has to be evaluated in relation to the goods or services to which the mark is applied.
A trademark usually performs the following four major functions:
It identifies the goods / or services and its origin and distinguish them from goods sold by others; It guarantees its unchanged or equal level of quality; it signifies that all goods bearing a particular trademark comes from a single source;
It acts as a prime instrument in advertising and selling the goods/services.
Thus the main functions of a trademark can be together said as identification, source, quality and advertising.
9
Thus now In India, trademarks are protected under The Trademarks Act, 1999. The trademark law primarily serves two important purposes:
1) It protects the public from confusion and deception by identifying the source of origin of particular products as distinguished from other similar products; and2) It protects the trademark owner's trade and business as well as the goodwill which is attached to his trademark.
Branding has a long history, both in India and around the world. The words 'brand' is derived from the word 'brandr', a word used by early Norse tribesmen meaning 'to burn', as in branding livestock to declare ownership. Ancient people around the world used marks to identify and classify objects for some of the same reasons that motivate the use of trademarks today. Although protecting trademarks is a relatively recent legal development, trademarks precursors predate written history and even writing itself.
Certain definitions of brand, which try and explain it, are as follow: Philip Kotler, the marketing guru has defined brand as 'a name, term symbol or design, or a combination of them which is intended to identify the goods or services of one seller to differentiate them from those of others'. Brands enable consumers to identify products or services, which promise specific benefits. They arouse expectations in the minds of customers about quality, price, purpose and performance. A brand stands out from commodities because commodities lack identity. Brands therefore command a price premium. For a Pc manufactured by a MNC, a consumer will have to shell out much more than what he would have paid to buy that PC from the unorganized sector.
The American Marketing Association (AMA) defines a brand as a "name, term, sign, symbol or design, or a combination of them intended to identify the goods and services of one seller or group of sellers and to differentiate them from those of other sellers.
According to Rita Clifton, CEO of Interbrand Newell and Sorrell- a leading specialist brand consultancy firm – a brand is: 'a mixture of tangible and intangible attributed symbolized in a trademark, which, is properly managed, creates influence and generates value'.
As a consequence, multiple competencies and business functions at the company level – as opposed to marketing and advertising alone – contribute to brand value and brand similarly, not only trademarks but also other IP forms, such as industrial designs, patents, copyrights and others, contribute to brand value.
Trademarks and the advertising of brands have an extensive, related history and have exerted authority on the way reputation and representationare built. Trademarks gratify the need for producers to recognize their products to the consumer, whereas advertising satisfies the craving of producers to make their products valued and demanded by consumers.
This definition truly captures the essence of a brand, and highlights the importance of
10

brand management. Branding is about creating 'value', both for customers, and for company. This value stems from the products and services that companies create and bring to the market, but extends further to encompass added values derived from factors such as the brand-customer relationship, the brand's emotional benefits, and its self-expressive benefits. Other common descriptions of a brand include – a 'relationship, a 'reputation', a 'set of expectation' and a 'promise'. It is a company's promise to consistently deliver a specific set of features, benefits and services to customers.
Thus, it can be summarized that a brand are basically 'richlyendowed entities'. They start life as ideas, making their way intoplanning and strategy documents, yet ultimately reside as consumer perceptions. For some companies, brands are their most valuable asset. The space a brand occupies inside a customer's head can create a 'mental' patent, which grows out of the cumulative memory and the experiences customers have of products or services. Assuch, brand building is about creating value through the provision of compelling and consistent customer experience that satisfies customers and keeps them coming back.
However, branding was by no means the only trademark forerunner. As and when people began to make more sophisticated goods and engaged in far-flung commerce, trademarks proliferated in several ancient civilizations. Some items continued to bear marks with a more personal or historical rather than strictly commercial significance. Further indicating the origin of manufactured goods took on an expanded importance as trade increased and purchasers were less and less likely to interact with the artisans who had made the things they bought. A source mark imprinted on the object itself helped consumers to remember the makers of goods that had previously proven satisfactorily.
When a person attaches a particular identification mark, or a brand or a name on a trademark to the wares, commodities or goods in such a manner as would create an impression in the minds of the public that these are the articles of manufacture by the person, he acquires the right to prevent others from selling similar goods. Thus, the manufacturer has the exclusive rights in the trademark, thereby creating a property in the trademark. It is true that this property, like property in goodwill is a very evanescent character, yet it is one of great value.
The property in the trademark is of a transitory nature. The enforcement of the right to the exclusive use of the trademark will depend upon continued use of the mark by the proprietor. It is also necessary that he should prevent other from using the mark might result in the mark becoming common to the trade. From the definition of brand mentioned above and as per the explanation of trademark stated before we can say that a brand is no different from what a trademark is. Globalization has increased brand awareness.
In India and many business houses are now becoming brand focused. It may at this stage be useful to 'unravel' the terminology that is used when the subject of brands is discussed. Terms like trademark, trade name, service mark, brand name, and corporate name are common parlance to legal and marketing people; frequently they are used interchangeably. Yet they do have different meanings, and rather more precision in their
11

use would be widely beneficial.
The following glossary may help:A trademark is a name, a sin or a symbol which is used to distinguish the products or services of an individual or enterprise from those of others
A brand is a trademark, or combination or trademarks, which through promotion and use has acquired significance over and above its functional role of distinguishing the goods or services concerned.
It is important to understand a trademark's function of showing the identity of a company and its corporate family. A company must have its trademarks used in a full and accurate manner to show its own identity.
For example, if counterfeit goods entered the market, it would be difficult to clearly distinguish between such counterfeit goods and the genuine article, and therefore, even the trademark owner may not be able to ascertain, at the request of the customs authorities, whether particular goods are counterfeit or genuine. A number of cases have occurred in which the customs authorities have exposed particular goods as counterfeit goods on the grounds that the mark the goods bore varied slightly, only to for the fact that the goods were manufactured by an overseas subsidiary of the trademark holder to be revealed. A trademark management system that can confuse the trademark holder will certainly mean that the customs authority will be at a loss regarding how to deal with any request to detect counterfeit goods.
Apart from wilful infringement involving counterfeit goods, the trend in the business world is toward any successful product being faced with competitors' products bearing an unmistakable likeness coming onto the market in waves. This may be only proper because companies' recurrent efforts to make their product resemble the most successful products promotes business competition, and goes toward the goal of making better products and leading to expansion of the industry. Under such cutthroat competition, what you can count on to protect your company is intellectual property.
Although the term “intellectual property right” is used as a general term in much the same way around the world, Intellectual property right and patent right, design right, trademark right and copyright as included therein are defined by the laws of relevant countries, and should be technically construed in accordance therewith. To put it simply, it should be noted that the definition of the term “intellectual property right” still varies from country to country.
Although times have not yet changed to the extent that all countries around the world are regarded as playing in the same game, the world economy has moved into an age of broad-ranging relationships in which multiple countries constitutes one single market.
Even with all active cross-border traffic of goods, the intellectual property system is still essentially operated on a country-by-country basis.
12

CASE STUDY: APPLE INC.
Since its foundation in 1976, Apple has grown from a small business selling computers into one of the most successful and valuable brands in the entire world. Consumers everywhere perceive the brand as being one of the very best because of their groundbreaking product lines, their successful marketing programs, and their ability to differentiate themselves among other competing brands. These elements and attributes are the core aspects that make up Apple's brand equity.Apple has always been known for releasing innovative, user-friendly products that have become extremely popular in the market. They are a dominant force in the market for consumer electronics, and their merchandise is in extremely high demand. Secondly, their very successful marketing and distribution strategies are able create consumer perceptions that make Apple's brand a highly reputable icon. Through these core elements and attributes, Apple as a brand has seen its value skyrocket over the years. By continuing to implement and improve on these successful programs and strategies, Apple's brand equity will continue to grow and flourish in the future of the company.
Brand attributes:Throughout the years, Apple has maintained the high quality and innovation in their products, which make it a different and successful brand. Following are the attributes of Apple which make Apple one of the world's leading brand:
1. Stylish
2. Cool
3. Unique
4. Reliable
5. Innovation
6. Intuitive
7. Multi-tasking
Competitor Analysis:
Following are the major competitors of Apple in the world market:
Blackberry: Blackberry marketed their brand as sophisticated and the latest technology for networking. It is only fitting that they cater to and consistently revolve their advertisements around elite business types.
Samsung: Samsung products are loaded with features that are generally sought out by technology lovers; Samsung places heavy focus on the features and specifications of their products in their commercials. Currently Samsung is the biggest competitor of Apple in smart phones and tablet category.
Dell: Dell has positioned itself in the market as a competitor to Apple with high affordability and user friendly interface. Dell's marketing campaign has always been catered to families and everyone in it. Using the fact that their computers are more
13

affordable than expensive brands such as Apple, Dell focuses their advertisement campaign with an economical approach. Dell is the direct competitor of Apple in the personal computer and laptop category.
Android: Samsung's success and large market share is in fact due to the latest craze for the Android operating system. The Android operating system is used in various different models with a few different vendors such as LG, Sony Ericsson, HTC, and Motorola.
Microsoft: Another direct competitor to Apple would be Microsoft and their latest operating system, Windows Phone 7/8. The Windows phone advertisement campaign revolves around social life and activities
Logo:
have different slogans which describes their importance, benefits, use and creativity of that product and it does so in creative fashion. Several of their slogans often emphasize the innovation of their products. For example, as they use for their App store that "Your iPhone gets better with every new app." the other best example is which they use for their iPad is "Thinner, Lighter, Faster, Face time, Smart Covers. 10 hour battery." Several slogans also state why Apple's products are better than competitors' products (including preceding Apple products). In 2008, the slogan,“Thefirst phone to beat the iPhone” was used to advertise the iPhone 3G. Currently they use slogan for Apple 5 is “The biggest thing to happen to iPhone since iPhone”
Brand licensing is one of the best methods opted by enterprises to exploit brand as their intellectual property. When a company licenses any of its affiliated companies to use a brand, a clear set of standards for licensing should be established. Trademarks vary in the amount of power and value they have in the marketplace.
Brand Elements: Apple's distinguishing symbol is the apple with a bite taken out of it. Although
their logo has changed since the 70's (the rainbow apple to the monochrome apple), the effect on customers is the same. Once they see this icon on a product, that product is associated with all of the perceptions of the Apple brand, such as quality and innovation. The product is immediately perceived as the best of its kind because it has the symbol of the most valuable technology company in the world. So the logo of Apple is the element of their brand.
Packaging: Apple's products are packaged in very simple boxes that are designed to connect with the consumer. On the outside, the design of the boxes is very plain and usually only features a picture of the product. It is opening the box for the first time that makes the package special. There is a department within the company which specializes in designing, packaging and testing which kind of boxes elicit the perfect emotional response on opening. When customers open the box of apple first it become a memorable moment for them, and they want to repeat the same by repurchasing another Apple product.
Slogans: Apple utilizes a variety of slogans to promote their products. For each product line they
14

According to Jean- Noel Kapferer (1992), Trademarks/brands perform several functions that add value and customer benefits:
· Identification- to be clearly seen, to make sense of the offer, to quickly identify sought after products.
· Practically- to save time and energy through identical repurchasing and loyalty. · Guarantee- to be sure of finding the same quality no matter where or when you
buy the product or service. · Opinion- to be sure of buying the best product in the category, the best performer
for a particular purpose. · Characterization- to have confirmation of your self-image or the image that you
present to others. · Continuity- satisfaction brought about through familiarity and intimacy with
trademarks/brand that you have been consuming for years. · Hedonistic- satisfaction lined to the attractiveness of the trademarks/brand, to its
logo, to its communication. · Ethical- satisfaction linked to the responsible behaviour of the trademarks/brand
in its relationship with society.
Whereas the value considerate by a company is different cause establishing a strong trademarks/brand is of vital importance for business success certain such as mentioned below:
· Market share and Profits- Typically a trademarks/brand leader obtains twice the market share of the number two trademarks/brand, and the number two twice the share of the number three
· Leverage – the brand leader benefits from two main leverage effects- higher volume leads to economies of scale in development, production and marketing, and premium pricing increases revenue.
· The value of Niche Trademarks/Brands- Dominating a niche market is usually more profitable than being fifth in a large market.
· Brand/ Trademarks Loyalty and Beliefs- Strong Brands are more attractive to investors. Brands/Trademark loyalty also reduces marketing costs and enables firms to override occasional problems (e.g. Johnson & Johnson with Tylenol)
· The Barrier- Brand/Trademark leaders usually have the financial strength to fend off competitors. Potential competitors are usually reluctant to enter the market if existing Trademarks/Brands satisfy customers. In addition, Brand leaders can exploit their superiority in the market (e.g. Coca-Cola 'the real thing')
· Avenues for growth- the product life cycle applies to products, not trademarks/brands. Companies can maintain a brand while modifying the underlying product to account for new technology, fashion or prevailing market conditions. The trademarks/brand can also be used to penetrate new markets.
· Motivating Stakeholders- Companies with strong trademarks/brands attract good recruits. They also tend to elicit community support.
Thus it can be concluded that creating efficient effects of a strong trademark or in simple words branding is essentially about creating value through the provision of a compelling
15

and consistent offering and customers experience that will satisfy customers and keep them coming back.
Building a strong trademark/brand is a complex task and the brand-building process starts with the development of a strong value proposition. Through the combination of the stimulus of consistent communications and satisfactory usage and experience, brand awareness, confidence, and brand equity are built. Protecting that brand is equally important. Yet many small businesses overlook an important first step in securing their brand: trademarks. With the perspective of an entrepreneur branding his product take a lot of efforts and to sustain that brand position in the market place is more of a requisite than just a formality to protect its brand, brand position, to behold its customers and consumers and prevent others to use its brand name from other and stop unfair trade practices in the market place to the best possible way. Well if you want to build a successful brand, you have to understand divergence. You have to look for opportunities to create new categories by divergence of existing categories. And then you have to become the first brand in this emerging new category.
Several factors contributing to the success of brands have been identified such as follows:A quality product/service Experience: satisfactory experience is the major determinant of brand values. If the quality of the experiences deteriorates, or if the trademark/brand is surpassed by superior offers from competitors, then its position will be undermined.
First- mover advantage- being first into the market does not necessarily mean success, but it makes the task easier. It is easier to capture a share of the consumer's mind and build a customer base, when the brand has no competitors to rival its position. Unique- positioning concept- is the brand is not the innovator; it must have a unique positioning concept – a segmentation scheme, value proposition or augmented brand, which will add value and distinguish it from competition.
Strong communication program - a successful brand requires an effective selling, advertising or promotional campaign, which will communicate the brand's existence, its function and psychological value, trigger trial and reinforce commitment to it. Without building awareness, comprehension and intention to buy, the trademark/brand is meaningless.
Time and consistency- traditionally, trademark/brands were not built quickly. It took years to build up the added values, and establish a trusting relationship.
Building strong trademark/brand stems from the creation of a compelling value proposition. Once the framework has been established and the organization configured to provide this proposition, companies must actively communicate it to the target audience to entice trial. As customers build trust in the brand through satisfaction of use and experience, companies have the opportunity to start building relations with their customers, strengthening the trademark/brand further, and making it more difficult for competitors to emulate. The internet provide the opportunity for companies to create a compelling value proposition never before possible, while providing new tools for
16

promotion, interaction and relationship building. As a result, it has profound impact on the traditional brand- building process.
Just like the invention of the internal combustion engine was instrumental in opening up new markets beyond the manufacturer's immediate locality so also the invention of the personal computer and its subsequent networking through the Internet opened up the frontiers of international trade. Manufacturers can now communicate direct with consumers anywhere in the world and can respond to order placed over the Internet within seconds, and in some cases deliver the goods via the same medium. Whilst the Internet does not necessarily increase supply as such it can enable business to supply goods to bigger market without the need for local presence, and in that sense it increase the availability of products.
It is impossible to recite here all the changes that have taken place during the century that have contributed to the development of the mass market. It took an enormous leap of the imagination for Charles Darwin to visualize his “great tree of life”, a divergence process that took place over hundreds of thousands, even millions of years. We are lucky to live in an era where computers exist. And what an era it has been. In a little more than fifty years, the world has witnessed an astounding array of products and this has lead to string emergence of brands, its positioning, equity and quality in its form and presence which is now addressed more as an asset to an enterprise whose image the trademark/brand represent in the market place.
We are living in an exciting time with regard to Intellectual property. The Internet has emerged as an industrial revolution of sorts, on both the technological and policymaking front simultaneously. Paradoxically, the Internet was created as a communication tool for government and industry, in response to policy, but has emerged as a global medium which now drives global economic development and policymaking. On one hand, the Internet has spawned new and emerging industries related to conducting business on an international scale, having extended the reach and depth of technology and business data acquisition. Yet, on the other hand, it has created opportunities and counter- balancing liabilities related to the disciplines of intellectual property development, enforcement and commercialization.
The Internet is a powerful tool that has already demonstrated its ability to create jobs, advance technology, shorten product life cycles, circumvent international communications barriers, and transcend political and social chasms. Yet at the same time, it has become a tool that has caused the devaluation of some intellectual property almost as much as it has created new value for others. It has caused confusion amongst leading policymakers, and while it has created new business opportunities, it is itself threatening to become an impediment to future economic expansion. Without proper management, the Internet can become 'worthless to the intellectual property community'.
Understanding the historical impacts of the Internet upon IP as a whole, and being able to anticipate technology, information technology, work flow management and IP, value creation is critical if issues like informed, sensible standardization, operations budgets and intellectual asset development and commercialization are to reach its potential.
17

Without properly managing operations to anticipate and meet the new metric brought about The Internet, one's seat at the table of IP prosperity may be lost for generations.
This commerce in intangible products raises a number of issues for intellectual property, in addition to those that would arise in respect of physical goods. For example, there is a growing role to be played by technological measures in protecting the rights of intellectual property owners. In addition, questions of the scope of rights and how existing law applies, jurisdiction, applicable law, validity of contracts and enforcement become more complex when the products offered have no necessary, physical manifestation.
The Internet is a new medium that demands planning, attention and integration. The development may be brought about as follows:
The corporate community must embrace the Internet as a means to complete in a global market place, and must develop an awareness of the potential benefits and its impact on a global basis regardless of its regional strategy, operations and decisions. The increased commercial and IP protection opportunities must be balanced with an inadvertent increase in exposure to infringement claims, increased requirements and costs to assert IP ownership globally, and the higher standard of practice in prior art clearance.
It is incumbent upon every growing company to develop an economic and business strategy associated with patents, trademarks and branding, copyrights, and defensive and offensive intellectual property. Typically, this calls for the creation of an intellectual property manager or specialist whose job it is to become educate with regard to the fast moving landscape of IP on the Internet.
As far as the government and policymakers are concerned, they should plan on continually increasing the number of patent and trademark applications, and understand the financial and operational impact of accelerating intellectual property activity.
It is recommended that the majority of budget and efforts be put on an exclusive content. Since there are many websites which continually monitor the Internet for IP related resources, and keep their hypertext links current and active, it is a poor use of budget currency to develop one's own directory of Internet resources. Without frequent updating, this section will become dated, even out of date, and will likely contain broken links websites change their web address.
CONCLUSION:
The virtual world is a complex parallel universe, where cyber squatting and domain name disputes have become a serious problem today due to unlimited scope of the Internet.
Implementing a comprehensive domain strategy and being vigilant about how your trademarks/brands are represented online is paramount. As the value of a trademark/ brand is of extreme importance not just to the owner of the same but also for its mark of
18
origin, quality and also to protect them from unfair competition and illegitimate activities such as infringement, passing off etc.
The Internet has changed how consumers make new purchases. It has reduced the time input and costrequired to conduct research on potential purchases, and it has simplified how consumers make purchases. How have these factors affected the way firms introduce new products? Are they obliged to introduce more new products at a more frequent rate? In other words, has the Internet changed firms' product life cycle? Has it also changed how firms appropriate their returns on investment in innovation? In the past, firms reported that lead-time advantage was one of the most effective ways to appropriate their returns on investment in innovation. Are branding activities online a better way for firms to improving their chances of securing a return on investment to innovation?
Lastly, assessing a product market power based on its ownership of brand names is not easy. The current methods used to identify the relevant market, and assess whether the product in question has market supremacy, need more rigorous analysis. It would be both appropriate and useful to conduct additional research studies to recognize how best to incorporate determinants of consumers' choices, such as brand reputation and brand loyalty, in these assessments
References:
Aaker, D.A. (1991). Managing Brand Equity. New York: The Free Press.
Aaker, D.A. (2011). Brand Relevance: Making Competitors Irrelevant. New York:
Jossey-Bass.
Cohen, W. M., Nelson, R. R., & Walsh, J. P. (2000). Protecting Their Intellectual Assets:
Appropriability Conditions and Why U.S. Manufacturing Firms Patent (or Not).
National Bureau of Economic Research Working Paper, No. 7552.
Faust , W.H., & Eilertson, A. (1994). “You've got a logo, you need a brand”. ABA Banking
Journal, 86
Faust and Eilertson (1994), Aaker (1995), and Moore (2012).
J Scott Davidson, Intellectual Property for the Internet, pg 3-4
Kapferer, J.N. (2008). The New Strategic Brand Management: Creating and Sustaining
Brand Equity Long Term (4th ed.)
Merriam-Webster Dictionary
Moore, L. (2012). “The Law and the Ultimate Intellectual Asset”. Intellectual Asset
Management, November/December 2012,
Ries Al & Laura, The Origin of Brands, 2004, Harper Collins publisher
Rita Clifton, and Maughan, E, The Future of Brands, 2000,
19

Rodney Ryder, Trademarks, Advertising and Brand Protection, 2006, MacMillan pg 85-
86
TRIPS, Section 2, Art. 15. See also (WIPO, 1993).
V.K. Ahuja, Intellectual Property In India volume 1
Website
http://ipindia.nic.in/tmr_new/default.htm
http://www.wipo.int/export/sites/www/freepublications/en/intproperty/944/wipo_pub_
944_2013.pdf
20

Spectrum Sharing – A step towards Digital India
Priyanka Kumari Asst. Prof. AIMS, Mumbai
Abstract
There has been a phenomenal development in the Indian Telecom industry after India opened up its economy in 1991 and went for Liberalization, Globalization and Privatisation. Telecommunication has emerged as a key driver of economic and social development in an increasingly knowledge intensive global scenario, in which India needs to play a leadership role. There has been an unprecedented growth in the teledensity and simultaneous decline in the call tariffs. From the advent of private players in the market to the present scenario of teledensity of 77%, our country has grown leaps and bounds in term of subscribers and services.
Today, Value Added Services, voice and data, all play a major role in any individual's life right from a vegetable vendor to a businessman. Communication has touched the lives of almost everyone around us. On one hand we want to be connected to our friends and family through phone calls, at the same time, we also want to access seamless data at the highest possible speed.
India is moving towards digitalization at a very fast pace and telecom industry has a very high and significant role to play. But telecommunication requires bandwidth and spectrum and India is one of those countries with a severe spectrum shortage for telecom. In such a scenario, spectrum sharing is a very right step towards improving the state of telecom in India. This article is an attempt to understand the process of spectrum sharing and how it will affect our future in digitalisation.
Keywords – Spectrum, Spectrum Sharing, Telecom, Trai, Mobile Network Operators
Introduction
Our country has the second largest telecom market in the world with an exponential growth in the subscriber base from 10% in the 2004 to 77% in June(TRAI). The urban teledensity has reached higher than the saturation point with 144% penetration while the rural teledensity still seems dismal with just close to 47%.
Indian telecom is a substantial contributor to the GDP of the economy and with the right policies of the government along with deregulation in FDI, has led to the growth of our country exponentially in the mobile sector. The mobile subscriber base is more than 1000 million and as per a study conducted by IDC, India will surpass US by 2017 in the smart
The recent nod of TRAI to spectrum sharing to improve spectral efficiency is a step towards fulfilling the dream of making Digital India a reality.
21

phone market. There has also been a sharp increase in the mobile data traffic generated by 2G and 3 G, mobile broadband service, as per a study by Nokia Networks' Mbit
Private Service Providers hold around 92% market share and the two state run telecom operators (BSNL and MTNL) hold only 8%. This is not good for the further rural telecom market as BSNL infrastructure has deep penetration in rural areas and is still not able to generate revenues or increase the mobile subscriber base. It has to come up with right policies in order to tap the unexplored market in the rural.
The DoT, TRAI and other stakeholders have taken several initiatives towards the development of Indian Telecom. However, there are several quality issues faced at present – high calls drops and low QoS, increased interference and noise, rise in Jitters and packet loss. In a recent move, TRAI has directed the telecom operators to compensate consumers in the event of call drops.
The telecom operators are apprehensive about this direction as they complain of decreasing profit and low ARPU. To lower down the operational expenditure (OPEX) and capital expenditure (CAPEX) of the mobile companies, Passive Infrastructure sharing was allowed long move. The bone of contention - Active Infrastructure sharing i.e. spectrum sharing has also now been allowed by DoT.
Spectrum Sharing
Spectrum are the radiations of different wavelength that are transmitted/broadcasted at certain frequencies. But if signals are broadcasted in an unregulated manner, it will lead to interference which would make the communication very difficult.
In order to prevent this, waves are divided into spectrum (based on frequency) and spectrums are further divided into bands. Spectrums are used for various services like mobile communication, broadcasting, satellite services, radio navigation etc. Telecom Spectrum are those waves which are used to transmit voice and data for communication. Telecom Operators in every country are assigned certain portions of spectrum. Globally this ranges between 400MHz to 4GHz. In India, the range is 800MHz to 2.3GHz. The spectrums used in India are 800MHz, 900MHz, 1800MHz, 2100MHz and 2300MHz. Each of these are suitable for different technologies in telecom like GSM, CDMA and LTE. Beyond this, we have unlicensed bands used for technologies like Wi-Fi and Bluetooth.
Recently a debate is going on the auction of 700MHz spectrum band which has been recommended by TRAI. 700MHz is used in most of the countries worldwide for 4G. However, telecom operators in India are opposing this move due to its high cost and unsuitability to technology. 700 MHz spectrum is important for rolling out high-speed mobile broadband services and help operators offer mobile connectivity in rural areas and semi-urban peripheries. Also, being one of the early adopters of this band, India could produce LTE-enabled devices and export them under the Make in India initiative. The rural penetration of telecoms is still afar sighted dream. One of the key reasons to this
22

is high CAPEX and OPEX. To combat this, passive infrastructure sharing was allowed, also known as tower sharing. However, this did not lead to increase in rural teledensity as expected.
Even in Urban areas, the Quality of Service has deteriorated. QoS refers to the capability of a network to provide better service to selected network traffic and includes other factors like quality of speech, error free transmission capability etc. This is a major parameter is determining the performance of the operators. It is a major differentiator in business market and determines how well a service is. QoS can degrade due to several factors like congestion, caused by traffic overflow, delays caused by retransmission of lost packets, limited bandwidth and shared communication channels.
Of the reasons cited by the telecom operators for increased call drops, spectrum crunch and decreasing ARPU were main. Though the teledensity has increased, there has alsways been issues raised by telecom operators of low profitability. Also, in rural areas, lot of resources are wasted in the form of unused spectrum. This is also due to high dispersal of population in the rural. In order to resolve this, TRAI has recommended spectrum sharing.
Spectrum sharing can be understood as an arrangement and agreement between two telecom service operators to share spectrum, when both of them have access to spectrum in the same band. This makes efficient use of the available resources. This efficiency is in terms of both cost and effort.
Spectrum sharing directly encourages and shapes whole business models, partly by increasing the amount of spectrum; partly by reshaping the value of licensed spectrum and partly by creating space for new business models potential built on either cheaper spectrum or new unlicensed spectrum. (Kim, 2015)
However, there are also certain challenges in spectrum sharing. One needs to make choices in technology to be used. There are probable chances of hoarding and windfall gains. Fragmentation may lead to interference which will further affect the QoS.
Spectrum Sharing in Global Scenario and India
Spectrum sharing is an issue of discussion in almost all the countries. Many countries allow spectrum sharing partly or wholly, with or without constraints. This makes the efficient use of available spectrum and leads to reduced effort, time and expenses for the telecom operators.
US allows spectrum sharing of 150MHz of spectrum in 3.5GHz for mobile broadband. In 2008, Brazil ANATEL issued 4 licences per licensed area for 3G wireless deployment in the entire country. Operators are allowed both passive and active infrastructure sharing.Europe is supporting the use of 2300MHz for licensed shared access to support the growth of mobile broadband. Japan is also considering to ease the regulations of spectrum sharing.
23

China, however, allows neither active nor passive infrastructure sharing in telecom. India has only recently allowed the active infrastructure sharing.
The first recommendation in spectrum sharing was given in 2010 by TRAI. Based on the reviews of DoT, the recommendations were reconsidered and in 2012, guidelines on 2G spectrum sharing were given. Again in 2014, working guidelines were re-issued allowing spectrum sharing to operators having spectrum in the same band. After a tussle, the Union Cabinet gave a nod to the guidelines given by DoT and TRAI and finally the guidelines were issued in 2015.
India suffers for severe spectrum holding shortage. There are only 18MHz available against the global average of 50 MHz Hence, spectrum sharing allows telecom companies to effectively and efficiently use there spectrum and supplement their existing spectrum holding.
Pooling spectrum also allows operators to bring together their fragmented spectrum holdings, resulting in better spectral efficiency and higher throughput. Trai guidelines for spectrum sharing outline a non-linear gain in spectral efficiency with increase in quantum of spectrum available. As an example, 5 MHz of paired spectrum allow GSM operators to carry 33.03 Erlang traffic, while, with a block of 10MHz spectrum the capacity goes up to 138.6 Erlang. (Ey.com, 2016)
TRAI Guidelines – Challenges
1. Sharing in the same band- spectrum can only be shared if both the telecom companies have the necessary spectrum in the same band. Spectrum leasing has not been allowed as it is considered to be spectrum trading in India. For the purpose of charging Spectrum Usage Charges (SUC), licensees shall be considered as sharing their entire spectrum holding in the particular band in the entire LSA.
2. Increase in SuC b 0.5% - the spectrum usage charge (SUC) for operators would increase by 0.5% post sharing, operators would need to balance the potential benefits of sharing against the cost outlay from additional SUC.
3. Spectrum cap 25% -The prescribed spectrum caps, 25% of the total assigned in a circle and 50% in a band, may prove to be conservative and are likely to prevent sharing of spectrum between leading incumbents. Another concern is that the government's decision to restrict the sharing of liberalised and un-liberalised spectrum
4. Technology Deployment - By restricting sharing within the respective bands (i.e. 900 MHz only with 900 MHz and not with 1800 MHz), the recommendations is only an improved version of the intra-circle roaming (ICR) guidelines released by the Department of Telecommunications (DoT) way back in 2008. (Prasad)
5. Infra and Network – inadequate spectrum is the cause for poor coverage and pathetic quality of service
India is in a unique position to be a pioneer in spectrum sharing for the following reasons: (i) India has the requisite number of operators (12-15) to avoid “thinness” in spectrum
24

sharing market (ii) initial allocation of spectrum is inefficient and insufficient and hence sharing is an avenue to promote allocative efficiency and (iii) the absolute number of mobile subscribers and the associated usage is expected to keep demand for network capacity always above supply to warrant optimal utilisation through sharing.(Prasad, 2014)
Recent Developments in Spectrum Sharing
In a recent move, the department of telecommunications (DoT) has approved a spectrum-sharing deal between Anil Ambani's Reliance Communications Ltd (R-Com) and MukeshAmbani's Reliance JioInfocomm Ltd (R-Jio) for faster rollout of high-speed 4G services. R-Com and RTL will share spectrum with R-Jio in nine telecom zones—Mumbai, Uttar Pradesh (East), Madhya Pradesh, Bihar, Orissa, Haryana, Himachal Pradesh, Assam and North-east. In January, R-Jio, which is yet to launch commercial services, signed agreements with R-Com to share spectrum
Further, State-run BSNL is in preliminary discussions with the country's top operator Bharti Airtel for spectrum sharing in four circles and the deal is likely to be finalised by June.
BSNL is looking at sharing spectrum in Rajasthan, UP (West), Bihar and Assam and has formed a committee to look into the feasibility aspect.
Conclusion
Spectrum sharing is definitely expected to bring a major relief to telecom operators in India as it is going to decreases CAPEX and OPEX both for the existing and new operators. It will also increase the spectrum holdings of the telecom operators making it more efficient.
However, this might also be seen as a first step toward the development. The introduction of these guidelines is a step in the right direction for the industry. It can be easily inferred that the policy has a significant role in the digitalisation process of the economy and will help move towards Digital India initiative.
An adequate monitoring of the spectrum requirements and management of frequency allocations to ensure adequate spectrum supply would result in significant positive implications for the mobile industry as a whole as well as the growing number of industries that are increasingly dependent on mobile services. Example industry applications include mobile payment or point of sale solutions, telematics, mHealth, usage-based insurance, utility smart grids, facility and home automation, location based services, and worker productivity apps. This, is turn, could have a positive effect on a country's economy, on the level of employment, and overall competitiveness.
Success in implementing spectrum sharing requires both vision and commitment for moving from current regulatory allocation and assignment practices based on a sound
25

understanding of technology and systems operating under predictable circumstances. Spectrum policies should address incentives for innovation, promote flexibility, establish spectrum users' rights and determine practical methods for compliance monitoring, interference management and dispute resolution.
To summarize, it is clear that the Indian government is committed to a digital transformation through various flagship programs such as Digital India and Smart Cities. There are efforts to extend inclusive and affordable Internet access to every Indian because of a fundamental belief that information communication technologies (ICTs) can empower the masses and become the critical avenue for accessing public services. For these reasons, government Spectrum policy in Indian authorities need to be sensitive to the impact of their decisions on long-term innovation. In order to have a viable digital ecosystem, it is crucial to have policies that promote competition and affordability.
REFERENCES
Anon,(2016). http://trai.gov.in/WriteReadData/Recommendation/Documents/Guidelines%20on%20%20Spectrum%20Sharing.pdf
Anon, (2016). Available at: http://www.gsma.com/spectrum/wp-content/uploads/2014/02/The-Impacts-of-Licensed-Shared-Use-of-Spectrum.-Deloitte.-Feb-20142.pdf
eGov Magazine. (2015). Videocon Telecom in talks to share spectrum in MP, Haryana circles. Available at: http://egov.eletsonline.com/2015/08/videocon-telecommunications-in-talks-to-share-spectrum-in-madhya-pradesh-haryana-circles/
Ey.com. (2016). EY - Spectrum sharing - will pave the way for caring. Available at: http://www.ey.com/IN/en/Newsroom/News-releases/ey-spectrum-sharing-will-pave-the-way-for-caring
Ghosh, S. (2015). Cabinet clears policy on spectrum sharing. http://www.livemint.com/. Available at: http://www.livemint.com/Industry/pX605aZTY1vBryAEDRgiUI/Cabinet-clears-policy-on-spectrum-sharing.html [Accessed 2 May 2016].
Mondaq.com. (2016). Spectrum Sharing: Game Changing Reform - Media, Telecoms, IT, Entertainment – India.
NDTV Gadgets360.com. (2016). Tech 101: What Is Spectrum, and Why Is It Being Auctioned?. [online] Available at: http://gadgets.ndtv.com/telecom/features/tech-101-
26

what-is-spectrum-and-why-is-it-being-auctioned-824721
Nokia Solutions and Networks. (2016). Nokia Networks study in India shows overall 74% increase in mobile data traffic in 2014 | Nokia. [online] Available at: http://networks.nokia.com/in/news-events/press-room/press-releases/nokia-networks-study-in-india-shows-overall-74-increase-in-mobile-data-traffic-in-2014
Prasad, V. (2014). A step forward in spectrum sharing. [online] The Hindu Business Line. Available at: http://www.thehindubusinessline.com/opinion/a-step-forward-in-spectrum-sharing/article6305105.ece
Sanjai, P. (2016). R-Com, R-Jio get DoT nod for spectrum deal. [online] http://www.livemint.com/. Available at: http://www.livemint.com/Money/tjXaFadiTiSY1tLNF47AHJ/RCom-shares-surge-nearly-6-on-spectrum-sharing-deal-with-R.html
timesofindia-economictimes. (2014). Government approves spectrum sharing by te lecom companies ; wi l l ca l l drops fa l l? . [onl ine] Avai lable a t : http://articles.economictimes.indiatimes.com/2015-08-13/news/65523905_1_share-airwaves-mhz-suc
Ujaley, M., Computer, E., Service, E. and Computer, E. (2016). Nokia fledgling India's 4 G e v o l u t i o n . [ o n l i n e ] E x p r e s s C o m p u t e r . A v a i l a b l e a t : ht tp: / /computer. f inancialexpress .com/news/nokia-f ledgl ing-indias-4g-evolution/13835/
27

WOMEN: PEACE AND POWER
Ms. Sushma Rani
Research scholar,
Ajeet Kumar Mishra Asst.Prof. Atharva Institute of Management Studies, Mumbai
ABSTRACTThis paper addresses the conceptual and methodological issues related to women's empowerment, the trends in women's empowerment over the last decades in key areas such as education, health, economic and political participation, and finally the best practices of state and non-state actors in empowering women. Following a brief critique of human development, it begins with a discussion of the growing conceptual consensus around empowerment, i.e., empowerment being control over resources, women's agency, a process and outcomes, specifically focusing on the Gender Empowerment Measure and arguing that minimally the measure needs to move away from its urban, elite, and formal employment bias. The trends in women's empowerment in the past years shows that while there have been gains in primary and secondary education, in political representation at the national level, and in waged labor, and a decline in fertility and maternal mortality, violence against women and HIV/AIDS continue to be endemic and these trends vary across regions and within countries urban and rural poor, ethnic minorities, and older and disabled women fare worse on all indicators with the current economic crisis reversing many gains.
Furthermore, decreases in gender gap do not translate into gender equality and positive trends are often accompanied by negative trends resulting from unintended consequences of development. Finally, it highlights some government best practices such as quotas, cash transfer programs, gender budgeting, and community based micro enterprises, some movement practices, i.e., local women run community based programs to combat violence and HIV/AIDS and transnational exchanges, unions campaigns such as Decent Work for Women and corporate practices such as gender equality seal and corporate social responsibility.
INTRODUCTION
“If you educate a man, you educate a person but if you educate a woman, you educate a nation” by Mahatma Gandhi”.
Education is the heart of all development. It is an essential prerequisite for equality, dignity and lasting peace. Although the Universal Declaration of Human Rights affirms that all human beings are equal in dignity and rights without distinction of any kind including distinction based on sex, it has taken considerable time and effort for the world community to accept women's rights as an integral part of Human Rights. Discrimination against women in access to opportunities still exists in a substantial way. Pernicious
28

social practices such as dowry and dowry-related crimes, female foeticides, female infanticides, child marriages, discrimination against girl child are still prevalent. Education is the weapon which strengthens the personality and makes one confident. Education in earlier days had the privilege of boys and men but now education has been spread all over breaking up the sex-barrier and everyone is concerned about girl education as education is an investment and not an expense which gives its returns in long run.
WOMEN'S EMPOWERMENT AND ITS DISCONTENT
Woman Empowerment is a global issue. This concept of woman empowerment appear to be the outcome of several important critiques, discussion, dialogues and debates generated by the woman movement throughout the world, especially in the third world countries (feminist).To empower women, literally speaking is to give power to women. 'Power' here does not, mean a mode of domination over others, but an exposure of inner strength and confidence to face life, the right to determine one's choice in life, the ability to influence the society and social change, a share in decision making and capacity-building for the sake of national development.
Empowerment, in its simplest form, is manifestation of redistribution of power that challenges patriarchal ideology and the male dominance. It is a process that enables women to gain access to and control of material as well as information resource. It is both process and result of the process. Empowerment is an active process enabling women to realize their full identity and power in all spheres of life (UNDP, 1994).Empowerment is defined as a process which enables individuals or groups to change balance of power in social, economical and political relations in society. The goals of women empowerment are to challenge patriarchal ideology to transform the structures and institutions that reinforce and perpetuate gender discrimination and social inequity and to enable poor women to gain access to and control of, both material and informational resources (Gita Sen, Srilatha Batliwala, 1994).
Empowerment thus becomes about mobilizing grassroots women, encouraging their participation and giving them voice in predetermined development strategies without giving them the power to challenge existing narratives of development and to articulate new alternatives (Elliot 2008). Given this domestication of the concept, feminists seek to rescue it and bring back the power imbedded in it, so women can collectively seek to transform themselves, their families, Communities, state, and international institutions. At the same time, feminists recognize the need to quantify empowerment through measurable indicators so it can be used to demand equality and make state and non-state actors accountable for gender-justice.
Gender Empowerment Measure (GEM) GEM is essentially a measure of three indicators: control over economic resources, measured by men and women's earned income; economic participation and decision making, measured by women and men's share of administrative, professional, managerial, and technical positions; and political participation and decision making,
29

measured by male and female share of parliamentary seats.
Women empowerment has now become a buzzword in India. The last decade witnesses very active and multifaceted efforts in various national and international forums for achieving principles of equality, sustainability and empowerment with a special focus on women. The issue of empowerment of women moved center-stage with the global paradigm shift from a growth-oriented to a human development approach. In the Indian context, the concern for women's empowerment was very visible in the thoughts and
th thwritings of social reformers of the 19 and 20 Centuries and this rich legacy of women empowerment was again once reemphasized by our constitutional framers which latter on was translated by the government into policies, initiatives, schemes, and programs for promoting women empowerment .The growing concern for bringing an attitudinal change in society for empowering women got culminated in the declaration of 2001 as the empowerment year for women. India is a democratic country. Apart from this, it is a fact that there is a deep ignorance in the society about the values of Women. Nowadays our government is trying to give special attention to the participation of women in society and to their education, socioeconomic and political awareness.
Trends in Women's Empowerment
Education Even before the capabilities approach, education had been regarded as a key to women empowerment for its ability to raise awareness and open possibilities as well as its instrumental link to economic growth and children's health. Hence universal primary education has been a goal in many developing countries for many years. With the articulation of the MDGs there has been increased focus on meeting this challenge.
Health Women generally live longer than men but in parts of Asia, particularly India and China due to gender-based discrimination female life expectancy is lower that for males (WHO 2009). At the global level, life expectancy has improved slightly but in Latin America and East and Central Asia it is now above 70 yrs, Figure 6 below. South Asia and Middle East and North Africa have made the most gains, while sub-Saharan Africa lags behind at mid-50s. The HIV/AIDS crisis is among the reasons for this situation. Another disturbing trend in terms of women's health is the increase in HIV/AIDS rates. Women and girls account for 50% of HIV/AIDS cases worldwide, or 15.5 million. Yet there is a persistent gap in treatment for women and it is now a leading cause of women's ill health and death (UNPF 2005); this in spite of a recent survey of 158 countries, conducted by WHO, UNICEF and UNAIDS, which found that more women have access to HIV testing and counseling than men (WHO 2009a) . There is a direct correlation between women's health and economic empowerment. At all stages women and girls in developed countries fare better than women and girls in poorer countries, though there is variation within countries based on urban/rural location as well as class and minority status. Access to education, household wealth, and place of residence are important factors in women's and girls' health outcomes in developing and developed countries. Women and girls in wealthier households have lower mortality and higher use of health care services
30

than those living in poorer households (WHO 2009:2). In most cases, lack of health education and access to affordable health care continue to prevent women from enjoying good health.
Economic Participation Women's economic participation is marked by three trends in the global economy: increasing feminization of the labor force, increased participation in the informal orvulnerable economy, and migrating to work in the service industry in the developed world. Women's increasing economic participation is one of the most visible trends of the global economy.
Union Efforts The Decent Work for Women Campaign of the International Trade Union Conference raised issues of women's representation in trade unions as well as the issue of gaps in wages between men and women. Its Global Wage Gap Report was instrumental in changing legislation and policies in 16 countries relating to workplace issues such as wage gap, harassment, child care facilities for mothers, and work-life balance. The campaign was launched in 56 countries and its aim is to foster equality for women at work in terms of workplace policies but also to increase representation in unions at all levels and in making policies and programs (www.ituc.org).
In summary, some important patterns in women's empowerment are: · There have been positive changes in some key indicators of women's
empowerment particularly in enrolment at the primary education level and to some extent in secondary and tertiary levels and increased participation in national parliaments and in the labor force, though the latter is declining in the current crisis. To a lesser extent there has also been a decline in maternal mortality and fertility and increase in contraceptive use. However, the changes vary across regions with the greatest gaps and within countries urban and rural poor, ethnic minorities, and older and disabled women fare worse on all indicators. As Buvinic et al. (2008) note there is some progress in expanding women's capabilities, particularly education, but not in opportunities for economic and political control.
· A reduction in gender gap does not translate into greater gender equality with women experiencing greater freedom or being able to develop their capabilities more fully or a decrease in violence. The wage gap and gender segregation of the workforce continue, thereby undermining women's equality.
· Positive trends are often accompanied by negative trends such as increasing unemployment for women in the current crisis, and reversal of gains in several countries.
· Broad indicators do not reveal the contradictory nature and unintended consequences of development. For example, while rapid decline in fertility improves women's life chances and well-being, in India and China it is also associated with imbalanced sex ratio, particularly where son preference has led to neglect and abandonment of infant girls as well as use of sex-selection technologies to abort female fetuses. India and China, with the fastest economic growth rates, also have the highest number of missing girls, so economic growth does not guarantee gender equality or
31

security (e.g., Beneria 2007, Elson 2006, Harcourt 2010, and Molyneux and Razavi 2006).
Girl's education is emerging as one of the top priorities of the international development community. United Nations Secretary-General Kofi Annan has said that “Educating girls is not an option, it is a necessary”, and the 189 countries that signed up for the Education for All (EFA) initiative in 2000 showed their support by pledging to eliminate gender disparities in education by 2005.The value of girl's education has received global recognition over the past two decades with the mounting awareness in the drive towards women's equality and emancipation. Women are today venturing into different fields breaking the male monopoly in the political arena, administration, science, technology, journalism and the like. In fact, in certain professions like medicine, nursing care, teaching, social work, they have proved to be better than men. The Government of India has opened the door and windows of education for all so far as equalization of educational opportunity is concerned. Though the era of Sarva Shiksha Abhiyan is continuing, the environment of girl's is still lower than that of boys.
And Education is a milestone for women empowerment because it enables them to respond to opportunities, to challenge their traditional roles and to change their lives. Similar ideas were supported in International Conference -1994.It was said that the “Education is one of the most important means of empowering women with the knowledge, skills and self-confidence necessary to participate fully in the development process”. Educating women benefits the whole society. It has a more significant impact on poverty and development than men's education. It is also one of the most influential factors in improving child health and reducing infant mortality. Educated women can be of immense help in different ways for the family .Education enhances the women empowerment in the following ways-
· Education provides financial and economic security to a woman and with that she can prove her worthiness.
· Education plays an important role in removing economic poverty by opening various job avenues for her so that she can work hand in hand with man and give support to the family, which in the long run strengthens the economy.
· Education helps one to maintain a balanced potential which further helps a women to choose a correct field of her work so that she can become a contributing factor to the family and society.
· An educating woman is guiding light for the children, family members, society and nation.
· Education is the input which a woman grasps and with the behavior comes the output.
· An educated woman can bring change in the attitude of family members and society by questioning the conservative thoughts of the people and blind faith.
· Education helps a women to play an leading role in the decision-making process at family level, and social, political and economic fronts.
· Women empowerment is possible with education as it helps her become socially, economically, politically, culturally and morally strong.
32

CONSTITUTIONAL PROVISIONS FOR WOMEN EDUCATION
The Constitutional of India in Article 15(1) on right to equality provides the basic policy framework that enshrines the vision of girl's education and the spirit in which their education is to be provided. In the National Policy on Education 1986, (as modified in 1992) a new thrust was provided to girl's education, which provided a holistic vision for
ndthe education of women and girls. In the 42 Constitutional Amendment (1976) the Central Government has played a more proactive role in the sector through several centrally sponsored schemes that had a distinct bearing on promoting education for girls.
thThe 86 Constitutional Amendment Act, 2002, has made elementary education a Fundamental Right for children in the age group of 6-14 years by providing that “the state shall provide free and compulsory education to all children of the age of six to fourteen years in such manner as the State may, by law, determine”. Subsequently, on 26 August 2009 the parliament received the assent of the President and the Right of Children to Free and Compulsory Education, 2009 was published in the Gazette of India on 27 August 2009.
New Initiative for Promoting Girl's Education
The success achieved in education of girls in our country in the past-Independence period is the result of a number of schemes put in place by the government for bringing girls to school and holding them there. While the stress on the education of girls has been the cornerstone of most plans and policies related to education, some of the notable schemes that have come up in recent years are as follows;
Mahila Samakhya The Mahila Samakhya (MS) scheme was started in 1989 to translate the goals enshrined in the National Policy on Education-1986 into a concrete program for the education and empowerment of women in rural areas, particularly those from socially and economically marginalized groups through informal learning. The MS scheme recognizes the centrality of education in empowering women to achieve equality. The Mahila Sanghas or women's collectives at the village level provide the women a place to meet, reflect, ask questions and articulate their thoughts and needs and make informed choices. The program has focused on awareness of the need to educate the children, especially girls, which has resulted in a direct impact on enrolment and retention of girls in schools.
Sarva Shiksha Abhiyan (SSA) This is an effort to universalize elementary education by community-ownership of the school system. One of the objective of the schemes is to bridge all gender and social category gaps at primary stage by 2007 and upper primary by 2012.The scheme has special features focusing on education of girls, which include provision of free textbooks to all girls up to class VIII, separate toilets for girls, back to school campus for out-of-school girls, bridge courses for older girls, recruitment of 50 percent women teachers, Early Childhood Care and Education (ECCE) centers in/near schools in convergence with ICDS program, teacher's sensitization programs to promote equitable learning
33

opportunities, gender-sensitive teaching-learning materials including textbooks, intensive community mobilization efforts, 'innovative fund' per district for need-base interventions for ensuring girl's attendance and retention.
National Programme for Education of Girls at Elementary Level (NPEGEL) The National Programme for Education of Girls at Elementary Level (NPEGEL) has been formulated for providing additional support for education of underprivileged/disadvantaged girls at elementary level. NPEGEL is a part of SSA and is implemented under its umbrella but as a distinct and separate gender component plan of SSA.
Kusturba Gandhi Balika VidyalayaThe Kusturba Gandhi Balika Vidyalaya )KGBV) scheme was launched by the Government of India in August, 2004 for setting up residential schools at upper primary level for girls belonging predominantly to the SC, ST, OBC and minorities in different areas. The scheme of the KGBV ran as a separate scheme but in harmony with the Sarva Shiksha Abhiyan (SSA), National Programme for Education of Girls at Elementary Level (NPEGEL) and Mahila Samakhya (MS) for the first two years, but has since 1 April, 2007 merged with the SSA programme as a separate component of that programme. The objective of KGBV is to ensure access and quality education to the girls of disadvantaged groups of society by setting up residential schools with boarding facilities at elementary level.
STEPS TO BE TAKEN FORWARD
Keeping in view the above problems, the following steps to be measured for the empowering the educational development of girls/womens:
i). Community Awareness Women should not be discriminated against especially when it comes to education. The two possible ways of achieving this are: the formation of women's organizations, particularly those who are enlightened should crusade for reforms to uproot the traditional beliefs by sensitizing the rural old men and women is in the kitchen. The second strategy is to sensitize the young ladies both at the primary and secondary school levels through debates to instill in them the consciousness of gender equality rather than to consider themselves as subservient and inferior to the men in academic, social, political and economic, political and economic spheres. The universally accepted precept 'Educate a women and you educate the whole generation 'should be adopted as a national slogan and publicity departments of the Government should undertake a special propaganda drive to build a climate in the country in favor of girl's education. A new prestige value around educated girls should be built up which will slowly lead to the desired goal.
ii). Women Teachers At least 50 percent of the total strength of teachers at the elementary stage should be women to attract more girls to schools. Special facilities may have to be provided to
34

women teachers for posting them in rural areas such as teacher's quarters, posting of husband and wife at one place as teachers etc. iii). Access to Education
Schooling facilities should be provided to the girls nearer to their place of residence (within easy walking distance).Mobile schools may be started for girls of nomadic tribes, migrant laborers and construction workers. Separate institutions for girls should be established wherever there is a demand even at the elementary stage.
iv). Transport and Hostel Facilities Adequate arrangements should be made for free transport of girls to school if it is situated more than one kilometer from their habitations. Free or cheap hostel facilities may be provided to girls .Ashram schools or residential may be established where it is difficult to walk down to schools daily.
v). Co-EducationThe system of mixed schools has been recommended by almost all Committees and Commissions as far as possible from the point of view of economy and standards of education, and this movement of co-education has gained momentum in modern India. But co-education can be successful, if mixed staff is provided in mixed schools and separate toilet facilities and common room are provided for girls. Also, separate provision should be made for the extra-curricular activities; games and sports for girls according to their interest and aptitude.
vi). IncentivesSince poverty is one of the major causes of non-attendance and drop-out of girls, adequate provision of incentives in the form of freeships, free supply of books , stationery; uniforms and midday meals, attendance scholarships and stipends and opportunity cost where necessary, should be made.
vii). Scholarship for Girls Scholarships should be given to the outstanding girls in different disciplines. It will also motivate girls from different communities to come ahead for education and compete with their classmates. These scholarships should be given in those areas where there is a need of girls for the development of society i.e. nursing, teaching, pathology and pharmacy etc.
viii). Reservation of Seats for Girls in Different DisciplinesThere should be provision of reservation of seats for girls in different disciplines as there is reservation for SC and BC candidates. It will certainly motivate the parents to send their daughters for higher education.
ix). Childcare Centre and BalwadisEstablishment of children's centers or balwadis as a part of the elementary education system is necessary to enable girls to bring their younger brothers and sisters with tem for whose care they have been charged with the responsibility. Otherwise, they would not be
35
in a position to attend schools.
x). Social Change and LegislationThe State Government should strictly enforce the existing legislations on the age of marriage of girls, dowry system and compulsory education. Simultaneously, the governments should encourage social workers, community development officials, girl youth leaders and political leaders to undertake a drive against social prejudices for girl's education and break through the apathy of the parents towards girls particularly in rural areas.
CONCLUSION
To fulfill their promises to women's empowerment and gender-justice, the world's governments will need to undertake a stimulus plan for women's equality that will:
· Make explicit the focus on gender- justice in law, policies, and budget allocations
at all levels and in all sectors, including macroeconomic policies.· Finance and implement these commitments.· Ensure changes in government structures and machineries at all levels to
institutionalize the process of gender-justice. Political will at all levels of the leadership is important to this success. To mobilize and sustain this political will, women's movements and other human rights movements and NGOs will have to demand accountability at local, national, and international levels. In addition to that, movements will have to undertake the long term and challenging task of transforming patriarchal values and attitudes that are another major impediment to women's empowerment. This work has already begun with promising results in many parts of the world. Thus, this era of crises can perhaps propel us towards a new vision of human well being that is in keeping with the spirit of the first Human Development Report but moves beyond it in terms of alternatives.
REFERENCES
· Aminuzzaman, S. M. (2002). Cellular phones in rural Bangladesh: A study of the VillagePay Phone of Grameen Bank. In A. Goldstein and D. O'Connor (Eds.), Electronic Commerce for Development (pp. 161-178): OECD Publishing.
· Araujo, C., and Garcia, A. I. (2006). The experience and the impact of quotas in Latin America. In D. Dahlerup (Ed.), Women, Quotas and Politics. New York: Routledge.
· Archenti, N., and Johnson, N. (2006). Engendering the legislative agenda with and without the quota: A comparative study of Argentina and Uruguay. Sociologia, Problemas e Praticas(52), 133-153.
· Bayes, A. (2001). Infrastructure and rural development: insights from a Grameen
36

Bank village phone initiative in Bangladesh. Agricultural Economics, 25(2-3), 261-272.
· Brinton, M. C. (Ed.). (2001). Women's working lives in East Asia. Stanford, CA: Stanford University Press.
· Cantuarias, F. and M. Delgado. (2004). Peru's urban land titling program. Paper prepared for Scaling up Poverty Reduction: A Global Learning Process and Conference, World Bank, Shanghai, May 25-27, 2004.
· Chen, F. (2000). Working women and state policies in Taiwan: A study in political economy. New York: Palgrave.
· Chen, M. (2005). Towards Economic Freedom—the impact of SEWA. Ahmedabad: SEWA Academy.
· Chen, M., and Snodrass, D. (2001). Managing resources, activities, and urban risk in India: The Impact of SEWA Bank. Washington, D.C.: Assessing the impact of microenterprise services.
· Cheng, L., and Hsiung, P. (1994). Women, export-oriented growth, and the state: The Case of Taiwan. In J. D. Aberbach, D. Dollar and K. L. Sokoloff (Eds.), The Role of the State in Taiwan's Development (pp. 321-353). Armonk, NY: An East Gate Book.
· Clark, C., and Clark, J. (2008). Institutions and gender empowerment in Taiwan. In K. C. Roy, H. Blomqvist and C. Clark (Eds.), Institutions and gender empowerment in the Global economy (pp. 131-150). Hackensack, NJ: World Scientific.
· Elson, Diane. 2006. The Changing Economic and Political Participation of Women: Hybridization, Reversals and Contradictions in the Context of Globalization. 06-8 Working Paper Series. International Working Group on G e n d e r , M a c r o e c o n o m i c s , a n d I n t e r n a t i o n a l E c o n o m i c s . http://www.genderandmacro.org/ accessed 8 march 2010.
· International Labor Organization. 2010. Women in Labour Markets: Measuring Progress and Identifying Challenges. Geneva, ILO.
· Rowlands, Jo. 1997. Questioning Empowerment: Working with Women in Honduras. Oxford: Oxfam.
· United Nations Development Fund for Women. 2010. Progress of the World's Women 2008/2009. Who Answers to Women? Gender and Accountability. UNIFEM, New York. http://www.unifem.org/progress/2008/media/POWW08_Report_Full_Text.pdf, accessed March 6, 2010.
37

Walkability of School Children in Borivali, Mumbai
Sumant Sovani Associate Professor, KES Shroff College, Mumbai.
Dr. Arun Bhole Professor, M. J. College, Jalgaon
Abstract
Walking is one of the basic and fundamental mobility traits. In cities, neighbourhood mobility for various purposes rely on quality of transport infrastructure like footpaths, street lights, traffic signals, zebra Crossings etc. However, today's transport planning is unfavourable to non-motorized modes such as cycles and pedestrians. This, in turn, affects the overall urban mobility particularly of unescorted students / children. Present research paper primarily aims to study the level of walking comfort for neighbourhood mobility in Borivali Taluka of Mumbai Suburban District, in students' perspective.
Borivli is a well-developed and assisted with better infrastructure taluka of Mumbai Suburban Districts. It was expected that, this region will have an excellent mobility situation, better walking and cycling friendly infrastructure and a comfortable walking environment for students / children. In reality however, students have less walking comfort, if not poor, primarily due to poor walking friendly environment- especially very poor footpaths, terrible traffic conditions, and poor cleanliness. It is very evident that unless the needs of non-motorised modes of mobility are met, it will be almost impossible to achieve pedestrian friendly system in urban areas. Municipal Corporation of Greater Mumbai which is, one of the richest corporations in India, must emphasise on improving pedestrian friendly facilities to improve the walking conditions and mobility environment for all its citizens.
Key Words: Neighbourhood Commuting, Urban mobility, Urban Transport, Walkability.
Introduction:
Urban environment and urban transportation appeared to be pedestrian friendly in the past. In ancient cities, merchant class was the main force behind the advancement in transportation. As a result, few cities, like, Teotitiuacan, what is now Mexico City, started developing planned street system. Civilization in ancient times too, gave importance to road building. Paved roads were built by Mesopotamia and in Indus valley. In medieval cities, Romans and Persians built stone paved roads to allow quick movements of Army. The medieval caliphate later even built tar-paved roads. Timgad, now in Algeria, had the orderly arrangements of streets. All these stages suggests a consistent effort to upgrade city transport system. However, the growth of industrial cities has brought in a drastic change in urban transportation. Motorised vehicles along with a strong desire for more
38

accessibility; higher speed and better mobility changed the bearing of urban moving. These changes were universal. But, old civilizations, like the one in India, had a tough time to adjust with the imposition of industrialised phase over the pre-existing, old and rigid form of cities. Accidents, traffic jams, pollution, travel fatigue and even uneasy walking conditions for pedestrians were the resultant effect of this new shift. Commuting within and between Indian cities no longer remained a joy. Non-motorised transport modes like walking, cycle, cycle rickshaw and tonga are still important components of an Indian urban transport system. Urban transport is ought to be for the people and goods and not about vehicles and speed; and hence, urban transport design must be for the people. Regrettably, current transportation policies in developing countries like India favour motorization and very less emphasis is given to provide and maintain basic pedestrian friendly infrastructure like quality footpaths (sidewalks), traffic islands, signals etc.; and a separate corridor for cyclists.
Walking is the basic and fundamental mobility traits. However development and advancement city may achieve, its environment has to be pedestrian friendly. This is a pre-requisite of any better and functional urban transport environment. Moreover, many advanced economies are now promoting 'walking culture' among its citizens. 'Safe routes to schools' (SRTS) by US Dept. of Transport aims to arrest the problem of decline in walking and bicycling of schoolchildren. Project TLC (Transportation for Livable City) also aimed at achieving better walking and cycling in the neighbourhood of San Francisco. One of the studies at international level advocates to encourage walking and cycling with proper infrastructure for the same. Studiesrelated to walking habits of School children in western developed work is primarily related to study of physical activity of children and health related issue. Physical activities of children, particularly urban children are declining. One such research shows that even Indian Urban Children are having similar trend. In Indian context, however, children's poor walking habit is not related to physical activity and health.
Walking habits and preferences is a reflection of mobility traits. Hence, it is appropriate to throw some light on walking patterns and walking behaviours of very residents of urban areas. Walking behaviour depends on mobility purposes within and between the neighbourhoods of the very residents. But over and above, it also depends on neighbourhood set-up and walking comfort to pedestrians. School children have a sizable presence in each neighbourhood. Their sphere of life goes beyond school. They visit many places within and beyond their neighbourhood. They not only go to schools every day, but also venture out for many other activities and some domestic / family related works. Present study primarily aims to look in to walking habits of school children within and between neighbourhoods in Borivali taluka of Mumbai Suburban District.
School Children Walking Trends-Issues:
Past studies related students walking habits are very wide and exhaustive. Children in age group of 10-14 in Johannesburg have spoken about unsafe places in neighbourhood, pedestrian problems, public transport, street light, traffic conditions, and road crossings. Exposure of children in developed countries due to poor neighbourhood situation is very
39

low not only in terms of their routine activity of going to School, but also in terms of their recreational physical activity of outdoor play. Studies related to urban mobility of School children in western developed world is primarily related to study of physical activity of children and health related issues. However, it has been also observed that, neighbourhood with similar design may have different walking habits. All these studies have, regrettably, focused more on physical and health related aspects of children's walking habits.
Studies carried out on walking habits in Indian context are relatively few. These studies are mainly addressing mobility problem in adults' point of view and not in students' point of view. The comparison among the Asian cities also shows that Indian cities are below or well below average transport environment. One can expect that walking habit of citizens of Mumbai Metropolitan Region (MMR) is ought to be more and consistent at least at neighbourhood level. Planning priorities given to transport projects here like, sky-walks, beautification of neighbourhoods and planned town-ships in this area are also responsible to get this impression. It is therefore, appropriate to discuss walking comfort to adult pedestrians in general and to unescorted young-ones in particular.
Measurement of 'Walk-Score' is a herculean task. Perception on urban walkability changes with people and their socio-eco-cultural background. School going children are in the age group of 10-15 years and comparatively objective and free from bias. They travel comparatively less but more frequently and regularly. They move around in their neighbourhood for school and other activities. Walking habits of school going children is decided to be the basic parameter or urban mobility. Present research primarily aims to study the level of walkability in students' perspective, with an assumption, that if 'walkability' in Borivali is friendly to school children; it is friendly to all pedestrians.
Objectives of the present study:
Present study intends to focus on following aims and objectives. 1. To understand the mode of transport / walking habits of school children for going
to School and other nearby places in the neighbourhood for several purposes.2. To understand the students perception on ambience of neighbourhood and its
impact on walkability.3. To understand students' comfort level about walkability in their neighbourhood.
Need and significance of study:
It is appropriate to assume that Secondary school children are comfortable and independent to walk in and beyond their neighbourhoods. This comfort level of both parents and children, in fact, is the best parameter of measuring neighbourhood walkability. It is also a reflection of good neighbourhood design, better foot paths, disciplined traffic and considerate society in the locale. The present study, therefore, helps to understand walkability comfort and patterns in walking trends of individual, particularly unescorted school children.
40

Utility of research:
Outcome of study will help to decide town planning, city design and strategies for pedestrian friendly neighbourhood. NGOs and neighbourhood community can undertake issues like good foot path and cleanliness in their area. It will focus the need of environmental friendly, easy and convenient means of daily commuting within urban area and young students will become sensitized to the issue of pedestrian friendly urban mobility.
Methodology And Sources Of Data:
This paper is based on primary data. Random sampling method was applied to select one school from each Sajjas of Borivali Taluka. Separate and detail questionnaires were prepared to take first hand inputs from students, parents and school authorities from selected sample schools. A sizeable 516 students of class VI and IX from 9 sample schools were surveyed through questionnaire.
Parents' perceptions were sought through questionnaire; either in person outside the school or it was sent to them through an e-mail. Similarly, school authorities were interviewed to understand their perception as well as contribution in students commuting. Onsite visit(s) of the researcher and observations made by him are also taken into consideration while drawing the inferences. All filled-in questionnaires were processed, with suitable statistical techniques.
Study Area:
Mumbai, the capital city of Maharashtra state has two administrative districts, the Southernmost district is known as Mumbai City with Colaba as its headquarter; while the Northern Mumbai is known as Mumbai Suburban District with Bandra as its headquarter. Borivali is one of the three talukas of Mumbai Suburban District. Borivli Taluka is dense and diverse with cosmopolitan characteristics.
Data Analysis:Purpose of Travel:
There are some specific activities and places where students often go. It was observed that there are some 37 places in the neighbourhood of students' residences, which they normally visit daily or occasionally. This indicates student's sphere of life associated with their daily routine, peers and family. These places were re-grouped for better analysis and understanding; and were identified with different types of works, for which students move out.
1) Mandatory works: Students visit certain places like school, stationary shop, library, tuition classes, hobby classes and even facility like Xerox regularly every day in order to complete their academic part.
41

2) Personal day to day works: Students also visit number of other places in order to fulfil their day to day personal works. These six places are cobbler, umbrella repairing, cycle repairing, friend's house, gymkhana /gymnasium or approaching nearby bus stop for further journey. It is obvious that all students may not go to all these places.
3) Personal Occasional Works: Apart from scheduled activities, students go to five places as and when need arises. These places are doctor, medical shop, photo studio, relatives and tailor. This is, in a way, students' occasional mobility.
4) Family day to day works: Every Student is an integral part of family and hence, play a significant role in daily family chorus. Therefore, student has to take care of certain family responsibilities as well. There are seven places identified where students visit in order to complete some or other minor financial works. Those places are bill centre to pay various bills, flour mill, grocery shop, laundry, milk vendor, ration shop and nearby vegetable or fish market.
5) Family Occasional works: Students may be required to visit family oriented places occasionally. Such places are Banks, Civil hospital, courier, gas centre, market, municipal office, post office and sweet mart.
6) Recreational / Fun Activities: Apart from these works, there is one more area closely concerned to student's day to day life. Such activities are mainly recreational. Students visit number of places for their recreational / fun activities. These are cyber café, fast food centre, juice and ice cream parlour, park / garden, playground and worship places like temple, church etc.
9. Purpose of Travel and School Children's Walking Trends in Borivali, Mumbai:Walking to nearby places is presumably a common and most convenient means of travel for students as their activities are normally concentrated in their neighbourhood of residence. The very purpose of this study is to understand walking habits of school children. Hence, the commuting mode as 'walking' was considered to be the friendliest and comfortable mode of transport.
Actual mode of transport used by student to visit each of these 37 places were tabulated and classified as per the type of works; and given in the table below.
42

Table No. 1Consolidated Students Mobility by Walk
A consolidated table of comparison given above brings out the overall picture of students mobility by walk in their neighbourhood. The percentage of mobility by walk is more than 76 in case of mandatory works, day to day works and recreation activities, while mobility by walk related to occasional and family related work is around 65%. Mobility by walk in respect of family occasional work is 45.55% which is less than rest of the mobility by walk figures. The consolidated table also indicates that the use of public transportation is hardly around 3.1% to 6.39%. This is the matter of concern primary because the infra-structure development is not good and the use of public transportation seems to be non-friendly to students. About 20 to 30% students depend on some or other vehicle for their daily works is also not a good sign. It indicates that either, the local built environment is not conducive to student needs, or the physical and social security is a matter of concern.
Thus, from the mode of travel students use to move in their neighbourhood, a very distinct trend about the walking comfort of students is observed. Students predominantly walk for their mandatory and day to day avidities, use public transportation for occasional work and use vehicles for family related work.
Mode of Transport Place of visit
Unlikely to visit some places
Always alone by walk
By walk with someone
By Public transport like bus /railway
By hired vehicle like Rickshaw / Taxi
By personal bike with parents
By personal Car with parents
Mobility by Walk
(b+c)
a b c d e f g (b+c)
Mandatory Works 9.14 50.01 26.95 4.71 5.08 3.63 2.01
76.96
Personal day to day Works
10.62 46.2 30.81 3.10 3.89 4.45 1.35 77.01
Personal occasional Works
3.29 26.55 40.11 6.39 7.56 8.91 7.17 66.66
Family day to day Works
13.56 32.55 33.33 3.10 7.36 6.78 3.29 65.88
Family Occasional Works
18.02 16.09 29.46 6.00 13.57 10.66 6.2 45.55
Recreational Activities
3.88 37.01 40.31 3.29 4.46 6.00 5.04 77.32
43

10. Walk Score: School going children visit number of places in their neighbourhood. Their decision to go by walk or by vehicle within someone largely depends on the distance to be travelled to visit the required place. School going children are not matured enough to judge the actual distance i.e. physical distance to be travelled. Nor even they can sense the cost distance as travel to these places may not involve expenditure every time. However, during pilot study, it was realized, that students can well comprehend the time distance and can perceive well the distance either as motivating factor or as a hindrance to walk or cycle alone. Students were, therefore, asked to respond the time distance if at all they need to walk to reach to these 37 places of their sphere of life. Students have responded in one of the options given in the table. The option of impossible to reach by walk was also given as some times in case of some places; students may feel that those places are too far to reach by walk.
Table 6Consolidated Average Percentage of Students having different Time Distances
for various types of Works
The consolidated table of Average Percentage of Students having different Time Distances for various types of works gives the overall picture. On the one hand about 7 to 12% students felt that the places are beyond the walkable distance; while on the other hand the number of students who felt that these places are at walkable distance is not crossing 55.00% for any purpose of work. Only for personal works, just above 55.00% students felt that these places are walkable, in rest of the cases, walkability of students is below 50%.
This is certainly a matter of concerned; particularly because, Borivli Taluka is very dense. The land use here is also intense. Hence, it was expected that the time distance for students between 5 to 15 minutes of walkability ought to be more for at least 70-75% of students; if not for 100%. This trend needs further scrutiny with parents and students.
During the informal discussion with parents, as well as students, it was revealed that, walking is certainly not a trend, nor a culture of Mumbai students. Besides, a very important disclosure came to notice that for most of the students felt that the time required just to cross the road and reach the shop / facility on the other side of road is
Time Distance Works
5-10 minutes of walk
10-15 minutes of walk
15-20 minutes of walk
20-25 minutes of walk
Impossible to reach by walk
Mandatory 9.5 39.78 25.42 13.18 12.1 Personal 5.12 51.00 23.8 12.2 7.88 Occasional 9.34 40.78 22.9 14.66 12.36 Family day today
8.66 35.34 28.29 15.16 12.60
Family occasional
19.16 18.99 21.51 19.30 21.04
Recreational 4.47 42.08 27.67 15.03 10.80
44

pathetic and delayed due to continuous flow of traffic. This causes daily agony for students and they perceived a longer time distance. It is naturally then, their time distance parameter needs uniformity.
It was therefore, decided that 'Walk Score' needs to be worked out. It was decided that 15-20 minutes' walk shall be considered neutral and hence must be considered ineffective. Less time distance than this would be considered positive while more time distance would be considered negative. Hence +1 and +2 score was assigned to 10-15 and 5-10 minutes distance respectively while -1 score was assigned to 20-25 minutes and -2 for more than 25 minutes time distance, or the distance that students feel impossible to walk.
Table 7
Walk Score of Borivali Taluka
The above table about Walk Score gives a very interesting picture. On the one hand when walkability score for mandatory and personal works is more than 20.00; the walkability score for family related works as ranging between +12.03 to -4.02. This shows that the choice or preference of students to walk diminishes with nature of work. It may be partly due to nature of work and partly due to vary inclination of some family member to avoid walking.
11. Students' Walking Comfort in Borivali, Mumbai: Walk Score gives us the sense of distance to amenities students need to walk; whereas mode of transport used by students gives us the trend of actual walking habits. However, walking comfort is also an important parameters based on conditions of footpath, traffic conditions etc. As far as Walking Comfort of students is concerned, a detail analysis gives very interesting trends.
5 to 10 minutes
10 to 15 minutes of walk
15 to 20 minutes of walk
20 to 25 minutes of walk
Impossible to Walk
Total
Assigned Weighted Score
+2 +1 Neutral hence No
Score
-1 -2
Mandatory 9.5 x 2 = 19.0
39.78 x 1 = 39.78
- 13.18 x -1 = 13.18
12.1 x -2 =24.20
21.4
Personal 5.12 x 2 = 10.24
51 x 1 = 51 - 12.2 x -1 = 12.2
7.88 x -2 = 15.76
33.28
Occasional 9.34 x 2 = 18/68
40.78 x 1 = 40.78
- 14.66 x -1 = 14.66
12.36 x -2 = 24.72
20.08
Family Day to day
8.66 x 2 = 17.32
35.34 x 1 = 35.34
- 15.16 x -1 = 15.16
12.60 x -2 = 25.20
12.3
Family occasional
19.16 x 2 = 38.32
18.99 x 1 = 18.99
- 19.30 x -1 = 19.3
21.04 x -2 = 42.08
-4.02
Recreational 4.47 x 2 = 8.94
42.08 x 1 = 42.08
- 15.03 x -1 = 15.03
10.80 x -2 = 21.60
14.39
Walk Score
97.43
45

Table 1Students' Opinion about Conditions of Footpath in neighbourhood
From the above table, it is observed that only 27.9% students felt that they enjoy continuous, good quality and wide footpaths; it means rest 72.1% students are not fully happy about footpath condition. 19% students felt that footpaths in their area are of poor quality; while 18.2% students felt that footpath in their area is irregular and therefore, many a times, they have to walk on the road and hence felt inconvenient. 14.7% students said that their footpath have encroachments and a sizeable 1/5 of the students i.e. 20.2% said that there area has no footpaths at all. So, in general, conditions about footpath in this area are not encouraging for walkers and hence have less mobility quality.
Similar response on the traffic conditions of the area was also taken from the students, and shown in the Figure below:
Fig. 1Students' Opinion about Traffic conditions in neighbourhood
From the above figure, it is seen that as good as 65.7% students felt that there are light and very light traffic conditions. 23.3% students felt that there is a heavy traffic and only 6.2% students felt that traffic is unbearable.
Students’ Opinion Frequency Percent
Does not have footpath at all and Students have to walk on the road 104 20.2
Has irregular footpath with encroachments on it 76 14.7
Has irregular footpath 94 18.2
Has continuous but poor quality footpath 98 19.0
Has continuous good and wide footpath 144 27.9
Total 516 100.0
6%
5%
23%
46%
20%
Traffic conditions in neighbourhood
Unbearable traffic Very heavy traffic Heavy traffic Light traffic Very light traffic
46

Table 2Students' Opinion about Degree of Comfort at Road Crossings
When students go to school or other places by walk, they need to cross the roads. Crossing the roads and the facilities available to cross the road at ease was therefore sensed through students' response. 23.1% students said that road crossing is very safe and simple; while 33.5% students said it is safe. But a good 26.2% students felt crossing the road is difficult while 10.7% students felt it's risky. 6.6% students felt it very risky and troubling. Overall, it seems that facilities to cross the road at ease like traffic islands, road divider, traffic lights (signals), zebra crossing, subways and foot over bridges are either absent or not up to the mark. Hence, students have difficulty in crossing the road.
Table 3Students' Opinion about Degree of Comfort to go to various places alone
However, when it comes to going to various places alone, Table 3 shows that only 39.7% students are ready to move alone. It means, for Schools, students are more used to go alone than to other places, probably due to frequent walking to school and used-to surroundings.14.1% students said that they are ready to go alone except early / wee hours and 13.00% students said that they feel it unsafe to go alone. Thus overall social safety seems to be poor.
Students’ Opinion Frequency Percent
Very risky and troubling 34 6.6
Risky 55 10.7
Difficult 135 26.2
Safe 173 33.5
Very safe and simple 119 23.1
Total 516 100.0
Students’ Opinion Frequency Percent
Its worrisome and impossible 14 2.7
Never, because unsafe 53 10.3
Sometimes I can 171 33.1
Always, but not in the early morning 73 14.1
Always and any time 205 39.7
Total 516 100.0
47

Table 4Students' Opinion about Degree of Comfort for walking environment
It is surprising that only 8.9% students felt that traffic is not at all a problem and 40.9% students felt that they can walk easily in the present traffic conditions. Together, only 50% students are comfortable to walk without further worry. Only 19.6% students expressed their satisfaction about traffic signals usefulness while 19.8% students felt that the presence of traffic police only making their walking comfortable. 12.8% students felt that walking environment is horrifying.
12. Walkability Score and Walkability Index:
All these isolated parameters of walking comfort discussed above were further processed for more clarity and applicability in other areas. This was done by assigning the weighted score to each of these parameters. Percentages of Students were multiplied by the weighted score assigned to each variable. Variables encouraging for better walking comfort were given positive score while discouraging variables were given negative score; and a walkability Score was worked out. From this calculation, a final Walkability Index was extracted.
Table 5Walkability Score of Borivali Taluka
Students’ Opinion Frequency Percent
We walk in horrifying traffic conditions. 66 12.8
There is always a policeman and traffic signals to take care of us. 92 17.8
There are traffic signals to take care of us. 101 19.6
We just walk easily and take care of us 211 40.9
We just don’t worry about traffic. 46 8.9
Total 516 100.0
48

Total Walkability Score (Ideal score is 2000)
49
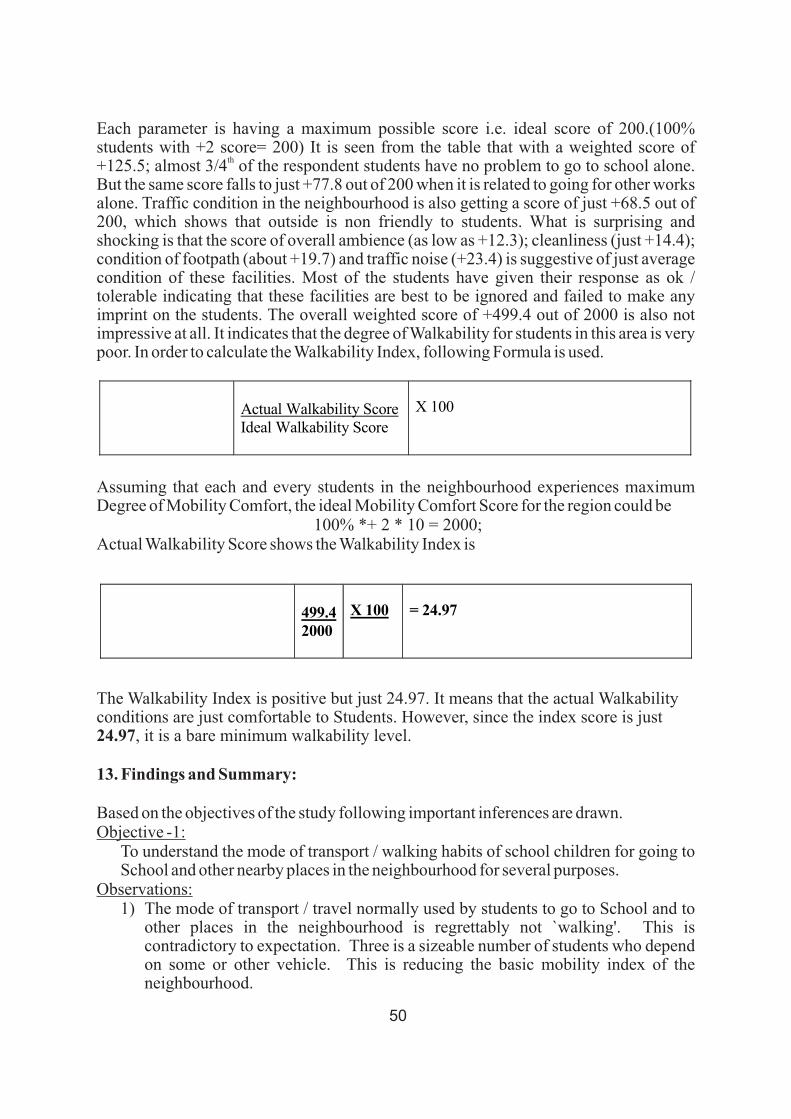
Each parameter is having a maximum possible score i.e. ideal score of 200.(100% students with +2 score= 200) It is seen from the table that with a weighted score of
th+125.5; almost 3/4 of the respondent students have no problem to go to school alone. But the same score falls to just +77.8 out of 200 when it is related to going for other works alone. Traffic condition in the neighbourhood is also getting a score of just +68.5 out of 200, which shows that outside is non friendly to students. What is surprising and shocking is that the score of overall ambience (as low as +12.3); cleanliness (just +14.4); condition of footpath (about +19.7) and traffic noise (+23.4) is suggestive of just average condition of these facilities. Most of the students have given their response as ok / tolerable indicating that these facilities are best to be ignored and failed to make any imprint on the students. The overall weighted score of +499.4 out of 2000 is also not impressive at all. It indicates that the degree of Walkability for students in this area is very poor. In order to calculate the Walkability Index, following Formula is used.
Assuming that each and every students in the neighbourhood experiences maximum Degree of Mobility Comfort, the ideal Mobility Comfort Score for the region could be
100% *+ 2 * 10 = 2000; Actual Walkability Score shows the Walkability Index is
The Walkability Index is positive but just 24.97. It means that the actual Walkability conditions are just comfortable to Students. However, since the index score is just 24.97, it is a bare minimum walkability level.
13. Findings and Summary:
Based on the objectives of the study following important inferences are drawn.Objective -1:
To understand the mode of transport / walking habits of school children for going to School and other nearby places in the neighbourhood for several purposes.
Observations:1) The mode of transport / travel normally used by students to go to School and to
other places in the neighbourhood is regrettably not `walking'. This is contradictory to expectation. Three is a sizeable number of students who depend on some or other vehicle. This is reducing the basic mobility index of the neighbourhood.
Actual Walkability Score Ideal Walkability Score
X 100
499.4 2000
X 100 = 24.97
50

2) From the mode of travel students use to move in their neighbourhood, a very distinct trend about the mobility comfort of students is observed. Students predominantly walk for their mandatory and day to day activities, use public transportation for occasional work and use vehicle for family related work.
Objective -2:To understand the students perception on ambience of neighbourhood and its impact on walkability.
Observations:As far as walking habits in neighbourhood based on traffic conditions, footpath, road crossing etc. is concerned, the traffic condition in the neighbourhood is somewhat tolerable; however, footpath, comfort of road crossings, cleanliness, parking and noise are pulling down the degree of good ambience and thereby walking comfort. Walking comfort is, therefore, just above average.
Objective -3:To understand students' comfort level about walkability in their neighbourhood.
Observations:1) +499.4 out of 2000 weighted score of Walkability is not impressive at all,
indicating that the degree of Walking Comfort for students in this area is very poor.
2) The Walkability Index is positive but just 24.97. It means that the actual mobility conditions are just comfortable to Students. However, since the index score is just 24.97, it is a bare minimum comfort level of mobility. This also shows that there is a lot of scope to improve the actual mobility comfort conditions. Walkability Index is also too poor to consider as benchmark.
14. Conclusion and Policy Recommendations:
Conclusion: Borivli is a well-developed and assisted with better infrastructure Taluka of Mumbai Suburban Districts. It was expected that, from students' point of view, this region will have an excellent mobility situation and pedestrian friendly conditions. It was also expected that a majority of the students must be walking frequently and comfortably. Besides, it was also expected that Borivli Taluka will have good degree of walking friendly infrastructure. In reality however, students have less walking comfort, if not poor. From this study, it's very clear that unless the needs of non-motorised modes of traffic are met, it will be almost impossible to design any sustainable transportation system for urban areas. Students in Borivali have less mobility and walkability comfort, primarily due to poor walking friendly environment- especially very poor footpaths, terrible traffic conditions, and poor cleanliness.
Policy Recommendations: In order to overcome these problems, some urgent as well as long term policies are suggested. Students must be encouraged to walk to School and to other areas in neighbourhood in a group of peers. Schools can give priority entry and exist
51
for students coming by walk / cycle to encourage walking/cycling. Local authorities must take care of improving conditions of footpath and keeping them approachable, clean and free from encroachments. Improving zebra crossing, road crossing over the divider across the Borivli Taluka and better traffic islands are also essential not only from students' point of view, but also for all other citizens as well. Traffic cooling measures especially near schools and dense residential areas shall also be ensured.
Scope for Future Studies
1. Similar study for entire Mumbai City for proper regional comparison.2. Development of some walkability model.
References:
World Book (2005); Vol – 4; page 578.
https://en.wikipedia.org/wiki/Transport accessed on 27/09 /2015.
https://en.wikipedia.org/wiki/Transport accessed on 27/09/2015.
world Book (2005), Vol. 4, page 581.
Singh, Sanjay K. (2005) REVIEW OF URBAN TRANSPORTATION IN INDIA; Journal of Public Transportation, 8 (1): 79-97. DOI:http://dx.doi.org/10.5038/2375-0901.8.1.5Available at: http://scholarcommons.usf.edu/jpt/vol8/iss1/5
BrentToderian, http://sdapa.org/download/Daniel_Haufschild.pdf
http://www.saferoutesinfo.org/and http://sfsaferoutestoschool.org/
Snyder, Dave., Director, Project TLC (Transportation for Liveable City) for San Francisco 2002 at http://sfsaferoutestoschool.org/
Mehdi Moeinaddini, ZohrehAsadi-Shekari, and MuhammadZaly Shah (2012); “THE EFFECTIVENESS OF PRIVATE MOTORIZED TRIPS INDICATORS IN REDUCING CAR USAGE”; International Journal for Traffic and Transport Engineering, 2012, 2(4): 347 – 358; UDC: 656.13.021:711.73 DOI: http://dx.doi.org/10.7708/ijtte.2012.2(4).05
Richard Larouche, Guy Faulkner, and Mark Tremblay, (2013) “Associations between neighbourhood walkability, active school transport and physical activity levels in
52

primary and secondary school students: A pilot-study”; UOJM Volume 3; Page 42-46
SumathiSwaminathan, SumithraSelvam, Tinku Thomas, Anura V. Kurpad& Mario Vaz (2011); Longitudinal trends in physical activity patterns in selected urban south Indian school children; Indian Journal of Medical Research, No. 134, 2011, pp 174-180.
Jill Swart Kruger and Louise Chawla, (2002); ''We know something someone doesn't know'': children speak out on local conditions in Johannesburg; Environment & Urbanization; Vol 14; No. 2; pp84-96 Retrieved on 17.11.2014 from http://eau.sagepub.com/content/14/2/85
Handy, Susan, Xinyu Cao, and Patricia Mokhtarian (2008). “Neighbourhood Design and Children's Outdoor Play: Evidence from Northern California.” Children, Youth andEnvironments 18(2): 160-179. Retrieved on 16.11.2014 from http://www.colorado.edu/journals/cye
Mehdi MoeinaddiniZohrehAsadi-Shekari, and MuhammadZaly Shah (2012); “THE EFFECTIVENESS OF PRIVATE MOTORIZED TRIPS INDICATORS IN REDUCING CAR USAGE”; International Journal for Traffic and Transport Engineering, 2012, 2(4): 347 – 358; UDC: 656.13.021:711.73 DOI: http://dx.doi.org/10.7708/ijtte.2012.2(4).05
Jan Friederich, Gavin Jaunky, Ran Xu, Manoj Vohra, (2011), Asian Green City Index Assessing the environmental performance of Asia's major cities, A research project conducted by the Economist Intelligence Unit, sponsored by Siemens, Munich, Germany, Publisher: Siemens AG Corporate Communications and Government Affairs Wittelsbacherplatz 2, 80333.
53
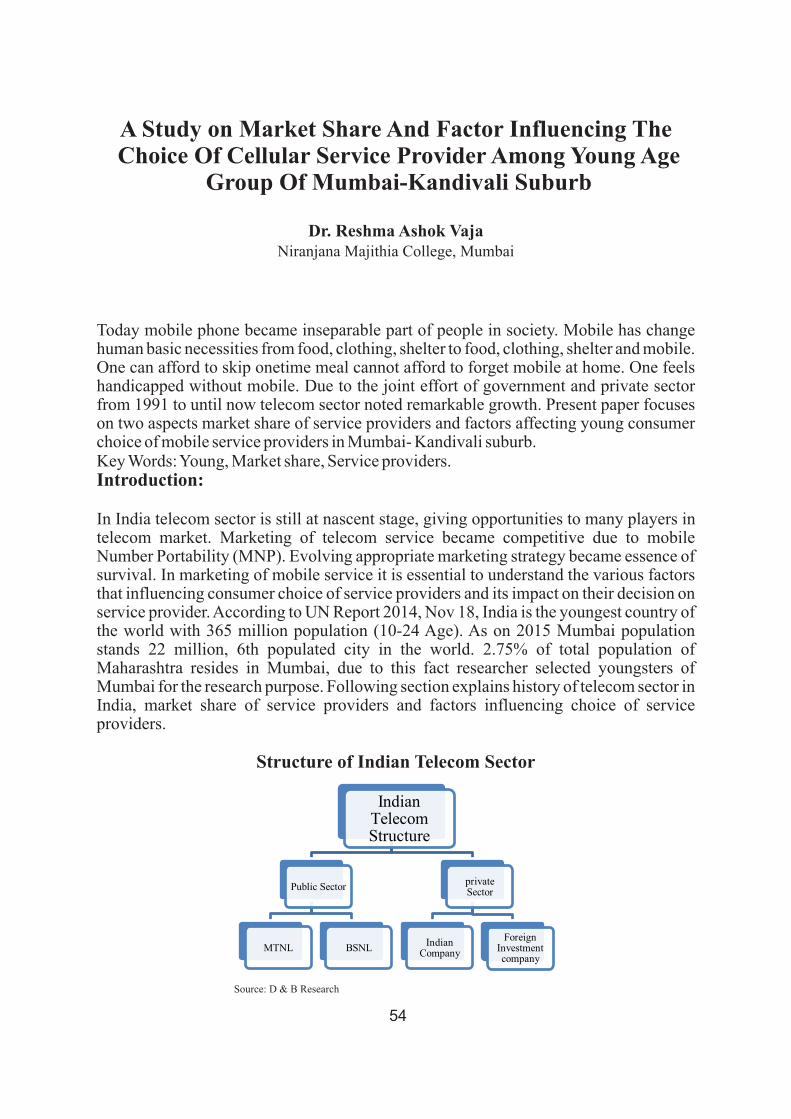
A Study on Market Share And Factor Influencing The Choice Of Cellular Service Provider Among Young Age
Group Of Mumbai-Kandivali Suburb
Dr. Reshma Ashok VajaNiranjana Majithia College, Mumbai
Today mobile phone became inseparable part of people in society. Mobile has change human basic necessities from food, clothing, shelter to food, clothing, shelter and mobile. One can afford to skip onetime meal cannot afford to forget mobile at home. One feels handicapped without mobile. Due to the joint effort of government and private sector from 1991 to until now telecom sector noted remarkable growth. Present paper focuses on two aspects market share of service providers and factors affecting young consumer choice of mobile service providers in Mumbai- Kandivali suburb.Key Words: Young, Market share, Service providers. Introduction:
In India telecom sector is still at nascent stage, giving opportunities to many players in telecom market. Marketing of telecom service became competitive due to mobile Number Portability (MNP). Evolving appropriate marketing strategy became essence of survival. In marketing of mobile service it is essential to understand the various factors that influencing consumer choice of service providers and its impact on their decision on service provider. According to UN Report 2014, Nov 18, India is the youngest country of the world with 365 million population (10-24 Age). As on 2015 Mumbai population stands 22 million, 6th populated city in the world. 2.75% of total population of Maharashtra resides in Mumbai, due to this fact researcher selected youngsters of Mumbai for the research purpose. Following section explains history of telecom sector in India, market share of service providers and factors influencing choice of service providers.
Structure of Indian Telecom Sector
Source: D & B Research
54
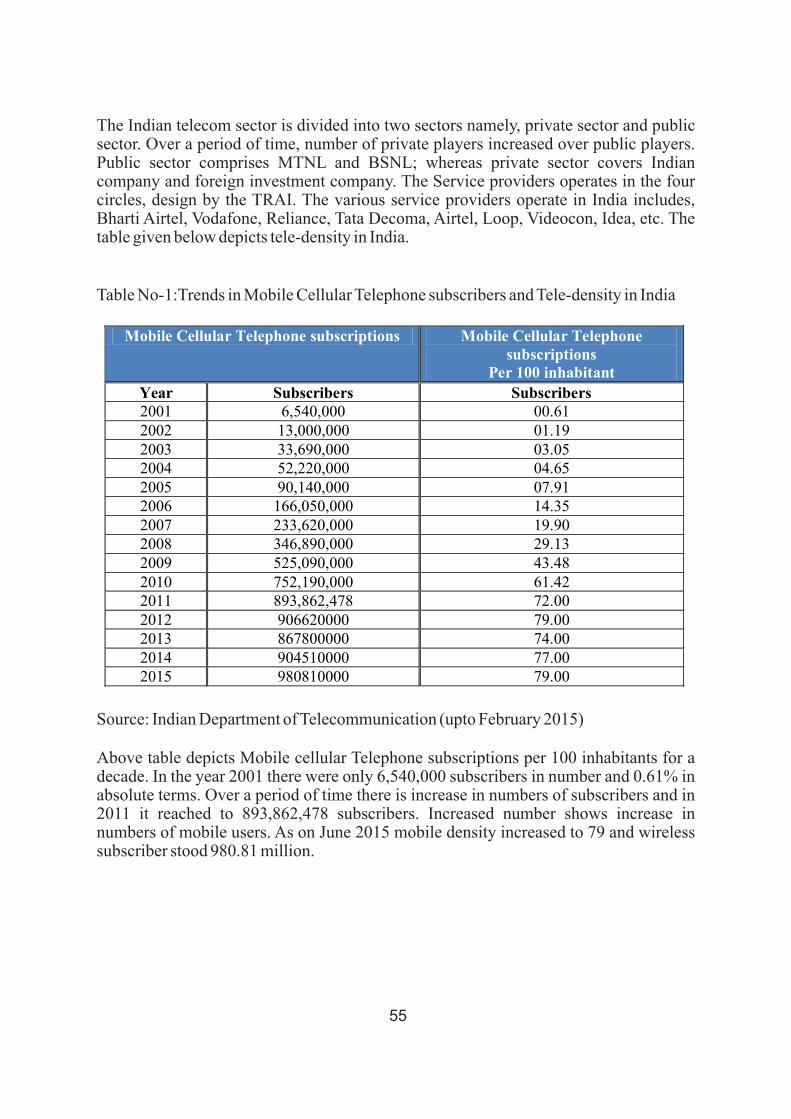
The Indian telecom sector is divided into two sectors namely, private sector and public sector. Over a period of time, number of private players increased over public players. Public sector comprises MTNL and BSNL; whereas private sector covers Indian company and foreign investment company. The Service providers operates in the four circles, design by the TRAI. The various service providers operate in India includes, Bharti Airtel, Vodafone, Reliance, Tata Decoma, Airtel, Loop, Videocon, Idea, etc. The table given below depicts tele-density in India.
Table No-1:Trends in Mobile Cellular Telephone subscribers and Tele-density in India
Source: Indian Department of Telecommunication (upto February 2015)
Above table depicts Mobile cellular Telephone subscriptions per 100 inhabitants for a decade. In the year 2001 there were only 6,540,000 subscribers in number and 0.61% in absolute terms. Over a period of time there is increase in numbers of subscribers and in 2011 it reached to 893,862,478 subscribers. Increased number shows increase in numbers of mobile users. As on June 2015 mobile density increased to 79 and wireless subscriber stood 980.81 million.
Mobile Cellular Telephone subscriptions Mobile Cellular Telephone subscriptions
Per 100 inhabitant
Year Subscribers Subscribers 2001 6,540,000 00.61 2002 13,000,000 01.19 2003 33,690,000 03.05 2004 52,220,000 04.65 2005 90,140,000 07.91 2006 166,050,000 14.35 2007 233,620,000 19.90 2008 346,890,000 29.13 2009 525,090,000 43.48 2010 752,190,000 61.42 2011 893,862,478 72.00 2012 906620000 79.00 2013 867800000 74.00 2014 904510000 77.00 2015 980810000 79.00
55
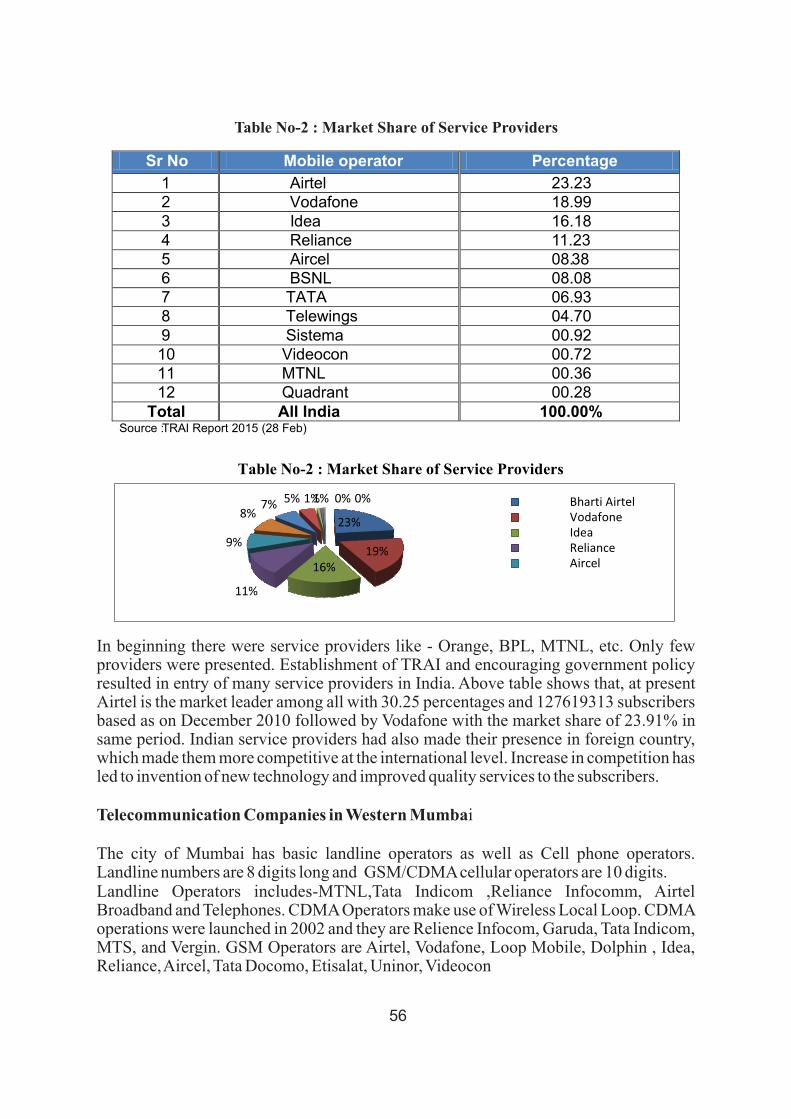
In beginning there were service providers like - Orange, BPL, MTNL, etc. Only few providers were presented. Establishment of TRAI and encouraging government policy resulted in entry of many service providers in India. Above table shows that, at present Airtel is the market leader among all with 30.25 percentages and 127619313 subscribers based as on December 2010 followed by Vodafone with the market share of 23.91% in same period. Indian service providers had also made their presence in foreign country, which made them more competitive at the international level. Increase in competition has led to invention of new technology and improved quality services to the subscribers.
Telecommunication Companies in Western Mumbai
The city of Mumbai has basic landline operators as well as Cell phone operators. Landline numbers are 8 digits long and GSM/CDMA cellular operators are 10 digits.Landline Operators includes-MTNL,Tata Indicom ,Reliance Infocomm, Airtel Broadband and Telephones. CDMA Operators make use of Wireless Local Loop. CDMA operations were launched in 2002 and they are Relience Infocom, Garuda, Tata Indicom, MTS, and Vergin. GSM Operators are Airtel, Vodafone, Loop Mobile, Dolphin , Idea, Reliance, Aircel, Tata Docomo, Etisalat, Uninor, Videocon
Table No-2 : Market Share of Service Providers
Table No-2 : Market Share of Service Providers
56

Table3: Mumbai Wireless Telecom Data and Service Providers
Source:http://www.boneless.in/search/label/2013
In Mumbai wireless telecom market, Vodafone leads with 21.1% share in terms of total subscriber base followed by Reliance (20.2%) and Airtel (12.6%).
Review of LiteratureAccoding to Govind Narayan and Priyanka Jain,August 2011, service charges and plan is most important factor followed by network quality service quality and brand image. The pivotal factor that motivates customer for the selection of MPS is family members, relatives and close friends. This is due the availability of good plan at minimum tariff on the same network.
Debarati Chaterjee and Ishita Choudhari, August 2010, revels that younger age group prefers the prepaid connection compared to post paid connection to restrict expenditure on postpaid connection. Factors like network family friend free connection with the handset offers free calls and SMS etc are the factor affecting the choice of MPS.
According to P.S Rajeshwari and P. Ravilochanan, 2014, research result there is direct relationship between change in number of phone usage and churn. Based on mobile design, people change service provider. Majority phone users are fond of taking internet connection.
Methodology
Objectives
to study the market potential of telecom sector. to figure out the factors influencing choice of service providers in general and youngsters specially. to understand the pre-purchase decision behaviour of youngster for choice of mobile service provider.
Ø
Ø
Ø
Player Total
Subscribers Market Share
Rank Active
% Active
Subscribers
Active market Share
Rank
Aitel 3,828,755 12.6% 3 95.5% 3,656,844 15.5% 3 Vodafone 6,413,152 21.1% 1 90.0% 5,773,119 24.4% 1 Reliance 6,124,823 20.2% 2 92.9% 5,689,348 24.1% 2 Idea 3,109,952 10.2% 5 90.4% 2,812,330 11.9% 4 Tata 3,509,471 11.6% 4 66.8% 2,344,678 09.9% 5 Aircel 1,548,230 05.1% 7 58.0% 0898,593 03.8% 7 MTNL 2,405,455 07.9% 6 39.1% 0939,330 04.0% 6 Others 3,432,955 11.3% -- 44.1% 1,512,754 06.4% -- Total 30,372,793 100% -- 77.8% 23,626,996 100.0% --
57

Research Design
The population for the study was the mobile users with the age group of 16-30 years. Researcher has selected colleges for the data collection. Researcher has taken sample of 200 respondents out of which 172 questionnaires were correctly filled, 28 were rejected and 150 questionnaires were used for research. The questionnaires were design with open-ended questions and close ended questions. Ten factors were identified which affects the decision making process of an individual while selecting particular service provider. The factors are: Initial subscription cost, tariff, network coverage, voice clarity, value added services, monthly charges for the services, free calls and SMS, feedback to complain, availability of plan, corporate image. The respondents were ask to assign order of preference, assign one to most preferred and five to the least preferred factor.
Findings
Market share of Vodafone is highest followed by Airtel in Mumbai.
80% of the youngsters use pre-paid connection.
Good network, low cost, and family and friends using same network are few most
important factor for youngsters for selection of service provider.
Youngsters are more attracted by lower cost package. Due to friend circle they
make more calls. They search service provider who charges less for and provides
more schemes related to data package.
SuggestionsNo doubt Airtel and Vodafone is popular in India. But it is also fact that they are charging high for their service. So they should reduce call charges. Special scheme for the students should be introduced to attract and retain them.
Ø
Ø
Ø
Ø
QUESTIONNAIRE
1. Name: _______________________________________________________________
2. Age: ________________________________________________________________
3. Education: Bachelor Post Graduate
4. Do use mobile phone? Yes No
5. Name your current service provider ______________ .
Hypothesis 1 Hypothesis 2
H0: Attributes are not correlated with population.
H0: Market share of service provider is not increasing.
H1: Attributes are correlated with population.
H1: Market share of service provider is increasing.
58

6. Which type of connection do you have? Pre-paid Post paid
7. What is your monthly expenditure on mobile (approx) ______________ .
8. From how long you are using this service provider?
Less than 6 month 6 month-1 year
1 year-2 years More than 2 years
9. Who was your earlier service provider? ____________________ .
10 why you have chose this service provider? (Rank your preference 1to 5)
11. Suggestion (if any)
__________________________________________________________________________
__________________________________________________________________________
Attributes Rank
1 Good Network
2 Less Initial subscription cost
3 Tariff
4 voice clarity
5 value added services (Ring tone, Caller tune, Missed call alert,
online gaming, etc)
6 Monthly charges for the services
7 Free calls and SMS
8 Feedback to complain
9 Availability of plan
10 Corporate image
59

Indians And The Work Life Balance
Dr. V. S. Kannan Kamalanathan Associate Professor, Vice Principal, KES College,Mumbai
ABSTRACT In today's fast-paced economy, human resource professionals find it difficult to improve the employee's morale, retain employees with valuable company knowledge, and keep pace with workplace trends. In organizations and on the home front, the challenge of work/life balance is rising to the top of many employers' and employees' consciousness. Work-life balance is a matter of concern for both research scholars and business leaders. However, there has been little academic attempt to provide a holistic picture of work-life balance benefits and programmes offered by various organisations. On the basis of the literature and secondary data, the present paper has made an effort to understand the current status of work/life balance in organisations and to identify its future prospects.
Introduction
Work life balance is a serious issue today as long hours at work are stealing quality hours we dedicate to our families and our personal pursuits. Globally, the corporate world is waking up to this reality. Global competition, personal lives/family values, and an aging workforce present challenges that intensify work/life balance. The corporate world's interest in work-life balance started from the West which led the world in rapid industrialization leading to massive urbanization of people, dislocation from traditional abodes of living and hence the breakdown of many centuries-old established structures that ensured balance in lives. Globalization and liberalization in India killed work/life balance. The normal 8 hours duty added with paid overtime radically changed to 10/12 hours duty. Today an IT professional is spending almost 12/14 hours in his duty leaving little time for family and self. The consequences of work-life imbalance started affecting employees' performance at work and hence a record of corporate and workplace initiatives started to take place. However, these policies and practices are more prominent in new economy organisations such as software and services organisations. Moreover, the range of work/life balance practices varies across organisations and there is still a long way to go. The paper suggests that organisations need to incorporate work/life balance practices and encourage it as a culture.
The Genesis of Work/Life Balance
The term “work/life balance” was coined in 1986, although its usage in everyday language was periodic for a number of years. Work/life balance from the employee viewpoint is the dilemma of managing work obligations and personal/family responsibilities. Work/life balance from the employer viewpoint is the challenge of
60

creating a supportive company culture where employees can focus on their jobs while at work.
Interestingly, work/life programs existed as early as the 1930s. Before World War II, the W.K. Kellogg Company created four six-hour shifts to replace the traditional three daily eight-hour shifts, and the new shifts resulted in increased employee morale and efficiency. Rosabeth Moss Kanter's seminal book (1977), Work and Family in the United States: A Critical Review and Agenda for Research and Policy, brought the issue of work/life balance to the forefront of research and organizations. In the 1980s and 1990s, companies began to offer work/life programs. While the first wave of these programs was primarily to support women with children, today's work/life programs are less gender-specific and recognize other commitments as well as those of the family.
Changing and increasing work pressures
A decade back, employees used to have fixed working hours or rather a 9 to 5 job from Monday to Friday. But with globalization and people working across countries, the concept of fixed working hours is fading away. Instead of just 7 or 8 hours a day, people are spending as much as 12-16 hours every day in office. The technological blessings like e-mail, text messaging and cell phones have actually integrated their personal and professional lives. The ever-increasing working hours leave the individuals with less time for themselves and to pursue his hobbies or leisure activities. This hinders the growth of the person as an individual in terms of his personal and professional growth. Professionals working in the BPO industry, doctors, nurses and especially IT professionals are the few examples who are facing the impact of the risk constantly.
Reasons of imbalance
There are various reasons for this imbalance and conflicts from individual career ambitions to pressure of coping up with family and work, the reasons can be different. The speed of advancement of information technology, the increasing competition in the talent supply market has led to a 'performance-driven' culture creating pressures and expectations to performance more and better every time. Also, many a times, many people find it difficult to say "NO" to others especially their superiors. They usually end up over burdening themselves with work. The increasing responsibilities on the personal front with age can also create stress on personal and professional fronts.
Effects
Constant struggle and effort to maintain a balance between the work and personal life can have serious implications on the life of an individual. According to studies, it has been found that such situation can take a toll on the person's health both physiologically and psychologically. Heart ailments, cardiovascular problems, sleep disorders, depression, irritability, jumpiness, insecurity, poor concentration and even nervous breakdowns are becoming common among the victims of such imbalance. Pressure, stress or tension in work life can lead to bad social life and vice versa.
61

· Stress and the Consequences for Employer and Employee
According to a survey conducted in America by the National Life Insurance Company, four out of ten employees state that their jobs are "very" or "extremely" stressful. Those in high-stress jobs are three times more likely than others to suffer from stress-related medical conditions and are twice as likely to quit. The study states that women, in particular, report stress related to the conflict between work and family. The number of stress-related disability claims has doubled. According to the American Institute of Stress, the cost to industry has been estimated at $200 billion-$300 billion a year. There is a sense of inflated competition and everyone wants to beat the other and be the best. The 'best', however, is never achieved because someone else is always perceived as better. A work/life balance survey conducted in 2002 by True Careers states that 70% of more than 1,500 respondents said they don't have a healthy balance between their personal and work lives.
· Depressions
One in six under 60 swallows at least once a week, a pill for the soul, whether it is against depression or just for a bit more drive in the stressful everyday life. The phases of burnout can be described, among other things, first by great ambition, and then follows the suppression of failure and isolation.
Depressions are the major causes of the nearly 10,000 suicides that occur alone each year in Germany. The implications of such imbalances can be further measured in figures: In 1993, early retirement due to mental illness still made 15.4 percent of all cases. In 2008, it was 35.6 percent. Even in the days of illness, the proportion of failures due to mental disorders increased. Statisticians calculated that 41 million absent days in 2008 went to the account of these crises, which led to 3.9 billion Euros in lost production costs. For companies it is time to act and support their employees with a healthy work-life-balance.
· Social implications
There are millions of kids at home after school without an adult. According to a study by the National Institute of Child Health and Human Development, the “more times that children spent in child care, the more likely their teachers were to report behavior problems.” The findings are the results of the largest study of child care and development conducted in the United States; the analysis tracked 1,364 children from birth.
Global comparisons
According to a new study in February 2007 by Harvard and McGill University, the United States lags far behind nearly all wealthy countries when it comes to family-oriented workplace policies such as maternity leave, paid sick days. For example, the study notes that the United States is one of only five countries out of 173 that do not guarantee some form of paid maternity leave. Other differences include the fact that fathers are granted paid paternity leave or paid parental leave in sixty-five countries;
62

thirty one of these countries offer at least fourteen weeks of paid leave. The U.S. does not guarantee this to fathers. At least 107 countries protect working women's right to breast-feed and, in at least seventy-three of them, women are paid. The U.S. does not have any federal legislation guaranteeing mothers the right to breast-feed their infants at work. When it comes to sick days, 145 countries provide sick days to their employees; 127 provide a week or more per year.
Indians and work-life balance
Indians' concerns over balancing work and life have surpassed worries about a slowing economy, according to the bi-annual global consumer opinion survey conducted in April 2008 among 28,253 Internet users in 511 countries from Europe, Asia-Pacific, North America and West Asia.
About 20% of Indians quote achieving this balance as their main worry; 13% cite the economy as the second biggest while (12%) quoted parent's welfare and happiness as third, the highest for any Asian country. Globally, the state of the economy is the biggest concern, with 20% of the respondents citing it. Interestingly, booming emerging markets across Eastern Europe, West Asia and Asia seem to feel the same. Globally, respondents rated job security (10%) as their third biggest concern, followed by health (9%), children's education/welfare (9%) and debt (8%). But concerns differ across regions. While Americans are more worried about finance, respondents from the Asia-Pacific region are more bothered about emotional and physical well-being. Europe is anxious about the environment and for people in West Asia/Africa, it is politics and terrorism.
Work/Life Balance and Women
Women in India have come a long way. From just a skilled homemaker women today have acquired skills and capabilities of not just being a homemaker but being at par with their male counterparts. The biggest difficulty in front of working women is to prioritize her work. Being a mother, by nature, she cannot divert her mind from her kids at any particular point of time and she is always worried about them when she is away from them. This is the biggest dilemma a working woman encounters. She has to manage not only the physical needs of her family – house making, etc., but also their feelings and views. She has to do a very, very delicate balancing act so as to not to appear career-oriented to her family and home-oriented to her employer. She also has to manage the egos of her husband, in-laws, relatives and friends without hurting anybody. The
63

husbands of these working women need to change, understand, support and encourage their wives.
The Employer's Perspective: Return on Investment (ROI)
Work/life balance is important for better productivity and a harmonious work life, but maintaining such balance is the biggest dilemma of the corporate world. In a survey management practices and work-life balance practices, surveying 732 medium sized manufacturing firms in the US, France, Germany and the UK, they found that work/life balance outcomes are significantly associated with better management, so that well run firms are both more productive and better for their employees.
Work/life balance measures
1. Family-Friendly BenefitsBenefits that offer employees to address their personal and family commitments, while at the same time not compromising their work responsibilities. A review of more than 30 surveys regarding work/life balance published from 1997 to 2003 reveals that the number of employers who offer family-friendly benefits has dramatically increased. According to the SHRM® 2003 Benefits Survey by the Society for Human Resource Management USA, the percentage of employers offering family-friendly benefits continues to increase. The top five family-friendly benefits offered are: Dependent care flexible spending accounts (71%), Flextime (55%), Family leave above required leave (39%), Telecommuting on a part-time basis (34%) and compressed workweeks (31%). In 2002, the Work/Life Today Survey conducted by the Alliance for Work/Life Progress revealed that an average of 56% of employees used work/life benefits when offered.
2. Time managementIt is one of the best solutions which can help to reduce the imbalance between the personal and the work life of the employees. Prioritizing the tasks and planning the activities can help to take out some free time which can be utilized for other purposes. Taking some time out for hobbies and leisure activities, spending time with loved ones can help to beat the stress. Workers to learn to say "no" if required.
3. Share and delegate responsibilities:Without checking into your efficiency meter, it can still be safely said that you can do only as much as your body and mind permit. You and your boss are both aware of this fact. So, if you're in a supervisory role, to people giving them independent responsibility. Sharing the responsibilities will help and don't commit for something which is practically impossible.
4. Make work/life balance a target:Achieving work/life balance is a tough call and one has to pursue it with perseverance to reach there. Work on it as a target as it is dependent on your goals and responsibilities at the end of the day. Try and work on the ones that top your strategy agenda. Make the managers responsible to achieve this target
delegate work
64

Conclusion:
Work/life programs have the potential to radically improve employee morale, reduce absenteeism, and retain organizational knowledge, particularly during difficult economic times. Be it employees whose family members and/or friends are called to serve their country, single mothers who are trying to raise their children and make a living, employees who value their personal time, couples struggling to manage dual-career marriages, or companies losing critical knowledge when employees leave for other opportunities, work/life programs offer a win-win situation for employers and employees. Juggling between the obligations towards the families, expectations of the organisation and constant struggle to maintain a balance in work can have serious implications on the life of an individual. Therefore, it is important for employees to maintain a healthy balance between work and their private lives. This will help them achieve their personal and professional goals.
References
Anita B. and Rao, P.S. Eds.(1998) Quality of Work Life in Commercial Banks, New Delhi: Discovery Publishing House.Casio, Wayne F. and Nambudiri, Ranjeet. (2010) Managing Human Resources: Productivity, Quality of work life, Profits, 8th Ed., New Delhi: Tata McGraw Hill Education Pvt. Ltd.Nancy R. Lockwood (2003) Work/ life Balance: Challenges and solutions, SHRM Research Quarterly.Raju, P.V.L. (Ed.)(2004) Work-life Balance: Concepts and Perspectives, Hyderabad: ICFAI
University Press.Robert Tailor, The Future of Work- life Balance, E.S.R.C Economic & Social Research Council, U.S.A. http://www.worklifebalance.com/http://www.worklifebalance.com/worklifebalancedefined.html http://indiatoday.intoday.in/story/Get+work- personal+life+balance+right/1/68588.htmlhttp://www.bia.ca/articles/AReportontheImportanceofWork-LifeBalance.htmhttp://www.inc.com/top-workplaces/2010/how-to-improve-your-employees-work-life-
balance.html
http://www.hrworld.com/features/encourage-work-life-balance-041608
http://www.livemint.com/2008/07/07215101/Indians-care-about-worklife-b.html
http://www.coolavenues.com/mba-journal/human-resources/work-life-balance
http://www.brookes.ac.uk/services/hr/eod/wlb/wlb_report.pdf
http://www.stressstop.com/stress-tips/articles/creating-work-life-balance.php
65

Impact of Global Slow Down on Manufacturing Sector in India
Samita Sengupta,
Research Scholar
Introduction
The most significant change that happened to producers in developing countries in the process of globalization is that they are increasingly exposed to global competition be it in the domestic market or in exports. The developing countries have increased their share in trade in manufactures and those who gained are also those who could climb up the value chain. As a result scope for a new international division emerges that not only makes room for those producing final products but also those capable of specializing in a specific task along the product chain.
Industrialized countries account for more than 2/3 of world industrial output but the share of developing countries is rising (20% in 2000). The share of manufacturing in total economy is higher in developing countries than in industrialized countries. The manufacturing value added (MVA) per capital in industrialized countries is considerably higher than in developing countries.
Table 1 : World Manufacturing – Some Estimated for 2010
The declining trend in global manufacturing value added (MVA) has been accompanied by a marked shift in the location of manufacturing from developed to developing countries. The annual growth of global manufacturing value added slowed from 4.3 per cent between 1995 and 2000 to 2.6 per cent between 2000 and 2005. The growth of manufacturing value added in industrialized countries decelerated to virtual stagnation, growing only at 1.1 per cent in 2000-05 compared with 3.7 per cent in the previous five years. While in developing countries manufacturing value added growth accelerated to 7 per cent from an already rapid 6.5 per cent.
Indicators Unit Industrialized
Countries
Developing
Countries
World
Manufacturing value added (MVA) Bill 2000 US$ 5010 2368 7378
Share in world total In % 67.9 32.1 100.0
Share of MVA in GDP, 2009 In % 16.5 21.7 17.8
MVA per capita 2000 US$ 3588.2 431.2 1070.8
66

Fig. 1 : Leading Manufacturers of the World 2010
Source : United Nations Industrial Development Organization
In the last decade, share of such major industrialized countries as US, Japan and Germany in the world MVA has fallen. China is the main winner who now ranks the second behind the US. Ranks are not stable due to close competition of emerging economies. In coming years, Russia, Mexico and Spain might increase their share and occupy higher position.
India had been big in manufacturing but presently is not really there where the profit margins are the highest. The global yearbook on manufacturing released by United Nation Industrial Development Organisation (UNIDO) on March 29, 2011 showed up the promise in the manufacturing sector and also catching up it has to do, to improve its current 9th rank in the list of leading manufacturers of the world as of 2010. The number one spot in the UNIDO list is still held by the US with China at second place. But after that the difference between the countries ranked 5th to 10th Republic of Korea at 5th position contributes to 3.2 per cent of the world manufacturing value added while Brazil at the 10th place contributes just a share lower at 1.7 per cent. India ranks above Brazil. In the last decade, the share of major industrialized countries like the US, Japan and Germany in world MVA has fallen due to growth of developing countries like India as well as the global recession.
World manufacturing showing the first sign of recovery from the recent financial crisis, UNIDO estimates that the world MVA grew by 5.3 per cent in 2010, since 2006, it was the first year when industrialized countries had a growing trend of industrial production. The MVA of industrialized countries grew by 3.4 per cent in 2010. However, the developing economies were the major force of world industrial growth in 2010, MVA of developing countries grew by 9.4 per cent. Thanks to the high growth rates achieved by developing countries, their share in the world manufacturing has reached 32 per cent compare to 20 per cent 10 years ago.
The India data shows that it is the number one manufacturer in the world (excluding
67

China) in large number of sectors like textile, chemical products, basic metals, machinery and equipments and electrical machinery. It is second in the world in the sectors of medical and precision equipment, motor vehicles and other transport equipment. But disaggregating the number show why those ranks do not push India up the manufacturing league globally. India lags in all sectors where there is strong value add. For instance, within textiles, in branded wearing apparels where the profit margins are the highest India with world share of 2.9 per cent ranks 11th way behind the leader Thailand even Bangladesh and Vietnam rank 3rd and 4th respectively. In office and computing equipment, India's share is 2.6 per cent ranks 6th, again Thailand commands 1st rank and Philippines is at 4th rank. In Radio and Television, Taiwan and Malaysia are at 1st and 2nd rank respectively whereas, India with share of 2 per cent ranks 8th.
Table 2 : Position of India in the Developing World byManufacturing Sectors 2010 (China excluded)
India's development strategy placed a heavy emphasis on the creation of a well diversified industrial base to realize the dream of industry led development. In the last two decades, Indian economy has witnessed a transformational change and has emerged as one of the fastest growing economies of the world. Industrial development in Independent India was catalysed by three major industrial policy resolutions of Government of India in 1948, 1956 and 1991 and have brought about a structural shift enabling the private sector to assume a much large role in all sectors of economy. However, the growth of GDP in India has largely been enabled by a dynamic growth in the services sector.
Though in the recent past, the growth of the manufacturing sector has generally outpaced the overall growth rate of the economy, at just 16.1 percent of GDP in 2009-10 the contribution of the manufacturing sector in India is much below its potential. This situation is a cause of concern when seen in the context of transforming registered in this
Leading Lagging
Sectors India’s Share in %
(rank in parenth)
Sectors India’s Share in %
(rank in parenth)
Textile 16.8 (1) Wearing 2.9 (11)
Printing & publishing 7.5 (3) Thailand (1)
Chemical products 22.2 (1) Bangladesh (3)
Rubber and plastic 8.7 (3) Vietnam (4)
Non-metallic mineral products 9.9 (3) Office and
computing
equipment
2.6 (6)
Basic metals 25.0 (1) Thailand (1)
Machinery and equipment 22.7 (1) Philippines (4)
Electrical machinery 43.8 (1) Radio and
television
2.0 (8)
Medical and precision equipment 12.9 (2) Taiwan (1)
Motor vehicles 16.8 (2) Malaysia (2)
Other transport equipment 17.5 (2)
68

sector by other Asian countries in similar stages of development. The share of manufacturing in China's GDP was 34 per cent in 2007. In India, the average share of manufacturing sector in real GDP increased about 13.2 per cent during 1970-75 to about 15.1 per cent during 2002-07 that is, by just 2 per cent over a period of more than three decades. China was a significant positive outlier (that is China's manufacturing sector contributed more to its national income compared with the historical evidence on countries of similar level of development) in 1981. Whereas, India had approximately the normal share of output and employment in manufacturing in 1981, if compared with countries at a similar level of development and size over the next two decades, when reforms were implemented, so as to remove the constraints on manufacturing sector. If failed to keep pace with the growth of the manufacturing sector in other countries with similar level of development.
Table 3 : Growth Rate of Manufacturing Sector in India
Source : Economic Survey (Various Issues), Government of India.
The manufacturing sector, despite being the driver of industry, has not been grown significantly overtime in terms of its share in the GDP. The share of Indian manufacturing in world manufacturing is also less than 1.4 per cent. The growth of manufacturing is crucial for employment generation, augmentation of domestic supply, resource utilization and value addition and for sustainable growth of exports. Neglect of research and development (R&D) in new technology and skill development continues to shackle growth of the manufacturing sector. High technology base and skilled manpower are crucial for enhancing manufacturing competitiveness in globalised economy. For many
Year Percentage
1955-96 14.1
1996-97 7.3
1997-98 6.7
1998-99 4.4
1999-00 7.1
2000-01 5.3
2001-02 2.9
2002-03 6.0
2003-04 7.4
2004-05 9.2
2005-06 8.9
2006-07 12.5
2007-08 9.05
2008-09 3.5
2009-10 10.9
2010-11 9.2
69

of the economically successful emerging economies, promotion of manufacturing has been a key objective. Some of these countries like South Korea have become technological giants solely on the basis of indigenous learning, skill and R&D effort. China has been the most successful in building the world's largest manufacturing base by giving special attention to technology development. However, faster growth experienced in developing countries has been correlated to the extent of sophistication and diversity of their manufacturing output and exports. These patterns substantiate the notions of “new structuralism” that says that growth of a developing country is not only depend upon the extent of structural change from agriculture to manufacturing but also on the composition of the manufacturing output itself.
Policy Initiatives on Manufacturing in India
The slowdown of growth rate in Indian economy and low share of manufacturing sector in India's GDP necessitated a dedicated policy of manufacturing sector to accelerate development, inclusive growth and provision of gainful employment. The Government of India announced manufacturing policy recently in 2011, with a vision to increase the share of manufacturing in GDP from 16 per cent to 25 per cent by 2022. The policy seeks to present specific action points I the areas identified as constraints that require immediate policy attention. The thrust areas identified which are to be addressed are : digitization of land and resource maps and creation of land and resource maps and creation of land banks by the states; water zoning; offset policy; fiscal and exchange rate measures; strategic acquisitions; development of world class manufacturing management capabilities; trade policy especially boosting India's exports and reforming the role of public sector enterprises. A lower emission inclusive growth strategy is another important area. These issues may be addressed through separate policy initiatives.
The policy statement states that in the last two decades, India economy has witnessed a transformational change and has emerged as one of the fastest growing economies of the world. Economic reforms unveiled in 1991, have brought about a structural shift enabling the private sector to assume a much larger role in all sectors of the economy. Though in recent past, the growth of manufacturing sector has generally outpaced the overall growth rate of the economy, at just over 16 per cent of GDP, the contribution of manufacturing sector in India is much below its potential. This situation is a cause of concern especially when seen in the context of transformation registered in this sector by other Asian countries in similar stages of development. The increasing gap in the sectoral share and the productivity of the manufacturing sector, between India and these economies, indicate that we have not been able to fully leverage the opportunities provided by the dynamics of globalization.
The policy has taken the attendant socio-economic manifestation in terms of over dependence of a large section of the population on agriculture for its livelihood, disguised unemployment and urban unemployment. India has a favourable demographic profile with over 60 per cent of population in the working age group of 15-59 years. For a country with largest young population in the world. This creates a challenge of significant magnitude. Over the next decade, India has to create gainful employment
70
opportunities for a large section of its population, with varying degrees of skills and qualifications. This will entail creation of 220 million jobs by 2025 in order reap the demographic dividend. The manufacturing sector would have to be the bulwark of this employment creation initiatives. Every job created in manufacturing has a multiplier effect of creating two to three additional jobs in related activities.
The development of manufacturing sector is critical from the point of view of ensuring that the growth model of India is sustainable by providing value addition to our natural and agricultural resources, addressing our strategic needs and developing new technologies for the welfare of our citizens. The relatively low level of value addition in the products manufactured in the country, and the growing imports of capital equipment – the building blocks of a country's manufacturing competitiveness also needs to be addressed urgently. Acquiring depth in manufacturing is crucial from the stand point of long-term competitiveness in strategic areas of economy such as defense and telecommunication. It is important to have a strong indigenous value chain addition element from the stand point of national security.
In the background, the Government of India decided to bring out the National Manufacturing Policy with following six objectives:
i) Increase manufacturing sector growth to 12.14 per cent over the medium term to make it the engine of growth for the economy. The 2 to 4 per cent differential over the medium term growth rate of the overall economy will enable manufacturing to contribute at least 25 per cent of the national GDP by 2022.
ii) Increase the rate of job in manufacturing to create 100 million additional jobs by 2022.iii) Creation of appropriate skill sets amount the rural migrant and urban poor to make
growth inclusive. iv) Increase domestic value addition and technological 'depth' in manufacturing. v) Enhance global competitiveness of India manufacturing through appropriate policy
support. vi) Ensure sustainability of growth, particularly with regard to the environment including
energy efficiency, optimal utilization of natural resources and restoration of damaged / degraded eco-systems.
In order to achieve these goals:
i) Foreign investment and technologies will be welcomed while leveraging the country's expanding market for manufactured goods to induce the building of more manufacturing capabilities and technologies within the country.
ii) Competitiveness of enterprises in the country will be the guiding principle in the design and implementation of policies and programmes;
iii) Compliance burden on industry arising out of procedural and regulatory formalities will be reduced through rationalization of business regulations;
iv) Innovation will be encouraged for augmenting productivity, quality and growth of enterprises; and
v) Effective consultative mechanism with all stakeholders will be instituted to ensure
71

mid-course corrections.In the policy specific policy instruments have been conceptualized to achieve the stated objectives which are: i) rationalization and simplification of business regulations; ii) Simple and expeditious exit mechanism for closure of sick units while protecting labour interests; iii) Financial and institutional mechanisms for technology development, including green technologies;iv) Industrial training and skill up gradation measures; v) Incentives for SMEs; vi) Special Focus Sectors; vii) Leveraging infrastructure deficit and government procurement including defence; viii) Clustering and aggregation National Investment and Manufacturing Zone (NIMZs);ix) Trade Policy.
Global experience of manufacturing has shown the advantages of clustering and agglomeration as it enhances supply chain responsiveness, provides easier across to market, talent and substantially lowers logistics costs. Though the government has been executing multiple schemes for promoting industrial clusters, full benefits of agglomeration are yet to be realized. One of the key instruments to catalyse the growth of manufacturing will be establishment of National Investment and Manufacturing Zones (NIMZs) which will be developed in the nature of green filed industrial township, benchmarked with the best manufacturing hubs in the world. These will also help us to meet the increasing demand for creating world class urban centers in India, while will also absorb surplus labour by providing them gainful employment opportunities. These NIMZs will seek to address the infrastructural bottleneck which has been cited as a constraining factor for the growth of manufacturing.
The growth of manufacturing at over 12 per cent per annum over the medium to long-term would exert a lot of pressure on raw materials markets. Arrangements for assured supply of such materials over the long term will be put in place. Acquisition of advanced technology companies would facilitate transfer of technology to the parent manufacturing company, while acquisition of companies enjoying better brand value or strategic location advantages would enhance market access of Indian firms. For these to be achieved a clear set of policy guidelines will be put in place by the government.
As per the Eleventh Five Year Plan 2007-12 Volume I, it is estimated that between 2007-17, 85 million persons will be added to the labour force. The growth of total employment during this period, based on the assumptions about employment elasticity and sectoral GDP growth rates is estimated at 116 million. With incremental job opportunities in agriculture being negative, entire projected increase in workers will be accommodated in the manufacturing and services sectors. Additional job opportunities in manufacturing alone are estimated at 24.5 million during 2006-17. All these jobs would require sector and skill specific trained workforce. Since only 6 per cent of the Indian workforce received any form of vocational training currently, there is pronounced 'skill gap' both in terms of quality and quantity. Overall skill gap would be significantly larger than the incremental workforce as even the existing workforce would need
72

retraining/skill specific training. Recognizing the urgency of interventions needed to address both the qualitative and quantitative gaps in skill development, the National Manufacturing Policy proposes to create a three tier structure for skill development, namely:
i) Skill building among large number of minimally educate workforce; ii) Relevant vocational and skill training through establishment of it is in Public Private
Partnership (PPP) mode; iii) Specialized skill development through establishment of Polytechnics; iv) Establishment of Instructor's Training Centre in each NIMZ.
Special Focus Sectors for Manufacturing in India
While the proposals in this policy paper are sector neutral, it is proposed to identify special focus sectors where India can be cost competitive and which would generate maximum employment. These sectors would need sector specific policy interventions. Some of these sector specific policy interventions are already in place. Their efficacy would need to be examined and wherever necessary additional measures would need to be introduced. The priority sectors as identified in the Planning Commission and National Manufacturing Competitiveness Council (NMCC) papers are:
a) Employment intensive industries like textiles and garments; leather and footwear; gems and jewellery; and food processing.
b) Capital goods like machine tools; heavy electronic equipment; heavy transport, earth moving and mining equipment; high technology equipment like telecom, power, ICT and electronic hardware.
c) Strategic industries like aerospace; shipping, IT and electronic hardware; renewable energy; solar, wind etc; defence equipment.
d) Industries where India enjoys a comparative advantage like automotive; pharmaceuticals.
As UNIDO has also identified textiles; chemicals; basic metals; machinery and equipment and electrical machinery, as sectors in which India leads among developing countries.
The expectation from the manufacturing sector were high due to the emphasis on heavy industries led planning process in India, and the countries with similar levels of development on the eve of planning in India, especially the East Asian economies including China, have been able to make their presence felt in the global market for manufacturing products to a for greater extent than India. Though the composition of GDP in India has undergone substantial changes over the years, the dependence of workforce on manufacturing sector had hardly increased. Historically, during the transition process, manufacturing sector has been the main absorber of mass unskilled labour that gets released from the agriculture sector. Unlike the East Asian economies, India failed to draw employment from agriculture into manufacturing in any significant magnitude. In brief, the manufacturing sector in India has failed to generate adequate
73

employment in general and in organized manufacturing sector in particular.
One of the areas of concern regarding the reform process in the Indian manufacturing has been the deceleration in the rate of growth of real emoluments. Growth of real emoluments has been shrinking over the years and it was infact negative during the later half of the nineties. The worrisome feature of Indian manufacturing sector is stagnancy of per capital real wages. Further, the compensation to supporting staff (especially managerial) has increased since nineties in relation to the workers directly engaged in the production process. This can have direct effect on the motivation for the shop-floor workers. It also explains as to why most of the engineering graduates do not prefer to pursue their engineering skills on the shop-floor and instead prefer to take up managerial positions. It is necessary for the manufacturing sector to retain technologist who are engaged in production process and for this the real per capita income to technologists have to move in tandem with those for the other managerial staff. Productivity increase depends both technology and managerial improvements and India can ill afford to neglect either of these.
Conclusion
Centre of world industrial growth has shifted to developing countries who have increased their share in trade in manufactures and those who gained are also those who could climb up the value chain. India is one of the among the top ten manufacturers of the world as she has important attributes – size, growth and diversity. Shifting of production plants, outsourcing and FDI has contributed to the fall of share of manufacturing in industrialized countries and rise in developing countries. Rapid growth of industry in developing countries may face the challenge related to energy and environment. The manufacturing sector, despite being the driver of industry, has not been grown significantly overtime in terms of it share in the GDP. The growth of is crucial for employment generation, augmentation of domestic supply, resource utilization and value addition and sustainable growth of exports. The Government of India announced National Manufacturing Policy 2011 to accelerate development, inclusive growth and provision of gainful employment. The development of manufacturing sector is critical from the point of view of ensuing that the growth model of India is sustainable by providing value addition to our natural and agricultural resources, addressing our strategic needs, and developing new technologies for the welfare of our citizens. Otherwise, we may be paying heavy price for ignoring the manufacturing sector.
References :
Castells, M. (1996). The Information Age: Economy, Society & Culture, Oxford, Black well, Capitalism, London: Verso.
Economic Survey, (2009-10); Monthly Economic Report April, 2010.
74

Gilpin R., (1987). The Political Economy of International Relations, Princeton: Princeton University Press.
Economic Survey, (2010-11), Government of India, National Manufacturing Policy, p.2
Giddens, Anthony, (1990). The Consequences of Nodernity, Cambridge, Polity.
Government of India, (1991-2008), Economic Survey, Various Issues, Ministry of Finance, Economic Division, New Delhi.
Harvey, D (1989), The Condition of Postmodernity, Oxford, Basil Black well.
Ministry of Commerce, (2011), Government of India, National Manufacturing Policy, p.16
Planning Commission (2010), Government of India, SME Cluster in India, p.13.
RBI (2011), Development Research Group on Productivity, Efficiency and Competitiveness, p.17
Roberston (1990), “Mapping the Global Condition: Globlisation as the Central Concept” in Mike Featherstone (ed) Global Culture, and London: Sage and 1992 Globalisation, London: Sage.
Rosenau, (1990). Turbulence in world politics, Princeton: Princeton University Press.
Roy Kartik, Chandra and Sidras Jorn (2006), Institutions Globalisation and Empowerment, Edward Elgar and Publishing USA.
Shyam Upadhyaya, (2011), Performance of Manufacturing Industries of India: Latest Statistical Evidences, United Nations Industrial Development Organisations, March 29.
The Hindu; June 27, (2011), Playing Heavy Price for Ignoring the Manufacturing Sector.
Wallerstein I, (1983). Historical Capitalism, London, Verso
World Bank, (2003). The Little Data Book, 2003.
75

Women Empowerment in Modern India :Role of Law
Dr. Chandrashekhar V. Joshi, Ph.D, D.Litt
AbstractThis paper highlights the problems faced by women in modern India such as crime, domestic violence, social discrimination, female feticide, sexual harassment and economic and social exploitation. It discusses in brief about the national policy for women. It also gives a brief mention about the women safety laws in India. The paper concludes by stating the need to change the mindset of the society and urges everyone to protect the dignity of a woman.
What does it mean to empower women?
Women Empowerment refers to increasing and improving the social, economic, political and legal strength of the women, to ensure equal-right to women, and to make them confident enough to claim their rights, such as:
· freely live their life with a sense of self-worth, respect and dignity,· have complete control of their life, both within and outside of their home and workplace,· to make their own choices and decisions,· have equal rights to participate in social, religious and public activities,· have equal social status in the society,· have equal rights for social and economic justice,· determine financial and economic choices,· get equal opportunity for education,· get equal employment opportunity without any gender bias,· get safe and comfortable working environment,
Women are not helpless in face of existing challenges. Around the world they are decision-makers for themselves, their families, villages, businesses, and governments. For societies where this is not the case, people speak of the need for women's empowerment. But what does it really mean to empower women? Is it political empowerment, economic empowerment or social empowerment? In fact, these categories are not mutually exclusive. They are mutually reinforcing.
Women's political empowerment, usually envisioned as political participation in elections and government, is necessary to give women a voice in the policies that affect their lives. Women's economic empowerment, which entails that women have the authority to make their own decisions regarding use of their resources, leads to prosperity for families and communities. Social empowerment, often achieved through public policy and education, liberates women from the mistreatment, exploitation, and
76

oppression that inhibit women from reaching their full potential.
Economic empowerment can provide the clout for women to be empowered politically. Political empowerment allows women to take control of the policies that will benefit their economic standing. Social empowerment reinforces the ability to participate economically and politically, which in turn reinforces women's standing in society. Unfortunately, many women are not empowered in these ways.
The barriers preventing women's empowerment extend beyond individuals – there are institutional and systemic reasons why women in some societies cannot participate freely. To break down these barriers, individuals have to work together to reform the laws, social norms, or whichever institutions are inhibiting women's productivity. Societies must also acknowledge the potential for growth and prosperity that can be achieved when women are included.
Women's business associations are an example of one vehicle for women to empower themselves. By networking to build better businesses, women gain economic empowerment. By associating with each other in a business association, women become part of civil society and can have a louder voice when advocating policies that will benefit their lives and businesses. When women have both economic and political power, t h e y b e c o m e f u l l m e m b e r s o f s o c i e t y ( S o u r c e : “http://www.cipe.org/blog/2011/03/07/what-does-it-mean-to-empower-women/”).
Status of Women in India
The status of women in India has been subject to many great changes over the past few millennia. From equal status with men in ancient times, through the low points of the medieval period, to the promotion of equal rights by many reformers, the history of women in India has been eventful. In modern India, women have held high offices in India including that of the President, Prime Minister, Speaker of the Lok Sabha and Leader of the Opposition.
Women's rights are secured under the Constitution of India; mainly, equality, dignity, and freedom from discrimination; further, India has various statutes governing the rights of women.
As of 2016 the Speaker of the Lok Sabha is a woman. However, women in India continue to face numerous problems, including violent victimization through rape, acid throwing, dowry killings and the forced prostitution of young girls.
Ancient India
According to scholars, women in ancient India enjoyed equal status with men in all aspects of life. Works by ancient Indian grammarians such as Patanjali and Katyayana suggest that women were educated in the early Vedic period. Rigvedic verses suggest that women married at a mature age and were probably free to select their own husbands.
77

Scriptures such as the Rig Veda and Upanishads mention several women sages and seers, notably Gargi and Maitreyi.
Medieval period
Indian women's position in society further deteriorated during the medieval period, when child marriages and a ban on remarriage by widows became part of social life in some communities in India. The Muslim conquest in the Indian subcontinent brought purdah to Indian society. Rajputs of Rajasthan practiced the Jauhar. In some parts of India, some of Devadasis were sexually exploited. Polygamy was practiced among Hindu Kshatriya rulers for some political reasons. In many Muslim families, women were restricted to Zenana areas of the house.
Historical practices
Traditions such as Sati, Jauhar, and Devadasi among some communities have been banned and are largely defunct in modern India. However, some instances of these practices are still found in remote parts of India. The purdah is still practiced by Indian women in some communities. Child marriage remains common in rural areas, although it is illegal under current Indian law.
British rule
Women played an important part in India's independence struggle. Some famous freedom fighters include Bhikaji Cama, Dr. Annie Besant, Pritilata Waddedar, Vijayalakshmi Pandit, Rajkumari Amrit Kaur, Aruna Asaf Ali, Sucheta Kriplani and Kasturba Gandhi. Other notable names include Muthulakshmi Reddy and Durgabai Deshmukh. The Rani of Jhansi Regiment of Subhas Chandra Bose's Indian National Army consisted entirely of women, including Captain Lakshmi Sahgal. Sarojini Naidu, a poet and freedom fighter, was the first Indian woman to become President of the Indian National Congress and the first woman to become the governor of a state in India.
Independent IndiaWomen in India now participate fully in areas such as education, sports, politics, media, art and culture, service sectors, science and technology, etc. Indira Gandhi, who served as Prime Minister of India for an aggregate period of fifteen years, is the world's longest serving woman Prime Minister.
The Constitution of India guarantees to all Indian women equality (Article 14), no discrimination by the State (Article 15(1)), equality of opportunity (Article 16), and equal pay for equal work (Article 39(d)). In addition, it allows special provisions to be made by the State in favor of women and children (Article 15(3)), renounces practices derogatory to the dignity of women (Article 51(A) (e)), and also allows for provisions to be made by the State for securing just and humane conditions of work and for maternity relief (Article 42).
78
Feminist activism in India gained momentum in the late 1970s. One of the first national-level issues that brought women's groups together was the Mathura rape case. The acquittal of policemen accused of raping a young girl from Mathura in a police station led to country-wide protests in 1979-1980. The protests, widely covered by the national media, forced the Government to amend the Evidence Act, the Criminal Procedure Code, and the Indian Penal Code; and created a new offence, custodial rape. Female activists also united over issues such as female infanticide, gender bias, women's health, women's safety and women's literacy.
Since alcoholism is often associated with violence against women in India, many women groups launched anti-liquor campaigns in Andhra Pradesh, Himachal Pradesh, Haryana, Odisha, Madhya Pradesh and other states. Many Indian Muslim women have questioned the fundamental leaders' interpretation of women's rights under the Shariat law and have criticized the triple talaq system. In 1990s, grants from foreign donor agencies enabled the formation of new women-oriented NGOs. Self-help groups and NGOs such as Self Employed Women's Association (SEWA) have played a major role in the advancement of women's rights in India. Many women have emerged as leaders of local movements; for example, Medha Patkar of the Narmada Bachao Andolan.
The Government of India declared 2001 as the Year of Women's Empowerment (Swashakti). The National Policy for the Empowerment of Women came was passed in 2001.
In 2006, the case of Imrana, a Muslim rape victim, was highlighted by the media. Imrana was raped by her father-in-law. The pronouncement of some Muslim clerics that Imrana should marry her father-in-law led to widespread protests, and finally Imrana's father-in-law was sentenced to 10 years in prison. The verdict was welcomed by many women's groups and the All India Muslim Personal Law Board.According to a report by Thomson Reuters, India is the "fourth most dangerous country" in the world for women, India was also noted as the worst country for women among the G20 countries, and however, this report has faced criticism for its inaccuracy. On 9 March 2010, one day after International Women's day, Rajya Sabha passed the Women's Reservation Bill requiring that 33% of seats in India's Parliament and state legislative bodies be reserved for women.
EducationThough it is gradually increasing, the female literacy rate in India is less than the male literacy rate. Far fewer girls than boys are enrolled in school, and many girls drop out. In urban India, girls are nearly on a par with boys in terms of education.
Workforce participationContrary to common perception, a large percentage of women in India work. National data collection agencies accept that statistics seriously understate women's contribution as workers. However, there are far fewer women than men in the paid workforce. In urban India, women participate in the workforce in impressive numbers. For example, in the
79

software industry 30% of the workforce is female. In the workplace women enjoy parity with their male counterparts in terms of wages and roles.
In rural India in the agriculture and allied industrial sectors, females account for as much as 89.5% of the labour force. In overall farm production, women's average contribution is estimated at 55% to 66% of the total labour. According to a 1991 World Bank report, women accounted for 94% of total employment in dairy production in India. Women constitute 51% of the total employed in forest-based small-scale enterprises (Source: “https://en.wikipedia.org/wiki/Women_in_India”).
Land and property rightsIn most Indian families, women do not own any property in their own names, and do not get a share of parental property. Due to weak enforcement of laws protecting them, women continue to have little access to land and property. In fact, some of the laws discriminate against women, when it comes to land and property rights. The Hindu personal laws of 1956 (applying to Hindus, Buddhists, Sikhs and Jains) gave women rights to inheritances. However, sons had an independent share in the ancestral property, while the daughters' shares were based on the share received by their father. Hence, a father could effectively disinherit a daughter by renouncing his share of the ancestral property, but a son would continue to have a share in his own right. Additionally, married daughters, even those facing marital harassment, had no residential rights in the ancestral home. Thanks to amendment of the Hindu laws in 2005, women now have the same status as men.
In 1986, the Supreme Court of India ruled that Shah Bano, an elderly divorced Muslim woman, was eligible for maintenance money. However, the decision was vociferously opposed by fundamentalist Muslim leaders, who alleged that the court was interfering in their personal law. The Union Government subsequently passed the Muslim Women's (Protection of Rights Upon Divorce) Act.
Similarly, Christian women have struggled over years for equal rights in divorce and succession. In 1994, all churches, jointly with women's organizations, drew up a draft law called the Christian Marriage and Matrimonial Causes Bill. However, the government has still not amended the relevant laws.
Empowerment of Women in Modern India
Constitutional provisions for women in India:
Art 14: Equality before law and equal protection of law
Art 15: No one should create any sort of discrimination on grounds of religion, race, sex, caste, and place of birth or any of them.
80

Art 16- Equal employment opportunity to every citizen of India
Art 39: (a) Directive principles of state policy ensures that men and women should have an equal right of adequate means of livelihood
(b) Ensures equal pay for equal work for both men and women
Art 42: Casts a duty on every employer to ensure just and humane conditions of work for maternity relief.
Art 243: Ensures reservation of seats in gram panchayat for women
Today women are protected against crimes such as Acid Throwing, Child Marriage, Domestic Violence, Dowry, Female Infanticide and Sex-Selective abortion, Honor Killings, Rape, Sexual Harassment and Trafficking etc through a plethora of Women Safety Laws in India which is mentioned below:
· Guardians & Wards Act, 1890· Indian Penal Code, 1860· Christian Marriage Act, 1872· Indian Evidence Act, 1872· Married Women's Property Act, 1874· Workmen's compensation Act, 1923· Indian Successions Act, 1925· Immoral Traffic (prevention) Act, 1956· Dowry Prohibition Act, 1961· Commission of Sati(Prevention) Act, 1987· Cinematograph Act, 1952· Births, Deaths & Marriages Registration Act, 1886· Minimum Wages Act, 1948· Prevention of Children from Sexual Offences Act, 2012· Child Marriage Restraint Act, 1929· Muslim Personal Law (Shariat) Application,1937· Indecent Representation of Women(Prevention) Act,1986· Special Marriage Act· Hindu Marriage Act, 1955· Hindu Successions Act, 1956· Foreign Marriage Act, 1969· Family Courts Act, 1984· Maternity Benefit Act,1861· Hindu Adoption & Maintenance ACT,1956· Code of Criminal Procedure, 1973· Medical Termination of Pregnancy Act,1971· National Commission for Women Act, 1990· Pre-Natal Diagnostic Techniques (Regulation and Prevention of Misuse) Act,
81

199)· Protection of Women from Domestic Violence Act, 2005· Sexual Harassment of Women at Work Place (Prevention, Prohibition &
Redressal) Act, 2013· Indian Divorce Act, 1969· Equal Remuneration Act, 1976· Hindu Widows Remarriage Act, 1856· Muslim women (protection of rights on divorce) Act, 1986
Rights of Women
Right to free aidWhen a woman goes to the police station without being accompanied by a lawyer she is quoted wrong, ignored or humiliated for her statements. She should be aware of the fact that she has a right to get the legal aid and that she should demand for it. "According to a Delhi High Court ruling, whenever a rape is reported, the senior house officer has to bring this to the notice of the Delhi Legal Services Authority. The legal body then arranges for a lawyer for the victim," says Saumya Bhaumik, a women rights lawyer (Source:” http:// timesofindia. indiatimes.com/life-style/ relationships/ man-woman/10- legal-rights- that-women-should-know/ articleshow/ 50742542.cms”).
Right to privacyA woman who has been raped has a right to record her statement in private, in front of the magistrate without being overheard by anyone else. She also has a freedom to record her statement with a lady constable or a police officer in personal. Under section 164 of the Criminal Procedure Code, the cops will have to give the privacy to the victim without stressing her in front of masses.
Right to untimely registrationThere are many reasons as to why a woman would postpone going to the police to lodge a complaint. She considers her reputation, dignity of the family and threats from the culprit to take her life away. Police in any way cannot say no to register her complaint, no matter if it's too late to register. The self-respect of women comes before anything else. She cannot be denied of anything.
Right to virtual complaintsAccording to the guidelines issued by the Delhi Police, a woman has the privilege of lodging a complaint via email or registered post. If, for some reason, a woman can't go to the police station, she can send a written complaint through an email or registered post addressed to a senior police officer of the level of Deputy Commissioner or Commissioner of Police. The officer then directs the SHO of the police station, of the area where the incident occurred, to conduct proper verification of the complainant and lodge an FIR. The police can then come over to the residence of the victim to take her statement.
Right to Zero FIRA rape victim can register her police complaint from any police station under the Zero
82

FIR ruling by Supreme Court. "Sometimes, the police station under which the incident occurs refuses to register the victim's complaint in order to keep clear of responsibility, and tries sending the victim to another police station. In such cases, she has the right to lodge an FIR at any police station in the city under the Zero FIR ruling. The senior officer will then direct the SHO of the concerned police station to lodge the FIR," says Abeed. This is a Supreme Court ruling that not many women are aware of, so don't let the SHO of a police station send you away saying it "doesn't come under his area" (Source:” http:// timesofindia. indiatimes.com/life-style/ relationships/ man-woman/10- legal-rights- that-women-should-know/ articleshow/ 50742542.cms”).
Right to no arrestAccording to a Supreme Court ruling, a woman cannot be arrested after sunset and before sunrise. There are many cases of women being harassed by the police at wee hours, but all this can be avoided if you exercise the right of being present in the police station only during daytime. "Even if there is a woman constable accompanying the officers, the police can't arrest a woman at night. In case the woman has committed a serious crime, the police require getting it in writing from the magistrate explaining why the arrest is necessary during the night," says Saumya Bhaumik.
Right to not being called to the police stationWomen cannot be called to the police station for interrogation under Section 160 of the Criminal Procedure Code. This law provides Indian women the right of not being physically present at the police station for interrogation. "The police can interrogate a woman at her residence in the presence of a woman constable and family members or friends," says Abeed. So, the next time you're called to the police station for queries or interrogation when you have faced any kind of harassment, quote this guideline of the Supreme Court to exercise your right and remind the cops about it.
Right to confidentialityUnder no circumstances can the identity of a rape victim be revealed. Neither the police nor media can make known the name of the victim in public. Section 228-A of the Indian Penal Code makes the disclosure of a victim's identity a punishable offense. Printing or publishing the name or any matter which may make known the identity of a woman against whom an offense has been committed is punishable. This is done to prevent social victimization or ostracism of the victim of a sexual offense. Even while a judgment is in progress at the high court or a lower court, the name of the victim is not indicated, she is only described as 'victim' in the judgment.
Right towards crime and not a medical conditionA case of rape can't be dismissed even if the doctor says that rape has not taken place. A victim of rape needs to be medically examined as per Section 164 A of the Criminal Procedure Code, and only the report can act as proof. "A woman has the right to have a copy of the medical report from the doctor. Rape is crime and not a medical condition. It is a legal term and not a diagnosis to be made by the medical officer treating the victim. The only statement that can be made by the medical officer is that there is evidence of recent sexual activity. Whether the rape has occurred or not is a legal conclusion and the doctor can't decide on this.
83

Right to no sexual harassmentIt is the duty of every employer to create a Sexual Harassment Complaints Committee within the organization for complaints. According to a guideline issued by the Supreme Court, it is mandatory for all firms, public and private, to set up these committees to resolve matters of sexual harassment. It is also necessary that the committee be headed by a woman and comprise of 50% women, as members. Also, one of the members should be from a women's welfare group.
Improvements to the Legal System
The outpouring of anger and grief following rape and murder gives rise to hopes for change in India. The government responded with the passage of several new sexual assault laws, including a mandatory minimum sentence of 20 years for gang rape, and six new fast-track courts created solely for rape prosecutions. As an indicator of the scope of the problem of rape prosecution, the "Nirbhaya" case was the only conviction obtained among the 706 rape cases filed in New Delhi in 2012. Between 16 December 2012 and 4 January 2013, Delhi police recorded 501 allegations of harassment and 64 of rape, but only four inquiries were launched. However, it appears that the "Nirbhaya" case has had an effect on the willingness of rape or molestation victims to report the crime; police records show that during the final nine months of 2013 almost twice as many rape victims filed a police report and four times as many allegations of molestation were made. A recent report released by the National Crime Records Bureau shows that 95 percent of the cases brought to the police were classified as a crime. However, there is a large backlog of cases with fewer than 15 percent of those charged tried in 2012, leaving 85 percent waiting to come to trial.
Conclusion
Indian women have had an extremely difficult time developing under the oppression of a male-dominated society, class and religion. But now it's the time to break silence. Women are entitled to respect. If every parent taught his or her son to respect women and treat them with dignity, a day would have come when they would not fear for the safety of their daughter. That would be a real education. Of course, there is a need to change our mindset and the patriarchal views that have engulfed Indian mindsets since ages.
In India by and large it is seen that Indian women are not safe. Only legislation cannot bring the security, dignity and status to the women but there is an urgent need to change the mindset of the society every member of the society be urged to protect the dignity of a woman.
Indian woman has come a long way and prove that she is capable of doing anything and equal partner in the growth and prosperity of the nation. Women are one of the pillars of the society and it would be very difficult to imagine society without the presence of women. Now it is high time for all of us to understand the power of women. Even our judiciary and legislature has also accepted the fact that women are one of the most important elements of society and their exploitation would not be accepted at any cost. There is one saying that behind every successful man there is a woman. This saying is
84

enough to prove that man and women both are necessary element of society. Women plays different role in her life which is not an easy task. During her life she acts as daughter, wife, sister and mother at different stages of life. So we must give them due care and respect and understand their efforts towards welfare of the society at large. This article is a modest attempt to cover the constitutional, judiciary and legislative rights of women against the crimes which they are facing for quite some time now. Hope that this article will help the readers to understand that rights of women are very necessary and Indian law is strong enough to protect women from any kind of harassment and torture.
References
Web-Sites
· http:// www. business dictionary. Com / definition / empowerment.html
· http://www.cipe.org/blog/2011/03/07/what-does-it-mean-to-empower-women
· https:// en. wikipedia. org/wiki/ 2012_ Delhi_gang_rape
· http:// timesofindia. indiatimes.com/life-style/ relationships/ man-woman/10-
legal-rights- that-women-should-know/ articleshow/ 50742542.cms
85

