vol. 7, no. 10 | 1 oct 2016 | biomedical optics express 4289
TRANSCRIPT

Dynamic contrast optical coherence tomography images transit time and quantifies microvascular plasma volume and flow in the retina and choriocapillaris
CONRAD W. MERKLE,1 CONOR LEAHY,1 AND VIVEK J. SRINIVASAN1,2,*
1Department of Biomedical Engineering, University of California Davis, Davis, California, USA 2Department of Ophthalmology and Vision Science, University of California Davis School of Medicine,
Sacramento, California, USA *[email protected]
Abstract: Despite the prevalence of optical imaging techniques to measure hemodynamics in
large retinal vessels, quantitative measurements of retinal capillary and choroidal
hemodynamics have traditionally been challenging. Here, a new imaging technique called
dynamic contrast optical coherence tomography (DyC-OCT) is applied in the rat eye to study
microvascular blood flow in individual retinal and choroidal layers in vivo. DyC-OCT is
based on imaging the transit of an intravascular tracer dynamically as it passes through the
field-of-view. Hemodynamic parameters can be determined through quantitative analysis of
tracer kinetics. In addition to enabling depth-resolved transit time, volume, and flow
measurements, the injected tracer also enhances OCT angiograms and enables clear
visualization of the choriocapillaris, particularly when combined with a post-processing
method for vessel enhancement. DyC-OCT complements conventional OCT angiography
through quantification of tracer dynamics, similar to fluorescence angiography, but with the
important added benefit of laminar resolution.
©2016 Optical Society of America
OCIS codes: (110.4500) Optical coherence tomography; (170.3880) Medical and biological imaging; (170.5380)
Physiology; (170.1470) Blood or tissue constituent monitoring; (170.6900) Three-dimensional microscopy;
(170.5755) Retina scanning.
References and links
1. T. E. Kornfield and E. A. Newman, “Regulation of blood flow in the retinal trilaminar vascular network,” J.
Neurosci. 34(34), 11504–11513 (2014). 2. E. A. Newman, “Functional hyperemia and mechanisms of neurovascular coupling in the retinal vasculature,” J.
Cereb. Blood Flow Metab. 33(11), 1685–1695 (2013).
3. J. Kur, E. A. Newman, and T. Chan-Ling, “Cellular and physiological mechanisms underlying blood flow regulation in the retina and choroid in health and disease,” Prog. Retin. Eye Res. 31(5), 377–406 (2012).
4. S. S. Hayreh, “In vivo choroidal circulation and its watershed zones,” Eye (Lond.) 4(2), 273–289 (1990).
5. G. Li, J. W. Kiel, D. P. Cardenas, B. H. De La Garza, and T. Q. Duong, “Postocclusive reactive hyperemia occurs in the rat retinal circulation but not in the choroid,” Invest. Ophthalmol. Vis. Sci. 54(7), 5123–5131
(2013).
6. A. Alm and A. Bill, “Blood flow and oxygen extraction in the cat uvea at normal and high intraocular pressures,” Acta Physiol. Scand. 80(1), 19–28 (1970).
7. A. Alm and A. Bill, “The oxygen supply to the retina. II. Effects of high intraocular pressure and of increased
arterial carbon dioxide tension on uveal and retinal blood flow in cats. A study with radioactively labelled
microspheres including flow determinations in brain and some other tissues,” Acta Physiol. Scand. 84(3), 306–
319 (1972).
8. H. R. Novotny and D. L. Alvis, “A method of photographing fluorescence in circulating blood in the human retina,” Circulation 24(1), 82–86 (1961).
9. G. Bjärnhall, L. Tomic, H. K. Mishima, H. Tsukamoto, and A. Alm, “Retinal mean transit time in patients with
primary open-angle glaucoma and normal-tension glaucoma,” Acta Ophthalmol. Scand. 85(1), 67–72 (2007). 10. R. W. Flower, “Extraction of choriocapillaris hemodynamic data from ICG fluorescence angiograms,” Invest.
Ophthalmol. Vis. Sci. 34(9), 2720–2729 (1993).
11. L. Tomic, O. Mäepea, G. O. Sperber, and A. Alm, “Comparison of retinal transit times and retinal blood flow: a study in monkeys,” Invest. Ophthalmol. Vis. Sci. 42(3), 752–755 (2001).
Vol. 7, No. 10 | 1 Oct 2016 | BIOMEDICAL OPTICS EXPRESS 4289
#269104 Journal © 2016
http://dx.doi.org/10.1364/BOE.7.004289 Received 30 Jun 2016; revised 19 Aug 2016; accepted 16 Sep 2016; published 27 Sep 2016

12. D. R. Williams, “Imaging single cells in the living retina,” Vision Res. 51(13), 1379–1396 (2011).
13. J. A. Martin and A. Roorda, “Direct and noninvasive assessment of parafoveal capillary leukocyte velocity,” Ophthalmology 112(12), 2219–2224 (2005).
14. Z. Zhong, B. L. Petrig, X. Qi, and S. A. Burns, “In vivo measurement of erythrocyte velocity and retinal blood
flow using adaptive optics scanning laser ophthalmoscopy,” Opt. Express 16(17), 12746–12756 (2008). 15. J. Tam, P. Tiruveedhula, and A. Roorda, “Characterization of single-file flow through human retinal parafoveal
capillaries using an adaptive optics scanning laser ophthalmoscope,” Biomed. Opt. Express 2(4), 781–793
(2011). 16. Z. Chen, T. E. Milner, D. Dave, and J. S. Nelson, “Optical Doppler tomographic imaging of fluid flow velocity
in highly scattering media,” Opt. Lett. 22(1), 64–66 (1997).
17. J. A. Izatt, M. D. Kulkarni, S. Yazdanfar, J. K. Barton, and A. J. Welch, “In vivo bidirectional color Doppler flow imaging of picoliter blood volumes using optical coherence tomography,” Opt. Lett. 22(18), 1439–1441
(1997).
18. B. White, M. Pierce, N. Nassif, B. Cense, B. Park, G. Tearney, B. Bouma, T. Chen, and J. de Boer, “In vivo dynamic human retinal blood flow imaging using ultra-high-speed spectral domain optical coherence
tomography,” Opt. Express 11(25), 3490–3497 (2003).
19. Y. Wang, B. A. Bower, J. A. Izatt, O. Tan, and D. Huang, “Retinal blood flow measurement by circumpapillary Fourier domain Doppler optical coherence tomography,” J. Biomed. Opt. 13(6), 064003 (2008).
20. V. J. Srinivasan, S. Sakadzić, I. Gorczynska, S. Ruvinskaya, W. Wu, J. G. Fujimoto, and D. A. Boas,
“Quantitative cerebral blood flow with optical coherence tomography,” Opt. Express 18(3), 2477–2494 (2010). 21. B. Baumann, B. Potsaid, M. F. Kraus, J. J. Liu, D. Huang, J. Hornegger, A. E. Cable, J. S. Duker, and J. G.
Fujimoto, “Total retinal blood flow measurement with ultrahigh speed swept source/Fourier domain OCT,”
Biomed. Opt. Express 2(6), 1539–1552 (2011). 22. S. Makita, Y. Hong, M. Yamanari, T. Yatagai, and Y. Yasuno, “Optical coherence angiography,” Opt. Express
14(17), 7821–7840 (2006).
23. Y. K. Tao, A. M. Davis, and J. A. Izatt, “Single-pass volumetric bidirectional blood flow imaging spectral domain optical coherence tomography using a modified Hilbert transform,” Opt. Express 16(16), 12350–12361
(2008). 24. B. J. Vakoc, G. J. Tearney, and B. E. Bouma, “Statistical properties of phase-decorrelation in phase-resolved
Doppler optical coherence tomography,” IEEE Trans. Med. Imaging 28(6), 814–821 (2009).
25. R. K. Wang, S. L. Jacques, Z. Ma, S. Hurst, S. R. Hanson, and A. Gruber, “Three dimensional optical angiography,” Opt. Express 15(7), 4083–4097 (2007).
26. B. Braaf, K. A. Vermeer, K. V. Vienola, and J. F. de Boer, “Angiography of the retina and the choroid with
phase-resolved OCT using interval-optimized backstitched B-scans,” Opt. Express 20(18), 20516–20534 (2012). 27. B. Braaf, K. V. Vienola, C. K. Sheehy, Q. Yang, K. A. Vermeer, P. Tiruveedhula, D. W. Arathorn, A. Roorda,
and J. F. de Boer, “Real-time eye motion correction in phase-resolved OCT angiography with tracking SLO,”
Biomed. Opt. Express 4(1), 51–65 (2013).
28. H. C. Hendargo, R. Estrada, S. J. Chiu, C. Tomasi, S. Farsiu, and J. A. Izatt, “Automated non-rigid registration
and mosaicing for robust imaging of distinct retinal capillary beds using speckle variance optical coherence
tomography,” Biomed. Opt. Express 4(6), 803–821 (2013). 29. A. Mariampillai, B. A. Standish, E. H. Moriyama, M. Khurana, N. R. Munce, M. K. K. Leung, J. Jiang, A.
Cable, B. C. Wilson, I. A. Vitkin, and V. X. D. Yang, “Speckle variance detection of microvasculature using
swept-source optical coherence tomography,” Opt. Lett. 33(13), 1530–1532 (2008). 30. D. M. Schwartz, J. Fingler, D. Y. Kim, R. J. Zawadzki, L. S. Morse, S. S. Park, S. E. Fraser, and J. S. Werner,
“Phase-variance optical coherence tomography: a technique for noninvasive angiography,” Ophthalmology
121(1), 180–187 (2014). 31. Y. Jia, O. Tan, J. Tokayer, B. Potsaid, Y. Wang, J. J. Liu, M. F. Kraus, H. Subhash, J. G. Fujimoto, J. Hornegger,
and D. Huang, “Split-spectrum amplitude-decorrelation angiography with optical coherence tomography,” Opt.
Express 20(4), 4710–4725 (2012). 32. V. J. Srinivasan, H. Radhakrishnan, E. H. Lo, E. T. Mandeville, J. Y. Jiang, S. Barry, and A. E. Cable, “OCT
methods for capillary velocimetry,” Biomed. Opt. Express 3(3), 612–629 (2012).
33. A. Bouwens, D. Szlag, M. Szkulmowski, T. Bolmont, M. Wojtkowski, and T. Lasser, “Quantitative lateral and axial flow imaging with optical coherence microscopy and tomography,” Opt. Express 21(15), 17711–17729
(2013).
34. P. Cimalla, J. Walther, M. Mittasch, and E. Koch, “Shear flow-induced optical inhomogeneity of blood assessed
in vivo and in vitro by spectral domain optical coherence tomography in the 1.3 μm wavelength range,” J.
Biomed. Opt. 16(11), 116020 (2011).
35. A. Roggan, M. Friebel, K. Dorschel, A. Hahn, and G. Muller, “Optical Properties of Circulating Human Blood in the Wavelength Range 400-2500 nm,” J. Biomed. Opt. 4(1), 36–46 (1999).
36. H. Cheng, G. Nair, T. A. Walker, M. K. Kim, M. T. Pardue, P. M. Thulé, D. E. Olson, and T. Q. Duong,
“Structural and functional MRI reveals multiple retinal layers,” Proc. Natl. Acad. Sci. U.S.A. 103(46), 17525–17530 (2006).
37. Y. Zhang, O. San Emeterio Nateras, Q. Peng, C. A. Rosende, and T. Q. Duong, “Blood flow MRI of the human
retina/choroid during rest and isometric exercise,” Invest. Ophthalmol. Vis. Sci. 53(7), 4299–4305 (2012).
Vol. 7, No. 10 | 1 Oct 2016 | BIOMEDICAL OPTICS EXPRESS 4290

38. A. Harris, R. C. Sergott, G. L. Spaeth, J. L. Katz, J. A. Shoemaker, and B. J. Martin, “Color Doppler analysis of
ocular vessel blood velocity in normal-tension glaucoma,” Am. J. Ophthalmol. 118(5), 642–649 (1994). 39. L. Schmetterer, S. Dallinger, O. Findl, H. G. Eichler, and M. Wolzt, “A comparison between laser
interferometric measurement of fundus pulsation and pneumotonometric measurement of pulsatile ocular blood
flow. 1. Baseline considerations,” Eye (Lond.) 14(1), 39–45 (2000). 40. D. M. Silver, R. A. Farrell, M. E. Langham, V. O’Brien, and P. Schilder, “Estimation of pulsatile ocular blood
flow from intraocular pressure,” Acta Ophthalmol. Suppl. 191, 25–29 (1989).
41. D. Y. Kim, J. Fingler, R. J. Zawadzki, S. S. Park, L. S. Morse, D. M. Schwartz, S. E. Fraser, and J. S. Werner, “Optical imaging of the chorioretinal vasculature in the living human eye,” Proc. Natl. Acad. Sci. U.S.A.
110(35), 14354–14359 (2013).
42. W. Choi, K. J. Mohler, B. Potsaid, C. D. Lu, J. J. Liu, V. Jayaraman, A. E. Cable, J. S. Duker, R. Huber, and J. G. Fujimoto, “Choriocapillaris and choroidal microvasculature imaging with ultrahigh speed OCT angiography,”
PLoS One 8(12), e81499 (2013).
43. B. Braaf, K. A. Vermeer, V. A. D. P. Sicam, E. van Zeeburg, J. C. van Meurs, and J. F. de Boer, “Phase-stabilized optical frequency domain imaging at 1-µm for the measurement of blood flow in the human choroid,”
Opt. Express 19(21), 20886–20903 (2011).
44. M. Miura, S. Makita, T. Iwasaki, and Y. Yasuno, “An approach to measure blood flow in single choroidal vessel using Doppler optical coherence tomography,” Invest. Ophthalmol. Vis. Sci. 53(11), 7137–7141 (2012).
45. C. W. Merkle and V. J. Srinivasan, “Laminar microvascular transit time distribution in the mouse somatosensory
cortex revealed by Dynamic Contrast Optical Coherence Tomography,” Neuroimage 125, 350–362 (2016). 46. Y. Pan, J. You, N. D. Volkow, K. Park, and C. Du, “Ultrasensitive detection of 3D cerebral microvascular
network dynamics in vivo,” Neuroimage 103, 492–501 (2014).
47. K. L. Zierler, “Equations for Measuring Blood Flow by External Monitoring of Radioisotopes,” Circ. Res. 16(4), 309–321 (1965).
48. L. Ostergaard, A. G. Sorensen, K. K. Kwong, R. M. Weisskoff, C. Gyldensted, and B. R. Rosen, “High resolution
measurement of cerebral blood flow using intravascular tracer bolus passages. Part II: Experimental comparison and preliminary results,” Magn. Reson. Med. 36, 726–736 (1996).
49. P. Meier and K. L. Zierler, “On the theory of the indicator-dilution method for measurement of blood flow and volume,” J. Appl. Physiol. 6(12), 731–744 (1954).
50. X. Wen, V. V. Tuchin, Q. Luo, and D. Zhu, “Controling the scattering of intralipid by using optical clearing
agents,” Phys. Med. Biol. 54(22), 6917–6930 (2009). 51. L. Ostergaard, R. M. Weisskoff, D. A. Chesler, C. Gyldensted, and B. R. Rosen, “High resolution measurement
of cerebral blood flow using intravascular tracer bolus passages. Part I: Mathematical approach and statistical
analysis,” Magn. Reson. Med. 36, 715–725 (1996). 52. W. M. Kuebler, A. Sckell, O. Habler, M. Kleen, G. E. Kuhnle, M. Welte, K. Messmer, and A. E. Goetz,
“Noninvasive measurement of regional cerebral blood flow by near-infrared spectroscopy and indocyanine
green,” J. Cereb. Blood Flow Metab. 18(4), 445–456 (1998).
53. H. Radhakrishnan and V. J. Srinivasan, “Compartment-resolved imaging of cortical functional hyperemia with
OCT angiography,” Biomed. Opt. Express 4(8), 1255–1268 (2013).
54. C. Leahy, H. Radhakrishnan, G. Weiner, J. L. Goldberg, and V. J. Srinivasan, “Mapping the 3D Connectivity of the Rat Inner Retinal Vascular Network Using OCT Angiography,” Invest. Ophthalmol. Vis. Sci. 56(10), 5785–
5793 (2015).
55. L. V. Chinta, L. Lindvere, and B. Stefanovic, “Robust quantification of microvascular transit times via linear dynamical systems using two-photon fluorescence microscopy data,” J. Cereb. Blood Flow Metab. 32(9), 1718–
1724 (2012).
56. R. Fahraeus and T. Lindqvist, “The viscosity of the blood in narrow capillary tubes,” Am. J. Physiol. 96, 562–568 (1931).
57. R. D. Braun, C. A. Wienczewski, and A. Abbas, “Erythrocyte flow in choriocapillaris of normal and diabetic
rats,” Microvasc. Res. 77(3), 247–255 (2009). 58. S. N. Jespersen and L. Østergaard, “The roles of cerebral blood flow, capillary transit time heterogeneity, and
oxygen tension in brain oxygenation and metabolism,” J. Cereb. Blood Flow Metab. 32(2), 264–277 (2012).
59. D. C. Morris, Z. Zhang, K. Davies, J. Fenstermacher, and M. Chopp, “High resolution quantitation of microvascular plasma perfusion in non-ischemic and ischemic rat brain by laser-scanning confocal microscopy,”
Brain Res. Brain Res. Protoc. 4(2), 185–191 (1999).
60. T. M. Mayhew and D. Astle, “Photoreceptor number and outer segment disk membrane surface area in the retina
of the rat: stereological data for whole organ and average photoreceptor cell,” J. Neurocytol. 26(1), 53–61
(1997).
61. C. Desjardins and B. R. Duling, “Microvessel hematocrit: measurement and implications for capillary oxygen transport,” Am. J. Physiol. 252(3 Pt 2), H494–H503 (1987).
62. M. Pouliot, M. C. Deschênes, S. Hétu, S. Chemtob, M. R. Lesk, R. Couture, and E. Vaucher, “Quantitative and
regional measurement of retinal blood flow in rats using N-isopropyl-p-[14C]-iodoamphetamine ([14C]-IMP),” Exp. Eye Res. 89(6), 960–966 (2009).
63. V. J. Srinivasan and H. Radhakrishnan, “Total average blood flow and angiography in the rat retina,” J. Biomed.
Opt. 18(7), 076025 (2013).
Vol. 7, No. 10 | 1 Oct 2016 | BIOMEDICAL OPTICS EXPRESS 4291
64. Y. Y. Shih, L. Wang, B. H. De La Garza, G. Li, G. Cull, J. W. Kiel, and T. Q. Duong, “Quantitative retinal and
choroidal blood flow during light, dark adaptation and flicker light stimulation in rats using fluorescent microspheres,” Curr. Eye Res. 38(2), 292–298 (2013).
65. G. Li, B. De La Garza, Y. Y. Shih, E. R. Muir, and T. Q. Duong, “Layer-specific blood-flow MRI of retinitis
pigmentosa in RCS rats,” Exp. Eye Res. 101, 90–96 (2012). 66. J. Lin and S. Roth, “Ischemic preconditioning attenuates hypoperfusion after retinal ischemia in rats,” Invest.
Ophthalmol. Vis. Sci. 40(12), 2925–2931 (1999).
67. R. G. Tilton, K. Chang, C. Weigel, D. Eades, W. R. Sherman, C. Kilo, and J. R. Williamson, “Increased ocular blood flow and 125I-albumin permeation in galactose-fed rats: inhibition by sorbinil,” Invest. Ophthalmol. Vis.
Sci. 29(6), 861–868 (1988).
68. R. G. Tilton, K. C. Chang, W. S. LeJeune, C. C. Stephan, T. A. Brock, and J. R. Williamson, “Role for nitric oxide in the hyperpermeability and hemodynamic changes induced by intravenous VEGF,” Invest. Ophthalmol.
Vis. Sci. 40(3), 689–696 (1999).
69. L. Wang, B. Fortune, G. Cull, K. M. McElwain, and G. A. Cioffi, “Microspheres method for ocular blood flow measurement in rats: size and dose optimization,” Exp. Eye Res. 84(1), 108–117 (2007).
70. D. Y. Yu, V. A. Alder, and S. J. Cringle, “Measurement of blood flow in rat eyes by hydrogen clearance,” Am. J.
Physiol. 261(3 Pt 2), H960–H968 (1991). 71. H. Ludot, J. Y. Tharin, M. Belouadah, J. X. Mazoit, and J. M. Malinovsky, “Successful resuscitation after
ropivacaine and lidocaine-induced ventricular arrhythmia following posterior lumbar plexus block in a child,”
Anesth. Analg. 106, 1572–1574 (2008). 72. M. A. Rosenblatt, M. Abel, G. W. Fischer, C. J. Itzkovich, and J. B. Eisenkraft, “Successful use of a 20% lipid
emulsion to resuscitate a patient after a presumed bupivacaine-related cardiac arrest,” Anesthesiology 105(1),
217–218 (2006). 73. S. Ciechanowicz and V. Patil, “Lipid emulsion for local anesthetic systemic toxicity,” Anesthesiol. Res. Pract.
2012, 131784 (2012).
74. A. Biesemeier, T. Taubitz, S. Julien, E. Yoeruek, and U. Schraermeyer, “Choriocapillaris breakdown precedes
retinal degeneration in age-related macular degeneration,” Neurobiol. Aging 35(11), 2562–2573 (2014).
1. Introduction
Blood is supplied to retinal tissue by two distinct microcirculatory beds. The inner retinal
circulation, arising from the central retinal (and/or cilioretinal) artery and draining through the
central retinal vein, has a three-layered (“trilaminar”) architecture that primarily feeds the
ganglion cell and plexiform layers of the inner retina [1,2]. The retinal circulation is thought
to be regulated by central nervous system mechanisms that operate in the brain, including
neurovascular coupling, blood gases, and autoregulation [3]. The choroidal circulation, which
supplies the metabolically active photoreceptors and outer retina, arises from the posterior
ciliary arteries and drains through the vortex veins [4]. The choroid is a high flow vascular
bed that is also thought to be weakly regulated [5]. Though sometimes assumed to be
“overperfused” based on its high flow and low oxygen extraction [6,7], knowledge of the
choroidal circulation is limited, in part, by the lack of appropriate high resolution
methodologies to study it in vivo.
Fluorescence angiography, based on the transit of a fluorescent tracer (fluorescein or
indocyanine green, ICG) through the vasculature, is routinely used qualitatively to assess
arteriovenous transit times or vascular permeability in clinical examination. However,
because fluorescence angiography images are essentially photographs of the fundus [8], no
depth resolution is achieved. ICG angiography, with a longer excitation and emission
wavelength than fluorescein, enables improved assessment of choroidal circulation. Though
occasionally fluorescence angiography is used quantitatively [9–11], measuring transit times
at the capillary level, as well as the resolution of flow in small vessels in different layers (i.e.,
retina vs. choroid), remains challenging.
Since ocular clarity and optical quality are needed for good vision, the inner retinal
vasculature, situated proximal to the photoreceptors, is usually accessible to high-resolution
optical imaging methods. The adaptive optics scanning laser ophthalmoscope [12] enables
visualization of individual blood cells in capillaries, including leukocytes [13] and
erythrocytes [14], based on intrinsic optical properties. Blood cell velocity can be quantified
from a time series of images [15]. However, such high-resolution, small field-of-view
methods are inherently low throughput, require expensive adaptive optics technology, and
Vol. 7, No. 10 | 1 Oct 2016 | BIOMEDICAL OPTICS EXPRESS 4292
cannot yet be performed in the choriocapillaris or choroid due to difficulties in focusing
through the retinal pigment epithelium (RPE).
Recently, optical coherence tomography (OCT)-based methods of blood flow and
angiography have emerged. Doppler OCT [16–18] can quantify total retinal blood flow by
explicitly determining vessel angle [19] or by using angle-independent methods [20,21].
While Doppler OCT methods provide robust flow estimates in large vessels, they cannot
quantify flow in microvasculature where red blood cell flux is intermittent and single-file.
OCT angiography techniques [22–25], based on enhancing contrast arising from moving and
scattering cells in the blood, are useful for selective imaging of only the “functional”
microvasculature perfused with moving blood cells [26–30]. In its most widely-used
implementation, angiography is used for visualization of microvasculature; however, recent
efforts have pushed towards quantitative angiography using decorrelation rate [31]. Though
decorrelation rate may be related to blood speed given a resolution voxel of known size
[32,33], issues related to the red blood cell orientation [34], multiple and cooperative
scattering in large vessels [35], and possible degradation of the focus in deeper tissues may
confound quantification using decorrelation-based methods.
By comparison with the proximal retinal vasculature, the more distal choroidal vasculature
is relatively more challenging to probe with light due to the highly scattering and absorbing
overlying RPE. Blood-oxygen-level-dependent [36] and arterial spin labelling [37] functional
magnetic resonance imaging (MRI) can assess the retina and choroid, but do not resolve the
finer layers. Doppler Ultrasound can assess velocity and pulsatility indices in the posterior
ciliary, central retinal, and ophthalmic arteries [38], but microvascular imaging remains
challenging. For laser Doppler flowmetry [27] and laser speckle [28] imaging, proximal
retinal vasculature can confound efforts to isolate choroidal flow, though foveolar choroidal
blood flow below the avascular zone can be assessed independently [27]. Fundus pulsations
measured using laser interferometry have also been used to indirectly assess regional pulsatile
flow [39] and intraocular pressure can be used to estimate pulsatile flow [40]. While OCT
angiography has succeeded in producing high-quality choroidal images [41], particularly at
longer wavelengths [42], attempts at quantification through Doppler-based methods have had
mixed success [43,44], possibly due to difficulties arising from multiple scattering of light
transmitted through the RPE.
In this work, we show that dynamic OCT imaging and angiography during the passage of
an intravascular scattering contrast agent through the field-of-view reveals laminar ocular
blood flow patterns. Relative to a previous investigation of DyC-OCT in the brain [45], in
addition to presenting a novel application in the retina and choroid, we also introduce a
method for tracer signal calibration as well as a framework for quantification. Blood plasma
transit times (based solely on tracer kinetics) are measured in retinal and choroidal vessels,
while flow and volume are quantified for each of the microvascular layers.
2. Methods
We performed DyC-OCT by injecting a bolus of Intralipid 20% while imaging the rat eye
with OCT angiography at 1300 nm, as shown in Fig. 1. After describing the imaging system,
animal preparation, bolus injection protocol, and angiography algorithm, we describe and
validate the modeling assumptions used to achieve quantitative measurements of plasma
transit time, flow, and volume in individual retinal and choroidal layers.
2.1 Imaging system
A 1300 nm spectral / Fourier domain OCT microscope (Thorlabs, USA) was used to image
the rat retina and choroid. This system used a bandwidth over 100 nm to provide an axial
(depth) resolution of 7 μm in air (5.2 μm in tissue) and a system sensitivity of 91 dB after
computational spectral reshaping, at a 91 kHz A-scan rate. A 1024 pixel InGaAs line scan
camera was used in the spectrometer. A 5x objective lens with a measured transverse
Vol. 7, No. 10 | 1 Oct 2016 | BIOMEDICAL OPTICS EXPRESS 4293
resolution of 8.3 μm FWHM was used to focus the beam onto the rat retina through a contact
lens.
2.2 Animal preparation
The animal procedures were approved by the Institutional Animal Care and Use Committee at
UC Davis. Male Sprague Dawley rats (n = 4; 250-400 grams) were used in this study. The
rats were initially anesthetized in a chamber ventilated with 2% v/v isoflurane in a gas
mixture of 80% air and 20% oxygen. After successful induction of anesthesia, the rats were
removed from the chamber and placed on a heating blanket (Harvard Apparatus, USA)
regulated by a rectal thermometer to maintain a core temperature of 37 degrees Celsius. The
rat’s nose was placed in a ventilation cone which continued to deliver anesthesia between
1.25-1.75% isoflurane, adjusted as necessary to minimize discomfort while maintaining
healthy breathing. Following a toe pinch to evaluate depth of anesthesia, the head was affixed
to a custom frame to reduce motion caused by breathing. A peribulbar nerve block was also
performed by injecting 0.1 mL of Lidocaine to prevent movement of the eye during imaging.
A drop of 1% Tropicamide was placed on the rat eye to dilate the pupil and Goniovisc was
used to facilitate contact between the eye and a fundus laser lens (Ocular Instruments, USA),
used to eliminate corneal refraction and keep the eyelids open. Artificial tears were applied to
the eye that was not imaged to prevent corneal dehydration. The rats were oriented so that the
imaging field-of-view included at least one large vitreal artery-vein pair emanating from the
optic nerve head.
2.3 Bolus injection protocol
Intralipid 20%, an FDA approved nutritional supplement for intravascular use in humans,
which has been shown to enhance both the OCT Doppler [46] and intensity [45] signals
within vasculature, was used as an OCT tracer. A bolus of this tracer was rapidly injected
over the course of ~0.5-1 seconds via the tail vein using a 25 gauge syringe. The volume of
this bolus was restricted to between 1.5-3 mL/kg weight (~2.4-4.7% of the rat blood volume)
to minimize the bolus’s effect on systemic physiology. Previous experiments showed no
observable change in blood flow in the mouse neocortex following injection of a similarly
proportioned bolus [45].
2.4 OCT imaging protocols
Several imaging protocols were performed on each rat. First a baseline 3-D angiogram of the
posterior pole was acquired. Next, DyC-OCT imaging was performed during the bolus
injection. Finally, another 3-D angiogram was acquired at steady state, in which the
recirculated tracer from the DyC-OCT injection enhanced the intravascular scattering signal.
2.4.1 3-D angiography
The 3-D angiography scanning protocol consisted of a series of repeated B-scans of the rat
retina and choroid. Each 3-D angiography scan sampled 500 Y positions over 2 mm where 10
B-scans were repeated at each Y position, for a total of 5000 B-scans. Each B-scan contained
500 A-lines over 2 mm. The 3-D angiography data was acquired in a sequence of 5 blocks (2
× 0.4 mm) with 100 Y positions each over the total field-of-view of 2 × 2 mm.
2.4.2 DyC-OCT
DyC-OCT imaging was performed by acquiring 1000 repeated B-scans at a fixed Y position
after the injection of the Intralipid tracer (Fig. 1) to measure the Intralipid signal during its
passage through vasculature in the field-of-view. Each B-scan contained 1024 A-lines across
2 mm. B-scans were acquired at ~80 Hz continuously for 13 seconds.
Vol. 7, No. 10 | 1 Oct 2016 | BIOMEDICAL OPTICS EXPRESS 4294
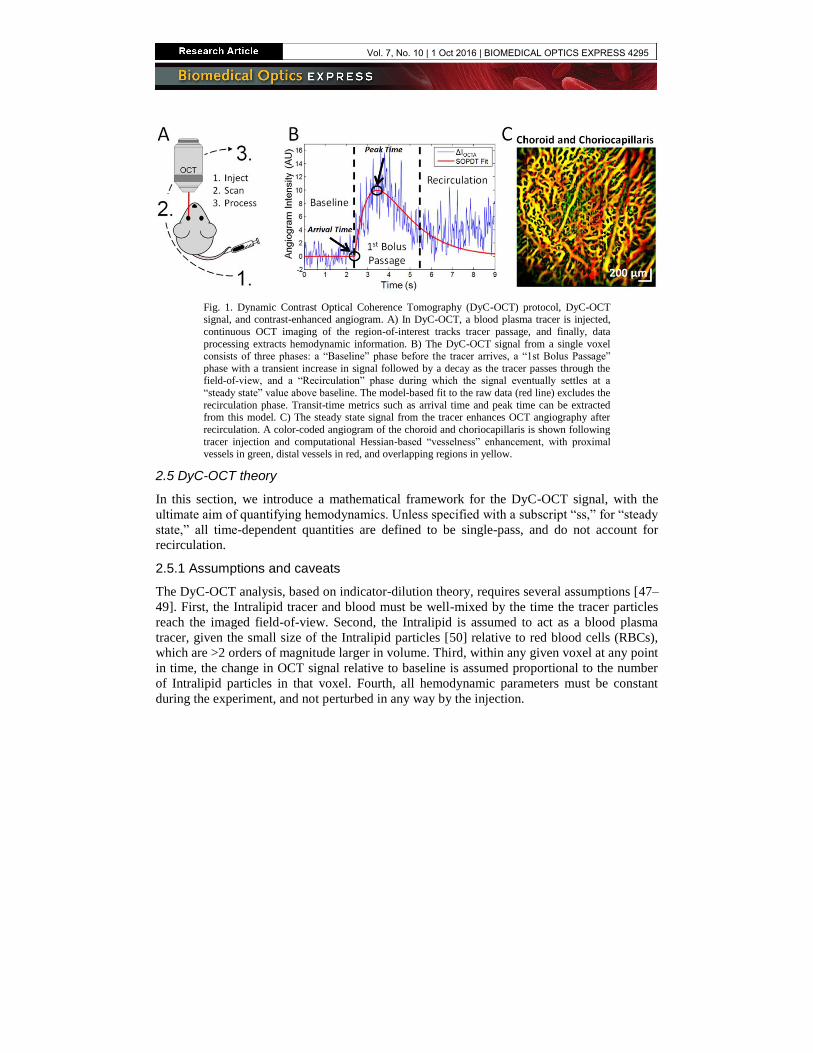
Fig. 1. Dynamic Contrast Optical Coherence Tomography (DyC-OCT) protocol, DyC-OCT signal, and contrast-enhanced angiogram. A) In DyC-OCT, a blood plasma tracer is injected,
continuous OCT imaging of the region-of-interest tracks tracer passage, and finally, data
processing extracts hemodynamic information. B) The DyC-OCT signal from a single voxel consists of three phases: a “Baseline” phase before the tracer arrives, a “1st Bolus Passage”
phase with a transient increase in signal followed by a decay as the tracer passes through the field-of-view, and a “Recirculation” phase during which the signal eventually settles at a
“steady state” value above baseline. The model-based fit to the raw data (red line) excludes the
recirculation phase. Transit-time metrics such as arrival time and peak time can be extracted from this model. C) The steady state signal from the tracer enhances OCT angiography after
recirculation. A color-coded angiogram of the choroid and choriocapillaris is shown following
tracer injection and computational Hessian-based “vesselness” enhancement, with proximal vessels in green, distal vessels in red, and overlapping regions in yellow.
2.5 DyC-OCT theory
In this section, we introduce a mathematical framework for the DyC-OCT signal, with the
ultimate aim of quantifying hemodynamics. Unless specified with a subscript “ss,” for “steady
state,” all time-dependent quantities are defined to be single-pass, and do not account for
recirculation.
2.5.1 Assumptions and caveats
The DyC-OCT analysis, based on indicator-dilution theory, requires several assumptions [47–
49]. First, the Intralipid tracer and blood must be well-mixed by the time the tracer particles
reach the imaged field-of-view. Second, the Intralipid is assumed to act as a blood plasma
tracer, given the small size of the Intralipid particles [50] relative to red blood cells (RBCs),
which are >2 orders of magnitude larger in volume. Third, within any given voxel at any point
in time, the change in OCT signal relative to baseline is assumed proportional to the number
of Intralipid particles in that voxel. Fourth, all hemodynamic parameters must be constant
during the experiment, and not perturbed in any way by the injection.
Vol. 7, No. 10 | 1 Oct 2016 | BIOMEDICAL OPTICS EXPRESS 4295

Table 1. Reference locations for the theory of DyC-OCT metrics.
Metric Theory Units Sections Equations
Individual Vessel Plasma Volume
Steady-State DyC-OCT Signal
Volume per unit length [pL/mm to
nL/mm]
2.5.4 6-9, 10
Total Layer Plasma Volume
Steady-State DyC-OCT Signal
Volume per unit en face area [nL/mm2]
2.5.4 6-9, 11
Integrated DyC-OCT
Signal
Volume per unit en
face area [nL/mm2]
2.5.5 12, 13, 15
Total Layer Plasma Flow
Central Volume Principle Flow per unit en face area [μL/min/mm2]
2.5.5 Inline
Model-Based Residue
Deconvolution
Flow per unit en face
area [μL/min/mm2]
2.5.5, 2.6.7 12, 13, 14
Singular Value Decomposition Residue
Deconvolution
Flow per unit en face area [μL/min/mm2]
2.5.5, 2.6.7 12, 13, 14
Blood Flow Index Arbitrary Units 2.5.7 N.A.
Hematocrit Index Ratio Between Plasma Tracer and Baseline
Angiogram Signals
Arbitrary Units 2.5.8 17
Mean Transit
Time
Arteriovenous Transport
Function Centroid
Time [s] 2.5.5 13, 16
Model-Based Residue
Deconvolution
Time [s] 2.5.5, 2.6.7 12-14, Inline
Singular Value
Decomposition Residue Deconvolution
Time [s] 2.5.5, 2.6.7 12-14, Inline
Other Transit
Times
Arrival Time , Peak Time,
Mean Transit Time, and Time to Peak from Fitted
DyC-OCT Curve
Time [s] 2.6.2, 2.6.5 N.A.
2.5.2 DyC-OCT signal
The baseline backscattering DyC-OCT signal is assumed to arise from endogenous blood
cells, predominantly RBCs, and tracer, with backscattering coefficients of , ( , )b RBC z x and
, ( , , )b i z x t , respectively. Assuming that backscattering coefficients add, the OCT angiogram
signal is described as the product of a position-dependent sensitivity factor ( , )h z x and the
total backscattering coefficient:
, ,( , , ) ( , )[ ( , ) ( , , )]OCTA b RBC b iI z x t h z x z x z x t . (1)
The factor ( , )h z x in Eq. (1) defines the space-variant signal change measured by the OCT
instrument in response to a local increase in backscattering. It can account for a variety of
effects, including spectrometer roll-off, focusing, vignetting, and attenuation due to scattering
and/or absorption, all of which are spatially-dependent and subject-dependent. Specifically,
( , ) ( ) ( ) ( ) ( , )spec focus vign attenh z x h z h z h x h z x . (2)
While the tracer itself may cause additional attenuation, ( , )attenh z x was approximated as time-
invariant. The OCT reflectance signal in the avascular outer nuclear layer (ONL) did increase
~10% during the bolus peak. However, this change is small compared to the reflectance
increase in the vasculature (~86%) when averaged over the same time window.
The backscattering coefficient of the tracer is assumed to equal the time-dependent tracer
concentration times the backscattering cross-section of the tracer:
, ,( , , ) ( , , )b i i b iz x t c z x t . (3)
Vol. 7, No. 10 | 1 Oct 2016 | BIOMEDICAL OPTICS EXPRESS 4296

Similarly, the backscattering coefficient of endogenous blood is assumed to equal the mean
RBC concentration times the backscattering cross-section of RBCs:
, ,( , ) ( , )b RBC RBC b RBCz x c z x . (4)
Note that the mean RBC concentration is equivalent to the local hematocrit in a voxel if the
voxel samples only blood. If a voxel samples blood and tissue, causing a partial volume
effect, the RBC concentration is lower than the local hematocrit. Also, the mean RBC
concentration at a given point, and therefore, RBC backscattering (Eq. (4)), is assumed to be
constant throughout the experiment. The change in RBC concentration caused by the volume
of injected tracer is neglected. The proportionate scaling of RBC backscattering coefficient
with concentration (Eq. (4)) and the superposition of backscattering from RBCs and tracer
(Eq. (1)) are both assumptions that may not fully hold in practice due to dependent scattering
and shadowing effects in blood [35].
There is initially no tracer present in the field-of-view, so ( , ,0) 0ic z x , and therefore,
, ( , ,0) 0b i z x . It follows that ,( , ,0) ( , ) ( , )OCTA b RBCI z x h z x z x . However, as shown in Fig.
1(B), noise is caused by stochastic fluctuations in instantaneous RBC concentration and
speckle. The change in single-pass DyC-OCT signal over time, shown in Fig. 1(B), can thus
be written as:
,( , , ) ( , , ) ( , ,0) ( , ) ( , , ) ( , ) ( , , )OCTA OCTA OCTA b i iI z x t I z x t I z x h z x z x t K z x c z x t . (5)
In the above expression, ,( , ) ( , ) b iK z x h z x represents an unknown calibration factor
relating the measured DyC-OCT signal to plasma tracer concentration, the quantity of
interest.
2.5.3 DyC-OCT signal calibration
Calibration of the DyC-OCT signal refers to recovering tracer concentration ( , , )ic z x t , from
( , , )OCTAI z x t . Referring back to Eq. (5) with this goal in mind, local tracer concentration is
related to the change in OCT signal through an unknown factor ( , )K z x , which can differ
between eyes, as well as between regions within an eye (e.g. retina versus choroid) due to
light attenuation. While the backscattering cross-section ( ,b i ) for a single batch of tracer and
fixed detection geometry can be assumed to be reasonably constant, ( , )h z x is system,
position, and subject variant. Hence, ab initio calibration of the DyC-OCT signal is extremely
challenging. Rather than attempting to account individually for all of the effects in Eq. (2), we
use the fact that large retinal vessels have a known hematocrit close to the systemic
hematocrit. Hence, the fractional plasma volume of voxels in any of these large vessels is
relatively constant and known. Thus, DyC-OCT signal changes, if they are normalized or
otherwise referenced (as in a deconvolution) to a large vessel with known hematocrit, can be
made quantitative.
2.5.4 Quantifying plasma volume from the steady state signal
There are two methods by which quantitative plasma volume can be extracted from the DyC-
OCT signal. In the first method, the steady state DyC-OCT signal, after repeated recirculation
of the tracer, is compared to baseline and calibrated to yield quantitative plasma volume.
Steady-state variables are denoted by the subscript “ss” and are assumed to be time-invariant
over the imaging timescale.
, , , ,( , ) ( , )b i ss i ss b iz x c z x (6)
Vol. 7, No. 10 | 1 Oct 2016 | BIOMEDICAL OPTICS EXPRESS 4297

Note that , , ,( , , ) 0 ( , )b i b i ssz x t z x and ,( , , ) 0 ( , )i i ssc z x t c z x , since single-
pass quantities decay to zero, while steady state quantities are reached after repeated
recirculation. The plasma tracer assumption can be expressed as , ( , ) ( , )i ss pc z x c z x , where
( , )pc z x is the fractional plasma volume. Moreover, the coefficient , relating tracer
concentration ,i ssc to plasma concentration pc , depends on the total plasma volume (related to
the total blood volume and hematocrit) of the subject and the amount of tracer injected. Thus,
, , , ,( , ) ( , ) ( , ,0) ( , ) ( , ) ( , ) ( , )OCTA ss OCTA ss OCTA b i ss ss pI z x I z x I z x h z x z x K z x c z x . (7)
In the above expression, ,( , ) ( , )ss b iK z x h z x represents an unknown constant relating the
measured DyC-OCT signal to plasma volume, the quantity of interest.
To calibrate the DyC-OCT signal, we average the DyC-OCT signal over a reference
vessel region of interest (ROI) with known area ,ROI refA and hematocrit (being careful to
avoid vessel edges with partial volume effects).
, , ,
,,
1( , )OCTA ss ref OCTA ss
ROI refROI ref
I I z x dzdxA
(8)
Ideally, each location in the field-of-view would be calibrated using a reference in its
immediate vicinity; however in practice only a few reference vessels are available across the
field-of-view. Based on assumed hematocrits in a reference vessel, it is possible to estimate
the calibration factor. For instance, macro-vessels (vitreal arteries and veins) in the retina are
known to have hematocrits ( H ) close to the systemic hematocrit. Hence the fractional
plasma may be estimated as 1pc H . For instance, if 0.45H , then , 0.55p refc .
, ,
,
,
( , )OCTA ss ref
ss ss ref
p ref
IK z x K
c
(9)
The plasma volume for individual vessels near a given calibration factor, ,ss refK , can then be
expressed using the following integral where ,V ssPV has units of plasma volume per unit
length:
,
,, ,
,
( , )( , )
OCTA ss
V ss pROI vessel ROI vessel
ss ref
I z xPV c z x dzdx dzdx
K
. (10)
Similarly, plasma volume for different layers of the retinal vasculature can be expressed using
the following integral where ,L ssPV has units of plasma volume per unit en face area and
layerX is the width of the field-of-view:
,
,, ,
,
( , )1 1( , )
OCTA ss
L ss pROI layer ROI layer
layer layer ss ref
I z xPV c z x dzdx dzdx
X X K
. (11)
Since reference macro-vessels with known hematocrits are not uniformly available throughout
the imaged field-of-view, it is not possible to calibrate each voxel in the image. In this work,
we use both a large vitreal artery and a choroidal artery at the center of the field-of-view to
perform the calibration for the inner retinal and choroidal vascular networks respectively.
Plasma volume measurements are expected to be most quantitatively accurate in the
immediate vicinity of the vessel that was used for calibration. While plasma volume
Vol. 7, No. 10 | 1 Oct 2016 | BIOMEDICAL OPTICS EXPRESS 4298
measurements can also be mapped on a voxel-by-voxel basis using this method, speckle noise
is reduced when integrating the signal over a vessel or layer.
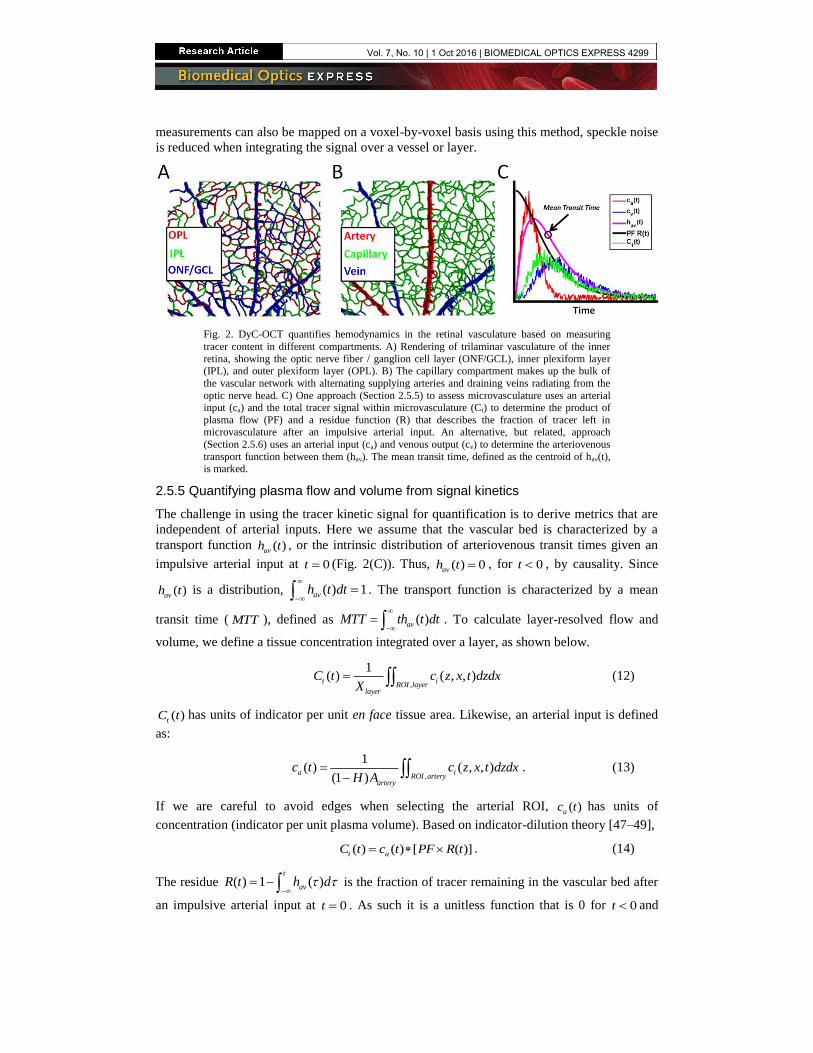
Fig. 2. DyC-OCT quantifies hemodynamics in the retinal vasculature based on measuring
tracer content in different compartments. A) Rendering of trilaminar vasculature of the inner
retina, showing the optic nerve fiber / ganglion cell layer (ONF/GCL), inner plexiform layer (IPL), and outer plexiform layer (OPL). B) The capillary compartment makes up the bulk of
the vascular network with alternating supplying arteries and draining veins radiating from the
optic nerve head. C) One approach (Section 2.5.5) to assess microvasculature uses an arterial input (ca) and the total tracer signal within microvasculature (Ct) to determine the product of
plasma flow (PF) and a residue function (R) that describes the fraction of tracer left in microvasculature after an impulsive arterial input. An alternative, but related, approach
(Section 2.5.6) uses an arterial input (ca) and venous output (cv) to determine the arteriovenous
transport function between them (hav). The mean transit time, defined as the centroid of hav(t), is marked.
2.5.5 Quantifying plasma flow and volume from signal kinetics
The challenge in using the tracer kinetic signal for quantification is to derive metrics that are
independent of arterial inputs. Here we assume that the vascular bed is characterized by a
transport function ( )avh t , or the intrinsic distribution of arteriovenous transit times given an
impulsive arterial input at 0t (Fig. 2(C)). Thus, ( ) 0avh t , for 0t , by causality. Since
( )avh t is a distribution, ( ) 1avh t dt
. The transport function is characterized by a mean
transit time ( MTT ), defined as ( )avMTT th t dt
. To calculate layer-resolved flow and
volume, we define a tissue concentration integrated over a layer, as shown below.
,
1( ) ( , , )t i
ROI layerlayer
C t c z x t dzdxX
(12)
( )tC t has units of indicator per unit en face tissue area. Likewise, an arterial input is defined
as:
,
1( ) ( , , )
(1 )a i
ROI arteryartery
c t c z x t dzdxH A
. (13)
If we are careful to avoid edges when selecting the arterial ROI, ( )ac t has units of
concentration (indicator per unit plasma volume). Based on indicator-dilution theory [47–49],
( ) ( ) [ ( )]t aC t c t PF R t . (14)
The residue ( ) 1 ( )t
avR t h d
is the fraction of tracer remaining in the vascular bed after
an impulsive arterial input at 0t . As such it is a unitless function that is 0 for 0t and
Vol. 7, No. 10 | 1 Oct 2016 | BIOMEDICAL OPTICS EXPRESS 4299

decreases monotonically from 1 (at 0t ) to 0 (as t ). Given these units, and noting that
convolution is with respect to time, plasma flow ( PF ) is obtained in units of plasma volume
per unit en face tissue area per unit time. The solution of this equation for PF requires a
deconvolution if ( )R t is not known a priori. Deconvolution techniques can be divided into
model-based and model-independent approaches [51].
Moreover, by making use of the fact that areas add under convolution and taking into
account the central volume principle (CVP), PV PF MTT , with ( )MTT R t dt
, the
following relationship is obtained:
( )
( )
t
a
C t dtPV
c t dt
. (15)
The units of PV are plasma volume per unit en face area. If ( , ) refK z x K is similar for both
the arterial ROI and layer ROI, ( , , )OCTAI z x t can replace ( , , )ic z x t in Eq. (12) and Eq. (13),
and the unknown calibration factor cancels out in both the deconvolution (Eq. (14)) or the
normalization (Eq. (15)). Thus, if arterial inputs can be found, both plasma flow and plasma
volume can be determined quantitatively in absolute units. Blood flow and blood volume may
then be readily determined by assuming a hematocrit for the capillary bed.
2.5.6 Direct arteriovenous transit time measurements
Noting that ( )avh t can be measured by deconvolving an arterial input and a venous output,
DyC-OCT affords an alternative approach for measuring MTT . In particular, since
( ) ( ) ( )v a avc t c t h t , MTT can be determined as
( ) ( )
( )( ) ( )
a v
av
a v
tc t dt tc t dtMTT th t dt
c t dt c t dt
, (16)
where ( )vc t is measured at a venous output.
If PV is determined from Eq. (15) and MTT from Eq. (16), /PF PV MTT can be
determined from the central volume principle; however, PF will be underestimated if the
total plasma volume connecting the artery and vein is not accounted for.
2.5.7 Blood flow index
In addition to the quantitative blood flow metrics proposed in Sections 2.5.5 and 2.5.6, a more
qualitative blood flow index can be derived from the DyC-OCT signal. The qualitative blood
flow index (BFI) has been used in similar indicator dilution studies [52]. BFI is given by the
slope of the rising edge of the DyC-OCT signal and can be calculated as the magnitude of the
DyC-OCT signal divided by the difference between arrival and peak times (shown in Fig.
1(B)) and can be additionally normalized to the BFI of the arterial input for better
comparisons across animals.
2.5.8 Hematocrit index
The baseline DyC-OCT signal arises from endogenous blood scattering, predominantly from
RBCs, while the steady state signal change arises from tracer scattering (Eq. (7)). The ratio of
baseline to steady state signal therefore yields a qualitative indicator of hematocrit:
Vol. 7, No. 10 | 1 Oct 2016 | BIOMEDICAL OPTICS EXPRESS 4300

,
, , , ,
( , )( , ,0)( , )
( , ,0) ( , ) ( , ) ( , )
b RBC RBCOCTA
index
OCTA OCTA ss b RBC RBC b i i ss
c z xI z xH z x
I z x I z x c z x c z x
. (17)
When defined in this way, the problematic system-dependent calibration factor ( , )h z x is
eliminated, and information about the relative concentrations of RBCs and tracer (the latter
related to fractional plasma volume) is obtained. A major caveat of this metric is that RBC
backscattering ,b RBC is highly orientation-dependent; thus, the hematocrit index is expected
to be especially unreliable in larger vessels, where RBC orientation varies across the vessel
cross-section [34].
2.6 Data processing
Here we describe the steps used to perform angiography on both DyC-OCT time series and 3-
D volumes.
2.6.1 Angiography algorithm
Dynamic scattering was isolated by removing the static scattering component of the OCT
signal by high-pass filtering consecutive B-scans along the slow axis [53]. This left only the
dynamic component of the OCT signal, OCTAI (Eq. (1)), which corresponds to moving particles
such as blood cells or Intralipid within the vasculature. Here, the high-pass filtering algorithm
entailed complex subtraction of consecutive frames, after sub-pixel axial motion correction
and bulk phase correction. If the interframe time is sufficiently larger than the intrinsic
decorrelation time, the angiogram, derived in this manner, accurately represents intravascular
scattering and is relatively insensitive to flow speed. The same angiography algorithm
(complex subtraction) was used to generate both DyC-OCT time series and 3-D angiograms.
For 3-D angiograms, the dynamic scattering signals were averaged at each Y location, prior to
application of Hessian-based vesselness enhancement [54].
2.6.2 Time course fitting
DyC-OCT time courses were determined and fit on a voxel, vessel, or layer basis. The
angiography time series showing tracer passage was averaged by convolving it with a 3×3×3
( , , )z x t kernel. The baseline value of each voxel was then subtracted, to obtain ( , , )OCTAI z x t
(Eq. (5)). Next ( , , )OCTAI z x t was fit using a second-order plus dead time model (SOPDT) as
described in previous literature [45,55] and shown in Fig. 1(B). Based on the fit of the model
to the time course, parameters describing the local transit of the injected bolus were
determined. DyC-OCT signal was also summed over selected vessels or layers and SOPDT
fits and subsequent analysis were applied to the summed signal. Interrogating individual
vessels and layers rather than voxels reduced motion artifacts and noise and improved
goodness-of-fits.
2.6.3 Vessel segmentation
A binary mask was generated based on the R2 (goodness-of-fit) of the model at each
individual voxel in the DyC-OCT data set. Voxels with low R2 values and non-physiological
fits were rejected from the mask before using automated segmentation algorithms to generate
a mask for each individual vessel.
2.6.4 Layer segmentation
For the DyC-OCT data, vascular layers of the retina and choroid were segmented manually
using the angiograms and structural OCT images to identify key features. The 3-D angiogram
data sets were segmented by automatically detecting the sharp increase in OCT signal at the
Vol. 7, No. 10 | 1 Oct 2016 | BIOMEDICAL OPTICS EXPRESS 4301

RPE. The signal was integrated across the vessel mask of each layer to reduce noise outside
the vasculature.
2.6.5 Tracer kinetics
Measurements of tracer kinetics were extracted directly from the model’s fit to the DyC-OCT
time course. Arrival time, peak time, and time to peak were all obtained from parameters of
the fit. Arrival time is the earliest appearance of the tracer, peak time is where the tracer signal
is at its maximum, and time to peak is the difference between peak and arrival times. Mean
transit times were also obtained using Eq. (16) where ( )vc t was replaced by the
concentration-time curves in individual microvessels. Inter-animal comparisons were made
for arrival and peak time by first referencing them to the earliest arrival times in a retinal or
choroidal artery, as appropriate. Time to peak and mean transit time measurements, on the
other hand, are inherently comparable across animals, and do not require another time
reference.
2.6.6 Plasma volume
As shown in Table 1, there are two approaches to quantify plasma volume. The first, based on
Eq. (10) and Eq. (11), uses the steady state tracer signal. The second, based on Eq. (15), uses
the integral under the tissue concentration-time curve. Both volume measurements were
calibrated (Eq. (9)) using a large vitreal artery, assuming a hematocrit of 45%. An alternative
calibration was also performed for the choriocapillaris using a choroidal artery, assuming a
hematocrit of 45%.
2.6.7 Plasma flow
Four plasma flow metrics were implemented based on the total DyC-OCT signal in each
vascular layer (Table 1). The first two approaches performed the deconvolution in Eq. (14) to
determine ( )PF R t . This was achieved using either a model-independent, truncated singular
value decomposition (SVD) approach to invert the arterial input matrix and solve for
( )PF R t directly, or a model-based approach which assumed a functional form for ( )R t .
Compared to a traditional SVD approach, the truncated SVD removes singular values below a
given threshold, determined individually for each arterial input matrix, to reduce the effects of
noise when estimating the inverted arterial input matrix. For the model-based approach, by
treating the microvasculature as a well-mixed single compartment, we obtained /( ) ( )t MTTR t e u t , where ( )u t is the unit step function. Plasma flow ( PF ) and the mean
transit time ( MTT ) were determined simultaneously by least squares fitting of Eq. (14).
The third approach (Section 2.5.6) determined plasma flow based on the central volume
principle (CVP) by dividing the quantitative plasma volume from each layer by the
arteriovenous MTT . Separate MTT values were obtained using artery-vein pairs in the inner
retina and the choroid. A single MTT was determined for each network (i.e. inner retina and
choroid) and used to estimate flow through the CVP for each of the corresponding
subnetworks (i.e. ONF/GCL, IPL, OPL, and CC).
Finally, in the fourth approach, BFI was measured (Section 2.5.7) and normalized to the
BFI in the same reference artery used for residue deconvolution.
2.6.8 Statistical testing
For statistical testing of significant differences in DyC-OCT metrics across different vascular
networks of the eye, a Kruskal-Wallis test was used. This was then followed by Tukey’s
honestly significant differences test to account for multiple comparisons.
Vol. 7, No. 10 | 1 Oct 2016 | BIOMEDICAL OPTICS EXPRESS 4302

3. Results
After investigating how the angiogram signal increases after the Intralipid tracer injection,
metrics describing tracer kinetics, plasma volume, and plasma flow are shown for different
layers.
3.1 DyC-OCT signal and artifacts
Figure 3(A)-3(C) compares a conventional OCT angiogram with the DyC-OCT angiogram, or
the angiogram determined from DyC-OCT signal change averaged over the first bolus
passage. In addition to providing higher contrast, particularly for the microvasculature, DyC-
OCT mitigates some traditional OCT angiogram artifacts. The center of a large choroidal
vessel (asterisk) has low angiogram signal (Fig. 3(A)) due to multiple scattering which creates
a large false angiogram signal below (i.e. at a larger path length than) the vessel as marked by
the arrow. The DyC-OCT signal change angiogram accurately localizes signal to the
vasculature and reduces multiple scattering artifacts, as shown in Fig. 3(B). In Fig. 3(C), a
color overlay of RBC-based OCT angiography (red) and tracer-based DyC-OCT angiography
(green) highlights regions of agreement (yellow). Notable departures include multiple RBC
scattering tails (red) under major retinal and choroidal vessels, higher DyC-OCT enhancement
(green) in major choroidal vessels and at the edges of some major retinal vessels, and an
“hourglass” artifact that transitions from red (vertical axis) to yellow or green (horizontal
axis) in some major retinal vessels.
Figure 3(D) shows changes in the angiogram signal as the tracer passes through the cross-
section of a large artery (labeled “A”) and vein (labeled “V”). Arteries and veins were
identified as large vessels with early and late arrival times, respectively. The baseline
angiogram demonstrates a well-known hourglass shaped artifact in both vessels, which is
caused by shear-induced orientation of red blood cells and their orientation-dependent
backscattering [34]. The peak angiogram shows that the tracer increases the angiogram signal
and fills the vessel, particularly in the boundary layer, which is typically devoid of RBCs due
to the Fåhræus–Lindqvist effect [56]. Interestingly, the signal change, corresponding to
( , , )OCTAI z x t given by Eq. (5), also shows an apparent hourglass artifact (Fig. 3(B)). If tracer
concentration were uniform across the vessel cross-section and DyC-OCT signal change were
proportional to concentration, as assumed in Eq. (5), the signal change would also have been
uniform. The fact that an hourglass artifact, albeit inverted, appears in the signal change
images (middle column), in spite of a presumably uniform tracer concentration across the
vessel cross-section, suggests the presence of orientation-dependent shadowing effects. For
reasons that are not entirely clear, the inverted hourglass artifact appears in the venous DyC-
OCT signal change, but not the arterial signal as shown in the middle column of Fig. 3(D).
This may be related to the smaller diameter, higher pulsatility, or blunted flow profile of the
artery. For these reasons, when calibrating quantitative metrics, arteries are preferred over
veins, and the sides of vessels are preferred over the top or bottom of vessels.
3.2 Angiogram enhancement
As shown in Fig. 3, injection of the contrast agent increases the signal in the angiogram
throughout both the inner and outer retina in cross-section. Figure 4 investigates this signal
enhancement using en face projections. Before contrast agent, large retinal vessels create
shadows in deeper layers (red arrows). Following Intralipid injection, the false positive
angiogram signal created by multiple scattering from these vessels decreases, particularly in
the CC and choroid. The contrast agent fills the edges of large vessels and reveals
microvasculature. In addition, the last row of Fig. 4 demonstrates how computational
“vesselness” enhancement can help to clarify the structure in the extremely dense
choriocapillaris and choroid. The fine structure enhanced by the algorithm is not likely caused
by noise as angiograms acquired later revealed similar structure.
Vol. 7, No. 10 | 1 Oct 2016 | BIOMEDICAL OPTICS EXPRESS 4303
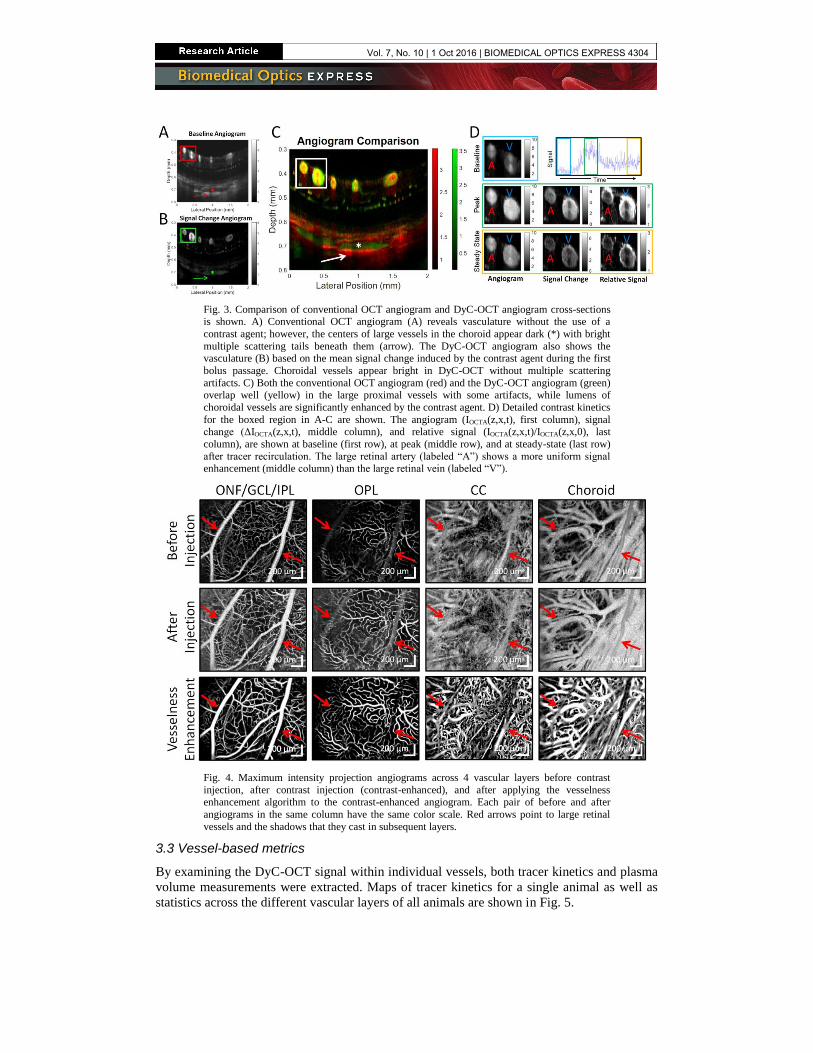
Fig. 3. Comparison of conventional OCT angiogram and DyC-OCT angiogram cross-sections is shown. A) Conventional OCT angiogram (A) reveals vasculature without the use of a
contrast agent; however, the centers of large vessels in the choroid appear dark (*) with bright
multiple scattering tails beneath them (arrow). The DyC-OCT angiogram also shows the vasculature (B) based on the mean signal change induced by the contrast agent during the first
bolus passage. Choroidal vessels appear bright in DyC-OCT without multiple scattering
artifacts. C) Both the conventional OCT angiogram (red) and the DyC-OCT angiogram (green) overlap well (yellow) in the large proximal vessels with some artifacts, while lumens of
choroidal vessels are significantly enhanced by the contrast agent. D) Detailed contrast kinetics
for the boxed region in A-C are shown. The angiogram (IOCTA(z,x,t), first column), signal change (ΔIOCTA(z,x,t), middle column), and relative signal (IOCTA(z,x,t)/IOCTA(z,x,0), last
column), are shown at baseline (first row), at peak (middle row), and at steady-state (last row)
after tracer recirculation. The large retinal artery (labeled “A”) shows a more uniform signal enhancement (middle column) than the large retinal vein (labeled “V”).
Fig. 4. Maximum intensity projection angiograms across 4 vascular layers before contrast
injection, after contrast injection (contrast-enhanced), and after applying the vesselness
enhancement algorithm to the contrast-enhanced angiogram. Each pair of before and after
angiograms in the same column have the same color scale. Red arrows point to large retinal
vessels and the shadows that they cast in subsequent layers.
3.3 Vessel-based metrics
By examining the DyC-OCT signal within individual vessels, both tracer kinetics and plasma
volume measurements were extracted. Maps of tracer kinetics for a single animal as well as
statistics across the different vascular layers of all animals are shown in Fig. 5.
Vol. 7, No. 10 | 1 Oct 2016 | BIOMEDICAL OPTICS EXPRESS 4304

Figure 5 demonstrates that DyC-OCT measures temporal tracer dynamics both in the
retina and choroid, and in some cases, in the scleral vasculature as well. The top row of Fig. 5
shows transit times for each individual voxel, demonstrating heterogeneity within individual
vessels. The time to peak measurements in Fig. 5(C) appear to be more sensitive to noise. The
middle row shows transit times for each individual vessel, determined by summing the DyC-
OCT signal within a vessel before fitting the model. The expected alternating artery/vein
structure of the large retinal vessels is now clear from the arrival and peak time maps. The
bottom row of Fig. 5 summarizes metrics for individual vessels within each layer. In these
charts, arrival and peak times are given in reference to retinal arteries for the ONF/GCL, IPL,
and OPL or choroidal arteries for the choroid and choriocapillaris. As each vessel is counted
equally and capillaries are most numerous, trends in the bottom row reflect capillaries;
however the large vessels tend to contribute extreme outliers to the distributions. Statistically
significant differences in arrival time are shown between the macrovascular ONF/GCL and
choroid and the microvascular OPL. The arrival time heterogeneity (as shown by the upper
and lower quartiles in Fig. 5(G)) is smallest in the OPL compared to all other layers, probably
due to the preponderance of capillaries, rather than arterioles and venules, in this layer [54].
Statistically significant differences in peak time are observed between the choroid and the
OPL, and the peak time heterogeneity appears to be smallest in the microvascular layers with
the highest expected branch orders (OPL and CC). There are no significant differences in time
to peak values across layers. Mean transit times ( MTT ) in individual vessels, measured as
described in Section 2.6.5, are longest in the choroid. MTT values in microvascular layers are
shorter than those in the macrovascular layers, at a statistically significant level. In general,
based on mean transit time, the tracer appears to circulate from the macrovasculature to the
microvasculature and back faster in the inner retina compared to the choroid. However,
differences in the other temporal metrics across layers are minimal.
Figure 6(A)-6(B) shows qualitative red blood cell (RBC) content, based on baseline
angiogram signal, and quantitative plasma volume measurements, based on tracer signal, from
individual vessels in log scale. Using this information, a hematocrit index was mapped for
each vessel (Fig. 6(C)). Due to high RBC backscattering signal from orientation effects in
large vessels (Fig. 3(D)), the hematocrit index is underestimated, particularly in veins
(labelled “V”). After eliminating large vessels, Fig. 6(D) shows the hematocrit index for the
total signal in each microvascular layer across 4 animals. In the inner retina, hematocrit index
drops in microvascular networks with higher branching orders [54]. In the choriocapillaris,
hematocrit index increases, possibly due to the unusually large diameters of capillaries in the
choriocapillaris bed [57].
3.4 Layer-based metrics
Quantitative layer-based metrics of key hemodynamic parameters (transit time distribution,
plasma volume, and plasma flow) can be assessed using DyC-OCT. Accurate quantification
of flow and transit time requires accounting for bolus dispersion using an appropriate arterial
input and, for volume or flow, calibration of tracer signal using a vessel of known hematocrit.
The following figures will show a retina-based calibration (unfilled symbols) for the retinal
layers and both a retina- and a choroid-based calibration (filled symbols) for the
choriocapillaris. Unlike the plots in Fig. 5, which weight individual vessels evenly, here the
total signal within each layer is used, which inherently weights larger vessels more strongly
than smaller vessels; however, the large supplying arteries and draining veins are not included
for the layer-based metrics. Large vessels are excluded from layer-based analysis to satisfy
assumptions of indicator-dilution theory. Moreover, capillary perfusion is more directly
related to nutritive supply in a given retinal area than perfusion in large vessels, which are
more densely located near the optic nerve head and sparser at the periphery.
Vol. 7, No. 10 | 1 Oct 2016 | BIOMEDICAL OPTICS EXPRESS 4305

Fig. 5. DyC-OCT measures laminar transit time kinetics. False color transit time maps are
overlaid on grayscale structural OCT images with large arteries and veins marked (A and V
respectively) at both the voxel level (A-C) and the vessel level (D-F). Statistics from vessels across 4 rats are shown (G-J). Metrics are arrival time (A,D, and G), peak time (B,E, and H),
time to peak (C,F, and I), and mean transit time (J). The arrival and peak times shown in the
first two rows are relative to the imaging start time. In the third row, the ONF/GCL, IPL, and OPL arrival and peak times are referenced, for each rat, to the earliest inner retinal arterial
arrival time, while the CC and choroid arrival and peak times are similarly referenced to the
earliest choroidal arterial arrival time. Medians (red lines) and means (red X’s) for each layer, with equal weighting for each vessel, are shown. The upper and lower quartile ranges are
bounded by the blue box. Outliers (red points) fall outside of 2.5 times the upper or lower
quartile range. The maximum and minimum points (dashed black lines), excluding outliers, are shown. Black bars show statistically significant pairwise comparisons (* p < 0.05 and *** p <
0.0005). ONF/GCL – Optic Nerve Fiber/Ganglion Cell Layer, IPL – Inner Plexiform Layer,
OPL – Outer Plexiform Layer, and CC – Choriocapillaris.
Fig. 6. RBC signal and plasma volume measurements are used to determine a hematocrit index.
False color volume and hematocrit maps are overlaid on grayscale structural OCT images, with large arteries and veins marked A and V, respectively. A) Log scale red blood cell (RBC)
content as measured by the qualitative baseline OCT angiogram. B) A quantitative map of
plasma volume per vessel shown in log scale. C) Qualitative hematocrit index for individual vessels. D) Mean hematocrit index (red line) and individual hematocrit index measurements
(blue lines) across the microvascular layers of four rats. IR – Total Inner Retina, ONF/GCL –
Optic Nerve Fiber/Ganglion Cell Layer, IPL – Inner Plexiform Layer, OPL – Outer Plexiform Layer, and CC – Choriocapillaris.
Vol. 7, No. 10 | 1 Oct 2016 | BIOMEDICAL OPTICS EXPRESS 4306
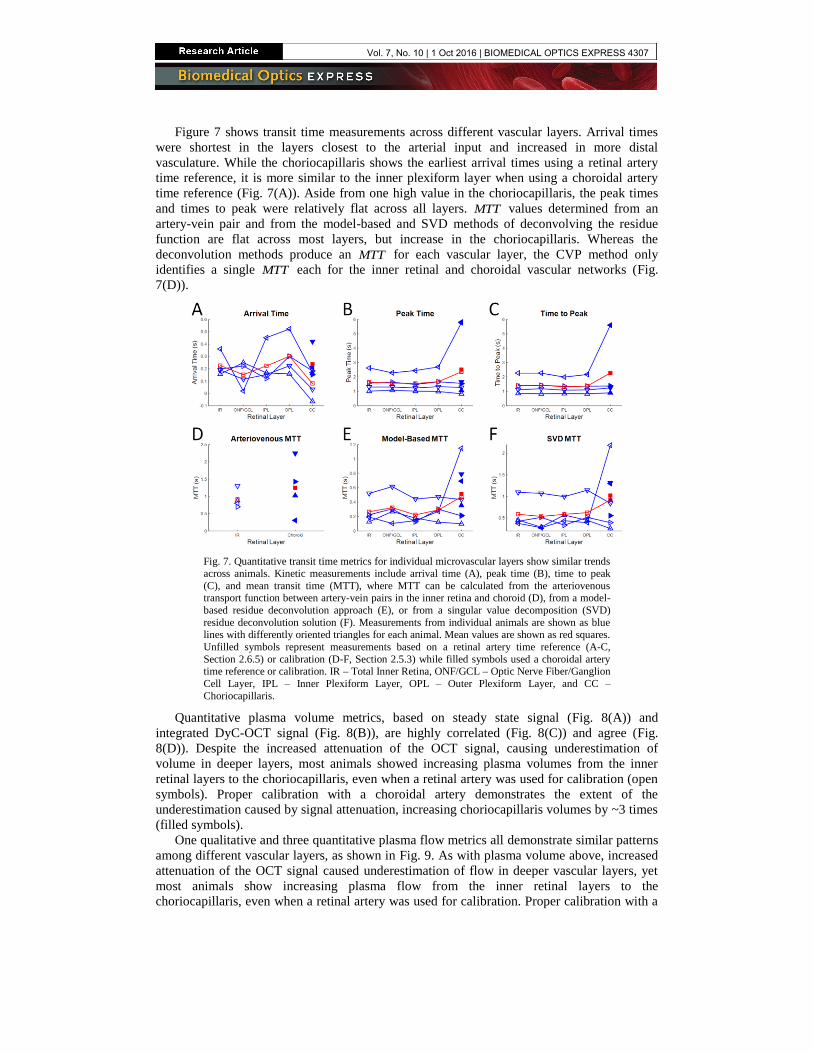
Figure 7 shows transit time measurements across different vascular layers. Arrival times
were shortest in the layers closest to the arterial input and increased in more distal
vasculature. While the choriocapillaris shows the earliest arrival times using a retinal artery
time reference, it is more similar to the inner plexiform layer when using a choroidal artery
time reference (Fig. 7(A)). Aside from one high value in the choriocapillaris, the peak times
and times to peak were relatively flat across all layers. MTT values determined from an
artery-vein pair and from the model-based and SVD methods of deconvolving the residue
function are flat across most layers, but increase in the choriocapillaris. Whereas the
deconvolution methods produce an MTT for each vascular layer, the CVP method only
identifies a single MTT each for the inner retinal and choroidal vascular networks (Fig.
7(D)).
Fig. 7. Quantitative transit time metrics for individual microvascular layers show similar trends
across animals. Kinetic measurements include arrival time (A), peak time (B), time to peak
(C), and mean transit time (MTT), where MTT can be calculated from the arteriovenous transport function between artery-vein pairs in the inner retina and choroid (D), from a model-
based residue deconvolution approach (E), or from a singular value decomposition (SVD)
residue deconvolution solution (F). Measurements from individual animals are shown as blue lines with differently oriented triangles for each animal. Mean values are shown as red squares.
Unfilled symbols represent measurements based on a retinal artery time reference (A-C,
Section 2.6.5) or calibration (D-F, Section 2.5.3) while filled symbols used a choroidal artery time reference or calibration. IR – Total Inner Retina, ONF/GCL – Optic Nerve Fiber/Ganglion
Cell Layer, IPL – Inner Plexiform Layer, OPL – Outer Plexiform Layer, and CC –
Choriocapillaris.
Quantitative plasma volume metrics, based on steady state signal (Fig. 8(A)) and
integrated DyC-OCT signal (Fig. 8(B)), are highly correlated (Fig. 8(C)) and agree (Fig.
8(D)). Despite the increased attenuation of the OCT signal, causing underestimation of
volume in deeper layers, most animals showed increasing plasma volumes from the inner
retinal layers to the choriocapillaris, even when a retinal artery was used for calibration (open
symbols). Proper calibration with a choroidal artery demonstrates the extent of the
underestimation caused by signal attenuation, increasing choriocapillaris volumes by ~3 times
(filled symbols).
One qualitative and three quantitative plasma flow metrics all demonstrate similar patterns
among different vascular layers, as shown in Fig. 9. As with plasma volume above, increased
attenuation of the OCT signal caused underestimation of flow in deeper vascular layers, yet
most animals show increasing plasma flow from the inner retinal layers to the
choriocapillaris, even when a retinal artery was used for calibration. Proper calibration with a
Vol. 7, No. 10 | 1 Oct 2016 | BIOMEDICAL OPTICS EXPRESS 4307

choroidal artery rectifies this underestimation, yielding flow values ~2-3 times higher than
with retinal calibration.
Fig. 8. Quantitative plasma volume metrics for individual microvascular layers show similar
trends across animals. Two separate methods of quantifying plasma volume based on the DyC-OCT signal are compared: steady state signal (A) and integrated DyC-OCT signal (B).
Measurements from individual animals are shown as blue lines with differently oriented
triangles for each animal. Mean values are shown as red squares. Unfilled symbols represent measurements based on a retinal calibration (Section 2.5.3) while filled symbols are from a
choroidal calibration. C) Both methods are correlated based on linear regression (red line), with
all points near the line of equality (black). D) A Bland-Altman plot demonstrates agreement between the two methods. The black line shows the average difference, centered near zero, and
the red lines show two standard deviations from this mean. IR – Total Inner Retina, ONF/GCL
– Optic Nerve Fiber/Ganglion Cell Layer, IPL – Inner Plexiform Layer, OPL – Outer Plexiform Layer, and CC – Choriocapillaris.
Fig. 9. Plasma flow metrics for individual microvascular layers show similar trends across
animals: blood flow index (BFI) (A), central volume principle (CVP)-derived flow using arteriovenous mean transit times from Fig. 7(D) and plasma volumes from Fig. 8(A) (B), a
model-based residue deconvolution method (C), and a model-free singular value
decomposition (SVD) residue deconvolution method (D). Insets in C and D show respective plots of plasma flow (PF) times the residue (R(t)) for the choriocapillaris, determined by
deconvolution. Measurements from individual animals are shown as blue lines with differently
oriented triangles for each animal. Mean values are shown as red squares. Unfilled symbols represent measurements based on a retinal calibration (Section 2.5.3) while filled symbols are
from a choroidal calibration. IR – Total Inner Retina, ONF/GCL – Optic Nerve Fiber/Ganglion
Cell Layer, IPL – Inner Plexiform Layer, OPL – Outer Plexiform Layer, and CC – Choriocapillaris.
4. Discussion
DyC-OCT, or dynamic OCT imaging during the passage of a contrast agent, was performed
in the retina and choroid to probe microvascular hemodynamics. Based on features of the
dynamic contrast curves, ad hoc metrics such as arrival time and blood flow index (BFI) were
demonstrated. A framework for hemodynamic quantification was also introduced. By
accounting for dispersion in the arterial input, the intrinsic transit time distribution through the
microvasculature was quantified. Finally, by calibrating the DyC-OCT signal, both flow and
volume were quantified as well.
4.1 Angiogram enhancement
The Intralipid contrast agent enhances OCT angiogram signal throughout the vasculature.
Moreover, it also provides signal in the RBC-free boundary layer and helps compensate
orientation-dependent “hourglass” scattering artifacts found in conventional intensity-based
Vol. 7, No. 10 | 1 Oct 2016 | BIOMEDICAL OPTICS EXPRESS 4308

OCT angiograms (Fig. 3). These features may enable more accurate quantification of lumen
parameters such as diameter or area.
The DyC-OCT angiograms depict more localized intravascular signal in large choroidal
vessels (Fig. 3). In conventional OCT angiograms, the scattering signal is usually displaced
beneath the vessel due to multiple RBC scattering. Since the signal enhancement is axially
displaced from the baseline signal, gains appear modest in en face maximum intensity
projection angiograms of the choroid (Fig. 4). However, cross-sectional DyC-OCT images
reveal that false positive signals are greatly reduced (Fig. 3(B)-3(C)). The more isotropically
scattering Intralipid particles provide additional intravascular backscattering signal and may
help to reduce multiple scattering artifacts in the choroid. Both of these effects mitigate false
positive angiogram signal beneath large vessels, though artifacts remain, as shown in the first
two rows of Fig. 4. The additional vesselness enhancement step performed in post-processing
improves maximum intensity projections of the choroid and choriocapillaris (third row of Fig.
4), which are easier to visualize and interpret than their unfiltered counterparts. Due to the
small size of the majority of Intralipid particles (<λ) relative to red blood cells (>λ), Intralipid
scattering is expected to increase proportionately more than RBC scattering as wavelength is
reduced. Hence, Intralipid signal enhancement is expected to be more prominent at the ~800
nm wavelength range used in standard ophthalmic systems than at the ~1300 nm wavelength
range used here.
4.2 Kinetic measurements
DyC-OCT time courses contain information about microvascular topology and flow
pathways, which are encapsulated in the transit time distribution. Kinetic measurements are
inherently more robust than flow or volume, and require only that the transit times are
appropriately ascribed to the vessels being measured [45]. Given the high choriocapillaris
flow relative to the inner retina (Fig. 9 and Table 2), it is somewhat surprising that transit
times, including the MTT, are similar (Fig. 5(G)-5(J) and Fig. 7). However, the CVP dictates
that given the high volume of the choriocapillaris relative to the inner retinal capillaries (Fig.
8), a much larger flow is required to achieve a comparable MTT. Beyond the MTT, the full
transit time distribution will enable more comprehensive analysis of vessel networks using
DyC-OCT. For example, the variance of the transit time distribution is related to efficacy of
oxygen extraction, with less transit time heterogeneity enabling a higher maximal oxygen
extraction fraction [58]. In particular, DyC-OCT metrics describing changes in flow topology
may prove useful as biomarkers for retinal and choroidal diseases. Further investigation is
warranted to link the observed transit characteristics to flow topology of each layer.
4.3 Plasma volume and flow
Quantitative flow (Fig. 9(B)-9(D)) and volume (Fig. 8) are achieved in DyC-OCT based on
Eq. (14) and Eq. (15), respectively. Deconvolution of Eq. (14) ensures that the arterial input
function dispersion is accounted for and tracer signal is calibrated. The residue-based analysis
in Eq. (14) is valid if signals are integrated across an entire vascular bed comprising all
compartments. For these reasons, flow metrics based on tracer dynamics are only used to
characterize layers and not individual vessels. Our analysis implicitly assumes that cross-
sections chosen for DyC-OCT are representative samples of the entire network. In the future,
3-D DyC-OCT imaging will more comprehensively sample the vascular bed and better satisfy
assumptions of residue analysis. Finally, it is important to emphasize that residue analysis is
applicable to entire networks (e.g. inner retina and choriocapillaris), and significant flow
connectivity between retinal layers [54] would invalidate residue analysis for individual inner
retinal layers. Thus, while the flow rates measured for individual microvascular layers may be
affected by interconnectivity, the total flow measured for the inner retina is more strictly
accurate based on indicator-dilution theory.
Vol. 7, No. 10 | 1 Oct 2016 | BIOMEDICAL OPTICS EXPRESS 4309
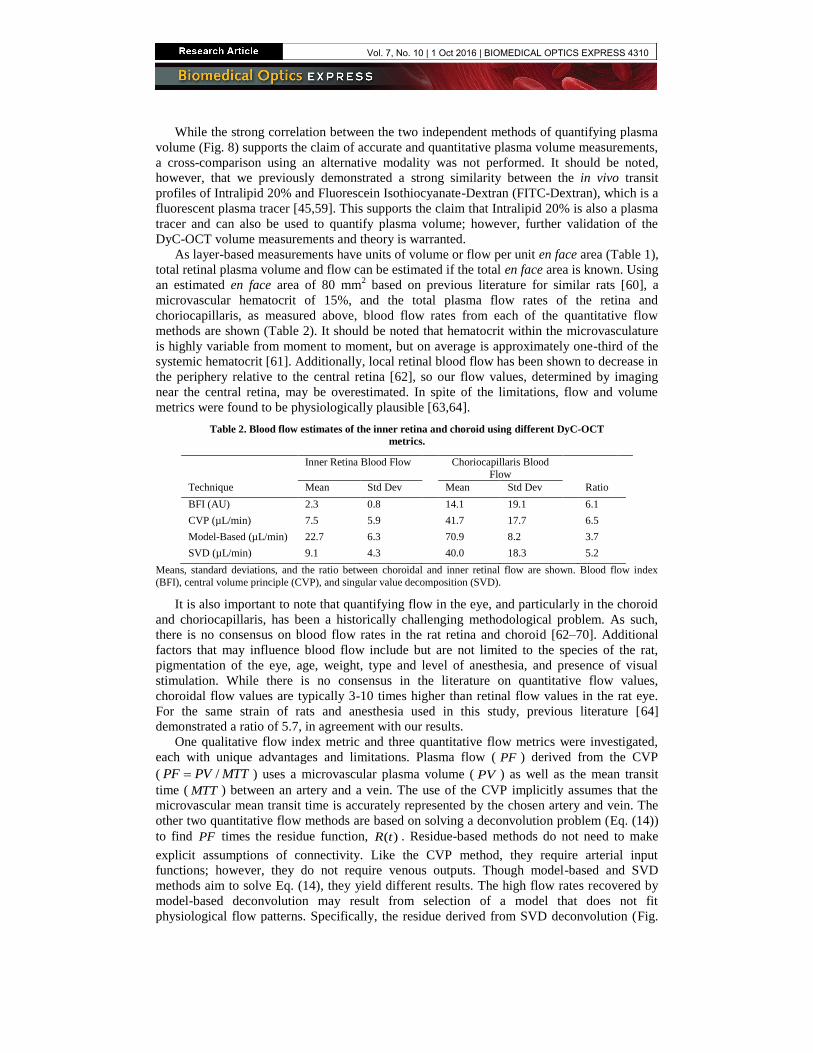
While the strong correlation between the two independent methods of quantifying plasma
volume (Fig. 8) supports the claim of accurate and quantitative plasma volume measurements,
a cross-comparison using an alternative modality was not performed. It should be noted,
however, that we previously demonstrated a strong similarity between the in vivo transit
profiles of Intralipid 20% and Fluorescein Isothiocyanate-Dextran (FITC-Dextran), which is a
fluorescent plasma tracer [45,59]. This supports the claim that Intralipid 20% is also a plasma
tracer and can also be used to quantify plasma volume; however, further validation of the
DyC-OCT volume measurements and theory is warranted.
As layer-based measurements have units of volume or flow per unit en face area (Table 1),
total retinal plasma volume and flow can be estimated if the total en face area is known. Using
an estimated en face area of 80 mm2 based on previous literature for similar rats [60], a
microvascular hematocrit of 15%, and the total plasma flow rates of the retina and
choriocapillaris, as measured above, blood flow rates from each of the quantitative flow
methods are shown (Table 2). It should be noted that hematocrit within the microvasculature
is highly variable from moment to moment, but on average is approximately one-third of the
systemic hematocrit [61]. Additionally, local retinal blood flow has been shown to decrease in
the periphery relative to the central retina [62], so our flow values, determined by imaging
near the central retina, may be overestimated. In spite of the limitations, flow and volume
metrics were found to be physiologically plausible [63,64].
Table 2. Blood flow estimates of the inner retina and choroid using different DyC-OCT
metrics.
Inner Retina Blood Flow Choriocapillaris Blood
Flow
Technique Mean Std Dev Mean Std Dev Ratio
BFI (AU) 2.3 0.8 14.1 19.1 6.1
CVP (µL/min) 7.5 5.9 41.7 17.7 6.5
Model-Based (µL/min) 22.7 6.3 70.9 8.2 3.7
SVD (µL/min) 9.1 4.3 40.0 18.3 5.2
Means, standard deviations, and the ratio between choroidal and inner retinal flow are shown. Blood flow index
(BFI), central volume principle (CVP), and singular value decomposition (SVD).
It is also important to note that quantifying flow in the eye, and particularly in the choroid
and choriocapillaris, has been a historically challenging methodological problem. As such,
there is no consensus on blood flow rates in the rat retina and choroid [62–70]. Additional
factors that may influence blood flow include but are not limited to the species of the rat,
pigmentation of the eye, age, weight, type and level of anesthesia, and presence of visual
stimulation. While there is no consensus in the literature on quantitative flow values,
choroidal flow values are typically 3-10 times higher than retinal flow values in the rat eye.
For the same strain of rats and anesthesia used in this study, previous literature [64]
demonstrated a ratio of 5.7, in agreement with our results.
One qualitative flow index metric and three quantitative flow metrics were investigated,
each with unique advantages and limitations. Plasma flow ( PF ) derived from the CVP
( /PF PV MTT ) uses a microvascular plasma volume ( PV ) as well as the mean transit
time ( MTT ) between an artery and a vein. The use of the CVP implicitly assumes that the
microvascular mean transit time is accurately represented by the chosen artery and vein. The
other two quantitative flow methods are based on solving a deconvolution problem (Eq. (14))
to find PF times the residue function, ( )R t . Residue-based methods do not need to make
explicit assumptions of connectivity. Like the CVP method, they require arterial input
functions; however, they do not require venous outputs. Though model-based and SVD
methods aim to solve Eq. (14), they yield different results. The high flow rates recovered by
model-based deconvolution may result from selection of a model that does not fit
physiological flow patterns. Specifically, the residue derived from SVD deconvolution (Fig.
Vol. 7, No. 10 | 1 Oct 2016 | BIOMEDICAL OPTICS EXPRESS 4310
9(D) inset) for the choriocapillaris decays more slowly than the exponential form (Fig. 9(C)
inset) assumed for model-based deconvolution, suggesting overestimation of flow by model-
based deconvolution. SVD-derived flow appears to be more in line with the CVP flow, but
requires optimization of an SVD threshold for each experiment.
4.4 Translational feasibility
As Intralipid 20% is widely used for parenteral nutrition, it is appropriate to discuss the
potential of DyC-OCT for human use. Current guidelines for Intralipid 20% as a nutritional
supplement in humans recommend a low infusion rate (1 mL/min for a first-time recipient)
compared to what was used here (1.5-3 mL/kg over ~1 s). However, there has been recent
interest in using Intralipid and other lipid emulsions to treat cardiac toxicity following an
intravenous overdose of local anesthetic. In case studies using this rescue injection, a lipid
bolus ranging from 1.2-3 mL/kg is rapidly injected followed by a slower infusion to aid in the
clearance of lipophilic local anesthetic from the cardiac tissue [71,72]. The American Society
of Regional Anesthesia and Pain Medicine (ASRA) and Association of Anaesthetists of Great
Britain and Ireland (AAGBI) guidelines recommend a bolus of 1.5 mL/kg over 1 minute
followed by an infusion of 15 mL/kg/hr, with additional boluses and infusions to be given
should resuscitation fail [73]. While further research on ideal injection rates and volumes and
patient safety are necessary, this 1.5 mL/kg/min initial bolus may be sufficient for performing
DyC-OCT in humans.
Additionally, we project that improvements in the DyC-OCT methodology will enable
higher signal with the same injection volume, or the same signal with reduced injection
volumes. Intralipid 30% is also commercially available and should provide more signal than
Intralipid 20%. Further tracer purification to concentrate only the most highly scattering (i.e.
larger) lipid particles would also reduce the injection volume. Other tracers, including those
that are not lipid-based, should be investigated for DyC-OCT. Furthermore, the injection site
in the tail vein used here likely represents the worst-case scenario for tracer dispersion and
time delay due to its remoteness from the heart. Selection of a more proximal injection point
such as a vein around the elbow or upper arm would ensure a more condensed bolus, which
would again reduce the required injection volume. Finally, higher speed OCT systems, a more
optimal wavelength for lipid scattering, and detection geometries that enhance the tracer
signal relative to RBC scattering will be investigated.
When scaling DyC-OCT up to humans, the transit time of the tracer will also increase due
to the relative size of the human cardiovascular network. This means that the imaging time
frame will increase and likely include motion of the eye such as blinking or saccades.
Fluorescence angiography is currently performed over a comparable time frame and suffers
from these effects. Development of a 4D OCT system for human DyC-OCT imaging will
enable out-of-plane motion correction based on volumetric information. Further development
of DyC-OCT technology and a thorough investigation into the safety standards of lipid
injections will be required to translate these methods for clinical use.
4.5 Future directions
The measurements presented here were all obtained from healthy animals, but DyC-OCT may
also monitor layer-specific changes over time due to stimulation or disease. In particular,
DyC-OCT may be a valuable tool for the study and early detection of age-related macular
degeneration (AMD). Recent evidence suggests that dysfunction of the choriocapillaris may
precede damage to the RPE [74]. If DyC-OCT is used to track the progression of AMD, the
quantitative measurements of tracer kinetics, flow, and volume in the choriocapillaris may
provide new insight into the time frame and mechanism of the disease. Other applications of
the method, including the potential visualization of extravasation or leakage, also merit
further investigation.
Vol. 7, No. 10 | 1 Oct 2016 | BIOMEDICAL OPTICS EXPRESS 4311

5. Conclusions
Quantification of hemodynamics using intrinsic contrast alone has proved to be challenging
due to the complexity of RBC scattering. Here we demonstrate the value of exogenous
contrast enhancement for Dynamic Contrast OCT (DyC-OCT) of retinal and choroidal
microvasculature. The use of an exogenous plasma tracer removes many obstacles to
quantification. Dynamic imaging of contrast agent passage yields depth-resolved
hemodynamics. Quantitative measurements of tracer kinetics and layer-resolved plasma
volume and flow were demonstrated in vivo in the retina and choroid, yielding flow values
that are in line with literature. In the future, DyC-OCT can be used to study outer retinal
diseases such as early age-related macular degeneration and retinitis pigmentosa, in
experimental models, and potentially also in human subjects.
Acknowledgments
We acknowledge support from the National Institutes of Health (R01NS094681,
P30AG010129) and the Glaucoma Research Foundation Catalyst for a Cure.
Vol. 7, No. 10 | 1 Oct 2016 | BIOMEDICAL OPTICS EXPRESS 4312