vol. 38 (nº 33) año 2017. pág. 20 methods for identifying ... · pdf...
TRANSCRIPT

ISSN 0798 1015
HOME Revista ESPACIOS ! ÍNDICES ! A LOS AUTORES !
Vol. 38 (Nº 33) Año 2017. Pág. 20
Methods for identifying the prioritydevelopment fields of the regionalpharmaceutical cluster based on themechanisms of using the BalancedScorecardMétodos para identificar los campos de desarrollo prioritario delgrupo farmacéutico regional sobre la base de los mecanismos deutilización del Balanced ScorecardEduard Olegovich TOPLENINOV 1; , Leonid Alekseevich ELSHIN 2;
Received: 30/05/2017 • Approved: 15/06/2017
Content1. Introduction2. Methods3. Results of the study4. Discussion of results5. ConclusionAcknowledgmentReferences
ABSTRACT:This article presents conceptual approaches toassessment and analysis of efficiency of thepharmaceutical industry development by the example ofthe Republic of Tatarstan based on the use of methodsof normative scorecard. The results of the conductedresearch allow to identify the mechanisms and prioritydevelopment fields for the sectors of the economyunder study, on the basis of systematic analysis of thehighlighted key series of indicators that describe variousaspects of sectoral development: financial results of theindustry development and capability to increaseinvestment and innovation activity directly arising fromthem; structure of cost for the production, whichdetermines the capabilities of output of competitive
RESUMEN:Este artículo presenta los enfoques conceptuales de laevaluación y el análisis de la eficiencia del desarrollo dela industria farmacéutica por el ejemplo de la Repúblicade Tatarstán basado en el uso de métodos de cuadro demando normativo. Los resultados de las investigacionesrealizadas permiten identificar los mecanismos yámbitos prioritarios de desarrollo de los sectores de laeconomía objeto de estudio, sobre la base de unanálisis sistemático de la serie de indicadores clave quedescriben diversos aspectos del desarrollo sectorial:resultados financieros de la industria Desarrollo ycapacidad para incrementar las actividades de inversióne innovación que surjan directamente de ellas;Estructura del costo para la producción, que determina

products; financial stability and liquidity of the industrydevelopment, which provides capability of financialsecurity of the long-term progressive development; anduse of labor resources, their composition and structure.Key development fields of the pharmaceutical industryof the Republic of Tatarstan during the current andperspective periods of development have beenformulated and defined in the work based on the resultsof assessment of competitiveness of the previouslyformed business processes that describe sectoraldevelopment. Key words: efficiency of development ofpharmaceutical industry, normative scorecard, referencesequence of indicators of sectoral development, priorityfields of formation of an industrial cluster, integralestimation of the efficiency of sectoral development.
las capacidades de producción de productoscompetitivos; La estabilidad financiera y la liquidez deldesarrollo de la industria, que proporciona la capacidadde seguridad financiera del desarrollo a largo plazoprogresiva; Y el uso de los recursos laborales, sucomposición y estructura. Los principales ámbitos dedesarrollo de la industria farmacéutica de la Repúblicade Tatarstán durante los períodos actuales yperspectivas de desarrollo han sido formulados ydefinidos en el trabajo basado en los resultados de laevaluación de la competitividad de los procesosempresariales previamente formados que describen eldesarrollo sectorial. Palabras clave: eficiencia del desarrollo de la industriafarmacéutica, cuadro de mando normativo, secuenciade referencia de indicadores de desarrollo sectorial,campos prioritarios de formación de un clusterindustrial, estimación integral de la eficiencia deldesarrollo sectorial.
1. IntroductionA balanced scorecard (BSC) is one of the complex tools of assessment of the efficiency ofdevelopment of the socio-economic system of a various level. It was first developed by R.Kaplan and D. Norton (Kaplan and Norton, 2006). It relies on the principle of systemic analysisof the obtained results of the organization based on examination and evaluation of acomprehensive set of indicators that describe not just the financial and economic parameters ofdevelopment, but also social and institutional ones. According to developers, the latter describethe efficiency of personnel development, business processes being implemented andrelationships with customers. The conceptual need for using BSC is that it establishes causalrelationships in the course of examination of factors that generate the dynamics and quality ofthe organization development. In accordance with the basic BSC approaches, "multidimensionalindicators in a properly established system must consist of interrelated objectives andevaluation criteria of their achievement, consistent and complementary" (Kaplan and Norton,2006). In other words, the need for the balanced scorecard application is justified by the needof transformation of the organization's mission into the system of tangible objectives and tasks.As such, the scope of the BSC use broadens the horizons of planning and generates a specificset of indicators of the organization’s efficiency, which is not limited to the assessment of theeconomic field, but also takes into account quite a wide range of institutional parameters. Thisapproach allows to establish a link between the financial costs and specific results, and todevelop the adapted current and future development needs of the targeted programs on thisbasis.At the same time, one of the most significant drawbacks of the BSC method is that the authorsof this method do not clearly describe the algorithm of balancing various indicators thatdescribe the qualitatively diverse aspects of the socio-economic system development.\Algorithms of assessment of the organizations’ efficiency, developed by Robert Kaplan andDavid Norton, have been further developed in the writings of other scholars. For instance, theThomas Clark’s paper (Clarke 2001) justifies that the analysis of the organization’s activityshould be carried out based on the so-called triple system of indicators that takes into accountnot just financial and economic, but also social and environmental results. The author arguesthat in the current economic conditions, the efficient operation of the organization cannot beensured in the case of focusing only on economic parameters in the planning system.The institutional reality is that the modern organization aiming for sustainable developmentacts as one of the elements establishing the social background in the society. As such, the issueof promoting social obligations, which undoubtedly include the issues of environmental well-being of the territories, becomes strategically important.Methodological tools of building the normative scorecard, whose foundations were laid in 1980

by I.M. Syroezhin, are presented in domestic science (Syroezhin, 1980). Later, themethodological tools of the normative scorecard were developed in the studies of Yu.A. Raeva,A.R. Gilmullin, T.A. Konovalova (Raeva 2005; Gilmullin 2009; Konovalova 2013).The essence of this method is establishment of some reference sequence of the rate of changeof indicators of the socio-economic development of the system. Then, the actual distribution ofindicator growth rates is compared with the reference distribution, and the closer the matchingof the actual and reference distributions of growth rates, the higher the efficiency ofdevelopment of the socio-economic system under study. The method of the normativescorecard was originally used at the enterprise level, and then the possibility of using themethod at the level of a larger-scale system (in particular – by the example of the sector) wasjustified.
2. MethodsUsing the tools of the normative scorecard, a method to identify priority fields of the formationof an industrial cluster based on an integrated estimation of the efficiency of its developmenthas been developed in this study (procedure of the method application is shown in Figure 1).Designations used in the suggested method:
Dev – deviation of the actual rank of the rate of the sectoral development growth fromthe reference rank;
I – ranks inversion (I = Dev at Dev > 0, I =0 at Dev < 0);
n – total number of indicators of each set (in the developed method, n = 5 for each ofthe sets of the sectoral development indicators);
Ksp – Spearman test;
Kkn – Kendall test;
E – efficiency of sectoral development in one of the sections (sets of socio-economicindicators);
Eint – integral efficiency of the sectoral development.

Figure 1. Procedure of the developed method to identify priority fields of the cluster formation on the basis of integral estimate of the efficiency of sectoral development
Indicators "E" and "Eint" are measured in the range 0% to 100%, in accordance with thegeneral method of the normative scorecard. Respectively, the efficiency of sectoral developmentfor a particular set of indicators is considered to be above average at a value of "E" exceeding50%.As such, we have identified four main sets of indicators describing various aspects of sectoraldevelopment:- financial results of the sectoral development and the capability to improve investment activitydirectly arising from them;- production cost structure, which determines the capability of competitive production;- financial stability and liquidity of the sectoral development, which ensures the capability offinancial security of long-term progressive development;- use of labor resources, their composition and structure.The reference sequence of the indicators of the said sets within the developed method is shownin Figure 2.The reference sequence of the rate of change in the indicators of financial results and the

investment and innovation activity of the sectoral development within the developed method isas follows (Formula 1):
(1)where T is a real (leveling the inflation component) rate of the indicator change.
Figure 2 – Reference sequence of indicators of the sectoral development within the developed method
Let’s describe the proportions of the reference sequence by the example of the set of indicatorsof financial results and the investment and innovation activity of the developed method toidentify priority fields of cluster formation based on an integral estimate of the efficiency of thesectoral development:1. The rate of growth of investment in innovation should be the largest in modern conditions, inan ideal scenario – outpacing the rates of changes in all other socio-economic indicators thatare included in the method. This proportion arises from the need for constant technical andtechnological modernization of the sector, introduction of innovative approaches to managing

human resources, sales, finance, and administration of the development of the enterprises inthe sector in general (Enright and Ffowcs-Williams, 2001). In particular, implementation of thisproportion indicates an increase in the level of innovation focus of the investment process in thesector.2. Investment growth rate must be higher than the net profit growth rate in the sector.Satisfaction of this ratio shows the increase in production capacity and improvement of materialand technical base that provides long-term sustainable growth of the enterprises in the sector.Indeed, if this reference ratio is not satisfied, the net profit growth rate will be higher than theinvestment growth rate, and therefore, there will be a tendency of the current consumption ofresources in the dominant industry, as opposed to their reinvestment, which is not quitepositive from the view of ensuring the long-term sustainable efficient development (McConnelland Brue, 2006).3. The net profit growth rate must be higher than the gross profit growth rate, illustrative of thecomparative decrease in non-operating, operational and other similar costs in the sector, i.e. ofthe increase in the efficiency of its development from the view of overhead costs optimization.4. The excess of the gross profit growth rate over the revenue growth rate indicates an increasein the level of profitability of the sector functioning. Satisfaction of this ratio is an indicator ofthe comparative reduction in the level of production costs of the industry operation and savingof various types of material, energy and other forms of direct production costs (Porter 2002).In accordance with the proposed method of identification of the priority fields of clusterformation based on an integral estimate of the efficiency of the industry development, the mostimportant reserves can be defined for each of the sets using the criterion of maximizing thedeviation of the actual rank of the rate of change in the indicators from the reference one inabsolute magnitude Respectively, the fields of the formation and improvement of the cluster aredeveloped within the identified most significant reserves.In general, the novelty of the developed method to identify priority fields of the formation of anindustrial cluster based on an integral estimate of the efficiency of sectoral development incomparison with already existing BSC (Balanced Scorecard) and NSC (normative scorecard)methodological tools is the following:- the sets of production cost structure in the sector and the set of labor resources were firstjustified within the developed method in comparison with already existing approaches (Sölvell2003; Safiullin, et.al. 2011; Markov, et.al., 2010; Zdunov 2009; Dudkin 1997; Larina andKiselnikov, 1998);- all the sets of indicators were adjusted to a unified system of coordinates, the capability ofintegral estimate of the efficiency of sectoral development are formed within the method, asopposed to already existing studies based on methodological tools of the normative scorecard;- the capability of formation and improvement of clusters in the field of mobilization of the mostsignificant reserves of increase in the efficiency of sectoral development for all the sets includedin the method and individual indicators were justified for the first time.
3. Results of the studyThe developed method was tested based on the data of regional statistics and informationprovided by OJSC “Tatchempharmpreparaty”. The rate of growth of the indicators ofpharmaceutical industry in Tatarstan included in the method to identify the priority fields of thecluster formation based on an integral estimate of sectoral efficiency is presented in Table 1.
Table 1 – Source data required for testing the method to identify priority fields of the cluster formation based on an integral estimate of efficiency
of sectoral development of the RT pharmaceutical industry (Official Website of the Tatchempharmpreparaty Company)
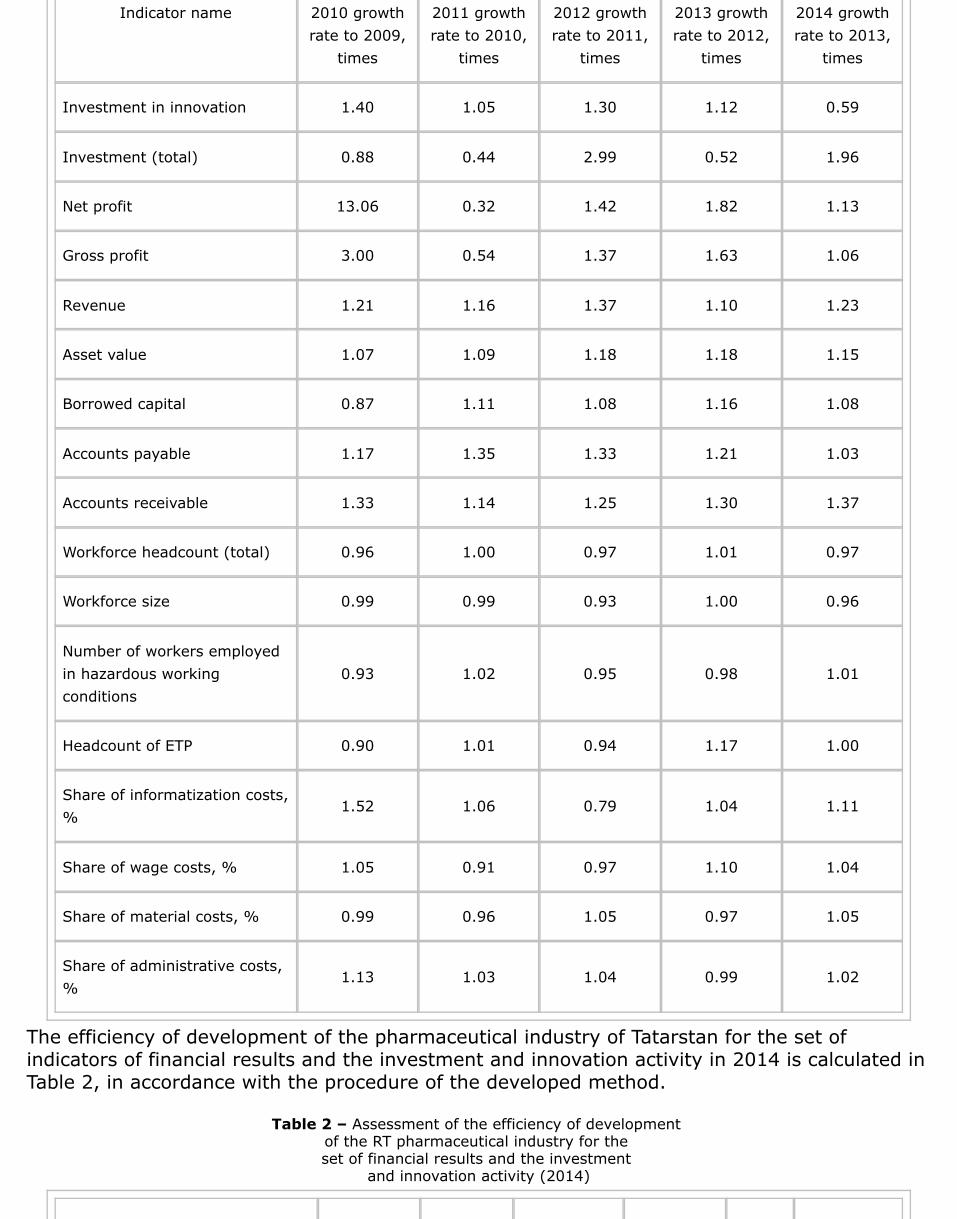
Indicator name 2010 growthrate to 2009,
times
2011 growthrate to 2010,
times
2012 growthrate to 2011,
times
2013 growthrate to 2012,
times
2014 growthrate to 2013,
times
Investment in innovation 1.40 1.05 1.30 1.12 0.59
Investment (total) 0.88 0.44 2.99 0.52 1.96
Net profit 13.06 0.32 1.42 1.82 1.13
Gross profit 3.00 0.54 1.37 1.63 1.06
Revenue 1.21 1.16 1.37 1.10 1.23
Asset value 1.07 1.09 1.18 1.18 1.15
Borrowed capital 0.87 1.11 1.08 1.16 1.08
Accounts payable 1.17 1.35 1.33 1.21 1.03
Accounts receivable 1.33 1.14 1.25 1.30 1.37
Workforce headcount (total) 0.96 1.00 0.97 1.01 0.97
Workforce size 0.99 0.99 0.93 1.00 0.96
Number of workers employedin hazardous workingconditions
0.93 1.02 0.95 0.98 1.01
Headcount of ETP 0.90 1.01 0.94 1.17 1.00
Share of informatization costs,%
1.52 1.06 0.79 1.04 1.11
Share of wage costs, % 1.05 0.91 0.97 1.10 1.04
Share of material costs, % 0.99 0.96 1.05 0.97 1.05
Share of administrative costs,%
1.13 1.03 1.04 0.99 1.02
The efficiency of development of the pharmaceutical industry of Tatarstan for the set ofindicators of financial results and the investment and innovation activity in 2014 is calculated inTable 2, in accordance with the procedure of the developed method.
Table 2 – Assessment of the efficiency of development of the RT pharmaceutical industry for the set of financial results and the investment
and innovation activity (2014)

Indicators in the set
Referencerank series
Growthrate,times
Actual rankseries
Deviationof ranks(Dev)
Dev2 Inversion (I)
1. Investment in innovation 1 0.59 5 4 16 4
2. Investment (total) 2 1.96 1 -1 1 0
3. Net profit 3 1.13 3 0 0 1
4. Gross profit 4 1.06 4 0 0 1
5. Revenue 5 1.23 2 -3 9 0
6. Sum x x x x 26 6
7. Spearman test (Ksp) -0.3
8. Kendall test (Kkn) -0.2
9. Efficiency of the developmentof pharmaceutical industry forthis set of indicators, %
14
The efficiency for the set of financial results and the investment and innovation activity of thedevelopment of the pharmaceutical industry of Tatarstan in 2014 is significantly below theaverage, which is 50%. Meanwhile, the most significant reserve for increasing the efficiency ofsectoral development is the increase in the rate of growth of investment in innovation (thisindicator should increase first, according to the reference sequence, but in fact it increases last,Dev=4).Table 3 presents the calculation of the efficiency of the development of pharmaceutical industryof Tatarstan for the set of indicators of the production cost structure in 2014
Table 3 – Assessment of the efficiency of the development of the RT pharmaceutical industry for the set of indicators of the production cost structure (2014).
Indicators in the setReferencerank series
Growthrate, times
Actual rankseries
Deviation ofranks (Dev)
Dev2
Inversion(I)
1. Revenue 1 1.23 1 0 0 0
2. Share of informatization costs,% of the total cost
2 1.11 2 0 0 0
3. Share of wage costs, % of thetotal cost
3 1.04 4 1 1 1

4. Share of material costs, % 4 1.05 3 -1 1 0
5. Share of administrative costs,%
5 1.02 5 0 0 0
6. Sum x x x x 2 1
7. Spearman test (Ksp) 0.9
8. Kendall test (Kkn) 0.8
9. Efficiency of the developmentof pharmaceutical industry for thisset of indicators, %
85.5
The efficiency of development of the pharmaceutical industry of Tatarstan for the set ofindicators of the production cost structure is significantly above the average. At the same time,despite the high level of efficiency of development of the pharmaceutical industry for this set ofindicators, there is a reserve of its increase based on the reduction of the share of wage costsin the total amount of the overall costs (this indicator in the reference sequence ranks 3rd, andin fact it is 4th, respectively).The efficiency of development of the pharmaceutical industry of Tatarstan for the set ofindicators of financial stability and liquidity in 2014 is calculated in Table 4, in accordance withthe procedure of the developed method.
Table 4 – Assessment of the efficiency of the development of the RT pharmaceutical industry for the set of the financial stability and liquidity (2014)
Indicators in the setReference rankseries
Growthrate, times
Actual rankseries
Deviation ofranks (Dev)
Dev2
Inversion(I)
1. Revenue 1 1.23 2 1 1 1
2. Asset value, mln rub. 2 1.15 3 1 1 1
3. Borrowed capital 3 1.08 4 1 1 1
4. Accounts payable, mlnrub.
4 1.03 5 1 1 1
5. Accounts receivable,mln rub.
5 1.37 1 -4 16 0
6. Sum x x x x 20 4
7. Spearman test (Ksp) 0
8. Kendall test (Kkn) 0.2

9. Efficiency of thedevelopment ofpharmaceutical industryfor this set of indicators,%
30
The efficiency of sectoral development for the set of financial stability and liquidity, like in thefirst case, reveals the lag from the threshold level of efficiency (50%). Meanwhile, the maincomponent that forms insufficient level of efficiency is a high level of dynamics of non-currentreceivables (this indicator is the maximum deviation of the actual rank from the reference inabsolute magnitude). Respectively, the decrease in the growth rate of accounts receivable ofthe enterprise in the sector is required. However, the creation of a cluster and development ofvarious forms of corporate integration on its basis will automatically entail processes of assetsconsolidation and rationalization of their composition and structure.
Table 5 – Assessment of the efficiency of the development of the RT pharmaceutical industry for the set of labor resources (2014)
Indicators inthe set
Reference rankseries
Growth rate,times
Actual rankseries
Deviation ofranks (Dev)
Dev2
Inversion(I)
1. Revenue 1 1.23 1 0 0 0
2. ETPheadcount
2 1.00 3 1 1 1
3. PPPheadcount
3 0.97 4 1 1 1
4. Workforcesize
4 0.96 5 1 1 1
5. Number ofworkersemployed inhazardousworkingconditions
5 1.01 2 -3 9 0
6. Sum x x x x 12 3
7. Spearmantest (Ksp)
0.4
8. Kendall test(Kkn)
0.4
9. Efficiency ofthe

development ofpharmaceuticalindustry for thisset ofindicators, %
49
As Table 5 reveals, the efficiency of development of the RT pharmaceutical industry within theset of labor resources is close to the threshold level of efficiency, to the average value. Themain reserve for efficiency increase is decrease in the rate of growth in the number of workersemployed in hazardous working conditions in the overall structure of industrial productionpersonnel in the sector.In accordance with the proposed method, the integral efficiency of development of the RTpharmaceutical industry can be determined using the formula of the geometric mean of partialefficiency indicators, namely (Formula 2):
(2)The integral efficiency of development of the pharmaceutical industry of the Republic ofTatarstan in 2010-2014 is calculated in a similar manner, according to formula 2. The finalassessment of the efficiency in the context of the sets of the method and the integral efficiencyare shown in Figure 3.
Figure 3 – Assessment of the efficiency of development of the pharmaceutical industry of the Republic of Tatarstan in accordance with the developed method
to identify priority fields of the cluster formation based on the integral estimate of the efficiency of sectoral development
4. Discussion of resultsThe implemented assessment of the efficiency of development of the pharmaceutical industry ofthe Republic of Tatarstan allowed to make the conclusion that the most stable growth of theindicator in terms of time is the efficiency for the set of the production cost structure. Thislargely determines the growth of competitiveness in the medium- and long-term perspectives of
sectoral development.The lowest (moreover, steadily low) value of efficiency for the sets of financial results and theinvestment and innovation activity of the development of the pharmaceutical industry of theRepublic of Tatarstan within the selected sets represents a strategic threat. Insufficientefficiency of development of this set in the long term will cause a decline in efficiency for othersets as well: for example, insufficient investment and innovation activity limits the capabilitiesof rationalization of the cost structure due to the introduction of resource-saving equipment andproduction technology and administration, aggravates labor automation processes, reducespotential attractiveness of the sector to various external strategic investors.
5. ConclusionThe developed methodological approach to identification of priority fields of the industrialcluster formation allows to identify the key fields of formation of the adapted mechanisms ofdevelopment of the industrial sector of the economy, which contribute to largely increasing thelevel of its integral efficiency. According to the results of the study, such fields in the Republic ofTatarstan are the following:- a significant increase in the rate of the growth of investment in innovation, primarily thanks tocooperation between enterprises of the pharmaceutical industry and small innovativeenterprises from the specialized universities and research institutes of the region, as well asintegration with the elements of regional innovation infrastructure;- an increase in the share of costs for informatization and simultaneous consistent decline in theshare of material costs and administrative costs at the expense of the cluster formation;- a decline in the share of accounts payable in the structure of sources of funding theenterprises of the pharmaceutical industry of the Republic of Tatarstan; and- evolving processes of involving to the industry and retaining highly skilled engineering andtechnical personnel, including thanks to strengthening the processes of industrial andeducational cooperation with the specialized universities and faculties of the region.
AcknowledgmentThe publication has been prepared as part of the research project No. 16-06-00062 supportedby the RFBR.
ReferencesKaplan, R.S. and D.P. Norton, 2006. Sbalansirovannaya sistema pokazateley: ot strategii kdeystviyu [The Balanced Scorecard: Translating Strategy into Action]. Moscow: Olympus-Business, pp: 294.Clarke, T., 2001. Balancing the Triple Bottom line: Financial, Social and EnvironmentalPerformance. Journal of General Management, 26 (4): 16-27.Dudkin,V., 1997. Amerikanskiy i zapadnoyevropeyskiy podkhody k indikativnomu planirovaniyu:vozmozhen li sintez na rossiyskoy pochve? [American and West European Approaches toIndicative Planning: is Synthesis Possible on Russian Soil?]. Russian Economic Journal, 10: 99-101Enright, M.J. and I. Ffowcs-Williams, 2001. Local Partnership, Clusters and SME Globalusation.OECD Workshop Paper, pp: 38.Gilmullin, A.R., 2009. Strategicheskoye upravleniye razvitiyem regiona na osnove kompleksnoyotsenki effektivnosti funktsionirovaniya ekonomicheskikh podsistem [Strategic Management ofthe Regional Development Based on the Comprehensive Assessment of Efficiency of theEconomic Sub-System Functioning]. Dissertation ... of the Candidate of Economic Sciences.

Kazan, pp: 198.Konovalova, T.A., 2013. Povysheniye effektivnosti ekonomicheskogo razvitiya monogorodastrategicheskogo znacheniya [Improving the Efficiency of Economic Development of aMonotown of Strategic Importance]. Dissertation ... of the Candidate of Economic Sciences. St.Petersburg, pp: 198.Larina, N.I. and A.A. Kiselnikov, 1998. Regionalnaya politika v stranakh s rynochnoyekonomikoy [Regional Policy in Market-economy Countries]. Moscow: Economy, pp: 173.Markov, L.S., M.A. Yagolnitser, and I.G. Teplova, 2010. Funktsionirovaniye i mekhanizmyrazvitiya proizvodstvennogo klastera [Functioning and Mechanisms of Development of theProduction Cluster]. Region: Economics and Sociology, 1: 287-305.McConnell, C.R. and S.L. Brue, 2006. Economics. Moscow: INFRA-M, pp: 940.Official Website of the Tatchempharmpreparaty Company. Date Views 17.01.2017www.tatpharm.ru.Porter, M., 2002. Konkurentsiya [On Competition]. Moscow: Publishing House “Williams", pp:496.Raeva, Yu.A., 2005. Metodika optimizatsii investitsionnoy strategii (na primere OAO NK“Rosneft'”) [Method for Optimization of the Investment Strategy (by the Example of JSC NK"Rosneft")]. Bulletin of the Financial Academy, 3(35): 110-115.Safiullin, L.N., A.R. Safiullin and B.Z. Khaziakhmetov, 2011. Strukturnoye issledovaniyekonkurentosposobnosti Respubliki Tatarstan [Structural Research of the Competitiveness of theRepublic of Tatarstan]. Kazan: CAER ASRT.Sölvell, Ö., 2003. The Cluster Initiative Greenbook. In The Competitiveness Institute, Eds.,Sölvell, Ö., G. Lindqvist and C. Ketels. VINNOVA, Gothenburg, pp: 94. Date Views 16.01.2017www.cluster-research.org/greenbook.htm.Syroezhin, I.M., 1980. Sovershenstvovaniye sistemy pokazateley effektivnosti i kachestva[Improvement of Performance and Quality Scorecard]. Moscow: Economics, pp: 192.Zdunov, A.A., 2009. Metodologiya povysheniya effektivnosti vzaimodeystviya gosudarstvennykhi munitsipalnykh organov pri razrabotke programm sotsialno-ekonomicheskogo razvitiya[Methodology of Improving the Efficiency of Interaction Between the State and MunicipalAuthorities in the Development of Programs of the Socio-economic Development]. Kazan:Publishing House of the Kazan University, pp: 152.
1. Public Organization "Economic Society of the Republic of Tatarstan", Kazan, Butlerov St., 4, 420012. Email:[email protected]. Kazan Federal University, Center of Advanced Economic Research Academy of Sciences of the Republic of Tatarstan,Kazan, Kremlevskaya, 18, 420008; Kazan, Ostrovskogo 23, 420111
Revista ESPACIOS. ISSN 0798 1015Vol. 38 (Nº 33) Año 2017
[Índice]
[En caso de encontrar algún error en este website favor enviar email a webmaster]
©2017. revistaESPACIOS.com • Derechos Reservados