vol. 19, no. 01, june 2021, pp. 1 ~ 19 *, firwan tan
TRANSCRIPT

1
Jurnal Ekonomi Pembangunan Vol. 19, No. 01, June 2021, pp. 1 ~ 19
The Analysis of Cooperative Development on Padang Municipality
Economy
Rano Efmona*, Firwan Tanb, Neng Kamarnic a,b,c
Master of Economics, Faculty of Economics, Andalas University, Indonesia
*Corresponding author: [email protected]
Info Articles Abstract
Article history:
Received February 3, 2021
Revised May 7, 2021
Accepted June 28, 2021
Available online June 30, 2021
This research aimed to analyze the influence of Cooperative Development on Economic Performance and Public Welfare in
Padang Municipality and analyze the indirect and direct effect
of Economic Performance as a mediator construct related to Cooperative Development on Public Welfare in Padang
Municipality. Cooperative Performance data used in this research as panel data consists of 17 sub-sectors of Cooperative
groups in Padang Municipality within 2012–2019 (8 years).
Data analysis using quantitative statistical analysis approached by structural equation modeling-partial least square (SEM-
PLS) method. This research found that Cooperative
Development positively and significantly influenced Economic Performance and Public Welfare in Padang Municipality.
Economic performance has a positive and significant influence on Public Welfare in Padang Municipality. Cooperative
Development on Public Welfare through Economic
Performance has a considerable contribution compared to direct influenced Cooperative Development on Public Welfare in
Padang Municipality. Finally, Economic Performance has effective and complete mediation to improve Public Welfare by
Cooperative Development in Padang Municipality within
2012–2019.
Keywords: Public Welfare, Economic
Performance, Cooperative Development
JEL Classification: G20, Q13,
O11
INTRODUCTION
The achievements of Cooperative sector development in Indonesia today are generally a portrait of micro accumulation of each region, including Padang City as one of the regions in West Sumatra Province with the vision-
mission in the Regional Medium Term Development Plan (RPJMD) 2019-2024 on improving the performance of Cooperatives and Micro, Small & Medium Enterprises (MSMEs) in the economy (BPS Padang, 2020).
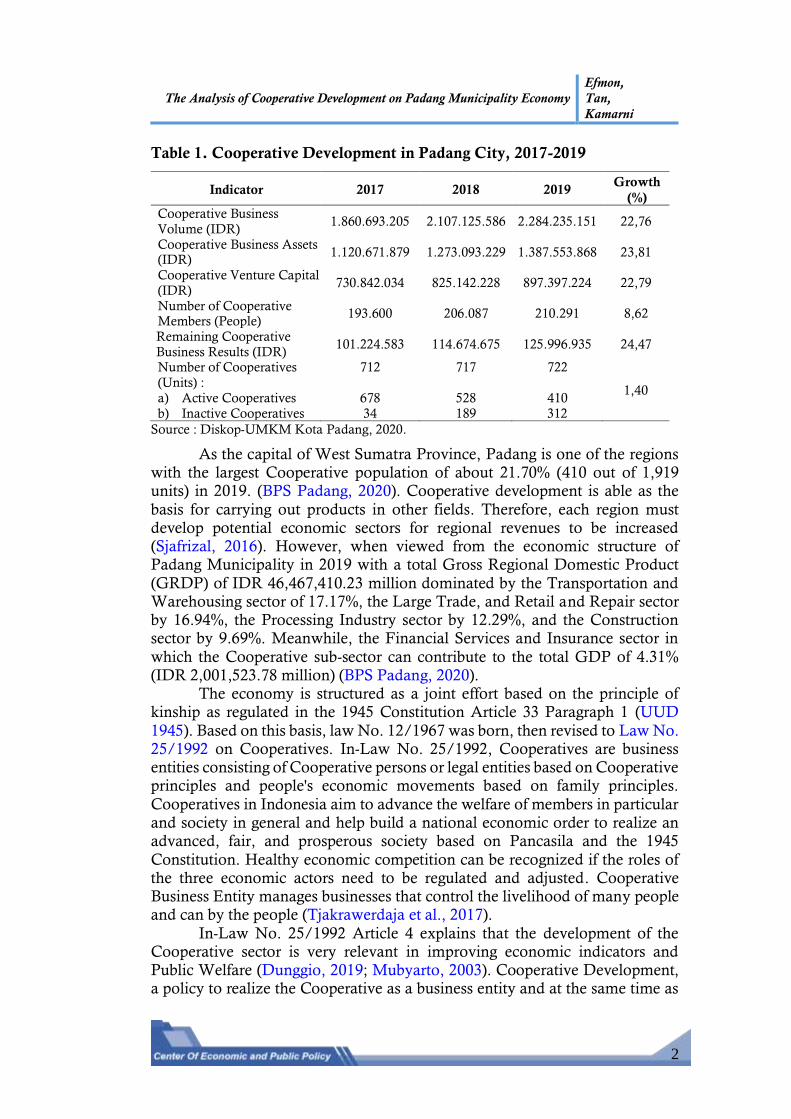
Each indicator of Cooperative Development in Padang Municipality
from 2017 to 2019 shows a significant increase. The number of cooperatives in Padang Municipality in 2019 has reached 722 units (410 active and 312 inactive) or grew by about 1.40% per year over the last three years. With an increase in the number of cooperative members by 8.26% per year (201,291
people in 2019), it has made each other suitable development indicators also increased by an average of 23.46% per year to the volume of business (turnovers), assets, own capital, and windfall profits (SHU) (Diskop-UMKM Padang, 2020). Therefore, the improvement of each indicator should contribute
significantly to the progress of Economic Performance and Community Welfare in Padang Municipality over the last three years.
The Analysis of Cooperative Development on Padang Municipality Economy
Efmon,
Tan,
Kamarni
2
Table 1. Cooperative Development in Padang City, 2017-2019
Indicator 2017 2018 2019 Growth
(%)
Cooperative Business
Volume (IDR) 1.860.693.205 2.107.125.586 2.284.235.151 22,76
Cooperative Business Assets (IDR)
1.120.671.879 1.273.093.229 1.387.553.868 23,81
Cooperative Venture Capital
(IDR) 730.842.034 825.142.228 897.397.224 22,79
Number of Cooperative Members (People)
193.600 206.087 210.291 8,62
Remaining Cooperative
Business Results (IDR) 101.224.583 114.674.675 125.996.935 24,47
Number of Cooperatives
(Units) :
a) Active Cooperatives
b) Inactive Cooperatives
712
678
34
717
528
189
722
410
312
1,40
Source : Diskop-UMKM Kota Padang, 2020.
As the capital of West Sumatra Province, Padang is one of the regions with the largest Cooperative population of about 21.70% (410 out of 1,919 units) in 2019. (BPS Padang, 2020). Cooperative development is able as the
basis for carrying out products in other fields. Therefore, each region must develop potential economic sectors for regional revenues to be increased (Sjafrizal, 2016). However, when viewed from the economic structure of Padang Municipality in 2019 with a total Gross Regional Domestic Product
(GRDP) of IDR 46,467,410.23 million dominated by the Transportation and Warehousing sector of 17.17%, the Large Trade, and Retail and Repair sector by 16.94%, the Processing Industry sector by 12.29%, and the Construction sector by 9.69%. Meanwhile, the Financial Services and Insurance sector in
which the Cooperative sub-sector can contribute to the total GDP of 4.31% (IDR 2,001,523.78 million) (BPS Padang, 2020).
The economy is structured as a joint effort based on the principle of kinship as regulated in the 1945 Constitution Article 33 Paragraph 1 (UUD
1945). Based on this basis, law No. 12/1967 was born, then revised to Law No. 25/1992 on Cooperatives. In-Law No. 25/1992, Cooperatives are business entities consisting of Cooperative persons or legal entities based on Cooperative principles and people's economic movements based on family principles.
Cooperatives in Indonesia aim to advance the welfare of members in particular
and society in general and help build a national economic order to realize an advanced, fair, and prosperous society based on Pancasila and the 1945
Constitution. Healthy economic competition can be recognized if the roles of the three economic actors need to be regulated and adjusted. Cooperative Business Entity manages businesses that control the livelihood of many people and can by the people (Tjakrawerdaja et al., 2017).
In-Law No. 25/1992 Article 4 explains that the development of the Cooperative sector is very relevant in improving economic indicators and
Public Welfare (Dunggio, 2019; Mubyarto, 2003). Cooperative Development, a policy to realize the Cooperative as a business entity and at the same time as

The Analysis of Cooperative Development on Padang Municipality Economy
Efmon,
Tan,
Kamarni
3
a healthy, resilient, vital, and independent people's economic movement and as a national economic pillar, as a forum to gather people's economic capabilities in national economic activities, to play a role in improving the financial
performance and welfare of the people (Swasono, 2004).
As a socio-economic institution, aspects of self-empowerment, agents of development, the Cooperative does not aim to profit, but as a forum (facilitator)
of jointly owned businesses to seek benefits for its members (Mubyarto, 2010). So that the development of Cooperatives is a manifestation of improving indicators of productivity of Cooperatives and the welfare of their members through the number of members, assets, business capital, business volume, and
windfall profits (SHU) to maintain the sustainability of future business (Sitio & Tamba, 2001; Regulation of the Minister of Cooperatives and SMEs, 2012)
Cooperative Development is an essential part of the economy in developing countries, as it can generate real income, contribute to reducing
income inequality, poverty, unemployment, and improving welfare (DeVille et al., 2007). Dogarawa (2005) stated that cooperatives play an important role in job creation, economic growth, and socio-economic development of the community (Agusalim et al., 2019; Alkire & Foster, 2011). One of the
indicators in measuring the success of economic growth is the economy's performance as an achievement of the performance of economic indicators in
the economic development of a region in aggregate in a certain period. Financial performance is very effectively used locally, regionally, nationally,
and multinationally related to macroeconomic indicators such as economic growth, inflation, budget deficit, unemployment, poverty, and others (Arsyad, 2010; Mankiw, 2019).
Public Welfare (Welfare Economic) itself is the output of the market
structure and allocation of goods and resources in economic activities to determine the overall welfare of society both standards of living, well-being, interest, and quality of life (Atkinson & Ezell, 2012; Dogarawa, 2005; Dunggio, 2019). According to the World Bank (2015), it is an indicator of the life
expectation index, expected years of schooling, mean years of education, and expenditure
per capita. Public Welfare can realize through equal growth and development in
all sectors of life. However, people's well-being has not only looked at high economic growth, but poverty, inequality, and unemployment remain massive problems (Kamarni et al., 2019; Midgley, 2014).
Furthermore, Bharadwaj (2012) stated that Cooperatives could be
effective socio-economic institutions in breaking the vicious cycle of poverty, especially in rural areas. Cooperatives are also able to create jobs, overcome socio-economic inequality, improve the quality of human resource education, and innovate to impact on improving productivity and national
competitiveness (Kumar et al., 2018; Smith & Rothbaum, 2013; Verhofstadt & Maertens, 2015; Wanglin & Awudu, 2016).
Theoretically and various empirical studies in multiple countries and regions in Indonesia have, but the condition experienced differences in Padang
Municipality. The state of Cooperative Development in its role micro and macro at this time, if there is no improvement in the national development
The Analysis of Cooperative Development on Padang Municipality Economy
Efmon,
Tan,
Kamarni
4
process, then it can risk exacerbating inequality and threatening the sustainability of development and welfare of the community itself (Alkire & Foster, 2011; Atkinson & Ezell, 2012; Dogarawa, 2005; DeVille et al., 2007).
On the other hand, Micro cooperative development can increase market share,
economies of scale, and scope among various business entities (Agusalim et al., 2019; Atkinson & Ezell, 2012; Dunggio, 2019). Thus, this study wants to prove
the empirical results directly both Agusalim et al. (2019); Alkire & Foster (2011); Atkinson & Ezell (2012); Dogarawa (2005); DeVille et al. (2007); Azhari et al. (2017) who recommended that the development of Cooperatives can improve Economic Performance and Public Welfare.
This research by Dunggio (2019) on developing the Cooperative sector in 9 districts/cities in Bali Province in a data panel in 2010-2014, using SEM-
PLS. Empirical findings state that the development of Cooperatives has a positive and significant effect on Public Welfare and Economic Performance,
or subsequently, Economic Performance has a significant impact on Public Welfare in 9 districts/ cities in Bali Province. The fundamental difference to Dunggio's research is that in this study, using Cooperative Development indicators following Regulation of the Minister of Cooperatives and SMEs of
the Republic of Indonesia Number 4/2012, by adding hands of Cooperative Development in terms of Own Capital and Economic Performance constructs
add indicators of unemployment. The hypothesis presented in this study is as a temporary conjecture on
some findings both theoretical and empirical before, namely: that the development of Cooperatives has a significant influence on Economic Performance in Padang Municipality during the period 2012-2019; it that the development of Cooperatives has a considerable effect on the public welfare in
Padang Municipality during the period 2012-2019; alleged Economic Performance has a significant influence on the Public Welfare in Padang Municipality during the period 2012-2019; it that the development of Cooperatives has a substantial effect on the Public Welfare in Padang
Municipality during the period 2012-2019 mediated by variable Economic Performance.
Or reverse proof of the Hatta (1987) hypothesis the need to build a Cooperative business entity system before making the economy realize Public
Welfare. This study aims to determine the influence of Cooperative Development on the Public Welfare in Padang Municipality during the period
2012-2019, where the Economic Performance is a variable mediator.
RESEARCH METHODS
This research design is a quantitative-exploratory approach with an
exploratory research approach (Sekaran & Bougie, 2016). The object of this research is all cooperatives registered in the Department of Cooperatives and SMEs of Padang City. Cross-sectoral as many as 17 types of cooperatives during the period 2012 to 2019 (8 years). There are 722 Cooperatives
Development and Renewal Units. However, along with the development of Cooperative business entity continuity, in 2019, the number of Cooperatives
The Analysis of Cooperative Development on Padang Municipality Economy
Efmon,
Tan,
Kamarni
5
that became the object of this research study amounted to 424 units of Cooperatives that are active and registered with the Office of Cooperatives MSMEs of Padang Municipality. All Cooperatives that are the object of this
research are Cooperatives engaged in the rill sector and saving-loans following
Law No. 25/1992 on Cooperatives. The sample selection in this study uses several stages approach following
selecting members of a particular population (Sekaran & Bougie, 2016). Determination of the number of research samples at each step of a specific method using a purposive procedure, namely the decision of the number of pieces by establishing unique characteristics and non-probability sampling
because members of the population who have homogeneous tendencies by specific criteria (Cooper & Schindler, 2011)
The research variables in this study are about the development of Cooperatives on Economic Performance and Public Welfare in Padang
Municipality during the period 2012 to 2019 consisting of 2 latent variables
(construct), i.e. construct latent exogenous: ξ (ksi) and construct latent
endogenous: η (eta) where both are unobserved variables (variables that can not be measured directly or through observation), are: 1) Construct latent
exogenous: ξ (ksi) namely the development of Cooperatives in the city of Padang with latent indicators: Turnover (OMZET), Assets (ASSETS), Own
Capital (EQUITY), Remaining Business Results (SHU), and the Number of
Members (MEMBERS); and 2) Construct latent endogenous: η (eta) namely Economic Performance with latent indicators: Economic Growth (GROWTH), Poverty Rate (POVERTY), Gini Ratio (GINI), and Unemployment Rate (UNEMPLOY); and Public Welfare with latent
indicators: Life Expectancy (LIFE_EXP), Expected Years Schooling (EYS), Mean Year Schooling (MYS), and Expenditure per Capita (CAP_EXPD).
The data of this research panel relates to the Data on Cooperative Development in Padang Municipality (i = 17) reported during the period 2012
to 2019 at the Office of Cooperatives and MSMEs of Padang Municipality. In addition, data on Economic Performance and Public Welfare was obtained from the Central Bureau of Statistics (BPS) Padang Municipality from 2012 to 2019 (t = 8), so the total observation was 136 samples.
It is testing this research model using Partial Least Square (PLS) approach with SmartPLS software, starting with model measurement (outer
model), structural model (inner model), and hypothesis testing of research
model (Ghozali, 2015). PLS, according to Ghozali, is an alternative approach that shifts from a covariance-based Structural Equation Modeling (SEM) system to a variant-based one. SEM is a statistical modeling technique that is very cross-sectional, linear, and common. Covariance-based SEM generally
tests causality or theory, whereas PLS is more predictive of models. PLS is a powerful analytical method, it does not have to meet the requirements of data normality assumptions, and the sample size does not have to be consistently large in number. PLS can also be used as a confirmation theory and can also
build relationships without theoretical basis or proposition testing.
The Analysis of Cooperative Development on Padang Municipality Economy
Efmon,
Tan,
Kamarni
6
Analysis using PLS-SEM through five stages process, where each step will affect the next stage (Ghozali, 2015; Vinzi et al., 2010), namely: 1) Designing measurement model (outer model). The relationship between the
development of the Cooperative and its latent indicators is Reflective. Likewise,
the relationship between Economic Performance and its latent indicators is Reflective. Meanwhile, the connection of public welfare with its hands is
Formative; 2) Design structural or inner model. Outer specifications or measurement of research models evaluated using Confirmatory Factor Analysis (CFA); 3) Specification of internal (structural model) research using path analysis approach or recursive model and causal chain system; 4)
Weighted Relation research model; and 5) Direct and Indirect Effect research
models. The direct effect is indicated by the loading value of γxy, while the
Indirect Effect by the loading value of βxz and γzy. Thus, the Total Effect of
exogenous latent variables on endogenous latent variables controlled by
mediators is the summation of direct and indirect effects into γxy + βxzγzy.
Evaluation of structural equation models through partial least square (PLS) approach in this study, including evaluation of outer model
(measurement model) and evaluation of inner model (structural model) (Ghozali, 2015; Vinzi et al., 2010), namely:
1) Rule of Thumb Evaluation Measurement Model – Reflective :
a) Convergent Validity with standardize loading factor parameter (λ) (> 0.70 for confirmatory research and > 0.60 for explanantory research, loading factor value ≥ 0.7 or > 0.5 can be said to be ideal), Average
Variance Extracted (AVE) (> 0.50 for confirmatory or explanantory research, > 0.60 for explanantory research).
b) Discriminant Validity and Reliability with Cross-loading parameters (> 0.70 for each construct).
c) The square root of ave (√AVE) > correlation between latent constructs.
d) Cronbach's Alpha (> 0.70 for Confirmatory Research and > 0.60 is still acceptable for Explanatory Research).
e) Composite Reliability (> 0.70 for Confirmatory Research and > 0.60 is still acceptable for Explanatory Research).
2) Rule of Thumb Evaluation Measurement Model – Formative :
a) Significance Weight (> 1.65 (α = 10%), > 1.96 (α = 5%), and > 2.58
(α = 1%).
b) Multicolinearity (VIF < 10 or < 5 and Tolerance > 0.10 or 0.20). 3) Rule of Thumb Structural Model Evaluation, with parameters:
a) R–Square (0.67; 0.33 and 0.19 indicate strong, moderate and weak models &0.75; 0.50 and 0.25 indicating strong, moderate and weak models).
b) Effect Size (f2) (0.02; 0.15 and 0.35 indicate small, medium and
large). c) Q2 = Predictive Relevance value (close to 1, the structural model fits
with the data or has relevance predictions).
The Analysis of Cooperative Development on Padang Municipality Economy
Efmon,
Tan,
Kamarni
7
d) Significance (Two Tailed) (1.65, α = 10%, 1.96, α = 5% and 2.58, α = 1%).
RESULTS AND DISCUSSION
Descriptive Analysis of Research Results
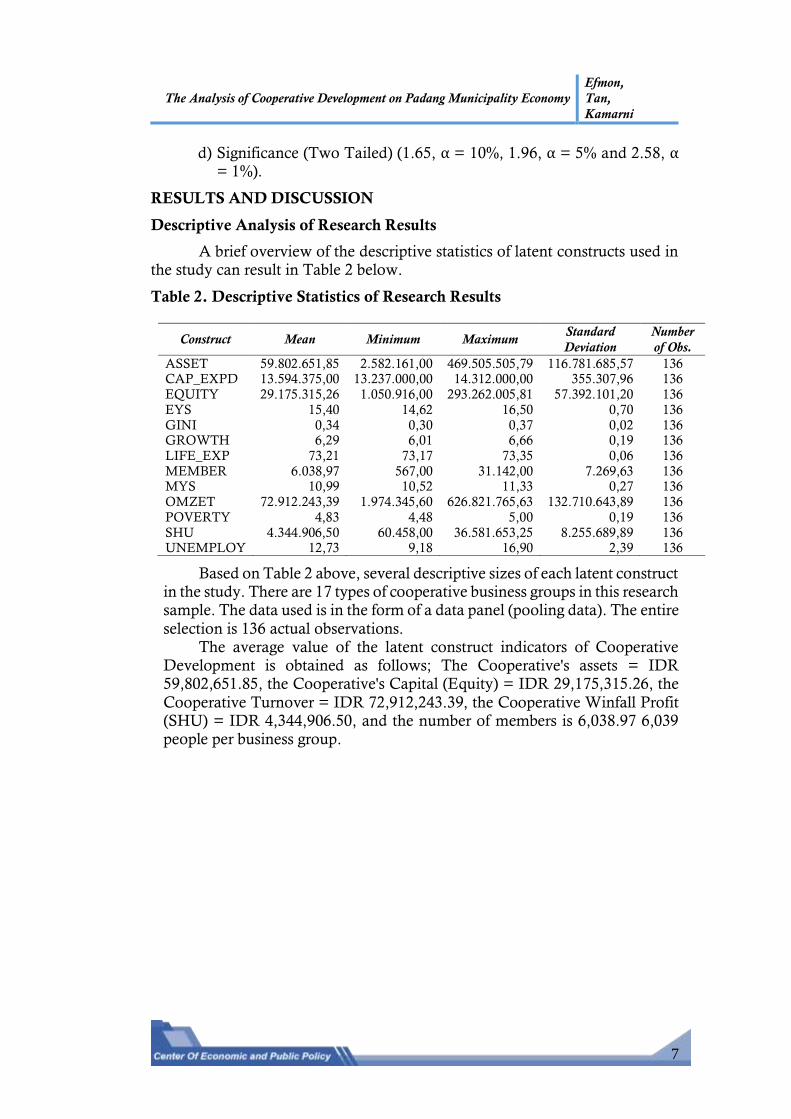
A brief overview of the descriptive statistics of latent constructs used in the study can result in Table 2 below.
Table 2. Descriptive Statistics of Research Results
Construct Mean Minimum Maximum Standard
Deviation
Number
of Obs.
ASSET 59.802.651,85 2.582.161,00 469.505.505,79 116.781.685,57 136 CAP_EXPD 13.594.375,00 13.237.000,00 14.312.000,00 355.307,96 136
EQUITY 29.175.315,26 1.050.916,00 293.262.005,81 57.392.101,20 136
EYS 15,40 14,62 16,50 0,70 136
GINI 0,34 0,30 0,37 0,02 136 GROWTH 6,29 6,01 6,66 0,19 136
LIFE_EXP 73,21 73,17 73,35 0,06 136
MEMBER 6.038,97 567,00 31.142,00 7.269,63 136 MYS 10,99 10,52 11,33 0,27 136
OMZET 72.912.243,39 1.974.345,60 626.821.765,63 132.710.643,89 136
POVERTY 4,83 4,48 5,00 0,19 136
SHU 4.344.906,50 60.458,00 36.581.653,25 8.255.689,89 136 UNEMPLOY 12,73 9,18 16,90 2,39 136
Based on Table 2 above, several descriptive sizes of each latent construct in the study. There are 17 types of cooperative business groups in this research sample. The data used is in the form of a data panel (pooling data). The entire
selection is 136 actual observations. The average value of the latent construct indicators of Cooperative
Development is obtained as follows; The Cooperative's assets = IDR 59,802,651.85, the Cooperative's Capital (Equity) = IDR 29,175,315.26, the
Cooperative Turnover = IDR 72,912,243.39, the Cooperative Winfall Profit (SHU) = IDR 4,344,906.50, and the number of members is 6,038.97 6,039 people per business group.

The Analysis of Cooperative Development on Padang Municipality Economy
Efmon,
Tan,
Kamarni
8
Structural Equation Model Evaluation
The calculation results of the entire model using the SmartPLS - Partial Least Square statistics program are as follows:
Figure 1. Full Model – Path Diagram Empirical Results
Testing of Structural Equation Modelling results with PLS approach by
looking at the results of the Measurement Model (Outer Model) and Structural Model (Inner Model) of the empirical model above, as follows:
1) Measurement Model Test Results
Table 3. Loading Factor Indicator Construct outer model (COOP_DEV)
Manifest Variable Original Samples (O) Std. Dev T-Stat Information
OMZET COOP_DEV 0,791 0,078 10,119 Valid
ASSET COOP_DEV 0,881 0,044 20,023 Valid
EQUITY COOP_DEV 0,898 0,069 13,009 Valid
SHU COOP_DEV 0,635 0,120 5,288 Valid
MEMBER COOP_DEV 0,664 0,136 4,885 Valid
Based on Table 3 above, it can that the five construct indicators or
manifest variables of Cooperative Development have outer loadings value of original samples greater than 0.5 to 0.7, and P-value is smaller than the level of
significance α = 0.05, which is reflective. The construct COOP_DEV and its indicators have a reasonably high correlation and meet the requirements of convergent validity.

The Analysis of Cooperative Development on Padang Municipality Economy
Efmon,
Tan,
Kamarni
9
Table 4. Loading Factor Indicator Construct Outer Model (ECO_PERF)
Manifest Variable Original Samples (O) Std. Dev T-Stat Information
GROWTH ECO_PERF -0,591 0,182 -3,253 Valid
POVERTY ECO_PERF 0,837 0,048 17,282 Valid
GINI ECO_PERF 0,663 0,126 5,246 Valid
UNEMPLOY ECO_PERF 0,602 0,136 4,424 Valid
Based on Table 4 above, the four construct indicators (manifest variables) of Economic Performance have external loadings value of original samples greater than 0.5 to 0.7, and P-value is smaller than the significance level
of significance α = 0.05 is Reflective. The construct ECO_PERF and its
indicators have a reasonably high correlation and meet the requirements of
convergent validity.
Table 5. Loading Factor Indicator Construct Outer Model (SOC_WELF)
Manifest Variable Original Samples (O) Std. Dev T-Stat Information
LIFE_EXP → SOC_WELF -0,558 0,058 -9,590 Valid
EYS → SOC_WELF -0,588 0,085 -6,905 Valid
MYS → SOC_WELF 0,911 0,031 29,609 Valid
CAP_EXPD → SOC_WELF 0,861 0,083 10,370 Valid
Based on Table 5 above, the four construct indicators or manifest variables of Public Welfare have external loadings value of original samples
greater than 0.5 to 0.7. P-value is smaller than the level of significance α = 0.05, which is formative. The construct SOC_WELF and its indicators have a reasonably high correlation and meet the requirements of convergent validity.
Based on the test results of the measurement model (outer model) of this study, obtained the following products:
Table 6. Average Variance Extracted (AVE) Value of Reflective Latent
Constructs
Latent Construct AVE √AVE Information
COOP_DEV 0,610 0,781 Valid
ECO PERF 0,348 0,590 Valid
Based on Table 6, the latent constructs of exogenous Cooperative Development and the latent constructs of endogenous Economic Performance
have a square root value of Average Variance Extracted (AVE) greater than 0.5. The SOC_WELF construct and its indicators have a reasonably high correlation and meet the discriminant validity requirements. Table 7 below describes the discriminant validity values.
The Analysis of Cooperative Development on Padang Municipality Economy
Efmon,
Tan,
Kamarni
10
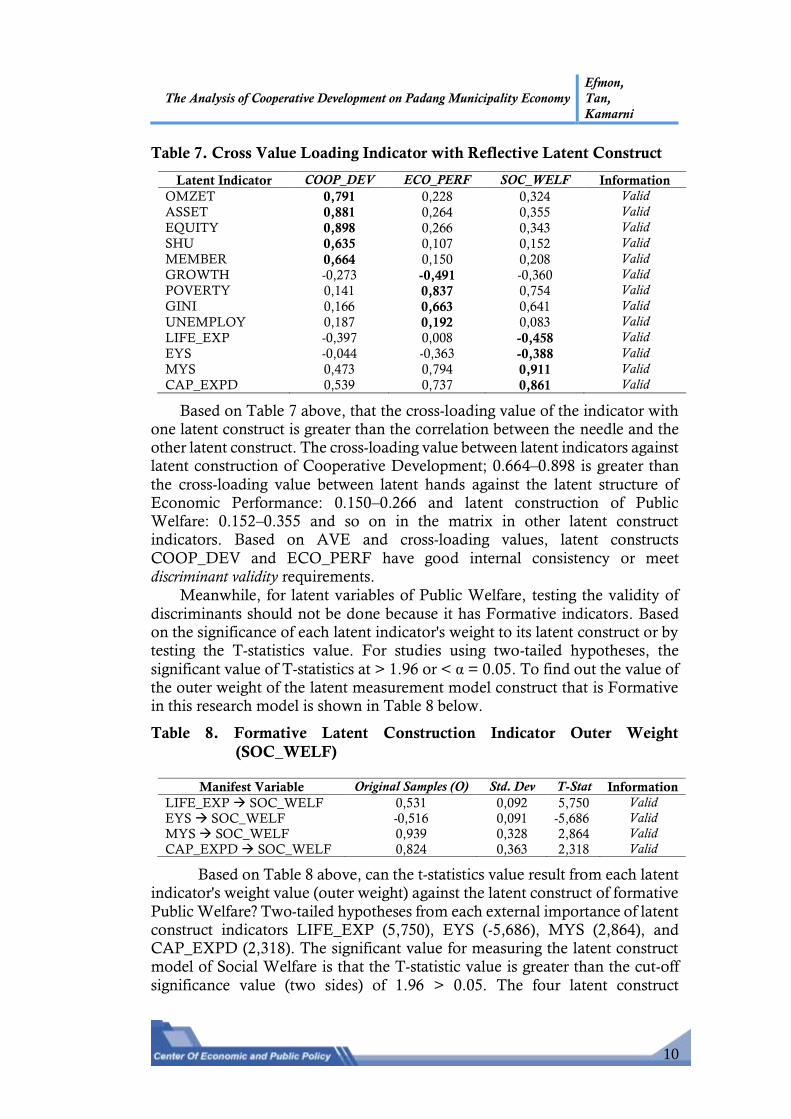
Table 7. Cross Value Loading Indicator with Reflective Latent Construct
Latent Indicator COOP_DEV ECO_PERF SOC_WELF Information
OMZET 0,791 0,228 0,324 Valid
ASSET 0,881 0,264 0,355 Valid
EQUITY 0,898 0,266 0,343 Valid
SHU 0,635 0,107 0,152 Valid
MEMBER 0,664 0,150 0,208 Valid
GROWTH -0,273 -0,491 -0,360 Valid
POVERTY 0,141 0,837 0,754 Valid
GINI 0,166 0,663 0,641 Valid
UNEMPLOY 0,187 0,192 0,083 Valid
LIFE_EXP -0,397 0,008 -0,458 Valid
EYS -0,044 -0,363 -0,388 Valid
MYS 0,473 0,794 0,911 Valid
CAP_EXPD 0,539 0,737 0,861 Valid
Based on Table 7 above, that the cross-loading value of the indicator with one latent construct is greater than the correlation between the needle and the other latent construct. The cross-loading value between latent indicators against latent construction of Cooperative Development; 0.664–0.898 is greater than
the cross-loading value between latent hands against the latent structure of Economic Performance: 0.150–0.266 and latent construction of Public Welfare: 0.152–0.355 and so on in the matrix in other latent construct indicators. Based on AVE and cross-loading values, latent constructs
COOP_DEV and ECO_PERF have good internal consistency or meet discriminant validity requirements.
Meanwhile, for latent variables of Public Welfare, testing the validity of
discriminants should not be done because it has Formative indicators. Based on the significance of each latent indicator's weight to its latent construct or by testing the T-statistics value. For studies using two-tailed hypotheses, the
significant value of T-statistics at > 1.96 or < α = 0.05. To find out the value of the outer weight of the latent measurement model construct that is Formative in this research model is shown in Table 8 below.
Table 8. Formative Latent Construction Indicator Outer Weight
(SOC_WELF)
Manifest Variable Original Samples (O) Std. Dev T-Stat Information
LIFE_EXP → SOC_WELF 0,531 0,092 5,750 Valid
EYS → SOC_WELF -0,516 0,091 -5,686 Valid
MYS → SOC_WELF 0,939 0,328 2,864 Valid
CAP_EXPD → SOC_WELF 0,824 0,363 2,318 Valid
Based on Table 8 above, can the t-statistics value result from each latent indicator's weight value (outer weight) against the latent construct of formative
Public Welfare? Two-tailed hypotheses from each external importance of latent construct indicators LIFE_EXP (5,750), EYS (-5,686), MYS (2,864), and CAP_EXPD (2,318). The significant value for measuring the latent construct
model of Social Welfare is that the T-statistic value is greater than the cut-off
significance value (two sides) of 1.96 > 0.05. The four latent construct

The Analysis of Cooperative Development on Padang Municipality Economy
Efmon,
Tan,
Kamarni
11
indicators can be tested further in the structural model of People's Welfare as latent formative endogenous.
The results of the reliability test of the measurement model on the outer
model of this study, presented in Table 9, follows:
Table 9. Composite Reliability Latent Reflective Constructs
Latent Construct CR Information
COOP_DEV 0,885 Reliabel
ECO_PERF 0,321 Tidak Reliabel
Based on Table 9 above, the composite reliability (CR) value of the measurement model in the outer model of this study, there is one latent construct with a CR value smaller than 0.7, which is ECO_PERF (0.321). Some
latent construction indicators ECO_PERF are not reliable to measure Economic Performance in Padang City. However, removing one construct in this research model will cause the research model to lose its meaning and primary purpose. Theoretically, reflective constructs that have insignificant
indicators can still be continued in structural testing but potentially reduce the predictive effect of causality between constructs (Abdillah & Hartono, 2015). Meanwhile, for latent constructs, COOP_DEV has a CR value greater than 0.7 (0.885); in other words, all manifest variables of latent constructs COOP_DEV
proven to have good accuracy and consistency in measuring constructs.
2) Structural Model Test Results
The following table 10 will show structural model testing (inner model) results in this study.
Tabel 10. Nilai R2 (Square) Konstruk Latent Endogenous
Latent Construct R2 (Square) Adjusted-R2 Information
ECO_PERF 0,076 0,069 Lemah
SOC_WELF 0,819 0,816 Kuat
Construction of Economic Performance in Padang Municipality in this
research model is weak. Based on Table 10 above, the R2 (R-Square) value of the latent construct of Economic Performance is 0.076. Variations in Cooperative Development can explain variations in Economic Performance construct changes constructs in Padang Municipality by 7.6%. Other constructs
outside the model define the remaining 92.4% percent of the rest.
Cooperative Development can explain public welfare constructs moderated by Economic Performance constructs in Padang Municipality as
much as 81.9%. Meanwhile, the value of the R2 (R-Square) Public Welfare construct is 0.816, more significant than 0.7, so that the Public Welfare construct is categorized firmly in this research model. In comparison, other constructs define the remaining 18.1% outside the model.
Stone Geiser Q-Square (Q2) Test Result
Based on the R2 value in Table 10 above, the Q2 value obtained for this
study is: Q2 = 1-{(1- 0,076) (1-0,816)}= 1-{(0,924) (0,184)}= 1-0,170016 =

The Analysis of Cooperative Development on Padang Municipality Economy
Efmon,
Tan,
Kamarni
12
0,8299. The results of the calculation of Q2 above 0.830 indicate that in the structural model of this study. 82.99% of the variation of changes in the latent construct of welfare can be predicted in relevance by variations of latent
construction. Cooperative development moderated by the latent construction
of Performance Economy in Padang City in a structural model. In comparison, other constructs explain the remaining 17.01% outside the research model.
Evaluation of Direct Effects, Indirect Effects, and Total Effects of Research
Models
Figure 2. Path Coefficient Structural Model
Figure 2 above shows the results of structural model testing through the
inner model in a one-away path or direct effect of each latent construct of the empirical model of the above research results, as follows:
1) Path Coefficient, the influence between the Development of Cooperatives
and Economic Performance obtained by γ1 = 0.276. There is a positive influence between Cooperative Development on Economic Performance.
If the Development of Cooperatives can by only 10%, then the Economic Performance will increase by 2.76%.
2) Path Coefficient, the influence between Economic Performance and Public
Welfare obtained by γ2 = 0.858. That is the positive influence between Economic Performance and Public Welfare in Padang Municipality from
2012 to 2019. If Economic Performance can be increased only by 10%, then Community Welfare in Padang City will increase by 8.58%.
3) Path Coefficient, the influence between the Development of Cooperatives
and Public Welfare obtained by γ3 = 0.137. That is the positive influence between the Development of Cooperatives on the Public Welfare in Padang Municipality during 2012 to 2019. If Cooperative Development can by only 10%, Padang City Community Welfare will increase by 1.37%
See the results of structural model testing direct effect, indirect effect,
and total effect can be seen in Table 11, as follows:
The Analysis of Cooperative Development on Padang Municipality Economy
Efmon,
Tan,
Kamarni
13
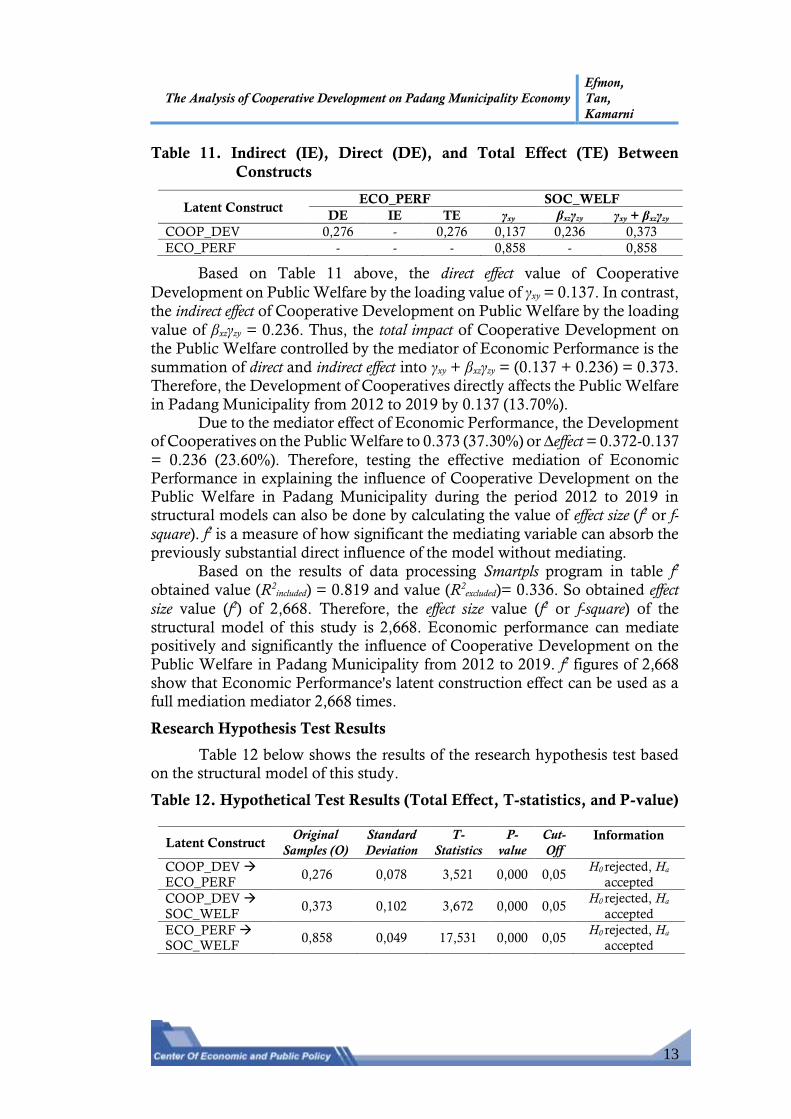
Table 11. Indirect (IE), Direct (DE), and Total Effect (TE) Between
Constructs
Latent Construct ECO_PERF SOC_WELF
DE IE TE γxy βxzγzy γxy + βxzγzy
COOP_DEV 0,276 - 0,276 0,137 0,236 0,373
ECO_PERF - - - 0,858 - 0,858
Based on Table 11 above, the direct effect value of Cooperative
Development on Public Welfare by the loading value of γxy = 0.137. In contrast,
the indirect effect of Cooperative Development on Public Welfare by the loading
value of βxzγzy = 0.236. Thus, the total impact of Cooperative Development on
the Public Welfare controlled by the mediator of Economic Performance is the
summation of direct and indirect effect into γxy + βxzγzy = (0.137 + 0.236) = 0.373.
Therefore, the Development of Cooperatives directly affects the Public Welfare
in Padang Municipality from 2012 to 2019 by 0.137 (13.70%). Due to the mediator effect of Economic Performance, the Development
of Cooperatives on the Public Welfare to 0.373 (37.30%) or ∆effect = 0.372-0.137
= 0.236 (23.60%). Therefore, testing the effective mediation of Economic Performance in explaining the influence of Cooperative Development on the Public Welfare in Padang Municipality during the period 2012 to 2019 in
structural models can also be done by calculating the value of effect size (f2 or f-
square). f2 is a measure of how significant the mediating variable can absorb the
previously substantial direct influence of the model without mediating.
Based on the results of data processing Smartpls program in table f2
obtained value (R2included) = 0.819 and value (R2
excluded)= 0.336. So obtained effect
size value (f2) of 2,668. Therefore, the effect size value (f2 or f-square) of the
structural model of this study is 2,668. Economic performance can mediate positively and significantly the influence of Cooperative Development on the
Public Welfare in Padang Municipality from 2012 to 2019. f2 figures of 2,668
show that Economic Performance's latent construction effect can be used as a full mediation mediator 2,668 times.
Research Hypothesis Test Results
Table 12 below shows the results of the research hypothesis test based on the structural model of this study.
Table 12. Hypothetical Test Results (Total Effect, T-statistics, and P-value)
Latent Construct Original
Samples (O)
Standard
Deviation
T-
Statistics
P-
value
Cut-
Off Information
COOP_DEV →
ECO_PERF 0,276 0,078 3,521 0,000 0,05
H0 rejected, Ha
accepted
COOP_DEV →
SOC_WELF 0,373 0,102 3,672 0,000 0,05
H0 rejected, Ha
accepted
ECO_PERF →
SOC_WELF 0,858 0,049 17,531 0,000 0,05
H0 rejected, Ha
accepted
The Analysis of Cooperative Development on Padang Municipality Economy
Efmon,
Tan,
Kamarni
14
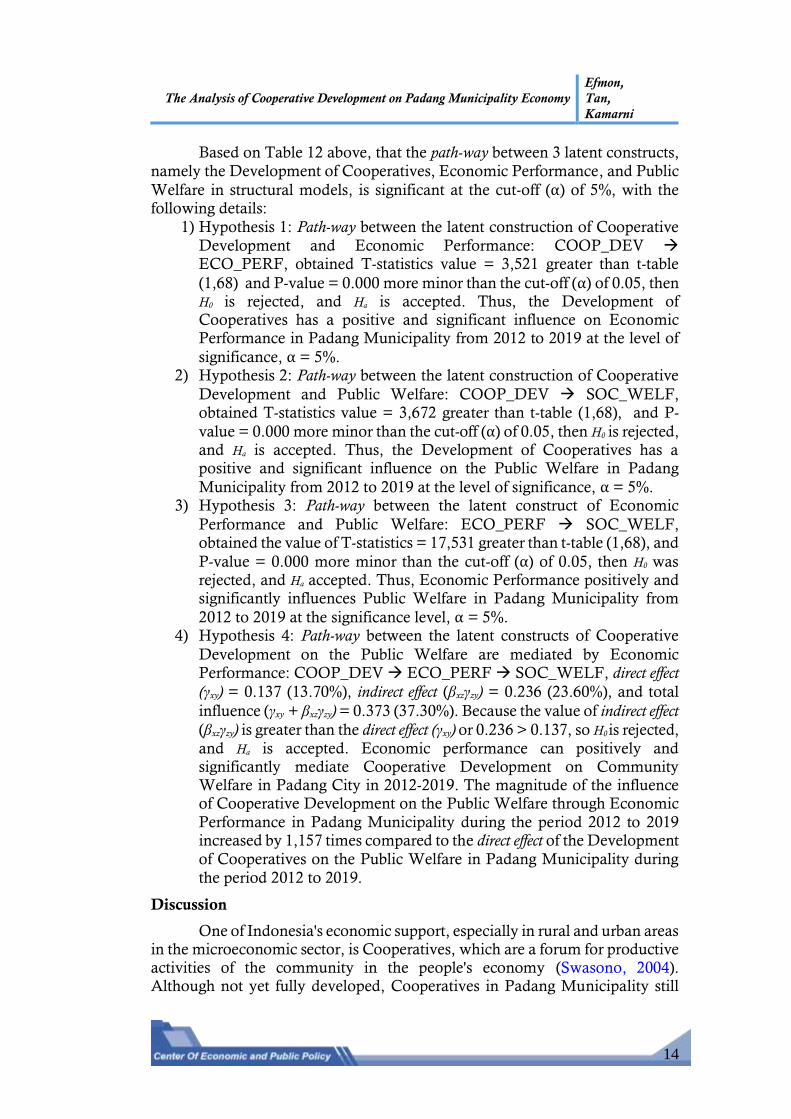
Based on Table 12 above, that the path-way between 3 latent constructs,
namely the Development of Cooperatives, Economic Performance, and Public
Welfare in structural models, is significant at the cut-off (α) of 5%, with the following details:
1) Hypothesis 1: Path-way between the latent construction of Cooperative
Development and Economic Performance: COOP_DEV → ECO_PERF, obtained T-statistics value = 3,521 greater than t-table
(1,68) and P-value = 0.000 more minor than the cut-off (α) of 0.05, then H0 is rejected, and Ha is accepted. Thus, the Development of Cooperatives has a positive and significant influence on Economic Performance in Padang Municipality from 2012 to 2019 at the level of
significance, α = 5%. 2) Hypothesis 2: Path-way between the latent construction of Cooperative
Development and Public Welfare: COOP_DEV → SOC_WELF, obtained T-statistics value = 3,672 greater than t-table (1,68), and P-
value = 0.000 more minor than the cut-off (α) of 0.05, then H0 is rejected, and Ha is accepted. Thus, the Development of Cooperatives has a positive and significant influence on the Public Welfare in Padang
Municipality from 2012 to 2019 at the level of significance, α = 5%. 3) Hypothesis 3: Path-way between the latent construct of Economic
Performance and Public Welfare: ECO_PERF → SOC_WELF, obtained the value of T-statistics = 17,531 greater than t-table (1,68), and
P-value = 0.000 more minor than the cut-off (α) of 0.05, then H0 was rejected, and Ha accepted. Thus, Economic Performance positively and significantly influences Public Welfare in Padang Municipality from
2012 to 2019 at the significance level, α = 5%. 4) Hypothesis 4: Path-way between the latent constructs of Cooperative
Development on the Public Welfare are mediated by Economic Performance: COOP_DEV → ECO_PERF → SOC_WELF, direct effect
(γxy) = 0.137 (13.70%), indirect effect (βxzγzy) = 0.236 (23.60%), and total
influence (γxy + βxzγzy) = 0.373 (37.30%). Because the value of indirect effect
(βxzγzy) is greater than the direct effect (γxy) or 0.236 > 0.137, so H0 is rejected,
and Ha is accepted. Economic performance can positively and significantly mediate Cooperative Development on Community Welfare in Padang City in 2012-2019. The magnitude of the influence of Cooperative Development on the Public Welfare through Economic
Performance in Padang Municipality during the period 2012 to 2019 increased by 1,157 times compared to the direct effect of the Development
of Cooperatives on the Public Welfare in Padang Municipality during
the period 2012 to 2019.
Discussion
One of Indonesia's economic support, especially in rural and urban areas in the microeconomic sector, is Cooperatives, which are a forum for productive activities of the community in the people's economy (Swasono, 2004). Although not yet fully developed, Cooperatives in Padang Municipality still
The Analysis of Cooperative Development on Padang Municipality Economy
Efmon,
Tan,
Kamarni
15
show their existence in improving the micro-economy of the region. Until 2017, there was a significant increase in the total number of Cooperatives in Padang Municipality, reaching 729 units (678 active and 34 inactive.) Nevertheless,
there was a decrease again but not so significant, especially in 2018 and 2019,
which resulted in the total number of Cooperatives in the last year (2019) to 722 units (410 active and 312 inactive).
Overall, there has been an increase of 20.13% in the total number of Cooperatives from 2012 to 2019 (Dinas Koperasi & UMKM Kota Padang, 2020). The number of cooperative members in Padang City increased from 2012-2019 by 49.46% or 106,276 to 210,291. Continuous increases in Own
Capital, Assets, Turnover, and Windfall Profits (SHU) with an average growth of 12.03%, 8.96%, 17.06%, and 11.99%, respectively.
Regulation of the Minister of Cooperatives and MSMEs Number 10/2015 concerning Cooperative Institutions sustainably and sustainably can
succeed in the government's movement to grow the economy (pro-growth). Contribute to increasing the number of Cooperatives and Members, Own Capital, Assets, Turnover, Windfall Profit and reduce the unemployment rate (pro job), and People's Welfare to achieve a decent standard of living (pro-
poor). Cooperative development in improving the economy of Padang City for
the period 2012 to 2019, the Financial Services and Insurance Sector (in which there is the Cooperative sector) can contribute to the total GRDP of 4.31% (Rp
2,001,523.78 million). Also relevant to Dunggio (2019), Cooperatives impact economic development processes, including increased employment and regional revenue growth. Dogarawa (2005) revealed that the Cooperative's role in the economy includes facilitating job creation, economic growth, and social
development. Baswir (2013) gives the same view that Cooperatives contribute to reducing poverty and job creation. Cooperatives can overcome inefficiency and ineffectiveness if they carry out individual economic activities in the region. Sociologically, collective action and in-group feeling to face competition
threaten the community's financial system. The role of Cooperatives in the economy is nothing but to increase
economies of scale and economies of scope (Baswir, 2013). The merger of the same and small-scale businesses (primarily people's businesses) into larger-scale
joint ventures is very likely to result in greater efficiency to production, management, and various aspects of the economy. Togetherness at the
operational level is also essential to minimize risks collectively and overcome
information asymmetry to reduce losses. Cooperatives with an integrated network will overcome the problem of information asymmetry. In reality, actors in the production sub-system often do not know the situation of the marketing sub-system (Baswir, 2013; Boediono, 1982).
The fluctuations in economic growth and the high unemployment rate in Padang City have triggered questions regarding financial management, which is considered no longer in line with the constitutional mandate of the 1945 Constitution Article 33 Paragraph 1. The economy not structured as a
joint business but as a company owned by individuals is the main culprit. The

The Analysis of Cooperative Development on Padang Municipality Economy
Efmon,
Tan,
Kamarni
16
contribution of Cooperative Development to the economy of Padang City during the period 2012 to 2019 was less than 4.31%. Not only that, but inequality also decreases the quality of economic growth in reducing poverty
and unemployment. Economic growth tends to be enjoyed by economic actors
with only upper-income levels caused by economic growth that is not inclusive or unequal. (Dunggio, 2019; World Bank, 2015)
Furthermore, suppose there is no affirmative step to redistribute income from top to bottom. In that case, economic growth is at risk of exacerbating the inequality that can ultimately increase social tensions. To some point, it can threaten the sustainability of economic growth and development (World Bank,
2015). Based on the development of Cooperatives in the world, the development of the Cooperative sector can be a solution to improve the
Economic Performance of a country. Macro-based, early indications from the low levels of inequality, poverty, and unemployment in these countries, where
the Cooperative sector contributes significantly to the economy. Meanwhile, micro-Cooperatives have market share, economies of scale,
and economies of scope among various business entities. Suppose the joint venture with governance that is not profit-oriented but benefit-oriented. In that
case, the focus is on improving the welfare of its members, then micro-cooperatives can be realized. (Dogarawa, 2005; Dunggio, 2019).
Based on the level of community welfare through the Human Development Index (HDI) approach in Padang Municipality during 2012 to
2019 in terms of Cooperative Development and improved Economic Performance, obtained a significant improvement of every indicator of Public Welfare. Got that Life Expectancy is about 73.24 years, Expected Years of Schooling about 15.43 years, Mean Years of Schooling approximately 11.34
years, and Expenditure per Capita in Padang Municipality from 2010 to 2019 is IDR 13,668,000 per year.
Empirically, the significant influence of Cooperative sector development on the Public Welfare through Economic Performance in Padang
Municipality during 2012 to 2019 was able to contribute 1,157 times compared to direct impact. In line with Philip (2003), Cooperative sector mobilization contributes to the level of Community Welfare, especially the literacy rate in the Indian state of Kerala of up to 90%, a figure above the Indian average of
51%. However, Dunggio (2019) revealed different empirical results that the development of Cooperatives in 9 districts/cities in Bali Province has a more
significant influence than the Economic Performance in creating Public
Welfare.
CONCLUSION
Based on the objectives and empirical results of the research, the development of Cooperatives has a positive and significant influence on the Economic Performance and the Public Welfare in Padang Municipality during the period 2012-2019. Economic performance positively and significantly
impacted the Public Welfare in Padang Municipality during 2012-2019. Financial performance can substantially mediate the effect of Cooperative

The Analysis of Cooperative Development on Padang Municipality Economy
Efmon,
Tan,
Kamarni
17
Development on the Public Welfare in Padang Municipality during the period 2012-2019. The direct impact between the Cooperatives Development on the
Public Welfare is smaller than through the Economic Performance in Padang Municipality during 2012-2019. Lastly, the Economic Performance was able to mediate the influence of Cooperative Development on the Public Welfare in Padang Municipality during the period 2012-2019 incomplete mediation.
Suggestions from this research Cooperatives as business actors in the city of Padang need to improve several things related to the development of cooperatives with a local economic development approach, related to
indicators of increasing the number of assets, own capital, turnover, number of members, and windfall profit. Policy to do improving people and systems, collaborative innovation, market share, cooperative education, people-centered
business, job creation, and adopting the digitalization era. For the city government, the Office of Cooperatives and MSMEs and universities in the Padang Municipal Environment need to take steps to create stability of Economic Performance so that the successful development of the Cooperative
sector can improve community welfare. The government can take steps in sustainable development, research, and business development, increasing economic scale and economic scope and formulating more targeted regulations in the development of cooperatives in the face of competition and the era of
economic digitization. This research has limitations in the generalization and determination of
study objects, research methods, and the scope of variables used. However, this empirical result is indeed very relevant in representing the reality of
Cooperative sector development in Padang Municipality today. However, for further studies, the need to add to the existence of various pertinent variables and more contributive to the development of the Cooperative itself, such as non-economic factors of the Cooperative sector, development and management
patterns, and business continuity in market competition. Furthermore, Economic Performance indicators should be the main driving factor and more contributive in improving Public Welfare compared to the development of the Cooperative sector in sterile regional economic conditions and low stability.
REFERENCES
Abdillah, Willy, and Jogiyanto Hartono. 2015. Partial Least Square (PLS):
Alternative Structural Equation Modeling (SEM) in Business Research. 1st ed.
Yogyakarta: ANDI. Agusalim, Lestari, Muhammad Karim, and Yaddarabullah. 2019. "Indonesia
Cooperative and Members Welfare : A Panel Data Analysis." Economics
Development Analysis Journal 8(1): 9–21.
Alkire, Sabina, and James Foster. 2011. "Counting and Multidimensional Poverty Measurement." Journal of Public Economics 95(7–8): 476–87.
Arsyad, Lincolin. 2010. Ekonomi Pembangunan. 5th ed. Yogyakarta: UPP STIM
YKPN.
Atkinson, Robert D., and Stephen J. Ezell. 2012. Innovation of Economics : The
Race for Global Advantage. Connecticut: Yale University Press.

The Analysis of Cooperative Development on Padang Municipality Economy
Efmon,
Tan,
Kamarni
18
Azhari, Gito., Mohd. N. Syechalad., Ishak Hasan, and M. Shabri A. Majid. 2017.
"The Role of Cooperative in the Indonesian Economy." International Journal
of Humanities and Social Science Invention. Vol. 6 (10): 43-46. Badan Pusat Statistik (BPS) Kota Padang. 2020. Padang Municipality in Figure
2019. Padang: BPS-Statistic of Padang Municipality.
Baswir, Revrisond. 2013. Koperasi Indonesia. 3rd ed. Yogyakarta: BPFE.
Dogarawa, Ahmad B. 2005. "The Role of Cooperative Societies in Economic Development." University Library of Munich, Germany, MPRA Paper.
Bharadwaj, Bishal. 2012. "Roles of Cooperatives in Poverty Reduction : A Case of Nepal." Administration and Management Review 24(1): 120–39.
Boediono. 1982. “Koperasi Dalam Teori Ekonomi Mikro: Kasus Koperasi Produsen.” Economics and Finance in Indonesia, Faculty of Economics and
Business, University of Indonesia 30: 39–58.
Cooper, Donald R., and Pamela S. Schindler. 2011. Business Research Methods.
11th ed. New York: McGraw-Hill Companies Inc. DeVille, Katherine C., Jaqueline E. Penn, and E. Eldon Eversull. 2007. Farmer
Cooperative Statistics, 2006. Washington, D.C.
Dinas Koperasi dan UMKM Kota Padang. 2020. Data Keragaan Koperasi Dan
UMKM Kota Padang Tahun 2012-2019. Padang.
Dunggio, Maryam. 2019. "The Influence of Cooperative Development on Economic Performance and Welfare of Society in Bali Province." Journal
of Economics and Finance (IOSR-JEF) 7(5): 28–38.
Ghozali, Iman, and Hengki Latan. 2015. Partial Least Squares, Konsep, Teknik
Dan Aplikasi Menggunakan Program Smartpls 3.0 Untuk Penelitian Empiris.
Semarang: Badan Penerbit UNDIP.
Hatta, Mohammad. 1987. Membangun Koperasi Dan Koperasi Membangun.
Jakarta: Inti Idayu Press. Kamarni, Neng, Muslich Anshori, and Raditya Sukmana. 2019. "Poverty
Alleviation Through Social Capital in Coastal Areas: Pariaman Coastal Case." Journal of Innovation in Business and Economics 3(1): 1–10.
Kumar, A., S. Saroj, P. K. Joshi, and H. Takeshima. 2018. "Does Cooperative
Membership Improve Household Welfare? Evidence from a Panel Data Analysis of Smallholder Dairy Farmers in Bihar, India." International Food
Policy Research Institute 75: 24–36.
Mankiw, N. Gregory. 2019. Essentials of Economics. 9th ed. Boston, MA:
Cengage Learning.
Midgley, James. 2014. Social Welfare in Global Context. California: SAGE
Publications, Inc. Mubyarto. 2003. Demokrasi Ekonomi, Demokrasi Industri, Dan Ekonomi Pancasila.
Yogyakarta: PUSTEP-UGM. ———. 2010. Dari Ilmu Berkompetisi Ke Ilmu Berkoperasi. Yogyakarta: PUSTEP-
UGM. Peraturan Menteri Koperasi Dan UKM Republik Indonesia Nomor 4 Tahun 2012
Tentang Pedoman Umum Akuntansi Koperasi.
Philip, Kate. 2003. Cooperative in South Africa: Their Role in Job Creation and
Poverty Reduction.
The Analysis of Cooperative Development on Padang Municipality Economy
Efmon,
Tan,
Kamarni
19
http://www.sarpn.org.za/documents/d0000786/P872Coops_October2003.pdf.
Sekaran, Uma, and Roger Bougie. 2016. Research Method For Business : A Skill
Building Approach. 7th ed. Chichester, WS: John Wiley & Sons Ltd.
Sitio, Arifin, and Halomoan Tamba. 2001. Koperasi: Teori Dan Praktek. Jakarta:
Erlangga.
Sjafrizal. 2016. Perencanaan Pembangunan Daerah Dalam Era Otonomi. 1st ed.
Jakarta: Rajawali Pers. Smith, Stephen C., and Jonathan Rothbaum. 2013. Cooperatives in a Global
Economy: Key Economic Issues, Recent Trends, and Potential for Development.
IZA Policy Paper No. 68.
Swasono, Sri Edi. 2004. Koperasi Mata Kuliah Di Universitas : Dapatkah Koperasi
Menjadi Pilar Orde Ekonomi Indonesia? Yogyakarta: PUSTEP-UGM.
Tjakrawerdaja, S., S. Soedarno., P.S. Lenggono., M. Karim., B. Purwandaya dan L. Agusalim. 2017. Sistem Ekonomi Pancasila. Jakarta: Rajawali Pers.
Undang-Undang Dasar Negara Republik Indonesia Tahun 1945. Undang-Undang Republik Indonesia Nomor 25 Tahun 1992 Tentang Perkoperasian.
Lembaran Negara Republik Indonesia. Sekretariat Negara. Verhofstadt, Ellen, and Miet Maertens. 2015. "Can Agricultural Cooperatives
Reduce Poverty? Heterogeneous Impact of Cooperative Membership on Farmers' Welfare in Rwanda." Applied Economic Perspectives and Policy
37(1): 86–106. Vinzi, V. Esposito, Wynne W. Chin, Jorg Henseler, and Huiwen & Wang.
2010. Handbook of Partial Least Squares: Concepts, Methods, and Applications.
eds. V. Esposito Vinzi, Wynne W. Chin, Jorg Henseler, and Huiwen & Wang. New York: Springer.
Wanglin, Ma, and Abdulai Awudu. 2016. "Does Cooperative Membership Improve Household Welfare? Evidence from Apple Farmers in China."
International Food Policy Research Institute 58(C): 94–102.
World Bank. 2015. The World Bank Annual Report 2015. Washington, D.C.