vol 114 – red meat and processed meat section 2.9 table 2...
TRANSCRIPT
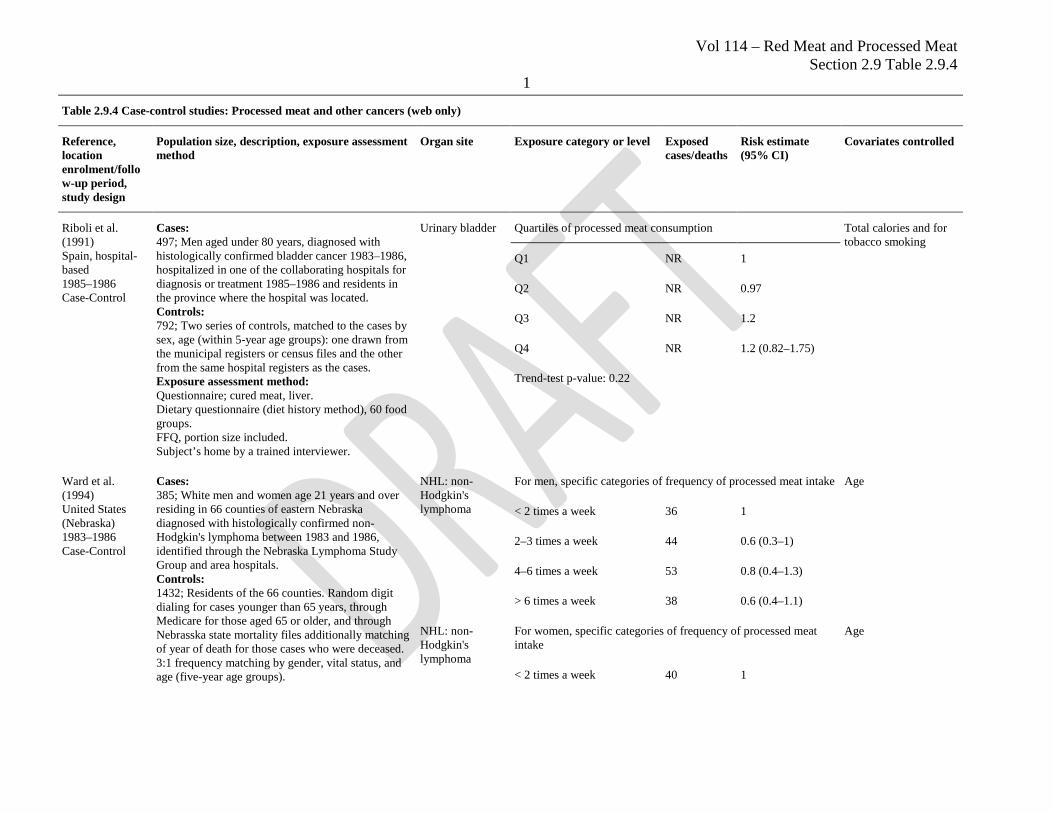
Vol 114 – Red Meat and Processed Meat Section 2.9 Table 2.9.4
1
Table 2.9.4 Case-control studies: Processed meat and other cancers (web only)
Reference, location enrolment/follow-up period, study design
Population size, description, exposure assessment method
Organ site Exposure category or level Exposed cases/deaths
Risk estimate (95% CI)
Covariates controlled
Riboli et al. (1991) Spain, hospital-based 1985–1986 Case-Control
Cases: 497; Men aged under 80 years, diagnosed with histologically confirmed bladder cancer 1983–1986, hospitalized in one of the collaborating hospitals for diagnosis or treatment 1985–1986 and residents in the province where the hospital was located. Controls: 792; Two series of controls, matched to the cases by sex, age (within 5-year age groups): one drawn from the municipal registers or census files and the other from the same hospital registers as the cases. Exposure assessment method: Questionnaire; cured meat, liver. Dietary questionnaire (diet history method), 60 food groups. FFQ, portion size included. Subject’s home by a trained interviewer.
Urinary bladder Quartiles of processed meat consumption Total calories and for tobacco smoking
Q1 NR 1
Q2 NR 0.97
Q3 NR 1.2
Q4 NR 1.2 (0.82–1.75)
Trend-test p-value: 0.22
Ward et al. (1994) United States (Nebraska) 1983–1986 Case-Control
Cases: 385; White men and women age 21 years and over residing in 66 counties of eastern Nebraska diagnosed with histologically confirmed non-Hodgkin's lymphoma between 1983 and 1986, identified through the Nebraska Lymphoma Study Group and area hospitals. Controls: 1432; Residents of the 66 counties. Random digit dialing for cases younger than 65 years, through Medicare for those aged 65 or older, and through Nebrasska state mortality files additionally matching of year of death for those cases who were deceased. 3:1 frequency matching by gender, vital status, and age (five-year age groups).
NHL: non-Hodgkin's lymphoma
For men, specific categories of frequency of processed meat intake Age
< 2 times a week 36 1
2–3 times a week 44 0.6 (0.3–1)
4–6 times a week 53 0.8 (0.4–1.3)
> 6 times a week 38 0.6 (0.4–1.1)
NHL: non-Hodgkin's lymphoma
For women, specific categories of frequency of processed meat intake
Age
< 2 times a week 40 1
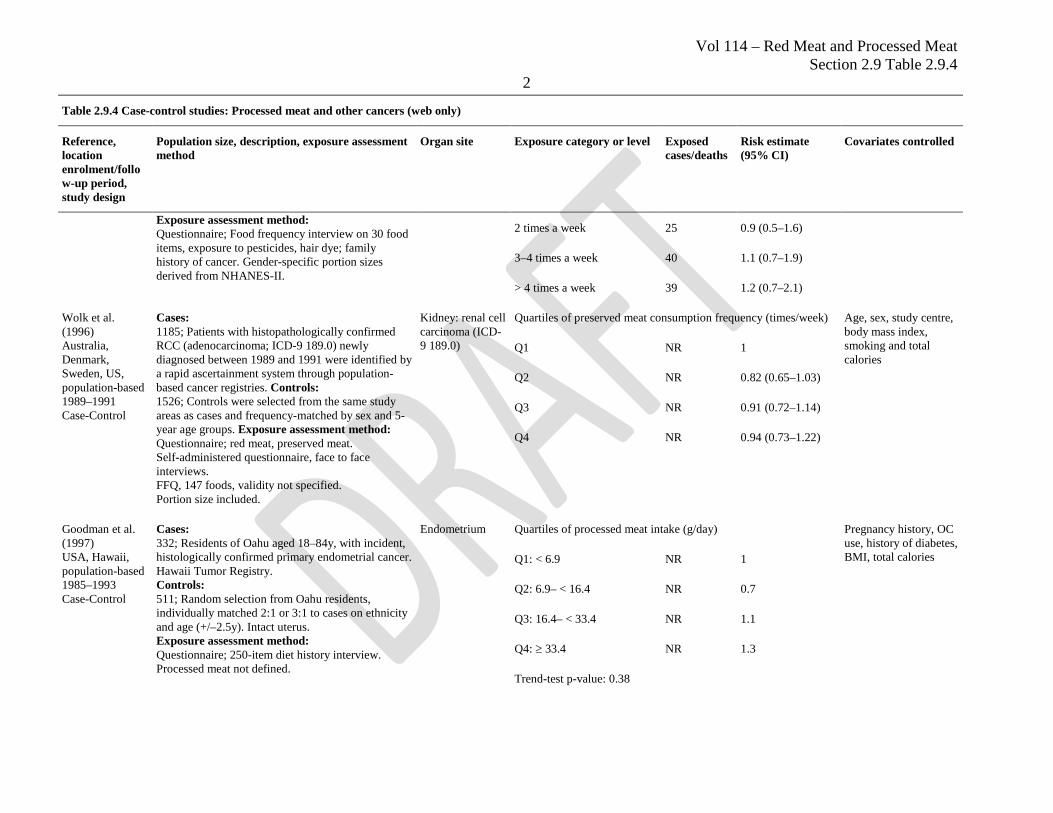
Vol 114 – Red Meat and Processed Meat Section 2.9 Table 2.9.4
2
Table 2.9.4 Case-control studies: Processed meat and other cancers (web only)
Reference, location enrolment/follow-up period, study design
Population size, description, exposure assessment method
Organ site Exposure category or level Exposed cases/deaths
Risk estimate (95% CI)
Covariates controlled
Exposure assessment method: Questionnaire; Food frequency interview on 30 food items, exposure to pesticides, hair dye; family history of cancer. Gender-specific portion sizes derived from NHANES-II.
2 times a week 25 0.9 (0.5–1.6)
3–4 times a week 40 1.1 (0.7–1.9)
> 4 times a week 39 1.2 (0.7–2.1)
Wolk et al. (1996) Australia, Denmark, Sweden, US, population-based 1989–1991 Case-Control
Cases: 1185; Patients with histopathologically confirmed RCC (adenocarcinoma; ICD-9 189.0) newly diagnosed between 1989 and 1991 were identified by a rapid ascertainment system through population-based cancer registries. Controls: 1526; Controls were selected from the same study areas as cases and frequency-matched by sex and 5-year age groups. Exposure assessment method: Questionnaire; red meat, preserved meat. Self-administered questionnaire, face to face interviews. FFQ, 147 foods, validity not specified. Portion size included.
Kidney: renal cell carcinoma (ICD-9 189.0)
Quartiles of preserved meat consumption frequency (times/week) Age, sex, study centre, body mass index, smoking and total calories
Q1 NR 1
Q2 NR 0.82 (0.65–1.03)
Q3 NR 0.91 (0.72–1.14)
Q4 NR 0.94 (0.73–1.22)
Goodman et al. (1997) USA, Hawaii, population-based 1985–1993 Case-Control
Cases: 332; Residents of Oahu aged 18–84y, with incident, histologically confirmed primary endometrial cancer. Hawaii Tumor Registry. Controls: 511; Random selection from Oahu residents, individually matched 2:1 or 3:1 to cases on ethnicity and age (+/–2.5y). Intact uterus. Exposure assessment method: Questionnaire; 250-item diet history interview. Processed meat not defined.
Endometrium Quartiles of processed meat intake (g/day) Pregnancy history, OC use, history of diabetes, BMI, total calories Q1: < 6.9 NR 1
Q2: 6.9– < 16.4 NR 0.7
Q3: 16.4– < 33.4 NR 1.1
Q4: ≥ 33.4 NR 1.3
Trend-test p-value: 0.38
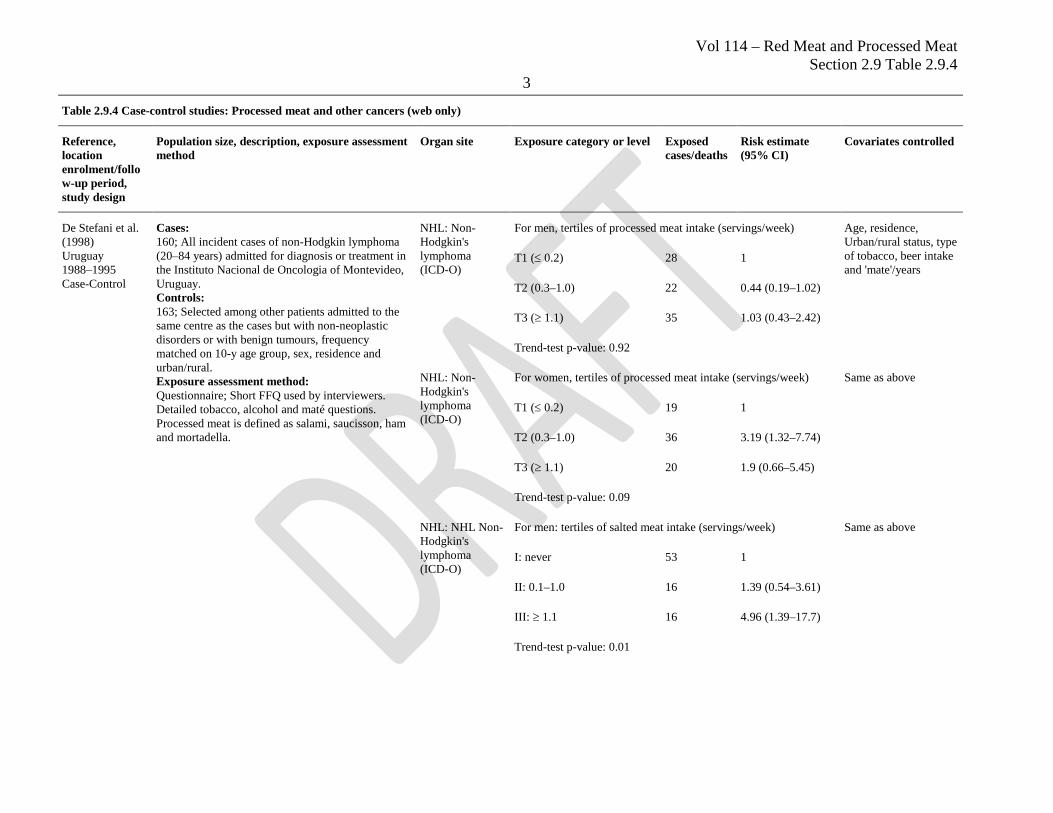
Vol 114 – Red Meat and Processed Meat Section 2.9 Table 2.9.4
3
Table 2.9.4 Case-control studies: Processed meat and other cancers (web only)
Reference, location enrolment/follow-up period, study design
Population size, description, exposure assessment method
Organ site Exposure category or level Exposed cases/deaths
Risk estimate (95% CI)
Covariates controlled
De Stefani et al. (1998) Uruguay 1988–1995 Case-Control
Cases: 160; All incident cases of non-Hodgkin lymphoma (20–84 years) admitted for diagnosis or treatment in the Instituto Nacional de Oncologia of Montevideo, Uruguay. Controls: 163; Selected among other patients admitted to the same centre as the cases but with non-neoplastic disorders or with benign tumours, frequency matched on 10-y age group, sex, residence and urban/rural. Exposure assessment method: Questionnaire; Short FFQ used by interviewers. Detailed tobacco, alcohol and maté questions. Processed meat is defined as salami, saucisson, ham and mortadella.
NHL: Non-Hodgkin's lymphoma (ICD-O)
For men, tertiles of processed meat intake (servings/week) Age, residence, Urban/rural status, type of tobacco, beer intake and 'mate'/years
T1 (≤ 0.2) 28 1
T2 (0.3–1.0) 22 0.44 (0.19–1.02)
T3 (≥ 1.1) 35 1.03 (0.43–2.42)
Trend-test p-value: 0.92
NHL: Non-Hodgkin's lymphoma (ICD-O)
For women, tertiles of processed meat intake (servings/week) Same as above
T1 (≤ 0.2) 19 1
T2 (0.3–1.0) 36 3.19 (1.32–7.74)
T3 (≥ 1.1) 20 1.9 (0.66–5.45)
Trend-test p-value: 0.09
NHL: NHL Non-Hodgkin's lymphoma (ICD-O)
For men: tertiles of salted meat intake (servings/week) Same as above
I: never 53 1
II: 0.1–1.0 16 1.39 (0.54–3.61)
III: ≥ 1.1 16 4.96 (1.39–17.7)
Trend-test p-value: 0.01
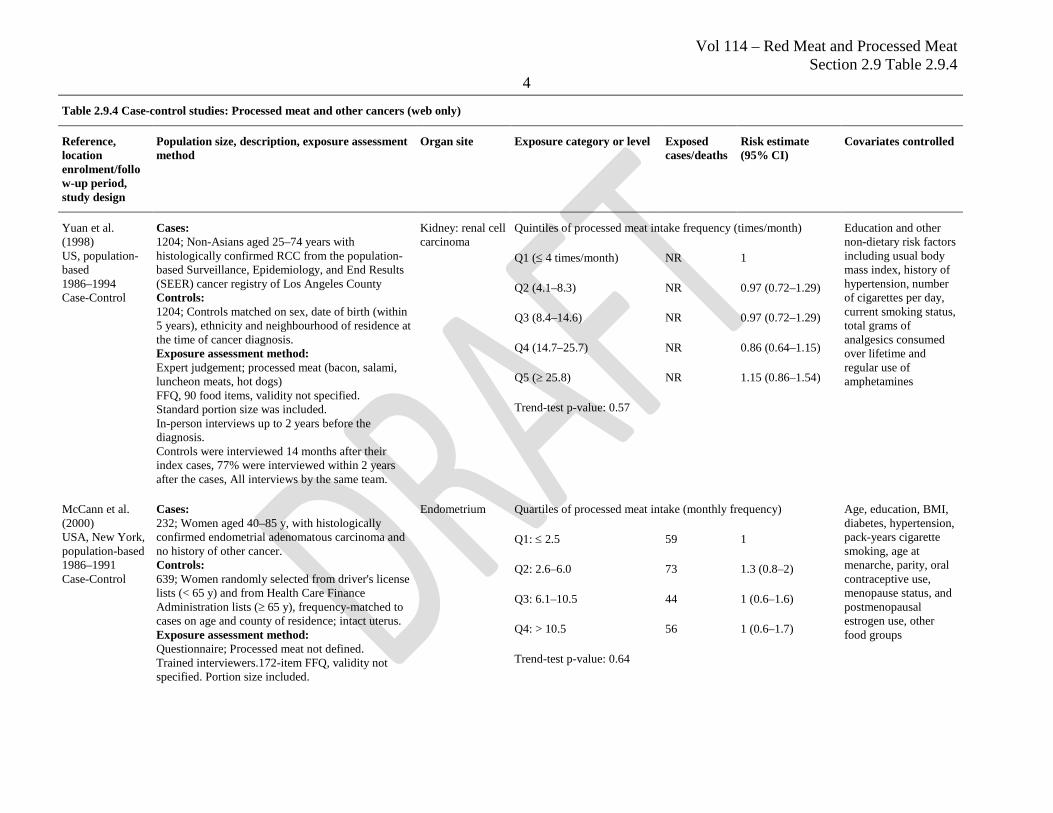
Vol 114 – Red Meat and Processed Meat Section 2.9 Table 2.9.4
4
Table 2.9.4 Case-control studies: Processed meat and other cancers (web only)
Reference, location enrolment/follow-up period, study design
Population size, description, exposure assessment method
Organ site Exposure category or level Exposed cases/deaths
Risk estimate (95% CI)
Covariates controlled
Yuan et al. (1998) US, population-based 1986–1994 Case-Control
Cases: 1204; Non-Asians aged 25–74 years with histologically confirmed RCC from the population-based Surveillance, Epidemiology, and End Results (SEER) cancer registry of Los Angeles County Controls: 1204; Controls matched on sex, date of birth (within 5 years), ethnicity and neighbourhood of residence at the time of cancer diagnosis. Exposure assessment method: Expert judgement; processed meat (bacon, salami, luncheon meats, hot dogs) FFQ, 90 food items, validity not specified. Standard portion size was included. In-person interviews up to 2 years before the diagnosis. Controls were interviewed 14 months after their index cases, 77% were interviewed within 2 years after the cases, All interviews by the same team.
Kidney: renal cell carcinoma
Quintiles of processed meat intake frequency (times/month) Education and other non-dietary risk factors including usual body mass index, history of hypertension, number of cigarettes per day, current smoking status, total grams of analgesics consumed over lifetime and regular use of amphetamines
Q1 (≤ 4 times/month) NR 1
Q2 (4.1–8.3) NR 0.97 (0.72–1.29)
Q3 (8.4–14.6) NR 0.97 (0.72–1.29)
Q4 (14.7–25.7) NR 0.86 (0.64–1.15)
Q5 (≥ 25.8) NR 1.15 (0.86–1.54)
Trend-test p-value: 0.57
McCann et al. (2000) USA, New York, population-based 1986–1991 Case-Control
Cases: 232; Women aged 40–85 y, with histologically confirmed endometrial adenomatous carcinoma and no history of other cancer. Controls: 639; Women randomly selected from driver's license lists (< 65 y) and from Health Care Finance Administration lists (≥ 65 y), frequency-matched to cases on age and county of residence; intact uterus. Exposure assessment method: Questionnaire; Processed meat not defined. Trained interviewers.172-item FFQ, validity not specified. Portion size included.
Endometrium Quartiles of processed meat intake (monthly frequency) Age, education, BMI, diabetes, hypertension, pack-years cigarette smoking, age at menarche, parity, oral contraceptive use, menopause status, and postmenopausal estrogen use, other food groups
Q1: ≤ 2.5 59 1
Q2: 2.6–6.0 73 1.3 (0.8–2)
Q3: 6.1–10.5 44 1 (0.6–1.6)
Q4: > 10.5 56 1 (0.6–1.7)
Trend-test p-value: 0.64
Vol 114 – Red Meat and Processed Meat Section 2.9 Table 2.9.4
5
Table 2.9.4 Case-control studies: Processed meat and other cancers (web only)
Reference, location enrolment/follow-up period, study design
Population size, description, exposure assessment method
Organ site Exposure category or level Exposed cases/deaths
Risk estimate (95% CI)
Covariates controlled
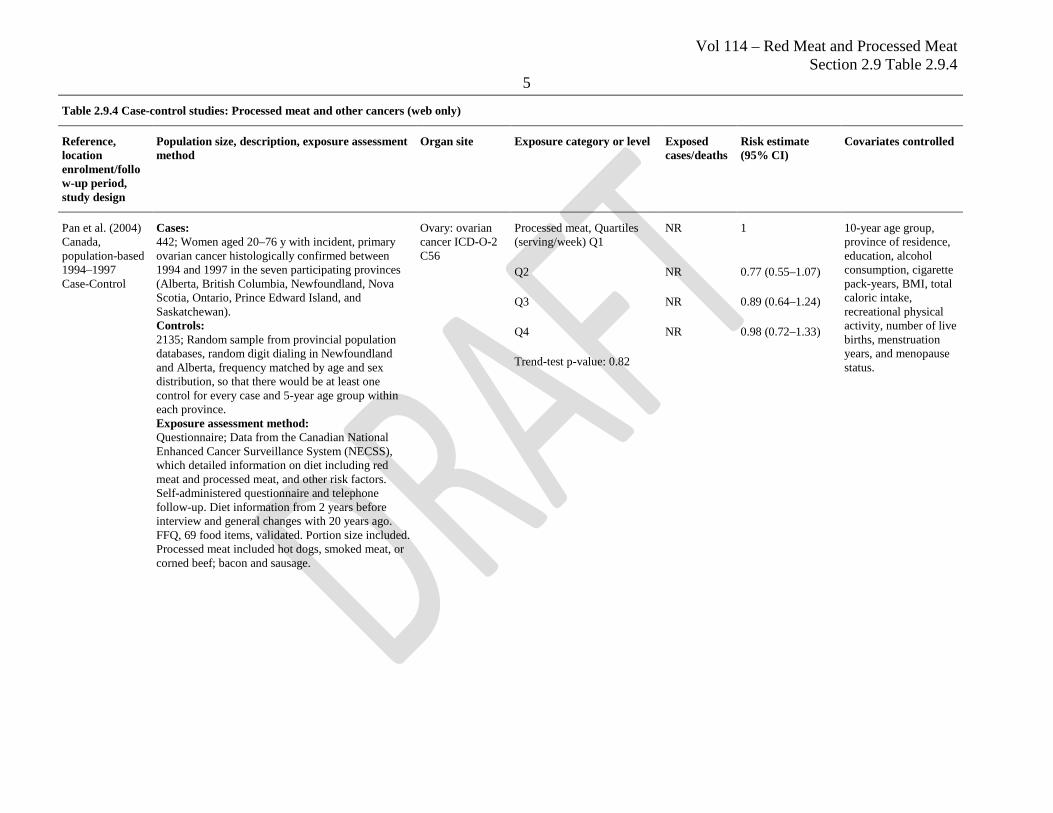
Pan et al. (2004) Canada, population-based 1994–1997 Case-Control
Cases: 442; Women aged 20–76 y with incident, primary ovarian cancer histologically confirmed between 1994 and 1997 in the seven participating provinces (Alberta, British Columbia, Newfoundland, Nova Scotia, Ontario, Prince Edward Island, and Saskatchewan). Controls: 2135; Random sample from provincial population databases, random digit dialing in Newfoundland and Alberta, frequency matched by age and sex distribution, so that there would be at least one control for every case and 5-year age group within each province. Exposure assessment method: Questionnaire; Data from the Canadian National Enhanced Cancer Surveillance System (NECSS), which detailed information on diet including red meat and processed meat, and other risk factors. Self-administered questionnaire and telephone follow-up. Diet information from 2 years before interview and general changes with 20 years ago. FFQ, 69 food items, validated. Portion size included. Processed meat included hot dogs, smoked meat, or corned beef; bacon and sausage.
Ovary: ovarian cancer ICD-O-2 C56
Processed meat, Quartiles (serving/week) Q1
NR 1 10-year age group, province of residence, education, alcohol consumption, cigarette pack-years, BMI, total caloric intake, recreational physical activity, number of live births, menstruation years, and menopause status.
Q2 NR 0.77 (0.55–1.07)
Q3 NR 0.89 (0.64–1.24)
Q4 NR 0.98 (0.72–1.33)
Trend-test p-value: 0.82
Vol 114 – Red Meat and Processed Meat Section 2.9 Table 2.9.4
6
Table 2.9.4 Case-control studies: Processed meat and other cancers (web only)
Reference, location enrolment/follow-up period, study design
Population size, description, exposure assessment method
Organ site Exposure category or level Exposed cases/deaths
Risk estimate (95% CI)
Covariates controlled
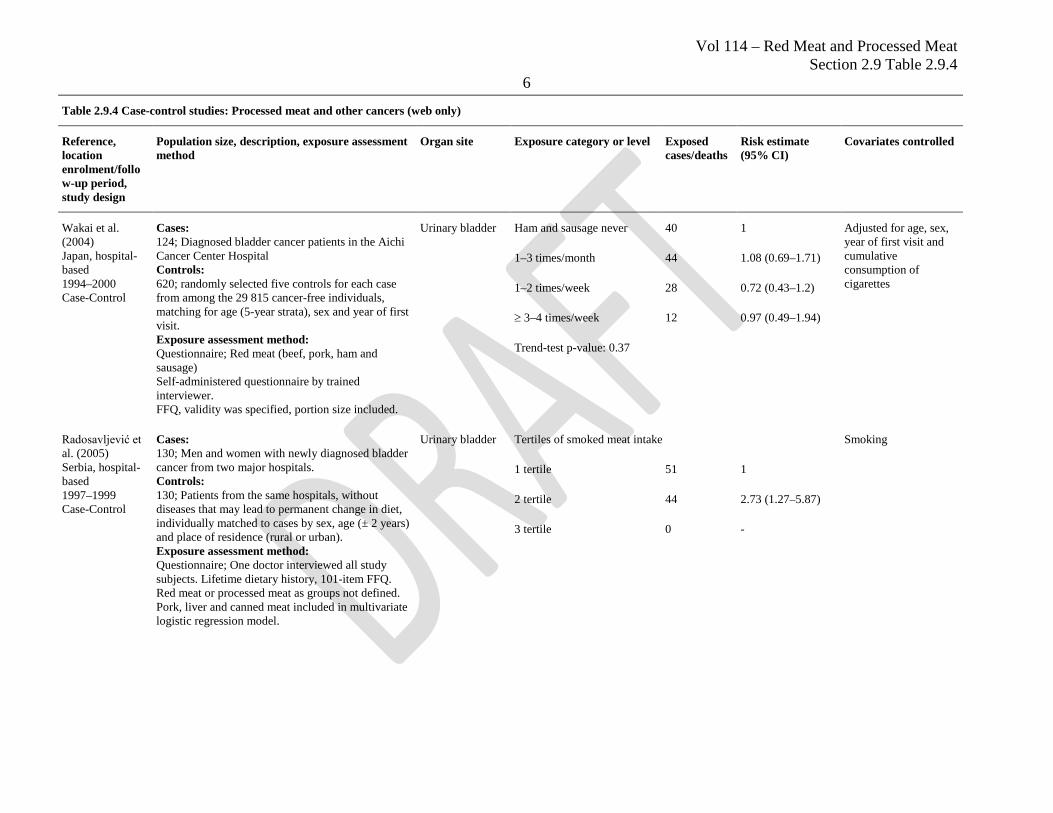
Wakai et al. (2004) Japan, hospital-based 1994–2000 Case-Control
Cases: 124; Diagnosed bladder cancer patients in the Aichi Cancer Center Hospital Controls: 620; randomly selected five controls for each case from among the 29 815 cancer-free individuals, matching for age (5-year strata), sex and year of first visit. Exposure assessment method: Questionnaire; Red meat (beef, pork, ham and sausage) Self-administered questionnaire by trained interviewer. FFQ, validity was specified, portion size included.
Urinary bladder Ham and sausage never 40 1 Adjusted for age, sex, year of first visit and cumulative consumption of cigarettes
1–3 times/month 44 1.08 (0.69–1.71)
1–2 times/week 28 0.72 (0.43–1.2)
≥ 3–4 times/week 12 0.97 (0.49–1.94)
Trend-test p-value: 0.37
Radosavljević et al. (2005) Serbia, hospital-based 1997–1999 Case-Control
Cases: 130; Men and women with newly diagnosed bladder cancer from two major hospitals. Controls: 130; Patients from the same hospitals, without diseases that may lead to permanent change in diet, individually matched to cases by sex, age (± 2 years) and place of residence (rural or urban). Exposure assessment method: Questionnaire; One doctor interviewed all study subjects. Lifetime dietary history, 101-item FFQ. Red meat or processed meat as groups not defined. Pork, liver and canned meat included in multivariate logistic regression model.
Urinary bladder Tertiles of smoked meat intake Smoking
1 tertile 51 1
2 tertile 44 2.73 (1.27–5.87)
3 tertile 0 -
Vol 114 – Red Meat and Processed Meat Section 2.9 Table 2.9.4
7
Table 2.9.4 Case-control studies: Processed meat and other cancers (web only)
Reference, location enrolment/follow-up period, study design
Population size, description, exposure assessment method
Organ site Exposure category or level Exposed cases/deaths
Risk estimate (95% CI)
Covariates controlled
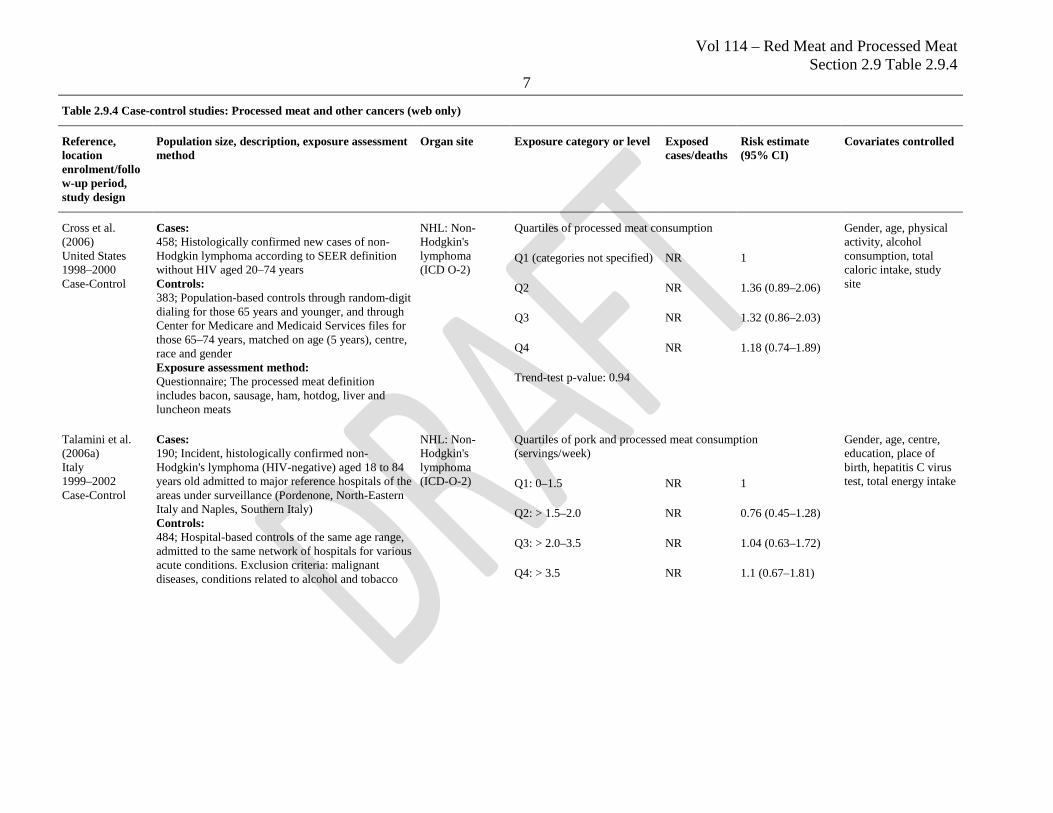
Cross et al. (2006) United States 1998–2000 Case-Control
Cases: 458; Histologically confirmed new cases of non-Hodgkin lymphoma according to SEER definition without HIV aged 20–74 years Controls: 383; Population-based controls through random-digit dialing for those 65 years and younger, and through Center for Medicare and Medicaid Services files for those 65–74 years, matched on age (5 years), centre, race and gender Exposure assessment method: Questionnaire; The processed meat definition includes bacon, sausage, ham, hotdog, liver and luncheon meats
NHL: Non-Hodgkin's lymphoma (ICD O-2)
Quartiles of processed meat consumption Gender, age, physical activity, alcohol consumption, total caloric intake, study site
Q1 (categories not specified) NR 1
Q2 NR 1.36 (0.89–2.06)
Q3 NR 1.32 (0.86–2.03)
Q4 NR 1.18 (0.74–1.89)
Trend-test p-value: 0.94
Talamini et al. (2006a) Italy 1999–2002 Case-Control
Cases: 190; Incident, histologically confirmed non-Hodgkin's lymphoma (HIV-negative) aged 18 to 84 years old admitted to major reference hospitals of the areas under surveillance (Pordenone, North-Eastern Italy and Naples, Southern Italy) Controls: 484; Hospital-based controls of the same age range, admitted to the same network of hospitals for various acute conditions. Exclusion criteria: malignant diseases, conditions related to alcohol and tobacco
NHL: Non-Hodgkin's lymphoma (ICD-O-2)
Quartiles of pork and processed meat consumption (servings/week)
Gender, age, centre, education, place of birth, hepatitis C virus test, total energy intake Q1: 0–1.5 NR 1
Q2: > 1.5–2.0 NR 0.76 (0.45–1.28)
Q3: > 2.0–3.5 NR 1.04 (0.63–1.72)
Q4: > 3.5 NR 1.1 (0.67–1.81)
Vol 114 – Red Meat and Processed Meat Section 2.9 Table 2.9.4
8
Table 2.9.4 Case-control studies: Processed meat and other cancers (web only)
Reference, location enrolment/follow-up period, study design
Population size, description, exposure assessment method
Organ site Exposure category or level Exposed cases/deaths
Risk estimate (95% CI)
Covariates controlled
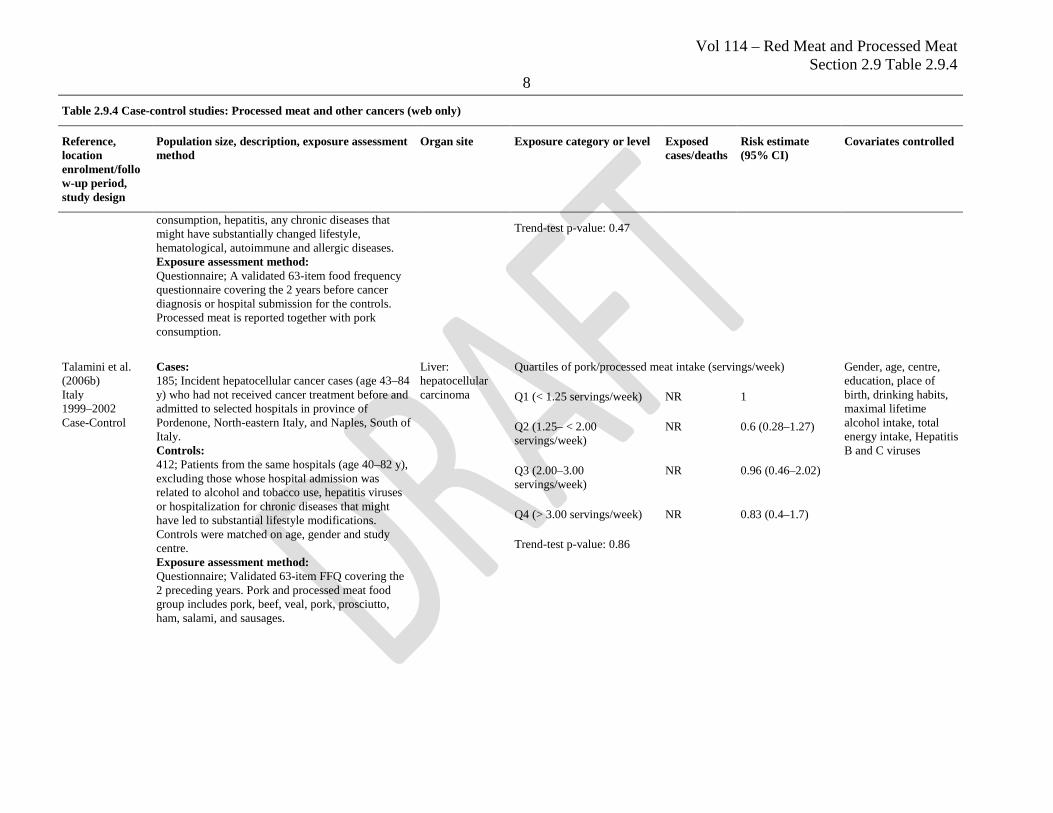
consumption, hepatitis, any chronic diseases that might have substantially changed lifestyle, hematological, autoimmune and allergic diseases. Exposure assessment method: Questionnaire; A validated 63-item food frequency questionnaire covering the 2 years before cancer diagnosis or hospital submission for the controls. Processed meat is reported together with pork consumption.
Trend-test p-value: 0.47
Talamini et al. (2006b) Italy 1999–2002 Case-Control
Cases: 185; Incident hepatocellular cancer cases (age 43–84 y) who had not received cancer treatment before and admitted to selected hospitals in province of Pordenone, North-eastern Italy, and Naples, South of Italy. Controls: 412; Patients from the same hospitals (age 40–82 y), excluding those whose hospital admission was related to alcohol and tobacco use, hepatitis viruses or hospitalization for chronic diseases that might have led to substantial lifestyle modifications. Controls were matched on age, gender and study centre. Exposure assessment method: Questionnaire; Validated 63-item FFQ covering the 2 preceding years. Pork and processed meat food group includes pork, beef, veal, pork, prosciutto, ham, salami, and sausages.
Liver: hepatocellular carcinoma
Quartiles of pork/processed meat intake (servings/week) Gender, age, centre, education, place of birth, drinking habits, maximal lifetime alcohol intake, total energy intake, Hepatitis B and C viruses
Q1 (< 1.25 servings/week) NR 1
Q2 (1.25– < 2.00 servings/week)
NR 0.6 (0.28–1.27)
Q3 (2.00–3.00 servings/week)
NR 0.96 (0.46–2.02)
Q4 (> 3.00 servings/week) NR 0.83 (0.4–1.7)
Trend-test p-value: 0.86
Vol 114 – Red Meat and Processed Meat Section 2.9 Table 2.9.4
9
Table 2.9.4 Case-control studies: Processed meat and other cancers (web only)
Reference, location enrolment/follow-up period, study design
Population size, description, exposure assessment method
Organ site Exposure category or level Exposed cases/deaths
Risk estimate (95% CI)
Covariates controlled
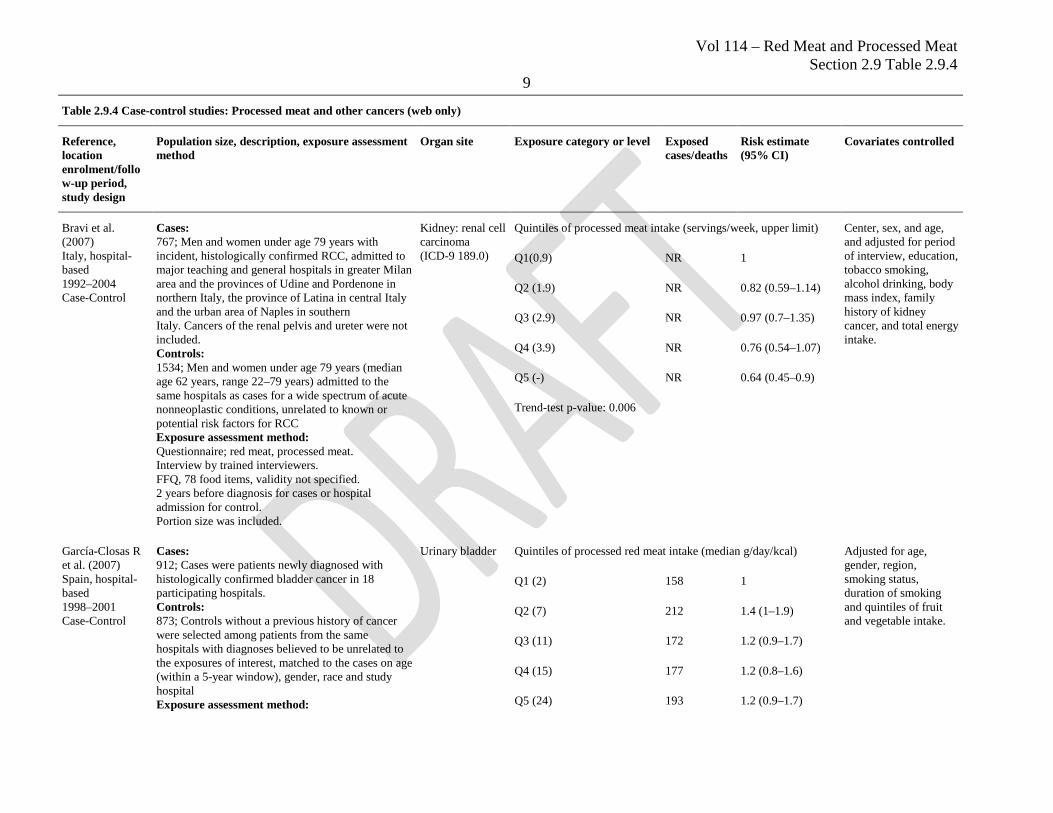
Bravi et al. (2007) Italy, hospital-based 1992–2004 Case-Control
Cases: 767; Men and women under age 79 years with incident, histologically confirmed RCC, admitted to major teaching and general hospitals in greater Milan area and the provinces of Udine and Pordenone in northern Italy, the province of Latina in central Italy and the urban area of Naples in southern Italy. Cancers of the renal pelvis and ureter were not included. Controls: 1534; Men and women under age 79 years (median age 62 years, range 22–79 years) admitted to the same hospitals as cases for a wide spectrum of acute nonneoplastic conditions, unrelated to known or potential risk factors for RCC Exposure assessment method: Questionnaire; red meat, processed meat. Interview by trained interviewers. FFQ, 78 food items, validity not specified. 2 years before diagnosis for cases or hospital admission for control. Portion size was included.
Kidney: renal cell carcinoma (ICD-9 189.0)
Quintiles of processed meat intake (servings/week, upper limit) Center, sex, and age, and adjusted for period of interview, education, tobacco smoking, alcohol drinking, body mass index, family history of kidney cancer, and total energy intake.
Q1(0.9) NR 1
Q2 (1.9) NR 0.82 (0.59–1.14)
Q3 (2.9) NR 0.97 (0.7–1.35)
Q4 (3.9) NR 0.76 (0.54–1.07)
Q5 (-) NR 0.64 (0.45–0.9)
Trend-test p-value: 0.006
García-Closas R et al. (2007) Spain, hospital-based 1998–2001 Case-Control
Cases: 912; Cases were patients newly diagnosed with histologically confirmed bladder cancer in 18 participating hospitals. Controls: 873; Controls without a previous history of cancer were selected among patients from the same hospitals with diagnoses believed to be unrelated to the exposures of interest, matched to the cases on age (within a 5-year window), gender, race and study hospital Exposure assessment method:
Urinary bladder Quintiles of processed red meat intake (median g/day/kcal) Adjusted for age, gender, region, smoking status, duration of smoking and quintiles of fruit and vegetable intake.
Q1 (2) 158 1
Q2 (7) 212 1.4 (1–1.9)
Q3 (11) 172 1.2 (0.9–1.7)
Q4 (15) 177 1.2 (0.8–1.6)
Q5 (24) 193 1.2 (0.9–1.7)
Vol 114 – Red Meat and Processed Meat Section 2.9 Table 2.9.4
10
Table 2.9.4 Case-control studies: Processed meat and other cancers (web only)
Reference, location enrolment/follow-up period, study design
Population size, description, exposure assessment method
Organ site Exposure category or level Exposed cases/deaths
Risk estimate (95% CI)
Covariates controlled
Questionnaire; FFQ, 127 food items, validated, portion size specified 49% of the FFQ were administered with the help of the relative, 34%were self-administered and 17%were administered by the interviewer. 39%of FFQ were completed while in the hospital and 61% were completed at home few days after discharge. Interview, Diet 5 years before diagnosis for cases and before interview for controls.
Trend-test p-value: 0.66
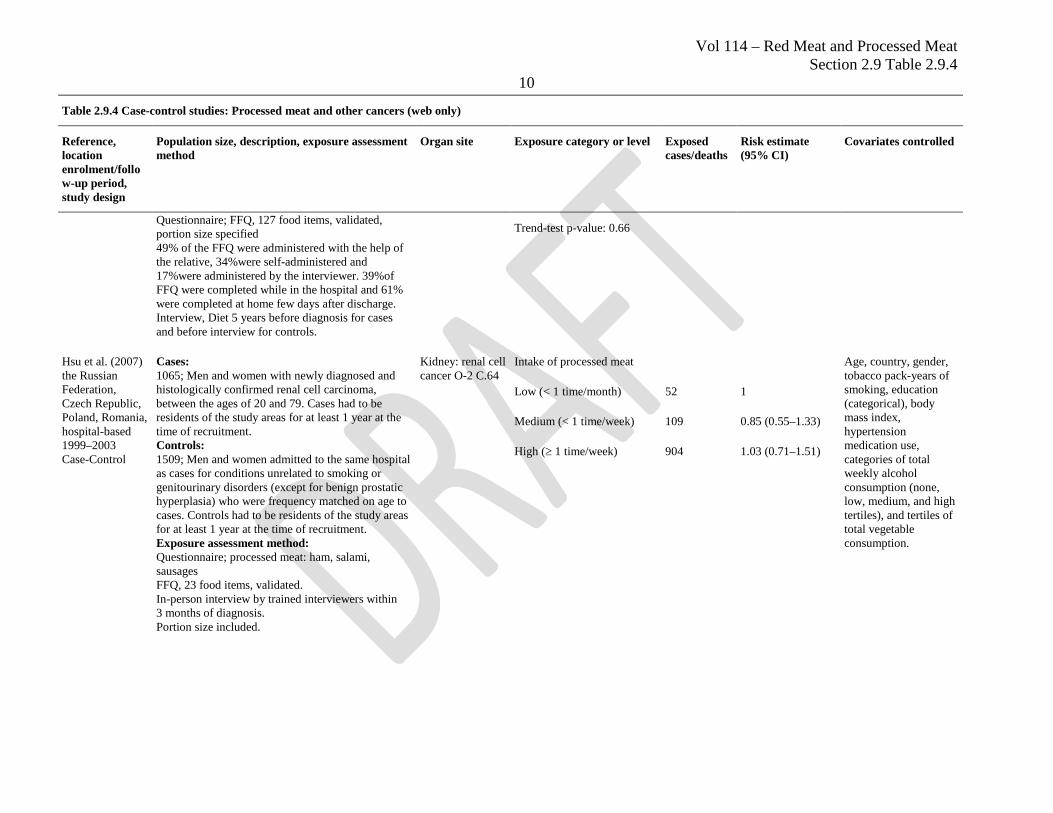
Hsu et al. (2007) the Russian Federation, Czech Republic, Poland, Romania, hospital-based 1999–2003 Case-Control
Cases: 1065; Men and women with newly diagnosed and histologically confirmed renal cell carcinoma, between the ages of 20 and 79. Cases had to be residents of the study areas for at least 1 year at the time of recruitment. Controls: 1509; Men and women admitted to the same hospital as cases for conditions unrelated to smoking or genitourinary disorders (except for benign prostatic hyperplasia) who were frequency matched on age to cases. Controls had to be residents of the study areas for at least 1 year at the time of recruitment. Exposure assessment method: Questionnaire; processed meat: ham, salami, sausages FFQ, 23 food items, validated. In-person interview by trained interviewers within 3 months of diagnosis. Portion size included.
Kidney: renal cell cancer O-2 C.64
Intake of processed meat Age, country, gender, tobacco pack-years of smoking, education (categorical), body mass index, hypertension medication use, categories of total weekly alcohol consumption (none, low, medium, and high tertiles), and tertiles of total vegetable consumption.
Low (< 1 time/month) 52 1
Medium (< 1 time/week) 109 0.85 (0.55–1.33)
High (≥ 1 time/week) 904 1.03 (0.71–1.51)
Vol 114 – Red Meat and Processed Meat Section 2.9 Table 2.9.4
11
Table 2.9.4 Case-control studies: Processed meat and other cancers (web only)
Reference, location enrolment/follow-up period, study design
Population size, description, exposure assessment method
Organ site Exposure category or level Exposed cases/deaths
Risk estimate (95% CI)
Covariates controlled
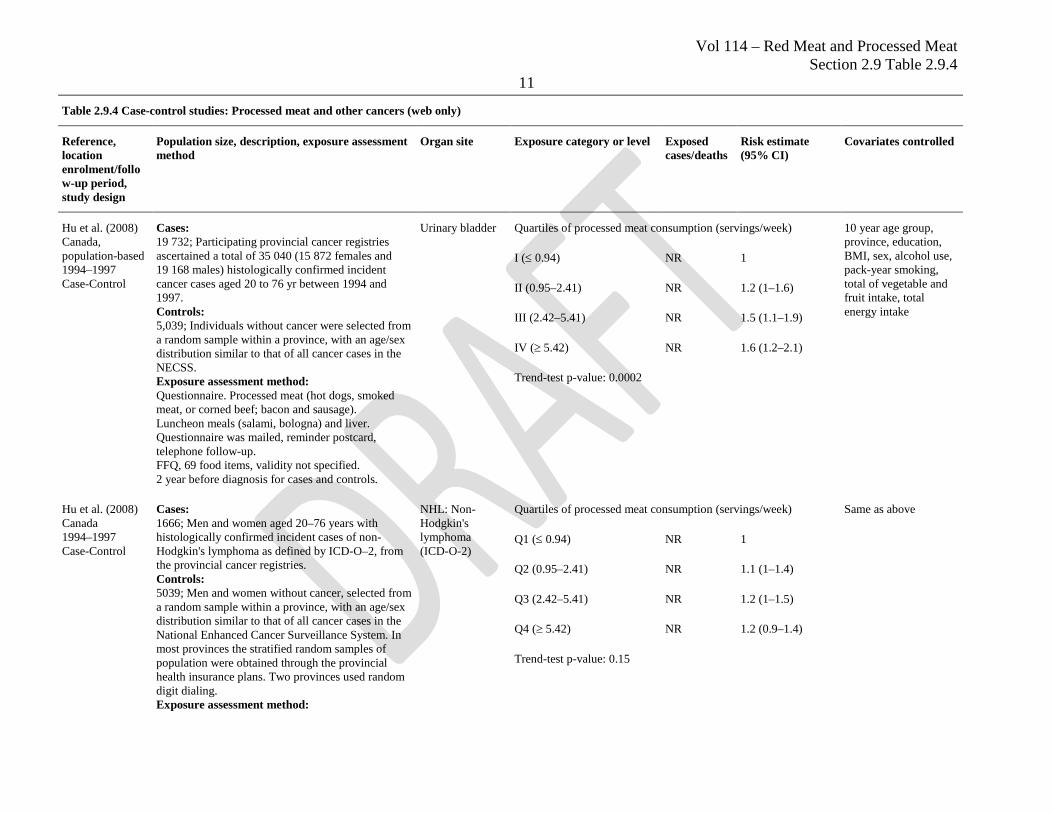
Hu et al. (2008) Canada, population-based 1994–1997 Case-Control
Cases: 19 732; Participating provincial cancer registries ascertained a total of 35 040 (15 872 females and 19 168 males) histologically confirmed incident cancer cases aged 20 to 76 yr between 1994 and 1997. Controls: 5,039; Individuals without cancer were selected from a random sample within a province, with an age/sex distribution similar to that of all cancer cases in the NECSS. Exposure assessment method: Questionnaire. Processed meat (hot dogs, smoked meat, or corned beef; bacon and sausage). Luncheon meals (salami, bologna) and liver. Questionnaire was mailed, reminder postcard, telephone follow-up. FFQ, 69 food items, validity not specified. 2 year before diagnosis for cases and controls.
Urinary bladder Quartiles of processed meat consumption (servings/week) 10 year age group, province, education, BMI, sex, alcohol use, pack-year smoking, total of vegetable and fruit intake, total energy intake
I (≤ 0.94) NR 1
II (0.95–2.41) NR 1.2 (1–1.6)
III (2.42–5.41) NR 1.5 (1.1–1.9)
IV (≥ 5.42) NR 1.6 (1.2–2.1)
Trend-test p-value: 0.0002
Hu et al. (2008) Canada 1994–1997 Case-Control
Cases: 1666; Men and women aged 20–76 years with histologically confirmed incident cases of non-Hodgkin's lymphoma as defined by ICD-O–2, from the provincial cancer registries. Controls: 5039; Men and women without cancer, selected from a random sample within a province, with an age/sex distribution similar to that of all cancer cases in the National Enhanced Cancer Surveillance System. In most provinces the stratified random samples of population were obtained through the provincial health insurance plans. Two provinces used random digit dialing. Exposure assessment method:
NHL: Non-Hodgkin's lymphoma (ICD-O-2)
Quartiles of processed meat consumption (servings/week) Same as above
Q1 (≤ 0.94) NR 1
Q2 (0.95–2.41) NR 1.1 (1–1.4)
Q3 (2.42–5.41) NR 1.2 (1–1.5)
Q4 (≥ 5.42) NR 1.2 (0.9–1.4)
Trend-test p-value: 0.15
Vol 114 – Red Meat and Processed Meat Section 2.9 Table 2.9.4
12
Table 2.9.4 Case-control studies: Processed meat and other cancers (web only)
Reference, location enrolment/follow-up period, study design
Population size, description, exposure assessment method
Organ site Exposure category or level Exposed cases/deaths
Risk estimate (95% CI)
Covariates controlled
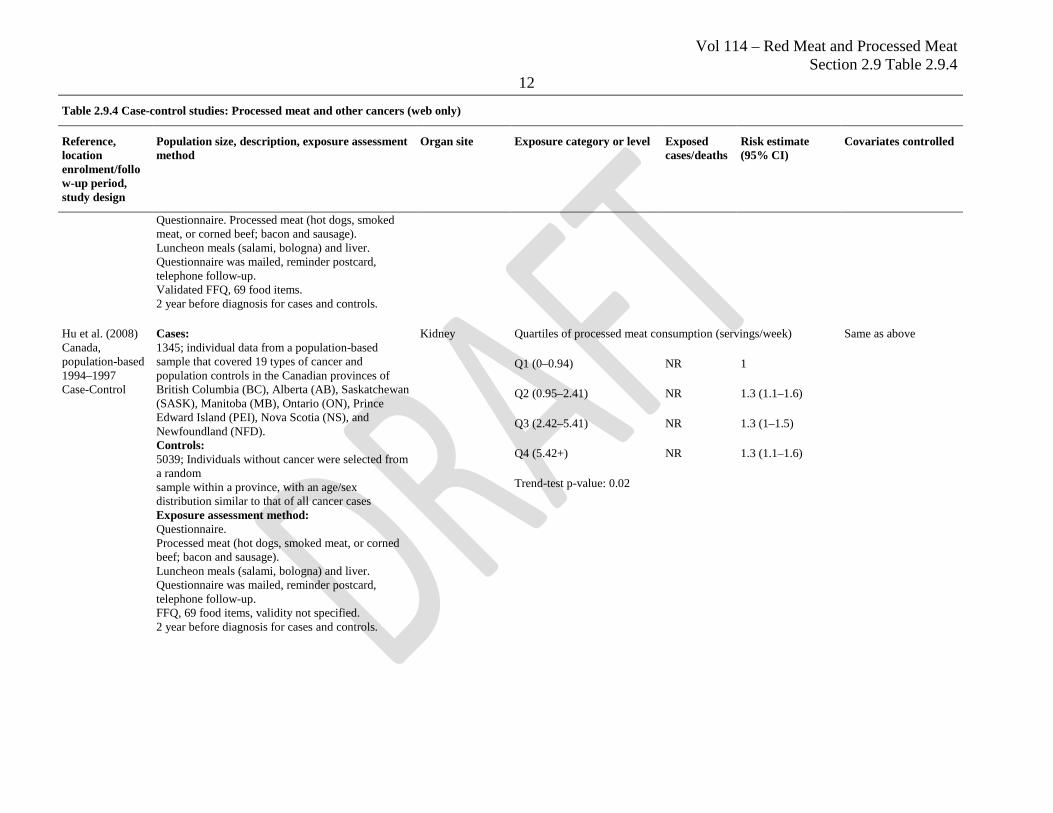
Questionnaire. Processed meat (hot dogs, smoked meat, or corned beef; bacon and sausage). Luncheon meals (salami, bologna) and liver. Questionnaire was mailed, reminder postcard, telephone follow-up. Validated FFQ, 69 food items. 2 year before diagnosis for cases and controls.
Hu et al. (2008) Canada, population-based 1994–1997 Case-Control
Cases: 1345; individual data from a population-based sample that covered 19 types of cancer and population controls in the Canadian provinces of British Columbia (BC), Alberta (AB), Saskatchewan (SASK), Manitoba (MB), Ontario (ON), Prince Edward Island (PEI), Nova Scotia (NS), and Newfoundland (NFD). Controls: 5039; Individuals without cancer were selected from a random sample within a province, with an age/sex distribution similar to that of all cancer cases Exposure assessment method: Questionnaire. Processed meat (hot dogs, smoked meat, or corned beef; bacon and sausage). Luncheon meals (salami, bologna) and liver. Questionnaire was mailed, reminder postcard, telephone follow-up. FFQ, 69 food items, validity not specified. 2 year before diagnosis for cases and controls.
Kidney Quartiles of processed meat consumption (servings/week) Same as above
Q1 (0–0.94) NR 1
Q2 (0.95–2.41) NR 1.3 (1.1–1.6)
Q3 (2.42–5.41) NR 1.3 (1–1.5)
Q4 (5.42+) NR 1.3 (1.1–1.6)
Trend-test p-value: 0.02
Vol 114 – Red Meat and Processed Meat Section 2.9 Table 2.9.4
13
Table 2.9.4 Case-control studies: Processed meat and other cancers (web only)
Reference, location enrolment/follow-up period, study design
Population size, description, exposure assessment method
Organ site Exposure category or level Exposed cases/deaths
Risk estimate (95% CI)
Covariates controlled
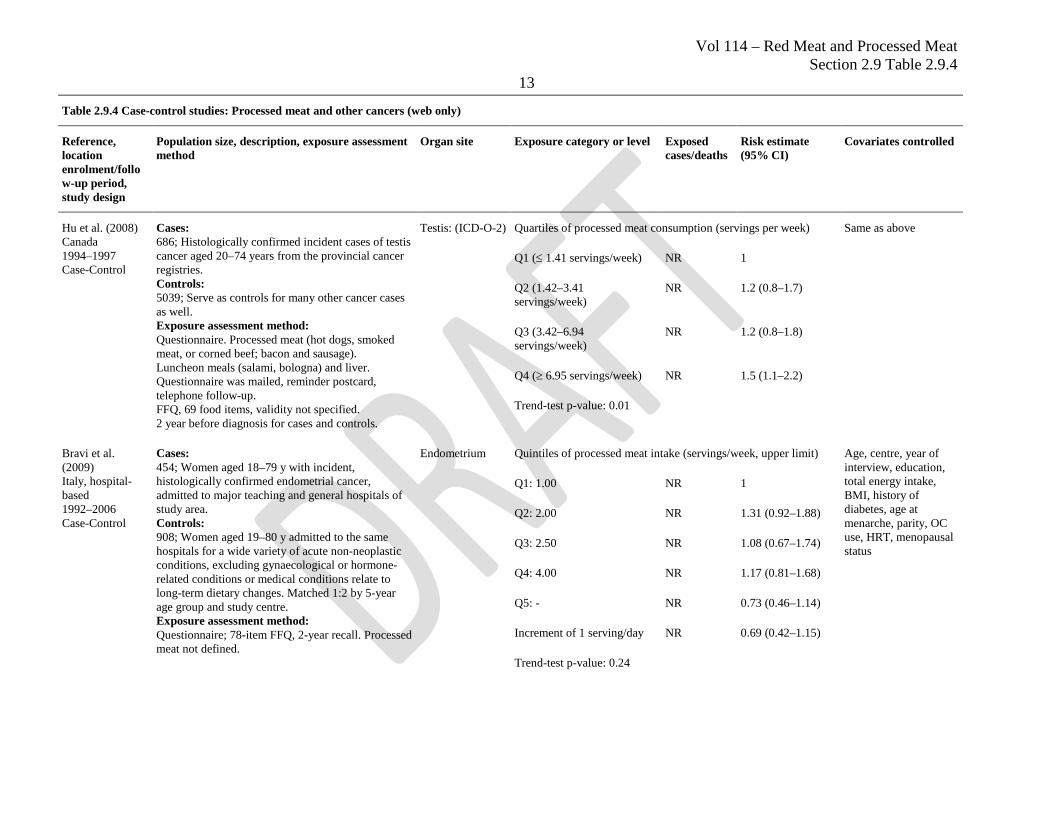
Hu et al. (2008) Canada 1994–1997 Case-Control
Cases: 686; Histologically confirmed incident cases of testis cancer aged 20–74 years from the provincial cancer registries. Controls: 5039; Serve as controls for many other cancer cases as well. Exposure assessment method: Questionnaire. Processed meat (hot dogs, smoked meat, or corned beef; bacon and sausage). Luncheon meals (salami, bologna) and liver. Questionnaire was mailed, reminder postcard, telephone follow-up. FFQ, 69 food items, validity not specified. 2 year before diagnosis for cases and controls.
Testis: (ICD-O-2) Quartiles of processed meat consumption (servings per week) Same as above
Q1 (≤ 1.41 servings/week) NR 1
Q2 (1.42–3.41 servings/week)
NR 1.2 (0.8–1.7)
Q3 (3.42–6.94 servings/week)
NR 1.2 (0.8–1.8)
Q4 (≥ 6.95 servings/week) NR 1.5 (1.1–2.2)
Trend-test p-value: 0.01
Bravi et al. (2009) Italy, hospital-based 1992–2006 Case-Control
Cases: 454; Women aged 18–79 y with incident, histologically confirmed endometrial cancer, admitted to major teaching and general hospitals of study area. Controls: 908; Women aged 19–80 y admitted to the same hospitals for a wide variety of acute non-neoplastic conditions, excluding gynaecological or hormone-related conditions or medical conditions relate to long-term dietary changes. Matched 1:2 by 5-year age group and study centre. Exposure assessment method: Questionnaire; 78-item FFQ, 2-year recall. Processed meat not defined.
Endometrium Quintiles of processed meat intake (servings/week, upper limit) Age, centre, year of interview, education, total energy intake, BMI, history of diabetes, age at menarche, parity, OC use, HRT, menopausal status
Q1: 1.00 NR 1
Q2: 2.00 NR 1.31 (0.92–1.88)
Q3: 2.50 NR 1.08 (0.67–1.74)
Q4: 4.00 NR 1.17 (0.81–1.68)
Q5: - NR 0.73 (0.46–1.14)
Increment of 1 serving/day NR 0.69 (0.42–1.15)
Trend-test p-value: 0.24
Vol 114 – Red Meat and Processed Meat Section 2.9 Table 2.9.4
14
Table 2.9.4 Case-control studies: Processed meat and other cancers (web only)
Reference, location enrolment/follow-up period, study design
Population size, description, exposure assessment method
Organ site Exposure category or level Exposed cases/deaths
Risk estimate (95% CI)
Covariates controlled
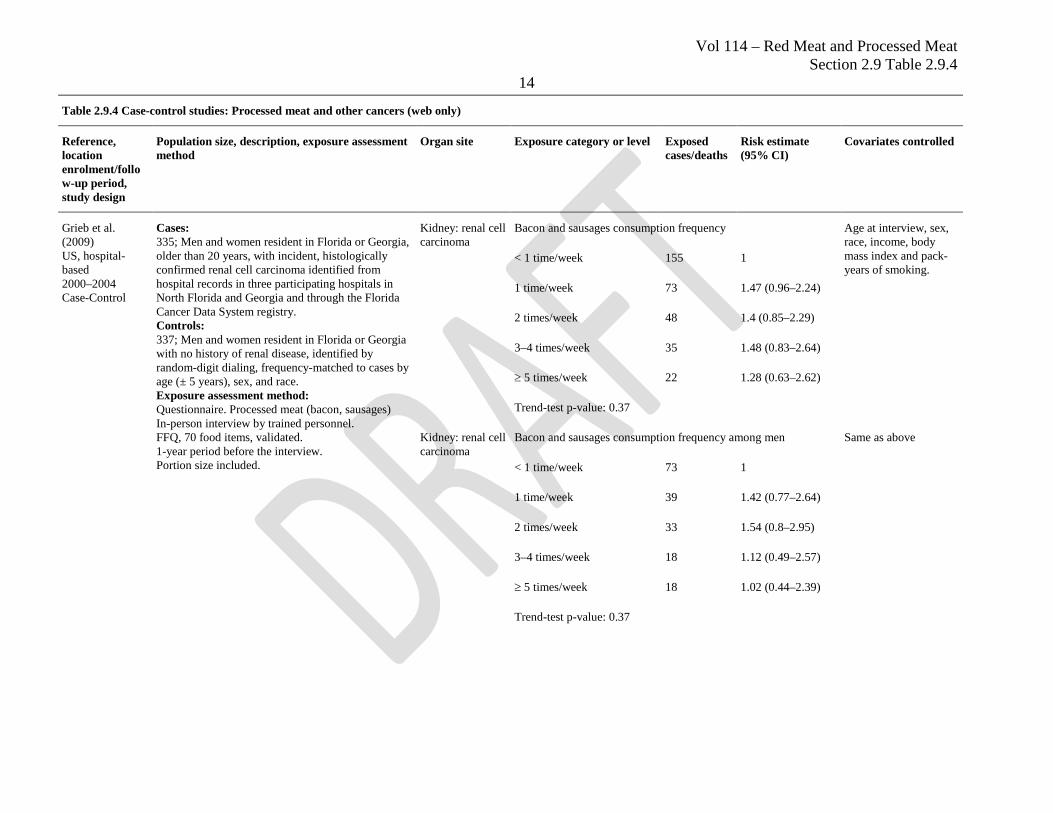
Grieb et al. (2009) US, hospital-based 2000–2004 Case-Control
Cases: 335; Men and women resident in Florida or Georgia, older than 20 years, with incident, histologically confirmed renal cell carcinoma identified from hospital records in three participating hospitals in North Florida and Georgia and through the Florida Cancer Data System registry. Controls: 337; Men and women resident in Florida or Georgia with no history of renal disease, identified by random-digit dialing, frequency-matched to cases by age (± 5 years), sex, and race. Exposure assessment method: Questionnaire. Processed meat (bacon, sausages) In-person interview by trained personnel. FFQ, 70 food items, validated. 1-year period before the interview. Portion size included.
Kidney: renal cell carcinoma
Bacon and sausages consumption frequency Age at interview, sex, race, income, body mass index and pack-years of smoking.
< 1 time/week 155 1
1 time/week 73 1.47 (0.96–2.24)
2 times/week 48 1.4 (0.85–2.29)
3–4 times/week 35 1.48 (0.83–2.64)
≥ 5 times/week 22 1.28 (0.63–2.62)
Trend-test p-value: 0.37
Kidney: renal cell carcinoma
Bacon and sausages consumption frequency among men Same as above
< 1 time/week 73 1
1 time/week 39 1.42 (0.77–2.64)
2 times/week 33 1.54 (0.8–2.95)
3–4 times/week 18 1.12 (0.49–2.57)
≥ 5 times/week 18 1.02 (0.44–2.39)
Trend-test p-value: 0.37
Vol 114 – Red Meat and Processed Meat Section 2.9 Table 2.9.4
15
Table 2.9.4 Case-control studies: Processed meat and other cancers (web only)
Reference, location enrolment/follow-up period, study design
Population size, description, exposure assessment method
Organ site Exposure category or level Exposed cases/deaths
Risk estimate (95% CI)
Covariates controlled
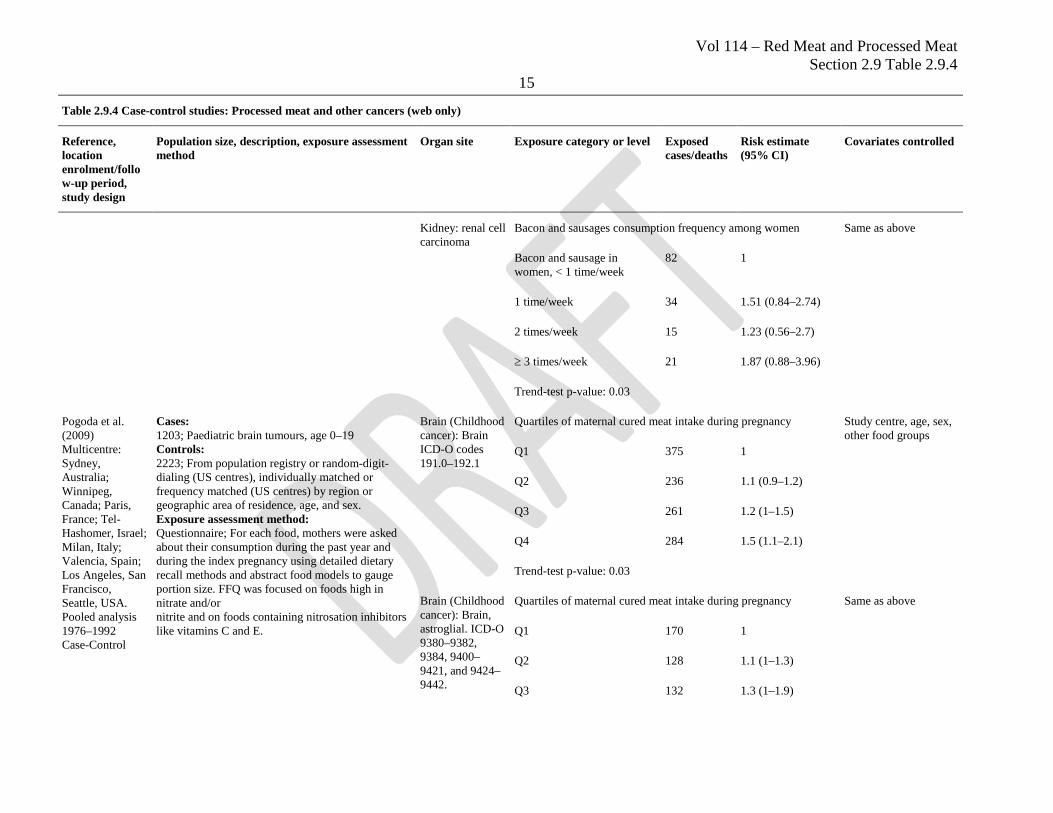
Kidney: renal cell carcinoma
Bacon and sausages consumption frequency among women Same as above
Bacon and sausage in women, < 1 time/week
82 1
1 time/week 34 1.51 (0.84–2.74)
2 times/week 15 1.23 (0.56–2.7)
≥ 3 times/week 21 1.87 (0.88–3.96)
Trend-test p-value: 0.03
Pogoda et al. (2009) Multicentre: Sydney, Australia; Winnipeg, Canada; Paris, France; Tel-Hashomer, Israel; Milan, Italy; Valencia, Spain; Los Angeles, San Francisco, Seattle, USA. Pooled analysis 1976–1992 Case-Control
Cases: 1203; Paediatric brain tumours, age 0–19 Controls: 2223; From population registry or random-digit-dialing (US centres), individually matched or frequency matched (US centres) by region or geographic area of residence, age, and sex. Exposure assessment method: Questionnaire; For each food, mothers were asked about their consumption during the past year and during the index pregnancy using detailed dietary recall methods and abstract food models to gauge portion size. FFQ was focused on foods high in nitrate and/or nitrite and on foods containing nitrosation inhibitors like vitamins C and E.
Brain (Childhood cancer): Brain ICD-O codes 191.0–192.1
Quartiles of maternal cured meat intake during pregnancy Study centre, age, sex, other food groups
Q1 375 1
Q2 236 1.1 (0.9–1.2)
Q3 261 1.2 (1–1.5)
Q4 284 1.5 (1.1–2.1)
Trend-test p-value: 0.03
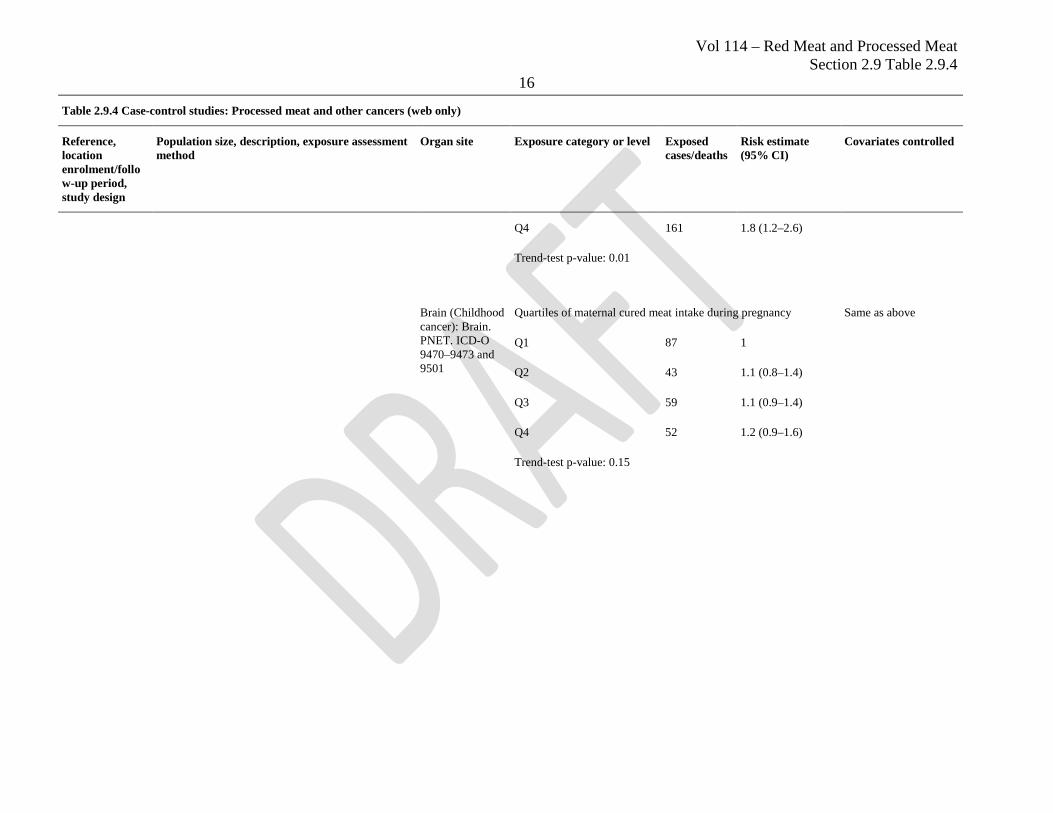
Brain (Childhood cancer): Brain, astroglial. ICD-O 9380–9382, 9384, 9400–9421, and 9424–9442.
Quartiles of maternal cured meat intake during pregnancy Same as above
Q1 170 1
Q2 128 1.1 (1–1.3)
Q3 132 1.3 (1–1.9)
Vol 114 – Red Meat and Processed Meat Section 2.9 Table 2.9.4
16
Table 2.9.4 Case-control studies: Processed meat and other cancers (web only)
Reference, location enrolment/follow-up period, study design
Population size, description, exposure assessment method
Organ site Exposure category or level Exposed cases/deaths
Risk estimate (95% CI)
Covariates controlled
Q4 161 1.8 (1.2–2.6)
Trend-test p-value: 0.01
Brain (Childhood cancer): Brain. PNET. ICD-O 9470–9473 and 9501
Quartiles of maternal cured meat intake during pregnancy Same as above
Q1 87 1
Q2 43 1.1 (0.8–1.4)
Q3 59 1.1 (0.9–1.4)
Q4 52 1.2 (0.9–1.6)
Trend-test p-value: 0.15
Vol 114 – Red Meat and Processed Meat Section 2.9 Table 2.9.4
17
Table 2.9.4 Case-control studies: Processed meat and other cancers (web only)
Reference, location enrolment/follow-up period, study design
Population size, description, exposure assessment method
Organ site Exposure category or level Exposed cases/deaths
Risk estimate (95% CI)
Covariates controlled
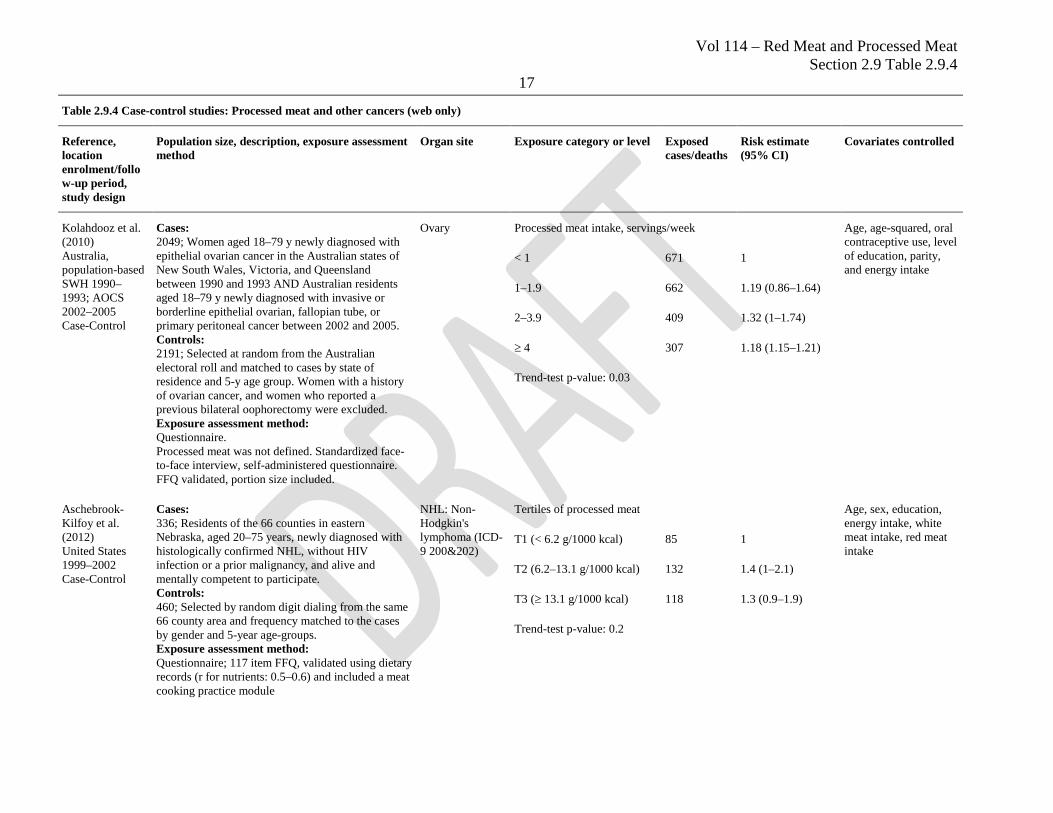
Kolahdooz et al. (2010) Australia, population-based SWH 1990–1993; AOCS 2002–2005 Case-Control
Cases: 2049; Women aged 18–79 y newly diagnosed with epithelial ovarian cancer in the Australian states of New South Wales, Victoria, and Queensland between 1990 and 1993 AND Australian residents aged 18–79 y newly diagnosed with invasive or borderline epithelial ovarian, fallopian tube, or primary peritoneal cancer between 2002 and 2005. Controls: 2191; Selected at random from the Australian electoral roll and matched to cases by state of residence and 5-y age group. Women with a history of ovarian cancer, and women who reported a previous bilateral oophorectomy were excluded. Exposure assessment method: Questionnaire. Processed meat was not defined. Standardized face-to-face interview, self-administered questionnaire. FFQ validated, portion size included.
Ovary Processed meat intake, servings/week Age, age-squared, oral contraceptive use, level of education, parity, and energy intake
< 1 671 1
1–1.9 662 1.19 (0.86–1.64)
2–3.9 409 1.32 (1–1.74)
≥ 4 307 1.18 (1.15–1.21)
Trend-test p-value: 0.03
Aschebrook-Kilfoy et al. (2012) United States 1999–2002 Case-Control
Cases: 336; Residents of the 66 counties in eastern Nebraska, aged 20–75 years, newly diagnosed with histologically confirmed NHL, without HIV infection or a prior malignancy, and alive and mentally competent to participate. Controls: 460; Selected by random digit dialing from the same 66 county area and frequency matched to the cases by gender and 5-year age-groups. Exposure assessment method: Questionnaire; 117 item FFQ, validated using dietary records (r for nutrients: 0.5–0.6) and included a meat cooking practice module
NHL: Non-Hodgkin's lymphoma (ICD-9 200&202)
Tertiles of processed meat Age, sex, education, energy intake, white meat intake, red meat intake
T1 (< 6.2 g/1000 kcal) 85 1
T2 (6.2–13.1 g/1000 kcal) 132 1.4 (1–2.1)
T3 (≥ 13.1 g/1000 kcal) 118 1.3 (0.9–1.9)
Trend-test p-value: 0.2
Vol 114 – Red Meat and Processed Meat Section 2.9 Table 2.9.4
18
Table 2.9.4 Case-control studies: Processed meat and other cancers (web only)
Reference, location enrolment/follow-up period, study design
Population size, description, exposure assessment method
Organ site Exposure category or level Exposed cases/deaths
Risk estimate (95% CI)
Covariates controlled
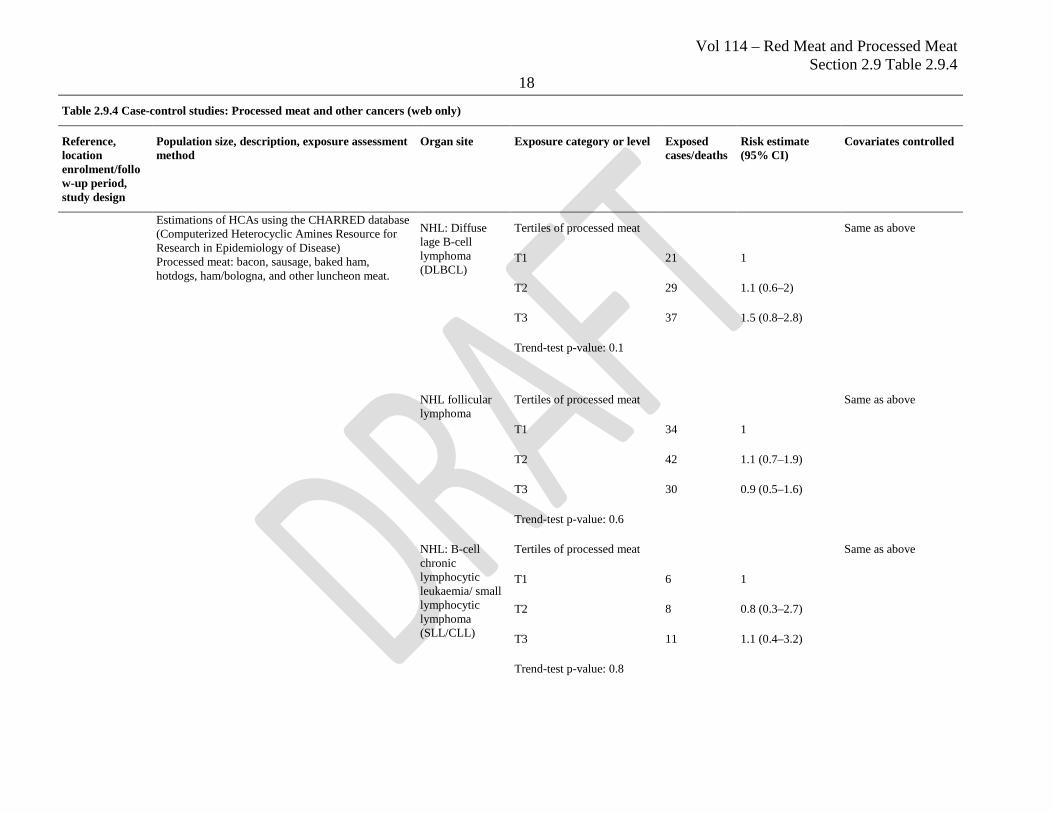
Estimations of HCAs using the CHARRED database (Computerized Heterocyclic Amines Resource for Research in Epidemiology of Disease) Processed meat: bacon, sausage, baked ham, hotdogs, ham/bologna, and other luncheon meat.
NHL: Diffuse lage B-cell lymphoma (DLBCL)
Tertiles of processed meat Same as above
T1 21 1
T2 29 1.1 (0.6–2)
T3 37 1.5 (0.8–2.8)
Trend-test p-value: 0.1
NHL follicular lymphoma
Tertiles of processed meat Same as above
T1 34 1
T2 42 1.1 (0.7–1.9)
T3 30 0.9 (0.5–1.6)
Trend-test p-value: 0.6
NHL: B-cell chronic lymphocytic leukaemia/ small lymphocytic lymphoma (SLL/CLL)
Tertiles of processed meat Same as above
T1 6 1
T2 8 0.8 (0.3–2.7)
T3 11 1.1 (0.4–3.2)
Trend-test p-value: 0.8
Vol 114 – Red Meat and Processed Meat Section 2.9 Table 2.9.4
19
Table 2.9.4 Case-control studies: Processed meat and other cancers (web only)
Reference, location enrolment/follow-up period, study design
Population size, description, exposure assessment method
Organ site Exposure category or level Exposed cases/deaths
Risk estimate (95% CI)
Covariates controlled
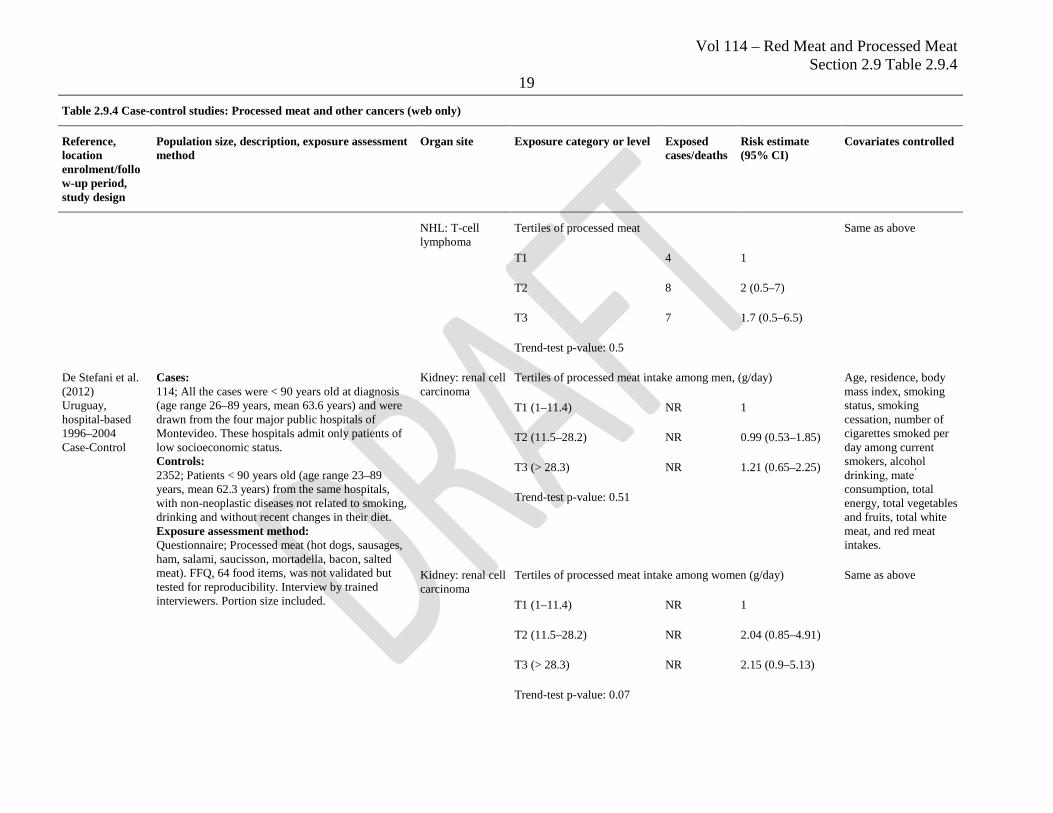
NHL: T-cell lymphoma
Tertiles of processed meat Same as above
T1 4 1
T2 8 2 (0.5–7)
T3 7 1.7 (0.5–6.5)
Trend-test p-value: 0.5
De Stefani et al. (2012) Uruguay, hospital-based 1996–2004 Case-Control
Cases: 114; All the cases were < 90 years old at diagnosis (age range 26–89 years, mean 63.6 years) and were drawn from the four major public hospitals of Montevideo. These hospitals admit only patients of low socioeconomic status. Controls: 2352; Patients < 90 years old (age range 23–89 years, mean 62.3 years) from the same hospitals, with non-neoplastic diseases not related to smoking, drinking and without recent changes in their diet. Exposure assessment method: Questionnaire; Processed meat (hot dogs, sausages, ham, salami, saucisson, mortadella, bacon, salted meat). FFQ, 64 food items, was not validated but tested for reproducibility. Interview by trained interviewers. Portion size included.
Kidney: renal cell carcinoma
Tertiles of processed meat intake among men, (g/day) Age, residence, body mass index, smoking status, smoking cessation, number of cigarettes smoked per day among current smokers, alcohol drinking, mate ́ consumption, total energy, total vegetables and fruits, total white meat, and red meat intakes.
T1 (1–11.4) NR 1
T2 (11.5–28.2) NR 0.99 (0.53–1.85)
T3 (> 28.3) NR 1.21 (0.65–2.25)
Trend-test p-value: 0.51
Kidney: renal cell carcinoma
Tertiles of processed meat intake among women (g/day) Same as above
T1 (1–11.4) NR 1
T2 (11.5–28.2) NR 2.04 (0.85–4.91)
T3 (> 28.3) NR 2.15 (0.9–5.13)
Trend-test p-value: 0.07
Vol 114 – Red Meat and Processed Meat Section 2.9 Table 2.9.4
20
Table 2.9.4 Case-control studies: Processed meat and other cancers (web only)
Reference, location enrolment/follow-up period, study design
Population size, description, exposure assessment method
Organ site Exposure category or level Exposed cases/deaths
Risk estimate (95% CI)
Covariates controlled
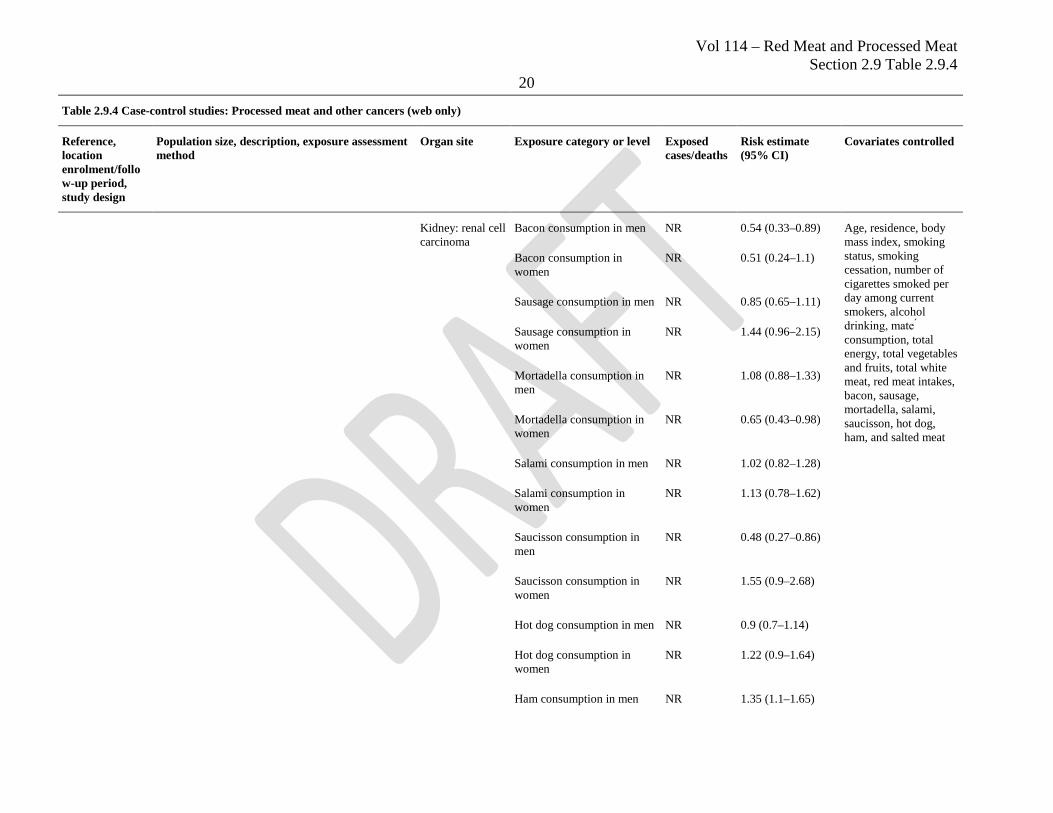
Kidney: renal cell carcinoma
Bacon consumption in men NR 0.54 (0.33–0.89) Age, residence, body mass index, smoking status, smoking cessation, number of cigarettes smoked per day among current smokers, alcohol drinking, mate ́ consumption, total energy, total vegetables and fruits, total white meat, red meat intakes, bacon, sausage, mortadella, salami, saucisson, hot dog, ham, and salted meat
Bacon consumption in women
NR 0.51 (0.24–1.1)
Sausage consumption in men NR 0.85 (0.65–1.11)
Sausage consumption in women
NR 1.44 (0.96–2.15)
Mortadella consumption in men
NR 1.08 (0.88–1.33)
Mortadella consumption in women
NR 0.65 (0.43–0.98)
Salami consumption in men NR 1.02 (0.82–1.28)
Salami consumption in women
NR 1.13 (0.78–1.62)
Saucisson consumption in men
NR 0.48 (0.27–0.86)
Saucisson consumption in women
NR 1.55 (0.9–2.68)
Hot dog consumption in men NR 0.9 (0.7–1.14)
Hot dog consumption in women
NR 1.22 (0.9–1.64)
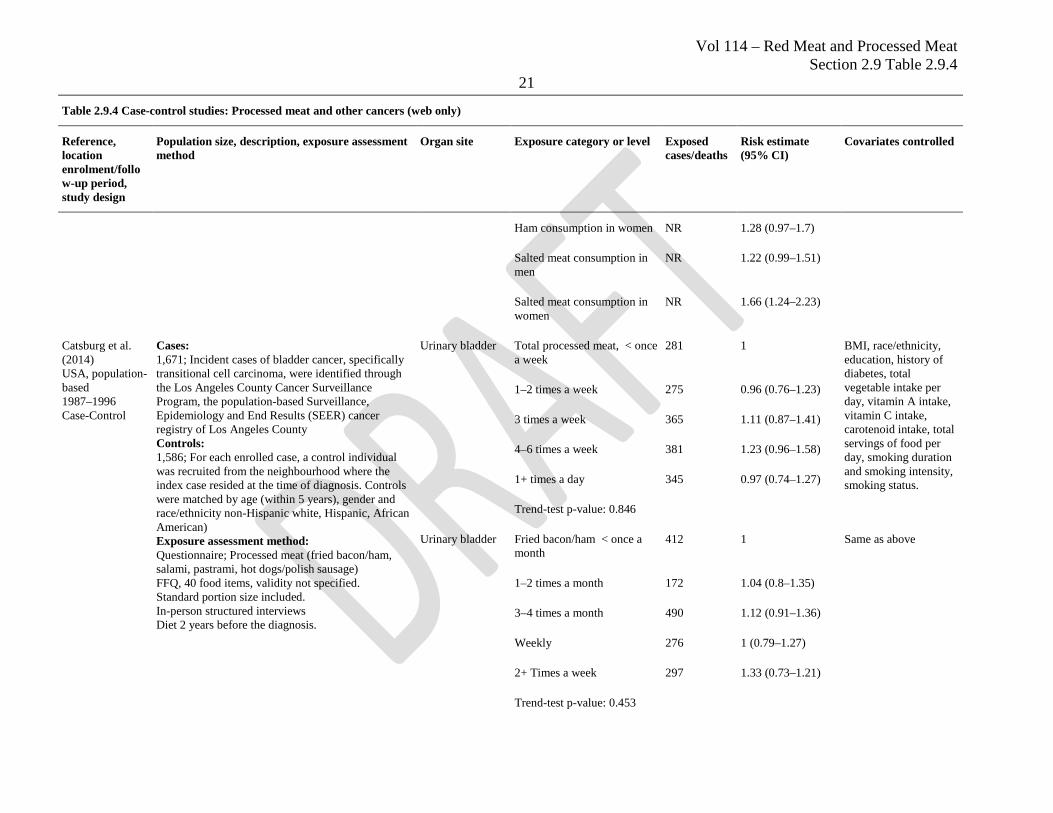
Ham consumption in men NR 1.35 (1.1–1.65)
Vol 114 – Red Meat and Processed Meat Section 2.9 Table 2.9.4
21
Table 2.9.4 Case-control studies: Processed meat and other cancers (web only)
Reference, location enrolment/follow-up period, study design
Population size, description, exposure assessment method
Organ site Exposure category or level Exposed cases/deaths
Risk estimate (95% CI)
Covariates controlled
Ham consumption in women NR 1.28 (0.97–1.7)
Salted meat consumption in men
NR 1.22 (0.99–1.51)
Salted meat consumption in women
NR 1.66 (1.24–2.23)
Catsburg et al. (2014) USA, population-based 1987–1996 Case-Control
Cases: 1,671; Incident cases of bladder cancer, specifically transitional cell carcinoma, were identified through the Los Angeles County Cancer Surveillance Program, the population-based Surveillance, Epidemiology and End Results (SEER) cancer registry of Los Angeles County Controls: 1,586; For each enrolled case, a control individual was recruited from the neighbourhood where the index case resided at the time of diagnosis. Controls were matched by age (within 5 years), gender and race/ethnicity non-Hispanic white, Hispanic, African American) Exposure assessment method: Questionnaire; Processed meat (fried bacon/ham, salami, pastrami, hot dogs/polish sausage) FFQ, 40 food items, validity not specified. Standard portion size included. In-person structured interviews Diet 2 years before the diagnosis.
Urinary bladder Total processed meat, < once a week
281 1 BMI, race/ethnicity, education, history of diabetes, total vegetable intake per day, vitamin A intake, vitamin C intake, carotenoid intake, total servings of food per day, smoking duration and smoking intensity, smoking status.
1–2 times a week 275 0.96 (0.76–1.23)
3 times a week 365 1.11 (0.87–1.41)
4–6 times a week 381 1.23 (0.96–1.58)
1+ times a day 345 0.97 (0.74–1.27)
Trend-test p-value: 0.846
Urinary bladder Fried bacon/ham < once a month
412 1 Same as above
1–2 times a month 172 1.04 (0.8–1.35)
3–4 times a month 490 1.12 (0.91–1.36)
Weekly 276 1 (0.79–1.27)
2+ Times a week 297 1.33 (0.73–1.21)
Trend-test p-value: 0.453
Vol 114 – Red Meat and Processed Meat Section 2.9 Table 2.9.4
22
Table 2.9.4 Case-control studies: Processed meat and other cancers (web only)
Reference, location enrolment/follow-up period, study design
Population size, description, exposure assessment method
Organ site Exposure category or level Exposed cases/deaths
Risk estimate (95% CI)
Covariates controlled
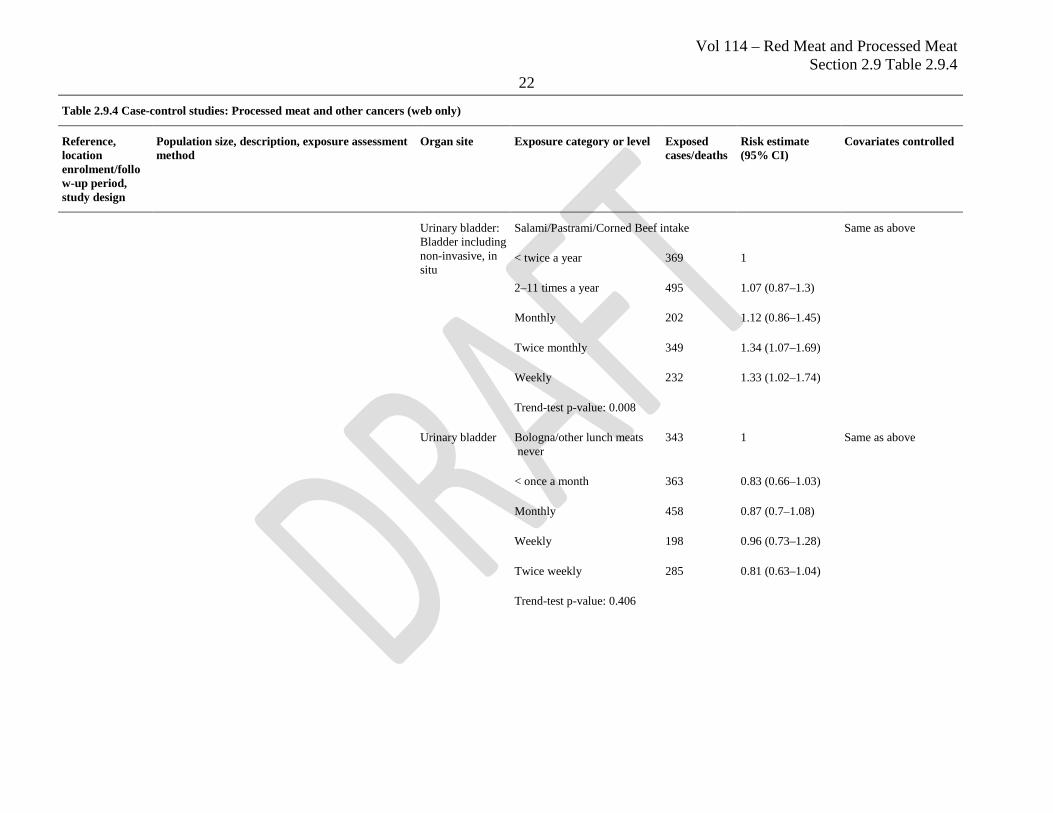
Urinary bladder: Bladder including non-invasive, in situ
Salami/Pastrami/Corned Beef intake Same as above
< twice a year 369 1
2–11 times a year 495 1.07 (0.87–1.3)
Monthly 202 1.12 (0.86–1.45)
Twice monthly 349 1.34 (1.07–1.69)
Weekly 232 1.33 (1.02–1.74)
Trend-test p-value: 0.008
Urinary bladder Bologna/other lunch meats never
343 1 Same as above
< once a month 363 0.83 (0.66–1.03)
Monthly 458 0.87 (0.7–1.08)
Weekly 198 0.96 (0.73–1.28)
Twice weekly 285 0.81 (0.63–1.04)
Trend-test p-value: 0.406
Vol 114 – Red Meat and Processed Meat Section 2.9 Table 2.9.4
23
Table 2.9.4 Case-control studies: Processed meat and other cancers (web only)
Reference, location enrolment/follow-up period, study design
Population size, description, exposure assessment method
Organ site Exposure category or level Exposed cases/deaths
Risk estimate (95% CI)
Covariates controlled
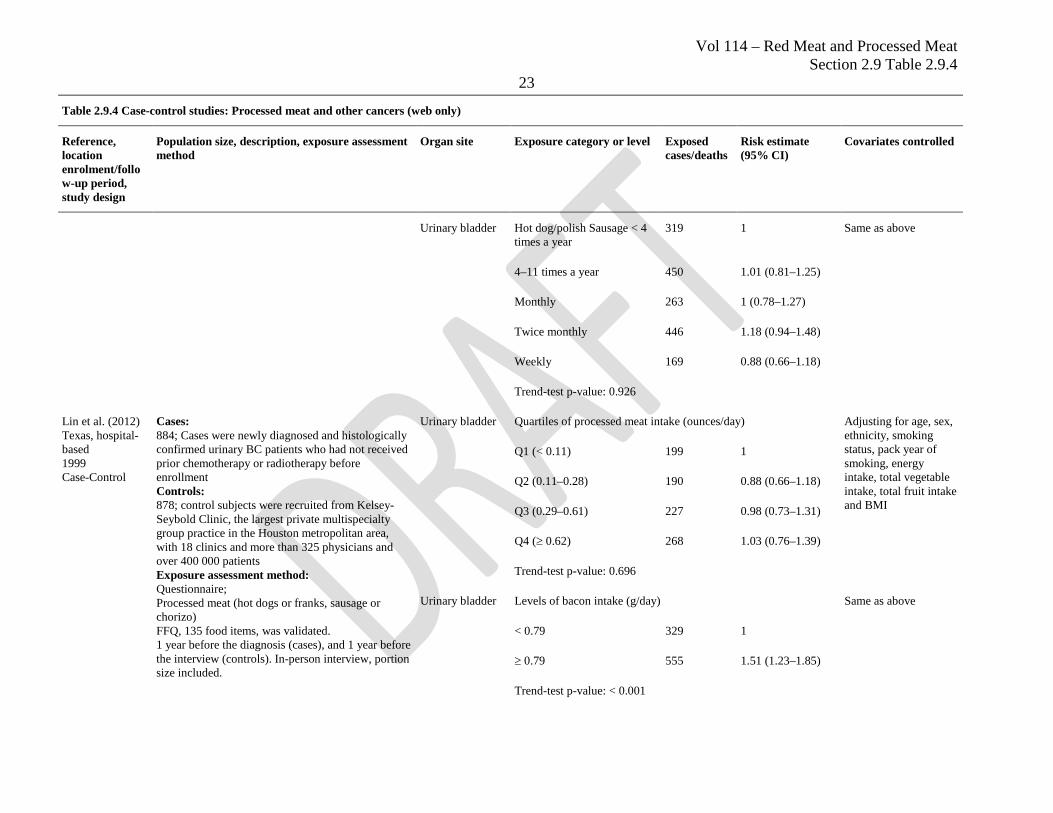
Urinary bladder Hot dog/polish Sausage < 4 times a year
319 1 Same as above
4–11 times a year 450 1.01 (0.81–1.25)
Monthly 263 1 (0.78–1.27)
Twice monthly 446 1.18 (0.94–1.48)
Weekly 169 0.88 (0.66–1.18)
Trend-test p-value: 0.926
Lin et al. (2012) Texas, hospital-based 1999 Case-Control
Cases: 884; Cases were newly diagnosed and histologically confirmed urinary BC patients who had not received prior chemotherapy or radiotherapy before enrollment Controls: 878; control subjects were recruited from Kelsey-Seybold Clinic, the largest private multispecialty group practice in the Houston metropolitan area, with 18 clinics and more than 325 physicians and over 400 000 patients Exposure assessment method: Questionnaire; Processed meat (hot dogs or franks, sausage or chorizo) FFQ, 135 food items, was validated. 1 year before the diagnosis (cases), and 1 year before the interview (controls). In-person interview, portion size included.
Urinary bladder Quartiles of processed meat intake (ounces/day) Adjusting for age, sex, ethnicity, smoking status, pack year of smoking, energy intake, total vegetable intake, total fruit intake and BMI
Q1 (< 0.11) 199 1
Q2 (0.11–0.28) 190 0.88 (0.66–1.18)
Q3 (0.29–0.61) 227 0.98 (0.73–1.31)
Q4 (≥ 0.62) 268 1.03 (0.76–1.39)
Trend-test p-value: 0.696
Urinary bladder Levels of bacon intake (g/day) Same as above
< 0.79 329 1
≥ 0.79 555 1.51 (1.23–1.85)
Trend-test p-value: < 0.001
Vol 114 – Red Meat and Processed Meat Section 2.9 Table 2.9.4
24
Table 2.9.4 Case-control studies: Processed meat and other cancers (web only)
Reference, location enrolment/follow-up period, study design
Population size, description, exposure assessment method
Organ site Exposure category or level Exposed cases/deaths
Risk estimate (95% CI)
Covariates controlled
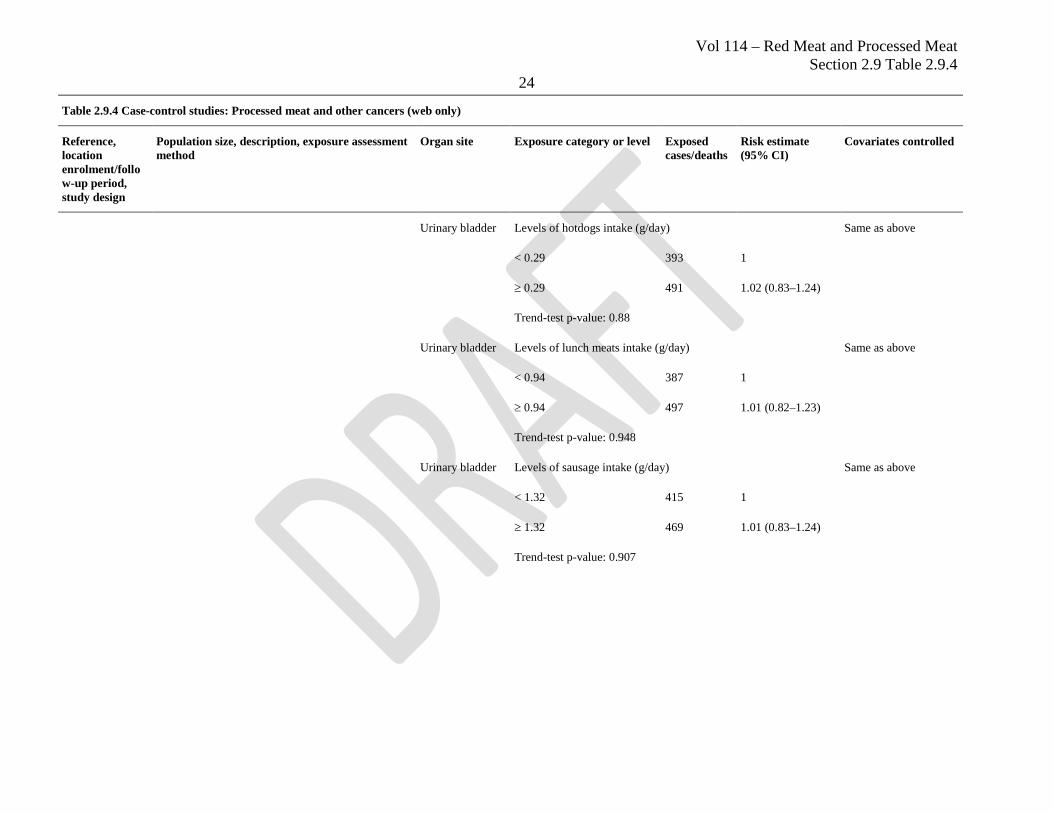
Urinary bladder Levels of hotdogs intake (g/day) Same as above
< 0.29 393 1
≥ 0.29 491 1.02 (0.83–1.24)
Trend-test p-value: 0.88
Urinary bladder Levels of lunch meats intake (g/day) Same as above
< 0.94 387 1
≥ 0.94 497 1.01 (0.82–1.23)
Trend-test p-value: 0.948
Urinary bladder Levels of sausage intake (g/day) Same as above
< 1.32 415 1
≥ 1.32 469 1.01 (0.83–1.24)
Trend-test p-value: 0.907
Vol 114 – Red Meat and Processed Meat Section 2.9 Table 2.9.4
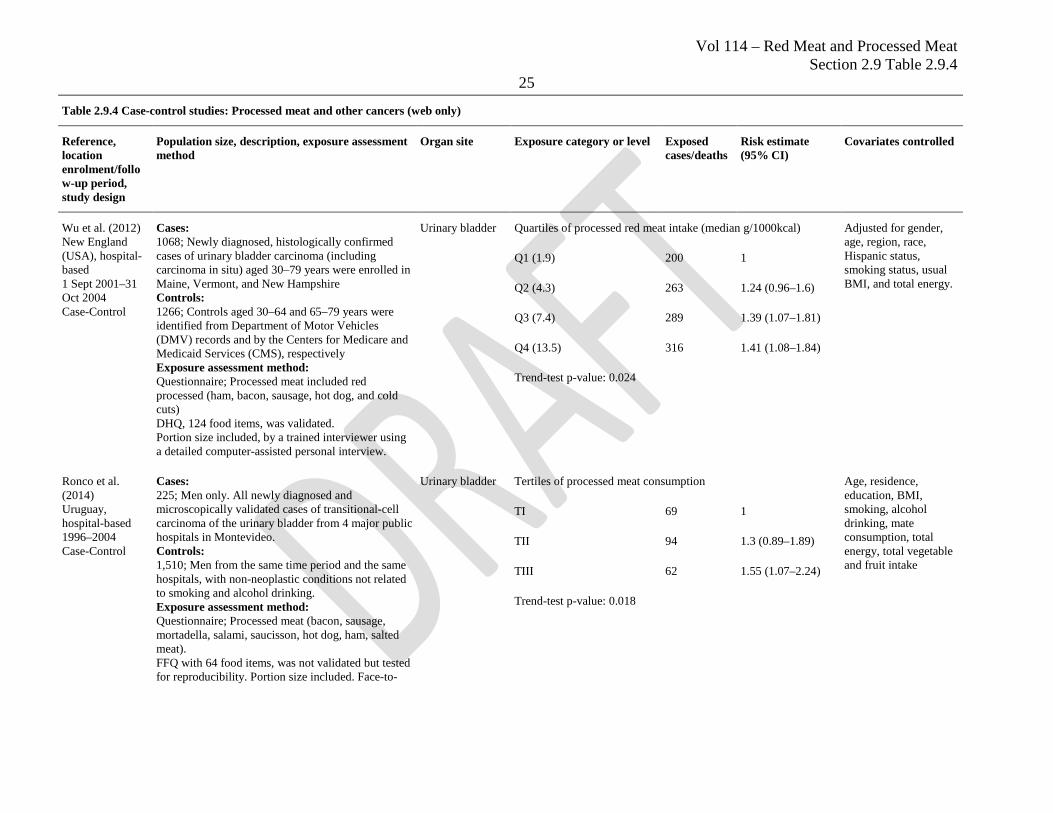
25
Table 2.9.4 Case-control studies: Processed meat and other cancers (web only)
Reference, location enrolment/follow-up period, study design
Population size, description, exposure assessment method
Organ site Exposure category or level Exposed cases/deaths
Risk estimate (95% CI)
Covariates controlled
Wu et al. (2012) New England (USA), hospital-based 1 Sept 2001–31 Oct 2004 Case-Control
Cases: 1068; Newly diagnosed, histologically confirmed cases of urinary bladder carcinoma (including carcinoma in situ) aged 30–79 years were enrolled in Maine, Vermont, and New Hampshire Controls: 1266; Controls aged 30–64 and 65–79 years were identified from Department of Motor Vehicles (DMV) records and by the Centers for Medicare and Medicaid Services (CMS), respectively Exposure assessment method: Questionnaire; Processed meat included red processed (ham, bacon, sausage, hot dog, and cold cuts) DHQ, 124 food items, was validated. Portion size included, by a trained interviewer using a detailed computer-assisted personal interview.
Urinary bladder Quartiles of processed red meat intake (median g/1000kcal) Adjusted for gender, age, region, race, Hispanic status, smoking status, usual BMI, and total energy.
Q1 (1.9) 200 1
Q2 (4.3) 263 1.24 (0.96–1.6)
Q3 (7.4) 289 1.39 (1.07–1.81)
Q4 (13.5) 316 1.41 (1.08–1.84)
Trend-test p-value: 0.024
Ronco et al. (2014) Uruguay, hospital-based 1996–2004 Case-Control
Cases: 225; Men only. All newly diagnosed and microscopically validated cases of transitional-cell carcinoma of the urinary bladder from 4 major public hospitals in Montevideo. Controls: 1,510; Men from the same time period and the same hospitals, with non-neoplastic conditions not related to smoking and alcohol drinking. Exposure assessment method: Questionnaire; Processed meat (bacon, sausage, mortadella, salami, saucisson, hot dog, ham, salted meat). FFQ with 64 food items, was not validated but tested for reproducibility. Portion size included. Face-to-
Urinary bladder Tertiles of processed meat consumption Age, residence, education, BMI, smoking, alcohol drinking, mate consumption, total energy, total vegetable and fruit intake
TI 69 1
TII 94 1.3 (0.89–1.89)
TIII 62 1.55 (1.07–2.24)
Trend-test p-value: 0.018
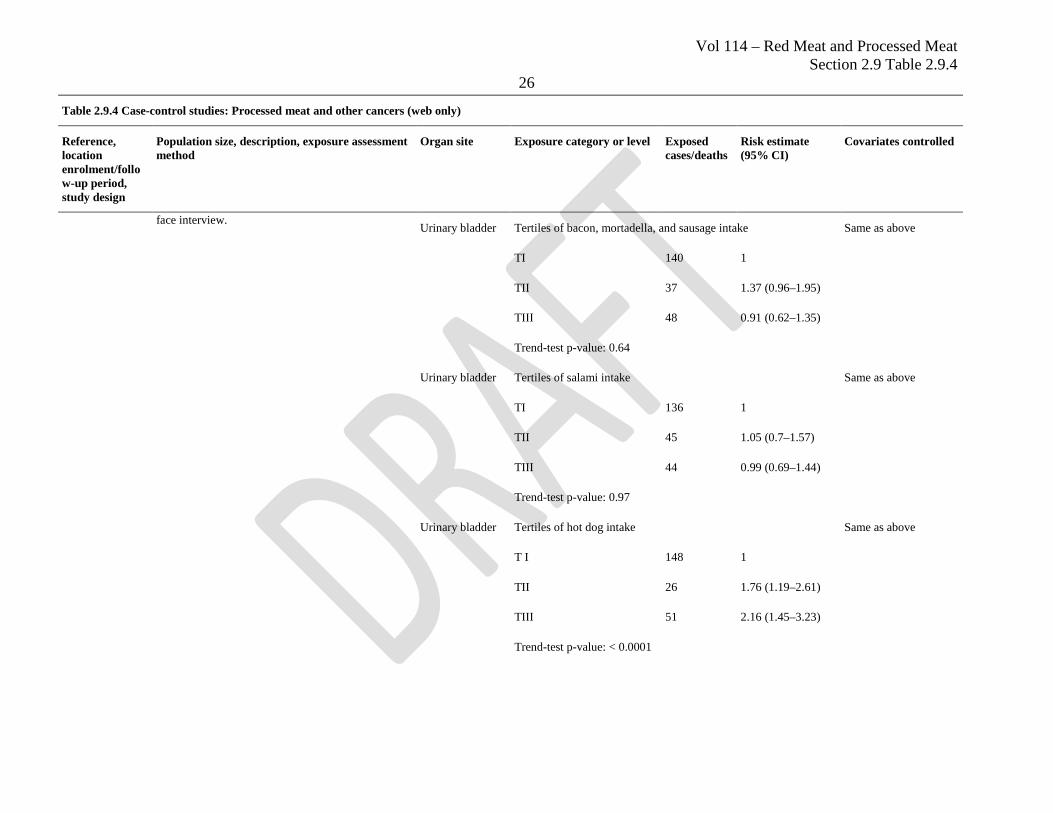
Vol 114 – Red Meat and Processed Meat Section 2.9 Table 2.9.4
26
Table 2.9.4 Case-control studies: Processed meat and other cancers (web only)
Reference, location enrolment/follow-up period, study design
Population size, description, exposure assessment method
Organ site Exposure category or level Exposed cases/deaths
Risk estimate (95% CI)
Covariates controlled
face interview. Urinary bladder Tertiles of bacon, mortadella, and sausage intake Same as above
TI 140 1
TII 37 1.37 (0.96–1.95)
TIII 48 0.91 (0.62–1.35)
Trend-test p-value: 0.64
Urinary bladder Tertiles of salami intake Same as above
TI 136 1
TII 45 1.05 (0.7–1.57)
TIII 44 0.99 (0.69–1.44)
Trend-test p-value: 0.97
Urinary bladder Tertiles of hot dog intake Same as above
T I 148 1
TII 26 1.76 (1.19–2.61)
TIII 51 2.16 (1.45–3.23)
Trend-test p-value: < 0.0001
Vol 114 – Red Meat and Processed Meat Section 2.9 Table 2.9.4
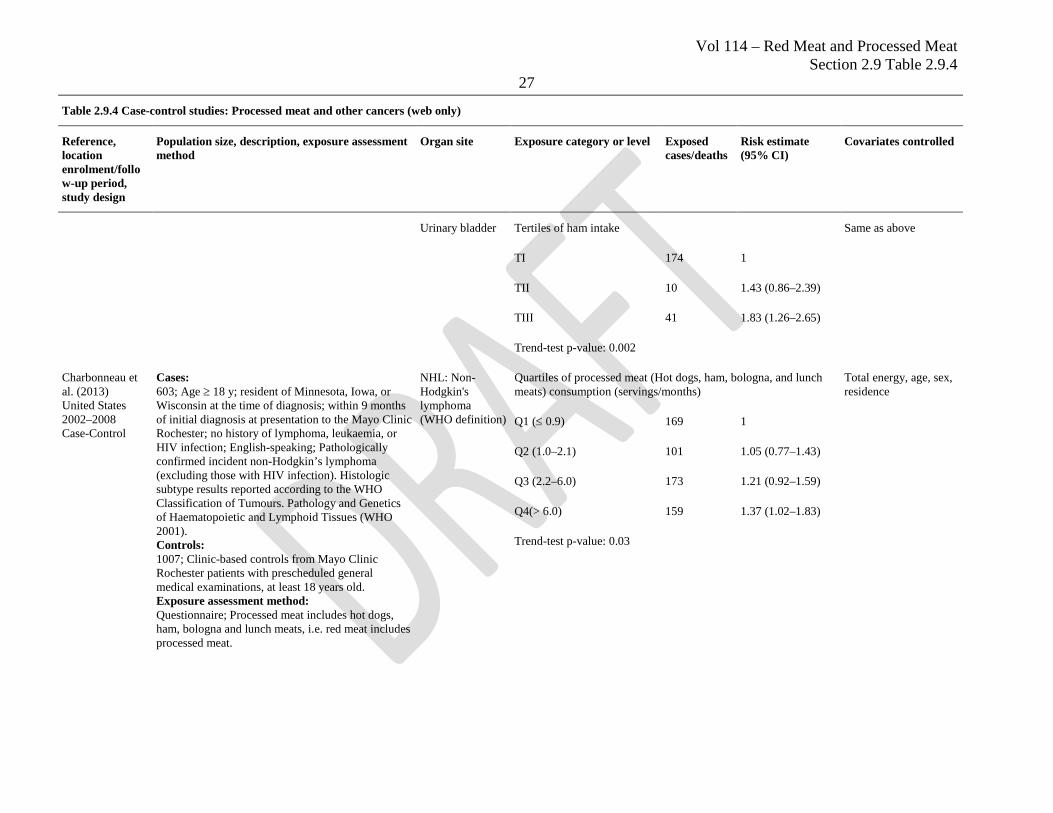
27
Table 2.9.4 Case-control studies: Processed meat and other cancers (web only)
Reference, location enrolment/follow-up period, study design
Population size, description, exposure assessment method
Organ site Exposure category or level Exposed cases/deaths
Risk estimate (95% CI)
Covariates controlled
Urinary bladder Tertiles of ham intake Same as above
TI 174 1
TII 10 1.43 (0.86–2.39)
TIII 41 1.83 (1.26–2.65)
Trend-test p-value: 0.002
Charbonneau et al. (2013) United States 2002–2008 Case-Control
Cases: 603; Age ≥ 18 y; resident of Minnesota, Iowa, or Wisconsin at the time of diagnosis; within 9 months of initial diagnosis at presentation to the Mayo Clinic Rochester; no history of lymphoma, leukaemia, or HIV infection; English-speaking; Pathologically confirmed incident non-Hodgkin’s lymphoma (excluding those with HIV infection). Histologic subtype results reported according to the WHO Classification of Tumours. Pathology and Genetics of Haematopoietic and Lymphoid Tissues (WHO 2001). Controls: 1007; Clinic-based controls from Mayo Clinic Rochester patients with prescheduled general medical examinations, at least 18 years old. Exposure assessment method: Questionnaire; Processed meat includes hot dogs, ham, bologna and lunch meats, i.e. red meat includes processed meat.
NHL: Non-Hodgkin's lymphoma (WHO definition)
Quartiles of processed meat (Hot dogs, ham, bologna, and lunch meats) consumption (servings/months)
Total energy, age, sex, residence
Q1 (≤ 0.9) 169 1
Q2 (1.0–2.1) 101 1.05 (0.77–1.43)
Q3 (2.2–6.0) 173 1.21 (0.92–1.59)
Q4(> 6.0) 159 1.37 (1.02–1.83)
Trend-test p-value: 0.03
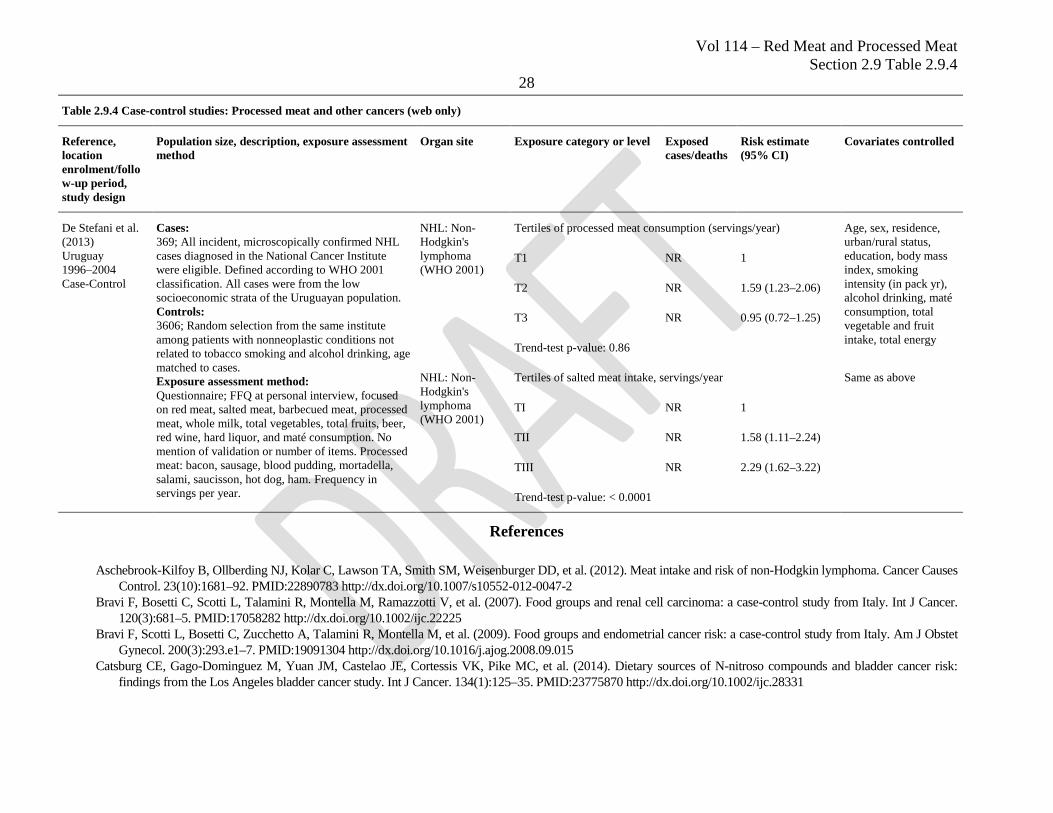
Vol 114 – Red Meat and Processed Meat Section 2.9 Table 2.9.4
28
Table 2.9.4 Case-control studies: Processed meat and other cancers (web only)
Reference, location enrolment/follow-up period, study design
Population size, description, exposure assessment method
Organ site Exposure category or level Exposed cases/deaths
Risk estimate (95% CI)
Covariates controlled
De Stefani et al. (2013) Uruguay 1996–2004 Case-Control
Cases: 369; All incident, microscopically confirmed NHL cases diagnosed in the National Cancer Institute were eligible. Defined according to WHO 2001 classification. All cases were from the low socioeconomic strata of the Uruguayan population. Controls: 3606; Random selection from the same institute among patients with nonneoplastic conditions not related to tobacco smoking and alcohol drinking, age matched to cases. Exposure assessment method: Questionnaire; FFQ at personal interview, focused on red meat, salted meat, barbecued meat, processed meat, whole milk, total vegetables, total fruits, beer, red wine, hard liquor, and maté consumption. No mention of validation or number of items. Processed meat: bacon, sausage, blood pudding, mortadella, salami, saucisson, hot dog, ham. Frequency in servings per year.
NHL: Non-Hodgkin's lymphoma (WHO 2001)
Tertiles of processed meat consumption (servings/year) Age, sex, residence, urban/rural status, education, body mass index, smoking intensity (in pack yr), alcohol drinking, maté consumption, total vegetable and fruit intake, total energy
T1 NR 1
T2 NR 1.59 (1.23–2.06)
T3 NR 0.95 (0.72–1.25)
Trend-test p-value: 0.86
NHL: Non-Hodgkin's lymphoma (WHO 2001)
Tertiles of salted meat intake, servings/year Same as above
TI NR 1
TII NR 1.58 (1.11–2.24)
TIII NR 2.29 (1.62–3.22)
Trend-test p-value: < 0.0001
References
Aschebrook-Kilfoy B, Ollberding NJ, Kolar C, Lawson TA, Smith SM, Weisenburger DD, et al. (2012). Meat intake and risk of non-Hodgkin lymphoma. Cancer Causes Control. 23(10):1681–92. PMID:22890783 http://dx.doi.org/10.1007/s10552-012-0047-2
Bravi F, Bosetti C, Scotti L, Talamini R, Montella M, Ramazzotti V, et al. (2007). Food groups and renal cell carcinoma: a case-control study from Italy. Int J Cancer. 120(3):681–5. PMID:17058282 http://dx.doi.org/10.1002/ijc.22225
Bravi F, Scotti L, Bosetti C, Zucchetto A, Talamini R, Montella M, et al. (2009). Food groups and endometrial cancer risk: a case-control study from Italy. Am J Obstet Gynecol. 200(3):293.e1–7. PMID:19091304 http://dx.doi.org/10.1016/j.ajog.2008.09.015
Catsburg CE, Gago-Dominguez M, Yuan JM, Castelao JE, Cortessis VK, Pike MC, et al. (2014). Dietary sources of N-nitroso compounds and bladder cancer risk: findings from the Los Angeles bladder cancer study. Int J Cancer. 134(1):125–35. PMID:23775870 http://dx.doi.org/10.1002/ijc.28331
Vol 114 – Red Meat and Processed Meat Section 2.9 Table 2.9.4
29 Charbonneau B, O’Connor HM, Wang AH, Liebow M, Thompson CA, Fredericksen ZS, et al. (2013). Trans fatty acid intake is associated with increased risk and n3
fatty acid intake with reduced risk of non-hodgkin lymphoma. J Nutr. 143(5):672–81. PMID:23486982 http://dx.doi.org/10.3945/jn.112.168658 Cross AJ, Ward MH, Schenk M, Kulldorff M, Cozen W, Davis S, et al. (2006). Meat and meat-mutagen intake and risk of non-Hodgkin lymphoma: results from a NCI-
SEER case-control study. Carcinogenesis. 27(2):293–7. PMID:16113054 http://dx.doi.org/10.1093/carcin/bgi212 De Stefani E, Boffetta P, Ronco AL, Deneo-Pellegrini H, Correa P, Acosta G, et al. (2012). Processed meat consumption and risk of cancer: a multisite case-control study
in Uruguay. Br J Cancer. 107(9):1584–8. PMID:23011480 http://dx.doi.org/10.1038/bjc.2012.433 De Stefani E, Fierro L, Barrios E, Ronco A (1998). Tobacco, alcohol, diet and risk of non-Hodgkin’s lymphoma: a case-control study in Uruguay. Leuk Res. 22(5):445–
52. PMID:9652731 http://dx.doi.org/10.1016/S0145-2126(97)00194-X De Stefani E, Ronco AL, Deneo-Pellegrini H, Boffetta P, Correa P, Barrios E, et al. (2013). Meat, milk and risk of lymphoid malignancies: a case-control study in
Uruguay. Nutr Cancer. 65(3):375–83. PMID:23530636 http://dx.doi.org/10.1080/01635581.2013.761255 García-Closas R, García-Closas M, Kogevinas M, Malats N, Silverman D, Serra C, et al. (2007). Food, nutrient and heterocyclic amine intake and the risk of bladder
cancer. Eur J Cancer. 43(11):1731–40. PMID:17596928 http://dx.doi.org/10.1016/j.ejca.2007.05.007 Goodman MT, Hankin JH, Wilkens LR, Lyu LC, McDuffie K, Liu LQ, et al. (1997). Diet, body size, physical activity, and the risk of endometrial cancer. Cancer Res.
57(22):5077–85. PMID:9371506 Grieb SM, Theis RP, Burr D, Benardot D, Siddiqui T, Asal NR (2009). Food groups and renal cell carcinoma: results from a case-control study. J Am Diet Assoc.
109(4):656–67. PMID:19328261 http://dx.doi.org/10.1016/j.jada.2008.12.020 Hsu CC, Chow WH, Boffetta P, Moore L, Zaridze D, Moukeria A, et al. (2007). Dietary risk factors for kidney cancer in Eastern and Central Europe. Am J Epidemiol.
166(1):62–70. PMID:17456477 http://dx.doi.org/10.1093/aje/kwm043 Hu J, La Vecchia C, DesMeules M, Negri E, Mery L, Group CCRE; Canadian Cancer Registries Epidemiology Research Group (2008). Meat and fish consumption and
cancer in Canada. Nutr Cancer. 60(3):313–24. PMID:18444165 http://dx.doi.org/10.1080/01635580701759724 Kolahdooz F, van der Pols JC, Bain CJ, Marks GC, Hughes MC, Whiteman DC, et al.; Australian Cancer Study (Ovarian Cancer) and the Australian Ovarian Cancer
Study Group (2010). Meat, fish, and ovarian cancer risk: Results from 2 Australian case-control studies, a systematic review, and meta-analysis. Am J Clin Nutr. 91(6):1752–63. PMID:20392889 http://dx.doi.org/10.3945/ajcn.2009.28415
Lin J, Forman MR, Wang J, Grossman HB, Chen M, Dinney CP, et al. (2012). Intake of red meat and heterocyclic amines, metabolic pathway genes and bladder cancer risk. Int J Cancer. 131(8):1892–903. PMID:22261697 http://dx.doi.org/10.1002/ijc.27437
McCann SE, Freudenheim JL, Marshall JR, Brasure JR, Swanson MK, Graham S (2000). Diet in the epidemiology of endometrial cancer in western New York (United States). Cancer Causes Control. 11(10):965–74. PMID:11142531 http://dx.doi.org/10.1023/A:1026551309873
Pan SY, Ugnat AM, Mao Y, Wen SW, Johnson KC; Canadian Cancer Registries Epidemiology Research Group (2004). A case-control study of diet and the risk of ovarian cancer. Cancer Epidemiol Biomarkers Prev. 13(9):1521–7. PMID:15342455
Pogoda JM, Preston-Martin S, Howe G, Lubin F, Mueller BA, Holly EA, et al. (2009). An international case-control study of maternal diet during pregnancy and childhood brain tumor risk: a histology-specific analysis by food group. Ann Epidemiol. 19(3):148–60. PMID:19216997 PMID:19216997 http://dx.doi.org/10.1016/j.annepidem.2008.12.011
Radosavljević V, Janković S, Marinković J, Dokić M (2005). Diet and bladder cancer: a case-control study. Int Urol Nephrol. 37(2):283–9. PMID:16142557 http://dx.doi.org/10.1007/s11255-004-4710-8
Riboli E, González CA, López-Abente G, Errezola M, Izarzugaza I, Escolar A, et al. (1991). Diet and bladder cancer in Spain: a multi-centre case-control study. Int J Cancer. 49(2):214–9. PMID:1879967 http://dx.doi.org/10.1002/ijc.2910490212
Ronco AL, Mendilaharsu M, Boffetta P, Deneo-Pellegrini H, De Stefani E (2014). Meat consumption, animal products, and the risk of bladder cancer: a case-control study in Uruguayan men. Asian Pac J Cancer Prev. 15(14):5805–9. PMID:25081704 http://dx.doi.org/10.7314/APJCP.2014.15.14.5805
Vol 114 – Red Meat and Processed Meat Section 2.9 Table 2.9.4
30 Talamini R, Polesel J, Montella M, Dal Maso L, Crispo A, Tommasi LG, et al. (2006b). Food groups and risk of hepatocellular carcinoma: A multicenter case-control
study in Italy. Int J Cancer. 119(12):2916–21. PMID:16998792 http://dx.doi.org/10.1002/ijc.22267 Talamini R, Polesel J, Montella M, Dal Maso L, Crovatto M, Crispo A, et al. (2006a). Food groups and risk of non-Hodgkin lymphoma: a multicenter, case-control study
in Italy. Int J Cancer. 118(11):2871–6. PMID:16385566 http://dx.doi.org/10.1002/ijc.21737 Wakai K, Hirose K, Takezaki T, Hamajima N, Ogura Y, Nakamura S, et al. (2004). Foods and beverages in relation to urothelial cancer: case-control study in Japan. Int J
Urol. 11(1):11–9. PMID:14678179 http://dx.doi.org/10.1111/j.1442-2042.2004.00740.x Ward MH, Zahm SH, Weisenburger DD, Gridley G, Cantor KP, Saal RC, et al. (1994). Dietary factors and non-Hodgkin’s lymphoma in Nebraska (United States).
Cancer Causes Control. 5(5):422–32. PMID:7999964 http://dx.doi.org/10.1007/BF01694756 WHO (2001). Pathology and Genetics of Tumours of Haematopoietic and Lymphoid Tissues. WHO Classification of Tumours. 3rd Edition. Volume 3. Jaffe ES, Harris
NL, Stein H, Vardiman JW eds. Wolk A, Gridley G, Niwa S, Lindblad P, McCredie M, Mellemgaard A, et al. (1996). International renal cell cancer study. VII. Role of diet. Int J Cancer. 65(1):67–73.
PMID:8543399 http://dx.doi.org/10.1002/(SICI)1097-0215(19960103)65:1<67::AID-IJC12>3.0.CO;2-F Wu JW, Cross AJ, Baris D, Ward MH, Karagas MR, Johnson A, et al. (2012). Dietary intake of meat, fruits, vegetables, and selective micronutrients and risk of bladder
cancer in the New England region of the United States. Br J Cancer. 106(11):1891–8. PMID:22568968 http://dx.doi.org/10.1038/bjc.2012.187 Yuan JM, Gago-Dominguez M, Castelao JE, Hankin JH, Ross RK, Yu MC (1998). Cruciferous vegetables in relation to renal cell carcinoma. Int J Cancer. 77(2):211–6.
PMID:9650554 http://dx.doi.org/10.1002/(SICI)1097-0215(19980717)77:2<211::AID-IJC7>3.0.CO;2-T