vol 1 no 9 mar 2012 - covenant universityeprints.covenantuniversity.edu.ng/9038/1/ajibola, osota and...
TRANSCRIPT

ISSN XXXX-‐XXXX
VOL . 1, NO . 9 MARCH -‐ 2012

Business and Social Sciences Review (BSSR) Vol . 1, No . 9, (Mar -‐ 2012) www.bssreview.org ISSN: 2047-‐6485
2
Copyright © 2012 – Society of Business and Social Sciences
TABLE OF CONTENTS EDITORIAL BOARD
3
An Examination Of Contemporary Methods For Assessing Compensation In Nigeria M. O. Ajibola T. O. Osota S. A. Oloyede
4
A Conceptual Model Of Top Management External Ties On Strategic Choice: The Moderator Of Firm Performance Bau-‐Jung Chang
17
Determinants Of Life Insurance Demand: An Empirical Investigation In The Malaysian Market Dr. Zatul Karamah Ahmad Baharul Ulum Lim Thien Sang Amer Azlan Abdul Jamal
28
Cost of Power Outages in Zimbabwean Industrial Sector Nyasha Kaseke Stephen Hosking
39
DISCLAIMER 66

Business and Social Sciences Review (BSSR) Vol . 1, No . 9, (Mar -‐ 2012) www.bssreview.org ISSN: 2047-‐6485
3
Copyright © 2012 – Society of Business and Social Sciences
EDITORIAL BOARD T. Moerer Director, Master in Organizational Leadership Program, College of Saint Mary, Omaha, USA W. P. Jones Deputy Head, Glamorgan Business School, UK I. M. Tahir Associate Professor, University Sultan Zainal Abidin UniSZA, Malaysia F. M. Kreishan Dean, Faculty of B.A. & E, Al-‐Hussein bin Talal University, Jordan M.M. Siddiqui Chairman, Department of Commerce, FUUAST, Pakistan G. T. W. Han Faculty of Business and Finance, Universti Tunku Abdul Rahman, Malaysia K. Shahzad Head Graduate Program, Riphah School of Leadership, RIU, Pakistan M. R. Noruzi Payam e Noor university of Maraghe, Iran X. Zhao School of Business and Economics, Wilfrid laurier University, Canada M. O. Samuel University of Fort Hare, Alice, South Africa A. Bhunia Fakir Chand College under University of Calcutta, Diamond Harbour, West Bengal, India M. S. Awan Department of Economics, University of Sargodha, Pakistan A. K. N. Al-‐Swidi UUM College of Business, University Utara Malaysia, Malaysia

Business and Social Sciences Review (BSSR) Vol . 1, No . 9, (Mar -‐ 2012) www.bssreview.org ISSN: 2047-‐6485
4
Copyright © 2012 – Society of Business and Social Sciences
AN EXAMINATION OF CONTEMPORARY METHODS FOR ASSESSING COMPENSATION IN NIGERIA
M. O. AJIBOLA
Corresponding Author Department of Estate Management, School of Environmental Sciences, College of Science and Technology, Covenant University, Ota, Nigeria
E-‐mail: [email protected] Tel.: + 234 (0) 802 3029 220
T. O. OSOTA
Department of Estate Management, School of Environmental Sciences, College of Science and Technology, Covenant University, Ota, Nigeria
E-‐mail: [email protected] Tel.: + 234 (0) 803 9240 389
S. A. OLOYEDE
Department of Estate Management, School of Environmental Sciences, College of Science and Technology, Covenant University, Ota, Nigeria
E-‐mail: [email protected] Tel.: +234 (0) 803 4722 469
ABSTRACT The issue of compensation and how it is determined under the provisions of the Land Use Act of 1978(LUA) and its application has been a major source of concern to professionals, academia in the real estate sector and Nigerians at large. This study examined the application of contemporary (environmental) valuation methods like contingent approach to determining compensation. One hundred and twenty (120) questionnaires were administered on claimants in Owiwi community whose farmlands and/or buildings were acquired for constructing the dam. Also questionnaire were administered on the eighteen (18) registered Estate Surveyors and Valuers in Ogun State. Both descriptive and inferential statistical tools were used in analysing the data collected from the respondents. The study revealed that the conventional approaches provided for by the statutes only captured the use values at the expense of non use values. The study therefore recommended a review of the statutes and the adoption of contingent valuation method for compensation valuation.
Keywords: Compensation, Contingent, Environmental Valuation, Ewekoro, Owiwi,
INTRODUCTION Compulsory acquisition is the power of government to acquire private rights in land without the willing consent of its owner or occupant in order to benefit society. This power is often necessary for social and economic development and the protection of the natural environment. Compensation on the other hand, whether in financial form or as

Business and Social Sciences Review (BSSR) Vol . 1, No . 9, (Mar -‐ 2012) www.bssreview.org ISSN: 2047-‐6485
5
Copyright © 2012 – Society of Business and Social Sciences
replacement land or structures, is at the heart of compulsory acquisition and it is necessary when compulsory acquisition has been carried out by a statutory body. The issue of compensation and how it is determined under the provisions of the Land Use Act of 1978(LUA) and its application has been a major source of concern to professionals, academia in the real estate sector and Nigerians at large. The provisions under the Land Use Act as regards valuation for compensation has been arguably critiqued and criticised as inequitable, inadequate, inflexible and ineffective, thus, posing big problem to the Nigerian economy and leaving an average Nigerian with little or no choice at all in the issue of compensation, especially those whose interests were acquired. Valuation for compulsory purchase and payment of compensation in Nigeria is a statutory valuation. In other words, the enabling statute provides the basis and method of valuation, which many scholars including Omuojine (1999) and Adisa (2000) have argued are inadequate. However in recent times, contemporary valuation methods have been developed, that can be used to determine compensation to be paid on acquired interest by valuing both the use and non use values of natural resources using the total economic value concept, and environmental valuation methods such contingent valuation, hedonic pricing, etc. This study, therefore, explores the application of environmental valuation methods in assessing compensation on Owiwi Dam Project (Federal Government Project) that involved the acquisition and compensation of land within Owiwi community.
THE STUDY AREA The study area is Owiwi community where the Owiwi earth dam was constructed on Owiwi River; it is located along Lagos/Abeokuta Expressway in Ewekoro Local Government Area of Ogun State, Nigeria. The study area comprises nine villages: Akinbiye, Ikalugbase, Kemta Agbogunmagbin, Olupona, Ikereku, Abese, Ijumo Olokunlatan, Arigbanla and Adeyori communities, all in the Ewekoro Local Government Area of the State. It has a land area of about 594 km² and is bounded by Yewa South in the West, Ifo Local Government in the South, Abeokuta North and Obafemi Owode in the North and East respectively. The headquarters of the Local Government Area is Itori town (6°56′00″N 3°13′00″E/ 6.9333333°N 3.2166667°E). The indigenous dwellers of this Local Government Area are mainly the Egbas, particularly the Egba Owu (Wikipedia, 2010). Crop and fish farming are the primary occupations of the indigenes of the local government, trading activities is also common among the people, since it is basically a rural settlement and thus, most of the land acquired by the Government were agricultural farmlands. The major food crops include rice, maize, cassava, yam and banana, and the main cash crops include cocoa, kola nut, palm oil, and palm kernels. Limestone is the major mineral resource found in the Local Government and this served has a major source of economic development of Ewekoro (Ewekoro LGA Official Website, 2010). Going by the 2006 population census, the population of the Local Government area was 55,156 (National Bureau of Statistics Official Website, 2010).

Business and Social Sciences Review (BSSR) Vol . 1, No . 9, (Mar -‐ 2012) www.bssreview.org ISSN: 2047-‐6485
6
Copyright © 2012 – Society of Business and Social Sciences
Owiwi Dam Project was constructed on Owiwi River at Owiwi community along Lagos/Abeokuta Expressway, Ogun State. Prior to the construction of the dam the Federal Government acquired a lot of communal and family land from the villagers under the supervision of Ogun-‐Osun River Basin Development Authority. The project is located on Owiwi River at Akinjole/Asipa in the Ewekoro Local Government Area of Ogun State. The execution of the project affected nine villages namely, Adeyori, Agbanla, Ijumo Olokun, Agbogun Magbin, Akinbiye, Olupona, Ikereku Idan, Abese and Ikalugbase. The land acquired from the villagers by the Ogun State Government for the dam site project was approximately 565.242 hectares (Bureau of Lands and Housing, Ogun State, 2010).
LITERATURE REVIEW According to Food and Agricultural Organization FAO (2008), sustainable development requires governments to provide public facilities and infrastructure that ensure safety and security, health and welfare, social and economic enhancement, and protection and restoration of the natural environment and the surest way to doing that is by acquisition of interests in landed property. Government cannot rely on land markets alone to ensure land is acquired when and where it is needed (FAO, 2008). Kuye (2009) opined that land acquisition and compensation arose due to the essential nature of land for human activities on earth, he stated that there is need for compulsory acquisition of land from a user by a statutory body for overriding public interest or public purpose, and when there is compulsory acquisition, there is usually need for compensation. He added that, what constitutes public purpose are usually defined in enabling statues of different countries, for example, public purposes are listed in section 50 (1) of the LUA. The basic principle of compensation for acquisition is that it should be fair and adequate (Kuye, 2009). Compensation is a recompense for loss and must approximate as far as possible, the money value unto which the owner might have converted his property, had the law not deprived him of it. It should restore the individual to a state where he is neither better nor worse off at the end of the revocation exercise. He further stated that any method of assessment used by the acquiring authority to determine compensation must sustain the principle of equity under which the property owner is to be left whole in terms of naira and that the requirements for the payment of compensation on acquired lands include right to compensation and social equity. In addition, Food and Agricultural Organization (2008) in a paper titled compulsory acquisition of land and compensation stated that compensation is to repay the claimants for their losses, and should be based on principles of equity, balance of interests, flexibility and equivalence. The principle of equivalence is crucial to determining compensation: affected owners and occupants should neither be enriched nor impoverished as a result of the compulsory acquisition. Financial compensation on the basis of equivalence of only the loss of land rarely achieves the aim of putting those affected in the same position as they were before the acquisition; the money paid cannot fully replace what is lost. In some countries, there is legal provision recognising this in the form of additional compensation to reflect the compulsory nature of the acquisition (FAO, 2008).

Business and Social Sciences Review (BSSR) Vol . 1, No . 9, (Mar -‐ 2012) www.bssreview.org ISSN: 2047-‐6485
7
Copyright © 2012 – Society of Business and Social Sciences
The History of Acquisition and Compensation in Nigeria Land acquisition system has been in practice in Nigeria since pre-‐colonial days, though on a minor scale, because then, land was readily available for public use. The history of land acquisition and compensation dated back to the early days of British Colonialism. Prior to that time, compensation in monetary terms was not a common practice in native communities. If there is any cause to acquire communal land in private hands for overriding community interest, the elders and high chiefs who were accredited trustees would provide an alternative farming parcel, or if building is affected, the person is given a new land and the building is erected by joint communal efforts (Kuye, 2009). During Colonial Era, before the amalgamation of the Northern and Southern Nigeria in 1914, the Colonial Nigeria was divided into colonies and protectorates where multiplicity of land tenure system existed. The arrival of the Europeans in Southern Nigeria in the later part of 19th century drastically changed the land holding system. Immediately after the cessation of Lagos to queen Victoria of Great Britain and Ireland in 1961, there was influx of missionaries, which led to the congestion of Lagos Island. This in turn, brought about the need for more land to decongest the city by way of expansion and provision of more social developments. This necessitated the pulling down of buildings and taking of private lands; this of course did not go down well with the people who protested vehemently. In order to curb the activities of these irate land owners, Ordinance No. 17 of October 1863 was promulgated which empowers the then colonial Governor to pull down affected buildings subject to payment of compensation. This became the precursor of the “Public Lands Acquisition Ordinance”, later known as the “Public Land Acquisition Act” of 3rd May, 1917 (Cap. 167 Laws of the Federation of Nigeria and Lagos). Oluwamotemi (2010) however noted that there were variations in the system of acquisition and compensation between the Southern and Northern parts of Nigeria, before the Land Use Act of 1978. In the South private ownership was the order of the day, and acquisition and compensation was guided by Cap. 167 of the laws of the Federation, whereas in the North, the State held land in trust for the people, acquisition and compensation were guided by the Land and Natives Rights Ordinance (Cap. 96), and later the Land Tenure Law of 1962. The Land Use Act unified the two-‐ tenure system. It could be seen from the above that the problem of finding land for social development by state led to the enactment of various laws relating to compulsory acquisitions and compensation. Several statutes have been enacted to regulate compulsory acquisition and compensation in Nigeria. The statutes include; Public Land Acquisition Act 197 (Cap 167 of 1958), Land Tenure Law of Northern Nigeria (CAP 59, 1962), Public Land Acquisition Miscellaneous Provision Decree 33 of 1976, State Land Resumed Decree 38 of 1968, Mineral Act Cap 350, Laws of the Federation of Nigeria 1990 and Land Use Decree No.6 of 1978 (now Land Use Act 1978, Cap202 Law of the Federation of Nigeria). The revocation and compensation provisions of the Act are contained in sec 28 and 29 (Part 5). Sec 28 provides that revocation shall be for overriding public interest as contained in the Act, while Sec 29 provides that the holder/occupier of the right of occupancy

Business and Social Sciences Review (BSSR) Vol . 1, No . 9, (Mar -‐ 2012) www.bssreview.org ISSN: 2047-‐6485
8
Copyright © 2012 – Society of Business and Social Sciences
revoked for overriding public interest shall be entitled to compensation under the following heads of claims; Land: for an amount equal to the rent, if any, paid by the occupier during the year in which the right of occupancy was revoked. (Sec 29 sub sec 4 (a), Buildings, Installations, and Improvements thereon: the amount of the replacement cost of the building, installation or improvement, that is to say, such cost as may be assessed on the basis of the prescribed method of assessment as determined by the appropriate officer less any depreciation, together with interest at the bank rate for delayed payment of compensation and in respect of any improvement in the nature of reclamation works, being such cost thereof as may be substantiated by documentary evidence and proof to the satisfaction of the appropriate officer. (Sec 29 sub sec 4 b) Crop: crops on land apart from any building, installation or improvement thereon, for an amount equal to the value as prescribed and determined by the appropriate officer. (Sec 29 sub sec 4c)
CONVENTIONAL AND CONTEMPORARY METHODS OF VALUATION Various studies had been conducted to determine whether it is possible to use the traditional approaches to valuing wetland resources (Bennett 1996; Leschine, Wellman and Green 1997). This is done; taking cognizance of the fact that majority of wetland resources are not marketed. Bennet (1996) opined that the traditional valuation tools are not applicable to valuing environmental resources because most of these tools are based on data that are observable in markets while most environmental benefits and costs are not bought or sold. In the face of this difficulty, new valuation techniques have to be devised to determine the value of environmental resources. Supporting the view that traditional approaches are inadequate for valuing wetland resources, Leschine, Wellman and Green (1997) argue that since the value of environmental resources flow from the services they provide, the traditional valuation usually results in their undervaluation. Hence, techniques that take accounts of the non-‐use values were advocated. Contributing to the criticisms against the traditional methods of valuation, Kalu (2001) observes that reliance on controlled income results in a false value for such property since the rent (income) may not necessarily represent the market rent; where adequate record is not kept on the transactions of the business, applying profit/accounts method might be impossible (this problem is common in property rating valuation, where property owners are reluctant to supply detailed information about their operation). Kalu’s criticisms against the cost/contactor’s method rest on the dangers of misconstruing cost to be value and equating them, and the problem of applying the right rate of depreciation to arrive at the depreciated replacement cost. Also, Ifediora (2005) identifies the following criticisms of the traditional methods. That real property is heterogeneous and therefore no two properties are the same thereby creating problem in adjusting the realised prices of comparables to reflect the minor differences between them and the property being valued.

Business and Social Sciences Review (BSSR) Vol . 1, No . 9, (Mar -‐ 2012) www.bssreview.org ISSN: 2047-‐6485
9
Copyright © 2012 – Society of Business and Social Sciences
The investment method looks somewhat subjective as it considers market value mainly from the prospective investor’s point of view, the indicated value from this approach rarely agrees with the achieved market price. With all the above criticisms, it is evident that current approaches to valuing real estate property is fraught with a lot of challenges how much more applying these approaches to a natural resources whose major outputs (products) are not traded in the market. With this position, there is need to adopt appropriate techniques for valuing environmental resources. The failure of the conventional approaches to truly capture the value of natural resources for compensation shows that there is need for approaches that adequately capture such value. In response, various studies had come up with methods appropriate for valuing environmental resources and these methods include Contingent Valuation Method (CVM), Hedonic Pricing, Travel Cost, Benefits Transfer, Production/Net Factor Income (NFI), Replacement Cost, Opportunity Cost and Market Prices. While most of these methods determine environmental resources using market based factors, studies have shown that contingent valuation method captures the value of environmental resources that are not determined from the open market. Therefore the study focused on the application of this method in assessing compensation.
CONTINGENT VALUATION METHOD According to Nunes (2009), contingent valuation method (CVM) as an economic, non-‐market based valuation method especially used to infer individual’s preferences for public goods, notably environmental quality. The range of environmental issues addressed include; water quality, outdoor recreation, species preservation, forest protection, air quality, visibility, waste management, sanitation improvements, biodiversity, health impacts, natural resource damage and environmental risk reductions to list but a few. FAO (2007) further posited that contingent valuation is a method of estimating the value that a person places on a good. According to FAO (2007), the approach asks people to directly report their willingness to pay (WTP) to obtain a specified good (e.g. preservation of wildlife), or willingness to accept (WTA) to give up a good (access to water resource), rather than inferring them from observed behaviours in regular market places. Because it creates a hypothetical marketplace in which no actual transactions are made, contingent valuation has been successfully used for commodities that are not exchanged in regular markets, or when it is difficult to observe market transactions under the desired conditions. Contingent valuation has proven particularly useful when implemented alone or jointly with other valuation techniques for non-‐market goods, such as the travel cost method or hedonic approaches. It remains the only technique capable of placing a value on commodities that have a large non-‐use component of value, and when the environmental improvements to be valued are outside of the range of available data (FAO, 2007)

Business and Social Sciences Review (BSSR) Vol . 1, No . 9, (Mar -‐ 2012) www.bssreview.org ISSN: 2047-‐6485
10
Copyright © 2012 – Society of Business and Social Sciences
Since its early beginnings, CVM has been used to measure benefits of a wide range of environmental goods including recreation, amenity value, scenery, forests, wetlands, wildlife, air and water quality. Venkatachalam (2004) posited that contingent valuation method is a widely used nonmarket valuation method especially in the areas of environmental cost–benefit analysis and environmental impact assessment its application in environmental economics includes estimation of non-‐use values (Walsh, Loomis and Gillman, 1984), non market use values (Chloe, Whittington and Lauria 1996) or both (Niklitschek and Leon, 1996) of environmental resources. In recent years, this method is commonly used in developing countries to elicit the individuals’ preferences for the basic infrastructural projects such as water supply and sanitation (Merrett, 2002). CVM helps in assessing the total economic value of environmental resources which in turn, helps in placing adequate figure of compensation on them.
CONCEPT OF TOTAL ECONOMIC VALUE FAO (2007) quoting Munasinghe (1993) stated that the most appropriate framework to assess the overall economic value of ecosystem or environmental goods and services is that of total economic value (TEV). This is based on the theory that environmental assets give rise to a range of economic goods and services (functions) that include direct use values, indirect use values and non-‐use values. Cavuta (2007) explained that the total economic value is not made of only the use value; it is given by the sum of use and non use values referring to intrinsic benefits, i.e. those deriving from the mere existence of environmental goods and it requires a precise distinction between use value and that of non-‐use.
Total Economic Value = Use values + Non use value Use value is derived from a concrete use of environmental goods. It comprises of direct and indirect uses (Cavuta, 2007). Ruitenbeek and Cartier (2008) posited that direct use values are produced in consequence of an immediate or mediate contact with the resource (the environmental goods). They identified two types of direct use; consumption use value and non-‐consumption use. The authors explained further that indirect use values are the regulating ecological functions carried out by the system and converged in the general categories of functions supporting life and the pollution control. In other words, they are the values derived from the use of functions provided by environmental resources. Non-‐use values are independent from any benefit linked to the use of environmental goods; these values are connected with the prolonged existence of goods, without any kind of contemporary or planned use. It comprises three types of value; option, existence and bequest value (Cavuta, 2007). He further explained the listed three types; option value is the premium that consumers are willing to pay for an un-‐utilized asset, simply to avoid the risk of not having it available in the future; the existence value is the value attributed to environmental goods by the economic subject without a link to a real or potential use, but exclusively to their mere existence and the last component of non-‐use value, bequest value, is defined as the value that an individual attributes to goods considering the use of the goods in the future by his heirs (Cavuta, 2007).

Business and Social Sciences Review (BSSR) Vol . 1, No . 9, (Mar -‐ 2012) www.bssreview.org ISSN: 2047-‐6485
11
Copyright © 2012 – Society of Business and Social Sciences
The figure below illustrates the total economic value concept:
Fig 2.2 Total Economic Value Concept Source: Dixon, 2008
RESEARCH METHODS This research was conducted using survey, cross sectional and descriptive methods of research design. This was done by administering questionnaires on one hundred and twenty (120) claimants in Owiwi community whose farmlands and/or buildings were acquired for constructing the dam. Also questionnaire were administered on the eighteen (18) registered Estate Surveyors and Valuers in Ogun State, where the dam is located. In addition to questionnaire, the study also used literature on land acquisition and compensation. These include the 1999 Nigerian Constitution and the land Use Act of 1978. Finally the research conducted reconnaissance survey on the study area so as to ascertain the physical features and existing situation in Owiwi community. This was done by the researchers to familiarise them with the study area. The study used both descriptive and inferential statistical tools (frequency tables and percentages, and relative importance index) in analysing the data collected from the respondents.
DATA ANALYSIS AND DISCUSSION In this section the data collected were collated and analysed with the discussion of the each of the table following. Statistical Package for Social Sciences (SPSS) version 17.0 was used for coding and analysis. One hundred and twenty (120) questionnaires were administered on the villagers/claimants, while eighteen (18) questionnaires were administered on the Estate Surveyors and Valuers within the study area. In addition, personal interview was also conducted on both the claimants and Estate Surveyors working with the acquiring authority to get more information on the case study.
Total Economic Value
Use Values
Direct Use Values
Usually measures Output
Indirect Use Values
Usually measures benefits and
services
Non Use Values
Option Value
Bequest Value
Existence Value

Business and Social Sciences Review (BSSR) Vol . 1, No . 9, (Mar -‐ 2012) www.bssreview.org ISSN: 2047-‐6485
12
Copyright © 2012 – Society of Business and Social Sciences
Table 1 Questionnaire Administration and Retrieval Respondents Questionnaires
Administered Questionnaires Retrieved
Percentage Achievement
Claimants/Villagers Estate Surveyors Total
120 18 138
100 18 118
83.3 100.0 85.5
Source: Author’s Field Survey, 2011
The responses gotten from the questionnaires administered were as shown in Table 1. The Table reveals that all questionnaires (100%) administered on the Estate Surveyors and Valuers were retrieved. The result obtained from the analysis above is not unexpected because the sample size of the registered Estate Surveyors and Valuers within the study area is small (18). On the other hand, out of the 120 questionnaires administered on the claimants 83.3% were retrieved this was used for the study. Overall, 85.5% of questionnaires administered on the two groups of respondents were retrieved.
Table 2 Academic Qualification of Estate Surveyors and Valuers Academic
Qualification Frequency Percentage PhD 1 6.0 M. Sc 5 28.0 B. Sc 6 33.0 HND 6 33.0 Total 18 100.0 Source: Author’s Field Survey, 2011
Table 2 contains the various academic qualifications of the respondent Estate Surveyors and Valuers. The table shows, 6 % of the Estate Surveyors have Ph. D, 28% have M. Sc. while 33% have B. Sc and HND each. It could be deduced from the table that all the respondents are academically qualified, and are competent enough to supply reliable and up to date data needed for the study. Table 3 Professional Qualification of Estate Surveyors and Valuers
Professional Qualification Frequency Percentage Fellow 4 22.0 Associate 14 78.0 Total 18 100.0
Source: Author’s Field Survey, 2011 Table 3 shows the professional qualification of respondent Estate Surveyors and Valuers. From the Table, 22% of the Surveyors are Fellows of the Nigerian Institution of Estate Surveyors and Valuers (NIESV) and 78% are Associates members. The import of the result is that all the respondent Estate Surveyors and Valuers are corporate members of the Institution whose opinion of value can be relied upon.

Business and Social Sciences Review (BSSR) Vol . 1, No . 9, (Mar -‐ 2012) www.bssreview.org ISSN: 2047-‐6485
13
Copyright © 2012 – Society of Business and Social Sciences
Table 4 Occupation of Claimants
Occupation Frequency Percentage Fishing 5 5.0 Civil Servant 12 12.0 Farming 58 58.0 Private Sector 10 10.0 Trader 15 15.0 Total 100 100.0
Source: Author’s Field Survey, 2011 The data retrieved from the field on the occupation of the claimants is contained in table 4 above. It shows that 58% of the respondents are farmers, 12 % are civil servants, 15% are traders 10% are in the private sector and 5% are fishermen. This implies that 63% (fishing and farming) of the claimants relied on the natural resources for their survival (i.e. farmland and the Owiwi River). This result is not unexpected because in primary occupation of most villagers in the study is farming. Table 5 Type of Property Acquired
Type of Property Frequency Percentage Bare Land 8 8.0
17.0 Land and Buildings 17 Farmland (crop and economic
trees) 23 23.0
Farmland and Buildings 52 52.0 Total 100 100.0
Source: Author’s Field Survey, 2011 Table 5 shows the type of property that was acquired from the claimants. From the table farmland and buildings were acquired from 52% of the claimants, farmland (crop and economic trees) only was acquired from 23% of the claimants, land and building were acquired from 17% of the claimants, while bare land was acquired from 8% of the claimants. This result is not unexpected since more than half of the villagers are farmers. Table 6 Level of Awareness on Environmental Valuation Methods for Compensation
Environmental Valuation Frequency Percentage
Contingent Method Benefits Transfer
No Idea Total
5 4 9 18
28.0 22.0 50.0 100.0
Source: Author’s Field Survey, 2011 Table 6 shows half of the respondent Estate Surveyors and Valuers had no idea about environmental valuation methods that can be used for compensation purposes. While 28 % of the Estate Surveyors and Valuers were of the opinion that contingent valuation method

Business and Social Sciences Review (BSSR) Vol . 1, No . 9, (Mar -‐ 2012) www.bssreview.org ISSN: 2047-‐6485
14
Copyright © 2012 – Society of Business and Social Sciences
is the most appropriate method for assessing compensation, 22% believed that benefits transfer method is appropriate for compensation valuation. The situation contained in the table could be due to the fact that environmental valuation is just finding its way into the curriculum of the most institutions in the country. Based on the Table, it could therefore be concluded that contingent valuation method is the most appropriate method for assessing compensation. Table 7 Non Use Values Claimants would like to be compensated for
Other Non Uses Responses Frequency Percentages Aesthetics
Disturbances
Historical Heritage
Goodwill
Yes No
Yes No
Yes No
Yes No
56 44 58 42 70 30 53 47
56.0 44.0
58.0 42.0
70.0 30.0
53.0 47.0
Source: Author’s Field Survey, 2011 Table 7 shows that claimants desired to be compensated for non use goods and services provided by the natural environment in addition the heads of claims recognised by the statutes and are valued using market determined approaches. The table reveals that the claimants want to be compensated for historical heritage (70%), disturbances (58%), aesthetics (56%) and goodwill (53%). This result is not unexpected, since the claimants are all villagers and most of them inherited the properties from their ancestors and such properties have been passed down their families and lineage for years and thus they have historical attachment with the acquired properties. This result also implies that dispossessed owners will like to be compensated for non use values of their properties, which indicates a need for contingent valuation method.
CONCLUSION AND RECOMMENDATIONS Various criticisms had trailed the adequacy of compensation paid on government acquisition. Such criticisms include the methods adopted for the determining the compensation. The use of traditional/conventional methods for compensation valuation did not adequately capture the use values not to talk about the non use values provided by natural resources. This inadequacy provides avenue for employing contemporary methods of valuation such as contingent valuation method which has been adjudged the only method that captures both use and non use values of natural resources. Having consideration to the fact that compensation valuation is a statutory valuation in Nigeria, there is need for a review of the various statutes relation to compensation in the country.

Business and Social Sciences Review (BSSR) Vol . 1, No . 9, (Mar -‐ 2012) www.bssreview.org ISSN: 2047-‐6485
15
Copyright © 2012 – Society of Business and Social Sciences
REFERENCES Adisa, S. Y. (2000). Conflict of Laws: The Valuers dilemma in Compensation for Land Acquisition. Estate Surveyors and Valuers, Vol. 23, No. 4, pp 53-‐59 Atkinson, G and Mourato, S. (2007). Environmental Valuation: A Brief Overview of Options. Being a paper presented at the Fifth Milan European Economy Workshop, with the theme Economics of European Integration. Milan, 26-‐27 March 2007 Cavuta, G. (2007) Environmental Goods Valuation: The Total Economic Value. University of Chieti -‐ Pescara, “G. D’Annunzio”, Italy. Available on http://www.openstarts.units.it/dspace/bitstream/10077/860/1/e7cavuta.pdf. Retrieved on the 11th of January 2011. Chloe K. A, Whittington D and Lauria D.T. (1996) The Economic Benefits of Surface Water Quality Improvements in Developing Countries: A Case Study of Davao, Philippines. Land Economics. Vol 72, pp 107–126 Dixon, J. A (2008) Environmental Valuation: Challenges and Practices (A Personal View). Being a paper presented at the Conservation Strategy Fund Conference, with the theme Economics and Conservation in the Tropics: A Strategic Dialogue, January 31 – February 1, 2008 Ewekoro Local Government Website, (2010) http://ogunstate.gov.ng/eGovernment/index.php?option=com_content&view=article&id=112&Itemid=115. Retrieved on the 15th of October, 2010. F G N, (1978) Decree No. 6 – Land Use Decree 1978, official Gazette No. 14, Vol. 65 Food and Agricultural Organization (2007) Socio-‐Economic Assessment and Economic Valuation of Egypt’s Mangroves. Available on http://www.fao.org/docrep/007/ae212e/ae212e03.htm. Retrieved on the 11th of January 2011. FAO, (2008). Compulsory Acquisition of Land and Compensation, Food and Agriculture Organization of the United Nations Rome. Electronic Publishing Policy and Support Branch Communication Division – FAO. Ifediora, B. U. (2005) Valuation Mathematics for Valuers and other Financial and Investment Analysts. Immaculate Publications Limited. Enugu. Kalu, I. U. (2001) Property Valuation and Appraisal. Bon Publications, Owerri. Merrett, S. (2002) Deconstructing Households: Willingness-‐To-‐Pay for Water in Low-‐Income Countries WaterPolicy. Vol 4, pp 157 –1 72

Business and Social Sciences Review (BSSR) Vol . 1, No . 9, (Mar -‐ 2012) www.bssreview.org ISSN: 2047-‐6485
16
Copyright © 2012 – Society of Business and Social Sciences
National Bureau of Statistics, (2010). http://www.nigerianstat.gov.ng/nbsapps/Connections/Pop2006.pdf retrieved on the 6th of November, 2010. Olusegun, K. (2009). Principles and Practice of Property Valuation. Olusegun Kuye & Associates, Lagos. Oluwamotemi, D. (2010). Land Acquisition, Compensation and Resettlement in Developing Economies –Nigeria as a Case Study. Being a paper presented at the FIG Congress 2010, with the theme: Facing the Challenges – Building The Capacity. Sydney, Australia. 11-‐16 April, 2010 Omuojine, E. O. (1999) The Land Use Act and the English Doctrine. Estate Surveyors and Valuers. Vol. 22, No. 3, Pp 54-‐56 Ogun State Official website, (2010) http://www.ogunstate.gov.ng/Government/index.php retrieved on the 15th of October, 2010. Ruitenbeek, J and Cartier C. M (2008) Environmental Valuation and SEEA: A Practical Approach to the Use of Environmental Economic Valuation in SEEA Decision-‐Making Frameworks in BC. Being a Final Report Prepared for Strategic Land Policy and Legislation Branch Crown Land Administration Division Ministry of Agriculture and Lands 780 Blanshard Street, 1st floor Victoria, Canada Venkatachalam, L. (2004). The contingent valuation method: A Review. Environmental Impact Assessment Review pp 89–124. Available on www.elsevier.com/locate/eiar. Retrieved on the 11th of January2011 Wikipedia Online Encyclopedia, (2010) Ewekoro Local Government Available on http://en.wikipedia.org/wiki/Ewekoro. Retrieved on the 15th of October, 2010

Business and Social Sciences Review (BSSR) Vol . 1, No . 9, (Mar -‐ 2012) www.bssreview.org ISSN: 2047-‐6485
17
Copyright © 2012 – Society of Business and Social Sciences
A CONCEPTUAL MODEL OF TOP MANAGEMENT EXTERNAL TIES ON STRATEGIC CHOICE: THE MODERATOR OF FIRM PERFORMANCE
Bau-‐Jung Chang
Department of Business Administration, Feng Chia University Email: [email protected]
ABSTRACT
Prior research on Top Management Teams (TMTs) has shown the influences of attitudes and demographics of TMTs on strategic choice and performance. However, the role of boundary spanning of TMTs has been overlooked in the research. Furthermore, relatively little research has investigated how TMTs seek information by external ties in declining situations, such as poor performance or bankruptcy. To bridge the research gap, this study draws on behavior decision-‐making and social network perspectives to study the role of external ties of TMTs in the condition of declining performance. Hypotheses and conceptual framework have been developed, and implication and conclusions are also elaborated in this study.
Keywords: Top Management Teams, Strategic Choice, Internal and External Ties
INTRODUCTION Since Top Management Teams (TMTs) are critical to decision making, fundamental organizational literature, such as Barnard (1938), March and Simon (1958) and Cyert and March (1963), have delivered insight into the role of TMTs in decision making. The upper echelon perspective has extended the theme of behavior decision making and articulated a model that top executives play a pivotal role in shaping major organizational outcomes. In this model, Hambrick and Mason (1984) emphasize the linkage among upper echelon characteristics, strategic choices, and performance based on cognitive processes and induce numerous studies employ this model into empirical test. Yet, since this perspective is most relevant to static efficiency and the underlying upper echelon is a linear one (Carpenter, Geletkanycz, and Sanders, 2004), it is likely to be insufficient for our understanding about decision making with complexity in the reality. Nevertheless, regarding the role of TMTs, Barnard (1938) notes that senior managers operate in a social context that spans organizational boundaries, and up to 50 percent of executive time and effort is spent in boundary-‐spanning interaction (Mintzberg, 1973). Additionally, executive boundary spanning activities are of the consequence to strategic formation and implementation (Kotter, 1982). The information exchange between interorganizational relationship and the strategic and social needs to interact with external ties may impact organizational outcomes. However, little research has considered the role of external ties of TMTs in influencing strategic choice. On the other hand, as we recognize that a firm’s top management team serves as critical role of strategic decision making, they take on particular importance during periods of declining performance (Mueller and Barker, 1997). In the periods of declining performance, the information scanning and searching behavior of firms might differ from

Business and Social Sciences Review (BSSR) Vol . 1, No . 9, (Mar -‐ 2012) www.bssreview.org ISSN: 2047-‐6485
18
Copyright © 2012 – Society of Business and Social Sciences
regularity. Firms would increase social consideration when confronting uncertainty (Meyer and Scott, 1983) or facing poor performance. Executives assign greater weights to information and advice from personal sources such as informal conversations with colleagues in making strategic decisions (Mintzberg, 1973; Elenkov, 1997). Even so, different sources of information may reveal distinct information and induce heterogeneous cognitive bases in the process of strategic choice. The purpose of this study is to bring TMTs into strategic choice, specifically emphasizes the role of external ties of TMTs in the poor performance condition. This study argues that different sources of external ties should have distinct influences on strategic choice, and the strength of this relationship might differ in the condition of declining performance. This paper is structured as follows. First, this study briefly reviews the behavior decision making and upper echelon literatures, which conduct the role of TMTs in strategic decision making. Next, literatures on external ties and decline responses in organizations are also reviewed. Additionally, this study develops hypotheses based on theoretical perspectives and demonstrates a conceptual framework. In the final section, conclusions and discussions are also elaborated.
THEORETICAL BACKGROUND
The role of Top Management Teams in strategic choice The main theme of behavior decision making is to resolve the question-‐ why do organizations act as they do? To unravel the process of decision making, researchers demonstrate decision making and strategic choice have a large number of behavior components, then these strategic choice reflect the idiosyncratices of decision makers. They argue each decision maker brings his/her own set of given to an administrative situation (March and Simon, 1958; Cyert and March, 1963), and these gives include individual decision maker’s cognitive and value base. Decision makers selectively perceive only a limited number of available cues and adopt simplified models of reality (Simon, 1976). Thus, the theorists of behavior decision making perspective view that complex decisions are largely the outcome of behavior factors, such as bounded rationality, multiple and complicating goals and uncertainty avoidance (March et al. 1958; Cyert et al. 1963), and strategic decisions are the result of behavior factors rather than the result of techno-‐economic and rational optimization. Further upper echelons research base on behavior factors and focus on the influence of top management teams’ characteristics on organizational outcomes (Hambrick and Mason, 1984). These researchers argue who makes the decisions matter and built a model of decision making process within a firm. In the model, they begin with cognitive aspect in terms of information filtering, value, and personality of top executive (Finkelstein and Hambrick, 1996).

Business and Social Sciences Review (BSSR) Vol . 1, No . 9, (Mar -‐ 2012) www.bssreview.org ISSN: 2047-‐6485
19
Copyright © 2012 – Society of Business and Social Sciences
Upper echelons theorists state that top executive play a pivotal role in shaping organizational outcome-‐ strategic choices and performance level (Hambrick et al. 1984). Based on researches of behavior decision making, upper echelons perspective emphasize executive cognitions, values, and perceptions and their influence on the process of strategic choice and resultant performance outcomes. A notable point of upper echelons perspective is that the scholars employ demographics of top executives to be reasonable proxies of cognitions, value, and perceptions owing to they are difficult to measure. The observable characteristics of top executives include age, other career experiences, education, and group characteristics (Hambrick et al. 1984). Building largely on the conceptual arguments of behavior decision making and the role of top management team (Cyert et al. 1963; Child, 1972; Hambrick et al. 1984), researchers have found considerable empirical support for the view that organizational profiles reflect the characteristics and processes of senior management. A number of research engage in empirical test of Hambrick and Mason’s model and later attract more researchers combining other disciplines into this field, such as agency theory. While the entire top management team has been studied for its effect on strategic actions, the chief executive officer (CEO) has the primary responsibility for initiating and implementing strategic choice in an organization (Tushman and Romanelli, 1985). This aspect emphasizes the importance of monitor, control, and incentive toward CEO and acquires more characteristics of CEO into strategic choice, such as TMT’s tenure and compensations. In addition, this approach also discusses the role of board of directors and brings it into decision making process. Upper echelon researchers bring insight into the role of top management team on strategic choices, however, this perspective is relevant to the static condition and endogenous factors which ignore time factor (Carpenter et al. 2004). Additionally, although behavior theory notes that top management team would build channel and rely on external referents when they face uncertainty and minimize search cost (Cyert et al. 1963), the theory pays more attention on the mental model (cognition, value and perception) of decision making and overlook discussing how firms obtain alternative information and the interaction with external entities. External ties of top management teams Past research shows that individuals who perform boundary spanning roles are considered influential, or gatekeepers, by their peers (Tushman, 1977; Tushman and Scanlan, 1981). Boundary spanner is an important role of information exchange between boundaries. Barnard (1938) notes that senior managers operate in a social context that span organizational boundaries, and up to 50 percent of executive time and efforts are spent on boundary-‐spanning interactions (Mintzberg, 1973). Additionally, executive boundary spanning activities are of the consequence to strategic formation and implementation (Kotter, 1982). Several literatures suggest the external ties of TMTs are seen as important conduits for information and social exchange. In other words, these linkages reveal some benefits and reflect decision makers’ need to link and interact with external entities. Two

Business and Social Sciences Review (BSSR) Vol . 1, No . 9, (Mar -‐ 2012) www.bssreview.org ISSN: 2047-‐6485
20
Copyright © 2012 – Society of Business and Social Sciences
causes can present why firms build external ties and how external ties matter: strategic needs revealing information acquirement and social needs exhibiting the power and legitimacy acquirement. Strategic needs Based on March and Simon (1958) and Cyert and March (1963), the organizational decision making process is a series of mental model involves cognition, value and perception of decision maker. Because of bounded rationality, decision maker limited to obtain all alternative decisions and information. In order to minimize searching cost, decision makers will search for external referents and build channel to obtain more information (Cyert et al. 1963). At the same time, decisions makers look to their counterparts and construct the logic for their own immediate context by rely on the experiences, definitions and interpretations on similar contexts by their counterparts. Furthermore, when decision makers in the face of high uncertain environment or decision conditions, they contend for turning to external referents for cues on appropriates of action. Through these linkages and interactions with outside entities, decision makers may understand the payoff structure of adoption some practices or new technologies. The revealing information of external ties facilitates firms to adopt more appropriate practices and derive important insight into their external context. Social needs The second theme emphasizes the social aspect of interpersonal interaction. All actions, including economic actions, are embedded in a social fabric of opportunities to interact (Granovetter, 1992). Interaction is likely to happen among people who know on another or especially the “friends”. These personal relationships, such as friends, classmates or coworkers, based on deepening awareness, trust, and commitment among parties and creating future opportunities for interaction and cooperation. Largely early work on social aspect of interaction is based on resource dependence theory (Pfeffer and Salancik, 1978; Pfeffer, 1988). According to this theory, organizations are the primary social actors and that intercorporate relations can be understood as a product of patterns of interorganizational dependence and constraint. Thus, intercorporate relations will be pursued to reduce constraints on profit (Burt, 1983). In order to manage the external dependences and constraints, organizations tend to build different patterns of intercorporate relations, such as board interlock, merger, and joint venture (Pfeffer, 1988). On the other hand, new institutional theorists view external ties serving as conduits for social influence and promoting the diffusion of view and practices across firms. New institutional theorists suggest that decision makers should increase social consideration when confronting uncertainty (Meyer et al. 1983). The uncertain consequences of adapting poorly-‐understood organizational technologies induce organizations to follow previous actors’ decision and practices to obtain legitimacy (DiMaggio and Powell, 1983). Through common language, shard experiences, and professional networks, the practices are spread in the organizational field and become an acceptable institution (DiMaggio et al. 1983).

Business and Social Sciences Review (BSSR) Vol . 1, No . 9, (Mar -‐ 2012) www.bssreview.org ISSN: 2047-‐6485
21
Copyright © 2012 – Society of Business and Social Sciences
External ties of TMTs and Strategic choice Although several studies have paid attention to address that interorganizational relationship attributes to strategic and social needs and this relationship contributes to firms’ strategic choice, existing research on external ties almost focus on directorship linkages. The narrow attention ignores the fact that firms have many other ties of interorganizational relationships (Haunschild, 1994). Recently, social network perspective addresses that information can be obtained through strong ties and weak ties (Granovetter, 1973) and structural holes (Burt, 1992). Granovetter (1973) conceptualize that strong ties characterize a dense cluster of actors who are all mutually connected to each other. On the other hand, weak ties enable the discovery of opportunities because they serve as bridge to new and different information. Nevertheless, frequency of interaction, which Granovetter (1973) employed to conceptualize information exchange and interaction, may be insufficient for explanation of information exchange in reality. Burt (1992) proposes the concept of “structural holes” by extending Granovetter’s (1973) idea and asserts that it is not so much the strength or weakness of a tie that determines its information potential, but rather whether a structural hole exists between a focal actor’s contacts. The position of network determines the quantity of information exchange in this connection. Large research on social network focus on the frequency of interaction that Granovetter (1973) proposed or the position in the network that Burt (1992) noted; however, whom firms interact with may provide insight in the strategic decision making since the practices, valued information, and the assumptions of environment context are different across industry boundaries. In other words, the sources of referents reveal distinct information for decision making in different competitive field. Decision makers should increase social consideration when confronting uncertainty (Meyer et al. 1983), specifically when facing poor performance or bankrupt. Nevertheless, few studies emphasize the interorganizational interaction in crisis condition. Additionally, studies which focus on external ties of TMTs in declining performance are rare. This is the research question this paper attempt to inquire. Declining performance responses of TMTs in strategic choice We are generally recognize that a firm’s top management teams serve as critical role of strategic decision making; furthermore, they take on particular importance during periods of declining performance (Mueller et al. 1997). Under declining performance condition, firms may engage in strategic changes to overcome the crisis. Several studies focus on the change of CEO under declining condition and report that firms have successfully implemented turnarounds are generally those who have hired outside TMTs (O'Neill, 1986). Besides, some studies demonstrate other strategies for recovery such as product line change (Slatter and Lovett, 1999). To date, empirical turnaround research has primarily focus on the efficiency of specific recovery strategies rather than the processes that TMTs employ to formulate or implement those strategies (Lohrke, Bedeian, and Palmer, 2004).

Business and Social Sciences Review (BSSR) Vol . 1, No . 9, (Mar -‐ 2012) www.bssreview.org ISSN: 2047-‐6485
22
Copyright © 2012 – Society of Business and Social Sciences
Beyond the studies of demographics of TMTs in declining condition, such as functional background and TMTs’ tenure, research in behavior decision making provide insight toward TMTs’ behavior and cognitive base and might suit the discussion of crisis responses. There are two opposite reactions posited this situation: crisis as the Mother of rigidity and crisis as the Mother of innovation (McKinley, 1993). In the first theoretical perspectives, threat-‐rigidity theorists demonstrate that the poor performance promotes top management teams to reduce information processing activities thus decreases their consideration of strategic alternatives (Staw, Sandelands, and Dutton, 1981). This point notes that centralization of decision making can response to poor performance and decrease the communication between lower-‐level managers and top managements. Thus, the restriction in information processing comes out the rigidity of strategic choice and become organizational inertia. On the contrary, the researchers in behavior theory of the firm (Cyert et al. 1963) and prospect theory (Kahneman and Tversky, 1979) suggest that poor performance promotes top management team to search for ways to improve firm performance. Based on behavior theory of the firm, researchers note that performance aspirations exceed a firm’s anticipated performance levels, a TMT will intend to change normal operational routines at present and make effort to enhance performance (March and Shapiro, 1987). Furthermore, prospect theory researchers demonstrate that decision makers interpret and react to expected performance outcomes depending on whether a loss or gain is anticipated (Kahneman et al. 1979). Relative to status quo, when decision makers face with a loss, top management team will become more risk seeking as a means of loss avoidance (Kahneman et al. 1979). In this condition, poor performance would provide opportunities to innovate or to take risky moves. Although the two perspectives make distinct predictions, empirical evidences show mixed support for these propositions. Furthermore, most research emphasizes on psychological attributes of TMTs when face poor performance and pay less attention to the interconnection aspect. External sources have become a channel and referent when TMTs make decisions, especially in the face of poor performance and crisis. Research on decision making has shown that executives make greater weight to information and advice from personal sources rather than impersonal ones. As a result, social ties of TMTs should play a significant role in strategic choice in general and especially in poor performance context. In the following, I address my argument by developing several hypotheses drawing from behavior decision making, social network, and highlight these relationships in the declining condition.
HYPOTHESES
External ties constitute important channels for the transfer of information and social influence that facilitate shaping decision makers’ frame of reference. Granovetter (1973) proposed that personal contact may alternately reinforce existing perspectives and insights or may expose actors to novel ideas and opportunities. In his argument, different personal ties will reveal distinct information and social influence. Ties to entities within the firm’s

Business and Social Sciences Review (BSSR) Vol . 1, No . 9, (Mar -‐ 2012) www.bssreview.org ISSN: 2047-‐6485
23
Copyright © 2012 – Society of Business and Social Sciences
industry subject executives to an abundance of information about common to the industry, while ties to entities outside the industry impact more novel information and exposure to diverse profiles and practices. Intra industry ties which link to entities operating within the same competitive field facilitate interaction among managers when facing the similar conditions in decision making. Within the same competitive and industrial field, executives shared common views regarding the similar conditions. Through similar experiences as operating or dealing with decisions in the same industry, the commonality of cognition and perspective emerged. A comparable homogeneity in the same industry is fostered by executives’ reliance on common sources of industry information (Hambrick, 1982). Hence, the tendency for shared industry views and linkage with social interaction comes out the likelihood that intra industry ties may induce executives’ strategic choice tending to be conformity. The shared recipes in the same industry through social interaction facilitate information diffusion and thus make similar strategic choice. Thus we hypothesize:
Hypothesis 1: A top management team’s intra industry ties will be positively related to
strategic conformity. Extra industry ties which means the linkage to entities operating outside firms’ competitive field should promote firms formulating strategies deviate from common practices in the industry on the contrary. Social interactions among entities who perform in different competitive field would have different assumptions regarding the environment context and thus reveal new views and practices to the focal firm. The views of these firms about the environment, business practices, and goal setting are distinct among firms which operating in the different industry. As a result, executives would obtain more novel information through extra industry interaction due to they have divergent experience and environment assumptions. Thus, extra industry ties provide an opportunity to acquire insight into the action which beyond the common industry practices. We hypothesize: Hypothesis 2: A top management team’s extra industry ties will be negatively related to
strategic conformity. Executives categorize each other according to their primary industry of employment (Lorsch, 1989; Porac, Wade, and Pollock, 1999). Moreover, employment in the same industry provides an important basis for social identification among managers, and individuals’ primary industry of employment is a salient basis for in-‐group identification among corporate directors (Porac, Thomas, and Baden-‐Fuller, 1989; Westphal and Milton, 2000). Social psychological research suggests that in-‐group members are seen as having greater expertise than out-‐group members (Brewer and Brown, 1998). In addition, research in threat-‐rigidity response represents that decision makers will rely heavily on past decision routines, restricting outside information flow, and escalating commitment to failing strategies (Milliken and Lant, 1991). Moreover, relative poor performance can

Business and Social Sciences Review (BSSR) Vol . 1, No . 9, (Mar -‐ 2012) www.bssreview.org ISSN: 2047-‐6485
24
Copyright © 2012 – Society of Business and Social Sciences
promote TMTs to seek more advice from executives of other firms who are their friends or similar to them (McDonald and Westphal, 2003). This is due to organizational rigidity and social cognition about referents when facing decline or crisis. Thus, under poor performance condition, the relationship between intraindustry ties and strategic conformity should be enhanced in the poor performance condition. Firms will seek information within in-‐group members who have similar experience or expertise about the condition in the same industry and make strategic convergence. Hence: Hypothesis 3: Poor performance will enhance the relationship between intraindustry ties and
strategic conformity due to rigidity. Cyert and March (1963) posits that a firm’s decline will promote executives to search for ways to improve firm performance. This condition will change top management team’s behavior on environment scan and search. Specifically, when a top management team’s performance aspirations exceed a firm’s anticipated performance levels, a top management team is expected to change its normal operational routines in an effort to enhance performance (March et al. 1987). Furthermore, prospect theory research demonstrates that decision makers interpret and react to expected performance outcomes depending on whether a loss or gain is anticipated (Kahneman et al. 1979). Relative to status quo, when decision makers face with a loss, top management team will become more risk seeking as a means of loss avoidance (Kahneman et al. 1979). Thus, firm should search new information and opportunity and thus innovation or new routines may emerge when firm faced poor performance. On the other hand, according to social network perspective, new information is obtained through casual acquaintances (weak ties) rather than through close personal friends (strong ties) (Granovetter, 1973). Executives gain exposure to varied information and perspectives through extraindustry interaction. As a result, extraindustry ties are likely to provide new information and make firms employ a different set of competitive practices. Thus, poor performance should strengthen the relationship between extraindustry ties and strategic conformity resulted from searching new information and new opportunities. We hypothesize: Hypothesis 4: Poor performance will enhance the relationship between extraindustry ties and
strategic conformity due to innovation.
IMPLICATION AND CONCLUSION Since top management teams are critical to decision making, this study brings external ties of TMTs into strategic choice, specifically emphasizes the role of external ties in the poor performance condition. This study argues that different sources of external ties should have distinct influences on strategic choice, and the strength of this relationship might differ in the condition of declining performance. Based on behavior decision making, social network, and declining performance responses literatures, this study integrates previous studies and develops several hypotheses. This study may not only pay more attention on

Business and Social Sciences Review (BSSR) Vol . 1, No . 9, (Mar -‐ 2012) www.bssreview.org ISSN: 2047-‐6485
25
Copyright © 2012 – Society of Business and Social Sciences
the external ties of TMTs and the influence of external ties on strategic choice, but also demonstrate the importance of external ties in declining performance.
REFERENCES
Barnard, C. I. 1938. The Functions of the Executive. Cambridge, MA: Harvard University Press.
Brewer, M. B. and Brown, R. J. 1998. Intergroup Relations In D.T.Gilbert & S.T.Fiske, (Eds.),
The Handbook of Social Psychology: 554-‐594. Boston: McGraw-‐Hill. Burt, R. S. 1992. Structural Holes: The Social Structure of Competition. Cambridge, MA:
Harvard University Press. Burt, R. S. 1983. Corporate Profits and Cooptation. New York: Academic Press. Carpenter, M. A., Geletkanycz, M. A., and Sanders, W. G. 2004. Upper Echelons Research
Revisited: Antecedents, Elements, and Consequences of Top Management Team Composition. Journal of Management, 30(6): 749-‐778.
Child, J. 1972. Organizational Structure, Environment and Performance: The Role of
Strategic Choice. Sociology, 6: 1-‐22. Cyert, R. M. and March, J. G. 1963. A Behavioral Theory of the Firm. New Jersey: Prentice
Hall, Inc. DiMaggio, P. J. and Powell, W. W. 1983. The iron cage revisited: Institutional isomorphism
and collective rationality in organizational fields. American Sociological Review, 48: 147-‐160.
Elenkov, D. S. 1997. Strategic Uncertainty and Environmental Scanning: The Case for
Institutional Influences on Scanning Behavior. Strategic Management Journal, 18: 287-‐303.
Finkelstein, S. and Hambrick, D. C. 1996. Strategic Leadership: Top Executives and Their
Effects on Organizations. St Paul, MN: West. Granovetter, M. 1992. Problems of Explanation in Economic Sociology In N.Nohria &
R.Eccles, (Eds.), Networks and Organizations: Structure, Form, and Action: 25-‐56. Boston, MA: Harvard Business School Press.
Granovetter, M. 1973. The Strength of Weak Ties. American Journal of Sociology, 78(6):
1360-‐1380.

Business and Social Sciences Review (BSSR) Vol . 1, No . 9, (Mar -‐ 2012) www.bssreview.org ISSN: 2047-‐6485
26
Copyright © 2012 – Society of Business and Social Sciences
Hambrick, D. C. 1982. Environmental Scanning and Organizational Strategy. Strategic Management Journal, 3: 159-‐174.
Hambrick, D. C. and Mason, P. A. 1984. Upper Echelons: The Organization as a Reflection of
Its Top Managers. Academy of Management Review, 9(2): 193-‐206. Haunschild, P. R. 1994. How Much is that Company Worth? Interorganizaitonal
Relationships, Uncertatinty, and Acquisition Premiums. Administtrative Science Quarterly, 39: 391-‐411.
Kahneman, D. and Tversky, A. 1979. Prospect Theory: An Analysis of Decisions under Risk.
Econometrica, 47: 313-‐327. Kotter, J. P. 1982. The General Managers. New York: The Free Press. Lohrke, F. T., Bedeian, A. G., and Palmer, T. B. 2004. The Role of Top Management Teams in
Formulating and Implementing Turnaround Strategies: A Review and Research Agenda. International Journal of Management Reviews, 5-‐6(2): 63-‐90.
Lorsch, J. W. 1989. Pawns or Potentates: The Reality of America's Corporate Boards.
Boston: Harvard Business School Press. March, J. G. and Shapiro, Z. 1987. Managerial Perspectives on Risk and Risk Taking.
Management Science, 33: 1404-‐1418. March, J. G. and Simon, H. A. 1958. Organizations. New York: Wiley. McDonald, M. L. and Westphal, J. D. 2003. Getting by with the Advice of Their Friends: CEOs'
Advice Networks and Firms' Strategic Responses to Poor Performance. Administrative Science Quarterly, 48(1): 1-‐32.
McKinley, W. 1993. Organizational Adaptation and Decline: Theoretical Controversies.
Organization Science, 4: 1-‐9. Meyer, J. W. and Scott, W. R. 1983. Organizational Environments: Ritual and Ceremony.
Beverly Hills, CA: Sage. Milliken, F. and Lant, T. 1991. The Effect of an Organization's Recent Performance History
on Strategic Persistence and Change: The Role of Managerial Interpretations In J. Dutton, (Ed.), Advances in Strategic Management: 129-‐156. CT: JAI Press.
Mintzberg, H. 1973. The Nature of Managerial Work. New York: Harper & Row.

Business and Social Sciences Review (BSSR) Vol . 1, No . 9, (Mar -‐ 2012) www.bssreview.org ISSN: 2047-‐6485
27
Copyright © 2012 – Society of Business and Social Sciences
Mueller, G. and Barker, V. I. 1997. Upper Echelons and Board Characteristics of Turnaround and Non-‐turnaround Declining Firms. Journal of Business Research, 39(2): 119-‐134.
O'Neill, H. 1986. Turnaround and Recovery: What Strategy Do You Need? Long Range
Planning, 19(1): 80-‐88. Pfeffer, J. 1988. A Resource Dependence Perspective on Intercorporate Relations In
M.Mizruchi & M.Schwartz, (Eds.), Intercorporate Relations: 25-‐55. New York: Cambridge University Press.
Pfeffer, J. and Salancik, G. R. 1978. The External Control of Organizations: A Resource
Dependence Perspective. New York: Harper & Row. Porac, J. F., Thomas, H., and Baden-‐Fuller, C. 1989. Competitive groups as cognitive
communities: The case of Scottish Knitwear manufacturers. Journal of Management Studies, 26: 397-‐416.
Porac, J. F., Wade, J. B., and Pollock, T. G. 1999. Industry Categories and the Politics of the
Comparable Firms in CEO Compensation. Administrative Science Quarterly, 44: 112-‐144.
Simon, H. A. 1976. Administrative Behavior. 3th edition edn. New York: The Free Press. Slatter, S. and Lovett, D. 1999. Corporate Turnaround. London: Penguin. Staw, B. M., Sandelands, L. E., and Dutton, J. E. 1981. Threat-‐rigidity Effects in
Organizational Behavior: A Multi-‐level Analysis. Administrative Science Quarterly, 26: 501-‐524.
Tushman, M. L. and Romanelli, E. 1985. Organizational Evolution: A Metamorphosis Model
of Convergence and Reorientation In B.M.Staw & L.Cumming, (Eds.), Research on Organization Behavior: 171-‐222. Greenwich: JAI Press.
Tushman, M. L. 1977. Special Boundary Roles in Innovation Process. Administrative
Science Quarterly, 22(4): 587-‐605. Tushman, M. L. and Scanlan, T. J. 1981. Characteristics and External Orientations of
Boundary Spanning Individuals. Academy of Management Journal, 24(1): 83-‐98. Westphal, J. D. and Milton, L. P. 2000. How Experience and Network Ties Affect the
Influence of Demographics Minorities on Corporate Boards. Administrative Science Quarterly, 45: 366-‐398.

Business and Social Sciences Review (BSSR) Vol . 1, No . 9, (Mar -‐ 2012) www.bssreview.org ISSN: 2047-‐6485
28
Copyright © 2012 – Society of Business and Social Sciences
DETERMINANTS OF LIFE INSURANCE DEMAND: AN EMPIRICAL INVESTIGATION IN THE MALAYSIAN MARKET
Dr. Zatul Karamah Ahmad Baharul Ulum
School of Business and Economics Universiti Malaysia Sabah Email: [email protected]
Lim Thien Sang
School of Business and Economics Universiti Malaysia Sabah
Amer Azlan Abdul Jamal
School of Business and Economics Universiti Malaysia Sabah
ABSTRACT The objectives of this article are to examine the determinants and relationship of economic variables towards the demand of life insurance policy in Malaysia. Based on the data sample from 1991 to the recently 2010, the empirical analysis proved that the three main factors which have influenced the life insurance demand are associated firstly with the roles played by the individual’s available expenses, secondly the short-‐term interest rates and finally the growth of an economy. The findings also highlights that consistent with previous research findings, the demand increases with individual’s available expenses and economic growth, and decreases with the condition of short-‐term interest rates in the market.
Keywords: Life insurance, demand, economic variables
INTRODUCTION
Insurance as proven by Hammond, Houston and Melander (1967) is a type of legally written coverage agreement to protect individuals from financial disabilities which resulted from unexpected events like death, accident, fire and theft. As its functions and markets are already established in developed nations including United States and most major European countries, the progress in many emerging economies flourished only in the past two or three decades (Hwang, 2003). Since then, together with new challenges in the world’s environment and economic conditions, the insurance industry continues to expand positively. The Life Insurance Industry in Malaysia Malaysia being one of the developing countries has also experienced rapid growth in insurance demand since the 1970s. It is influenced, as highlighted in Ahmad and Yaakob (2005), by the growth of the economy plus the encouraging support given by the

Business and Social Sciences Review (BSSR) Vol . 1, No . 9, (Mar -‐ 2012) www.bssreview.org ISSN: 2047-‐6485
29
Copyright © 2012 – Society of Business and Social Sciences
government. Besides that the increasing factor of self awareness on the importance to include insurance as part of individual’s financial plan also facilitate the progress of the industry. Generally, the Central Bank Annual Insurance Statistics (2010) report have recorded that the combined premium income (life and general insurance) in Malaysia was significantly valued at RM31,923.9 million as well as an accumulated rate of 5.5% (2010) for the insurance fund assets from the total assets of the financial system. The country has also experienced a remarkable premium income increment from 2.9% (1991) to 4.3% (2010). Besides that the number of registered agents has also increased for both life and general insurance (www.liam.org.my). In total, the number of registered agents for life insurance is 87,163 for 2010, which expanded from 37,373 in 1990. Meanwhile for the general insurance, 35,236 were recorded for the year 2010 as compared to 14,456 (1990). As a major part of the insurance industry, life insurance policy is a medium to ensure the economic well-‐being of the household in the unexpected event like death of any of its members (Gutter & Hatcher, 2008). Theoretically, the growth of life insurance industry depends on the roles played by the total premium in force; the original premium on all policies that are not cancelled or expired and initial or a new premium. This premium amount is to be paid at the beginning of each new insurance policy. For the case in Malaysia (Table 1), the distribution of sums insured for the in force policy in 2010, was led by 41.7% of Temporary policy followed by the remaining segments namely the Whole life, Investment-‐linked, Endowment, Annuity and others.
Table 1 Distribution Sums Insured for In Force Policy
TYPE % Temporary Whole life Investment-‐linked Endowment Annuity Others
41.7 22.1 21.7 7.9 -‐ 6.6
Source: www.liam.org.my Significantly, though the economic turbulence for example the 1997 Asian financial crises or the recently global economic recession in 2008 has its impact on both new and in force policy, still the life insurance operation in this country continues to illustrate positive growth (Table 2). This signifies the need for researcher to carry out further studies and analysis in this subject in that the findings are expected to assist policy makers, practitioners and consumers to make better financial related decisions.

Business and Social Sciences Review (BSSR) Vol . 1, No . 9, (Mar -‐ 2012) www.bssreview.org ISSN: 2047-‐6485
30
Copyright © 2012 – Society of Business and Social Sciences
Table 2 Annual Premium of New and In Force Policy
YEAR NEW PREMIUM IN FORCE PREMIUM No. Of policies
RMm No. Of policies
RMm
1990 498,338 573.1 2,388,585 1,576.7 2000 1,174,157 2,942.3 7,234,940 7,364.7 2005 1,365,037 6,701.4 10,144,771 12,308.1 2006 1,303,727 7,161.7 10,534,525 13,325.8 2007 1,337,514 7,587.0 10,909,842 14,538.8 2008 1,585,846 7,234.7 11,522,202 15,446.4 2009 1,387,724 7,544.4 11,850,981 17,347.4 2010 1,426,280 8,327.1 12,170,957 19,275.4
Source: www.liam.org.my In fact given the growing number of literature in insurance, still, there were limited areas of studies which are done in developing countries including Malaysia that require further attention. And being one of the most important types of insurance in the market, it is vital to examine the latest behaviour and influence of economic factors which give impact to the demand of life insurance in this country.
RESEARCH QUESTIONS Earlier studies have acknowledged the important roles played by economic and demographic factors namely; current interest rates, current mortality charges, sales amount of life insurance policy, short-‐term interest rates, savings and inflation in relation with the demand on insurance. Among these are studies done by Yaari (1965), Fortune (1973), followed by Babbel (1981), Browne and Kim (1993) and quite recently by Zietz (2003), Hwang (2003), Ahmad and Yaakob (2005) and Hussels, Ward and Zurbruegg (2005). Based on these former findings and facts plus the increase awareness on the importance of purchasing life insurance policy among Malaysian citizens, this study is done with the intention to find out the relationships of several economic factors towards the demand of conventional life insurance industry.1 The followings are the two main research questions addressed in this paper:
i. Is there any significant relationship between the independent variables towards the demand of life insurance in the Malaysian market?
ii. What is the most influential variable on the demand of life insurance in Malaysia?
REVIEW OF LITERATURE One of the leading studies on life insurance was done as early as in 1965 by Yaari who focused on the influence of the life insurance policy rates. Besides significantly 1 In the Malaysia case, as noted by Ahmad and Yaakob (2005), besides the above-mentioned economic factors, availability of Islamic takaful scheme must also be taken into consideration. Nonetheless, due to different approaches and global constraints of takaful scheme practices, this study will only focus on conventional life insurance policy.

Business and Social Sciences Review (BSSR) Vol . 1, No . 9, (Mar -‐ 2012) www.bssreview.org ISSN: 2047-‐6485
31
Copyright © 2012 – Society of Business and Social Sciences
demonstrated that rates as one of the economic factors, is important, Yaari also concluded each household has the same tendency to dislike risk relatively caused by differences of individual demographic factors, social-‐cultural and psychographic. In fact, Yaari (1965) and Hakansson (1969) have also justified that the demand of life insurance function was a process of maximization of the consumer utility function. This function is in accordance with the application using economic variables such as income level, interest rate and the supply of life insurance premium. In addition, Cargill and Troxel (1979) acknowledged the role played by the inflation factor which is able to change the life insurance usage patterns. Advance study by Mass (1994) found that inflation rate has both significant and negative relationships with the insurance demand. This is because spending and saving activities of individual are directly related with inflation rate. In this situation, a higher rate will jeopardize the total expenses in every economy and will indirectly reduce the value of life insurance to the extent that the policy will become less desirable. Similar findings were also verified by Green (1954), Fortune (1973), Babbel (1981), Browne and Kim (1993), Ahmad and Yaakob (2005) and Li, Moshirian, Nguyen and Wee (2007). Babbel and Staking (1983) also added that a higher value of interest rate will raise the real cost of life insurance product cash value compared to when it is much lower. Outreville (1996) on the other hand, linked the growth in the insurance industry of developing countries to the respective income premium variable and revealed that incomes as being represented by Gross Domestic Product per capita have significant and positive relationships with the growth of life insurance. This is because most consumers are willing to spend more thus higher income contributes higher demand of life insurance. The research also concluded that the demand of life insurance policy moves along with a higher income because the coverage it provides will reduce loss when unexpected events occur. Similar concluding remark was also supported by findings by Cummins (1973) and recently Hwang (2003). Latest research innovation however in this area of life insurance as compared to the earlier ones, was done much to address methodological issues and statistical estimates. Among others, a study on the demand of life insurance in OECD countries (Organisation for Economic Co-‐operations and Development) which was carried out by Li et al. (2007) using panel data approach to reconcile heteroscedasticity problems in the data. Their study confirmed that higher inflation and real interest rates decreases the consumption income elasticity, while the financial condition and development level of a country have significant positive relationship with life insurance demand.
DATA AND METHODOLOGY In order to address the relationship between several independent variables towards one dependent variable that is the demand of life insurance policy in Malaysia, a multiple variables regression analysis was conducted. The study highlights the following independent variables:

Business and Social Sciences Review (BSSR) Vol . 1, No . 9, (Mar -‐ 2012) www.bssreview.org ISSN: 2047-‐6485
32
Copyright © 2012 – Society of Business and Social Sciences
i. Market interest rate; Current interest rate, Short-‐term interest rate, Personal savings rate and Inflation rate
ii. Gross Domestic Product (GDP) iii. Income per capita
The data time frame from the year of 1991 until 2010 was chosen after taking into consideration the income tax exemption that was exercised nationally by the Inland Revenue Board of Malaysia since early 1990s. Datasets are gathered exclusively from reports published in:
i. Bank Negara Malaysia Annual and Quarterly Report ii. Annual Economic Report iii. Insurance Annual Report iv. Life Insurance Association of Malaysia
The linear model for this research was developed as follows:
[DEMAND] = α + β1,t [GDP] + β2,t [INCOME] + β3,t [BLR] + β4,t [TBILLS] + β5,t [SAVINGS] + β6,t [CPI] + εt
where: α -‐ Constant value [DEMAND] -‐ Life insurance demand in Malaysia [GDP] -‐ Gross domestic product in Malaysia [INCOME] -‐ Income per capita [BLR] -‐ Current interest rate [TBILLS] -‐ Short-‐term interest rate [SAVINGS] -‐ Personal savings rate [CPI] -‐ Inflation rate εt -‐ Random component represents other unconsidered factors The model’s sole dependent variable is the life insurance demand in Malaysia, and it is symbolised as [DEMAND]. Browne and Kim (1993) stated that this variable can be represented by the amount of new and in force of life insurance policy. The number of in force policy is used as an assumption, that each individual will still need insurance coverage and therefore shall continue holding it in the next coming year. The [GDP] or Gross Domestic Product represents the growth of the economy. [INCOME]; income per capita is valued as an individual’s available expenses (Outreville, 1996) while [BLR], the current interest rate is presented by the values of base lending rate (Carson and Hoyt, 1992). For the short-‐term interest rate, the same authors suggested that it can be based on 3-‐months Treasury Bills. The normal savings interest rate will be the foundation of [SAVINGS] data or the individual savings rate (Chang, 1995) and finally [CPI], consumer price index represents the inflation rate (Zietz, 2003).

Business and Social Sciences Review (BSSR) Vol . 1, No . 9, (Mar -‐ 2012) www.bssreview.org ISSN: 2047-‐6485
33
Copyright © 2012 – Society of Business and Social Sciences
It should be noted that although the four independent variables ([BLR], [TBILLS], [SAVINGS] and [CPI]) under the market interest rate category have different explanation power towards the demand of life insurance policy, each and every four of these variables may have a linear relationship towards one another (Ahmad and Yaakob, 2005). Therefore each of these variables is analyzed individually. Here, signs of multiple collinearity effect possibly may exist and in this case Stepwise Regression is done in later stage of the analysis. To test the exact and strong relationship (if any) amongst independent variables, statistical Tolerance test are used, where the values are between 0 (high correlation) and 1 (low correlation).Tolerance value approaching 0 means that the independent variable have exact linear relationship with other independent variable. Alternatively, values approaching 1 imitate that less correlation is observed in the data (Nurosis, 1995). In addition, other statistical procedures are also included in this study which comprises of t-‐test (significant test on individual Xi as compared to a dependent variable), F-‐test (overall model significant test towards a dependent variable), and to examine whether the error values will show a random pattern.
RESULTS Normality Figure 1 below shows that the bell shape verifies the random variable; ε has a normal distribution and thus, t-‐test, F-‐test and other statistical analyses can be tested for this study. Similarly, the shape of the histogram also recognizes the normality of error distribution from the tested data sample.
Figure 1 Data Histogram
Heteroscedasticity From the scatterplot of residuals against predicted values as shown in Figure 2 below, no clear relationship exists between both axes values and thus according to Coakes and Steed (2001), this is consistent with the assumption of linearity. The plotted graph proves that the suggested model does not generate any heteroscedasticity problem. It can also be noted

Business and Social Sciences Review (BSSR) Vol . 1, No . 9, (Mar -‐ 2012) www.bssreview.org ISSN: 2047-‐6485
34
Copyright © 2012 – Society of Business and Social Sciences
that the dependent variable’s variance was similar to those of all tested independent variables.
Figure 2 Heteroscedasticity Data Plot
Regression Analysis The results of the regression analysis considering the suggested independent variables are shown in Table 3. For the life insurance demand model, it is shown that 97.3% of the dependent variable can be explained by the independent variables. The F-‐value also reflects that all the independent variables are highly significant. The indication given by the t-‐values proves that GDP and TBILLS were significant at the 5% level while INCOME at the 1% level. Both GDP and INCOME have positive relationships towards DEMAND while TBILLS gave negative value towards the dependent variable at significant level of 5%.
Table 3 Multiple Regression Analysis Output Model Beta t-‐value Tolerance
Collinearity Statistic
Adjusted R2 F Value
(CONSTANT) GDP INCOME BLR TBILLS SAVINGS CPI
0.489 1.153 0.107 -‐0.324 -‐0.113 -‐0.035
2.672 2.570* 5.293** 0.845 -‐2.311* -‐0.929 -‐0.578
0.039 0.030 0.087 0.061 0.094 0.381
0.973 116.579**
Notes: Dependent Variable: DEMAND **Significant at the 0.01 level * Significant at the 0.05 level

Business and Social Sciences Review (BSSR) Vol . 1, No . 9, (Mar -‐ 2012) www.bssreview.org ISSN: 2047-‐6485
35
Copyright © 2012 – Society of Business and Social Sciences
Some of the tolerance collinearity statistics however suggested low multicollinearity error may exist between the independent variables. Similar findings were also demonstrated by the correlation analysis as in the following Table 4.
Table 4 Correlation Analysis Output GDP INCOME BLR TBILLS SAVINGS GDP INCOME BLR TBILLS SAVINGS CPI
1.000 0.970** -‐0.568** -‐0.577** -‐0.870** -‐0.284
1.000 -‐0.654** -‐0.689** -‐0.902** -‐0.358
1.000 0.940** 0.784** 0.602**
1.000 0.783** 0.694**
1.000 0.544**
**Significant at the 0.01 level Due to this fact, to produce a more justified model that is able to explain the demand, some of the independent variables should be excluded from the model based on the Stepwise Regression Analysis (Table 5).
Table 5 Stepwise Regression Analysis Output Model Beta t-‐value Tolerance
Collinearity Statistic
Adjusted R2 F Value
(CONSTANT) GDP INCOME TBILLS
0.461 1.190 -‐0.294
4.267 2.609** 5.985** -‐4.948*
0.440 0.350 0.387
0.974 6.807*
**Significant at the 0.01 level * Significant at the 0.05 level With reference to the first research question highlighted earlier, it is found that only three independent variables have significant relationship towards the demand of life insurance in Malaysia. The GDP and INCOME have positive relationship while TBILLS relates negatively towards similar dependent variable. The t-‐value for the three independent variables namely GDP, INCOME and TBILL are significant either at the significant confidence level of 5% or 1%. Table 5 also confirms that 97.4% of the model can be explained by the variables. In fact, the Tolerance Statistics has confirmed that no multiple collinearity error exist from the model with values larger than zero. Collectively from similar analysis, the life insurance demand can be influenced by the model in that the F-‐value is recorded significantly at 6.807. To address the second research question, with beta value of 1.190, it is verified that INCOME or the individual’s available expenses is the most influential variable towards determining the demand of life insurance in Malaysia.

Business and Social Sciences Review (BSSR) Vol . 1, No . 9, (Mar -‐ 2012) www.bssreview.org ISSN: 2047-‐6485
36
Copyright © 2012 – Society of Business and Social Sciences
With reference to these findings, the earlier suggested life insurance demand model for the Malaysian market can be rewritten as follows:
[DEMAND] = α + 0.461[GDP] + 1.190[INCOME] – 0.294[TBILLS] + εt
CONCLUSION The main intentions of this written article are to examine the determinants and relationship of economic variables towards the demand of life insurance industry in Malaysia. Based on the multiple regression analysis, the study has ascertained that individual’s available expenses played the most significant position in determining the life insurance demand. Theoretical argument suggested that a person with a bigger potion of available expenses that is after disbursements which may include hire purchase payment, loan payment and other expenses, may consider allocating a certain predetermined amount to purchase a life insurance(s) policy. This outcome is in line with studies conducted by Cummins (1973), Outreville (1996) and Hwang (2003). Growth of an economy and changes in the country’s income assembled strongly towards the demand while a lower short-‐term interest rate may trigger prospective and current consumer or policy holder to concentrate on insurance as an alternative for savings (Outreville, 1996; Hwang, 2003; Ahmad & Yaakob, 2005). Looking from another perspective, a higher short-‐term interest rate creates a scenario where consumers will invest their cash in short-‐term financial instruments that offers a better return in cash. The finding however is in contrast with Chang (1995) who documented that short-‐term interest rate did not have any significant association towards life insurance demand. On the other hand, excluded independent variables such as current interest rate (BLR), personal savings rate (SAVINGS) and inflation rate (CPI), are found to not having any impact on the demand due to the existence of multicollinearity error. Hence, from additional analysis, it retains only one market interest rate factor that is represented by the short-‐term interest rate (TBILLS). In contrast with Browne and Kim (1993) but consistent with Hwang (2003), one of the reason why the inflation rate variables has no effect on the life insurance demand is that it maybe because this study uses the values of new and in-‐force policy. For Browne and Kim (1993) however, the demand is supported by premium values or policy face values. The reason for not taking into consideration these two values (as in Browne & Kim, 1993) is that the sample is rather difficult to obtain and one needs to reason with the involvement of the base year. Future research that can be suggested on related issues may include consideration to use better or more advance methodology technique which can comprehend with the restriction of an ordinary linear regression method. Other factors comprising demographic variables like occupation, education level, marital status or gender may possibly be included to form the model. In fact some psychographic elements for example risk perception or one’s expected life expectancy can also be taken into account to enhance the expected model.

Business and Social Sciences Review (BSSR) Vol . 1, No . 9, (Mar -‐ 2012) www.bssreview.org ISSN: 2047-‐6485
37
Copyright © 2012 – Society of Business and Social Sciences
ACKNOWLEDGEMENT The earlier version of this paper was presented at The 5th International Conference of the Asian Academy of Applied Business in Phnom Penh, Cambodia dated 9th and 10th June 2011. The authors acknowledge the helpful comments given by the participants of the conference.
REFERENCES Ahmad, Z.K. & Yaakob, R. (2005, 21-‐22 January). Life insurance’s demand: Role played by
economic variables. Paper presented at the UiTM-‐AUT International Conference Asia Pacific Business Environment: Innovative Responses to Regional Events, Shah Alam, Selangor, Malaysia.
Babbel, D.F. (1981). Inflation, indexation and life insurance sales in Brazil. Journal of Risk & Insurance, (48), 115-‐135.
Babbel, D.F. & Staking, K.B. (1983). A capital budgeting analysis of life insurance costs in the United States. Journal of Finance. (38), 149-‐170.
Bank Negara Malaysia. (2010). Annual Insurance Statistics. Kuala Lumpur
Browne, M.J. & Kim, K. (1993). An international analysis of life insurance demand. Journal of Risk& Insurance. (60), 616-‐634.
Cargill, T.F. & Troxel, T.T. (1979). Modelling life insurance savings: some methodological issues. Journal of Risk& Insurance. (46), 391-‐410.
Carson, J.M. & Hoyt, R.E. (1992). An econometric analysis of the demand for life insurance policy loans. Journal of Risk& Insurance. (59), 777-‐792.
Chang, D.H. (1995). Economic analysis of the development of universal life insurance in the 1980s. Journal of the American Society of CLU & ChFC. (49), 82-‐87.
Coakes, S.J. & Steed, L.G. (2001). SPSS: Analysis without Anguish. New South Wales: John Wiley & Sons.
Cummins, J.D. (1973). An econometric model of the life insurance sector of the U.S. economy. Journal of Risk& Insurance. (40), 533-‐554.
Fortune, P. (1973). A theory of optimal life insurance: development and tests. Journal of Finance. (27), 587-‐600.
Green, M.R. (1954). Life insurance buying in inflation. Journal of the American Association of University teachers of Insurance. (27), 99-‐113.
Gutter, M.S. & Hatcher, C.B. (2008). Racial differences in the demand for life insurance. Journal of Risk& Insurance. (75), 677-‐689.

Business and Social Sciences Review (BSSR) Vol . 1, No . 9, (Mar -‐ 2012) www.bssreview.org ISSN: 2047-‐6485
38
Copyright © 2012 – Society of Business and Social Sciences
Hakansson, N.H. (1969). Optimal investment and consumption strategies under risk and uncertain lifetime and insurance. International Economic Review. 10(3), 443-‐466.
Hammond, J.D., Houston, D.B. & Melander, E.R. (1967). Determinants of household life insurance in early married life. Journal of Risk& Insurance. (47), 713-‐729.
Hussels, S., Ward, D. & Zurbruegg, R. (2005). Stimulating the demand for insurance. Risk Management and Insurance Review. 8(2), 257-‐278.
Hwang, T. (2003). The determinants of the demand for life insurance in an emerging economy – The case of China. Managerial Finance. 29(5/6), 81.
Li, D., Moshirian, F., Nguyen, P. & Wee, T. (2007). The demand for life insurance in OECD countries. Journal of Risk& Insurance. 74(3), 637-‐652.
Mass, P. (1994). Insuring the future. Business Latin America. (29), 2.
Nurosis, M.J. (1995). SPSS 6.1: Guide to Data Analysis. New Jersey: Prentice Hall.
Outreville, J.F. (1996). Life insurance markets in developing countries. Journal of Risk& Insurance. 63(2), 263.
Yaari, M. (1965). Uncertain lifetime, life insurance and the theory of the consumer. Review of Economic Studies. (32), 137-‐150.
Zietz, E.N. (2003). An examination of the demand for life insurance. Risk Management and Insurance Review. 6(2), 159-‐191.
Key Indicators Performance. Retrieved from http://www.liam.org.my

Business and Social Sciences Review (BSSR) Vol . 1, No . 9, (Mar -‐ 2012) www.bssreview.org ISSN: 2047-‐6485
39
Copyright © 2012 – Society of Business and Social Sciences
COST OF POWER OUTAGES IN THE ZIMBABWEAN INDUSTRIAL SECTOR
Nyasha Kaseke PhD Student
Nelson Mandela Metropolitan University Department of Economics and Economic History)
Email: [email protected]
Stephen Hosking Lecturer
Nelson Mandela Metropolitan University Department of Economics and Economic History
ABSTRACT
There are many factors undermining the industrial output of Zimbabwe. This paper describes and measures the cost of one – electricity outages. Industrial consumers experience power outage incidences of different duration, depending on the load shedding time table, the preference by the power utility and contract arrangements with the power utility. There are two outage cost reported; direct cost (welfare loss) and backup cost. The direct cost was estimated using the direct assessment method. Direct loss are incurred due to lost production, lost materials and lost time. The backup cost was estimated using the captive generation or indirect method. This method uses cost of investment in backup sources and mitigating measures as a measure of the cost of a power outage. The expected gain from self-‐generated kWh is assumed equal to the expected loss from the marginal kWh not supplied by the utility (the outage). The annualised capital cost of backup source plus the variable cost of generating electricity by the backup source are other costs of outages. Summing direct cost and backup cost provides the total outage cost. The total cost of power outages experienced to Zimbabwean’s industrial sector during 2009 was estimated to be US$1.2 billion. The paper deduces that there is an urgent efficiency need to increase the capacity of the Zimbabwe power utility to provide electricity service to Zimbabwe’s industrial sector.
Keywords: Electricity outage, direct assessment method, indirect assessment method,
INTRODUCTION Zimbabwe has a diversified manufacturing sector, producing a wide range of commodities from food and beverages to chemicals, clothing and metal products. The manufacturing sector was developed under import substitution industrialization policies of the white minority regimes prior to independence in 1980 (Confederation of Zimbabwe Industry

Business and Social Sciences Review (BSSR) Vol . 1, No . 9, (Mar -‐ 2012) www.bssreview.org ISSN: 2047-‐6485
40
Copyright © 2012 – Society of Business and Social Sciences
(ZCI) 2009:67). The country endured sanctions from 1965 to 1980 and import substitution was used as a strategy to ensure self-‐sufficiency for most of the basic consumer products (Ministry of Industry 2009). The strategy was carried forward (largely by default) into the post-‐independence period. The industrial sector contributes 14 percent (14%) of the country’s GDP, 20 percent (20%) of its exports and 15 percent (15%) of its employment (CZI 2009:68), but this contribution had declined due to various challenges, high among which has been persistent power outages (Eto, Divan & Brumsickle 2004; World Bank 2008). This paper estimates the cost to Zimbabwe of electricity outages for the industrial sector. Two components make up this estimate – direct costs and indirect cost. The paper is organised as follows: background is presented, literature is reviewed, methodology is outlined and the survey administration and analysis is described.
BACKGROUND Power shortages in Zimbabwe are not a problem for firms only but for the whole nation. Electricity sources in Zimbabwe ZESA Holdings is the nucleus of the generation, transmission and distribution of electricity in Zimbabwe. Zimbabwe has five major power stations, with a total capacity of 1240 MW (ZESA 2007). These facilities do not meet electricity demand. Electricity generation in Zimbabwe is mainly from coal and hydro plants, with a capacity of 1240 MW, while the Kariba hydropower plant generates 780 MW as shown in Table 1 (ZESA 2009). Table 1 Power Supply in Zimbabwe
Station Plant type Available Capacity (MW) Kariba Hydro 740 Hwange Coal 460 Harare Coal 0 Bulawayo Coal 0 Munyati Coal 0 Total 1240
Source: ZESA, (2009) In a bid to solve the problem of power shortages, the country resorted to importation. Zimbabwe used to import 35 % of its electricity from neighbouring countries, including the DRC, Mozambique and Zambia (see Table 2), but in recent years the import facility has been undermined due to payment uncertainty. The combination of under capacitated domestic production and in ability to imports has created shortages. The result has been power outages in the form of planned and unplanned load shedding.

Business and Social Sciences Review (BSSR) Vol . 1, No . 9, (Mar -‐ 2012) www.bssreview.org ISSN: 2047-‐6485
41
Copyright © 2012 – Society of Business and Social Sciences
Table 2 Zimbabwe Power Imports in 2009 COUNTRY Interconnection
Voltage kV Available capacity (MW)
Mozambique 300 300 South Africa 0 0 Zambia 100 50 DR Congo 100 100 Botswana 0 0 Total 500 450 Source: ZESA, (2009) Power Outage Power outages started as early as 1997 (Kayo 2001) when total systems losses averaged 11% in 1997 (ZESA 2007). It coincided with the rapid depreciation of the Zimbabwean dollar. ZESA was exposed to foreign exchange fluctuations and was prevented from passing on the cost by Government controls on pricing (Kayo 2001). Serious power outages started in 2000, soon after the land reform program was initiated in Zimbabwe (Kayo 2001) and the foreign currency shortage became acute (Ministry of Energy and Power Development 2005). In addition, the high cost of transporting coal from Hwange (coal mine) to Bulawayo, Munyati and Harare Thermal Power Stations (TPSs) and high maintenance cost to these TPSs resulted in their decommissioning. Prior to this, the TPSs contribute 670MW (Bulawayo 370MW, Harare 200MW and Munyati 100MW) to the grid (ZESA 2006). The supply was constrained at a time demand was growing due to growth in urban households, rural and growth point electrification (ZESA 2007). In 2007, there were major setbacks – Zimbabwe was disconnected from ESKOM supplies due to its domestic demand (ZESA 2007). Imports from Zambia, Democratic Republic of Congo and Mozambique were cut due to payment problems. ESKOM has converted the debt of electricity to a loan in order to cover its expenses (ZESA 2007). Zimbabwe was left with supply only from its domestic generation plus a guaranteed 100MW from Mozambique. The downward slide in generation was matched by a slide in management of the distributional infrastructure. The Electricity Amendment Bill (Number 17) of 2007 blamed vandalism for the problem, but there were many contributing factors. ZESA technicians and engineers blamed the poor quality transformers and related equipment being acquired (ZESA 2007). At the same time many qualified engineers, artisans and technicians left Zimbabwe for neighboring countries. In 2007 eighty (80) engineers and artisans left (ZESA 2008). By 2009 the generation of electricity was reduced to 55% of potential capacity (ZPC 2009). Total electricity supply fell well short of demand and the power utility provider resorted to organized planned and unplanned load shedding.

Business and Social Sciences Review (BSSR) Vol . 1, No . 9, (Mar -‐ 2012) www.bssreview.org ISSN: 2047-‐6485
42
Copyright © 2012 – Society of Business and Social Sciences
LITERATURE REVIEW The electricity outages have attracted interest from various scholars over the last three decades (Bernstein & Heganazy 1988; Lee & Anas 1992; Tierney 1997; Beenstock et al. 1998; Primen 2001; Rose & Lim 2002; Eto, Divan & Brumsickle 2004; Rose et al. 2004; Adenikinju 2005; Bose, Shukla, Srivastava & Yaron 2006). The general conclusion has been that power outages cause significant direct and indirect costs. Empirical evidence links the scale of these costs to variables such as electricity consumption per capita and the number of hours with/without electricity per day. Reliable electricity power supply delivered on demand is vital for most industrial equipment (Lawton et al. 2003), but the typical Zimbabwean firm experiences power failures about five times per week, each one lasting for about one to six hours daily, with no prior warning from the power utility (CZI 2009). This imposes a huge constraint on the manufacturing firms and causes various costs, e.g. idle workers, spoiled materials, lost output, damaged equipment and restart costs (Adenikinju 2005:1). At the same time, it increases business uncertainty and lower returns on investment, undermining Zimbabwe’s growth potential and the attractiveness of the economy to external investors (Mangwengwende 2005:7; World Bank 2008). Energy is a prerequisite for economic growth and development (Ebohon 1996; Rosenberg, 1998; Templet 1999; Boston Institute for Development Economics 2006; Calderon 2008). Energy has been shown to be equally as important in production as other factors such as labour, land and capital (European Commission, 1993). Improved energy supply reliability after the 1950s coincided with rising global economic growth (World Bank 2004:72). This paper surveys the global and African literature relevant to electricity outages. The relationship between economic growth and electrical power demand has been found to be close (European Commission 1993; Rosenbergy 1998; Ferguson, Wilkinson & Hill 2000). A study on the impact of energy consumption on economic growth in Taiwan, using data for the period 1955-‐2003, found evidence of a level-‐dependent effect between the two variables, energy consumption and economic growth (Lee & Chang 2006). Energy consumption is positively correlated to economic growth (Akinlo 2008). There are essentially five ways by which firms may respond to unreliable electricity supply. These are choice of location, factor substitution, private provision, choice of business and output reduction (Adenikinju 2005:3). While all these options are seen to be selected by various firms, the most common approach has been private backup provision (Adenikinju 2005:4). Firms find it necessary to provide their own electricity to substitute (or complement) the utility supply (World Bank, 2008).
METHODOLOGY This paper applies two methods for estimating the cost of outages the direct cost and captive generation method.

Business and Social Sciences Review (BSSR) Vol . 1, No . 9, (Mar -‐ 2012) www.bssreview.org ISSN: 2047-‐6485
43
Copyright © 2012 – Society of Business and Social Sciences
The methodology of the direct assessment approach uses direct loss by which it estimates the cost of power outages through lost production, lost materials and lost time or leisure. The direct assessment method is an economic appraisal tool that estimates the cost of power outages by allowing electricity consumers to express their losses in monetary terms (Bose et al. 2006:1439). The approach is based on the principle that the lost production, materials and time in each productive sector, or lost goods during an outage, can be estimated directly, and this can be aggregated to a total (de Nooijet al. 2006:284). The approach relies on the individual respondent’s self assessment method of valuing the cost of electricity outage. Direct cost estimations, such as the direct financial evaluation approach, the gross economic indices approach (GNP divided by total electricity consumption), and the case study approach have been frequently employed in the past (Pollitt, Jamasb & Yu 2006). In order to estimate the cost of outage by the direct assessment, it is important that total value lost by consumers due to power outages is ascertained by summing all direct cost experienced during outages. The direct costs incurred by firms go beyond production loss or output loss. In addition to output loss cost, other direct costs such as materials destruction cost (in stock), labour cost (payment of idle labourers and cost of overtime and bonuses to meet production and orders), damage to equipment cost, restart cost, time or opportunity cost per outage are part of the outage cost.
𝑇𝐷𝐶! = 𝑂𝐿! +𝑀𝐶! + 𝐿𝐶! + 𝐸𝐷𝐶! + 𝑅𝐶! (1) 𝑇𝐷𝐶! is the total direct cost for the ith consumer; 𝑂𝐿! is cost of lost output (lost leisure for households); 𝑀𝐶! is the material destruction cost; 𝐿𝐶! is labour cost; 𝐸𝐷𝐶! is the equipment damage and maintenance cost as a result of outages; and R𝐶! is restart cost. From equation 1 costs per unit of electricity (kWh) lost can be estimated as:
OC! =TDC!
kWhlos! (2 )
OC! is the cost per kWh lost and kWhlosj are the total units of electricity (kWh) lost or unsupplied due to outages. The methodology of the captive generation uses direct cost of acquiring backup equipment and cost of running the backup equipment during outages. The purchase of, or investment in, backup systems, such as generators, solar panels, diesel pumps or UPS’s may be regarded as the payment of a premium on an insurance policy against outage risks (Eto et al. 2001). The cost to a firm generating its own power consists of two elements (Adenikinju 2005:10). The first is the yearly capacity cost of the generator and other capital outlays. This cost will be denoted by c(Kg), where Kg is the generator’s capacity measured in kVa. Second is the variable cost per kWh for fuel, maintenance and wage costs. If the generator is used to

Business and Social Sciences Review (BSSR) Vol . 1, No . 9, (Mar -‐ 2012) www.bssreview.org ISSN: 2047-‐6485
44
Copyright © 2012 – Society of Business and Social Sciences
capacity during power cuts, as assumed, the variable cost per year is given by v.H.Kg, where H is the expected total duration of outages, measured in hours per year. The total backup cost is estimated by adding the capital cost and variable cost of acquiring and running the captive generation backup system. The capital cost has to take into account the issue of depreciation and the discounting factor for investment in the capital equipment. A captive unit will typically have a life span of more than one year and the capital cost must be divided over the life span of the asset. The average economic cost per unit of power generated for the ith consumer, using the jth backup unit, can be calculated by dividing the total indirect cost by the total kWhs generated as:
𝐶!" =𝐾!"𝑅! +𝑀!" + 𝐹!"
𝑈!" (3)
𝑅! =𝑟
1− 1+ 𝑟 ! (4)
Where 𝐶!" is the gross backup cost of the ith consumer with j backup units; 𝐾!"𝑅! is the annualised cost of back-‐up power expressed in US$ (𝐾!" is the capital cost of the backup device at current prices expressed in US$ and 𝑅! is the capital recovery factor); 𝑈!" is the electrical units generated by the backup units expressed in kWh; 𝑀!"is the annual maintenance and wage cost expressed in US$; 𝐹!" the annual fuel cost of running backup generation expressed in US$; r the annual rate of interest; n the total life of the backup device expressed in years; j the number of backup units.
ADMINISTERING INDUSTRIAL SURVEY Questionnaire Design The questionnaire used in the industrial sector electricity outage cost survey was designed in consultation with focus groups consisting of engineers (electrical), statisticians (at ZESA)and representatives of organizations such as the CZI and the Ministry of Industry and Commerce. The questionnaire consisted of three parts. The first part contained general questions about the firm/institution: the location, operational hours and electricity consumption from the grid; amount paid for electricity consumed and the arrangement made with the power utility concerning load shedding. The second part included questions about the direct cost estimation of power outages. This part estimated actual outage cost: lost production, damage to equipment, idle time for workers, spoiled stocks and restart cost. The third part asked questions concerning the captive generation cost for the sector: the cost of acquiring the captive devices and the accessories, running and maintenance costs. Before the questionnaire was finalised, it was tested on a smaller group of 10 firms. Population The sample frame included all industrial electricity consumers connected to the utility grid. A summary analysis of the sample frame for industrial consumers is shown in Table 3.

Business and Social Sciences Review (BSSR) Vol . 1, No . 9, (Mar -‐ 2012) www.bssreview.org ISSN: 2047-‐6485
45
Copyright © 2012 – Society of Business and Social Sciences
Table 3 ZESA Industrial Tariff Classification Tariff Class Number of Customers Low Capacity Manufacturing 2132 High Capacity Manufacturing 401 Low Capacity Commercial Services 35554 High Capacity Commercial services 197 Low Capacity Institutions 1458 High Capacity Institutions 15 TOTAL 39757 Source: ZESA (ZEDTCO) (2009)
Sample size and sample selection Sample size The sample size was determined by applying the Yamane (1967) approach to sample size determination. The sample sizes for the selected industry electricity consumer classes are shown in Table 4. Table 4 Sample sizes based on electricity tariff classification Electricity Supply Capacity
Tariff Class Number of Customers
Sample size of
respondents
Sample size as % of population
Low Capacity Manufacturing 2132 95 5% High Capacity Manufacturing 401 25 6% Low Capacity Commercial Services
23554 290 1.2%
High Capacity Commercial Services
197 20 10%
Low Capacity Institutions 1458 65 5% High Capacity Institutions 15 5 33% TOTAL 27757 500 1.8% Sampling selection A stratified sampling design was adopted for the Zimbabwean industrial electricity outage cost estimation survey. Industries were first stratified into low capacity (LC) and high capacity (HC) manufacturing, commercial and institutions, as per the utility classification shown in Table 4. The second stratification was in terms of the nature of activities in each class. The manufacturing sector was further stratified into Food and beverages; Paper, wood and rubber; Textiles and leather; Chemicals and drugs (fertiliser, petroleum, paint and pharmaceuticals); Engineering and construction (metal, electrical, cement, glass and bricks); agriculturally based and Tobacco industries. Similarly, the services were classified into wholesaling and retailing; Communications and information technology (IT), Hospitality, leisure and tourism, Transport and automobile services, Commercial tertiary services (accounting, banking, advertising, insurance, consultancy and warehousing).

Business and Social Sciences Review (BSSR) Vol . 1, No . 9, (Mar -‐ 2012) www.bssreview.org ISSN: 2047-‐6485
46
Copyright © 2012 – Society of Business and Social Sciences
Lastly, institutions were stratified as Education, health and government institution; and Non-‐Governmental Organisations (NGO) and humanitarian services. The samples were drawn randomly from the sub-‐strata identified. The selection of the type and of units for the survey was based on secondary data on electricity purchased, sanctioned load, electricity generated by captive units and ZESA recommendations. Data Collection and Analysis The survey was administered by the researcher and research assistants who were also trained in administering the questionnaires. The questionnaires were personally administered in order to improve response rate and reduce mis-‐information biases. The industry respondents were informed of the purpose of the research in advance by telephone or email. The data collection exercise was spread over 6 months. The data from the questionnaires were then collated on Excel spreadsheets and the software Statistical Package for Social Scientists (SPSS 13) and Eviews (6) were used for data analysis.
ANALYSIS OF DATA Descriptive Analysis Table 5 Respondents distribution by power supply capacity, scale, location and class
Item of Analysis Consideration
Direct Method (C1)
Indirect Method (C2)
Frequency
Percent of total
Frequency
Percent of total
Power Supply Capacity
HC Firms 176 67.7 79 34.2
LC Firms 84 32.3 152 65.8 Scale of Operation Small Scale (SS) 84 32.3 63 27.3 Medium Scale (MS) 92 35.4 86 37.2 Large Scale (LS) 84 32.3 82 35.5 Location Harare 95 36.5 88 38.1 Bulawayo 50 19.2 45 19.5 Gweru 13 5.0 10 4.7 Mutare 21 8.1 17 7.4 Masvingo 12 4.6 12 5.2 Kwekwe 13 5.0 13 5.6 Kadoma 11 4.2 10 4.3 Chegutu 8 3.1 6 2.6 Chinhoyi 16 6.2 10 4.3 Vic Falls 12 4.6 12 5.2 Kariba 2 0.8 1 0.4 Other small towns/GPA 7 2.7 7 3.0

Business and Social Sciences Review (BSSR) Vol . 1, No . 9, (Mar -‐ 2012) www.bssreview.org ISSN: 2047-‐6485
47
Copyright © 2012 – Society of Business and Social Sciences
Industrial Sectors -‐ Manufacturi
ng Food and Beverages 43 16.5 40 17.3
Paper, Wood, Rubber 33 12.7 31 13.4 Textile and leather 8 3.1 6 2.6 Drugs and Chemicals 11 4.2 10 4.3 Engineering/constructio
n 42 16.2 34 14.7
Agro-‐based and Tobacco 7 2.7 7 3.0 -‐ Services Wholesale and retailing 21 8.1 17 7.4
Communication and IT 12 4.6 11 4.8 Tourism and hospitality 16 6.2 16 6.9 Transport and
automobiles 22 8.5 19 8.5
Commercial Tertiary Services
31 11.9 28 12.1
Education, Health & Gvt 10 3.8 8 3.5 NGOs and Humanitarian 2 0.8 2 0.9 Other Services 2 0.8 2 0.9 A total of 260 out of the 500 questionnaires (52%) were successfully retrieved, coded and analysed for the direct cost method (C1) and 231 out of 500 (46.2%) questionnaires for the indirect cost method of estimation (C2). The distribution of the firms by electricity supply capacity, specified industry sector, scale of production and location is shown in Table 5. For the purpose of this survey, firms connected to voltage supply of below 300kVa were regarded as Low Capacity (LC) and those above 300kVa as High Capacity (HC) firms. Firms employing less than 100 were classified as small scale, firms employing between 100 and 250were classified as medium scale and firms above 250, large scale. The industrial sector firms were further classified as either manufacturing or service industry. The electricity supply problems to the industry sector can be seen from the information portrayed in Tables 6, 7, 8 and 9. Table 8.4 shows the frequencies of outages per week. Table 6 Frequency of weekly outages experienced by Industry Number of Outages per week
Frequency Percentage
1-‐2 57 21.92 3-‐4 153 58.85 5-‐6 36 13.85 7 14 5.38 Of the surveyed firms, 58.85 percent reported they experienced 3 to 4 outage incidences per week, 21.92 percent reported they experienced 1 to 2 outage incidences per week,

Business and Social Sciences Review (BSSR) Vol . 1, No . 9, (Mar -‐ 2012) www.bssreview.org ISSN: 2047-‐6485
48
Copyright © 2012 – Society of Business and Social Sciences
13.85 percent reported they experienced 5 to 6 outage incidences per week and 5.38 percent reported they experienced 7 or more outage incidences per week. All firms reported having at least one outage per week in 2009. On average, firms experienced 4 outage incidences per week; slightly above the average of 3 outage incidences per week reported by the CZI (2009). Table 7 Average duration of outages in hours reported by firms Average outage duration Frequency Percentage
0-‐1 hour 10 3.8 2-‐3 hours 97 37.3 4-‐5 hours 119 45.7 6-‐7 hours 26 10 8-‐9 hours 3 1.2
10-‐12hours 2 0.8 12+ hours 3 1.2
Table 7 shows the ranges of average duration of outages reported by firms. Of the surveyed firms 45.7 percent reported average outage duration ranging between four and five hours per outage incident, followed by 37.3 percent reporting between two and three hours per incident and 1.2 percent (3 firms) reported 12 or more hours per outage incident. The average duration of outage was found to be four hours. Table 8 Uninterrupted supply and warning arrangement by firms with ZESA
Type of firm Frequency Percentage
Average weekly outages
Average outage duration (hours)
FFirms without arrangement
205 78.8 4 4
Firms with arrangement 55 21.2 2 3 Of the surveyed firms, 78.8 percent had no arrangement with the power utility for uninterrupted power supply and advance warning arrangements and 21.2 percent had that arrangement. It was found that firms having an arrangement had fewer outages per week than those without and they also had shorter outages than those without. It was also found that the frequency and duration of outages differed, depending on whether there was an arrangement with the power utility for an uninterrupted power supply or not. Table 9 Proportion of total firm output/service loss caused by power outages Proportion of firm’s output/services lost Frequency Percentage
0% Loss 4 1.53 Less than 10% 12 4.6 Between 10-‐25% 79 30.4

Business and Social Sciences Review (BSSR) Vol . 1, No . 9, (Mar -‐ 2012) www.bssreview.org ISSN: 2047-‐6485
49
Copyright © 2012 – Society of Business and Social Sciences
Between 26-‐50% 85 32.7 Between 51-‐75% 42 16.2 Between 76-‐99% 28 10.8 100% loss 10 3.8 Of the surveyed firms, 3.8 percent (10 firms) reported having to shut down production at one time or the other in the year due to power outages, 32.7 percent reported between 26 and 50 percent output loss, 30.4 percent reported between 10 to 25 percent output loss, 10.8 percent reported between 76 and 99 percent loss while 1.53 percent (4 firms) reported no loss (Table 9). Ranking of service problems by firms in Zimbabwe Respondent firms were also asked to rank the severity of service problems in Zimbabwe on a scale of 1 to 3: major obstacle, moderate obstacle and no obstacle respectively (see Table 10). Table 10 Ranking of severity of service problems by firms (percentage) Service Major Obstacle Moderate Obstacle No Obstacle Electricity 67.3 29.2 3.5 Water 46.2 31.1 22.6 Transport 17.7 56.9 25.4 Telecommunication 21.2 53.4 25.4 Market 54.4 37.2 8.4 Table 10 shows that a significant number (67.3%) of surveyed firms regarded power outages as a major obstacle of their operations. Only a small percentage (3.5%) regarded it as no obstacle. Direct Cost Estimation The direct costs of outages in the industrial sector were value of lost output, labour cost, material destruction cost, other additional cost (restart cost, damage to equipment and repair and maintenance cost) and total value added lost by firms. The direct cost components were summed together to get the total direct cost. Transformations were also performed to calculate the cost in terms of per unit of energy (kWh) unsupplied to the firm by the power utility. Direct cost by type of cost for firms Table 11 Direct cost for firms by type Cost Type Amount (US$) As % of Total Lost output 20521 76 Labour cost 1304 4.8 Destruction of material (raw materials and stocks)
4343 16.1

Business and Social Sciences Review (BSSR) Vol . 1, No . 9, (Mar -‐ 2012) www.bssreview.org ISSN: 2047-‐6485
50
Copyright © 2012 – Society of Business and Social Sciences
Table 11 shows the decomposition of direct cost by type incurred by surveyed firms, using the mean values and the proportion of each cost type to total cost. Lost output is the highest (76% of total cost). The total mean direct outage cost for the surveyed firms totalled US$26997 in 2009. Using the mean of the total direct cost components, the total outage costs of the surveyed firms (260) was calculated to be US$7015220. The total cost for the sector (27757 firms) translates to US$749355729. Direct cost per Industry class Table 12 shows the decomposition of cost by industry class. Table 12 Decomposition of Direct cost by industrial classification
Industry Class
Output loss cost (US$)
Labour cost (US$)
Material destruction cost (US$)
Other direct cost (US$)
Total Direct Cost (US$)
Manufacturing Food and Beverage 850843 130544 209773 91513 128267
3 Paper, Wood and Rubber 302080 119644 205465 50845 678034 Textile and leather 756200 54000 289250 93750 119320
0 Drugs and Chemicals 146733
5 63273 84273 49091 166397
1 Engineering and construction 144822
9 95300 131349 68200 174307
8 Agro-‐based and Tobacco 99429 12857 17143 12000 141429 Services Wholesale and Retailing 251143 35206 59794 20646 366789 Communication and Networking
874000 54500 46950 45800 1021250
Tourism, Leisure and Hospitality
44000 45563 36188 15750 141500
Transport and Automobile services
44682 13855 15218 12682 86436
Commercial and Tertiary services
33081 18452 18943 17743 86219
Education, Health, and Gvt 13896 7580 4600 9140 35216
Restart costs 616 2.3 Damage to equipment 213 0.8 Sub-‐Total 26997 100 Labour cost savings 0 0 Total Cost 26997 100

Business and Social Sciences Review (BSSR) Vol . 1, No . 9, (Mar -‐ 2012) www.bssreview.org ISSN: 2047-‐6485
51
Copyright © 2012 – Society of Business and Social Sciences
NGOs and Humanitarian Services
1000 1000 1500 1500 5000
Other Services (e.g.consultancy)
80000 80000 40000 18000 218000
TOTAL 7004340
Of the surveyed manufacturing firms, drugs, chemicals, and engineering and construction firms reported the highest output loss cost. Food and beverages reported the highest cost of labour and material destruction, while agro-‐based and tobacco firms reported the least. Agro-‐based and tobacco firms reported the lowest cost of all classes of cost. For the services sectors, communication and IT firms reported the highest value of services lost and total direct cost. Other services (consultancy and repairs) reported the highest labour cost and material or information destruction cost and other costs (restart and damage to equipment). NGOs and humanitarian services reported the least cost of all classes. From the direct cost for each industry class (see Table 12), the total direct cost for the firms was obtained by summing the value of output lost, labour cost, material destruction cost and other cost (restart cost and damage to equipment cost). For the surveyed firms, the total direct cost was US$7444795 in 2009. The cost figure must be added to the total direct cost obtained by using the mean direct outage cost figure (Table 11). Distribution of Direct cost per kWh lost by the Industrial sector For the surveyed firms, the direct cost per kWh lost was obtained by dividing the total direct cost by total number of kWhs unsupplied by the utility provider. Table 13 shows direct cost per kWh lost by firms using the following distinctions: power supply capacity, scale of operation, location and industrial classification sector. The HC firms reported higher direct cost per unsupplied kWh than the LC firms. Similarly, large scale firms reported higher direct cost per kWh unsupplied than small scale firms. Table 13 also shows that there was a high variation in the cost incurred by different firms. Firms located in Kwekwe reported the highest direct cost per kWh, followed by firms in Harare, while firms in other small towns and growth point areas reported the lowest direct cost per kWh. Of the surveyed firms, those in manufacturing had a direct cost ranging between US$4 and US$19 per kWh lost. Drug and chemical producing firms reported the highest direct cost per kWh lost and agro-‐based and tobacco firms, the lowest. For the service sectors, the cost per kWh lost ranged between US$0.3 and US$18, highest for communication and IT firms and lowest for NGOs and humanitarian services.

Business and Social Sciences Review (BSSR) Vol . 1, No . 9, (Mar -‐ 2012) www.bssreview.org ISSN: 2047-‐6485
52
Copyright © 2012 – Society of Business and Social Sciences
Table 13 Distribution of per kWh direct cost by power capacity, scale, location and class
Factor Capacity
Cost per kWh
unsupplied (US$)
Electricity supply capacity
Low Capacity Firms (LC) 11
High Capacity Firms (HC) 19 Scale of Production Small scale 7 Medium scale 12 Large scale 18 City of Location Harare 17 Bulawayo 12 Gweru 5 Mutare 10 Masvingo 12 Kwekwe 19 Kadoma 14 Chegutu 9 Chinhoyi 11 Victoria Falls 13 Kariba 7 Other Small Towns and Growth Point
Areas 4
Industry Sectors Manufacturing Sectors Food and Beverage 10 Paper, Wood and Rubber 9 Textile and leather 8 Drugs and Chemicals 18 Engineering and construction 15 Agro-‐based and Tobacco 4 Services Sectors Wholesale and Retailing 9 Communication and IT 19 Tourism, Leisure and Hospitality 7 Transport and Automobile services 6 Commercial and Tertiary 5 Education, Health, and Gvt Institutions 2 NGOs and Humanitarian Services 0.3 Other Services 3 Based on an average kWh cost of US$7.94, the total direct cost incurred by surveyed firms due to unsupplied kWhs was calculated to be US$7286680 in 2009. The average cost for
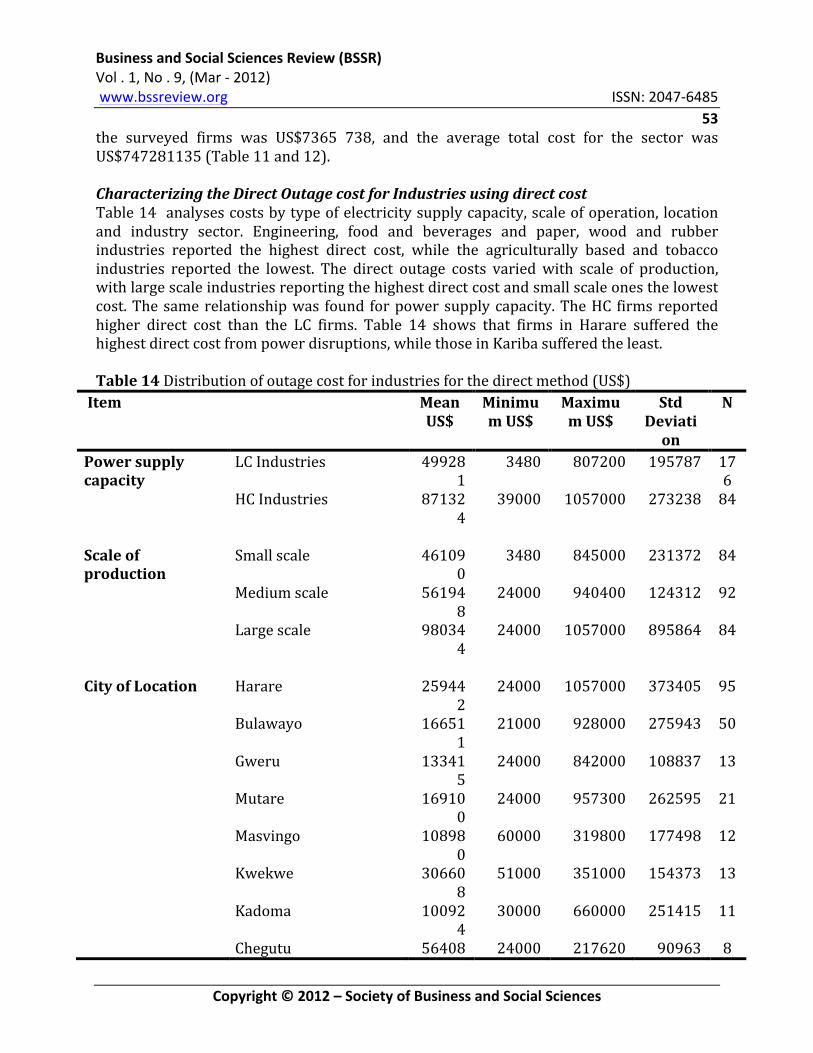
Business and Social Sciences Review (BSSR) Vol . 1, No . 9, (Mar -‐ 2012) www.bssreview.org ISSN: 2047-‐6485
53
Copyright © 2012 – Society of Business and Social Sciences
the surveyed firms was US$7365 738, and the average total cost for the sector was US$747281135 (Table 11 and 12). Characterizing the Direct Outage cost for Industries using direct cost Table 14 analyses costs by type of electricity supply capacity, scale of operation, location and industry sector. Engineering, food and beverages and paper, wood and rubber industries reported the highest direct cost, while the agriculturally based and tobacco industries reported the lowest. The direct outage costs varied with scale of production, with large scale industries reporting the highest direct cost and small scale ones the lowest cost. The same relationship was found for power supply capacity. The HC firms reported higher direct cost than the LC firms. Table 14 shows that firms in Harare suffered the highest direct cost from power disruptions, while those in Kariba suffered the least. Table 14 Distribution of outage cost for industries for the direct method (US$)
Item Mean US$
Minimum US$
Maximum US$
Std Deviation
N
Power supply capacity
LC Industries 499281
3480 807200 195787 176
HC Industries 871324
39000 1057000 273238 84
Scale of production
Small scale 461090
3480 845000 231372 84
Medium scale 561948
24000 940400 124312 92
Large scale 980344
24000 1057000 895864 84
City of Location Harare 25944
2 24000 1057000 373405 95
Bulawayo 166511
21000 928000 275943 50
Gweru 133415
24000 842000 108837 13
Mutare 169100
24000 957300 262595 21
Masvingo 108980
60000 319800 177498 12
Kwekwe 306608
51000 351000 154373 13
Kadoma 100924
30000 660000 251415 11
Chegutu 56408 24000 217620 90963 8

Business and Social Sciences Review (BSSR) Vol . 1, No . 9, (Mar -‐ 2012) www.bssreview.org ISSN: 2047-‐6485
54
Copyright © 2012 – Society of Business and Social Sciences
Chinhoyi 94335 3480 257000 54338 16 Victoria Falls 30860
0 48000 856000 305284 12
Kariba 42000 24000 60000 135.00 2 Other Small towns/GPA 12300
0 108000 138000 21213 7
Industrial sector: Manufacturing Food and Beverage 37267
3 23400 657000 894565 43
Paper, Wood and Rubber
308803
60000 459600 567801 33
Textile and leather 199320
24000 464160 161777 8
Drugs and Chemicals 266397
72000 415868 71212 11
Engineering/construction
487307
34800 741904 117655 42
Agro-‐based and Tobacco
101429
24000 278000 88469 7
Services Wholesale and Retailing 366789
42000 878000 330164 21
Communication and IT 521250
30000 1057000 394072 12
Tourism and Hospitality
841500
48000 1036000 514483 16
Transport and Automobile
186436
24000 673200 194009 22
Commercial Tertiary 158219
21000 780000 215335 31
Education, Health and Gvt
105216
24000 480000 141891 10
NGOs and Humanitarian
33000 24000 42000 12728 2
Other Services 13000 6000 19000 6000 2 Direct cost as a function of duration for the Industrial Sector The relationship between direct cost and outage duration of firms by electricity supply capacity, scale of operation, location and industrial classification are shown in Figure 1. Figure 1a compares the mean direct cost for: 1 hour, 2 hours, 6 hours and 12 hours outage durations by industrial sectors. The longer the duration of the outage, the higher the outage cost. All industry sectors reported lower cost for a shorter outage duration. Communication and IT services firms reported the highest direct cost, sharply increasing with duration of outage, followed by engineering, drugs and chemicals firms.

Business and Social Sciences Review (BSSR) Vol . 1, No . 9, (Mar -‐ 2012) www.bssreview.org ISSN: 2047-‐6485
55
Copyright © 2012 – Society of Business and Social Sciences
Figure 8.1 Average Direct outage cost per duration per class, capacity, location and scale
0
10000
20000
30000
40000
50000
60000
70000
1 2 6 12
Direct Outage cost (U
S$)
Outage duraSon (hours)
1a:Mean direct outage cost per duraJon by industrial classificaJon
Food and Beverage
PlasJc, Wood, Rubber TexJle and leather
Drugs and Chemicals Engineering
Agro-‐based
Wholsale and Retailing CommunicaJon and IT Tourism and Hospitality Transport services
Commercial services EducaJon and Health NGOs
Other Services
0
10000
20000
30000
40000
50000
60000
1 2 6 12
Direct Outage cost (U
S$)
Outage duraSon (hours)
1b: Mean direct outage cost per duraJon by power supply capcity for
firms
LC Firms
HC Firms
0
5000
10000
15000
20000
25000
30000
35000
1 2 6 12
Direct Outage cost (U
S$)
Outage duraSon (hours)
1c: Mean direct outage cost per duraJon by locaJon Harare
Bulawayo
Gweru
Mutare
Masvingo
Kwekwe
Kadoma
Chegutu
Chinhoyi
Vic Falls
Kariba
Other
0
10000
20000
30000
40000
50000
60000
1 2 6 12
Direct Outage cost (U
S$)
Outage duraSon (hours)
1d: Mean direct outage cost per duraJon per scale of producJon
Small scale
Medium scale
Large scale

Business and Social Sciences Review (BSSR) Vol . 1, No . 9, (Mar -‐ 2012) www.bssreview.org ISSN: 2047-‐6485
56
Copyright © 2012 – Society of Business and Social Sciences
For the same duration periods, Figure 1b compares the mean direct cost between HC firms and LC firms in terms of electricity supply capacity. Figure 1c compares this relationship for different locations. Firms located in Kwekwe reported the highest direct cost, followed by those in Harare, while those located in other small towns and growth point areas reported the lowest. Figure 1d makes a similar comparison in terms of scale of production. All relationships shown are positive and increasing. Deterred Investment and unemployment by Industrial sectors Power outages were also analysed in terms of the effects and problems they cause, such as unemployment (Table 15). Table 15 Unemployment caused by outages to firms Industry Sectors Classes of Industries Number of workers Laid off
Manufacturing
Food and Beverage 71
Paper, Wood and Rubber 179 Textile and Leather 225 Drugs, Chemicals and
Paint 247
Engineering and Construction
636
Agro-‐based and Tobacco 18 Services Wholesale and Retailing 19 Communication and IT 13 Tourism and Hospitality 0 Transport and Automobile 12 Commercial and Tertiary 538 Education, Health, and Gvt 8 NGOs and Humanitarian 0 Other services 0 Outages result in workers being laid-‐off, either through closure of some units or inability to pay due to high operational costs. Engineering firms reported the highest number of workers laid off, followed by firms in tertiary and commercial services, while firms in tourism and hospitality, NGOs and other services reported zero labourers laid off. Backup Cost Estimation for Industries Backup cost was computed using the cost of acquiring and running backup equipment by firms. Firms purchased backup equipment such as generators, solar panels, UPS, coal boilers and gas stoves so that they could continue to produce during outages.

Business and Social Sciences Review (BSSR) Vol . 1, No . 9, (Mar -‐ 2012) www.bssreview.org ISSN: 2047-‐6485
57
Copyright © 2012 – Society of Business and Social Sciences
Availability, type of backup equipment and use of backup equipment by firms The nature and type of backup equipment used by firms is shown in Table 16. This table shows that firms invested in many different types of backup equipment. Of the surveyed firms, 61.9 percent had private generators only as backup equipment, 27.3 percent had generators and UPSs and only 3 percent only had UPSs, diesel pumps and solar panels. Table 16: Backup equipment used by firms Frequency Percentage Generator only 143 61.9 UPS only 6 2.6 Generator and UPS 63 27.3 Generator and Diesel Pump 8 3.5 Generator, Diesel Pump and UPS 2 0.9 Diesel Pump and Solar 1 0.4 Generator, Boiler and Gas 7 3.0 Generator and Solar 1 0.4 Among the surveyed firms, 15 reported having three generators and 12 reported having two generators on site. Some of these firms reported that the generator sets were used to power different production plants at the same time during outages. The generators mostly used were connected to the electricity distribution box so that any outage triggered the generator. UPSs are used in commercial tertiary services, such as accounting, banking and insurance for safe serving and up-‐keeping of data bases. The importance of the backup equipment is reflected in the proportion of firms’ production covered by the backup supply during outages (Table 17). Table 17 Proportion of firms’ operations/services powered by backup equipment Proportion powered by own generation/savers
Frequency Percentage
1-‐10% 22 9.5 11-‐20% 20 8.7 21-‐50% 79 34.2 51-‐75% 65 28.1 76-‐99% 27 11.7 100% 18 7.8
About 8 percent of the surveyed firms reported that their operations were covered in full (100%) during outages and 34.2 percent reported cover by between 21 and 50 percent. The power crisis to firms is also shown by the average duration of backup use during outages (Table 18) and frequency of times of backup use per week (Table 19).

Business and Social Sciences Review (BSSR) Vol . 1, No . 9, (Mar -‐ 2012) www.bssreview.org ISSN: 2047-‐6485
58
Copyright © 2012 – Society of Business and Social Sciences
Table 18 Average hours of backup use by firms per week Average backup time use per outage (hours)
Frequency Percentage
1-‐2 30 13.2 3-‐4 142 61.5 5-‐6 45 19.5 7-‐9 8 3.6 10-‐11 3 1.3 12+ 2 0.9
The majority of firms surveyed (61.5%) used backup equipment to power operations for an average duration of 3 to 4 hours per outage. The average time of backup use was 4 hours which translates into almost half (½) of a working day (8 hours). Table 19 Frequency of backup equipment use per week by firms Frequency(times) per week Frequency(outcome) Percentage
1-‐2 55 23.8 3-‐4 120 51.9 5-‐6 36 15.6 7 20 8.6
Table 19 shows the reported frequency of use of backup equipment by firms per week. Among the surveyed firms, about 52 percent used backup equipment 3 to 4 times per week, 15.6 percent used backup equipment 5 to 6 times per week, 8.6 percent used backup 7-‐8 times per week and 23.8 percent used backup 1 to 2 times per week. The average frequency of use was 4 per week. The use of backup time for 7 times a week shows that some firms experienced daily outages. The majority (76.1%) used backup equipment more than 3 times per week to power operations. Investment in backup equipment and period of use by firms Firms invested significant amounts in backup capital equipment. Table 20 shows the total investment devoted by firms in their own electricity backup facilities, capacity of backup equipment and the years of backup use. Table 20 Descriptive Information for backup equipment cost (US$) owned by firms
Item Backup equipment Minimum Maximum Mean
Standard Deviatio
n Cost (US$) Generator 1500 1200000 64382 118300 UPS 340 15000 1806 1836 Diesel Pump 200 6000 2526 1551 Gas or Coal Boiler 50 4300 985 517

Business and Social Sciences Review (BSSR) Vol . 1, No . 9, (Mar -‐ 2012) www.bssreview.org ISSN: 2047-‐6485
59
Copyright © 2012 – Society of Business and Social Sciences
Solar Panel 120 14000 4800 2344 Capacity Generator (kVa) 10 3600 120 370 Diesel Pump (HP) 3 24 12 6 Solar Panel (kW) 10 1000 220 185 UPS (VA) 300 40000 6400 4865 Years in Use
Generator 1 15 4 3
UPS 1 4 2 1.8 Diesel pump 1 12 5 1.8 Gas or Coal Boiler 1 7 4 1.9 Solar Panel 1 7 3 1.5 The investment cost varies with the type and capacity of backup equipment. Generators are the highest cost with values ranging from a minimum of US$1500 to a maximum of US$1200000 for one large generator. UPS follows generators in cost ranging from US$340 for one of the small UPS to US$15000 for one of the largest UPS. The capacity of backup equipment differs with the type of equipment. The capacity of a generator is measured in kVa. These range from 10 kVa for one of the small generators to 3600 kVa for one of the largest generators. The capacity of UPSs is measured in Volts Amps (VA) ranging from 300VA to a maximum of 40000VA. Solar panels range from 10kW to 1000kW and diesel pumps range in horse power (HP) from 3HP to 24HP. The number of years in use of the backup equipment varied from 1 to 15 years (Table 20). The mean years of use were 4 years for generators, 2 for UPSs, 5 for diesel pumps, 4 for gas and coal boilers and 3 for solar panels. Cost structure of own generators for firms Table 21 shows the cost of generators. Of the running cost, fuel, oil and grease are the main components. Table 21 Mean cost structure of own generation by firms in terms of cost items
Item Cost (US$) As % of Total cost
Capital Item Generator Cost 64382 98.71 Installation cost (transport, house, oil tank) 840 1.29 Total Capital cost 65222 100 Operating Cost Item Fuel, oil and grease cost 15642 84.08

Business and Social Sciences Review (BSSR) Vol . 1, No . 9, (Mar -‐ 2012) www.bssreview.org ISSN: 2047-‐6485
60
Copyright © 2012 – Society of Business and Social Sciences
Labour cost (wages and salaries) 1745 9.38 Maintenance cost 1217 6.54 Total Running Cost 18604 100
The decomposition of cost of investing in backup equipment and that of running the equipment by industrial classification is shown in Table 22. Table 22 Capital and running cost by industry class (US$)
Industry Classification
Average Generator cost (US$)
Average fuel cost (US$)
Average Maintenance cost (US$)
Average labour
cost (US$)
Manufacturing sectors Food and Beverage 72785 26890 1799 6305 Paper, Wood and Rubber 136839 27652 2922 5332 Textile and leather 49167 33200 1425 5700 Drugs and chemicals 173800 46380 2620 7020 Engineering and construction 53962 33004 1727 6882 Agro-‐based and Tobacco 7429 29657 1621 2914 Services sectors Wholesale and Retailing 12706 18353 1288 2141 Communication and IT 113727 40909 3736 3632 Tourism, Leisure and Hospitality
49344 18863 2247 3488
Transport and Automobile 27074 11811 1367 3244 Commercial tertiary services 17518 11897 1441 1243 Education, Health, and Gvt 20375 14550 1288 3100 NGOs and Humanitarian 8750 5100 1425 2700 Other Services 15000 6000 950 1200 Among firms in the manufacturing sector, those producing drugs and chemicals reported the highest average capital cost and firms manufacturing agro-‐based products reported the lowest capital cost per year. Measuring the Backup Cost for Firms The annualized capital cost depends on the price schedule of the generator (which was linearly related to generator capacity), depreciation rules and the interest rates. The annualized generator cost was obtained by dividing the generator cost by the number of years in use of the generator, deducting 15% depreciation for each year, using the reducing balance method and discounting the values using the prevailing interest rate, i.e. 10%. The generator annualized kVa cost was converted to kW cost using the power factor (0.8kVa = kW). Other capital costs, such as generator house, stabilizer, fuel and oil tanks, were also annualized and converted to cost per kW. The annualized generator cost, plus annualized other capital cost, yielded the total annualized capital cost per kW of electricity and was converted to kWh (energy terms). The operating costs were mainly fuel, oil and grease,

Business and Social Sciences Review (BSSR) Vol . 1, No . 9, (Mar -‐ 2012) www.bssreview.org ISSN: 2047-‐6485
61
Copyright © 2012 – Society of Business and Social Sciences
labour and maintenance cost. These were also converted to cost per kWh. The annualized cost per kWh was also computed by summing annualized per kWh costs. The cost of insuring the firm against power outage per kWh by own electricity generation was estimated as the cost per kWh unsupplied. Table 23 shows cost per kWh for the electricity supply capacity, scale of operation, location and industrial class for the surveyed firms. The HC firms reported a higher cost than the LC firms. For the scale of production, large firms reported a higher cost than the small scale firms. Among the firms surveyed, those in engineering reported the highest backup cost per kWh and agro-‐based firms the lowest. The average backup cost per kWh lost for the industry, using the industry classification, was calculated to be US$5.15, the total outage cost of the firms surveyed US$6 160 820 and the total backup cost for the sector US$442549320. Table 23 Backup cost for power capacity, scale, location and industrial classification
Factor Consideration Cost per kWh (US$)
Electricity supply capacity Low Capacity Firms (LC) 6 High Capacity Firms (HC) 10 Scale of Production Small scale 4 Medium scale 8 Large scale 13 City of Location Harare 12 Bulawayo 7 Gweru 6 Mutare 8 Masvingo 7 Kwekwe 10 Kadoma 9 Chegutu 5 Chinhoyi 4 Victoria Falls 8 Other Small Towns and GPA 3 Industrial Sectors Manufacturing Industry sectors
Food and Beverage 8
Paper, Wood and Rubber 7 Textile and leather 6 Drugs and Chemicals 10 Engineering and Construction 13

Business and Social Sciences Review (BSSR) Vol . 1, No . 9, (Mar -‐ 2012) www.bssreview.org ISSN: 2047-‐6485
62
Copyright © 2012 – Society of Business and Social Sciences
Agro-‐based and Tobacco 3 Services Industry sectors Wholesale and Retailing 7 Communication and IT 16 Tourism, Leisure and
Hospitality 9
Transport and Automobile Services
3
Commercial and Tertiary Services
4
Education, Health, and Government
1.5
NGOs and Humanitarian Services
0.5
Other Services 3 Computation of Total Outage Cost for the Industry Sector The total cost was obtained by summing the direct and backup costs. In this case, the total cost was calculated to be US$1189830455 (US$747281135 + US$432237491). Industry Outage Cost Impact Assessment The impact of the outage cost for the sector was assessed by comparing it to the GDP of about US$5.4 billion for 2009 (RBZ 2010). The cost of outages for the sector as a proportion of GDP using direct cost was 13.8 percent of GDP and backup, 8.2 percent of GDP; 22 percent in total.
CONCLUSION The power supply crisis in Zimbabwe is unhealthy for development of the industrial sector of the economy. The government has stated its desire to improve capacity utilisation, diversify production, attract foreign investors, expand import substitution and improving the export base for the economy away from agriculture. The findings of this paper show the goals are unlikely to be achieved if for no other reason than power outages. Power outages have a great influence on industrial firms through the disruption of their production operations. In all industrial subsectors, a positive and increasing relationship was found between mean outage cost and outage duration. The longer the outage duration the higher the outage cost. The outage cost per kWh lost was found to exceed the unit price charged by ZESA of US$0.07. It ranged from US$0.3 to US$19 for the direct cost and from US$0.50 to US$16 for the backup cost.

Business and Social Sciences Review (BSSR) Vol . 1, No . 9, (Mar -‐ 2012) www.bssreview.org ISSN: 2047-‐6485
63
Copyright © 2012 – Society of Business and Social Sciences
REFERENCES
Adenikinju, A. 2003. Electric infrastructure failures in Nigeria: A survey-‐based analysis of the cost and adjustment responses. Ibadan, Nigeria:Department of Economics and Centre for Econometric and Applied Research, University of Ibadan,.
Adenikinju, A. 2005. Analysis of the cost of infrastructure failures in a developing economy:
The case of the electricity sector in Nigeria.Nairobi, Kenya: African Economic Research Consortium. Available:www.aerc.org/publications/index.asp
Akinlo, A.E. 2008. Energy consumption and economic growth: evidence from 11 Sub-‐Sahara
African countries, Energy Economics, volume 30, pp. 2391-‐ 2400. Beenstock, M., Goldin, E. & Haitovsky, Y. 1998. Response Bias in a Conjoint Analysis of
Power Outages. Energy Economics, volume 20, no.2,pp. 135-‐156. Bernstein, M. & Heganazy, Y. 1988. Economic costs of electricity shortages: Case study of
Egypt. The Energy Journal, Special Electricity Reliability Issues, volume 9: pp.173-‐88. Bose, R.K., Shukla, M. Srivasta, L. & Yaron, G. 2006. Cost of unserved Power in Karnataka,
India. Energy Policy, volume 34,no. 12, pp. 1434-‐1447. Boston Institute for Development Economics. 2006. Impact of privatisation in Africa:
Synthesis of Eight Case Studies. Public Private Infrastructure Advisory Facility. Calderon, C. 2008. Infrastructure and Growth in Africa. Working Paper, Africa Infrastructure Country Diagnostic. Confederation of Zimbabwean Industries (CZI). 2009. Manufacturing Sector Survey for
2009. Harare, Zimbabwe. De Nooij, M., Kopmans, C. & Bijvoet, C.2006. The value of supply security and cost of power
interruptions: Economic input for damage reduction and investment in networks. Sciecne Technology Journal, volume 23, pp. 231-‐256.
Ebohon, O.J. 1996. Energy, economic growth and causality in developing countries: a case
study of Tanzania and Nigeria. Energy policy, volume 24, no.5, pp. 447-‐453. Energy Sector Management Assistance Programme (ESMAP). 2005. Annual report Eto, J., Koomey, J., Lehman, B., Martin, N., Mills, E., Webber, C. & Worrell, E. 2001. Scoping
Study on Trends in the Economic Value of Electricity Reliability to the U.S. Economy. Barkeley, CA: LawrenceBerkeley National Laboratories, Pub LBNL-‐47911: pp. 1-‐23.

Business and Social Sciences Review (BSSR) Vol . 1, No . 9, (Mar -‐ 2012) www.bssreview.org ISSN: 2047-‐6485
64
Copyright © 2012 – Society of Business and Social Sciences
Eto, J., Divan, D. & Brumsickle, W. 2004. Pilot Evaluation of Electricity-‐Reliability and Power-‐Quality Monitoring in California's Silicon Valley with the I-‐Grid System.Barkeley, CA: Lawrence Berkeley National Laboratory. LBNL-‐52740: pp. 1-‐34.
European Commission.1993. Growth, competitiveness, employment: the challenges and ways
forward into the 21st century. European Union, Brussels: White paper COM (93) 700. Ferguson, R., Wilkinson, W. & Hill, R. 2000. Electricity use and economic development.
Energy Policy, volume 28, pp. 923-‐934. Kayo, D. 2001. Power sector reform in Zimbabwe: Proceedings of a reginal policy seminar on
power reforms in Africa. Nairobi, Kenya: AFREPREN. Available:www.afrepre.org /Pubs/wpp1.htm.
Lawton, L., Sullivan, M., Van Liere, K. & Katz, A. 2003. Characteristics and trends in a
National Study of Consumer Outage Costs.San Francisco, CA: Population Research System, LLC.
Lee, K.S.& Anas, A. 1991. Manufacturers’ responses to infrastructure deficiencies in Nigeria: Private alternative and policy options. Economic Reform in Sub-‐Saharan Africa, A World Bank Symposium.
Lee, C. & Chang, C. 2006. The impact of energy consumption on economic growth: Evidence
from linear and nonlinear models in Taiwan. Energy volume, volume 32, no.12, pp. 2282-‐2294.
Mangwengwende, S.E. 2002. Tariffs and Subsidies in Zimbabwe' reforming electricity
industry: Steering a utility through turbulent times. Energy Policy, volume 30, pp. 947-‐958
Mangwengwende, S.E. 2003. Improving Electricity Service Delivery for Urban Poor
Zimbabwe's Experience. Washington, DC: World Bank Energy Lecture Series. Mangwengwende, S.E. 2005. Increasing Electricity Access While Ensuring Financial Viability:
A Perspective form the African Electricity Industry. Nairobi, Kenya:Global Network on Energy For Suatinable Development (GNESD).
Ministry of Energy and Power Development.2009.Annual Report, Harare, Zimbabwe Ministry of Industry.2009.Annual Report. Harare, Zimbabwe. Pollit, M., Jamasb, T. & Yu, W. 2006. Incoporating the price of Quality in Efficiency Analysis:
The case of Electricity Distribution Regulation in the UK. Cambridge, UK: University of Cambridge,

Business and Social Sciences Review (BSSR) Vol . 1, No . 9, (Mar -‐ 2012) www.bssreview.org ISSN: 2047-‐6485
65
Copyright © 2012 – Society of Business and Social Sciences
Primen. 2001. The Cost of Power Disturbances to Industrial and Digital Economy Companies. Primen; TR-‐1006274. Available: EPRI. June 29. Madison WI.
Reserve Bank of Zimbabwe (RBZ). 2010. Monetary Policy Statement.
Available:www.rbz.co.zw/inc/publications/legaldept/rbzpdfs/ Rose, A. & Lim, D. 2002. Business Interruption Losses from Natural Hazards: Conceptual
and Methodology Issues in the Case of the Northridge Earthquake. Environmental Hazards: Humanand Social Dimensions,volume 4, pp.1-‐14.
Rose, A., Oladosu, G. & Salvino, D. 2004. Regional Economic Impacts of Electricity Outages in
Los Angeles: A Computable General Equilibrium Analysis. In M. Crew & M. Spiegel (Eds.).Obtaining the Best from Regulation and Competition.Dordrecht: Kluwer.
Rosenberg, N. 1998. The role of electricity in industrial development. The Energy Journal,
volume 19, no. 2, pp. 7-‐24. Templet, P.H. 1999. Energy, diversity and development in economic systems: an empirical
analysis. Ecological Economics, volume 30, no. 2, pp. 223-‐233. Tierney, K. 1997.Impacts of Recent Disasters on Businesses: The 1993 Midwest Floods and the
1994 Northridge Earthquake. In Jones, B. (Ed.).Economic Consequences of Earthquakes: Preparing for the Unexpected. Buffalo, NY: National Center for Earthquake Engineering Research.
World Bank. 2004a.Making Services Work for Poor People. World Development Report.
Washington, DC: The World Bank. World Bank.2004b.Azerbaijan. Raising Rates: Short-‐Term Implications of Residential
Electricity Tariff Rebalancing. Europe and Central Asia Environmentally and Socially Sustainable Development Department Report, no. 30749-‐AZ.
World Bank. 2008.Africa’s Power Supply Crisis: Unravelling the Paradoxes. Washington DC:
pp. 74-‐78. Yamane, T. 1967. Statistics: An Introductory Analysis. 2ndEdition. New York, USA: Harper
and Row. ZESA. 2006.Harare, Zimbabwe: Annual Report. ZESA. 2007.Harare, Zimbabwe: Annual Report. ZESA. 2009.Harare, Zimbabwe: Annual Report. Zimbabwe Power Company, subsidiary of ZESA. 2009.Annual Report.

Business and Social Sciences Review (BSSR) Vol . 1, No . 9, (Mar -‐ 2012) www.bssreview.org ISSN: 2047-‐6485
66
Copyright © 2012 – Society of Business and Social Sciences
DISCLAIMER All the contributions are published in good faith and intentions to promote and encourage research activities around the globe. The contributions are property of their respective authors/owners and BSSR is not responsible for any content that hurts someone’s views or feelings etc.
Chief Editor BSSR