voice source characteristics in different registers in ... · voice source characteristics in...
TRANSCRIPT
Dept. for Speech, Music and Hearing
Quarterly Progress andStatus Report
Voice source characteristicsin different registers in
classically trained femalemusical theatre singers
Bjorkner, E. and Sundberg, J. and Cleveland,T. and Stone, E.
journal: TMH-QPSRvolume: 46number: 1year: 2004pages: 001-011
http://www.speech.kth.se/qpsr


TMH-QPSR, KTH, Vol. 46, 2004
Speech, Music and Hearing, KTH, Stockholm, Sweden TMH-QPSR, KTH, Vol. 46: 1-11, 2004
1
Voice source characteristics in different registers in classically trained female musical theatre singers Eva Björkner12, Johan Sundberg1, Tom Cleveland3 and Ed Stone3
1 Department of Speech Music Hearing, KTH, Stockholm, Sweden 2 Laboratory of Acoustics and Audio Signal Processing, Helsinki University of Technology, Finland 3Vanderbilt Voice Center, Dept. of Otolaryngology, Vanderbilt Univ. Medical Center, Nashville, TN
Abstract Musical theatre singing typically requires females to use two vocal registers. Physiological differences between these registers, however, have not been explicated. Our investigation considered voice source and subglottal pressure Ps characteristics of these registers, here referred to as chest and head register. These were studied by inverse filtering the oral airflow recorded for a sequence of /pae/ syllables sung at constant pitch and decreasing vocal loudness in each register by seven female professional musical theatre singers. Ten equidistantly spaced Ps values were selected and the relationships between Ps and several parameters were examined; closed quotient Qclosed, peak-to-peak pulse amplitude Up-t-p, negative peak of the differentiated flow glottogram, i.e., the maximum flow declination rate (MFDR) and the normalised amplitude quotient (NAQ) [Up-t-p/ (T0*MFDR)] where T0 is the fundamental period. Ps was typically slightly higher in chest than in head register. As Ps influences the measured glottogram parameters, these were also compared at an identical Ps of 11 cm H2O. Results showed that for typical tokens MFDR and Qclosed were significantly greater while NAQ and Up-t-p were significantly lower in chest than in head. These observations can be explained if vocal fold thickness is assumed to be greater in chest register.
1. Introduction According to Titze (1994) “The term register has been used to describe perceptually distinct regions of vocal quality that can be maintained over some ranges of pitch and loudness”. Vocal register is a phenomenon of great relevance in vocal art, particularly in female singing. An important task in singing training, regardless of style, is to teach the student how to master the transition from one register to the other with minimal timbral changes. The register used in the lower part of the female pitch range is generally referred to as chest or modal, and the register used in the adjacent higher part as head or middle, henceforth chest and head register, respectively. The transition between these registers occurs somewhere between the pitches of C4 and A4 (264 Hz and 440 Hz)(Sundberg & Kullberg, 1999).
It is generally agreed that vocal registers reflect voice source characteristics such as the relative duration of the closed phase Qclosed, the
peak-to-peak pulse amplitude Up-t-p, and the negative peak of the differentiated flow glotto-gram, i.e., the maximum flow declination rate (MFDR). All these parameters are heavily influenced by two physiological voice control parameters, subglottal pressure Ps and glottal adduction. For example, with increased glottal adduction Qclosed tends to increase, and Up-t-p tends to decrease (Hertegård et al., 1989). Hence it seems reasonable to analyse these parameters in a study of vocal registers.
The so-called Normalised Amplitude Quotient (NAQ) has been launched as a measure of glottal adduction (Alku et al., 2002). It is defined as the ratio between Up-t-p/(T0*MFDR). In a one-singer subject investigation, NAQ was found to correlate with the degree of perceived phonatory pressedness (Sundberg et al., 2002). The same study also showed that the NAQ parameter differed between styles of singing.
In classical singing, mainly the head register is used while in non-classical styles, like pop, jazz and blues, chest is used more commonly.

Björkner E et al.: Voice source characteristics in different registers ....
2
The repertoire in musical theatre, on the other hand, demands a perfect control of both registers. In the education of musical theatre singing, classical training is often considered a recommendable platform. In this repertoire, high subglottal pressures are typically used. Such pressures are commonly assumed to jeopardise vocal health. To find out to what extent and under what conditions this is true, a better description and knowledge of the register function in female singing is needed. Such knowledge should be valuable also to vocal training and therapy. As a step towards this goal, the present investigation studies the register function in professional female musical theatre singers by analysing their voice source charac-teristics, paying special attention to the influence of subglottal pressure on these characteristics.
2. Material and Methods 2.1 Subjects and recording Seven female musical theatre singers between the ages of 17-43 years, all classically trained, volunteered as subjects (Table 1).
Table 1. Singer subjects data, including the pitches chosen. Singer Age Years of Pitch chosen experience chest head MAR 43 14 Eb4 Eb4
PAT 37 17 C4 C4
SUB 39 11 G4 G4
COX 29 10 E4 F4
CIE 25 12 E4 Eb4
JUL 39 25 F4 F4
AL 17 None F4 F4
Their task was to sing a sequence of the syllable /pae/ at a pitch where they could use both chest and head register. This pitch varied between C4 and G4 for different subjects. They initiated the sequence at high lung volume and at maximum degree of vocal loudness and continued while gradually decreasing vocal loudness. They were asked to perform this sequence three times first in chest and then three times in head register. The vowel /ae/ was
chosen since its high first formant adds to the reliability of inverse filtering and the oral pressure during the p-occlusion allows estima-tion of Ps.
The flow signal was recorded using the Rothenberg mask, a specially designed pneumo-tachograph for capturing oral flow. The subject held a plastic tube, inner diameter 4 mm, in the corner of her mouth for recording oral pressure. The audio signal outside the mask was recorded from a microphone at a distance of 30 cm from the lips. All these signals plus an EGG signal (Glottal Enterprises) were recorded on a multi-channel digital recorder [TEAC RD 180 PCM].
2.2 Analysis The effect of Ps variation on the voice source can be ideally analysed by examining glottal parameters as a function of several equally spaced Ps values. Therefore, for each subject and register ten Ps-values were selected. These values were gained by computing the singer’s total Ps variation range in the three takes. This range was divided by 9, thus yielding 10 equidistantly spaced ideal Ps values. The Ps values closest to these ideal values were then identified from the three takes and selected for further analysis. The entire material thus con-sisted of a total of 140 samples, ten for each register and singer, respectively.
Subject MAR produced emphatic /p/ explosions in her head register recordings, as demonstrated by sharply peaked oral pressure peaks (Hertegård et al., 1995). Following the recommendation of Hertegård, the estimates of Ps in these cases were taken from the dis-continuity appearing in the initial part of the pressure peak.
2.3 Listening test Informal listening to the subjects’ samples revealed that some subjects produced very small timbre differences between the registers. Hence, a computerised listening test (Judge, Svante Granqvist) was run with a panel of three voice experts. Their task was to rate along a visual analogue scale how representative the various 280 sung samples (10 degrees of vocal loudness x 2 registers, x 2 presentations of each sample) were of chest and head register. The subjects were presented with a visual analogue rating scale on the computer display, where 0 marked ‘Chest’ and 1000 was marked ‘Head’ (Figure 1). The program recorded all response settings.

TMH-QPSR, KTH, Vol. 46, 2004
Speech, Music and Hearing, KTH, Stockholm, Sweden TMH-QPSR, KTH, Vol. 46: 1-11, 2004
3
Figure 2 shows the standard deviations as function of the ratings averaged across the three raters. The standard deviations were highest in the center of the scale, as expected. For some singers, the chest and head register data are gathered toward the left and right sides of the graph, respectively, indicating that their chest and head register samples were perceived as clear examples of these registers. Other singers, on the other hand, produced samples that differed less clearly. For singers JUL and AL, most chest register tones were perceived as head register tones. Their data were discarded, as they seemed of limited value to a study of voice source differences between registers.
A total of 16% of the samples received mean ratings in the interval 0 – 250 while 49% of the samples received ratings in the interval 750-1000. In other words, a considerably greater number of samples sounded as sung in head than in chest register. Given this bias it seemed promising to analyse the most typical cases in the first place. The 17 samples that received ratings in the range of 0-250 were thus accepted as ‘clear cases of chest register’ while the 17 samples that received the highest mean ratings were considered as clear cases of head register.
2.4 Voice source analysis Vocal registers are determined by the voice source, the sound produced by the pulsating transglottal airflow. This airflow can be retrieved by inverse filtering the flow signal, i.e., by eliminating the contributions from the vocal tract. Flow glottograms were obtained using the DeCap custom-made program (S. Granqvist). Because of the relatively high pitch, the inverse filtering was sometimes difficult. In such cases, the formant frequencies used for the inverse filtering were checked by using them for synthesising the vowel sound. For this purpose,
Figure 1. The display of the Judge programused for the listening test.
0
50
100
150
200
250
300
350
400
450
500
0 100 200 300 400 500 600 700 800 900 1000
Mean rating [mm]
SD [
mm
]
AL CIE COX
JUL MAR PAT
SUB
Figure 2. Standard deviations of the three experts’ register ratings as function of the averages ofthese ratings. Symbols refer to singer subjects, and filled and open symbols pertain to chest andhead register, respectively.
Björkner E et al.: Voice source characteristics in different registers ....
4
the custom made MADDE synthesiser was used (S. Granqvist) which produces the voice sound resulting from a specified set of formant and fundamental frequencies combined with a standard source spectrum. The formant fre-quency values were adjusted such that a ripple-free closed phase was obtained in the flow glottogram at the same time as the synthesized voice timbre was similar to that of the singer’s original.
From the resulting flow glottograms, period time, Qclosed, Up-t-p and MFDR were measured. In addition, the normalised ratio between pulse amplitude and MFDR, i.e. NAQ was deter-mined. As Ps significantly influences most of these parameters (Sundberg et al., 2002) it seemed relevant to examine their variation with Ps for the two registers.
3. Results 3.1 Statistical analysis A 2-way ANOVA was carried out for the clear cases, with register and singer as factors, see Table 2. Due to a technical problem three pho-nations of singer SUB`s recordings could not be analysed and had to be discarded. While this did not affect the overall analysis her data had to excluded from the statistical analysis.
Results show register as highly significant for all parameters. Factor singer was found to be significant for Ps (p=0.01), Up-t-p (p=0.01) and MFDR (p=0.03). For MFDR, a significant interaction was also found between the two factors register and singer (p=0.03).
A second 2-way ANOVA was carried out for all parameters, again with register and singer as factors. The results show that register was highly significant for the parameters Ps, Qclosed and NAQ, and singer was highly significant for parameter Ps, Up-t-p, MFDR and NAQ. No significant interaction between register and singer was found for any parameter.
Post Hoc Tests were also carried out between singers and Ps. Both Tukey´s test and LSD showed that Ps -values for singer PAT differed significantly from COX, CIE and MAR, who showed no significant differences between each other. This is not surprising since PAT´s Ps-values were notably lower for both registers.
3.2 Acoustic/aerodynamic analysis Figure 3 illustrates the differences between the registers in terms of the means across the 17 clear cases. The mean and SD of Ps were higher for the chest register samples, which also had higher Qclosed and NAQ means, and somewhat higher Up-t-p. The MFDR values were more negative in the chest register. Figure 4, showing mean Ps values, calculated over each subject’s 10 Ps values in each register, show higher values for chest than for head. This was true for all subjects.
As Ps significantly affects glottal parameters and differed between the registers, it is interest-ing to analyse the variation of these parameters with Ps. Figure 5 (left) a illustrates the relation-ship between Ps and Qclosed. Clear register diffe-rences can be observed. Chest register phona-tions (filled symbols) tended to show higher Qclosed values than head register phonations (open symbols). Thus, Qclosed tended to be higher in chest register even though the differences were smaller at lower Ps-values.
The same relationship is illustrated also in Figure 5 (right), showing the relationship be-tween pressure and Qclosed, averaged across subjects. Here pressure is given in terms of the normalized excess pressure, henceforth PSEN, defined as the ratio (Ps - Psthreshold)/Psthreshold
(Titze, 1992). The dashed curves represent an approximation of the data points by means of a power function (Sundberg et al., 1999). The approximation reflects the Qclosed values reason-
Table 2. Result of the ANOVA of the listening test.
Univariate Analysis of Variance
Clear Ps Qclosed Up-t-p MFDR NAQCases
Register s s s s s Singer s ns s s ns Register* s ns ns s ns Singer
Univariate Analysis of Variance
All Ps Qclosed Up-t-p MFDR NAQCases
Register s s ns ns s Singer s ns s s s Register* ns ns ns ns ns Singer
s = significant n = non-significant Significant with alpha = 0.05

TMH-QPSR, KTH, Vol. 46, 2004
Speech, Music and Hearing, KTH, Stockholm, Sweden TMH-QPSR, KTH, Vol. 46: 1-11, 2004
5
ably well, except for the lowest PSEN. The registers differ clearly with respect to the asymptote, reaching 25% and 20% in chest and head registers, respectively. In addition, the growth of Qclosed with increasing PSEN is quicker in chest register. These findings strongly suggest that a longer closed phase is typical of chest as compared to head register.
The relationship between Ps and the other glottal parameters is illustrated in Figure 6. For increasing Ps, MFDR became more strongly negative in both registers (Figure 6, above). The Up-t-p tended to increase with increasing Ps (Figure 6, left); the intersubject scatter could reflect interindividual differences, e.g., with respect to vocal fold length. The statistical analysis asserted a highly significant influence between factor singer and parameters MFDR and Up-t-p.
Figure 6 (right) illustrates the relationship between NAQ and Ps. The general trend is that NAQ decreased with increasing Ps and that chest register values were lower than head register values. The statistical analysis showed that NAQ was affected by register but was different between singers.
As Ps heavily influences glottal parameters, comparisons at identical Ps values are infor-mative. All singers had used a Ps value of 11 cm H2O, approximately, somewhere in their recor-ding, except one who reached a maximum of 9
Ps
0
5
10
15
20
25
Mea
n a
cros
s cl
ear
case
s
ChestHead
Qclosed
0
5
10
15
20
25
30
35
40
45
Mea
n a
cro
ss c
lear
cas
es
Up-t-p
0,00
0,02
0,04
0,06
0,08
0,10
0,12
0,14
Mea
n ac
ross
cle
ar c
ase
s
MFDR
-350
-300
-250
-200
-150
-100
-50
0
Me
an a
cros
s cl
ear
cas
es
NAQ
0,00
0,05
0,10
0,15
0,20
0,25
0,30
Mea
n a
cro
ss c
lear
cas
es
Figure 3. Means across singer subjects of the indicated parameters for the two registers. The meanswere calculated for the clear cases only. The bars represent one standard deviation.
0
5
10
15
20
MAR PAT SUB COX CIE
Ps
[cm
H2
O]
ChestHead
Figure 4. Singer subjects’ mean subglottalpressures Ps for the two registers.

Björkner E et al.: Voice source characteristics in different registers ....
6
Mean Qclosed
0
5
10
15
20
25
30
0 2 4 6 8 10 12
Normalised Excess Pressure
Qcl
ose
d [%
]
Ps & QClosed
0
10
20
30
40
50
0 5 10 15 20 25 30Pressure [cmH2O]
QCl
osed
[%
]MAR
PATSUBCOX
CIE
Figure 5. Closed quotient Qclosed as function of subglottal pressure Ps (left panel) and normalisedexcess pressure (right panel). Filled and open symbols refer to chest and head register,respectively. The right panel shows the mean values for all subjects and the dotted and dashedcurves represent the power function that best approximates these data points.
Ps vs. Up-t-p
0 5 10 15 20 25 30Pressure [cmH2O]
Up-
t-p
[arb
uni
t]
Ps & MFDR
-600
-500
-400
-300
-200
-100
0
0 5 10 15 20 25 30Pressure [cmH2O]
MFD
R
MARPATSUBCOXCIE
Ps & NAQ
0,00
0,10
0,20
0,30
0,40
0 5 10 15 20 25 30Pressure [cmH2O]
NA
Q
Figure 6. The derivative MFDR, the flow amplitude Up-t-p and the NAQ as function of subglottalpressure Ps for the five singers’ ten examples of chest and head register (filled and open symbols,respectively).

TMH-QPSR, KTH, Vol. 46, 2004
Speech, Music and Hearing, KTH, Stockholm, Sweden TMH-QPSR, KTH, Vol. 46: 1-11, 2004
7
cm H2O in head register. Productions at Ps =11 cm H2O in the two registers are compared with regard to sound level and glottogram parameters in Figures 7a - e.
Considering the random variation inherent in the individual data points shown in the figure, several surprisingly clear trends can be ob-served. Ps is the physiological control parameter for vocal loudness and hence closely correlated with sound level (Titze, 1994). On the other hand, depending on various factors, such as vocal fold morphology and pitch level, a given
Ps value will not produce the same sound level in all voices (Titze, 1992). This variability is illustrated in Figure 7a. For all subjects, sound level was higher in chest. This appears to agree with the typical observation that head register at low fundamental frequency, henceforth F0, is difficult to combine with loud phonation. Figure 7b shows that the higher sound level in chest corresponded to a more negative MFDR in all cases except in subject COX, probably depen-ding on her dominant fundamental in head register. The closed phase was clearly longer in chest (Figure 7c). This should produce a strong second partial. At the pitches used, this partial is close to F1, so a stronger second partial will enhance F1, which therefore contributes more to the overall sound level in chest than in head. Thus, the relationship between Ps and sound
level is complicated by a number of factors, including register.
While Up-t-p did not differ consistently between the registers and varied among singers, (Figure 7d), NAQ was consistently lower in chest than in head.
Summarising, the Ps difference between the registers cannot account for all of the differences illustrated in Figure 3, since the differences in Qclosed and NAQ remained even under conditions of an identical Ps value.
Of the glottogram parameters analysed, NAQ seems particularly interesting. It represents a ratio between MFDR, a parameter directly depending on Ps, and Up-t-p, a parameter directly dependent upon glottal adduction. A more detailed analysis of the dependence of NAQ on various glottal control parameters therefore seemed relevant.
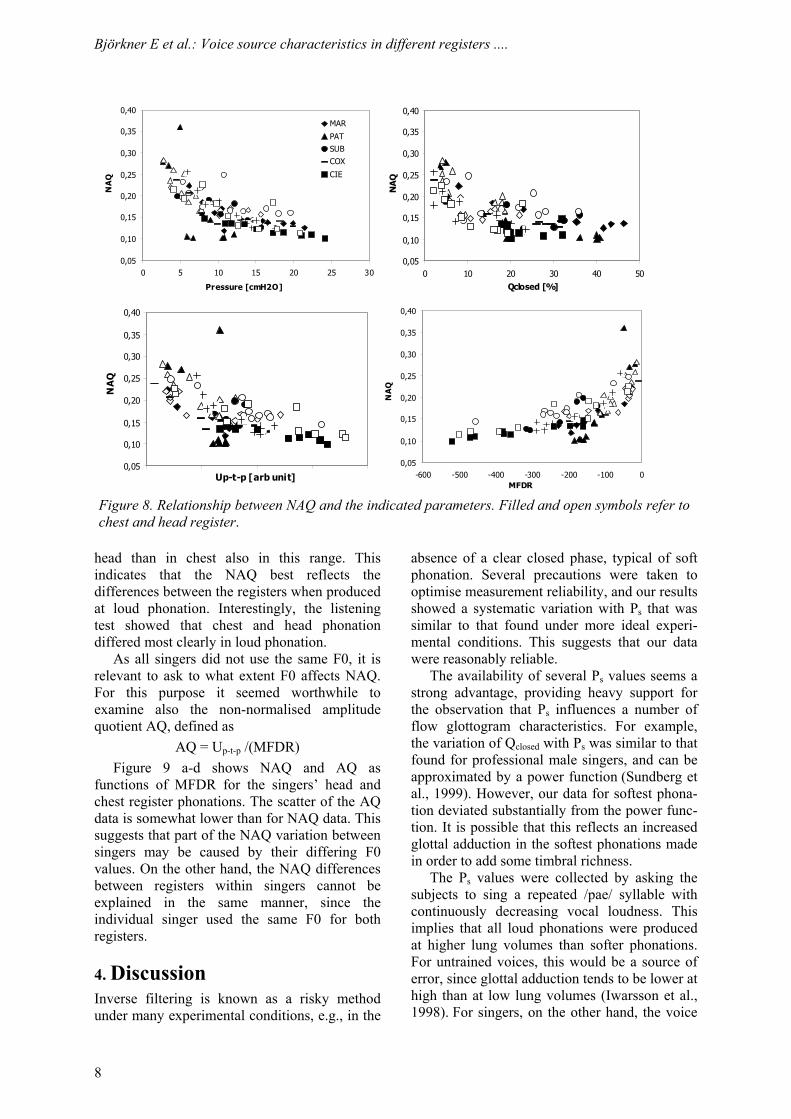
The different panels in Figure 8 illustrate the relationship between NAQ and the different parameters analysed. In general, the NAQ values for head are higher than those for chest register, as expected. Disregarding the consider-able scatter it can be noted that small values of Ps, Qclosed, and Up-t-p, and MFDR values close to zero cause a great variation of NAQ. Thus, the dependence of NAQ on Ps, Qclosed, Up-t-p, and MFDR is almost nil at high values of these parameters. Yet, NAQ tends to be greater in
0
5
10
15
20
25
30
MAR COX CIE SUB
Qcl
osed
[%
]
-50
-40
-30
-20
-10
MAR COX CIE SUB
So
un
d le
vel [
dB
]
chesthead
0
50
100
150
200
250
MAR COX CIE SUB
MFD
R
MAR COX CIE SUB
Up
-t-p
[ar
b u
nit
]0,00
0,05
0,10
0,15
0,20
0,25
0,30
MAR COX CIE SUB
NA
Q
a
e
c
b
d
0
5
10
15
20
25
30
MAR COX CIE SUB
Qcl
osed
[%
]
-50
-40
-30
-20
-10
MAR COX CIE SUB
So
un
d le
vel [
dB
]
chesthead
0
50
100
150
200
250
MAR COX CIE SUB
MFD
R
MAR COX CIE SUB
Up
-t-p
[ar
b u
nit
]0,00
0,05
0,10
0,15
0,20
0,25
0,30
MAR COX CIE SUB
NA
Q
a
e
c
b
d
Figure. 7. Sound level, Qclosed, Up-t-p, MFDR and NAQ for the singers’ phonations at a Ps of11 cm H2O, approximately, in chest and head register.
Björkner E et al.: Voice source characteristics in different registers ....
8
head than in chest also in this range. This indicates that the NAQ best reflects the differences between the registers when produced at loud phonation. Interestingly, the listening test showed that chest and head phonation differed most clearly in loud phonation.
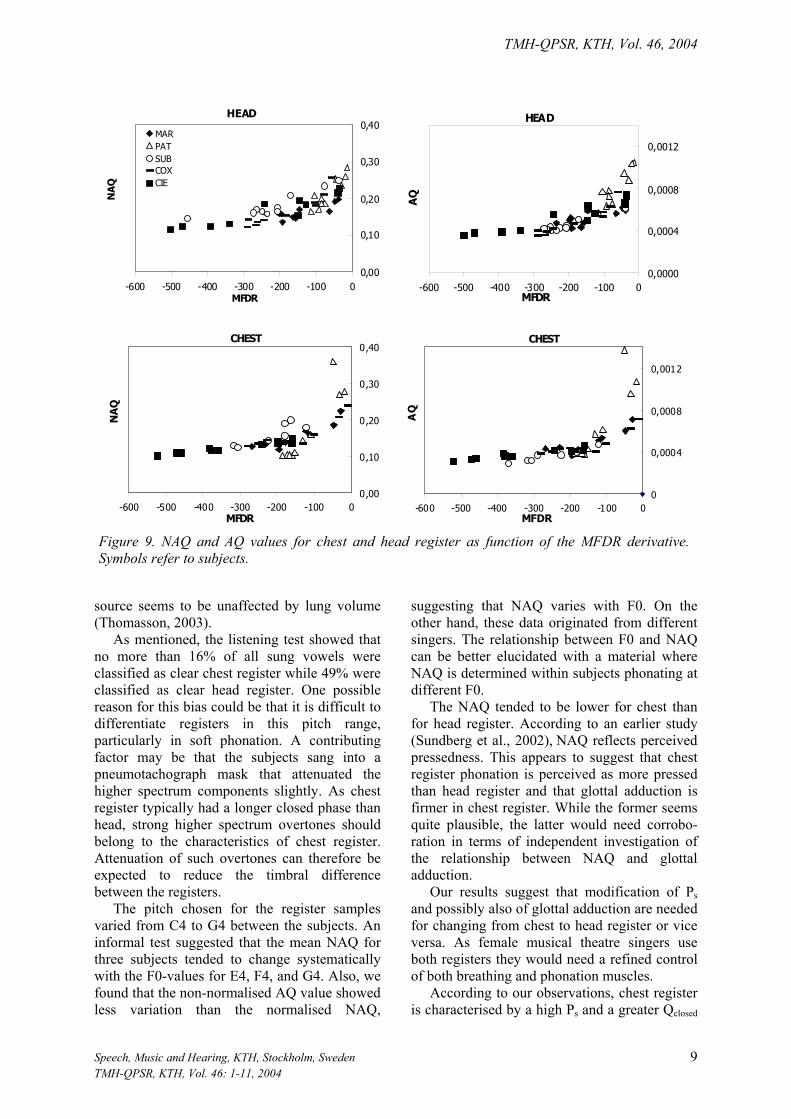
As all singers did not use the same F0, it is relevant to ask to what extent F0 affects NAQ. For this purpose it seemed worthwhile to examine also the non-normalised amplitude quotient AQ, defined as
AQ = Up-t-p /(MFDR) Figure 9 a-d shows NAQ and AQ as
functions of MFDR for the singers’ head and chest register phonations. The scatter of the AQ data is somewhat lower than for NAQ data. This suggests that part of the NAQ variation between singers may be caused by their differing F0 values. On the other hand, the NAQ differences between registers within singers cannot be explained in the same manner, since the individual singer used the same F0 for both registers.
4. Discussion Inverse filtering is known as a risky method under many experimental conditions, e.g., in the
absence of a clear closed phase, typical of soft phonation. Several precautions were taken to optimise measurement reliability, and our results showed a systematic variation with Ps that was similar to that found under more ideal experi-mental conditions. This suggests that our data were reasonably reliable.
The availability of several Ps values seems a strong advantage, providing heavy support for the observation that Ps influences a number of flow glottogram characteristics. For example, the variation of Qclosed with Ps was similar to that found for professional male singers, and can be approximated by a power function (Sundberg et al., 1999). However, our data for softest phona-tion deviated substantially from the power func-tion. It is possible that this reflects an increased glottal adduction in the softest phonations made in order to add some timbral richness.
The Ps values were collected by asking the subjects to sing a repeated /pae/ syllable with continuously decreasing vocal loudness. This implies that all loud phonations were produced at higher lung volumes than softer phonations. For untrained voices, this would be a source of error, since glottal adduction tends to be lower at high than at low lung volumes (Iwarsson et al., 1998). For singers, on the other hand, the voice
0,05
0,10
0,15
0,20
0,25
0,30
0,35
0,40
0 10 20 30 40 50Qclosed [%]
NA
Q
0,05
0,10
0,15
0,20
0,25
0,30
0,35
0,40
0 5 10 15 20 25 30
Pressure [cmH2O]
NA
Q
MAR
PATSUBCOX
CIE
0,05
0,10
0,15
0,20
0,25
0,30
0,35
0,40
Up-t-p [arb unit]
NA
Q
0,05
0,10
0,15
0,20
0,25
0,30
0,35
0,40
-600 -500 -400 -300 -200 -100 0MFDR
NA
Q
0,05
0,10
0,15
0,20
0,25
0,30
0,35
0,40
0 10 20 30 40 50Qclosed [%]
NA
Q
0,05
0,10
0,15
0,20
0,25
0,30
0,35
0,40
0 5 10 15 20 25 30
Pressure [cmH2O]
NA
Q
MAR
PATSUBCOX
CIE
0,05
0,10
0,15
0,20
0,25
0,30
0,35
0,40
Up-t-p [arb unit]
NA
Q
0,05
0,10
0,15
0,20
0,25
0,30
0,35
0,40
-600 -500 -400 -300 -200 -100 0MFDR
NA
Q
Figure 8. Relationship between NAQ and the indicated parameters. Filled and open symbols refer tochest and head register.
TMH-QPSR, KTH, Vol. 46, 2004
Speech, Music and Hearing, KTH, Stockholm, Sweden TMH-QPSR, KTH, Vol. 46: 1-11, 2004
9
source seems to be unaffected by lung volume (Thomasson, 2003).
As mentioned, the listening test showed that no more than 16% of all sung vowels were classified as clear chest register while 49% were classified as clear head register. One possible reason for this bias could be that it is difficult to differentiate registers in this pitch range, particularly in soft phonation. A contributing factor may be that the subjects sang into a pneumotachograph mask that attenuated the higher spectrum components slightly. As chest register typically had a longer closed phase than head, strong higher spectrum overtones should belong to the characteristics of chest register. Attenuation of such overtones can therefore be expected to reduce the timbral difference between the registers.
The pitch chosen for the register samples varied from C4 to G4 between the subjects. An informal test suggested that the mean NAQ for three subjects tended to change systematically with the F0-values for E4, F4, and G4. Also, we found that the non-normalised AQ value showed less variation than the normalised NAQ,
suggesting that NAQ varies with F0. On the other hand, these data originated from different singers. The relationship between F0 and NAQ can be better elucidated with a material where NAQ is determined within subjects phonating at different F0.
The NAQ tended to be lower for chest than for head register. According to an earlier study (Sundberg et al., 2002), NAQ reflects perceived pressedness. This appears to suggest that chest register phonation is perceived as more pressed than head register and that glottal adduction is firmer in chest register. While the former seems quite plausible, the latter would need corrobo-ration in terms of independent investigation of the relationship between NAQ and glottal adduction.
Our results suggest that modification of Ps and possibly also of glottal adduction are needed for changing from chest to head register or vice versa. As female musical theatre singers use both registers they would need a refined control of both breathing and phonation muscles.
According to our observations, chest register is characterised by a high Ps and a greater Qclosed
CHEST
0
0,0004
0,0008
0,0012
-600 -500 -400 -300 -200 -100 0MFDR
AQ
HEAD
0,0000
0,0004
0,0008
0,0012
-600 -500 -400 -300 -200 -100 0MFDR
AQ
CHEST
0,00
0,10
0,20
0,30
0,40
-600 -500 -400 -300 -200 -100 0MFDR
NA
Q HEAD
0,00
0,10
0,20
0,30
0,40
-600 -500 -400 -300 -200 -100 0MFDR
NA
Q
MARPATSUBCOXCIE
CHEST
0
0,0004
0,0008
0,0012
-600 -500 -400 -300 -200 -100 0MFDR
AQ
HEAD
0,0000
0,0004
0,0008
0,0012
-600 -500 -400 -300 -200 -100 0MFDR
AQ
CHEST
0,00
0,10
0,20
0,30
0,40
-600 -500 -400 -300 -200 -100 0MFDR
NA
Q HEAD
0,00
0,10
0,20
0,30
0,40
-600 -500 -400 -300 -200 -100 0MFDR
NA
Q
MARPATSUBCOXCIE
Figure 9. NAQ and AQ values for chest and head register as function of the MFDR derivative.Symbols refer to subjects.

Björkner E et al.: Voice source characteristics in different registers ....
10
and by a lower Up-t-p and NAQ. In female untrained voices’ chest register, Qclosed was found to be higher than in head register (Sundberg & Kullberg, 1999). In addition, the flow glottogram waveform was more sinusoidal and the fundamental more dominant in head register. Comparing professional baritones’, tenors’ and counter tenors’ modal and falsetto registers Sundberg & Högset (2001) found that Ps and Qclosed were higher, glottal leakage smaller, and the fundamental was weaker in chest register. These observations are compa-tible with or similar to the findings of the present investigation. They suggest that much of the voice source differences, between these registers, can be explained if the vocal folds are assumed to be thicker in the modal/chest register. Thicker folds would be associated with a longer phase lag between the upper and lower margins of the vocal folds, which should cause a more extended closed phase (Figure 10).
5. Conclusions The chest and head register voice source in female musical theatre singers differ in several respects. In typical tokens of chest register Ps and MFDR are higher, Qclosed is greater while Up-t-p and NAQ are lower than in head register. Register differences are perceptually clearer in loud than in soft phonation. The results also show that Ps has a strong influence on flow glottogram parameters. As NAQ seems associ-ated with degree of perceived phonatory pressedness, the low NAQ values for chest register suggests a more adducted phonation as compared to head register. The observed voice source differences can be explained if vocal fold thickness is assumed to be greater in chest register.
Acknowledgements The authors are indebted to the singers for their kind participation, to Paavo Alku for support and valuable discussions, and to Mattias Heldner for the statistical analysis. The experiment was carried out at the Vanderbilt University Voice Center, Dr Robert Ossoff, chairman.
This investigation is part of Eva Björkner’s doctoral dissertation work, which is financially supported by the European Community's Human Potential Programme under contract HPRN-CT-2002-00276 [HOARSE-network].
References Alku P, Bäckström T &Vilkman E (2002). Norma-
lized amplitude quotient for parameterization of the glottal flow. J Acoust Soc Am 112: 701-710.
Hertegård S, Gauffin J & Lindestad P-Å (1995). A comparison of subglottal and intraoral pressure measurements during phonation. J Voice 9: 149-155.
Hertegård S, Gauffin J & Sundberg J (1989). Spectral correlates of glottal voice source waveform charac-teristics. J Speech Hearing Res 32: 556-565.
Iwarsson J, Thomasson M & Sundberg J (1998). Effects of lung volume on the glottal voice source. J Voice 12: 424-433.
Sundberg J & Högset C (2001). Voice source differences between falsetto and modal registers in counter tenor, tenor, and baritone singers. Log Phon Vocol 26: 26-36.
Sundberg J & Kullberg Å (1999). Voice source studies of register differences in untrained female singing. Log Phon Vocol 24: 76-83.
Sundberg J, Andersson M & Hultqvist C (1999). Effects of subglottal pressure variation on pro-fessional baritone singers’ voice sources. J Acoust Soc Am 105: 1965-1971.
0
0.5
1
0 2 4 6 8Time (ms)
Airf
low
(arb
. sca
le)
0
0.5
1
0 2 4 6 8Time (ms)
Air
flow
(arb
. sca
le)
Upper edge
Lower edge
Lower edge
Upper edge
Thin folds(falsetto register)
Thick folds(modal register)
0
0.5
1
0 2 4 6 8Time (ms)
Airf
low
(arb
. sca
le)
0
0.5
1
0 2 4 6 8Time (ms)
Air
flow
(arb
. sca
le)
Upper edge
Lower edge
Lower edge
Upper edge
Thin folds(falsetto register)
Thick folds(modal register)
Figure 10. Schematical illustration of theeffect of vocal fold thickness on the glottalarea. Thick vocal folds imply a great phaselag between the upper and lower layer of thefolds, such that the opening of the upperlayer is interrupted by closing of the lowerlayer and the area waveform becomestriangular in shape. For thin vocal folds, thephase lag is small, and the area waveform ismore rounded. After Sundberg & Högset(2001).

TMH-QPSR, KTH, Vol. 46, 2004
Speech, Music and Hearing, KTH, Stockholm, Sweden TMH-QPSR, KTH, Vol. 46: 1-11, 2004
11
Sundberg J, Thalén M, Alku P & Vilkman E (2002). Estimating perceived phonatory pressedness in singing from flow glottograms. TMH-QPSR, KTH, 43: 89-96.
Thomasson M (2003). From air to aria. Dissertation, Department of Speech, Music and Hearing, KTH, Stockholm. ISBN 91-628-5703-7.
Titze I (1992). Phonation threshold pressure: a missing link in glottal aerodynamics. J Acoust Soc Am 91: 2926-2935.
Titze I (1994). Principles of Voice Production, Englewood Cliffs, NJ: Prentice-Hall.