voice over long term evolution service quality
TRANSCRIPT

Technical Disclosure Commons
Defensive Publications Series
January 09, 2019
VOICE OVER LONG TERM EVOLUTIONSERVICE QUALITY MEASUREMENTS ANDDIAGNOSTICS USING MACHINELEARNING TECHNIQUESSri Gundavelli
Dhananjay Patki
Vimal Srivastava
Amarnath Reddy Nagireddy
Follow this and additional works at: https://www.tdcommons.org/dpubs_series
This work is licensed under a Creative Commons Attribution 4.0 License.This Article is brought to you for free and open access by Technical Disclosure Commons. It has been accepted for inclusion in Defensive PublicationsSeries by an authorized administrator of Technical Disclosure Commons.
Recommended CitationGundavelli, Sri; Patki, Dhananjay; Srivastava, Vimal; and Nagireddy, Amarnath Reddy, "VOICE OVER LONG TERM EVOLUTIONSERVICE QUALITY MEASUREMENTS AND DIAGNOSTICS USING MACHINE LEARNING TECHNIQUES", TechnicalDisclosure Commons, ( January 09, 2019)https://www.tdcommons.org/dpubs_series/1863
brought to you by COREView metadata, citation and similar papers at core.ac.uk
provided by Technical Disclosure Common

1 5761
VOICE OVER LONG TERM EVOLUTION SERVICE QUALITY MEASUREMENTS AND DIAGNOSTICS USING MACHINE LEARNING TECHNIQUES
AUTHORS:
Sri Gundavelli Dhananjay Patki Vimal Srivastava
Amarnath Reddy Nagireddy
ABSTRACT
Techniques are described for a machine learning based Voice over Long Term
Evolution (VoLTE) trouble-shooting/diagnostic approach which can look at various data
sources in the mobile packet core and identify the key issues by observations and
correlations across data fields using machine learning techniques. It helps mobile operators
to quickly identify fault domains in VoLTE calls and take corrective actions to enhance
customer Quality of Experience (QoE).
DETAILED DESCRIPTION
Leveraging the Internet Protocol (IP) and Quality of Service (QoS) capabilities of
the Long Term Evolution (LTE) network, operators all over the world are deploying Voice
over LTE (VoLTE) services. For most of these operators, realizing a stable, high-
performing VoLTE network with the best end-user experience is proving to be a major
challenge. A customer’s complaint (e.g., “I place a VoLTE call, the other person picks up
the phone, but I do not hear anything”) may not allow the operator to diagnose that issue
and identify the root cause. Operators also do not have the ability to proactively identify
such issues in each of the cell-site locations and take corrective actions.
There are many point tools in the market for VoLTE service measurement. One can
carry an expensive 100-pound box and insert it in one point of the network. That box, based
on some packet sniffing on that link, can generate some diagnostics data which can be used
for identifying some issues. However, the analysis data from these tools is often flawed
and incorrect, as the analysis is on a partial set of data. These tools do not have visibility
into all the elements and data sources impacting that VoLTE call, or the ability to establish
correlations across those elements. In the absence of such a comprehensive view and
2
Gundavelli et al.: VOICE OVER LONG TERM EVOLUTION SERVICE QUALITY MEASUREMENTS AND D
Published by Technical Disclosure Commons, 2019
2 5761
correlation capability, operators have no means to measure VoLTE service performance,
and for characterizing the end-user experience in a precise manner.
To address these issues, an approach is provided which may examine various data
sources in the mobile packet core and identify the key issues by observations and
correlations across data fields using machine learning techniques. The data sources of
interest may include performance related to an air interface, IP Multimedia Subsystem
(IMS) signaling, data plane, backend interfaces, cell conditions, Public Data Network
(PDN) / bearer, cell to cell transport, and RTP media. Preliminary results based on small
test data indicates that issues may be identified with a high success rate. Though the focus
of this work is on an LTE network, the approaches described herein are equally valid for
Wi-Fi® calling on a Wi-Fi access network. Identified are the key elements, data sources,
measurement techniques, data pipelining approaches, correlation techniques, target
behaviors, and associated output elements.
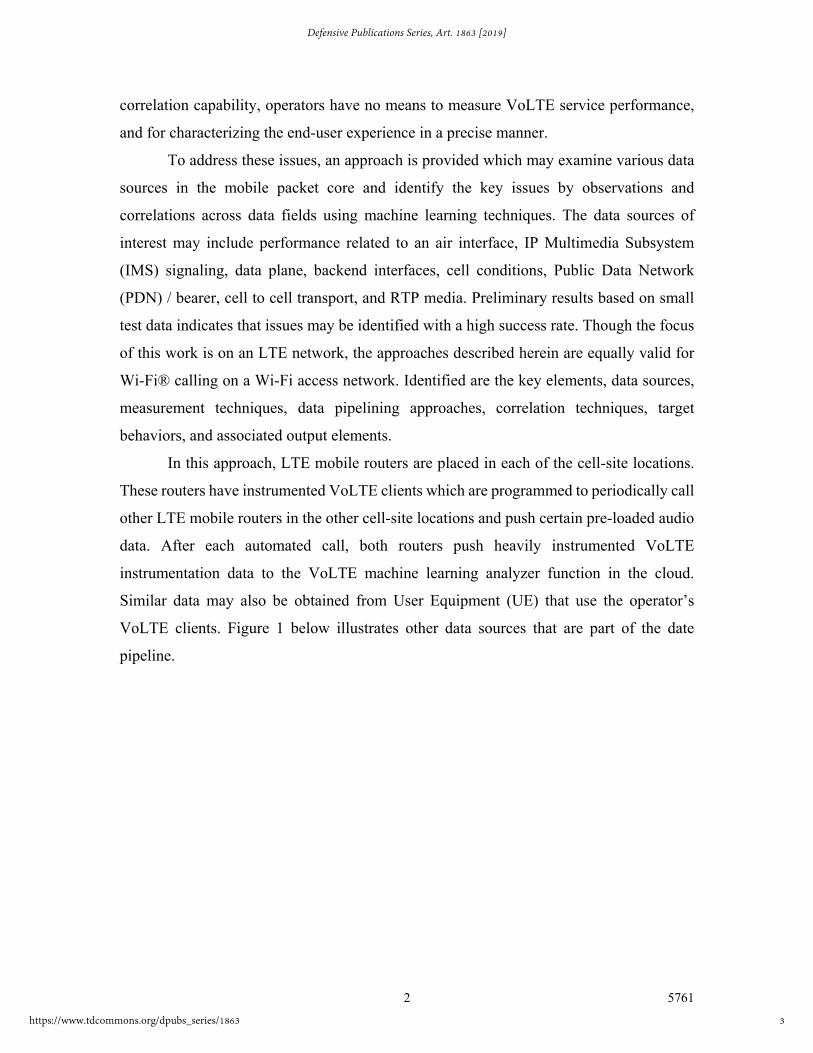
In this approach, LTE mobile routers are placed in each of the cell-site locations.
These routers have instrumented VoLTE clients which are programmed to periodically call
other LTE mobile routers in the other cell-site locations and push certain pre-loaded audio
data. After each automated call, both routers push heavily instrumented VoLTE
instrumentation data to the VoLTE machine learning analyzer function in the cloud.
Similar data may also be obtained from User Equipment (UE) that use the operator’s
VoLTE clients. Figure 1 below illustrates other data sources that are part of the date
pipeline.
3
Defensive Publications Series, Art. 1863 [2019]
https://www.tdcommons.org/dpubs_series/1863
3 5761
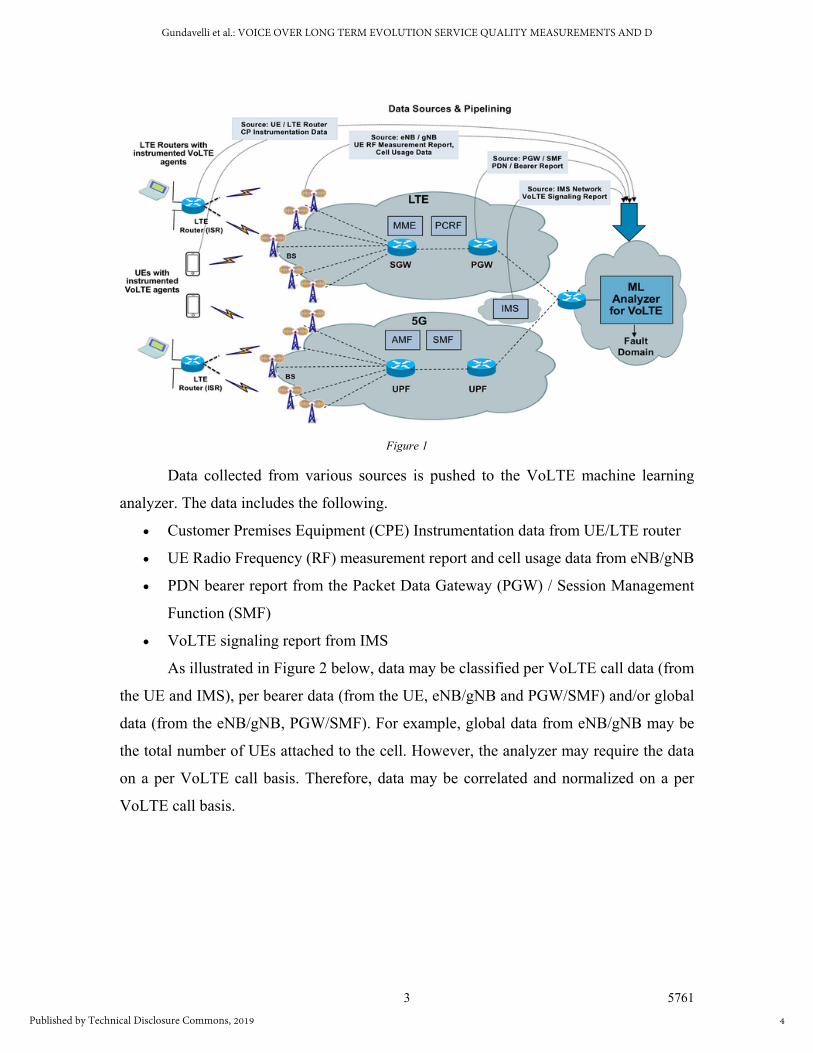
Figure 1
Data collected from various sources is pushed to the VoLTE machine learning
analyzer. The data includes the following.
Customer Premises Equipment (CPE) Instrumentation data from UE/LTE router
UE Radio Frequency (RF) measurement report and cell usage data from eNB/gNB
PDN bearer report from the Packet Data Gateway (PGW) / Session Management
Function (SMF)
VoLTE signaling report from IMS
As illustrated in Figure 2 below, data may be classified per VoLTE call data (from
the UE and IMS), per bearer data (from the UE, eNB/gNB and PGW/SMF) and/or global
data (from the eNB/gNB, PGW/SMF). For example, global data from eNB/gNB may be
the total number of UEs attached to the cell. However, the analyzer may require the data
on a per VoLTE call basis. Therefore, data may be correlated and normalized on a per
VoLTE call basis.
4
Gundavelli et al.: VOICE OVER LONG TERM EVOLUTION SERVICE QUALITY MEASUREMENTS AND D
Published by Technical Disclosure Commons, 2019
4 5761
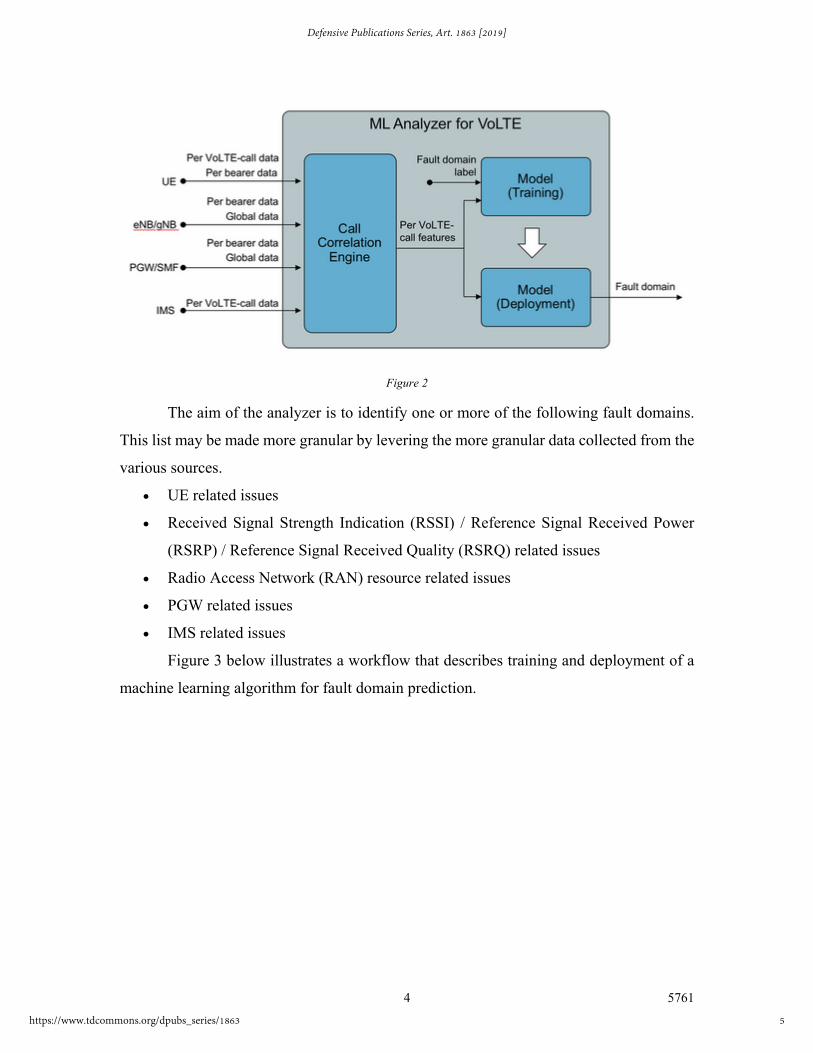
Figure 2
The aim of the analyzer is to identify one or more of the following fault domains.
This list may be made more granular by levering the more granular data collected from the
various sources.
UE related issues
Received Signal Strength Indication (RSSI) / Reference Signal Received Power
(RSRP) / Reference Signal Received Quality (RSRQ) related issues
Radio Access Network (RAN) resource related issues
PGW related issues
IMS related issues
Figure 3 below illustrates a workflow that describes training and deployment of a
machine learning algorithm for fault domain prediction.
5
Defensive Publications Series, Art. 1863 [2019]
https://www.tdcommons.org/dpubs_series/1863

5 5761
Figure 3
Wherever possible, fault labels for calls with Quality of Experience (QoE) issues
may be generated using a method of injecting faults into the network. This is possible in a
controlled environment without live users. In an example method, initially the first type of
fault is injected into the network. Second, the instrumented VoLTE clients make calls to
other clients. Third, the generated call data is labeled with the injected fault type. Fourth,
the process is repeated for all other fault types. Fifth, the process is also repeated with no
fault injected into the network so that call data with no QoE issues is also included for
model building. When faults cannot be injected into the network (e.g., a live network),
labels may be identified using manual troubleshooting before the model is trained.
Described herein is an approach for collecting specific instrumented data from a
UE (or a mobile router fixed in cell-site location), eNB/gNB, PGW/SMF/UPF and IMS
core network. An LTE based mobile router may place calls to other LTE mobile router(s)
6
Gundavelli et al.: VOICE OVER LONG TERM EVOLUTION SERVICE QUALITY MEASUREMENTS AND D
Published by Technical Disclosure Commons, 2019

6 5761
periodically to proactively measure the VoLTE performance. PDN/Bearer performance
metrics may be obtained from the PGW/UPF/SMF functions. RTP sender reports may be
intercepted on the UE to UE data plane. Data received from various sources described
above may be correlated and normalized on a per call basis. Call data may be labeled with
one of multiple fault domains in case of calls with QoE issues and with no-fault labels in
case of calls with no QoE issues. Feature selection methods may be applied on the labeled
data to extract only relevant call features. A multi-label classifier machine learning model
may be trained based on the labeled call data and deployed on new calls for predicting fault
domains in case of calls with QoE issues.
VoLTE signaling plane instrumentation may be obtained from the VoLTE client
on UE (or a mobile router in the cell-site). This may include the following features:
Call Setup Delay: Dial to ring back tone delay, where larger values indicate that the
user will hang up the call.
Dial to Ring Delay: Between invite to 180 (ringing), a dedicated bearer setup takes
place and that involves Rx signaling from the IMS to the Policy and Charging Rules
Function (PCRF) and Gx signaling from PCRF to PGW. Once the phone rings, it
depends on when the user picks up the phone.
Retransmission of each of the Session Initiation Protocol (SIP) messages and the
associated round-trip delay.
Invite Packet size: The size of the Invite message may be large due to inclusion of
Session Description Protocol (SDP) and other parameters so it may result in
fragmentation.
Post Pickup Delay: The delay between the time the callee picks up the receiver and
the time the caller receives an indication of the same.
Post Dial Delay: Delay between the Invite and first provisional response. It may
cause retransmission or call failure if the delay is substantial.
Mid-Call Signaling: The call may activate additional SIP features.
Delays should be within the acceptable limit for qualifying the service as “good.”
Additional Key Performance Indicators (KPIs) from the PGW and IMS core (user
calls):
7
Defensive Publications Series, Art. 1863 [2019]
https://www.tdcommons.org/dpubs_series/1863

7 5761
o Number of calls that lasts less than 10 seconds. This is an indication of a
problem.
o Average number of calls from each cell-site
o Peak Call Count
o Timeouts reaching the Proxy-Call Session Control Function (P-CSCF)
o Current (e.g., today) SIP/RTP bytes per call.
The UE Measurement Reports may be obtained from the eNB/gNB. The
Measurement Report may be triggered when the measured value crosses (e.g., goes higher
or lower than) a certain target value. The eNB sends a Radio Resource Control (RRC)
message indicating what kind of items are to be measured and the UE sends an RRC
message that carries the result of the measurement.
The Channel Status Indicator may comprise three LTE Quality Indicators (e.g.,
Channel Quality Indicator (CQI), Precoding Matrix Indicator (PMI), and Rank Indicator
(RI)) and serve as a benchmark for transmission quality in the downlink. The CQI contains
information sent from a UE to the eNB to indicate a suitable downlink transmission data
rate (e.g., a Modulation and Coding Scheme (MCS) value). PMI may determine how the
individual data streams (called layers in LTE) are mapped to the antennas. RI is a channel
rank that indicates the number of layers and the number of different signal streams
transmitted in the downlink. PMI and RI are for multiple-input and multiple-output (MIMO)
pre-processing and ensure that the correct rank and precoders that will maximize
throughput are set.
Parameters for cell selection/reselection may include RSRP and RSRQ, which are
key measures of signal level and quality for modern LTE networks. In cellular networks,
when a mobile device moves from cell to cell and performs cell selection/reselection and
handover, it has to measure the signal strength/quality of the neighbor cells. In an LTE
network, a UE measures two parameters on the reference signal: RSRP and RSRQ. RSRP
may also be used to estimate the path loss for power control calculations.
Cell usage conditions may be obtained from the eNB/gNB. Table 1 below illustrates
the basic cell configuration parameters upon which eNB performance is dependent.
8
Gundavelli et al.: VOICE OVER LONG TERM EVOLUTION SERVICE QUALITY MEASUREMENTS AND D
Published by Technical Disclosure Commons, 2019

8 5761
Table 1
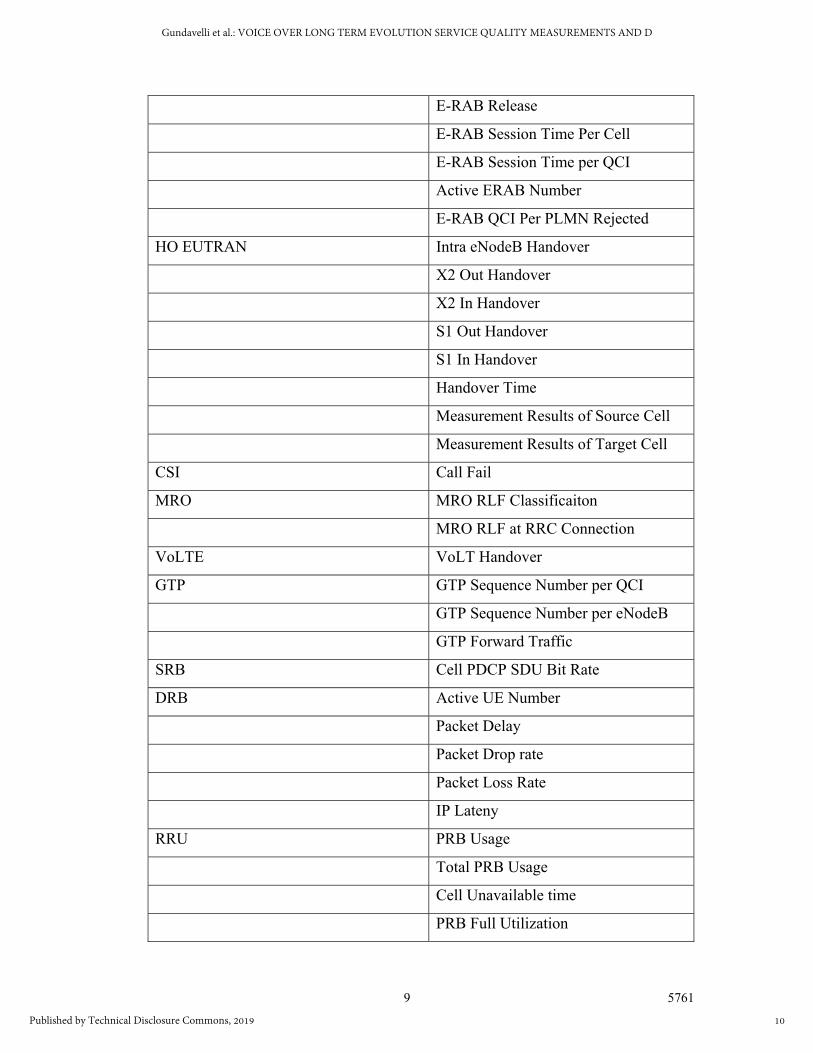
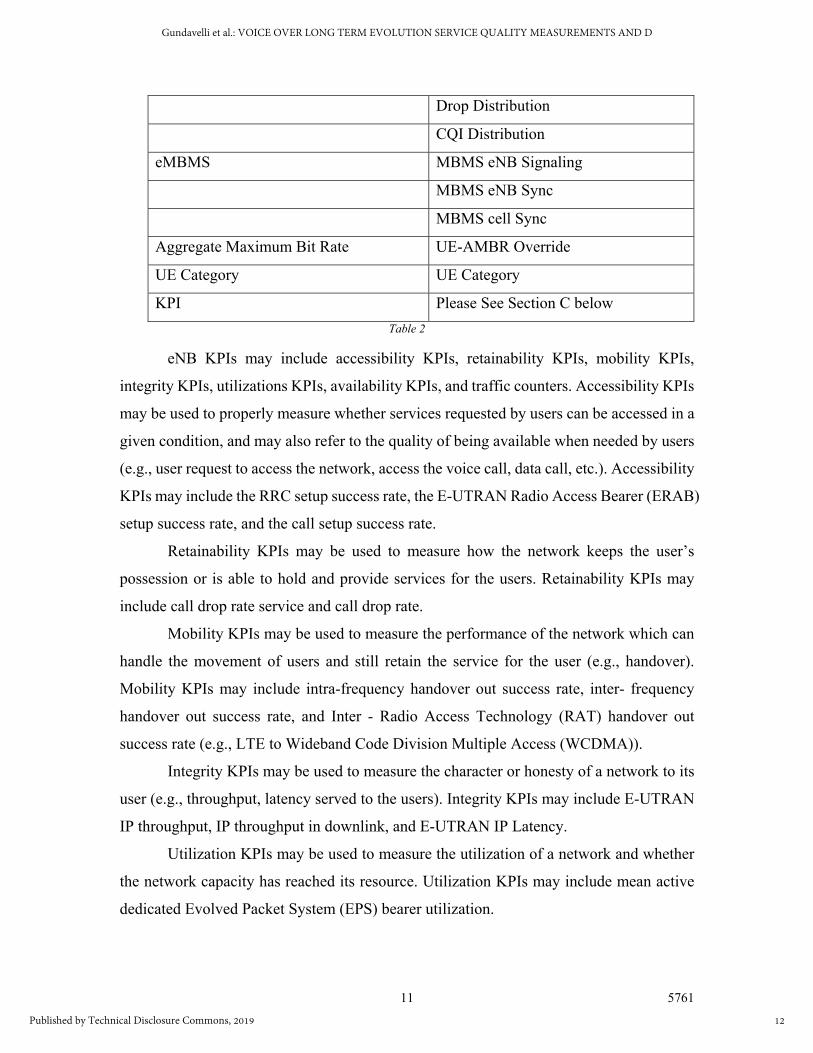
Table 2 below illustrates various eNB statistics and counters.
Packet statistics Ethernet Packets
Ethernet Packets Per VLAN
AIR MAC Packets
AIR RLD Packets
PDCP Packets
RRC RRC Connection Establishment
RRC Connection Recofiguration
RRC Connection Re Establishemnt
RRC Connection Release
RRC Connection Number
RRC Connection Setup Time
RRC Connection
RRC Connection Re Establishment
Time
ERAB E-RAB Setup
E-RAB Setup Add
E-RAB Setup Time
E-RAB Erase Request
E-RAB Erase
E-RAB Modify
E-RAB Release Request
9
Defensive Publications Series, Art. 1863 [2019]
https://www.tdcommons.org/dpubs_series/1863
9 5761
E-RAB Release
E-RAB Session Time Per Cell
E-RAB Session Time per QCI
Active ERAB Number
E-RAB QCI Per PLMN Rejected
HO EUTRAN Intra eNodeB Handover
X2 Out Handover
X2 In Handover
S1 Out Handover
S1 In Handover
Handover Time
Measurement Results of Source Cell
Measurement Results of Target Cell
CSI Call Fail
MRO MRO RLF Classificaiton
MRO RLF at RRC Connection
VoLTE VoLT Handover
GTP GTP Sequence Number per QCI
GTP Sequence Number per eNodeB
GTP Forward Traffic
SRB Cell PDCP SDU Bit Rate
DRB Active UE Number
Packet Delay
Packet Drop rate
Packet Loss Rate
IP Lateny
RRU PRB Usage
Total PRB Usage
Cell Unavailable time
PRB Full Utilization
10
Gundavelli et al.: VOICE OVER LONG TERM EVOLUTION SERVICE QUALITY MEASUREMENTS AND D
Published by Technical Disclosure Commons, 2019

10 5761
S1SIG UE Associated Logical S1 connection
establishment
Paging Paging
Overload Protection Denied Call by overload protection
Power Power
RNTP of Own Cell
RSSI of each path measured by MAC
RA Random Acess Preambles
RACH Usage
HARQ Transmission BLR
AMC MIMO
MCS
DL MCS
DL Layer
DL Wideband CQI
DL PMI
DL RI
DL Ack-Nack DTX Ratio
Timing Alignment Timing Alignment
Timing Advance Based UE Limitation
in connected
Timing Advance Based UE Limitation
in Initial Attach
IOT Uplink IOT Level
Load Balancing Load
Load Balancing Handover
Idle Load Balancing
Redirected by Load Balancing
Traffic distribution Throughput distribution
Delay distribution
11
Defensive Publications Series, Art. 1863 [2019]
https://www.tdcommons.org/dpubs_series/1863
11 5761
Drop Distribution
CQI Distribution
eMBMS MBMS eNB Signaling
MBMS eNB Sync
MBMS cell Sync
Aggregate Maximum Bit Rate UE-AMBR Override
UE Category UE Category
KPI Please See Section C below
Table 2
eNB KPIs may include accessibility KPIs, retainability KPIs, mobility KPIs,
integrity KPIs, utilizations KPIs, availability KPIs, and traffic counters. Accessibility KPIs
may be used to properly measure whether services requested by users can be accessed in a
given condition, and may also refer to the quality of being available when needed by users
(e.g., user request to access the network, access the voice call, data call, etc.). Accessibility
KPIs may include the RRC setup success rate, the E-UTRAN Radio Access Bearer (ERAB)
setup success rate, and the call setup success rate.
Retainability KPIs may be used to measure how the network keeps the user’s
possession or is able to hold and provide services for the users. Retainability KPIs may
include call drop rate service and call drop rate.
Mobility KPIs may be used to measure the performance of the network which can
handle the movement of users and still retain the service for the user (e.g., handover).
Mobility KPIs may include intra-frequency handover out success rate, inter- frequency
handover out success rate, and Inter - Radio Access Technology (RAT) handover out
success rate (e.g., LTE to Wideband Code Division Multiple Access (WCDMA)).
Integrity KPIs may be used to measure the character or honesty of a network to its
user (e.g., throughput, latency served to the users). Integrity KPIs may include E-UTRAN
IP throughput, IP throughput in downlink, and E-UTRAN IP Latency.
Utilization KPIs may be used to measure the utilization of a network and whether
the network capacity has reached its resource. Utilization KPIs may include mean active
dedicated Evolved Packet System (EPS) bearer utilization.
12
Gundavelli et al.: VOICE OVER LONG TERM EVOLUTION SERVICE QUALITY MEASUREMENTS AND D
Published by Technical Disclosure Commons, 2019

12 5761
Availability KPIs may be used to measure how the network keeps the user’s
possession or is able to hold and provide the services for the users. Availability KPIs may
include E-UTRAN cell availability and partial cell availability (node restarts excluded).
Traffic counters may include a number of different factors, including Outbound
Bad Packets, Outbound Packets Discarded, Received Bad Packets, Received Octets,
Received Packets Discarded, Received Unicast Packets, Received Unknown Protocol
Packets, Transmitted Octets, and Transmitted Unicast Packets.
The PDN/Bearer performance report may be provided from the PGW. The
performance report may include average jitter for the RTP on the Guaranteed Bit Rate
(GBR) bearer, average packet delay on the GBR bearer, and average packet loss on the
GBR bearer.
Table 3 below illustrates an example PDN total.
Active The total number of active PDN sessions.
Setup The total number of setup PDN sessions.
Released The total number of released PDN sessions.
Rejected The total number of rejected PDN sessions.
Table 3
Table 4 below illustrates an example bearers total.
Active The total number of active bearers.
Setup The total number of bearers setup.
Released The total number of number of bearers released.
Rejected The total number of rejected bearers.
Table 4
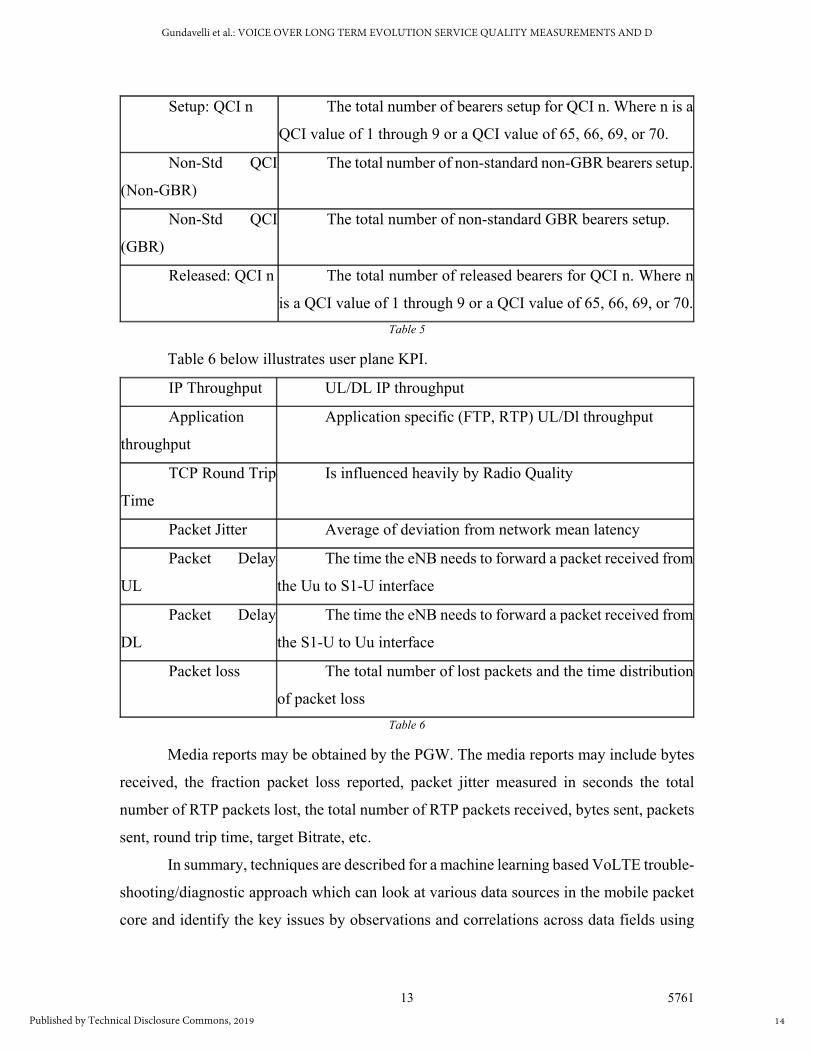
Table 5 below illustrates example bearers by QoS characteristics:
Active: QCI n The total number of active bearers for QCI n. Where n is
a QCI value of 1 through 9 or a QCI value of 65, 66, 69, or 70.
Non-Std QCI
(Non-GBR)
The total number of active non-standard non-GBR
bearers.
Non-Std QCI
(GBR)
The total number of active non-standard GBR bearers
13
Defensive Publications Series, Art. 1863 [2019]
https://www.tdcommons.org/dpubs_series/1863
13 5761
Setup: QCI n The total number of bearers setup for QCI n. Where n is a
QCI value of 1 through 9 or a QCI value of 65, 66, 69, or 70.
Non-Std QCI
(Non-GBR)
The total number of non-standard non-GBR bearers setup.
Non-Std QCI
(GBR)
The total number of non-standard GBR bearers setup.
Released: QCI n The total number of released bearers for QCI n. Where n
is a QCI value of 1 through 9 or a QCI value of 65, 66, 69, or 70.
Table 5
Table 6 below illustrates user plane KPI.
IP Throughput UL/DL IP throughput
Application
throughput
Application specific (FTP, RTP) UL/Dl throughput
TCP Round Trip
Time
Is influenced heavily by Radio Quality
Packet Jitter Average of deviation from network mean latency
Packet Delay
UL
The time the eNB needs to forward a packet received from
the Uu to S1-U interface
Packet Delay
DL
The time the eNB needs to forward a packet received from
the S1-U to Uu interface
Packet loss The total number of lost packets and the time distribution
of packet loss
Table 6
Media reports may be obtained by the PGW. The media reports may include bytes
received, the fraction packet loss reported, packet jitter measured in seconds the total
number of RTP packets lost, the total number of RTP packets received, bytes sent, packets
sent, round trip time, target Bitrate, etc.
In summary, techniques are described for a machine learning based VoLTE trouble-
shooting/diagnostic approach which can look at various data sources in the mobile packet
core and identify the key issues by observations and correlations across data fields using
14
Gundavelli et al.: VOICE OVER LONG TERM EVOLUTION SERVICE QUALITY MEASUREMENTS AND D
Published by Technical Disclosure Commons, 2019

14 5761
machine learning techniques. It helps mobile operators to quickly identify fault domains in
VoLTE calls and take corrective actions to enhance customer QoE.
15
Defensive Publications Series, Art. 1863 [2019]
https://www.tdcommons.org/dpubs_series/1863