voice of the people preference ranking survey results
Post on 21-Dec-2015
223 views
TRANSCRIPT

Voice of the PeoplePreference Ranking Survey Results
Outline
ReviewThe SurveySummary StatisticsConsolidated OutcomesOutcome ComparisonsForthcoming analysis

Purpose of the Survey
Support active community involvement and participation in the decision making process
Elicit County resident preferences for values related to land use policy
Provide an indication of the preferred policy direction

Why we used this Preference Ranking Method
1. ‘Natural’ extension to the PIF deliberation process
2. Helped us incorporate subjective considerations

Why we used this Preference Ranking Method
4. Provides a theoretical basis for consistent decision making
3. Can be used to help evaluate policies

What was inconsistency again?
Inconsistent judgments meant the person was contradicting himself.
Also know as: intransitivity

Why did we care about it?The more inconsistency, the more likely that the same results could have been obtained by randomly generating numbers with which to fill out the survey.
This would decrease the confidence that the results are reflecting the participant’s values

What was allowable?
To be included in the final analysis, overall inconsistency needed to be at or below 20%

What did we do when we found it?
When a person had even one section of the survey with inconsistency over 20% the survey was returned to them with: a cover letter tailored example of consistency a return postage-paid envelope
Participants were asked to re-evaluate the inconsistent sections

What do the results tell us?
Priority weights tell us what values are considered important – and which are less importantIndicates the preferred general policy directionThe inconsistent sections indicate where there might be a need for more information or education

What don’t the results tell us?
Not a random sample – can’t extrapolate results to the entire population Survey participants are self-selected, much
like when people choose to vote or not.
Doesn’t give specific recommendations for policy

The Survey – Values
Private Property Rights: Property owners should be allowed to use their land for any purpose. Their neighbors should be allowed to do the same.
'Neighborhood' Property Values: Property owners should have the right to be free of spillover effects resulting from how their neighbors use their land.

The Survey – Values
Local Ownership: Farming and industry should be owned by local residents rather than non-local residents.
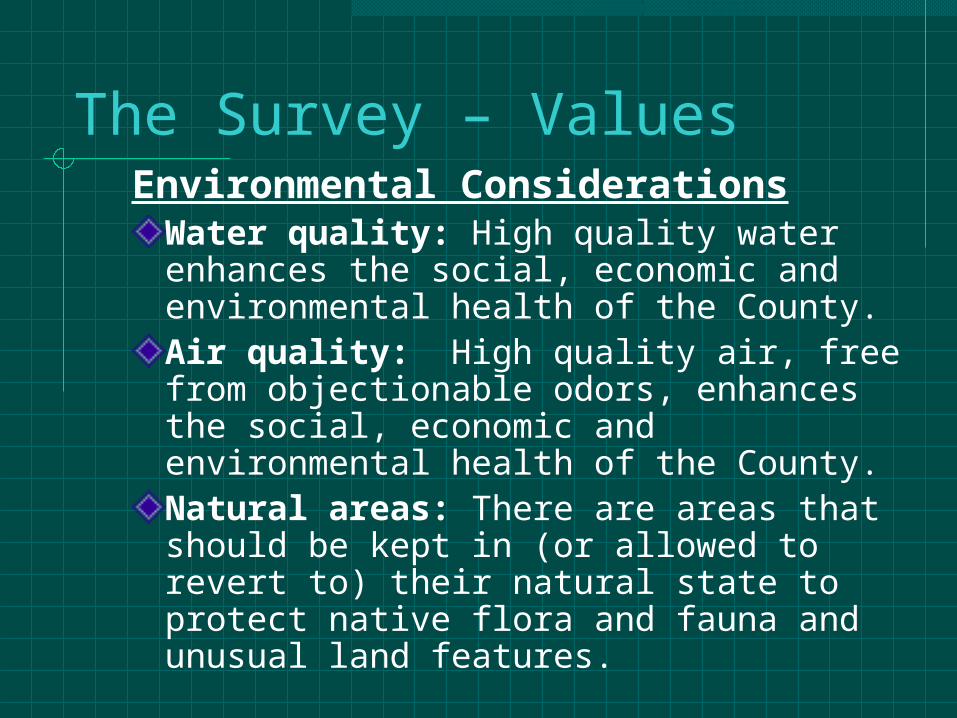
The Survey – ValuesEnvironmental Considerations
Water quality: High quality water enhances the social, economic and environmental health of the County.Air quality: High quality air, free from objectionable odors, enhances the social, economic and environmental health of the County. Natural areas: There are areas that should be kept in (or allowed to revert to) their natural state to protect native flora and fauna and unusual land features.

The Survey – ValuesCultural and Historical Considerations: Cultural and historical places should be protected as they enhance the social and economic health of the County.
Economic Considerations Jobs and income Local tax base

The Survey – Policy Options
Regulation or Deregulation
Market-oriented Solution
Subsidy or Tax
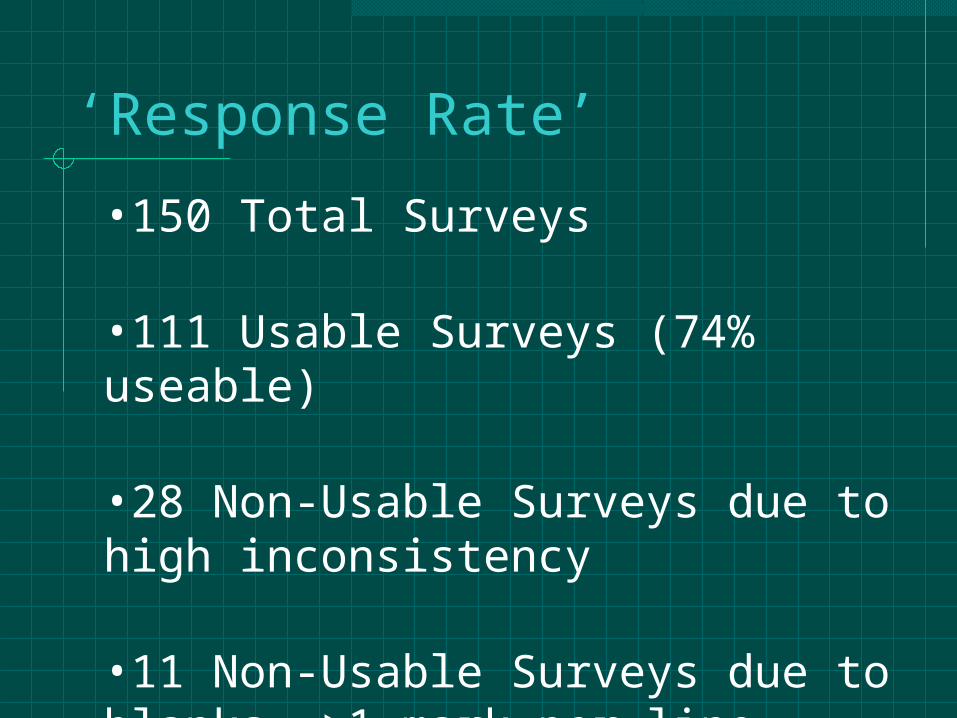
‘Response Rate’
•150 Total Surveys
•111 Usable Surveys (74% useable)
•28 Non-Usable Surveys due to high inconsistency
•11 Non-Usable Surveys due to blanks, >1 mark per line

Results of All Useable SurveysValues
19.6%18.2%
14.8%
20.2%
11.5%
15.6%
0.0%
5.0%
10.0%
15.0%
20.0%
25.0%
PROP NEIGH LOCAL ENV CULT ECON

Results of All Useable SurveysEnvironment
9.6%
7.3%
3.4%
0.0%1.0%2.0%3.0%4.0%5.0%6.0%7.0%8.0%9.0%
10.0%
Water Air Natural

Results of All Useable SurveysEconomic
10.6%
5.0%
0.0%
2.0%
4.0%
6.0%
8.0%
10.0%
12.0%
JOBS TAX BASE

Results of All Useable SurveysPolicies
Regulation
Market
Tax orSubsidi
es
Weight 44.5 25.8 29.6

Most Preferred PolicyLegislation
Neigh. Prop. Value
s
Local Owner-ship
Water Qualit
y
Clean Air
Jobs & Incom
e
Tax Base
Wght
6.8 8.4 5.1 3.5 6.8 2.0

Most Preferred PolicyMarket Oriented
Private Propert
y Rights
Natural Areas
Cultural and
Historical
Weight
7.1 1.3 5.2

All LIFE PIF
Weight 19.6 17.8 20.3
OutcomesPrivate Property Rights

OutcomesNeighborhood Property Values
All LIFE PIF
Weight 18.2 17.6 18.3

OutcomesLocal Ownership
All LIFE PIF
Weight 14.8 9.8 19.3

OutcomesEnvironmental Considerations
All LIFE PIF
Weight 20.2 25.0 17.1

OutcomesCultural & Historical
All LIFE PIF
Weight 11.5 13.3 10.9

OutcomesEconomic Considerations
All LIFE PIF
Weight 15.6 16.8 14.1

OutcomesWater Quality
All LIFE PIF
Weight 9.6 12.7 7.8

OutcomesAir Quality
All LIFE PIF
Weight 7.3 8.7 6.2

OutcomesNatural Areas
All LIFE PIF
Weight 3.4 3.6 3.1

OutcomesJobs & Income
All LIFE PIF
Weight 10.6 12.2 9.0

OutcomesTax Base
All LIFE PIF
Weight 5.0 4.5 5.1

Forthcoming Analysis
Determine where inconsistencies tended to occur more
Variance of outcomes
Correlations of outcomes with respect to:age, gender, where they live, length of time in the county, education, LIFE or Town Meeting, etc.
What are you interested in finding out?