vodafone submission attachment - report from network strategies
TRANSCRIPT

Final report for Vodafone New Zealand
Selection of broadband anchor products
Options paper for the
Telecommunications Act 2001 Review
PUBLIC
Network Strategies Report Number 36016. 2 September 2016


P U B L I C
0 Executive summary
The options paper for the Telecommunications Act 2001 Review1 proposes a regulatory model with an annual revenue cap for Chorus with price caps for three initial technology-neutral anchor products which will be subject to price-quality regulation. Two broadband layer 2 products are proposed – a 15/1Mbit/s low cost “entry-level” product and a 100/20Mbit/s “basic” broadband product – as well as a voice-only input product. As stated in the paper selection of ‘the right mix’ of anchor products is key to the success of this proposed model. If the mix is inappropriate then there is a risk of compensatory high prices for non-anchor products. The paper notes that this risk can be mitigated by keeping the set of initial anchor products to a minimum, and the possible introduction of a layer 1 fibre anchor product.
An anchor pricing approach with judicious selection of anchor products may certainly achieve Government objectives for the communications sector. Given that a central focus is to protect end-users from monopoly pricing, the optimal selection may be a layer 1 anchor product applied in tandem with a layer 2 anchor product that will be appropriate in 2020 following the current period of market transition. Based on current uptake and usage patterns and our forecasts, we consider it challenging to specify an optimal layer 2 anchor product now that will be relevant in four years’ time. Our recommendation is that the decision is left to the Commission closer to the regulatory period. Alternatively rules could be established for defining an anchor product in terms of an empirically observable measure which identifies the typical basic speed – together with any other relevant characteristics such as quality of service.
1 Ministry of Business, Innovation and Employment (2016), Telecommunications Act Review: Options Paper, July 2016.
ii Network Strategies Final report for Vodafone New Zealand
P U B L I C
The main target of the proposed low cost 15/1 product appears to be limited to the market segment that cannot access UFB services, which will primarily consist of rural dwellers whose geographic location precludes economic provision of fibre service, and where Chorus’ low-speed copper service is the only available broadband service. We have identified a likely distortionary impact from accommodating this product within the proposed pricing framework and recommend that the target end-users be closely identified, any subsidy should be made transparent and a means of funding identified that is more efficient than the current proposal. If there are some income-constrained individuals or households unable to subscribe to a fixed broadband service then the most effective means of encouraging uptake for this market segment would be through a targeted grant or voucher scheme.
An anchor product specified at the passive layer should be preferred to a 15/1 product at layer 2. A layer 1 anchor will support innovation and infrastructure-based competition and thus act as a competitive restraint in contrast to a 15/1 product at layer 2 which is likely to render unworkable equivalence of inputs obligations. Moreover in a selection of other jurisdictions with wholesale broadband open access or equivalence of inputs obligations we find the following:
cost-oriented regulation of prices at layer 1 a significant differential between prices for layer 1 and layer 2 services, increasing as the
bandwidth of the bitstream increases regulated layer 1 prices are compatible with layer 2 prices differentiated by bandwidth
as typically the variation in the latter prices is not based on costs but set by applying a notional glide path to the average cost per unit demand (across all bandwidths)
no apparent barriers to speed-price differentiation for retail services.
Based on our analysis we have determined that the lowest bandwidth bitstream service in New Zealand would have a cost-based differential with the layer 1 service of at least 34%, and indeed is likely to be considerably greater. In the post 2020 world, it will be crucial for this differential to reflect appropriate investment signals – failure to do so will create market distortions as well as barriers for future innovation.

P U B L I C
Selection of broadband anchor
products
Final report for Vodafone New Zealand
Contents
0 Executive summary i
1 Introduction 1
2 The role of anchor products 3
2.1 Proposed regulatory model 3
2.2 Key market developments 5
2.3 Proposed anchor products 7
2.4 Conclusions 28
3 Wholesale pricing: layer 1 versus layer 2 29
3.1 Denmark 29
3.2 Netherlands 31
3.3 Singapore 35
3.4 Sweden 42
3.5 New Zealand 47
3.6 Summary 49
4 Accessing affordable broadband services 51
4.1 Australia 51
4.2 Singapore 52
4.3 United Kingdom 53
4.4 United States 54

iv | Network Strategies Final report for Vodafone New Zealand
P U B L I C
5 Summary of recommendations 57
P U B L I C
1 Introduction
The options paper for the Telecommunications Act 2001 Review published by the Ministry of Business, Innovation and Employment (the Ministry)2 envisages a post 2020 telecoms market in which access seekers purchase price-capped anchor products and / or commercial layer 1 products. The proposed conceptual model includes an annual revenue cap in addition to price caps on individual wholesale products. A single wholesale price is proposed for three initial technology-neutral anchor products which will be subject to price-quality regulation, namely:
a voice-only input product an entry-level broadband product (up to 15/1Mbit/s) a basic broadband product (up to 100/20Mbit/s).
The paper confirms that from 2020 dark fibre services on point-to-multipoint parts of the UFB network will be available to RSPs. The paper proposes that these layer l services should be priced on a commercial basis, although the Commerce Commission would have power to set cost-based prices if deemed necessary (that is, subject to a legislative test). In addition, it is proposed that regulation of the legacy UCLL service will cease owing to market changes driven by UFB deployment and uptake.
We consider the proposed broadband anchor products, including the case for price regulation of layer 1 services from 2020. In particular we examine:
the Ministry’s initial position on anchor products and layer 1 (Section 2)
2 Ministry of Business, Innovation and Employment (2016), Telecommunications Act Review: Options Paper, July 2016.

2 Network Strategies Final report for Vodafone New Zealand
P U B L I C
observed deltas in wholesale pricing between layer 1 and layer 2 products for selected sample jurisdictions (Section 3)
the issue of maintaining affordable broadband services (Section 4).
Our recommendations are summarised in Section 5.
Although this report has been commissioned by Vodafone New Zealand the views expressed here are entirely our own.

P U B L I C
2 The role of anchor products
We have reviewed the proposed regulatory and pricing model in the Ministry’s options paper (Section 2.1), the relevance of important recent market developments (Section 2.2), and the proposed anchor products (Section 2.3). Our conclusions are presented in Section 2.4.
2.1 Proposed regulatory model
The favoured regulatory model presented in the options paper encompasses an annual revenue cap for Chorus as well as price caps for individual wholesale products. A single wholesale price is proposed for three initial technology-neutral anchor products which will be subject to price-quality regulation:
a voice-only input product an entry-level broadband product (up to 15/1Mbit/s) a basic broadband product (up to 100/20Mbit/s).
These products are to be priced in the first regulatory period (2020 to 2025) according to the following principles:
no price shocks for end-users of anchor products prices of similar products in the market in 2019 should be regarded as reference points
for the pricing of anchor products the quality of the anchor product should be reflected in its pricing so that appropriate
relativities exist between anchor product prices.

4 Network Strategies Final report for Vodafone New Zealand
P U B L I C
The Ministry sees anchor products as a mechanism for addressing the risk of price shock for consumers as well as a means of influencing the prices of UFB services.
Anchor products can address the price shock risk to end-users that might be incurred under
the ‘pure’ revenue cap approach. They also mean that the basic services (and the layer 1 UFB
service that UFB providers must offer by 2020) can act as ‘anchors’ to the rest of the service
set.3
From 2020 dark fibre services will be available on point-to-multipoint parts of the UFB network initially priced on a commercial basis, although the Commerce Commission would have power to set cost-based prices if deemed necessary (that is, subject to a legislative test). It is also proposed that regulation of the legacy UCLL service will cease owing to market changes driven by UFB deployment and uptake.
The options paper clearly states that a central focus of the new regulatory regime is to protect end-users from monopoly pricing4. The desired outcomes of the proposed anchor product model are listed as:
incentives for regulated suppliers to innovate and upsell in order to achieve revenue caps promotion of the interests of ‘vulnerable’ end-users.
The Ministry acknowledges the natural monopoly characteristics of UFB infrastructure and that ‘Chorus is unlikely to face significant competitive pressure that could constrain its pricing post-2020’5. As such a key issue for the long term benefit of end-users will be the strength of the constraint inherent in the proposed regulatory framework.
3 Ibid, page 9.
4 Ibid, page 7.
5 Ibid, page 16.

Selection of broadband anchor products 5
P U B L I C
2.2 Key market developments
In the intervening period between the Ministry’s 2015 discussion document on future regulation of the communications sector6 and the options paper a significant and disruptive change occurred in the New Zealand telecommunications market with the Commission’s final decision on the regulated price of copper access in December 20157. From this date wholesale copper bitstream became more expensive than the contractually agreed price for entry level wholesale fibre (Exhibit 2.1). Retail offers immediately changed in response, and suddenly broadband customers were faced with paying more for copper services which in some cases were inferior to lower priced fibre services.
2015 2016 2017 2018 2019
UCLL 29.75 30.22 30.70 31.19 31.68
UBA 41.19 41.44 41.71 42.02 42.35
Fibre 30/10 38.50 39.50 40.50 41.50 42.50
Exhibit 2.1: Copper and fibre wholesale monthly prices in New Zealand [Source: Commerce
Commission, Crown Fibre Holdings]
The market reaction has been swift. As at August 2016 Chorus is connecting 600 premises per day to the UFB network (Exhibit 2.2). In its Quarterly Update of April 20168 Chorus stated that 22% of premises passed have taken fibre, with 46% of mass market fibre connections on plans of 100Mbit/s or more. Moreover, 73% of mass market net additions in the March quarter 2016 were for products with bandwidth of at least 100Mbit/s, increasing to 90% in the June quarter 20169.
6 Ministry of Business, Innovation and Employment (2015), Regulating communications for the future, September 2015.
7 Commerce Commission (2015), Final pricing review determination for Chorus’ unbundled bitstream access service, 15 December 2015.
8 Chorus (2016), Q3 FY16 – Connections Update, 15 April 2016.
9 Chorus (2016), FY16 Full Year Result, 29 August 2016.

6 Network Strategies Final report for Vodafone New Zealand
P U B L I C
Exhibit 2.2:
Chorus fibre installs
per day, February
to August 2016
[Source: Chorus]
Take-up of UFB services is certainly accelerating nationwide. In the June quarter 2016 there were over 44 000 new additions, and almost one-quarter (23.9%) of the premises passed have connected to fibre (Exhibit 2.3).
Exhibit 2.3: UFB new connections and take-up, September 2013 to June 2016 [Source: MBIE]
0
100
200
300
400
500
600
700
February 2016 May 2016 August 2016
Inst
alls
per
day
0%
5%
10%
15%
20%
25%
0
5,000
10,000
15,000
20,000
25,000
30,000
35,000
40,000
45,000
50,000
Sept2013
Dec2013
Mar2014
June2014
Sept2014
Dec2014
Mar2015
June2015
Sept2015
Dec2015
Mar2016
June2016
% o
f pre
mis
es p
asse
d
Con
nect
ions
New connections UFB take-up

Selection of broadband anchor products 7
P U B L I C
2.3 Proposed anchor products
The Ministry notes that its proposed three anchor products encompass 87% of Chorus’ fixed line connections as at 31 December 201510, but that it expects a decline in this proportion by 2020 reflecting uptake of faster UFB services. Information from Chorus’ 2016 Annual Report illustrates that baseband copper still dominates Chorus’ fixed connections, despite a significant decline (Exhibit 2.4).
Exhibit 2.4: Fixed access connections, June 2014 to June 2016 [Source: Chorus financial
reports]
The purpose of the Ministry’s proposed 15/1 entry-level broadband anchor product is stated as ‘to ensure a baseline broadband service is available, particularly for rural end-users who
10 Ministry of Business, Innovation and Employment (2016), Telecommunications Act Review: Options Paper, July 2016, page 48.
0
200
400
600
800
1,000
1,200
1,400
1,600
1,800
Fixe
d ac
cess
con
nect
ions
('00
0s)
Fibre
Data services over copper
Naked Basic / NakedEnhanced UBA / Naked VDSL
SLU/SLES
UCLL
Baseband IP
Baseband copper

8 Network Strategies Final report for Vodafone New Zealand
P U B L I C
may not be able to access UFB’11. We note that Plum Consulting also suggested a 15/1 transitional anchor product with the main purpose stated as ‘to facilitate transition and copper retirement’12. However, clearly in areas where UFB services are inaccessible this proposed anchor product cannot facilitate migration to fibre services. Moreover it would seem unlikely that this budget copper product would incentivise fibre uptake in areas where UFB is available. We conclude that the objective of the product is not to encourage laggards to take up fibre.
So what is the Ministry’s main driver for implementing a price cap on a 15/1 product? We assume that it is to ensure that an affordable basic broadband service is available to all.
The primary purpose of this [anchor products] would be to protect end-users who use the
most affordable and basic services, and the secondary purpose would be to ‘anchor’ the
pricing of other services higher up the value chain.13
To this end the proposed affordable entry-level product is to encompass speeds up to and including those of ADSL2+ services, while VDSL2 will be grouped with fibre products at a higher price point.
We note this price [the regulated UBA price of $42.35 for Chorus’ copper UBA service in
December 2019] includes both ADSL2+ and VDSL2 unbundled bitstream access services.
As noted above, we would expect that the ‘entry-level broadband’ anchor product would
include ADSL2+ whereas the ‘basic broadband’ anchor product would include VDSL2, so
the Commission will need to develop price caps for these separate anchor products with
reference to the single UBA price in the market in 2019.14
11 Ibid, page 48.
12 Plum Consulting (2015), New Zealand’s telecommunications policy – a way forward, October 2015, page 19.
13 Ministry of Business, Innovation and Employment (2016), Telecommunications Act Review: Options Paper, July 2016, page 43.
14 Ministry of Business, Innovation and Employment (2016), Telecommunications Act Review: Options Paper, July 2016, footnote 17, page 50.

Selection of broadband anchor products 9
P U B L I C
Broadband affordability: at risk groups
Arguably the main considerations for proposing a low-cost broadband anchor product are:
to provide a low-cost service to end-users who live and / or work outside UFB reach to encourage broadband uptake by low socio-economic or other disadvantaged groups to provide a budget low-speed alternative for existing broadband subscribers in the above
vulnerable groups.
Our market analysis indicates that, given current trends, by 2020 those without broadband subscriptions will be a very small group consisting of individuals who simply do not see the need for fixed broadband. Even a copper broadband offering priced at marginal cost will therefore be unlikely to attract uptake by this market segment. If there are some income-constrained individuals or households unable to subscribe to a fixed broadband service then the most effective means of encouraging uptake for this market segment would be through a targeted grant or voucher scheme. We explore approaches adopted in other jurisdictions for assistance to vulnerable groups in Section 4.
Given current copper and fibre pricing, by 2020 we forecast that the majority of broadband subscribers within the UFB footprint will subscribe to a fibre service of 100Mbit/s or greater. If at that stage price changes render current services unaffordable for some groups then the low-cost alternative will entail inefficiencies caused by the cost of switching back to copper services and a quality shock. Consequently we doubt that the proposed 15/1 product will be acceptable to this market segment.
Thus it appears that the main target of the low cost 15/1 product is the market segment that cannot access UFB services, which will primarily consist of rural dwellers whose geographic location precludes economic provision of fibre service.
The geographic scope of this market segment is more limited than simply non UFB areas since the Rural Broadband Initiative (RBI) has led to investment by multiple providers in different broadband technologies in these areas (for example, Fixed Wireless Access). Excessive pricing is of course constrained by competition and the availability of substitutes.

10 Network Strategies Final report for Vodafone New Zealand
P U B L I C
We note that Chorus has already recently invested in the copper network in these areas with support from the RBI. Chorus recently announced that it has upgraded over 1200 cabinets in RBI areas, providing approximately 110,000 households and businesses with faster broadband, with 85% uptake15. Those end-users living within a kilometre of the cabinet may access VDSL services with speeds over 50Mbit/s while others consistently obtain 10 to 20Mbit/s.
Thus the 15/1 product would only be relevant to those customers not able to access the faster services in areas where no substitutes are available – that is, where Chorus has a monopoly. A mandated 15/1 anchor product at a price that reflects service quality provides a means of cross subsidising these high-cost areas from other (primarily UFB) areas.
An important consideration going forward is whether Chorus will have sufficient incentives to maintain and continue to invest in the copper network in these areas. Arguably with a low priced service incentives will be weak at best. Nevertheless Chorus has already indicated that it sees the role of anchor products as a mechanism for addressing such issues through cross-subsidies.
If the wholesale TSO can be resolved in a BBM [building block model] (e.g. by offering
entry-level voice and broadband anchor at affordable differentiated prices, with revenue
sufficiency mechanisms to ensure recovery of costs), the TSO requirements (to the extent
they relate to Chorus) could potentially be removed from the Act 16.
The LFCs, on the other hand, explicitly state that they are unwilling ‘to be the source of a subsidy for high-cost areas but are willing to discuss the provision of relevant basic services’17.
15 Chorus (2016), Rural broadband initiative completed, faster broadband for hundreds of thousands, 9 June 2016. Available at
https://www.chorus.co.nz/rural-broadband-initiative-completed-faster-broadband-for-hundreds-of-thousands.
16 Chorus (2015), Submission for Chorus in response to The Ministry of Business Innovation and Employment’s Discussion Paper Regulating communications for the future – Review of the Telecommunications Act 2001 (8 September 2015), October 2015, page 76.
17 Enable, Northpower and Ultrafast Fibre (2015), Response to MBIE, 3 November 2015, paragraph 105.

Selection of broadband anchor products 11
P U B L I C
In the absence of a regulated price cap for a low speed copper service we believe that Chorus will have some incentives post 2019 to offer lower cost copper broadband services. By this time the mix of copper and fibre services (and their contribution to Chorus’ revenue) will have changed considerably compared to the present. Furthermore, in LFC areas we would certainly expect Chorus to price ADSL (and possibly VDSL) at lower price points than fibre in order to retain market share. However, as the Government has expressed a preference for ‘comparable pricing for all customers and to protect against the risk of anti-competitive pricing on a geographic basis’18, these lower wholesale copper price points would apply nationwide.
If the Government wants more certainty for the affected rural market segment the proposed cross-subsidisation is a policy option, but it is important to note that the implicit tradeoff is significant and will affect a much larger proportion of end-users. Cross-subsidisation entails higher prices than otherwise in UFB and higher density rural areas (for example, where VDSL services are available). This incurs allocative inefficiencies if reduction in fibre demand in these areas occurs, compared to the level of demand in the absence of the cross-subsidy.
On the supply side, it is clear from the options paper that the Ministry envisages a very low price for this layer 2 product, which may have implications for the equivalence of inputs obligation.
… requirements for the Commission to smooth any price increase and for prices to reflect
quality may mean anchor product prices are capped at levels close to the expected layer 1
price, which may not be consistent with equivalence in a strict sense. Accordingly we propose
to carve the initial layer 2 anchor products out from the ‘equivalence of inputs’ obligations
on pricing given the policy significance of these anchor products.19
18 Ministry of Business, Innovation and Employment (2016), Telecommunications Act Review: Options Paper, July 2016, page 10.
19 Ibid, page 56.

12 Network Strategies Final report for Vodafone New Zealand
P U B L I C
Furthermore the paper notes that this issue could be exacerbated with the introduction of a cost-oriented layer 1 anchor product20.
We interpret ‘carving out’ of the layer 2 anchor products as effectively permitting Chorus to offer bundled (layer 1 and layer 2) products without any obligation to satisfy any equivalence of inputs test on pricing.
This implies that Chorus will be unable to offer dark fibre to access seekers on the same terms as internally. As such the conditions for the proposed 15/1 anchor product will distort service providers’ decisions between offering services based on layer 1 or layer 2 inputs, which will in turn have an adverse impact on innovation and the long term benefit of end-users.
Given that accommodating the low-priced 15/1 product within the proposed pricing framework is likely to have a significant distortionary impact we suggest that the Ministry consider a more targeted approach to meeting its objectives for the affected rural market segment. The target end-users should be closely identified, any subsidy should be transparent and a means of funding identified that is more efficient than the current proposal. This may involve specific funding from Government on either the supply or demand side. We have considered approaches adopted in other jurisdictions for geographic-based assistance in Section 4.
What is an appropriate entry-level anchor product for 2020?
As noted earlier, anchor pricing approaches are primarily useful to constrain monopolistic pricing behaviour while leaving some price flexibility available to the regulated supplier to support investment in new technologies, services and products. In the United Kingdom Ofcom has applied this approach using ADSL as the anchor product in order to foster commercial investment in higher speed broadband. Since broadband products may be provided over copper, cable or fibre and these networks co-exist in the UK, the possibility of substitution exists. In this particular environment it therefore follows that anchor wholesale ADSL pricing could act as a constraint on excessive pricing of higher bandwidth
20 Ibid.

Selection of broadband anchor products 13
P U B L I C
fibre products. Note also that Ofcom simultaneously regulated passive infrastructure access (for ducts and poles) and sub-loop unbundling.
To date we have adopted a mixed approach to access regulation (i.e. using both active and
passive remedies. … A mixed approach gives providers the flexibility to build business
models using a variety of wholesale remedies and allows for different levels of investment.
For this reason it may result in a larger number of providers competing in the market and
enable providers to target particular customer needs or niches.21
Given the significant market changes we are observing now in the New Zealand market at best ADSL and fibre will have become weak substitutes by 2020. An anchor product based on ADSL characteristics will therefore be unlikely to act as a constraint on abuse of monopoly power. Chorus currently offers a range of price regulated and commercial fibre products differentiated by speed at layer 222. In July 2014 Chorus introduced a commercial 100/20 product with a wholesale price of $40 to “help establish this speed as the entry level fibre wholesale product”23, presumably because the contractually agreed $55 price point for the 100/50 product was attracting little interest from RSPs. Chorus’ commercial pricing placed the product closer to the UFB contractual price of the 30/10 product than the UFB contractual price of the 100/50 product (Exhibit 2.5). Note that there are two 100/50 products. The higher priced product was part of Chorus’ contracted pricing at UFB commencement while the lower priced product is a commercial offering.
21 Ofcom (2015), Strategic Review of Digital Communications, 16 July 2015, page 96.
22 Ibid, page 27.
23 Chorus (2015), Annual Report 2015, page 17.
14 Network Strategies Final report for Vodafone New Zealand
P U B L I C
2015 2016 2017 2018 2019
UCLL 29.75 30.22 30.70 31.19 31.68
UBA 41.19 41.44 41.71 42.02 42.35
Fibre 30/10 (contracted product)
38.50 39.50 40.50 41.50 42.50
Fibre 100/20 (commercial product)
41.00 42.00 43.00 44.00 45.00
Fibre 100/50 (commercial product)
46.00 47.00 48.00 49.00 50.00
Fibre 100/50 (contracted product)
54.00 53.00 52.00 51.00 49.90
Exhibit 2.5: Chorus’ copper and fibre wholesale monthly prices in New Zealand [Source:
Chorus, Commerce Commission, Crown Fibre Holdings]
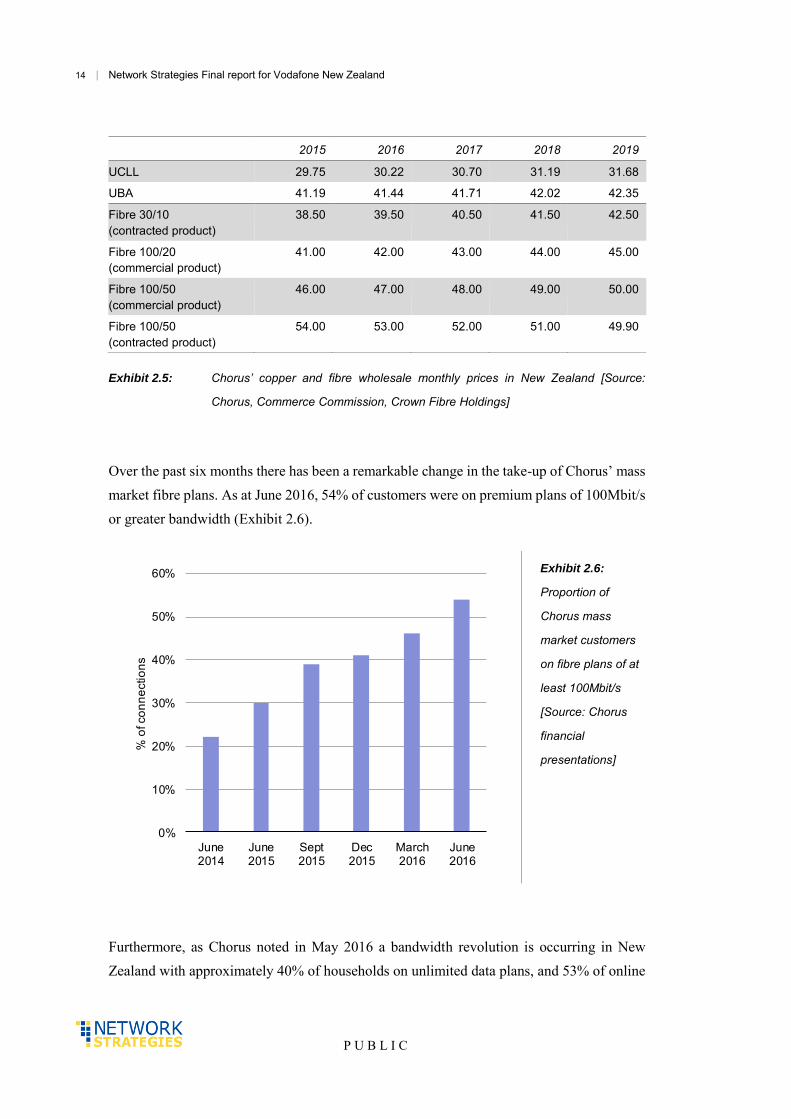
Over the past six months there has been a remarkable change in the take-up of Chorus’ mass market fibre plans. As at June 2016, 54% of customers were on premium plans of 100Mbit/s or greater bandwidth (Exhibit 2.6).
Exhibit 2.6:
Proportion of
Chorus mass
market customers
on fibre plans of at
least 100Mbit/s
[Source: Chorus
financial
presentations]
Furthermore, as Chorus noted in May 2016 a bandwidth revolution is occurring in New Zealand with approximately 40% of households on unlimited data plans, and 53% of online
0%
10%
20%
30%
40%
50%
60%
June2014
June2015
Sept2015
Dec2015
March2016
June2016
% o
f con
nect
ions

Selection of broadband anchor products 15
P U B L I C
consumers streaming television or movies24. These trends indicate that by 2020 a 15/1Mbit/s product will clearly not represent an entry-level broadband product in New Zealand. Thus, on the basis of current trends, it appears that any entry level broadband anchor product should at a minimum achieve 100/20Mbit/s.
Based on the reported UFB take-up, we have developed fibre demand projections for the period 2016 to 2019. Take-up has been increasing steadily and as at June 2016, it had reached 23.9%25, increasing from 21.3% in March 201626. There are now fibre plans that are cheaper than copper (Exhibit 2.11), so there is clear incentive for end-users to switch to UFB services. With over three-quarters (76.8%)27 of New Zealand households having access to the Internet there is considerable opportunity for more rapid growth in UFB take-up.
Our projections encompass a range of relatively conservative growth scenarios, based on an assumed end-of-year take-up for 2016. The base case is for take-up to remain flat at the mid-year level (24%), however the quarterly performance to date suggests that a more likely outcome would see take-up approaching 30% by the end of 2016 – in which case by the end of 2019 take-up is projected to reach 58%, or around 877 000 connections (Exhibit 2.7). More rapid migration to UFB services is indeed feasible, given that fibre is now less expensive than copper, and achieving take-up in excess of 70% by 2019 could well be possible.
24 Chorus (2016), Macquarie Australia Conference 2016, 6 May 2016, Page 10.
25 Ministry of Business, Innovation and Employment (2016), Broadband Deployment Update June 2016.
26 Ministry of Business, Innovation and Employment (2016), Broadband Deployment Update March 2016.
27 Statistics New Zealand (2016), 2013 Census QuickStats about transport and communications, 3 February 2015.

16 Network Strategies Final report for Vodafone New Zealand
P U B L I C
Exhibit 2.7: Demand projections for UFB fibre, 2016 to 2019 [Source: Network Strategies]
We also examined take-up of premium (100Mbit/s and above) plans. Chorus stated that in the June quarter 2016 90% of its new mass market installs were for premium plans28 – if we assume that this trend continues over the next four years, plus a relatively modest 10% of non-premium connections being upgraded to premium plans each year, then by the end of 2019 81% of all plans will be 100Mbit/s and above (Exhibit 2.8).
28 Chorus (2016), FY16 Full Year Result, 29 August 2016.
0
200,000
400,000
600,000
800,000
1,000,000
1,200,000
1,400,000
2013 2014 2015 2016 2017 2018 2019
Con
nect
ions
40% take-up 2016 35% take-up 2016
30% take-up 2016 24% take-up 2016

Selection of broadband anchor products 17
P U B L I C
Exhibit 2.8: Projected mix of plans, with premium plans being 90% of new installs and 10%
churn for non-premium plans, 2015 to 2019 [Source: Network Strategies]
If however a third of non-premium plans are migrated each year, then by 2019 premium plans would comprise 90% of all plans (Exhibit 2.9). With there being little difference between prices for 100Mbit/s and 30Mbit/s retail plans (Exhibit 2.11), take-up of premium plans could well be even higher.
0%
10%
20%
30%
40%
50%
60%
70%
80%
90%
100%
2015 2016 2017 2018 2019
% o
f con
nect
ions
Premium plans (100Mbit/s and above) Non-premium plans (<100Mbit/s)
New installs = 90% premium
Non-premium migration = 10%

18 Network Strategies Final report for Vodafone New Zealand
P U B L I C
Exhibit 2.9: Projected mix of plans, with premium plans being 90% of new installs and 33%
churn for non-premium plans, 2015 to 2019 [Source: Network Strategies]
Plum Consulting suggests that a single 30/10Mbit/s fibre anchor product would suffice as a constraint on the access provider’s market power, with the price of copper ‘stabilised as close as possible to the price of the basic fibre product’29. If the Ministry followed Plum Consulting’s recommendation then, given current trends, Chorus would be free to exercise its monopoly power with a substantial price differential for the 100Mbit/s service consumed by the majority of UFB end-users. Furthermore, Chorus recently stated30 that the highest UFB uptake levels are now being observed in lower socio-economic areas such as Manukau and Porirua. These households are relinquishing other services in order to obtain 100Mbit/s UFB services for use in their daily lives as the Internet becomes more accessible than previously (through devices such as tablets). As discretionary income is typically low in such households, it will be these groups that will encounter particular hardship if the entry level anchor product is set inappropriately.
29 Plum Consulting (2015), New Zealand’s telecommunications policy – a way forward, October 2015, page 1.
30 Chorus presentation at Auckland Tuanz meeting, 4 August 2016.
0%
10%
20%
30%
40%
50%
60%
70%
80%
90%
100%
2015 2016 2017 2018 2019
% o
f con
nect
ions
Premium plans (100Mbit/s and above) Non-premium plans (<100Mbit/s)
New installs = 90% premium
Non-premium migration = 33%
Selection of broadband anchor products 19
P U B L I C
In conclusion, while the Ministry’s proposed 100/20 anchor product may appear to be a reasonable basic-level product at the present time, it is highly unlikely that this will be the case in 2020. With the current pace of change we note that it is extremely difficult to specify appropriate anchor products for a regulatory time-period that is four years away. As such we recommend that the Ministry consider establishing rules for defining an anchor product in terms of an empirically observable measure. These rules could then identify the typical basic level speed – together with any other relevant characteristics such as quality of service – closer to the regulatory period. We anticipate such rules would consider the distribution of mass market connections by plan, across all technologies. In this way, the anchor product is defined by, and is relevant for, the market within the desired regulatory period.
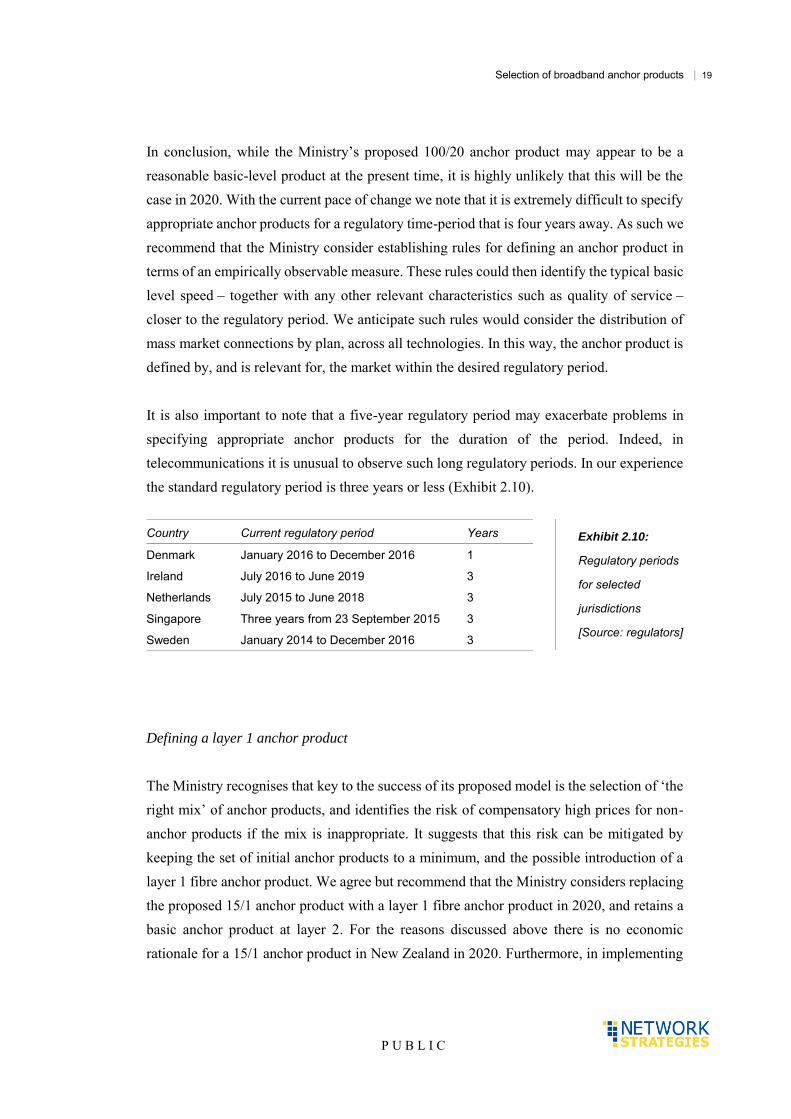
It is also important to note that a five-year regulatory period may exacerbate problems in specifying appropriate anchor products for the duration of the period. Indeed, in telecommunications it is unusual to observe such long regulatory periods. In our experience the standard regulatory period is three years or less (Exhibit 2.10).
Country Current regulatory period Years Exhibit 2.10:
Regulatory periods
for selected
jurisdictions
[Source: regulators]
Denmark January 2016 to December 2016 1
Ireland July 2016 to June 2019 3
Netherlands July 2015 to June 2018 3
Singapore Three years from 23 September 2015 3
Sweden January 2014 to December 2016 3
Defining a layer 1 anchor product
The Ministry recognises that key to the success of its proposed model is the selection of ‘the right mix’ of anchor products, and identifies the risk of compensatory high prices for non-anchor products if the mix is inappropriate. It suggests that this risk can be mitigated by keeping the set of initial anchor products to a minimum, and the possible introduction of a layer 1 fibre anchor product. We agree but recommend that the Ministry considers replacing the proposed 15/1 anchor product with a layer 1 fibre anchor product in 2020, and retains a basic anchor product at layer 2. For the reasons discussed above there is no economic rationale for a 15/1 anchor product in New Zealand in 2020. Furthermore, in implementing

20 Network Strategies Final report for Vodafone New Zealand
P U B L I C
a 15/1 anchor another important regulatory tool (equivalence of inputs) for protecting access seekers from potential abuse of monopoly power may be compromised.
It is important to note that implementation of an equivalence of inputs obligation at layer 1 does not necessarily preclude the need for regulated pricing. Indeed in New Zealand when equivalence of inputs obligations were imposed on the newly functionally separated Telecom New Zealand in 2008 these were accompanied by regulated pricing of unbundled copper local loop services. Other countries with wholesale broadband open access regimes regulate prices of unbundled fibre local loop services – for example, Denmark and Sweden, as discussed in Section 3.
Chorus has previously indicated that layer 1 unbundling would prevent it from subsidising lower priced / quality fibre products with higher priced / quality fibre products:
… without controlling the electronics, Chorus could not sell the layer 1 at two different
prices – one for faster downloads and another for slower downloads. Consequently, Chorus
could not sustain a high priced fast download bundled product (with an implicit high price
for use of the dark fibre) because any access seeker using that bundled product to supply end-
users could be undercut by another access provider taking unbundled GPON (at a lower
price) and supplying fast downloads over that using its own electronics. This will drive out
the high price/quality bundled offerings and, ultimately the lower priced/quality bundled
offerings (given the former fund the latter).31
Plum Consulting also suggests that cross-subsidisation is required in order to ‘offer entry level packages which would support digital inclusion’32. Indeed its argument that layer 1 unbundling is inconsistent with speed-price differentiation rests on the implicit assumption (as depicted in Plum Consulting’s Figure 3-4) that the cost-based passive wholesale price would be greater than the wholesale (layer 2) price for an entry level product, thereby reducing the scope for the regulated supplier to offer cross-subsidised products.
31 Chorus (2015), Submission for Chorus in response to The Ministry of Business Innovation and Employment’s Discussion Paper
Regulating communications for the future – Review of the Telecommunications Act 2001 (8 September 2015), October 2015. Footnote 36.
32 Plum Consulting (2015), New Zealand’s telecommunications policy – a way forward, October 2015, page 8.

Selection of broadband anchor products 21
P U B L I C
With copper loop unbundling the main forms of service differentiation were contention, data
caps, technology (with the shift to ADSL2+) and customer service. Whilst service-price
differentiation based on speed was tried in a number of markets it arguably wasn’t credible
given the significant variation in speed over individual copper lines.
However, for commercial fibre deployments speed-price differentiation has proved
important, with different speed tiers offered to all customers – for example, Verizon in the
US. Layer 1 unbundling would undermine this form of differentiation.
The reason for this is that if an unbundled product is available which offers the full capability
of fibre at a single wholesale price, then any retailer who attempts to charge a premium for
the highest possible speed will be undercut and one who charges less for a lower speed value
package will not find it viable.33
We note that Verizon is the one example provided by Plum Consulting purportedly to illustrate the importance of speed-price differentiation and no unbundling. It is difficult to see the relevance to the New Zealand context of the pricing plans of a vertically integrated network operator / retailer for whom its major competitors are cable operators.
In regulated markets it should be noted that differential prices of layer 2 services by bandwidth are not based on costs. These prices are typically set by applying a notional glide path to the average cost per unit demand (across all bandwidths), with the glide path defined by assumed relative differences between the various bands. This technique is employed as there is little difference in the underlying costs of the various bandwidth services. In essence the regulator is assigning a relative value for the various bandwidth services with the overall outcome expected to be revenue neutral – essentially assuming some distribution of demand. Clearly distortions will occur if the demand distribution differs from the assumed distribution. If demand for the high bandwidth services is greater than expected, the wholesale operator will receive excessive profits. Conversely if demand for high bandwidth services is lower than expected – for example if a low priced entry level service proves to be more attractive than anticipated – the wholesale operator will incur a loss.
33 Ibid, page 7.

22 Network Strategies Final report for Vodafone New Zealand
P U B L I C
The nature of forecasting is that forecast error increases as time progresses. Thus a projected demand distribution for a regulatory period commencing in 2020 will have a far greater error than one for a period commencing in 2017, particularly in a dynamic market undergoing significant structural changes such as those that typify broadband in New Zealand. As we have noted above the post 2020 broadband market will look very different to the 2015 broadband market.
As regards price relativities between layer 1 dark fibre and layer 2 in overseas jurisdictions we find that where wholesale prices are regulated there is a significant difference between layer 1 and layer 2 prices, with no apparent barriers to speed-price differentiation for retail services (explored further in Section 3).
From a review of retail offers for different fibre products with unlimited data on offer as at 4 August 2016 (Exhibit 2.11) we found little or no retail speed-price differential for the entry-level (30) and higher speed (100) fibre products. There are copper-based plans that are priced slightly higher than fibre plans, but this was as expected, given the increase in the regulated copper bitstream price in December 2015. The retail prices were very similar across the RSPs which reflects the fact that they are all offering identical wholesale products in a competitive retail market and as such the underlying business cases are basically the same. Given that the price of a 100bit/s fibre service can be the same or lower than a DSL or VDSL service, it is hardly surprising that consumers are churning to fibre.
ADSL VDSL Fibre 30 Fibre 100
Orcon 95.00 95.00 95.00 95.00
Spark 95.00 95.00 90.00 90.00
Vodafone 95.00 95.00 91.00 91.00
Slingshot 89.95 94.95 89.95 94.95
Actrix 99.00 99.00 99.00 109.00
Unlimited Internet 69.00 75.00 70.00 75.00
Compass 79.95 94.95 84.95 89.95
Bigpipe 79.00 89.00 - 79.00
MyRepublic - 89.99 - 89.99
2Degrees - 95.00 - 95.00
Exhibit 2.11: Monthly broadband retail pricing in New Zealand, August 2016 [Source: service
providers]

Selection of broadband anchor products 23
P U B L I C
Another clear observation from our inspection of RSPs’ websites is that in a fibre world retailers still seek to differentiate offerings on the basis of features that add value, such as customer service, different sized data bundles, discounts for multiple services, and various innovative bundling options.
However, the scope for differentiation and innovation would be widened in an alternative scenario in which access seekers have flexibility to innovate via upstream investment. Dynamic efficiency would be promoted with investment in active infrastructure by service providers prepared to trade off higher risks for higher returns.
If we consider the likely competitive dynamic it is improbable that a speed-price differential would cease to exist, but rather that more scope for differentiated retail products would arise from unbundling. Once a service provider obtains a cost-based layer 1 price and invests in electronics, new layer 2 products may be created, thereby promoting competition. The service provider’s competitive advantage should lead to pressure from other competitors that have not invested in layer 1 unbundling for equivalent products from the access provider. The long-term benefit of end-users is promoted as pressure to match new offerings provides incentives for further investment, increases in efficiency and / or cost savings.
The LFCs identify the main cause for concern in the above scenario, namely that ‘the primary risk is that unbundled access may be under-priced with the effect of inflicting capital losses on LFC investors’.34 We agree that it is important that a layer 1 unbundled price is cost-reflective, in order to ensure not only a fair rate of return for the access provider, but also to provide efficient investment signals.
Submissions from Chorus and the LFCs indicate that they believe that layer 1 unbundling would be both technically complex and expensive, with adverse revenue and profit implications35. As such they have recommended that the Government abandon completely the existing contractual obligation to unbundle point-to-multipoint parts of the network in 2020. If the Government were to do this then it would effectively be relying on Chorus to
34 Enable, Northpower and Ultrafast Fibre (2015), Response to MBIE, 3 November 2015, paragraph 96.
35 Chorus (2015), Submission for Chorus in response to The Ministry of Business Innovation and Employment’s Discussion Paper Regulating communications for the future – Review of the Telecommunications Act 2001 (8 September 2015), October 2015. Appendix 7; Enable, Northpower and Ultrafast Fibre (2015), Response to MBIE, 3 November 2015, section 4.4.

24 Network Strategies Final report for Vodafone New Zealand
P U B L I C
invest and innovate in the absence of competition. Arguably Chorus’ producer surplus may be greater than otherwise in these circumstances to fund new investment and innovation, but whether it would have the incentives to do so may be questionable.
Does innovation matter in a fibre world?
Plum Consulting admits that, absent layer 1 unbundling, opportunities for independent innovation to offer higher speed may be limited. At the same time it suggests that third parties have fewer options for innovation than the wholesale operator, and the economic value of innovation based on speed is questionable.
Whilst there is considerable uncertainty regarding the value of future bandwidth there are
reasons [sic] expecting diminishing returns: the set of applications dependent on ever higher
speeds narrows, some applications may be approaching the resolution limits of our senses
(e.g. 4K video), evidence regarding willingness to pay suggests diminishing returns, and
download time savings from successive speed doublings are half those from the preceding
doubling.36
In our view, Plum Consulting’s caution is at best premature and indeed may be misplaced. Mass market applications, such as video streaming, that would have been unthinkable only a few years ago are now made possible through a combination of affordable and accessible devices and bandwidth. It makes little sense to assume further innovation would not be possible, when innovation by its very nature may represent a revolutionary and / or disruptive advance. Indeed some sixty years ago it was believed that there would be a market for only a handful of computers.
The main driver for increased speeds and data caps has been video applications. Over half (53%) of New Zealand consumers are streaming television or movies – Chorus notes that video requires sustained 50Mbit/s capacity and expects this to increase to 100Mbit/s.37
36 Plum Consulting (2015), New Zealand’s telecommunications policy – a way forward, October 2015, pages 8-9.
37 Chorus (2016), Introducing Chorus, Macquarie Australia Conference, 6 May 2016.

Selection of broadband anchor products 25
P U B L I C
Furthermore the broadband connection may need to support multiple simultaneous applications with each user within the household operating several different devices.
Even the humble web page has expanded. Over the past six years the size of the average web page has increased by more than 240%, from 0.7MB to 2.3MB38 (Exhibit 2.12). The key factors behind this increase are the use of images, scripts and video.
Exhibit 2.12: Average size of web pages, November 2010 to July 2016 [Source: HTTP Archive]
We tested the home pages for a sample of New Zealand websites and found that many of these were significantly larger than the 2.3MB average, including the home pages of Lightbox, MBIE, SkyTV, Stuff and Metservice (Exhibit 2.13). We note the recent announcement that Stuff will be entering the fibre broadband market as an RSP39 and plans
38 Based on a survey by HTTP Archive (http://www.httparchive.org).
39 Stuff (2016), Stuff to enter the broadband market with Stuff Fibre, 9 August 2016.
0.0
0.5
1.0
1.5
2.0
2.5
Siz
e (M
B)
Average web page Web page images

26 Network Strategies Final report for Vodafone New Zealand
P U B L I C
to offer a 100Mbit/s service – clearly with a video- and image-rich website Stuff is keen for there to be no barrier for its users to have a quality experience.

Selection of broadband anchor products 27
P U B L I C
Exhibit 2.13: Size of website home page, for a sample of New Zealand websites, 4 August 2016
[Source: Network Strategies]
0 1 2 3 4 5 6 7 8 9 10
asb.co.nzseek.co.nz
tki.org.nzird.govt.nz
westpac.co.nzhealth.govt.nz
tpk.govt.nzvodafone.co.nz
spark.co.nzanz.co.nz
govt.nztrademe.co.nz
airnewzealand.co.nzworkandincome.govt.nz
realestate.co.nzchorus.co.nz
aucklandcouncil.govt.nzwcc.govt.nz
kiwibank.co.nzmathletics.co.nz
tv3.co.nzthewarehouse.co.nz
tvnz.co.nznoelleeming.co.nzeducation.govt.nz
ccc.govt.nzvictoria.ac.nz
aut.ac.nzjustice.govt.nznzherald.co.nzauckland.ac.nz
allblacks.commaoritelevision.com
2degreesmobile.co.nzimmigration.govt.nz
metservice.comstuff.co.nz
skytv.co.nzmbie.govt.nz
lightbox.co.nz
Home page size (MB)

28 Network Strategies Final report for Vodafone New Zealand
P U B L I C
2.4 Conclusions
An anchor pricing approach with judicious selection of anchor products may certainly achieve Government objectives for the communications sector. However we find that an anchor product specified at the passive layer to support infrastructure-based competition is most likely to act as a competitive restraint and so should be preferred to a 15/1 product at layer 2 which may render unworkable equivalence of inputs obligations. The main target of the low cost 15/1 product appears to be limited to the market segment that cannot access UFB services, which will primarily consist of rural dwellers whose geographic location precludes economic provision of fibre service, and where Chorus’ low-speed copper service is the only available broadband service. Given the likely distortionary impact from accommodating the low-priced 15/1 product within the proposed pricing framework we recommend a more targeted approach to meeting Government objectives for the affected rural market segment.
The layer 1 anchor should be applied in tandem with a layer 2 entry level product that will be appropriate in 2020 following the current period of market transition. While the Ministry’s proposed 100/20 anchor product appears reasonable at present for this entry-level product, with the current pace of change it is challenging to specify an optimal entry level product now that will be relevant in four years’ time. Our recommendation is that the Ministry either leave this to the Commission, or consider establish rules for defining an anchor product in terms of an empirically observable measure which identifies the typical entry level speed – together with any other relevant characteristics such as quality of service – closer to the regulatory period.

P U B L I C
3 Wholesale pricing: layer 1 versus layer 2
We have investigated wholesale pricing – in particular the differential between layer 1 and layer 2 prices – in several jurisdictions, including:
Denmark (Section 3.1) Netherlands (Section 3.2) Singapore (Section 3.3) Sweden (Section 3.4) New Zealand (Section 3.5).
3.1 Denmark
Background
Raw fibre is available at end-customer addresses where TDC (the incumbent operator) has already deployed fibre, or where a new fibre (‘drop cable’) can be connected and which is no more than 30 metres in length from the fibre distribution point (FDP) to the end-customer address.40 This regulatory remedy was introduced in a 2012 determination, and reflects Danish conditions. The regulator (Erhvervsstyrelsen) was of the view that there was
40 TDC Wholesale, Bilag 1a: Produktspecifikation for Rå fiber FTH. Available at
https://wholesale.tdc.dk/wholesale/produkter/aftaler/Sider/productadditions.aspx.

30 Network Strategies Final report for Vodafone New Zealand
P U B L I C
extensive fibre coverage in Denmark with the only gaps being the final drop cable from the FDP to the end-customer address.41
Retail services
There is a wide range of fibre plans offered by service providers, with services ranging from 15/15Mbits to 1000/1000Mbit/s (Exhibit 3.1). Note that these service providers utilise the fibre networks from various energy companies.
Plan Altibox Fibia Stofa Waoo
15/15Mbit/s
25/25Mbit/s
30/30Mbit/s
50/25Mbit/s
50/50Mbit/s
60/60Mbit/s
75/75Mbit/s
90/90Mbit/s
100/100Mbit/s
250/250Mbit/s
300/300Mbit/s
500/500Mbit/s
1000/1000Mbit/s
Exhibit 3.1: Fibre broadband plans, Denmark [Source: service providers]
Wholesale pricing
Regulated price caps for raw fibre and bitstream are based on a LRAIC approach.
41 European Commission (2012), Commission Decision concerning Case DK/2012/1339: wholesale market for physical network
infrastructure access in Denmark, 9 July 2012, pp3-4.

Selection of broadband anchor products 31
P U B L I C
The fibre layer 2 bitstream options range from 10Mbit/s to 100Mbit/s, with the monthly rental varying from DKK120 to DKK138. Note that the price of the lowest speed fibre bitstream service is 23% higher than the wholesale price for raw fibre (Exhibit 3.2).42
Exhibit 3.2: Comparison of layer 2 bitstream prices with raw fibre price, Denmark [Source:
Erhvervsstyrelsen]
3.2 Netherlands
Background
Regulatory obligations with respect to unbundled fibre (ODF access) have been imposed on the incumbent operator (KPN) since 2009. KPN is required to provide FTTH at cost-oriented
42 Erhvervsstyrelsen (2015), Afgørelse om fastsættelse af maksimale netadgangspriser efter LRAIC-metoden for 2016 – fastnet,
3 December 2015.
0 20 40 60 80 100 120 140 160
Raw fibre
Bitstream 10Mbit/s
Bitstream 15Mbit/s
Bitstream 20Mbit/s
Bitstream 25Mbit/s
Bitstream 30Mbit/s
Bitstream 40Mbit/s
Bitstream 50Mbit/s
Bitstream 60Mbit/s
Bitstream 80Mbit/s
Bitstream 100Mbit/s
Monthly rental (DKK)

32 Network Strategies Final report for Vodafone New Zealand
P U B L I C
rates, however the obligation to provide FTTO (fibre to the office) was removed in 2013 as KPN was found to no longer have SMP in that market.
In its policy statement on tariffs for unbundled fibre, the regulator (OPTA) stated:
The purpose of tariff regulation for unbundled fibre access is to prevent some of the
competition problems that would otherwise arise where SMP is present. Preventing these
competition problems fosters competition on wholesale and retail markets. The price-related
competition problems that are of importance in unbundled fibre access are margin squeeze,
price discrimination and excessively high tariffs.
…The ultimate goal of the regulatory framework is to bring about a situation of enduring
competition. This is competition that is not – or is no longer – dependent on sector-specific
regulation for its existence and effectiveness. The commission [OPTA] takes the view that a
situation of enduring competition can best be achieved by giving priority in the choice of
obligations, wherever possible, to measures that foster infrastructure competition.
…The commission takes the view that both fostering competition and encouraging
investments are essential objectives in implementing tariff regulation of unbundled fibre
access. As in many cases a trade-off occurs between the two objectives the commission will
have to find the necessary balance.43
In 2011 OPTA noted that the market characteristics were such that there was significant uncertainty with regard to future costs and demand. With a strong cable sector and an incumbent having significant investment in both copper and fibre networks, developing accurate estimates was seen to be difficult, and thus OPTA implemented an alternative approach44 for price regulation of FTTH and FTTO. For the regulatory period 2012-14, OPTA set a price cap based on a Discounted Cash Flow (DCF) model using actual 2011 costs and with an inflation adjustment (using the consumer price index) applied each year. OPTA considered that the DCF model was best suited for an environment with considerable
43 OPTA (2008), Policy rules: tariff regulation for unbundled fibre access, 19 December 2008, paragraphs 19-20, 31.
44 An Embedded Direct Cost (EDC) model was used to set prices for unbundled copper.

Selection of broadband anchor products 33
P U B L I C
uncertainty, and expected that this approach would be continued beyond the 2012-14 regulatory period.
The fibre prices applied as from January 2016 were again determined by a DCF model and internal rate of return (IRR) based on that of KPN. The current regulator (ACM) notes that this approach:
…strikes the balance between encouraging investments (since the model is based on the
investor’s business model, accounts for the investment risk and allows for regulatory
certainty) and promoting competition. ACM is of the view that withdrawing the use of the
currently applicable DCF model (and applying the recommended economic replicability test
(ERT) and lifting price regulation from ODF-FttH) would hamper regulatory certainty, thus
impacting investment negatively.45
KPN can introduce prices below the price caps – and does so in practice – and is also permitted to apply volume discounts. ACM expects substantial take-up of ODF-FTTH over the regulatory period46, and over the six months to March 2016 demand for unbundled fibre has more than doubled (Exhibit 3.3).
45 European Commission (2015), Commission Decision concerning Case NL/2015/1794: Wholesale local access provided at a fixed
location in the Netherlands, 30 November 2015.
46 Ibid.

34 Network Strategies Final report for Vodafone New Zealand
P U B L I C
Exhibit 3.3: Demand for layer 1 and layer 2 access in the Netherlands, December 2014 to
March 2016 [Source: ACM]
Wholesale pricing
Prices for wholesale broadband access (WBA) are available from KPN Wholesale47. The uplift for the lowest bandwidth service (50/50Mbit/s and below) is 39% (Exhibit 3.4).
47 KPN Wholesale (2016), WBA Annex 4 CM: Tariffs Consumer modules Version 3.20 valid from 1 April 2016, 11 March 2016.
0
100
200
300
400
500
600
700
800
900
Dec 2014 Mar 2015 June 2015 Sept 2015 Dec 2015 Mar 2016
Con
nect
ions
('00
0s)
Unbundled fibre (FTTH) Unbundled copper Active fibre (FTTH) Active copper

Selection of broadband anchor products 35
P U B L I C
Exhibit 3.4: Monthly pricing for unbundled and active fibre in the Netherlands, 2016 [Source:
KPN Wholesale]
3.3 Singapore
Background
Singapore’s Next Generation Nationwide Broadband Network (Next Gen NBN) is a Government-subsidised high-speed fibre network. It operates within a three-tier structure:
Network Operating Company (NetCo), responsible for the passive network infrastructure (such as dark fibre and ducts)
Operating Company (OpCo), the active network operator offering layer 2 and layer 3 services
Retail Service Providers (RSPs), delivering services directly to end-users.
Wholesale price caps for services on both the passive and active networks were specified in the original contracts awarded in the tender process. The successful tenderers were:
0 5 10 15 20 25 30 35 40 45 50
FTTH
<= 50/50Mbit/s
<= 100/100Mbit/s
<= 200/200Mbit/s
<= 500/500Mbit/s
Monthly tariff (EUR per line)
FTTH VLAN FTTH

36 Network Strategies Final report for Vodafone New Zealand
P U B L I C
NetCo – OpenNet, originally a consortium between SingTel, SP Telecommunications, Singapore Press Holdings and Axia NetMedia
OpCo – Nucleus Connect, wholly owned by StarHub, one of the major telecommunications operators in Singapore.
As part of the NetCo proposal, a form of structural separation was applied, whereby SingTel’s infrastructure assets (layer 0 – ducts, manholes and exchanges) were transferred to an independent entity, AssetCo. In 2013 SingTel acquired 100% of the shares in OpenNet, and as part of the merger conditions is required to reduce its stake in NetLink Trust (the trust entity that now manages both NetCo and AssetCo) to 25% by 2018. In addition SingTel was required to relinquish its role as the sole Key Sub-Contractor (KSC) for OpenNet (NetCo) – a commercial arrangement in which SingTel was contracted to deploy fibre infrastructure and services – and transfer its KSC staff to NetLink Trust.
Nucleus Connect is a regulated OpCo, however many RSPs – including SingTel, M1, MyRepublic and ViewQwest (Exhibit 3.5) – have become commercial OpCos, obtaining passive infrastructure assets directly from NetCo. The purpose of the regulated OpCo is to facilitate the market entry of new players without the need to deploy their own OpCo.
Exhibit 3.5:
Market share, fibre
broadband,
Singapore,
December 2015
[Source: iDA,
operator financial
reports, Morgan
Stanley]
SingTel52.0%
StarHub29.0%
M113.7%
My Republic4.8%
Others0.5%

Selection of broadband anchor products 37
P U B L I C
By the end of 2015, fibre accounted for nearly two-thirds (63%) of wireline broadband connections in Singapore (Exhibit 3.6).
Exhibit 3.6: Fixed broadband subscriptions, Singapore, 2009 to 2015 [Source: iDA]
Fibre in Singapore: market failure or success?
The Singapore model is criticised heavily in Chorus’ submission48. Chorus claims that the separation of layers 0, 1 and 2 resulted in considerable inefficiencies. Our own investigation of the situation in Singapore suggests that the picture is not nearly as bleak as that described by Chorus.
48 Chorus (2015), Submission for Chorus in response to The Ministry of Business Innovation and Employment’s Discussion Paper
Regulating communications for the future – Review of the Telecommunications Act 2001 (8 September 2015), 30 October 2015.
0
200,000
400,000
600,000
800,000
1,000,000
1,200,000
1,400,000
1,600,000
2009 2010 2011 2012 2013 2014 2015
xDSL Cable modem Fibre Other platforms

38 Network Strategies Final report for Vodafone New Zealand
P U B L I C
The Singapore regulator, iDA, issued a detailed explanatory memorandum of its decision to allow the 2013 merger49. It notes that a key benefit for the merger proposal would be increased efficiencies due to the integration of the layer 0 and layer 1 passive infrastructure and the transfer of SingTel KSC staff into NetLink Trust.
iDA also noted that:
iDA does not prevent competing service providers offering services in the NetCo and OpCo layers
a number of telecoms players have deployed dark fibre either for their own use or for leasing to third parties
other than Nucleus Connect, there were seven OpCo players (as at 2013) taking dark fibre services directly from NetCo,50
This is clearly an environment in which service providers are purchasing both layer 2 and layer 1 services, as well as building their own infrastructure – achieving a key policy objective to encourage operators in climbing the ladder of investment. As noted by Analysys Mason in its detailed case study of fibre in Singapore for Ofcom, prior to the Next Gen NBN few service providers purchased the passive infrastructure products offered by SingTel as part of its regulatory obligations in the wholesale broadband market.51 Analysys Mason – consultants to Chorus throughout the FPP process for UCLL and UBA – also concludes that “the dark fibre remedy in Singapore has successfully enabled infrastructure-based competition”52.
49 iDA (2013), Explanatory memorandum on the decision of the Info-communications Development Authority of Singapore in relation
to the long form consolidation application submitted by Opennet Pte Ltd, the Netlink Trust, Citynet Infrastructure Management Pte Ltd and Singapore Telecommunications Ltd, 21 November 2013.
50 Ibid, paragraphs 8-9.
51 Analysys Mason (2015), International case studies, final report for Ofcom, 10 July 2015, p163.
52 Ibid, p172.

Selection of broadband anchor products 39
P U B L I C
In its submission53, Chorus has ignored such findings, instead focussing on inefficiencies that occurred prior to the 2013 merger, together with a fairly limited review of the retail market.
To a large degree, Chorus’ pessimistic analysis of the Singapore model is irrelevant to the situation in New Zealand. Singapore has implemented a much greater degree of structural separation than in New Zealand, where Chorus is responsible for layer 0, 1 and 2 infrastructure, and thus should not be subject to the between-layer inefficiencies observed in Singapore prior to the 2013 merger.
However, unlike what is being proposed for New Zealand, Singapore maintains a clear differential (outlined below) between the regulated prices for layer 1 and layer 2 products. This therefore provides more appropriate signals for service providers at various levels on the ladder of investment than in a situation with a relatively small gap – a gap that does not reflect differences in the underlying infrastructure costs – between layer 1 and layer 2 prices.
Has there been service innovation in Singapore? Chorus claims that “service offerings are relatively homogenous” between the major retail service providers with “limited product differentiation based on network performance”54. We certainly did not find this to be the case based on our examination of plans advertised on RSP websites55. Residential plans range from 100Mbit/s to 10Gbit/s (Exhibit 3.7). Fibre plans for business typically emphasise superior network performance to that of residential plans (for example for SingTel and M1), while low latency plans designed specifically for gamers are available from M1 and MyRepublic. ViewQwest offers low latency plans for businesses. All these RSPs are OpCos.
53 Chorus (2015), Submission for Chorus in response to The Ministry of Business Innovation and Employment’s Discussion Paper
Regulating communications for the future – Review of the Telecommunications Act 2001 (8 September 2015), 30 October 2015.
54 Chorus (2015), Submission for Chorus in response to The Ministry of Business Innovation and Employment’s Discussion Paper Regulating communications for the future – Review of the Telecommunications Act 2001 (8 September 2015), 30 October 2015, appendix 7, paragraph 21.
55 All retail plans current as at 1 August 2016.

40 Network Strategies Final report for Vodafone New Zealand
P U B L I C
Operator Bandwidth Notes Exhibit 3.7:
Bandwidths
available with
residential fibre
plans in Singapore,
August 2016
[Source: operator
websites]
SingTel 500Mbit/s
1Gbit/s
10Gbit/s
Starhub 100Mbit/s
200Mbit/s Only with dual fibre/cable plan
300Mbit/s
500Mbit/ Only with dual fibre/cable plan
1Gbit/s
M1 100Mbit/s
300Mbit/s
1Gbit/s
10Gbit/s
MyRepublic 1Gbit/s
ViewQwest 1Gbit/s
2Gbit/s
While there are common features among a number of the plans, this is more likely to be due to service providers targeting similar customer segments rather than demonstrating lack of service innovation.
Based on this evidence we therefore conclude that the Singapore model has indeed delivered benefits to end-users in terms of service choice, and we agree with Analysys Mason’s conclusion that infrastructure competition has been successful.
Wholesale pricing
For its residential offering, the OpCo Nucleus Connect has four classes of service, with defined performance parameters (Exhibit 3.8)56.
56 Nucleus Connect (2014), Service Schedule - Residential Per-End-User Connection, 16 January 2014. Available at
http://www.nucleusconnect.com/ico.php?navid=3&itemID=11.

Selection of broadband anchor products 41
P U B L I C
Class of service Jitter Latency Packet loss
Class A Real Time 0.5ms 4ms 0.2%
Class B Near Real Time 1ms 8ms 0,2%
Class C Mission Critical 3ms 15ms 0.1%
Class D Best Effort Best effort 30ms Best effort
Exhibit 3.8: Performance parameters for Nucleus Connect’s residential service [Source:
Nucleus Connect]
Nucleus Connect’s pricing structure for residential services depends on three factors:
class of service (as per Exhibit 3.8) type of port
Fast Ethernet – peak information rate57 of 100Mbit/s downlink and 50Mbit/s uplink Gigabit Ethernet – peak information rate of 1Gbit/s downlink and 500Mbit/s uplink
committed information rate, guaranteed by Nucleus Connect Fast Ethernet – minimum 25Mbit/s downlink; maximum 100Mbit/s downlink and
50Mbit/s uplink – Gigabit Ethernet – minimum 250Mbit/s downlink and 10Mbit/s uplink; maximum
300Mbit/s downlink and 150Mbit/s uplink.
Monthly rental for Nucleus Connect’s least expensive residential service (Class D Best Effort Fast Ethernet with the minimum committed information rate of 25Mbit/s downlink) is 40% higher than that for the passive connection from NetLink Trust (Exhibit 3.9). This gap widens as the committed information rate increases, for higher classes of service and for Gigabit Ethernet ports.
57 Defined as the maximum bandwidth from the aggregation router to the NTE/ONT in the absence of traffic aggregation, congestion
or multiplexing.

42 Network Strategies Final report for Vodafone New Zealand
P U B L I C
Exhibit 3.9:
Monthly rental for a
residential end-user
connection for Fast
Ethernet with
25Mbit/s downlink
committed
information rate,
compared to rental
for passive
connection
[Sources: Nucleus
Connect, NetLink
Trust]
3.4 Sweden
Background
Regulatory remedies for fibre access, including dark fibre, were first imposed on the Swedish incumbent operator (TeliaSonera) in 2010. These remedies included an obligation to deploy fibre in existing ducts where there was no available dark fibre to which access can be provided on request.58 An earlier market study by the regulator (PTS) found that the market for fibre access was subject to competition issues – at that time TeliaSonera’s infrastructure comprised around 45% of the national fibre network, however there was a distortion of market power due to the geographically fragmented nature of the local fibre companies competing with TeliaSonera.59
58 European Commission (2010), Commission decision concerning Case SE/2010/1061: Wholesale (physical) network infrastructure
access (including shared or fully unbundled access) at a fixed location, 19 April 2010, p4.
59 PTS (2009), Svart fiber – ett år senare, 24 June 2009, Abstract.
0 10 20 30 40 50
Passive connection
Class D Fast Ethernet
Class C Fast Ethernet
Class B Fast Ethernet
Class A Fast Ethernet
Monthly rental (SGD)

Selection of broadband anchor products 43
P U B L I C
In its 2015 report on the Swedish telecommunications market60, PTS notes that there have been “significant sales” of dark fibre to operators. PTS also found that regulation of wholesale local access provided at a fixed location (market 3a – unbundled copper and fibre) had been sufficient to resolve competition issues, however the regulatory remedy for market 3b (wholesale broadband/bitstream access) had resulted in limited take-up.61
Retail demand for fibre
In Sweden, fibre currently has almost half the market (49%) for fixed broadband connections (Exhibit 3.10).
Exhibit 3.10:
Swedish fixed
broadband
connections by
technology, 2015
[Source: PTS]
60 PTS (2015), The Swedish telecommunications market 2015, 10 June 2015, p55.
61 European Commission (2015), Commission Decision concerning Case SE/2015/1687: Wholesale local access provided at a fixed location in Sweden, 6 February 2015, p6.
Fibre49%
Cable19%
DSL32%
Other0.5%

44 Network Strategies Final report for Vodafone New Zealand
P U B L I C
The most popular plans are those with downstream bandwidth of at least 100Mbit/s and under 1000Mbit/s, comprising 73% of all fibre connections (Exhibit 3.11). Indeed over the past six years demand for fibre plans with slower speeds has been largely static.
Exhibit 3.11: Swedish fibre broadband connections by bandwidth, 2010 to 2015 [Source: PTS]
Wholesale pricing
Wholesale price caps for TeliaSonera’s dark fibre are currently set by geotype, using a LRIC methodology. Definitions of the five geotypes are based on line density:
geotype 1 – more than 500 lines per km2 geotype 2 – between 50 and 500 lines per km2 geotype 3 – between 5 and 50 lines per km2 geotype 4 – between 1 and 5 lines per km2 geotype 5 – less than 1 line per km2. Note that it is assumed that geotype 5 is served by
wireless technology rather than fibre.
0
200
400
600
800
1,000
1,200
1,400
1,600
1,800
2010 2011 2012 2013 2014 2015
Con
nect
ions
('00
0s)
Less than 2Mbit/s 2-10Mbit/s 10-30Mbit/s
30-100Mbit/s 100-1000Mbit/s 1000Mbit/s and over
Selection of broadband anchor products 45
P U B L I C
PTS notes that there is considerable geographic variation in costs, and reasons that in order to provide the appropriate investment signals for an access seeker assessing whether to build its own fibre network or lease dark fibre geographically de-averaged prices are required.62
In contrast, for wholesale copper access TeliaSonera can choose to apply either national average prices or prices by geotype. PTS notes that the former can give rise to situations where copper will be more expensive than fibre.63
Current wholesale price caps for dark fibre in geotypes 1 and 2 are significantly lower than the least expensive bitstream option, FTTx 0.25/0.25 (Exhibit 3.12). For geotype 3, the dark fibre price is comparable to the low-end bitstream option, but is still significantly less expensive than the other three bitstream products. However in the rural areas typified by geotype 4, the dark fibre price is only slightly lower than the two high-end bitstream products.
62 PTS (2015), Beslut om fastställande av företag med betydande inflytande på marknaden för lokalt tillträde till nätinfrastruktur
(marknad 3a), 19 December 2015, p240.
63 Ibid.

46 Network Strategies Final report for Vodafone New Zealand
P U B L I C
Exhibit 3.12: Comparison of LRIC-based fibre bitstream prices with regulated prices for dark
fibre, Sweden [Source: PTS]
As from 1 December 2016, an Economic Replicability Test (ERT) will be introduced and the above fibre price caps will no longer apply. Under the ERT:
…TeliaSonera must apply a pricing structure that ensures that access seekers can
economically replicate its retail offers on the basis of the NGA wholesale inputs, whose
prices will no longer be regulated.64
Downstream costs will be estimated via a bottom-up LRIC model and based on an “Equally Efficient Operator” (EEO) standard. For fibre access wholesale reference prices will be calculated as a national average, and retail products will be the two “most relevant” products (in terms of volumes and values) in the single and multi-dwelling unit segments. It should
64 European Commission (2015), Commission Decision concerning Case SE/2015/1687: Wholesale local access provided at a fixed
location in Sweden, 6 February 2015, p8.
0 50 100 150 200 250
Geotype 1
Geotype 2
Geotype 3
Geotype 4
National average
FTTx 0.25/0.25
FTTx 10/10
FTTx 100/10
FTTx 100/100
Monthly rental (SEK)
Bitstream Dark fibre

Selection of broadband anchor products 47
P U B L I C
be noted that unlike Chorus TeliaSonera is a vertically integrated operator, offering both wholesale and retail services.
3.5 New Zealand
The Commerce Commission’s determination of the final price for Chorus’ unbundled copper local loop (UCLL) service65 was based on cost modelling of a fibre network. The resultant price should therefore reflect the cost of unbundled fibre. In terms of the unbundled bitstream access (UBA) service the Commission’s determination66 was based on copper DSL services. Hence the differential between the unbundled fibre price and the UBA price is not exactly equivalent to those prices in the jurisdictions examined above. In year 5 of the Commission’s final prices this differential for the Basic UBA (BUBA) service is 34% (Exhibit 3.13).
65 Commerce Commission (2015), Final pricing review determination for Chorus’ unbundled copper local loop service, 15 December
2015.
66 Commerce Commission (2015), Final pricing review determination for Chorus’ unbundled bitstream access service, 15 December 2015.

48 Network Strategies Final report for Vodafone New Zealand
P U B L I C
Exhibit 3.13: New Zealand UCLL and UBA prices, year 5 [Source: Commerce Commission]
We believe that the incremental costs for a fibre bitstream service are unlikely to be less than those for a DSL bitstream service, and indeed are more likely to be greater. We therefore conclude that a lower bound for a cost-based differential for the lowest bandwidth service in New Zealand would be no less than 34%.
In comparison, Chorus’ own modelling in 2014 suggested that the uplift representing incremental costs for bitstream on a copper service (EUBA0 / BUBA) would be around 23-25%67 and that “key parameters and data will generally be the same for a fibre modelling approach”.68 While this is comparable to Denmark, it is smaller than the differentials in Singapore and Sweden. Note that the Commerce Commission used its own modelling for the FPP determination rather than that of Chorus, so our preference is for the lower bound to be based on the former.
67 Chorus (2014), Chorus network modelling, 2 December 2014, page 5.
68 Ibid, page 3.
0 5 10 15 20 25 30 35 40 45 50
UCLL
BUBA
EUBA 40
EUBA 90
EUBA 180
Monthly rental (NZD)
Bitstream Unbundled fibre

Selection of broadband anchor products 49
P U B L I C
3.6 Summary
We have found that in each of the case study jurisdictions there is a significant differential between prices for layer 1 and layer 2 services. This differential increases as the bandwidth of the bitstream increases (Exhibit 3.14).
Country Bitstream service Differential with raw fibre
Denmark 10Mbit/s 23%
100Mbit/s 40%
Netherlands ≤50/50Mbit/s 39%
≤100/100Mbit/s 58%
Singapore Class D Best Effort Fast Ethernet with minimum committed information rate of 25Mbit/s downlink
40%
Class D Best Effort Gigabit Ethernet with minimum committed information rate of 250Mbit/s downlink and 10Mbit/s uplink
707%
Sweden FTTx 10/10 224% (geotype 1)
115% (geotype 2)
30% (geotype 3)
FTTx 100/100 265% (geotype 1)
143% (geotype 2)
47% (geotype 3)
New Zealand (lower bound based on DSL bitstream) 34%
Exhibit 3.14: Summary of differentials between layer 1 and layer 2 services for selected countries
and bitstream services [Source: regulators, operators]
We have determined that the lowest bandwidth bitstream service in New Zealand would have a cost-based differential of at least 34%, and indeed is likely to be considerably greater. In the post 2020 world, it will be crucial for this differential to reflect appropriate investment signals – failure to do so will create market distortions as well as barriers for future innovation.


P U B L I C
4 Accessing affordable broadband services
In this Section we provide an overview of schemes in a sample of overseas jurisdictions that offer targeted assistance for consumer groups unable (for various reasons, including geographical and social circumstances) to access communications services at affordable prices.
4.1 Australia
Income-based assistance
A Government provided Telephone Allowance can be obtained by those receiving certain income support payments, which is paid out at two rates depending on circumstances. Most income support payments are tied to the basic rate of AUD27.80 (NZD29.19) per quarter for voice telephony services. Recipients of the Disability Support Pension who are under 21, without children and who have a home Internet connection, however, are eligible for the higher rate of AUD41.40 (NZD43.47) per quarter.69
69 Australian Government Department of Human Services (2016), Telephone allowance,
https://www.humanservices.gov.au/customer/services/centrelink/telephone-allowance.

52 Network Strategies Final report for Vodafone New Zealand
P U B L I C
4.2 Singapore
Income-based assistance
The Infocomm Development Authority (iDA) has a Digital Inclusion Fund to help low-income households, Voluntary Welfare Organisations and Help Agencies to bridge the digital divide. There are two programmes supported by the fund:
Home Access Social Innovation.
The Home Access programme70 provides subsidised home broadband (fibre) and telephony services bundled with a basic device, such as a tablet. Eligible households must meet an income criteria, plus must have at least one Singapore Citizen and no school-going children. The connectivity package will cost households SGD6 (NZD6.20) per month for 48 months. The programme is expected to provide Internet access for up to 8000 households, and is supported by the National Council of Social Services.
M1 is the retailer delivering the fibre Internet access through the Home Access programme.71 Netlink Trust is also sponsoring access to the Home Access Programme, subsidising the cost of the basic computing device and providing free fibre broadband connectivity for two years for 400 end users.72
70 iDA Singapore (2016), Home Access, https://www.ida.gov.sg/Learning/Community-Development/Digital-Inclusion-Fund/Home-
Access.
71 M1 (2015), M1 appointed IDA’s Home Access programme service provider, 9 April 2015. Available at https://www.m1.com.sg/AboutM1/NewsReleases/2015/M1%20appointed%20IDA%20Home%20Access%20programme%20service%20provider.aspx.
72 NetLinkTrust (2015), NetLink Trust sponsors access for low-income families and tele-health project, 29 September 2015. Available at http://www.netlinktrust.com/press/netlink-trust-sponsors-access-for-low-income-families-and-tele-health-project/.

Selection of broadband anchor products 53
P U B L I C
Students and persons with disabilities from low income households can apply for the NEU PC Plus Programme.73 This programme provides up to a 75% subsidy on a computing device plus free broadband for three years.
4.3 United Kingdom
Geographically-based assistance
The government has committed to ensuring that every home and business in the UK can access and affordable broadband service of at least 2Mbit/s. To this end, subsidised installation is available for satellite broadband services to properties that will not benefit from the superfast broadband roll out.74 Eligible homes and business will pay no more than no more than GBP400 (NZD735) over a 12 month period for broadband access. This scheme is being delivered through 44 local broadband projects that are managed by local public authorities. A public subsidy totalling GBP1.2 billion (NZD2.2 billion) funds the scheme, with the UK government providing GBP530 million (NZD974 million), combined with other public funding sourced from local and European funding sources.75
In addition to the above subsidised broadband installations, the UK government is supporting seven market test pilots to gain understanding of challenges in rolling out superfast broadband to most remote areas.76
73 iDA (2016), NEU PC Plus Programme how to apply, https://www.ida.gov.sg/Learning/Community-Development/NEU-PC-Plus-
Programme/How-to-Apply.
74 Department for Culture, Media & Sport (2016), Get better connected, http://basicbroadbandchecker.culture.gov.uk/index.php.
75 Department for Culture Media & Sport (2015), UK next generation network infrastructure deployment plan, March 2015. Available at https://www.gov.uk/government/uploads/system/uploads/attachment_data/file/418567/UK_Next_Generation_Network_Infrastructure_Deployment_Plan_March_15.pdf.
76 GOV.UK (2015), State Aid consultation: market test pilot intervention areas, https://www.gov.uk/government/publications/state-aid-consultation-market-test-pilot-intervention-areas.
54 Network Strategies Final report for Vodafone New Zealand
P U B L I C
Income-based assistance
As part of BT’s universal service obligations, it has a social tariff plan, BT Basic,77 specifically for those on eligible benefits:
income support income-based jobseeker’s allowance pensions credit employment and support allowance universal credit.
The basic telephone plan can have broadband added to it (up to 16Mbit/s download with a 10GB data cap), which together costs GBP29.85 (NZD54.85) for three months.
4.4 United States
The FCC provides universal support for telecommunications services through the Universal Service Fund,78 which administers four programmes:
Connect America Fund – providing support to operators serving high-cost areas Lifeline – assisting low-income customers Rural Health Care Schools and Libraries – providing telecoms services to eligible schools and libraries.
Telecoms operators pay contributions to the Universal Service Fund based on an assessment of their interstate and international end-user revenues.
77 BT (2016), BT Basic + Broadband, http://btplc.com/inclusion/ProductsAndServices/BTBasic/BTBasicBroadband/index.htm.
78 Federal Communications Commission (2016), Universal Service, https://www.fcc.gov/general/universal-service.

Selection of broadband anchor products 55
P U B L I C
Income-based assistance
The Lifeline programme79 provides a discount on telecoms services for qualifying low-income consumers. The services supported by this program were extended this year, and now includes fixed and mobile broadband.80 The program provides USD9.25 (NZD12.83) per month specifically for broadband access. Minimum service standards for fixed broadband access are set at 10Mbit/s download / 1Mbit/s upload, with a usage allowance of 150GB.
79 Federal Communications Commission (2016), Lifeline program for low-income consumers, https://www.fcc.gov/general/lifeline-
program-low-income-consumers.
80 FCC News (2016), FCC modernizes lifeline program for the digital age, 31 March 2016. Available at https://www.fcc.gov/document/fcc-modernizes-lifeline-program-digital-age.


P U B L I C
5 Summary of recommendations
Our recommendations, with key supporting empirical evidence, are summarised below.
Targeted approach
for affordability
objectives
As inclusion of a low-priced 15/1 anchor product within the proposed pricing framework is likely to have a significant distortionary impact we recommend a more targeted approach to meeting affordability objectives for the affected rural market segment. The target end-users should be closely identified, any subsidy should be transparent and a means of funding identified that is more efficient than the current proposal. This may involve specific funding from Government on either the supply or demand side.
Grant scheme to
assist low income
households
If there are some income-constrained individuals or households unable to subscribe to a fixed broadband service then the most effective means of encouraging uptake for this market segment would be through a targeted grant or voucher scheme. Our market analysis indicates that, given current trends, by 2020 those without broadband subscriptions will be a very small group consisting of individuals who simply do not see the need for fixed broadband.
Define a regulated
layer 1 anchor
product
We recommend a regulated layer 1 anchor product as an effective means of exercising a competitive constraint in preference to inclusion of a 15/1 product at layer 2 which may render unworkable equivalence of inputs obligations. Overseas evidence indicates that regulated layer 1 price points may be used in combination with equivalence of inputs or open access obligations to promote optimal consumer outcomes where monopolistic conditions exist in

58 Network Strategies Final report for Vodafone New Zealand
P U B L I C
wholesale broadband markets. Empirical evidence also indicates that where wholesale prices are regulated there is a significant difference between layer 1 and layer 2 prices, with no apparent barriers to speed-price differentiation for retail services. Furthermore, regulated layer 1 prices are compatible with layer 2 prices differentiated by bandwidth as typically the variation in the latter prices is not based on costs but set by applying a notional glide path to the average cost per unit demand (across all bandwidths).
Select a market-
appropriate
layer 2 entry level
product
The layer 1 anchor should be applied in tandem with a layer 2 anchor product that will be appropriate in 2020 following the current period of market transition. While the Ministry’s proposed 100/20 anchor product may appear reasonable at present as a basic anchor product, with the observed current pace of change it is challenging to specify an optimal product now that will be relevant in four years’ time. We recommend either:
leave this decision to the Commerce Commission closer to the regulatory period, or
consider establish rules for defining an anchor product in terms of an empirically observable measure which identifies the typical entry level speed – together with any other relevant characteristics such as quality of service.
Reconsider
whether a five year
regulatory period
is appropriate
Given the dynamic nature of the telecommunications market most regulatory authorities adopt a shorter regulatory period than five years. We recommend that the Ministry consider a period of no more than three years.