vodafone attachment e - department of communications · pdf filevodafone hutchison australia...
TRANSCRIPT

www.TheCIE.com.au
F I N A L R E P O R T
Australia’s telecommunications market
structure
The price premium paid by consumers
Prepared for
Vodafone Hutchison Australia
June 2015
THE CENTRE FOR INTERNATIONAL ECONOMICS
www.TheCIE.com.au

The Centre for International Economics is a private economic research agency that
provides professional, independent and timely analysis of international and domestic
events and policies.
The CIE’s professional staff arrange, undertake and publish commissioned economic
research and analysis for industry, corporations, governments, international agencies
and individuals.
© Centre for International Economics 2015
This work is copyright. Individuals, agencies and corporations wishing to reproduce
this material should contact the Centre for International Economics at one of the
following addresses.
C A N B E R R A
Centre for International Economics
Ground Floor, 11 Lancaster Place
Canberra Airport ACT 2609
GPO Box 2203
Canberra ACT Australia 2601
Telephone +61 2 6245 7800
Facsimile +61 2 6245 7888
Email [email protected]
Website www.TheCIE.com.au
S Y D N E Y
Centre for International Economics
Suite 1, Level 16, 1 York Street
Sydney NSW 2000
GPO Box 397
Sydney NSW Australia 2001
Telephone +61 2 9250 0800
Facsimile +61 2 9250 0888
Email [email protected]
Website www.TheCIE.com.au
DISCLAIMER
While the CIE endeavours to provide reliable analysis and believes the material
it presents is accurate, it will not be liable for any party acting on such information.
Australia’s telecommunications market structure iii
www.TheCIE.com.au
Contents
Executive summary 1
Consumers are paying substantial price premiums to the incumbent in
Australian telecommunications markets 3
How do we measure the price premium paid by consumers? 3
Dataset on communication service prices and services 3
Size of the price premium for Telstra services 4
The total consumer price premium for Telstra services 4
In international markets, price differences for incumbents are small 8
Fixed line services internationally 8
Mobile phone services internationally 9
Comparison of premiums in Australia and internationally 10
How might we get more competitive telecommunications markets and better
outcomes for consumers? 11
A Technical appendices 13
B Estimated models for international markets 21
BOXES, CHARTS AND TABLES
1 Putting the consumer price premium into perspective 2
2 Impost on consumers from Telstra price premium 5
3 Putting the communications premium into perspective 7
4 Fixed line broadband market shares 8
5 Mobile services market shares 9
6 Price premiums for the dominant provider 10
A.1 Mobile phone plan characteristics 14
A.2 Mobile plans (Australia) – price compared to data allowance 15
A.3 Mobile plans (Australia) – price compared to value of included calls 16
A.4 Examples of mobile phone plans 16
A.5 Estimated prices for mobile phone services - Australia 17
A.6 Broadband and home phone plan characteristics 18
A.7 Fixed line services (Australia) – price compared to peak data allowance 19
A.8 Examples of NBN broadband bundle plans 19
A.9 Estimated prices for fixed line services - Australia 20
B.1 Estimated prices for fixed line services – New Zealand 21

iv Australia’s telecommunications market structure
www.TheCIE.com.au
B.2 Estimated prices for fixed line services – UK 21
B.3 Estimated prices for mobile phone services in New Zealand 22
B.4 Estimated prices for mobile phone services in the UK 22

Australia’s telecommunications market structure 1
www.TheCIE.com.au
Executive summary
Australian telecommunications consumers pay a substantial price premium because of
the unique structural characteristics of the Australian telecommunications market.
■ Australian households pay a substantial price premium for the incumbent, Telstra,
over other operators in both fixed line and mobile services.
■ The premium for using Telstra over other operators is $20 per month for fixed line
services and $9 per month for mobile services.
■ The level of price premium for the incumbent in the Australian market does not
appear in overseas markets considered. This suggests that structural issues are limiting
the ability for competition to drive down market rents.
■ The additional cost to households of telecommunications services from this
premium amounts to $3.1 billion per year.
To put the premium paid by Telstra consumers into perspective:
■ The introduction of the carbon tax led to consumers paying in the order of $1.3 billion
more for electricity per year.
■ The premium paid is equivalent to a 15 cent per litre increase in fuel prices.
■ The premium paid is equivalent to each Australian person receiving an additional
3GB of mobile data each month.
Relative to important Government priorities in the 2015/16 Budget:
■ A total of $3.5 billion is allocated to the Child Care Package over four years,
compared to a premium paid by Telstra consumers of $12.4 billion over the same
period.
■ A total of $5.5 billion is allocated to the Jobs and Small Business Package over four
years, again compared to a premium paid by Telstra customers of $12.4 billion over
the same period.
The premium for Telstra reflects both limited competition and differences in service
quality, both of which have emerged from structural issues within the Australian
telecommunications market. There are many areas where Telstra is the only provider of
services, particularly in regional areas. This means regional consumers are heavily
affected by Australia’s telecommunications market structure.
Up to 3.5 million regional consumers could benefit from better access to competitive
mobile telecommunication services. Additionally, Telstra is the only available provider
for 46 per cent of fixed line services in regional areas. For a customer receiving only
Telstra services, such as some regional customers, the price premium could be between
$450 and $650 per household, depending on how many services they use. Therefore,
improvements to competition will benefit regional consumers in particular.

2 Australia’s telecommunications market structure
www.TheCIE.com.au
1 Putting the consumer price premium into perspective
Data source: CIE.
We have identified five important impediments to reduced prices for consumers in
Australia’s telecommunications market.
1 Historical and continued subsidisation of Telstra, through the Universal Service
Obligation (USO), which entrenches the incumbent’s market dominance.
2 The current regulatory approach to transmission leads to prices being set substantially
above the cost of supply in some areas, which negatively affects competition in
regional areas.
3 There is a disparity in spectrum holdings between operators and lower availability of
spectrum in regional areas. This acts as a barrier to competition.
4 There are insufficient incentives for co-location of mobile facilities, particularly in
regional areas where there are greater retail competition benefits from sharing of some
facilities.
5 Consumers are reluctant to move to better value services, reflecting information
barriers and the costs of changing provider.
Removing these impediments is not only good for Australian consumers; it will also help
drive Australia’s productivity growth. These reforms would deliver lower prices and
improved services at no cost to taxpayers.
Receiving an
additional 3GB of
mobile data per
person per month
More than twice
the electricity
price impact for
households of
the carbon tax
15 cents per
litre increase in
petrol prices
The premium paid by households to Telstra is equivalent to

Australia’s telecommunications market structure 3
www.TheCIE.com.au
Consumers are paying substantial price premiums to the
incumbent in Australian telecommunications markets
Australian telecommunications consumers pay a substantial price premium because of
the unique structural characteristics of the Australian telecommunications market.
■ Australian households pay a substantial price premium for the incumbent, Telstra,
over other operators in both fixed line and mobile services. The premium for using
Telstra over other operators is $20 per month for fixed line services and $9 per
month for mobile services.
■ The level of price premium for the incumbent in the Australian market does not
appear in overseas markets considered. This suggests that structural issues are limiting
the ability for competition to drive down market rents.
■ The additional cost of telecommunications services to Australian households from
this premium amounts to $3.1 billion per year
How do we measure the price premium paid by consumers?
The additional price that consumers pay for purchasing telecommunications services
from Telstra is measured by comparing the prices for otherwise similar services – for
example, the price difference for a fixed line bundle that offers the same inclusions for
free calls and same data levels. The most systematic way to undertake this comparison is
‘hedonic pricing’. Details of this approach are set out in the Technical Appendix.
The hedonic pricing method assumes that the value of a product is based on the value
consumers place on the characteristics of the product. For example in the context of
mobile phones, the value of a phone plan is dependent on characteristics such as the:
■ number of included call minutes;
■ amount of included data usage;
■ type of phone included (if relevant); and
■ mobile network providing the service.
By using information on many different phone plans, the aim is to determine the extra
amount consumers pay for each characteristic. For example, it estimates the price that
consumers are willing to pay for an extra megabyte of included data usage.
Such a model predicts the price of mobile phone plans based on the features included
after adjusting for differences in the average price of plans from each carrier.
Dataset on communication service prices and services
There are three main categories of telecommunications products:

4 Australia’s telecommunications market structure
www.TheCIE.com.au
■ landline phone service;
■ broadband internet service; and
■ mobile phone and data services.
We have collected data on the prices and characteristics of various products available
from retailers in Australia, New Zealand and the United Kingdom.
We have considered broadband internet services and landline phone services together, as
the category of fixed line services, given that these services are often sold as a bundle.
This is a conservative approach. If fixed line services were examined on an unbundled
basis, we expect that the Telstra price premium would be substantially higher.
Size of the price premium for Telstra services
We have constructed hedonic pricing models for fixed line and mobile services
separately, to estimate the Telstra price premium for each category of
telecommunications service (see Technical Appendix A for details).1 The results are
reported below.
Fixed line services
If all other measurable aspects of the service are held constant, consumers pay $23.70
more for a plan with Telstra than a plan with iiNet, TPG, or any other provider except
for Optus. Consumers pay $8 more for a plan with Telstra than a plan with Optus ($23.70
minus $15.80).
Mobile phone services
If all other measurable aspects of the service are held constant, consumers pay:
■ 50 per cent more for data on a Telstra service than with another carrier. This equates
to an increase in the implied price of data from $3.6 per GB of data cap per month for
other carriers to $5.5 per GB for Telstra; and
■ a $13.3 additional monthly premium for obtaining a phone package with Telstra
relative to other carriers
Using a standard amount of data usage and share of customers on a phone package, the
overall premium paid for Telstra’s mobile services averages $9 per month.
The total consumer price premium for Telstra services
For both fixed line and mobile markets there are substantial price premiums paid by
Australian consumers for Telstra services.
1 We use linear models, which implies that there is an additive effect of extra features on price.
(Diewert, W.E., (2003), ‘Hedonic Regressions. A Consumer Theory Approach’, Scanner Data
and Price Indexesp.326, http://www.nber.org/chapters/c9740.pdf).

Australia’s telecommunications market structure 5
www.TheCIE.com.au
■ Using the weighted average price excluding Telstra, the premium for a Telstra fixed
line plan is $20 per month.
■ Using the weighted average price excluding Telstra, the premium for a Telstra mobile
plan is $9 per month.
If we apply these premiums across Telstra’s customer base, households are paying in the
order of $3.1 billion more due to the Telstra pricing premium per year (table 2). This is
equivalent to a cost of $380 per annum per Australian household.2
There is a level of uncertainty about this range, with a minimum level of $210 per
household per year and a maximum of $560 per household per year.3
For a customer receiving only Telstra services, such as many regional customers, the
price premium could be between $450 and $650 per household, depending on their use of
fixed line services and number of mobile plans purchased. Therefore, improvements to
competition will benefit regional consumers in particular.
To put the premium paid by Telstra consumers into perspective:
■ The introduction of the carbon tax led to consumers paying in the order of $1.3 billion
more for electricity per year.
■ The premium paid is equivalent to a 15 cent per litre increase in fuel prices.
■ The premium paid is equivalent to each Australian household paying for an
additional 3GB of mobile data each month.
Relative to important Government priorities in the 2015/16 Budget:
■ A total of $3.5 billion is allocated to the Child Care Package over four years,
compared to a premium paid by Telstra consumers of $12.4 billion over the same
period.
■ A total of $5.5 billion is allocated to the Jobs and Small Business Package over four
years, again compared to a premium paid by Telstra customers of $12.4 billion over
the same period.
2 Impost on consumers from Telstra price premium
Service Customers Premium Total additional revenue
Millions $/month $billions/year
Estimated premium
Fixed line services 6.2 20.0 1.5
Mobile 16.0 8.6 1.6
2 Household numbers are based on private occupied dwellings to be consistent with provision of
fixed line telecommunications services. There were 7.76 million occupied private dwellings in
2011 according to the Australian Census, which, when increased using the percentage change
in population over that period (6.66 per cent), equates to 8.28 million occupied private
dwellings in 2014. Sources: ABS Australian Demographic Statistics, Mar 2014, Cat 3101.0.,
Australian Census 2011.
3 This range reflects the application of statistical confidence intervals to the estimated price
premium.

6 Australia’s telecommunications market structure
www.TheCIE.com.au
Service Customers Premium Total additional revenue
Total 3.1
Lower bound estimate
Fixed line bundles 6.2 14.4 1.1
Mobile 16.0 3.6 0.7
Total 1.8
Service Customers Premium Total additional revenue
Millions $/month $billions/year
Upper bound estimate
Fixed line bundles 6.2 27.8 2.1
Mobile 16.0 13.6 2.6
Total 4.7
Note: The number of fixed line customers (6.2 million) from the Telstra 2014 Annual Report is the fixed voice domestic retail
customers, which assumes all fixed data customers for Telstra also receive voice services. Mobile customer numbers are for domestic
retail services from Telstra’s 2014 Annual Report.
Source: Telstra Annual Report 2014, CIE.

Australia’s telecommunications market structure 7
www.TheCIE.com.au
3 Putting the communications premium into perspective
Data source: CIE.
Receiving an
additional 3GB of
mobile data per
person per month
More than twice
the electricity
price impact for
households of
the carbon tax
15 cents per
litre increase in
petrol prices
The premium paid by households to Telstra is equivalent to

8 Australia’s telecommunications market structure
www.TheCIE.com.au
In international markets, price differences for incumbents
are small
The presence of a large price premium for the incumbent is unusual compared to
international markets.
■ In the UK mobile market, which is less concentrated than the Australian market,
there are no significant premiums between the different operators.
■ In the New Zealand mobile market, the smallest of the three major operators has a
lower price level than the other providers, however the weighted average premium to
the largest operator is only one-fifth that of Telstra in the Australian market.
■ In the UK fixed line market, which is less concentrated than the Australian market,
Virgin and TalkTalk have significantly lower prices than BT and Sky. The price
premium for BT is about half that of Telstra in the fixed line market.
■ In the New Zealand fixed line market, the incumbent Spark has a price premium that
is less than one third of Telstra’s.
We have constructed hedonic pricing models for fixed line and mobile services in the
New Zealand and UK markets (see Technical Appendix A for details).4 The results are
reported below.
Fixed line services internationally
Fixed line broadband services are similarly distributed among providers in Australia and
New Zealand. Telstra and Spark (formerly known as Telecom) have 40-50 per cent
market share. In New Zealand, Vodafone also has a substantial amount of market share
(32 per cent), with other providers making up smaller shares of the market than in
Australia.
In the UK the fixed line market is fairly competitive. BT is the largest single provider,
however, unlike Telstra and Spark, it does not have a significant market share in the
mobile services industry.
4 Fixed line broadband market shares
Australia New Zealand UK
Provider Market share Provider Market share Provider Market share
Per cent Per cent Per cent
Telstra 41 Spark 49 BT 31
4 We use linear models, which implies that there is an additive effect of extra features on price.
(Diewert, W.E., (2003), ‘Hedonic Regressions. A Consumer Theory Approach’, Scanner Data
and Price Indexesp.326, http://www.nber.org/chapters/c9740.pdf).

Australia’s telecommunications market structure 9
www.TheCIE.com.au
Australia New Zealand UK
Provider Market share Provider Market share Provider Market share
Optus 14 Vodafone 32 Virgin Media 20
iiNet 15 Callplus 8 Sky 20
TPG 12 Orcon 5 TalkTalk 15
Other 18 Other 6 Other 13
Source: ACCC Telecommunications Competitive Safeguards for 2013-14 p26, Commerce Commission New Zealand 2013 Annual
Telecommunications Monitoring Report p19.
For fixed line services in New Zealand, the differences between the prices of the
operators is less than in the Australian market. Three of the four largest providers
(representing almost 90 per cent of the market share) have prices within $4 per month of
each other.
For fixed line services in the UK, Virgin and TalkTalk have prices that are $10 to $8
lower than the market leader BT.
See Appendix B for technical details.
Mobile phone services internationally
Table 5 shows the market shares for mobile services in Australia and compares it with the
marketshares for New Zealand and the UK. The UK mobile market is less concentrated
than the Australian market. New Zealand has a similar distribution of market share to
Australia, although there are only three retailers of mobile services with a significant
number of customers.5
For mobile phone services in the UK, there is no premium for any carrier over the
other.
For mobile phone services in New Zealand, mobile plans from 2Degrees are estimated to
be $7.60 lower than plans from other providers.
See Appendix B for technical details.
5 Mobile services market shares
Australia New Zealand UK
Provider Market share Provider Market share Provider Market share
Per cent Per cent Per cent
Telstra 45 Vodafone 42 EE a 32
Optus 27 Spark 33 o2 24
Vodafone 18 2Degrees 25 Vodafone 17
Other 10 Virgin 8
Other 18
5 Commerce Commission New Zealand 2013 Annual Telecommunications Monitoring Report
p23.

10 Australia’s telecommunications market structure
www.TheCIE.com.au
a EE includes Orange and T-Mobile.
Note: Mobile services excludes mobile data that is not associated with a mobile phone handset.
Source: ACCC Telecommunications Competitive Safeguards for 2013-14 p30, Statista table ‘Market share held by mobile phone
operators in the United Kingdom (UK) as of February 2013’: http://www.statista.com/statistics/279993/market-share-of-mobile-
phone-operators-in-the-united-kingdom-uk/ Commerce Commission New Zealand 2013 Annual Telecommunications Monitoring
Report p30.
Comparison of premiums in Australia and internationally
The price premiums obtained in the Australian market for the incumbent, Telstra, are not
replicated in other markets (chart 6).
Using the same approach as for Australia of estimating the weighted average premium
for the highest market share business to the rest of the market, premiums in New Zealand
are $3 per month in the mobile market and $5 per month for the fixed line market. In the
UK, the premium in the mobile market is zero and the premium in the fixed line market
for BT is $9 per month.
6 Price premiums for the dominant provider
Data source: CIE.
9
0
3
20
9
5
0
5
10
15
20
25
30
Australia UK New Zealand
$/m
on
th
Mobile Fixed line

Australia’s telecommunications market structure 11
www.TheCIE.com.au
How might we get more competitive telecommunications
markets and better outcomes for consumers?
A more competitive telecommunications market is an outcome of:
■ removing impediments to competition where possible — for example, ensuring
regulated transmission prices are set at cost, subsidies do not advantage one operator,
spectrum is available in regional areas for mobile carriers and fixed line access
regulations are consistently applied;
■ where competition is unlikely to emerge, considering arrangements for access to drive
competition as deeply into a market as is feasible — for example, co-location of
mobile facilities such as base stations provides consumers with coverage and choice
for mobile services, particularly in regional areas; and
■ creating conditions that reward competition — such as providing information that
allows consumers to understand the quality and price differences of products available
to them.
We have identified five main impediments to the functioning of telecommunications
markets that have led to the market price premiums observed.
1 Telstra has historically received, and continues to receive, subsidies such as the
Universal Service Obligation and NBN Co. agreement
– Telstra has not used these subsidies to provide lower prices for Australian
consumers
– Instead, these subsidies have allowed Telstra to entrench its market dominance
2 Regulated transmission prices
– The regulatory approach could lead to transmission prices exceeding the cost of
supply
– Telstra faces lower costs to providing downstream services than firms that are not
vertically integrated, creating barriers to competition
3 Disparity in spectrum holdings in regional areas
– The disparity in spectrum holdings between operators and the lower availability of
spectrum in regional areas act as a barrier to competition
– The release of more spectrum in regional areas will improve network quality for
mobile communications if the licence holder utilises that spectrum
– The high cost of spectrum creates a barrier to entry to the mobile market
4 Ownership and access to facilities (such as mobile base stations)
– Co-location avoids unnecessary duplication of infrastructure and promotes
competition
– The current facilities access regime does not set prices, and therefore facilities
access is effectively not mandatory

12 Australia’s telecommunications market structure
www.TheCIE.com.au
– Co-location of mobile facilities is not common in regional areas, where Telstra
owns the vast majority of mobile base stations
5 Consumer decisions over telecommunications services show that consumers are slow
to change
– Shifts in market share away from Telstra as markets become more competitive
shows that consumers take time to change to better value providers
– Slow consumer response to better deals is evident in fixed line markets in
particular
– Changes to competition and reductions in Telstra’s price premium over other
networks will take time to be reflected in market share as consumers will only
change providers gradually
– Impediments to better consumer decisions include a lack of systematic information
about coverage and quality of mobile and fixed line services
A more competitive telecommunications market would directly lead to lower prices for
consumers. It would also lead to productivity gains. Initially these would arise if
obligations such as the USO could be restructured to be achieved at lower cost. Over
time, a greater level of competition would encourage constant productivity improvements
in the sector. A more productive and lower cost telecommunications sector would flow
through to productivity gains for the Australian economy.
Australia’s telecommunications market structure 13
www.TheCIE.com.au
A Technical appendices
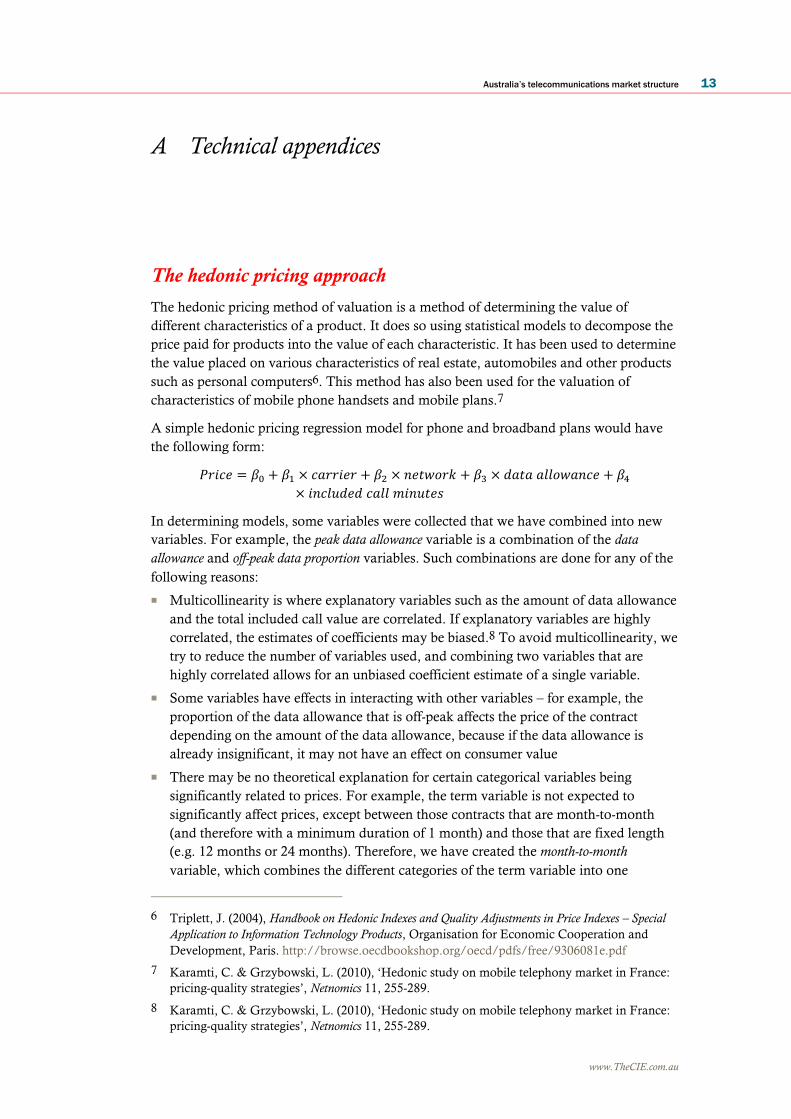
The hedonic pricing approach
The hedonic pricing method of valuation is a method of determining the value of
different characteristics of a product. It does so using statistical models to decompose the
price paid for products into the value of each characteristic. It has been used to determine
the value placed on various characteristics of real estate, automobiles and other products
such as personal computers6. This method has also been used for the valuation of
characteristics of mobile phone handsets and mobile plans.7
A simple hedonic pricing regression model for phone and broadband plans would have
the following form:
𝑃𝑟𝑖𝑐𝑒 = 𝛽0 + 𝛽1 × 𝑐𝑎𝑟𝑟𝑖𝑒𝑟 + 𝛽2 × 𝑛𝑒𝑡𝑤𝑜𝑟𝑘 + 𝛽3 × 𝑑𝑎𝑡𝑎 𝑎𝑙𝑙𝑜𝑤𝑎𝑛𝑐𝑒 + 𝛽4
× 𝑖𝑛𝑐𝑙𝑢𝑑𝑒𝑑 𝑐𝑎𝑙𝑙 𝑚𝑖𝑛𝑢𝑡𝑒𝑠
In determining models, some variables were collected that we have combined into new
variables. For example, the peak data allowance variable is a combination of the data
allowance and off-peak data proportion variables. Such combinations are done for any of the
following reasons:
■ Multicollinearity is where explanatory variables such as the amount of data allowance
and the total included call value are correlated. If explanatory variables are highly
correlated, the estimates of coefficients may be biased.8 To avoid multicollinearity, we
try to reduce the number of variables used, and combining two variables that are
highly correlated allows for an unbiased coefficient estimate of a single variable.
■ Some variables have effects in interacting with other variables – for example, the
proportion of the data allowance that is off-peak affects the price of the contract
depending on the amount of the data allowance, because if the data allowance is
already insignificant, it may not have an effect on consumer value
■ There may be no theoretical explanation for certain categorical variables being
significantly related to prices. For example, the term variable is not expected to
significantly affect prices, except between those contracts that are month-to-month
(and therefore with a minimum duration of 1 month) and those that are fixed length
(e.g. 12 months or 24 months). Therefore, we have created the month-to-month
variable, which combines the different categories of the term variable into one
6 Triplett, J. (2004), Handbook on Hedonic Indexes and Quality Adjustments in Price Indexes – Special
Application to Information Technology Products, Organisation for Economic Cooperation and
Development, Paris. http://browse.oecdbookshop.org/oecd/pdfs/free/9306081e.pdf
7 Karamti, C. & Grzybowski, L. (2010), ‘Hedonic study on mobile telephony market in France:
pricing-quality strategies’, Netnomics 11, 255-289.
8 Karamti, C. & Grzybowski, L. (2010), ‘Hedonic study on mobile telephony market in France:
pricing-quality strategies’, Netnomics 11, 255-289.

14 Australia’s telecommunications market structure
www.TheCIE.com.au
indicator variable. Month-to-month takes a value of 0 if the contract is for a fixed term
and a value of 1 if the contract is month-to-month (i.e. not minimum fixed term).
We have excluded from this model characteristics that we found did not provide
sufficient explanatory power to justify their inclusion. That is, we excluded characteristics
of plans that do not contribute to predicting the price of a plan.
Australian mobile phone services model and results
Table A.1 shows the characteristics of mobile plans for which we collected data.
A.1 Mobile phone plan characteristics
Variable Units Description
Raw price AUD/NZD/
GBP
Monthly price of the contract
AUD Price AUD Monthly price of the contract converted into AUD using the
exchange rate at the time of data collection
Included call value/minutes Number of
calls
Advertised number of minutes of calls or value of calls that is
free/included under the contract. We convert included value ($)
into included calls by assuming that the standard call lasts for 2
minutes and using the advertised price per minute and flagfall
charges from the carrier. We convert included minutes into
included calls by assuming a standard call lasts for two minutes.
If the number of calls is unlimited, we set the included number of
calls to 1000, which is the maximum of the sample.9
Included data allowance GB The amount of data the customer can use on the network before
additional charges are incurred. If the data allowance is unlimited,
we have set the allowance to 9GB.
Extra data price $/MB The cost per additional megabyte of usage beyond the included
data allowance
Number of included SMS Number The number of SMSs included in the plan for plans without
unlimited SMS. If the plan includes unlimited SMS then this
variable is equal to 0.
SMS unlimited? Yes/no Indicates whether SMSs are unlimited
MMS unlimited? Yes/no Indicates whether MMSs are unlimited
Price of SMS $ Indicates the price of SMS if messages are not unlimited
Price of MMS $ Indicates the price of MMS if messages are not unlimited.
Term of contract Months Number of months that the customer must pay the monthly fee
Flagfall $/call The price of flagfall (fixed price to begin a call).
Rate per minute $/minute The price per minute charged for calls
Network The wholesale network which the plan provides a service on, e.g.
Telstra, Optus or Vodafone
9 Our results are not very sensitive to the choice of this amount. The estimated premium (per
month) for Telstra is lower (higher) by approximately $1 ($0.3) if we make 800 (1200) calls
equivalent to unlimited calls instead of 1000 calls.

Australia’s telecommunications market structure 15
www.TheCIE.com.au
Variable Units Description
Carrier The retailer of the service, e.g. Telstra, Virgin, Optus
a Certain contracts have month-to-month payments where the carrier states there is no minimum length, however this is implicitly a
minimum length of one month as this is the shortest billing cycle available.
Source: CIE.
Chart A.2 shows the distribution of Australia mobile plans by the amount of the data
allowance. It illustrates the strong correlation between the amount of data allowance
under a mobile service contract and the monthly price of the service. It is also evident
that the price of Telstra mobile services is higher for a given amount of data allowance
than most of the other contracts. This is especially true at higher levels of data allowance
(2.5 to 4GB) as shown by the outlying teal series in chart A.2.
Modelling these prices using a hedonic regression method shows whether this higher
price level is due to other characteristics of the plan (such as more included call value) or
not.
A.2 Mobile plans (Australia) – price compared to data allowance
Data source: CIE.
We can also observe that there is a strong correlation between the value of included calls
and the price of the mobile plan.10 This relationship is shown in chart A.3.
10 The value of included calls is either explicitly stated by the carrier on their website or has been
calculated based on the amount of included minutes and the cost per minute/call.
0
20
40
60
80
100
120
140
160
0 2 4 6 8 10 12 14
Pri
ce
($
/m
on
th)
Data allowance (GB)
Telstra Optus Vodafone Virgin
iiNet TPG Amaysim

16 Australia’s telecommunications market structure
www.TheCIE.com.au
A.3 Mobile plans (Australia) – price compared to value of included calls
Note: This chart excludes plans with an unlimited call allowance. Some plans include a handset. All Optus plans have an unlimited call
allowance.
Data source: CIE.
Table A.4 provides examples of the features in mobile phone plans offered by a selection
of the major carriers. Our database also includes plans from Virgin, TPG, iiNet and
Amaysim.
A.4 Examples of mobile phone plans
Carrier Plan name Phone Price Contract term Included
value/calls
Data
allowance
$/month Months $ or calls GB
Telstra M IPhone 6 96 24 $1000 2.5
Optus 60 Plan IPhone 6 82 24 Unlimited 3.0
VHA 60 Plan IPhone 6 80 24 Unlimited 3.0
Telstra L Samsung
Galaxy S6
95 24 Unlimited 6.0
Optus 80 Plan Samsung
Galaxy S6
80 24 Unlimited 6.0
VHA 80 Red Samsung
Galaxy S6
83 24 Unlimited 9.0
Note: We have named some plans descriptively where there is no specific name for the plan on the carrier’s website.
Source: Carriers’ websites, CIE database.
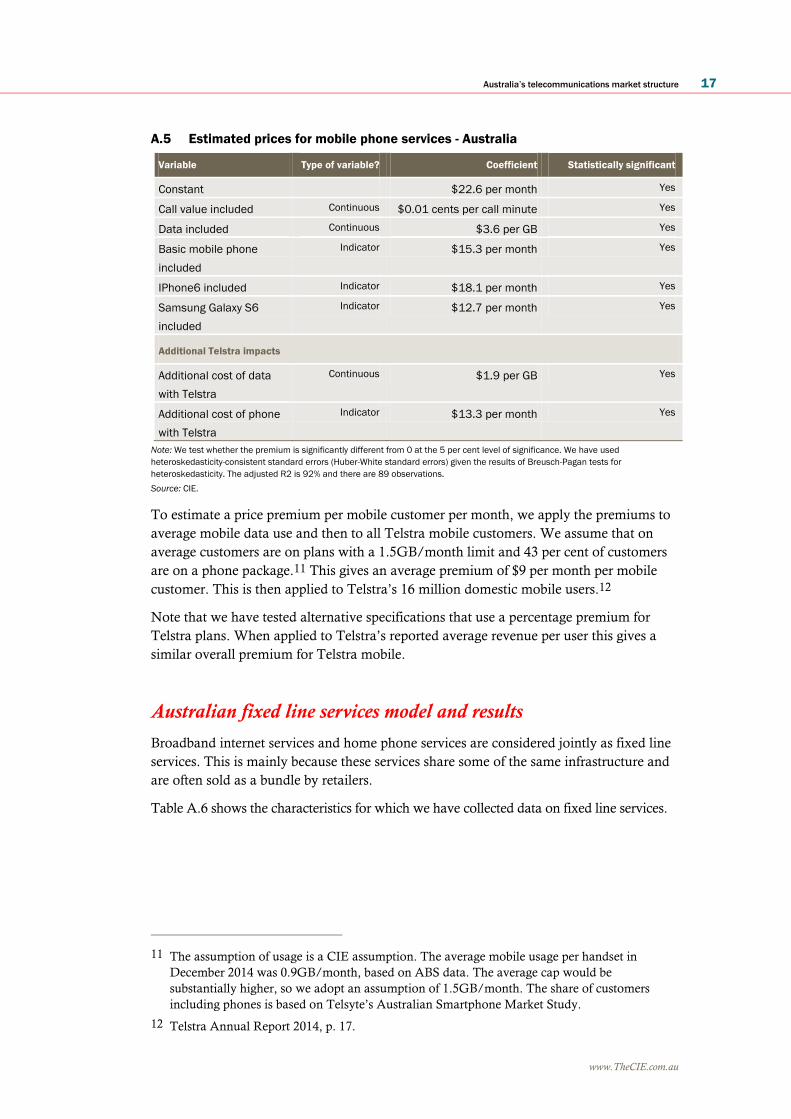
Table A.5 shows the estimated model for mobile services. This model includes an
additional cost for data on Telstra services and an additional cost for obtaining a Telstra
package that includes a phone. Telstra has recently reduced its bring your own packages
so that these are closer to the prices of other telecommunications service providers,
although these are more limited in terms of their offering than Telstra packages that
include a phone.
■ Each additional GB of data costs $3.6 across the market, except for Telstra which
costs more than 50 per cent more at $5.5 per GB ($3.6+$1.9)
■ Including a phone in a mobile package adds $15.3 per month across the market,
except for Telstra where this addition adds $28.8 per month ($15.3+$13.3)
0
10
20
30
40
50
60
70
80
0 200 400 600 800 1000
Pri
ce
($
/m
on
th)
Amount of included calls
Telstra Vodafone Virgin
iiNet TPG Amaysim
Australia’s telecommunications market structure 17
www.TheCIE.com.au
A.5 Estimated prices for mobile phone services - Australia
Variable Type of variable? Coefficient Statistically significant
Constant $22.6 per month Yes
Call value included Continuous $0.01 cents per call minute Yes
Data included Continuous $3.6 per GB Yes
Basic mobile phone
included
Indicator $15.3 per month Yes
IPhone6 included Indicator $18.1 per month Yes
Samsung Galaxy S6
included
Indicator $12.7 per month Yes
Additional Telstra impacts
Additional cost of data
with Telstra
Continuous $1.9 per GB Yes
Additional cost of phone
with Telstra
Indicator $13.3 per month Yes
Note: We test whether the premium is significantly different from 0 at the 5 per cent level of significance. We have used
heteroskedasticity-consistent standard errors (Huber-White standard errors) given the results of Breusch-Pagan tests for
heteroskedasticity. The adjusted R2 is 92% and there are 89 observations.
Source: CIE.
To estimate a price premium per mobile customer per month, we apply the premiums to
average mobile data use and then to all Telstra mobile customers. We assume that on
average customers are on plans with a 1.5GB/month limit and 43 per cent of customers
are on a phone package.11 This gives an average premium of $9 per month per mobile
customer. This is then applied to Telstra’s 16 million domestic mobile users.12
Note that we have tested alternative specifications that use a percentage premium for
Telstra plans. When applied to Telstra’s reported average revenue per user this gives a
similar overall premium for Telstra mobile.
Australian fixed line services model and results
Broadband internet services and home phone services are considered jointly as fixed line
services. This is mainly because these services share some of the same infrastructure and
are often sold as a bundle by retailers.
Table A.6 shows the characteristics for which we have collected data on fixed line services.
11 The assumption of usage is a CIE assumption. The average mobile usage per handset in
December 2014 was 0.9GB/month, based on ABS data. The average cap would be
substantially higher, so we adopt an assumption of 1.5GB/month. The share of customers
including phones is based on Telsyte’s Australian Smartphone Market Study.
12 Telstra Annual Report 2014, p. 17.

18 Australia’s telecommunications market structure
www.TheCIE.com.au
A.6 Broadband and home phone plan characteristics
Variable Units Description
Raw price AUD/NZD/
GBP
Monthly price of the contract
AUD price AUD Monthly price of the contract converted into AUD using
the exchange rate at the time of data collection
Total price AUD Includes any initial fees (such as for setup) which are
divided by 12 (as an approximation of the average length
of a contract) to give a monthly total
Term of contract Months Number of months that the customer must pay the
monthly fee
Included data GB The amount of data that can be used before speed is
reduced (‘shaping’) or extra charges are applied. If the
plan includes unlimited data, then the data allowance
has been set to 3000GB, the highest value in the
Australian sample.13
Proportion of data allowance that is off-
peak
Per cent The proportion of the data allowance that must be used
during a designated ‘off-peak’ period (such as 3:30-
8:30am for TPG)
Technology ADLS2+, NBN, ‘Ultra fibre’, phone only
NBN speed tier The NBN has 4 speed tiers, however we have limited our
analysis to the two lower speed levels14, which are
1 25mbps upload / 5mbps download, and
2 12mbps upload / 1mbps download.
Local calls included? Yes/no Indicates whether local calls are unlimited
National calls included? Yes/no Indicates whether national calls are unlimited
Mobile calls included? Yes/no Indicates whether mobile calls are unlimited
International calls included? Yes/no Indicates whether international calls are unlimited
1300 number calls included? Yes/no Indicates whether calls to 1300 numbers are unlimited
Calls within network/selected phones
included? a
Yes/no Indicates whether additional calls to phones within the
network or phones selected by the customer are
unlimited/subsidised
Weekend calls included? Yes/no Indicates whether calls during the weekend are included
Evening calls included? Yes/no Indicates whether calls during the evening are included
Provider The provider of the plan, e.g. Telstra, Optus
a This covers allowances for calls to nominated phones or allowances for additional calls to other phones under contract with the
same provider. E.g. Telstra offers the “family calls benefit”, which allows for unlimited calls from the home phone to up to four
nominated mobile phones under the same account as the home phone. Similarly, other providers may include calls to mobiles
supplied by the same provider, etc.
Source: CIE.
13 Our results are not very sensitive to the choice of this amount. The estimated premium (per
month) for Telstra is lower (higher) by approximately $0.3 ($0.05) if we make 2400 (3600) GB
of data equivalent to unlimited data instead of 3000GB.
14 We do not consider additional speed tiers of the NBN because this would add to the amount of
variables included in the model, which introduces a greater likelihood of multicollinearity.
Identifying the valuation of different speed tiers is not a goal of the estimation of this model.

Australia’s telecommunications market structure 19
www.TheCIE.com.au
Chart A.7 compares the price of fixed line services for each network to the amount of
data allowance during peak times (as defined by each provider). The peak data allowance
variable is used in our hedonic price model rather than the sum of peak and off-peak data
allowances. Often, providers do not have separate allowances for peak and off-peak
periods, and when this is the case, the allowance for peak is generally equal to the
allowance for off-peak.
We have created one variable to indicate the peak data allowance because two variables
indicating peak and off-peak data respectively would be highly correlated, leading to
biased coefficient estimates.
A.7 Fixed line services (Australia) – price compared to peak data allowance
Note: This chart excludes plans with an unlimited data allowance.
Data source: CIE.
Table A.8 provides examples of the features in broadband bundle plans offered by a
selection of the major carriers. The plans shown are all available on NBN technology,
although they are often also the same plans for ADSL2+. We also use data from
ADSL2+ plans. Our database also includes plans from iPrimus and Dodo.
A.8 Examples of NBN broadband bundle plans
Carrier Plan name Price Contract term Number of call
types included
Peak data
allowance
$/month Months Number of types GB
Telstra L 200 broadband 130 24 4 200
Optus Bundle 90 90 24 3 200
TPG Extra bundle 70 24 2 Unlimited
iiNet NBN 500 25 bundle 105 24 3 500
Internode NBN silver 75 24 0 300
Note: We have named some plans descriptively where there is no specific name for the plan on the carrier’s website.
Source: Carriers’ websites, CIE database.
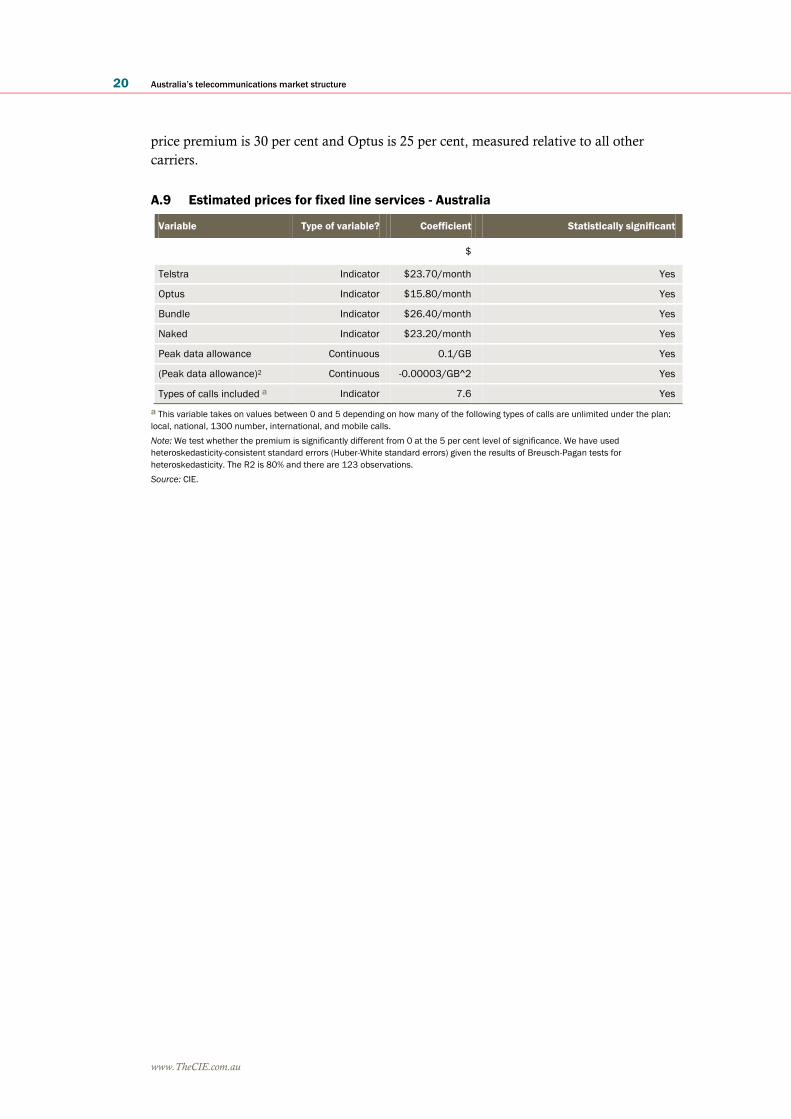
Table A.9 shows the estimated model for fixed line services. This uses the price level (per
month) as the dependent variable. The levels model fit the data better than using the
natural log model, as used for mobiles. If we use a natural log model then the Telstra
0
20
40
60
80
100
120
140
160
0 200 400 600 800 1000 1200 1400 1600
Pri
ce
($
/m
on
th)
Peak data allowance (GB/month)
Telstra Optus iPrimus iinet
TPG Dodo Internode
20 Australia’s telecommunications market structure
www.TheCIE.com.au
price premium is 30 per cent and Optus is 25 per cent, measured relative to all other
carriers.
A.9 Estimated prices for fixed line services - Australia
Variable Type of variable? Coefficient Statistically significant
$
Telstra Indicator $23.70/month Yes
Optus Indicator $15.80/month Yes
Bundle Indicator $26.40/month Yes
Naked Indicator $23.20/month Yes
Peak data allowance Continuous 0.1/GB Yes
(Peak data allowance)2 Continuous -0.00003/GB^2 Yes
Types of calls included a Indicator 7.6 Yes
a This variable takes on values between 0 and 5 depending on how many of the following types of calls are unlimited under the plan:
local, national, 1300 number, international, and mobile calls.
Note: We test whether the premium is significantly different from 0 at the 5 per cent level of significance. We have used
heteroskedasticity-consistent standard errors (Huber-White standard errors) given the results of Breusch-Pagan tests for
heteroskedasticity. The R2 is 80% and there are 123 observations.
Source: CIE.

Australia’s telecommunications market structure 21
www.TheCIE.com.au
B Estimated models for international markets
B.1 Estimated prices for fixed line services – New Zealand
Variable Type of variable? Coefficient Coefficient significantly different from 0?
$
Spark Indicator 13.0 Yes
Vodafone Indicator 10.0 Yes
Orcon Indicator 11.0 Yes
Fibre Indicator 4.0 Yes
Phone line only Indicator -7.6 No a
Peak data allowance Continuous 1.7/1 Yes
(Peak data allowance)2 Continuous -0.00005/GB Yes
Types of calls included Continuous 9.0 Yes
a While this coefficient is not significantly different from 0, it should clearly by related to price and thus it is likely that the premiums for
each carrier would be estimated less accurately if it were removed from the model.
Note: We test whether the premium is significantly different from 0 at the 5 per cent level of significance. We not used
heteroskedasticity-consistent standard errors (Huber-White standard errors) given the results of Breusch-Pagan tests for
heteroskedasticity. All coefficient estimates are in AUD.
Source: CIE.
B.2 Estimated prices for fixed line services – UK
Variable Type of variable? Coefficient Coefficient significantly different from 0?
$
Virgin Indicator -10.8 Yes
TalkTalk Indicator -17.5 Yes
Speed Continuous 0.3/Mbit Yes
Included calls Continuous 6.4 Yes
Phone only? Indicator -14.4 Yes
Note: We test whether the premium is significantly different from 0 at the 5 per cent level of significance. We not used
heteroskedasticity-consistent standard errors (Huber-White standard errors) given the results of Breusch-Pagan tests for
heteroskedasticity. All coefficient estimates are in AUD. The number of types of included calls is different in the UK, with included call
types being weekend calls, evening calls and mobile calls.
Source: CIE.

22 Australia’s telecommunications market structure
www.TheCIE.com.au
B.3 Estimated prices for mobile phone services in New Zealand
Variable Type of variable? Coefficient Coefficient significantly different from 0?
$AUD
Month-to-month Indicator -$6.4 No a
Included call value Continuous 0.01/call a Yes
(Included call value)2 Continuous -0.0001 Yes
Included data Continuous 8.3/GB Yes
2Degrees Indicator -7.6 Yes
a This coefficient is not significantly different from 0 at the 5 per cent level of significance, but is at the 10 per cent level.
Note: We test whether the premium is significantly different from 0 at the 5 per cent level of significance. We have used
heteroskedasticity-consistent standard errors (Huber-White standard errors) given the results of Breusch-Pagan tests for
heteroskedasticity.
Source: CIE.
B.4 Estimated prices for mobile phone services in the UK
Variable Type of variable? Coefficient Coefficient significantly different from 0?
$AUD
Total included call value Continuous 0.01/call a Yes
Included data Continuous 2.4/GB Yes
Note: We test whether the premium is significantly different from 0 at the 5 per cent level of significance. We have used
heteroskedasticity-consistent standard errors (Huber-White standard errors) given the results of Breusch-Pagan tests for
heteroskedasticity.
Source: CIE.


24 Australia’s telecommunications market structure
www.TheCIE.com.au
THE CENTRE FOR INTERNATIONAL ECONOMICS
www.TheCIE.com.au