vocational and technical training in québec - gouv · secteur de la formation professionnelle et...
TRANSCRIPT
Vocationaland TechnicalTraining in Québec
2007Version
Overview

© Gouvernement du QuébecMinistère de l’Éducation, du Loisir et du Sport, 2007-07-00358ISBN: 978-2-550-50275-3ISBN PDF: 978-2-550-50276-0
Legal deposit – Bibliothèque et Archives nationales du Québec, 2007

Foreword
Ensuring that there are enough skilled workers to meet labour needs is amajor challenge facing every modern society. Constant labour marketfluctuations mean that workers need to be not only highly skilled but alsoadaptable and innovative. Vocational and technical training (VTT) has adecisive role to play in this regard since it enables students to acquire theoccupational competencies demanded by the labour market, as well asthe personal skills and attitudes that will allow them to adapt to changeand to acquire new competencies.
In the late 1980s and early 1990s, Québec embarked on a comprehensivereform of its VTT system to bring it in l ine with a competency-basedapproach. The new program-development process, centred on ensuringa consistent match between the competencies taught in school and thoserequired in the workplace, is largely based on a sequence of measuresand steps designed to increase the number of qualified graduates in allthe regions of Québec.
The Québec government has invested heavily in providing educationalinstitutions with some of the most effective training mechanisms possible.Although Québec has attained its objective of offering universal accessto diversified and effective VTT programs, many challenges remain, includ-ing that of renewing its labour force, given the prevailing demographiccontext.
This publication is a third update to the 2003 edition. It describes thecurrent situation of Québec’s VTT system. It also outlines the system’scharacteristics and shows how its various components have evolved overthe past few years. This analysis is supplemented with detailed tablesand charts, which we hope will prove informative for our different partnersand for the general public.
Smaïl BouikniDirector general of programs and development
Secteur de la formation professionnelle et technique etde la formation continue
Jean TremblayDirector of research, statistics and indicators
Secteur de l’information et des communications
Vocational and Technical Training in Québec: Overview

Contents
1. Québec’s Vocational and TechnicalTraining System . . . . . . . . . . . . . . . . . . . . . . . . . . . . . 1
Legal and regulatory framework . . . . . . . . . . . . . . . . . . . . . . . . . . . . . . 1
Responsibilities . . . . . . . . . . . . . . . . . . . . . . . . . . . . . . . . . . . . . . . . . . . 3
Major reform . . . . . . . . . . . . . . . . . . . . . . . . . . . . . . . . . . . . . . . . . . . . . 3
Program management . . . . . . . . . . . . . . . . . . . . . . . . . . . . . . . . . . . . . 4
Partnerships . . . . . . . . . . . . . . . . . . . . . . . . . . . . . . . . . . . . . . . . . . . . . 5
2. Program Offerings . . . . . . . . . . . . . . . . . . . . . . . . . . 6
Diversity of training programs . . . . . . . . . . . . . . . . . . . . . . . . . . . . . . . . 6
Provincewide training services . . . . . . . . . . . . . . . . . . . . . . . . . . . . . . . 7
Investments and training costs . . . . . . . . . . . . . . . . . . . . . . . . . . . . . . . 8
Diversified training options . . . . . . . . . . . . . . . . . . . . . . . . . . . . . . . . . . 9
Recognition of prior learning and competencies . . . . . . . . . . . . . . . . 10
Significant financial aid . . . . . . . . . . . . . . . . . . . . . . . . . . . . . . . . . . . . 10
3. School Attendance . . . . . . . . . . . . . . . . . . . . . . . . . 12
Enrollments and graduation . . . . . . . . . . . . . . . . . . . . . . . . . . . . . . . . 12
Enrollments, by age and gender . . . . . . . . . . . . . . . . . . . . . . . . . . . . . 15
Educational success . . . . . . . . . . . . . . . . . . . . . . . . . . . . . . . . . . . . . . 18
4. Integration Into the Job Market . . . . . . . . . . . . . . . 20
Employment rate differences, by program of study . . . . . . . . . . . . . . 22
Employment rate differences, by age and gender . . . . . . . . . . . . . . . 23
Employer satisfaction . . . . . . . . . . . . . . . . . . . . . . . . . . . . . . . . . . . . . 23
5. Labour Market Outlook and Demographic Trends . . 24
Promotional campaigns . . . . . . . . . . . . . . . . . . . . . . . . . . . . . . . . . . . 24
Demographic downturn . . . . . . . . . . . . . . . . . . . . . . . . . . . . . . . . . . . 24
6. Challenges and Developments . . . . . . . . . . . . . . . 26
Appendix . . . . . . . . . . . . . . . . . . . . . . . . . . . . . . . . . . . 28
Vocational and Technical Training in Québec: Overview

1 Québec’s Vocationa l and Technica l Tra ining System
Legal and regulatory framework
Under Canada’s Constitution, the Québec government has complete juris-diction over its education system, which includes four levels: preschooland elementary, secondary, college, and university. From the age of five,children attend kindergarten, at the preschool level, for one year. Elementaryeducation normally lasts six years, and secondary education, five. Dependingon the choice of program, students can enroll in vocational training in theirthird, fourth or fifth year of secondary school. General-education studentswho earn a Secondary School Diploma (SSD) can go on to college for atwo-year preuniversity program or a three-year technical program. Lastly,university education is divided into three cycles. Three- or four-year under-graduate programs lead to a bachelor’s degree. Graduate studies lead toa master’s degree, and postgraduate studies, to a doctorate.
School attendance is compulsory for all children in Québec between theages of six and sixteen. Elementary education is offered in French, inEnglish or in Aboriginal languages, while secondary education is providedin French or in English. College and university students can choose eitherEnglish or French as the language of instruction, depending on the insti-tution they attend. Educational services are free for Québec residentsexcept for university education; however, the Québec government offersstudents financial aid in the form of loans and bursaries.
1Vocational and Technical Training in Québec: Overview

2 Vocational and Technical Training in Québec: Overview
I I
I I
II I
V V
Québ
ec’s
Edu
catio
n Sy
stem
Cont
inui
ng e
duca
tion
and
trai
ning
Job
mar
ket
Sem
iski
lled
occu
patio
ns |
Ski
lled
occu
patio
ns |
Tec
hnic
ians
and
tech
nolo
gist
s |
Pro
fess
iona
l occ
upat
ions
Voca
tiona
l tra
inin
gDV
S: 6
00 to
180
0 ho
urs
AVS:
330
to 9
00 h
ours
Age
16 +
lang
uage
of i
nstru
ctio
n,
seco
nd la
ngua
ge a
nd S
ec. I
II m
athe
mat
ics
for c
erta
in p
rogr
ams
or Age
16 +
lang
uage
of
inst
ruct
ion,
sec
ond
lang
uage
and
Se
c. IV
mat
hem
atic
s fo
r cer
tain
pro
gram
s
Trai
ning
for s
emis
kille
d oc
cupa
tions
Com
plet
ion
of S
ec. I
IAV
E: 9
00 h
ours
(G
E +
VT)
Univ
ersi
ty
Post
grad
uate
Ph
D (3
or m
ore
year
s)
Grad
uate
M
A (2
yea
rs)
Unde
rgra
duat
e BA
(3
or 4
yea
rs)
Colle
ge
Preu
nive
rsity
edu
catio
nDC
S: 2
yea
rs
Tech
nica
l tra
inin
gDC
S: 3
yea
rs
SSD
Seco
ndar
y5
year
s(a
ges
12 to
17)
Elem
enta
ry6
year
s (a
ges
6 to
12)
Pres
choo
l1
year
(age
5)

Responsibilities
Public or private secondary schools offer vocational training programs,among other services. CEGEPs,* private colleges and certain governmentschools offer technical training programs. Several factors determine if aprogram is to be offered at the secondary or college level, includingthe complexity of the occupation to which the program leads and theacademic prerequisites required for admission to the program. Vocationaltraining programs generally lead to skilled or semiskilled occupations andare certified by a Diploma of Vocational Studies (DVS), an Attestation ofVocational Specialization (AVS) or an Attestation of Vocational Education(AVE). School boards have recently started offering a new vocationaltraining option leading to a Skills Training Certificate (STC); programsunder this option are designed to meet periodic training needs. Collegesoffer technical programs that allow graduates to work as technicians ortechnologists. These programs are certif ied by a Diploma of CollegeStudies (DCS) or an Attestation of College Studies (ACS).
School boards and CEGEPs also offer continuing education and trainingboth in educational institutions and in the workplace. These offerings aretailored to match businesses’ and individuals’ specific needs. The trainingprovided is either customized or based on an official program of study,and leads to various types of certif ication issued by the educationalinstitutions.
Major reform
In 1986, the Ministère de l’Éducation du Québec (MEQ) launched a majorreform of vocational education (now known as vocational training), whichled to:
• the definition of new vocational education paths
• the adoption of a competency-based approach as the foundation forprogram design
• a new geographical distribution of program offerings corresponding tothe social and economic profile of each region
• major capital investments (buildings and equipment)
Moreover, in 1993-1994, the renewal of the college system made it pos-sible to extend the competency-based approach to technical training.
3Vocational and Technical Training in Québec: Overview
* A French acronym for general and technical colleges (collège d’enseignement général et professionnel)

Program management
The Ministère de l’Éducation, du Loisir et du Sport (MELS) guides andsupports VTT development by providing integrated program management,organizing program offerings, and ensuring universal access to educa-tion. In practice, this means that it handles the educational, physical andmaterial aspects of instruction, develops programs, issues diplomas andfunds training activities.
The process for developing VTT programs comprises a series of stepsthat include planning, design, development, implementation, follow-upand evaluation.
4 Vocational and Technical Training in Québec: Overview
Management Cycle
�program approval
�institutional authorizations
Evaluation of the system�programs
�performance (indicators, success rates)
�job entry
�employer satisfaction
Implementation of training�building construction and renovation
�purchase of equipment and materials
�in-service teacher training
�student training
�evaluation of student learning
Impact analysis�organizational guide
�funding parameters
�distribution of program offerings
Program development�job analysis
�design of the proposed training plan
�validation of the proposed training plan
�program development
Planning�sector surveys and monitoring
�orientations
�priority setting within and between sectors

Partnerships
Apart from the public sector (school boards, CEGEPs and governmentschools) and the private sector, several other partners work closely withthe MELS to plan and organize VTT services in Québec. Active partici-pants in this process include different government ministries and sectororganizations.
Emploi-Québec (EQ), for example, is responsible for estimating labourneeds and for managing and directing the apprenticeship program, amongother things. These activit ies, which rely on in-depth knowledge ofthe job market and labour forecasts, are essential in planning which VTTprograms are to be offered in Québec. These activit ies are also thecornerstone of the employment-training correlation model that the MELSuses to determine each region’s share of program offerings.
In addition, some thirty sector committees set up by EQ work in closecollaboration to identify occupational competencies and to run the appren-ticeship program. The Commission de la construction du Québec (CCQ)also plays a vital role in developing VTT programs, given that it is man-dated to coordinate the construction industry training system, makingsure that it corresponds to industry needs and realities.
Businesses, for their part, play a leading role in Québec’s VTT system.They take part in various surveys and studies carried out before programsare developed or revised. They are active participants in labour marketanalysis. Specialists from the different occupations are called upon toidentify the competencies and attitudes required by the job market.Businesses also help students get on-the-job training through theirinvolvement in traditional practicums or in work-study or apprenticeshipprograms that pair up students with journeymen.
Finally, the Comité national des programmes d’études professionnelleset techniques (CNPEPT), composed of representatives from business,labour unions, school boards, CEGEPs, private educational institutionsand EQ, advises the MELS on all important VTT issues as well as onprogram orientations and development.
5Vocational and Technical Training in Québec: Overview

2 Program Offerings
Diversity of training programs
Québec offers close to 300 VTT programs designed to meet the needs ofbusinesses and individuals. These programs all follow a competency-based approach. Programs are divided among 21 training sectors andcover all the occupations requiring vocational or technical training. Morespecifically, 142 programs lead to a Diploma of Vocational Studies (DVS),114 lead to a Diploma of College Studies (DCS), and 26 lead to anAttestation of Vocational Specialization (AVS).
In addition, school boards issue 199 different Attestations of VocationalEducation (AVE), and CEGEPs, over 1 400 Attestations of College Studies(ACS). Programs leading to a DVS normally last one to two years; AVSprograms, less than a year; and DCS programs, three years. Finally, AVEprograms last one year, and ACS programs vary in length from severalmonths to over a year.
6 Vocational and Technical Training in Québec: Overview
DVS AVS Total
Source: Ministère de l’Éducation, du Loisir et du Sport (MELS), Direction générale des programmes et du développement (DGPD), Direction de la planification (DPD), 2007
Administration, Commerce and Computer Technology 5 5 5 15
Agriculture and Fisheries 14 1 9 24
Arts 5 1 10 16
Beauty Care 2 1 3
Buildings and Public Works 24 2 6 32
Chemistry and Biology 1 5 6
Communications and Documentation 4 11 15
Electrotechnology 8 2 6 16
Fashion, Leather and Textiles 8 5 13
Food Services and Tourism 7 3 5 15
Forestry and Pulp and Paper 8 3 11
Health Services 5 20 25
Land Use Planning and the Environment 1 4 5
Maintenance Mechanics 6 3 1 10
Mechanical Manufacturing 9 4 6 19
Metallurgical Technology 8 1 1 10
Mining and Site Operations 8 3 12
Motorized Equipment Maintenance 9 2 2 13
Social, Educational and Legal Services 2 8 10
Transportation 2 3 5
Woodworking and Furniture Making 6 1 1 8
Total 142 26 114 283
Distribution of programs by educational path and training sector Vocational and technical training (Québec as a whole, 2006-2007)
DCS

Provincewide training services
Vocational and technical training is available throughout Québec. Vocationaltraining is managed by 70 school boards, including 9 English-languageboards. Altogether they operate 174 vocational training centres. Vocationaltraining is also offered by 3 government schools and 30 private institu-tions. Technical training is provided by 48 CEGEPs, 4 government schoolsand 15 private institutions offering DCS programs and 27 non-subsidizedprivate institutions offering ACS programs.
7Vocational and Technical Training in Québec: Overview
1. T
otal
num
ber o
f pro
gram
aut
horiz
atio
ns p
er re
gion
. The
sam
e pr
ogra
m m
ay b
e co
unte
d m
ore
than
onc
e if
it is
offe
red
by s
ever
al o
rgan
izat
ions
in th
e sa
me
regi
on.
2. N
umbe
r of a
utho
rized
pro
gram
s pe
r reg
ion.
Pro
gram
s ar
e co
unte
d on
ly o
nce
in a
regi
on e
ven
if of
fere
d by
mor
e th
an o
ne o
rgan
izat
ion.
Sour
ce: M
ELS,
DGP
D, D
PD, 2
007
01
Bas-
Sain
t-La
uren
t 77
58
4
51
39
5
02
Sagu
enay
–Lac
-Sai
nt-J
ean
92
72
5 49
37
4
03
Capi
tale
-Nat
iona
le
157
125
12
72
59
8
04
Mau
ricie
59
57
4
40
35
4
05
Estri
e 10
2 87
6
30
27
3
06
Mon
tréal
26
3 19
6 15
17
8 91
19
07
Outa
ouai
s 81
73
6
30
24
4
08
Abiti
bi-T
émis
cam
ingu
e 59
54
5
13
13
1
09
Côte
-Nor
d 32
26
2
14
11
2
10
Nord
-du-
Québ
ec
52
36
3 0
0 0
11
Gasp
ésie
–Île
s-de
-la-M
adel
eine
46
38
5
13
13
1
12
Chau
dièr
e-Ap
pala
ches
84
56
4
32
22
3
13
Lava
l 72
70
4
19
19
1
14
Lana
udiè
re
52
46
4 19
17
3
15
Laur
entid
es
82
64
7 26
24
2
16
Mon
téré
gie
234
125
18
75
38
8
17
Cent
re-d
u-Qu
ébec
62
56
6
19
16
3
Regi
onal
dis
trib
utio
n of
aut
horiz
atio
ns to
offe
r voc
atio
nal a
nd te
chni
cal t
rain
ing
prog
ram
s, a
nd n
umbe
rs o
f edu
catio
nal o
rgan
izat
ions
(sch
ool b
oard
s, C
EGEP
s, p
rivat
e in
stitu
tions
, gov
ernm
ent s
choo
ls) (
Québ
ec a
s a
who
le, 2
006-
2007
sch
ool y
ear)
Adm
inis
trat
ive
regi
on
Num
ber o
f or
gani
zatio
ns
Voca
tiona
l tra
inin
gAu
thor
izat
ions
Diffe
rent
2To
tal1
Num
ber o
f or
gani
zatio
ns
Tech
nica
l tra
inin
gAu
thor
izat
ions
Diffe
rent
2To
tal1

Investments and training costs
The VTT system requires an investment of over CAN$1 billion per year, ofwhich more than $100 million go to equipment and buildings. In 2005-2006 alone, investments totalled an estimated $1.435 billion. Nearly 60%of that amount ($817.9 million) went to technical training. The Québecgovernment provides almost all the funding for the VTT system, while busi-nesses make only a minor contribution. This situation differs radically fromthat of other provinces or countries, such as Ontario and the United States,which finance less than half of the total training costs, owing to higherstudent and business contributions.
According to MELS estimates, annual costs in 2001 amounted to $7 519 fora secondary-school student, $10 711 for a preuniversity college student,$14 556 for a technical college student, and $17 491 for a university student.In vocational training, the average annual cost per student is estimatedto be in excess of $10 000.
Total training costs for graduates vary greatly, however, since they dependon program length and operating costs. For example, training costs amountto $12 000 for an accounting clerk, a hairdresser or a secretary; $30 000for a nursing assistant; and over $40 000 for a heavy-machine operator.These estimates obviously do not include overall educational costs incurredsince the start of elementary school. Indeed, the cost of educating acollege graduate is over $140 000, and for a university graduate with abachelor’s degree, it is close to $180 000.
8 Vocational and Technical Training in Québec: Overview
Buildings
VT 46.21 57.32 12.50 42.01 48.70 206.74
TT 24.92* 43.57* 4.80 18.45 13.37 105.11
Subtotal 71.13 100.89 17.3 60.46 62.07 311.85
Equipment
VT 15.86 7.24 0.00 6.81 2.50 32.41
TT 30.43* 33.86* 13.80 36.90 26.43 141.42
Subtotal 46.29 41.10 13.80 43.71 28.93 173.83
Total 117.42 141.99 31.10 104.17 91.00 485.68
Investments in buildings and equipment for vocational training (VT) and technical training (TT) (Québec as a whole, from 2001-2002 to 2006-2007 [millions of CAN$])
* : Cost estimate based on total investments in colleges.** : No amounts were allocated in 2002-2003.
Source: MELS, Direction de la gestion des ressources (DGR), 2007
2001-2002 2004-2005 2005-20062003- 2004** Total2006-2007

Diversified training options
A variety of options have been implemented over the past few years tomake it easier for young people to enroll in vocational training.
• One of these options leads to an Attestation of Vocational Education(AVE), which gives access to semiskilled occupations. This path is aimedat lowering the dropout rate and meeting local labour needs. This train-ing is available to students aged 15 and over who have successfullycompleted basic Secondary II courses. Students learn an occupationin the workplace under the supervision of a co-worker acting as asponsor. Since 1995-1996, enrollments in this training option have risenfrom 600 to more than 2 000 a year. With the secondary school reform,this training will be part of the Work-Oriented Training Path and studentscan earn a training certificate for a semiskilled trade (TCST).
• The Exploration of Vocational Training option gives secondary studentsin general education the opportunity to explore one or more vocationaltraining programs to find the one that best suits their tastes and inter-ests. Since 1995-1996, the number of students enrolled in this trainingoption has jumped from 700 to over 22 000 a year.
• Many measures have been taken to create bridges between vocationaland technical training. A number of programs in these two sectors arecurrently being harmonized so that students can follow a continuouslearning path from the Diploma of Vocational Studies (DVS) to the Diplomaof College Studies (DCS). Several programs in the Administration,Commerce and Computer Technology; Agriculture and Fisheries; andMechanical Manufacturing sectors are already accepting studentswho choose this option. This year, ten continuous learning paths will bedeveloped and implemented by secondary and college-level institutionsworking together.
• The concurrent-program option allows students to enroll in a vocationaltraining program even if they do not have the requisite Secondary IVor V credits in general education. These students must neverthelessearn their missing credits during their vocational training before beingawarded a DVS. Students enrolled in vocational training can alsoconcurrently earn the general education credits needed to obtain theirSecondary School Diploma (SSD), in addition to their DVS. Since 1996-1997, the number of students enrolled in this training option has risenfrom under 100 to over 1 100 a year.
9Vocational and Technical Training in Québec: Overview
Recognition of prior learning and competencies
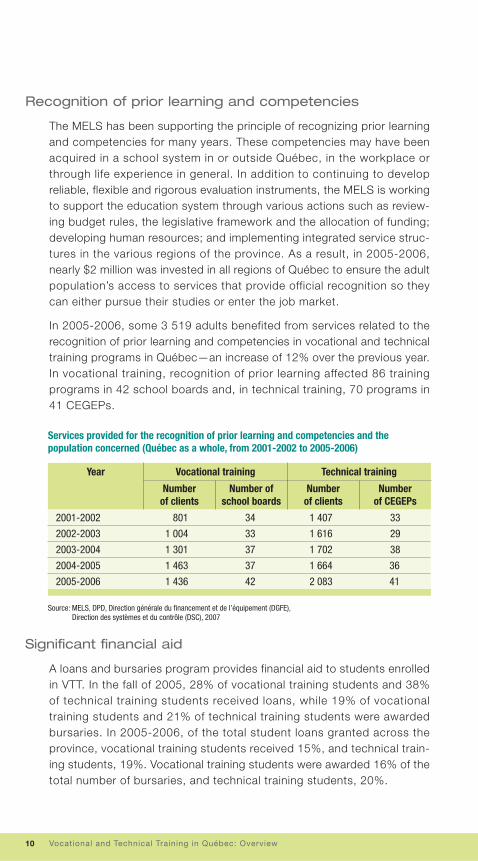
The MELS has been supporting the principle of recognizing prior learningand competencies for many years. These competencies may have beenacquired in a school system in or outside Québec, in the workplace orthrough life experience in general. In addition to continuing to developreliable, flexible and rigorous evaluation instruments, the MELS is workingto support the education system through various actions such as review-ing budget rules, the legislative framework and the allocation of funding;developing human resources; and implementing integrated service struc-tures in the various regions of the province. As a result, in 2005-2006,nearly $2 million was invested in all regions of Québec to ensure the adultpopulation’s access to services that provide official recognition so theycan either pursue their studies or enter the job market.
In 2005-2006, some 3 519 adults benefited from services related to therecognition of prior learning and competencies in vocational and technicaltraining programs in Québec—an increase of 12% over the previous year.In vocational training, recognition of prior learning affected 86 trainingprograms in 42 school boards and, in technical training, 70 programs in41 CEGEPs.
Significant financial aid
A loans and bursaries program provides financial aid to students enrolledin VTT. In the fall of 2005, 28% of vocational training students and 38%of technical training students received loans, while 19% of vocationaltraining students and 21% of technical training students were awardedbursaries. In 2005-2006, of the total student loans granted across theprovince, vocational training students received 15%, and technical train-ing students, 19%. Vocational training students were awarded 16% of thetotal number of bursaries, and technical training students, 20%.
10 Vocational and Technical Training in Québec: Overview
Technical trainingVocational trainingYear
Source: MELS, DPD, Direction générale du financement et de l’équipement (DGFE), Direction des systèmes et du contrôle (DSC), 2007
2001-2002 801 34 1 407 33
2002-2003 1 004 33 1 616 29
2003-2004 1 301 37 1 702 38
2004-2005 1 463 37 1 664 36
2005-2006 1 436 42 2 083 41
Services provided for the recognition of prior learning and competencies and the population concerned (Québec as a whole, from 2001-2002 to 2005-2006)
Number of clients
Number of school boards
Number of clients
Number of CEGEPs

11Vocational and Technical Training in Québec: Overview
Sour
ce: M
ELS,
Aid
e fin
anci
ère
aux
étud
es, 2
005-
2006
repo
rt, p
relim
inar
y da
ta fr
om J
anua
ry 2
6, 2
007
Voca
tiona
l tra
inin
g 36
.9
38.9
45
.5
88.5
76
.6
286.
4 36
.9
41.8
45
.3
46.9
49
.9
220.
8
Colle
ge
93
.3
92.6
90
.7
145.
9 12
2.5
545.
0 69
.3
74.6
74
.4
74.7
78
.6
371.
6
P
reun
iver
sity
edu
catio
n 22
.9
22.7
22
.6
35.0
30
.0
133.
2 14
.4
15.5
15
.4
14.1
16
.4
75.8
Te
chni
cal t
rain
ing
70.4
69
.9
68.1
11
0.9
92.4
41
1.7
54.9
59
.1
59.0
66
.6
62.2
30
1.8
Univ
ersi
ty e
duca
tion
170.
8 18
6.2
198.
5 36
7.0
274.
6 1
197.
1 14
7.5
175.
6 19
5.2
160.
9 17
4.1
853.
3
Othe
r ins
titut
ions
and
prog
ram
s 37
.6
27.5
20
.7
30.2
21
.7
137.
7
Tota
l
338.
6 34
5.2
355.
4 63
1.6
495.
4 2
166.
2 25
4.0
292.
4 31
5.2
282.
9 30
3.0
1 44
7.5
Inte
rest
exp
ense
s on
loan
s 48
.0
39.4
46
.3
40.0
57
.4
231.
1
Dist
ribut
ion
of fi
nanc
ial a
id in
the
form
of l
oans
and
bur
sarie
s, b
y le
vel o
f pro
gram
(Qué
bec
as a
who
le, f
rom
200
1-20
02 to
200
5-20
06 [m
illio
ns o
f CAN
$])
Loan
sBu
rsar
ies
2001
-20
0220
02-
2003
2003
-20
0420
04-
2005
2005
-20
06To
tal
2001
-20
0220
02-
2003
2003
-20
0420
04-
2005
Tota
l20
05-
2006

3 School Attendance
Enrollments and graduation
The number of students enrolled in the various VTT programs in Québectotals more than 168 000 a year. Over 35 000 diplomas are awarded eachyear to vocational training students, and approximately 18 000 to tech-nical training students. For their part, institutions offering ACS programsissue approximately 11 000 attestations each year to the 20 000 studentsenrolled in these programs. By comparison, the MELS annually awardssome 70 000 diplomas for general secondary-school studies and lessthan 25 000 for preuniversity college studies. However, nearly three outof ten of the students leaving the Québec education system each yearhave no specific vocational or technical qualifications to help them enterthe job market: 15% have no diplomas at all and 15% have only a generalsecondary-school or college diploma.
12 Vocational and Technical Training in Québec: Overview
45 000
50 000
55 000
60 000
65 000
70 000
75 000
80 000
85 000
90 000
95 000
2005-2006
2004-2005
2003-2004
2002-2003
2001-2002
2000-2001
1999-2000
1998-1999
1997-1998
Total enrollment trends in vocational training (DVS, AVS, AVE) and technical training (DCS)(Québec as a whole, from 1997-1998 to 2005-2006)
Source: MELS, Direction de la recherche, des statistiques et des indicateurs (DRSI), DPD chart, 2007
Vocational training Technical training
78 2
18
90 6
79
10 000
15 000
20 000
25 000
30 000
35 000
40 000
20042003200220012000199919981997
Trends in numbers of diplomas awarded in vocational training (DVS, AVS, AVE)and in technical training (DCS) (Québec as a whole, from 1997 to 2004)
Source: MELS, DRSI, DPD chart, 2007
Vocational training Technical training
17 9
70
36 2
61
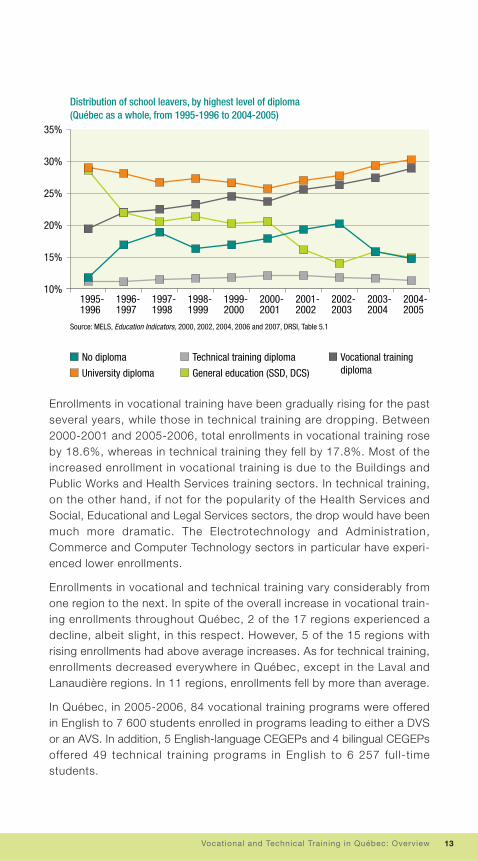
Enrollments in vocational training have been gradually rising for the pastseveral years, while those in technical training are dropping. Between2000-2001 and 2005-2006, total enrollments in vocational training roseby 18.6%, whereas in technical training they fell by 17.8%. Most of theincreased enrollment in vocational training is due to the Buildings andPublic Works and Health Services training sectors. In technical training,on the other hand, if not for the popularity of the Health Services andSocial, Educational and Legal Services sectors, the drop would have beenmuch more dramatic. The Electrotechnology and Administration,Commerce and Computer Technology sectors in particular have experi-enced lower enrollments.
Enrollments in vocational and technical training vary considerably fromone region to the next. In spite of the overall increase in vocational train-ing enrollments throughout Québec, 2 of the 17 regions experienced adecline, albeit slight, in this respect. However, 5 of the 15 regions withrising enrollments had above average increases. As for technical training,enrollments decreased everywhere in Québec, except in the Laval andLanaudière regions. In 11 regions, enrollments fell by more than average.
In Québec, in 2005-2006, 84 vocational training programs were offeredin English to 7 600 students enrolled in programs leading to either a DVSor an AVS. In addition, 5 English-language CEGEPs and 4 bilingual CEGEPsoffered 49 technical training programs in English to 6 257 full-timestudents.
13Vocational and Technical Training in Québec: Overview
Distribution of school leavers, by highest level of diploma(Québec as a whole, from 1995-1996 to 2004-2005)
No diploma
University diploma
Technical training diploma
General education (SSD, DCS)
Vocational trainingdiploma
10%
15%
20%
25%
30%
35%
2004-2005
2003-2004
2002-2003
2001-2002
2000-2001
1999-2000
1998-1999
1997-1998
1996-1997
1995-1996
Source: MELS, Education Indicators, 2000, 2002, 2004, 2006 and 2007, DRSI, Table 5.1

14 Vocational and Technical Training in Québec: Overview
The
data
for 2
005-
2006
ar
e pr
elim
inar
y.1.
Reg
ular
pat
hs o
nly
(Dip
lom
a of
Voc
atio
nal S
tudi
es,
Certi
ficat
e of
Voc
atio
nal
Stud
ies,
Atte
stat
ion
of
Voca
tiona
l Spe
cial
izat
ion,
an
d At
test
atio
n of
Vo
catio
nal E
duca
tion)
.2.
Fig
ures
incl
ude
stud
ents
en
rolle
d in
pro
gram
s le
adin
g to
a
Dipl
oma
of C
olle
ge S
tudi
es.
Sour
ce: M
ELS,
Don
nées
div
erse
s su
r la
form
atio
n pr
ofes
sion
- ne
lle e
t tec
hniq
ue, D
RSI,
Nove
mbe
r 200
6
Abiti
bi-T
émis
cam
ingu
e 1
632
1 79
3 1
714
1 92
1 17
.7%
1
316
1 32
8 1
254
1 14
2 -1
3.2%
Bas-
Sain
t-La
uren
t 2
571
2 63
9 2
621
2 70
6 5.
3%
4 46
7 4
256
4 14
4 3
985
-10.
8%Ca
pita
le-N
atio
nale
9
748
10 0
05
10 6
05
11 8
16
21.2
%
11 4
16
11 0
49
10 8
21
10 5
30
-7.8
%Ce
ntre
-du-
Québ
ec
1 98
3 1
966
2 04
9 2
073
4.5%
1
483
1 27
3 1
268
1 35
1 -8
.9%
Chau
dièr
e-Ap
pala
ches
4
100
4 37
7 4
553
4 48
1 9.
3%
3 43
1 3
311
3 13
4 3
104
-9.5
%Cô
te-N
ord
907
796
814
897
-1.1
%
710
681
666
618
-13.
0%Es
trie
3 35
3 3
477
3 57
4 3
671
9.5%
3
411
3 36
0 3
341
3 34
6 -1
.9%
Gasp
ésie
–Île
s-de
-la-M
adel
eine
1
069
1 12
8 1
127
1 12
5 5.
2%
601
557
579
592
-1.5
%La
naud
ière
2
092
2 07
0 2
164
2 32
8 11
.3%
1
587
1 55
3 1
613
1 62
4 2.
3%La
uren
tides
5
565
5 81
0 5
966
5 54
5 -0
.4%
3
467
3 25
7 3
147
3 05
6 -1
1.9%
Lava
l 5
005
5 30
4 6
152
6 04
3 20
.7%
2
614
2 46
9 2
582
2 62
0 0.
2%M
auric
ie
3 14
5 3
288
3 29
1 3
347
6.4%
4
200
4 03
5 3
841
3 79
4 -9
.7%
Mon
téré
gie
9 61
9 10
250
11
065
11
707
21
.7%
9
261
8 75
7 8
486
8 12
5 -1
2.3%
Mon
tréal
21
707
23
529
24
283
25
056
15
.4%
28
965
28
003
27
515
27
051
-6
.6%
Nord
-du-
Québ
ec
398
381
358
402
1.0%
30
39
39
27
-1
0.0%
Outa
ouai
s 2
704
2 91
1 3
011
2 86
4 5.
9%
2 11
2 2
078
2 19
8 2
096
-0.8
%Sa
guen
ay–
Lac-
Sain
t-Je
an
4 69
0 4
828
4 80
9 4
697
0.1%
5
614
5 56
0 5
448
5 15
7 -8
.1%
Québ
ec a
s a
who
le
80 2
88
84 5
52
88 1
56
90 6
79
12.9
%
84 6
85
81 5
66
80 0
76
78 2
18
-7.6
%
Tren
ds in
enr
ollm
ents
in v
ocat
iona
l and
tech
nica
l tra
inin
g, b
y ad
min
istr
ativ
e re
gion
(Qué
bec
as a
who
le, v
aria
tion
betw
een
2002
-200
3 to
200
5-20
06)
Voca
tiona
l tra
inin
g1
2002
-20
0320
04-
2005
2003
-20
0420
05-
2006
Varia
tion
2002
-200
3/20
05-2
006
Tech
nica
l tra
inin
g2
2002
-20
0320
04-
2005
2003
-20
0420
05-
2006
Varia
tion
2002
-200
3/20
05-2
006

Enrollments, by age and gender
In vocational training, male students (57%) outnumber female students.The situation is different in technical training, however, where the propor-tion of female students is higher (60%). Female students are concentratedin fewer sectors. In vocational training, 4 out of 5 women (81%) are enrolledin four sectors: Administration, Commerce and Computer Technology(33%); Health Services (29%); Beauty Care (12%); and Food Services andTourism (7%). In technical training, more than 2 out of 3 female students(71%) are enrolled in three sectors: Administration, Commerce andComputer Technology (12%); Health Services (31%); and Social,Educational and Legal Services (27%).
15Vocational and Technical Training in Québec: Overview
The data for 2005-2006 are preliminary.
Source: MELS, DGPD, DPD, 2007
Vocational training programs (DVS, AVS) (Programs are offered in both English and French.)
578799/528799 Health, Assistance and Nursing 4 719 711 5 430
571299/521299 Secretarial Studies 4 185 47 4 232
573199/523199 Accounting 3 487 720 4 207
569299/519299 Automobile Mechanics 187 3 557 3 744
579599/529599 Electricity 104 2 797 2 901
576499/526499 Starting a Business 1 662 1 180 2 842
192899/142899 Carpentry 74 2 570 2 644
569599/519599 Welding and Fitting 196 2 219 2 415
558199/508199 Assistance to Patients or Residents in Health Care Establishments 1 971 330 2 301
578199/528199 Automated Systems Electromechanics 93 2 012 2 105
Technical training programs (DCS) (Not all programs are offered in English.)
180.A0 Nursing 8 014 1 155 9 169
410.B0 Accounting and Management Technology 2 670 2 183 4 853
351.A0 Special Care Counselling 3 592 460 4 052
420.A0 Computer Science Technology 227 3 501 3 728
322.A0 Early Childhood Education 3 242 64 3 306
410.D0 Business Management 1 180 1 692 2 872
310.A0 Police Technology 896 1 567 2 463
388.A0 Social Service 1 845 315 2 160
243.06 Industrial Electronics Technology 81 1 818 1 899
241.A0 Mechanical Engineering Technology 64 1 723 1 787
Total enrollments in 2005-2006
Female students
Male students
Total
The ten vocational and technical training programs with the highest enrollmentsTotal full-time enrollments (Québec as a whole, 2005-2006)

On the whole, students enrolled in technical training are younger thanthose in vocational training. In fact, over 85% of technical training stu-dents are below the age of 25, whereas in vocational training just under55% of students belong to that age group. Interestingly enough, nearlyone-third of vocational training students are aged 30 or over. In Québec,vocational training appears to be an option chosen more by adults thanby young people.
16 Vocational and Technical Training in Québec: Overview
The data for 2005-2006 are preliminary.
Source: MELS, DGPD, DPD, 2007
Vocational training programs (DVS, AVS) (Programs are offered in both English and French.)
578799/528799 Health, Assistance and Nursing 4 719 711 5 430
571299/521299 Secretarial Studies 4 185 47 4 232
573199/523199 Accounting 3 487 720 4 207
558199/508199 Assistance to Patients or Residents 1 971 330 2 301 in Health Care Establishments
574599/524599 Hairdressing 1 912 64 1 976
576499/526499 Starting a Business 1 662 1 180 2 842
553599/503599 Aesthetics 1 543 3 1 546
564499/514499 Dental Assistance 860 13 873
153899/103899 Professional Cooking 813 991 1 804
550599/500599 Interior Decorating and Display 801 23 824
Technical training programs (DCS) (Not all programs are offered in English.)
180.A0 Nursing 8 014 1 155 9 169
351.A0 Special Care Counselling 3 592 460 4 052
322.A0 Early Childhood Education 3 242 64 3 306
410.B0 Accounting and Management Technology 2 670 2 183 4 853
388.A0 Social Service 1 845 315 2 160
570.03 Interior Design 1 181 68 1 249
410.D0 Business Management 1 180 1 692 2 872
412.A0 Office System Technology 982 315 1 297
310.C0 Paralegal Technology 969 222 1 191
145.A0 Animal Health Technology 956 66 1 022
Total enrollments in 2005-2006
Female students
Male students
Total
The ten vocational and technical training programs with the highest enrollments of female students. Total full-time enrollments (Québec as a whole, 2005-2006)

Depending on their age, a proportionally higher number of young peo-ple enroll in college technical training than in secondary-level vocationaltraining. Up until the age of 20, there are decidedly more young peoplein general education for adults than there are in vocational training. It isonly starting at age 25 that enrollments are higher in vocational trainingthan in technical training.
Nearly 60% of students who enroll in vocational training already have aSecondary School Diploma (SSD). This percentage is inversely propor-tional to the student’s age. Two thirds (67%) of the students under20 years old already have an SSD when they enroll in vocational training,compared with 64% of those aged 20 to 24, and 51% of older students.
17Vocational and Technical Training in Québec: Overview
0%
10%
20%
30%
40%
50%
60%
Age 30 and overAges 25-29Ages 20-24Under age 20
Student enrollments in vocational training (DVS, AVS, AVE) and technical training (DCS),by age group (Québec as a whole, 2005-2006)
Source: MELS, DRSI, DPD chart, 2007
Vocational training
Technical training
Educational success
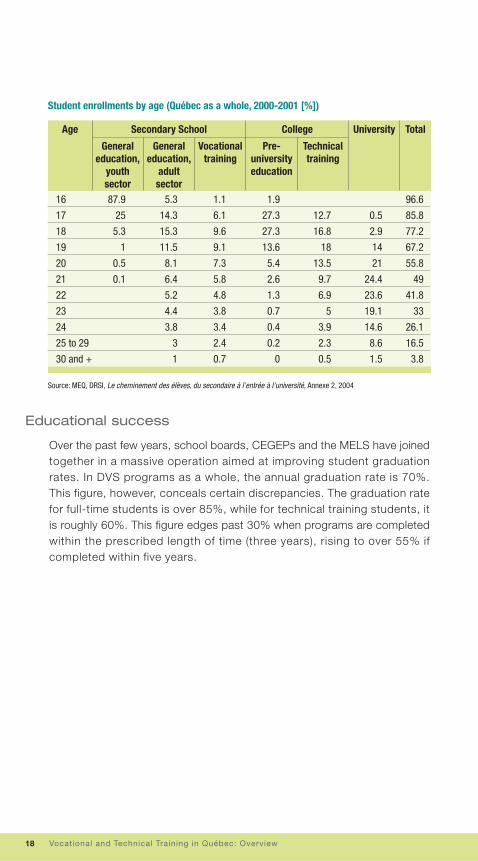
Over the past few years, school boards, CEGEPs and the MELS have joinedtogether in a massive operation aimed at improving student graduationrates. In DVS programs as a whole, the annual graduation rate is 70%.This figure, however, conceals certain discrepancies. The graduation ratefor full-time students is over 85%, while for technical training students, itis roughly 60%. This figure edges past 30% when programs are completedwithin the prescribed length of time (three years), rising to over 55% ifcompleted within five years.
18 Vocational and Technical Training in Québec: Overview
Secondary School College University TotalAge
Source: MEQ, DRSI, Le cheminement des élèves, du secondaire à l’entrée à l’université, Annexe 2, 2004
16 87.9 5.3 1.1 1.9 96.6
17 25 14.3 6.1 27.3 12.7 0.5 85.8
18 5.3 15.3 9.6 27.3 16.8 2.9 77.2
19 1 11.5 9.1 13.6 18 14 67.2
20 0.5 8.1 7.3 5.4 13.5 21 55.8
21 0.1 6.4 5.8 2.6 9.7 24.4 49
22 5.2 4.8 1.3 6.9 23.6 41.8
23 4.4 3.8 0.7 5 19.1 33
24 3.8 3.4 0.4 3.9 14.6 26.1
25 to 29 3 2.4 0.2 2.3 8.6 16.5
30 and + 1 0.7 0 0.5 1.5 3.8
Student enrollments by age (Québec as a whole, 2000-2001 [%])
General education,
youth sector
General education,
adult sector
Vocational training
Pre- university education
Technical training

19Vocational and Technical Training in Québec: Overview
Male
LVP or DVS 2 57.1 58.3 60.0 67.7 63.9 74.5 71.3
Full-time 3 51.8 51.4 81.1 79.5 81.6 84.7 84.5
Female
LVP or DVS 2 65.5 69.5 50.3 64.5 70.2 75.0 75.1
Full-time 3 61.3 62.0 80.0 78.3 82.4 86.4 86.9
Male and female
LVP or DVS 2 61.7 64.1 54.4 66.1 66.6 74.7 73.0
Full-time 3 56.3 56.6 80.6 78.9 82.0 85.4 85.6
Proportion of secondary-level vocational training graduates,1 by gender, category and last year of enrollment (%)
e: Estimates1. All secondary-level diplomas are taken into account.2. Figures for 1980-1981 and 1985-1986 include enrollments in Long Vocational Programs (LVP) in the youth sector.
Figures after 1988-1989 take into account the Diploma of Vocational Studies (DVS) awarded in the youth and adult sectors.3. Students enrolled for 270 or more course hours per year are considered full-time.
Source: MELS, Education Indicators, 2007 edition, preliminary version, DRSI, Table 3.2
1980- 1981
1985- 1986
1990- 1991
1995- 1996
1999- 2000
2003- 2004
2004- 2005 e
Male and female graduates
Same type of initial training
3 years or less 1 N/A 29.6 26.8 31.6 36.1 34.1
5 years or less 1 N/A 51.1 47.8 52.4 57.2 55.4
All durations N/A 56.6 53.1 57.6 63.8 62.1
Other type of initial training 2
All durations N/A 64.4 55.7 57.8 62.0 62.6
All types of initial training and all durations
Male and femalegraduates 59.0 58.6 53.9 57.7 63.2 62.3
Male 53.9 54.7 46.1 50.1 55.8 54.8
Female 63.0 61.3 60.9 64.6 69.2 68.1
Proportion of technical training DSC graduates, by last year of enrollment in regular college education, gender, type of initial training and time elapsed 1 since the beginning of studies (%)
e: EstimatesN/A: Data not available1. The time elapsed since initial enrollment is not necessarily the same as the duration of studies because the studies
may have been interrupted at some point.2. Until 1993-1994, this category referred to students who began their studies in a preuniversity program. As of 1994-1995,
this category also includes students who leave technical training (with or without a diploma) after having begun in an Explorations program the previous year.
Source: MELS, Education Indicators, 2007 edition, preliminary version, DRSI, Table 3.4
1980-1981 1990-1991 1995-1996 1999-2000 2003-2004 2004-2005 e
4 Integration Into the Job Market
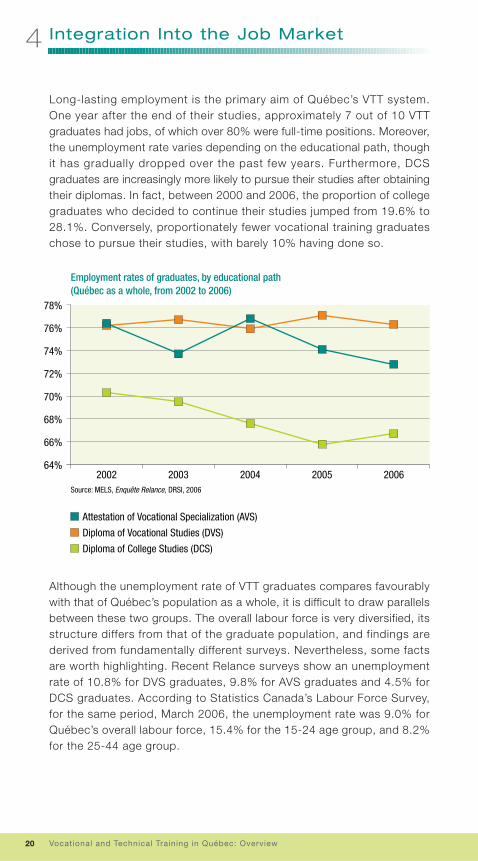
Long-lasting employment is the primary aim of Québec’s VTT system.One year after the end of their studies, approximately 7 out of 10 VTTgraduates had jobs, of which over 80% were full-time positions. Moreover,the unemployment rate varies depending on the educational path, thoughit has gradually dropped over the past few years. Furthermore, DCSgraduates are increasingly more likely to pursue their studies after obtainingtheir diplomas. In fact, between 2000 and 2006, the proportion of collegegraduates who decided to continue their studies jumped from 19.6% to28.1%. Conversely, proportionately fewer vocational training graduateschose to pursue their studies, with barely 10% having done so.
Although the unemployment rate of VTT graduates compares favourablywith that of Québec’s population as a whole, it is difficult to draw parallelsbetween these two groups. The overall labour force is very diversified, itsstructure differs from that of the graduate population, and findings arederived from fundamentally different surveys. Nevertheless, some factsare worth highlighting. Recent Relance surveys show an unemploymentrate of 10.8% for DVS graduates, 9.8% for AVS graduates and 4.5% forDCS graduates. According to Statistics Canada’s Labour Force Survey,for the same period, March 2006, the unemployment rate was 9.0% forQuébec’s overall labour force, 15.4% for the 15-24 age group, and 8.2%for the 25-44 age group.
20 Vocational and Technical Training in Québec: Overview
64%
66%
68%
70%
72%
74%
76%
78%
20062005200420032002
Employment rates of graduates, by educational path(Québec as a whole, from 2002 to 2006)
Source: MELS, Enquête Relance, DRSI, 2006
Attestation of Vocational Specialization (AVS)
Diploma of Vocational Studies (DVS)
Diploma of College Studies (DCS)

21Vocational and Technical Training in Québec: Overview
0%
5%
10%
15%
20%
25%
20062005200420032002
Trends in graduates’ unemployment rates, by educational path(Québec as a whole, from 2002 to 2006)
Source: MELS, Enquête Relance, DRSI, 2006
Attestation of Vocational Specialization (AVS)
Diploma of Vocational Studies (DVS)
Diploma of College Studies (DCS)
Situation on March 31, 2006 of the graduates from the class of 2004-2005(Diploma of Vocational Studies [DVS])
Situation on March 31, 2006 of the graduates from the class of 2004-2005(Attestation of Vocational Specialization [AVS])
Situation on March 31, 2006 of the graduates from the class of 2004-2005(Diploma of College Studies [DCS] in technical training)
Source: MELS, Enquête Relance, DRSI, 2006
4.2%10.1%
Employed 76.3%
9.3%9.9%
66.4%
Employed full-time
Employed part-time
Seeking employment
Pursuing studies
Inactive
7.9%61.9%
11.3%
Employed 72.8%
7.9%10.9%
Employed full-time
Employed part-time
Seeking employment
Pursuing studies
Inactive
2.1%56.9%
28.1%
Employed 66.7%
3.1%
9.8%
Employed full-time
Employed part-time
Seeking employment
Pursuing studies
Inactive
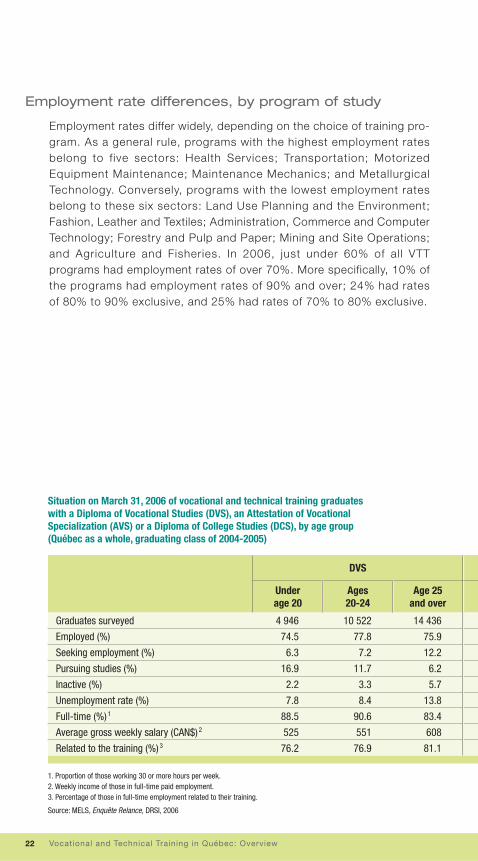
Employment rate differences, by program of study
Employment rates differ widely, depending on the choice of training pro-gram. As a general rule, programs with the highest employment ratesbelong to five sectors: Health Services; Transportation; MotorizedEquipment Maintenance; Maintenance Mechanics; and MetallurgicalTechnology. Conversely, programs with the lowest employment ratesbelong to these six sectors: Land Use Planning and the Environment;Fashion, Leather and Textiles; Administration, Commerce and ComputerTechnology; Forestry and Pulp and Paper; Mining and Site Operations;and Agriculture and Fisheries. In 2006, just under 60% of all VTTprograms had employment rates of over 70%. More specifically, 10% ofthe programs had employment rates of 90% and over; 24% had ratesof 80% to 90% exclusive, and 25% had rates of 70% to 80% exclusive.
22 Vocational and Technical Training in Québec: Overview
Age 25 and over
Ages 20-24
Under age 20
1. Proportion of those working 30 or more hours per week.2. Weekly income of those in full-time paid employment.3. Percentage of those in full-time employment related to their training.
Source: MELS, Enquête Relance, DRSI, 2006
Graduates surveyed 4 946 10 522 14 436
Employed (%) 74.5 77.8 75.9
Seeking employment (%) 6.3 7.2 12.2
Pursuing studies (%) 16.9 11.7 6.2
Inactive (%) 2.2 3.3 5.7
Unemployment rate (%) 7.8 8.4 13.8
Full-time (%) 1 88.5 90.6 83.4
Average gross weekly salary (CAN$) 2 525 551 608
Related to the training (%) 3 76.2 76.9 81.1
Situation on March 31, 2006 of vocational and technical training graduates with a Diploma of Vocational Studies (DVS), an Attestation of Vocational Specialization (AVS) or a Diploma of College Studies (DCS), by age group (Québec as a whole, graduating class of 2004-2005)
DVS

Employment rate differences, by age and gender
Age-group analysis of the job placements of vocational training gradu-ates (DVS and AVS) reveals that those aged 20 to 24 had the highestemployment rates. At the college level, there are proportionately moreemployed graduates among those aged 25 and over. Nevertheless, anyanalysis of college graduates’ employment status must take into accountthe sizeable proportion of students who continue their studies aftergraduation, especially those under the age of 25. This aspect meanswe must exercise caution when interpreting college-graduate employmentstatistics by age group. The same holds true for employment statistics bygender. Though women have higher employment rates than men (69.9%compared with 61.3%), they are less likely to pursue their studies oncethey have obtained a DCS (25.2% compared with 32.9%).
Employer satisfaction
The MELS has carried out several surveys among employers who hire VTTgraduates. More than 9 employers out of 10 consider their vocationaltraining recruits to be competent. This figure is slightly higher amongemployers who hire technical training graduates (95.7% compared with89.6%). Recent surveys also show that 91.2% of employers who hiredDVS or AVS graduates and 94.3% of those who hired DCS graduateswere satisfied with their new employees’ performance after one yearof work.
23Vocational and Technical Training in Québec: Overview
293 1 053 3 172 1 073 11 955 3 447
74.0 78.8 70.5 53.5 64.4 80.7
3.7 5.2 9.4 2.5 3.0 4.0
20.9 11.6 10.1 42.3 30.9 11.9
1.4 4.4 10.0 1.7 1.7 3.4
4.8 6.2 11.8 4.5 4.4 4.7
80.5 89.2 83.8 85.4 85.7 84.0
459 545 640 529 562 627
78.1 77.1 67.1 84.8 81.9 88.0
Age 25 and over
Ages 20-24
Under age 20
Age 25 and over
Ages 20-24
Under age 20
AVS DCS

5 Labour Market Outlook andDemographic Trends
Over the past few years, Québec has experienced significant job growth.Between 2000 and 2005, more than 314 500 jobs were created, anincrease of more than 9%. Emploi-Québec (EQ) estimates that the Québececonomy will create over 251 000 jobs between 2005 and 2009. Duringthe same period, retiring workers will create an additional 440 000 open-ings. It is estimated that half of all these jobs wil l require secondary-level vocational training or college-level technical training. As a result,labour market demand will continue to exert considerable pressure on theVTT system.
To ensure the best possible match between labour needs and theprofile of VTT graduates, the MELS and EQ together have developed anemployment-training correlation model. This model uses labour marketforecasts to determine how many people need to be trained in eachprogram.
The model reveals that 80% of the VTT programs are well balanced, thatis, enrollments in these programs should be sufficient to meet labourdemand. Still, in 12% of the programs, there is a substantial increaseddemand for enrollments, whereas in 5% of the programs the number ofenrollments exceeds demand.
Promotional campaigns
Several advertising campaigns have been orchestrated to promote train-ing programs offering the best job prospects and hiring opportunities.These campaigns are designed both to inform the general public—youngpeople in particular—about these programs and to increase enrollmentsin programs where the supply does not meet demand.
Demographic downturn
Promoting vocational and technical training is all the more important sinceseveral regions of Québec are expected to experience a particularly sharpdemographic downturn over the next few years. The MELS anticipatesthat between 2006 and 2016, total enrollments in elementary andsecondary schools will decline by 11%, as will those in public colleges,though by a smaller percentage (decline of less than 2% from 2005 to2015). These figures, however, vary considerably from one administrativeregion to the other. Several regions that have already begun to experi-ence a decline in student enrollments will continue to do so, with the dropaffecting both French-language and English-language school boards. Onlythe Aboriginal school boards will maintain their enrollments at currentlevels. As for college enrollments, they are expected to rise in only 6 ofthe 17 administrative regions. The tables appended to this report shedlight on each region’s specific situation.
24 Vocational and Technical Training in Québec: Overview
25Vocational and Technical Training in Québec: Overview
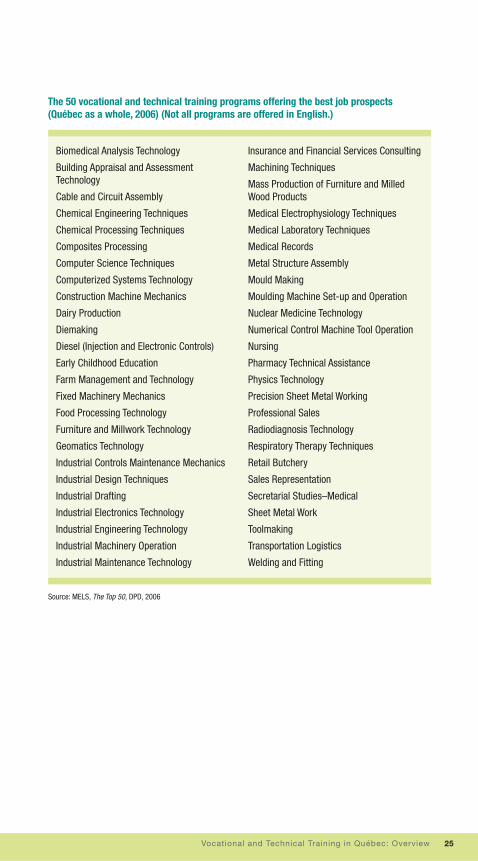
The 50 vocational and technical training programs offering the best job prospects(Québec as a whole, 2006) (Not all programs are offered in English.)
Biomedical Analysis Technology
Building Appraisal and Assessment Technology
Cable and Circuit Assembly
Chemical Engineering Techniques
Chemical Processing Techniques
Composites Processing
Computer Science Techniques
Computerized Systems Technology
Construction Machine Mechanics
Dairy Production
Diemaking
Diesel (Injection and Electronic Controls)
Early Childhood Education
Farm Management and Technology
Fixed Machinery Mechanics
Food Processing Technology
Furniture and Millwork Technology
Geomatics Technology
Industrial Controls Maintenance Mechanics
Industrial Design Techniques
Industrial Drafting
Industrial Electronics Technology
Industrial Engineering Technology
Industrial Machinery Operation
Industrial Maintenance Technology
Insurance and Financial Services Consulting
Machining Techniques
Mass Production of Furniture and Milled Wood Products
Medical Electrophysiology Techniques
Medical Laboratory Techniques
Medical Records
Metal Structure Assembly
Mould Making
Moulding Machine Set-up and Operation
Nuclear Medicine Technology
Numerical Control Machine Tool Operation
Nursing
Pharmacy Technical Assistance
Physics Technology
Precision Sheet Metal Working
Professional Sales
Radiodiagnosis Technology
Respiratory Therapy Techniques
Retail Butchery
Sales Representation
Secretarial Studies–Medical
Sheet Metal Work
Toolmaking
Transportation Logistics
Welding and Fitting
Source: MELS, The Top 50, DPD, 2006

6 Cha l lenges and Developments
The VTT system contributes directly to Québec’s social and economicdevelopment, given its two specific aims, which are to provide studentswith the competencies that will help guarantee their personal and profes-sional autonomy, and to fulfill labour market needs for qualified workers.The challenges are many, and they must be reviewed at regular intervalsso that we can react appropriately both to labour market developmentsand the demographic trends that raise important questions about train-ing program accessibility and regional development support.
Both modern technologies and the Québec economy are evolving at arapid pace. As an industrial leader, Québec must continue to invest inwork force qualifications, especially in the high-tech and health and socialservices sectors where labour demand is high. To ensure that the VTTsystem keeps pace with Québec’s economic trends and developments,we must maintain and consolidate the ties we have developed with thedifferent stakeholders and partners in the labour market. This approachis essential in the case of emerging (or developing) sectors and niches ofexcellence in the various regions. Consequently, the competencies relatedto industries like multimedia, video games, pharmaceuticals, transporta-tion equipment, valued-added manufacturing, etc. will be increasinglysought after in the Québec labour market and their presence will guaran-tee economic prosperity.
Vocational and technical training must be geared to helping job seekersfind long-lasting employment with relative ease. In that respect, the labouroutlook appears promising. Yet the current demographic downturn com-pels us to keep improving the performance of our training system as awhole and to make optimum use of our resources throughout Québec.This situation draws attention to three interesting facts. First, over onethird of our students leave school each year without any specific jobqualifications. Second, some programs, especially in technical training,have low graduation rates. Third, some training programs do not attractenough students despite the excellent job prospects they offer. One ofour challenges, therefore, is to ensure a better match between trainingand labour needs, while encouraging more young people to enroll in voca-tional training programs or to stay in school until they obtain a technicaltraining diploma.
26 Vocational and Technical Training in Québec: Overview

To meet this challenge, Québec has developed a vocational and techni-cal training collaboration plan to maintain access to training in all regionsof the province, help educational institutions experiencing difficulties withstudent recruitment, meet the pressing need for a qualified workforce inQuébec, enable students to make a smooth transition from one level ofeducation to another, and lead more youth and adults to acquire moretraining that will qualify them for a trade or profession. This plan is builton three priorities centred on collaboration among vocational and tech-nical training institutions and programs, along with regional dialogue, andcollaboration with the workplace.
Rapidly developing technologies require major investments in order tomaintain future workers’ qualification levels and to help businesses remaincompetitive. Access to these technologies can increasingly be gainedonly through school and business partnerships, both in initial vocationaland technical training and in continuing education.
27Vocational and Technical Training in Québec: Overview
Appendix
28 Vocational and Technical Training in Québec: Overview
Secondary school, private and public sectors (DVS, AVS)
Public and private colleges (DCS, ACS)
2003- 2004
2002- 2003
2004- 2005
2005- 2006
2003- 2004
2002- 2003
2004- 2005
2005- 2006
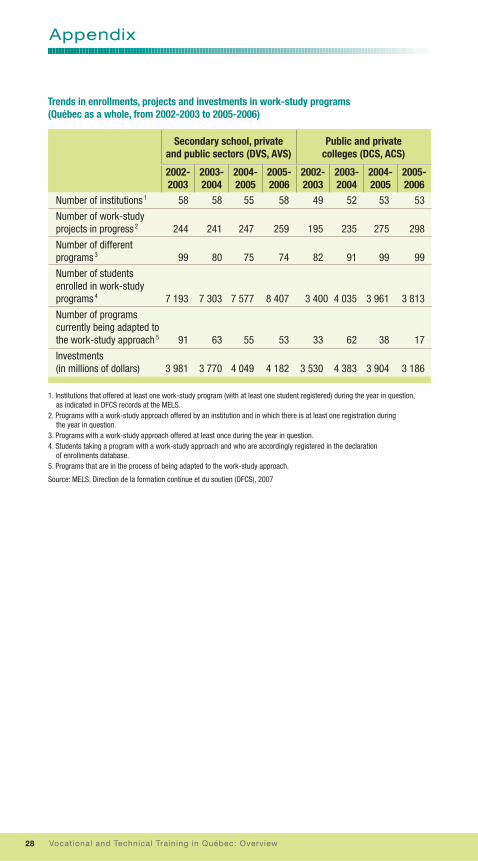
Number of institutions 1 58 58 55 58 49 52 53 53
Number of work-studyprojects in progress 2 244 241 247 259 195 235 275 298
Number of differentprograms 3 99 80 75 74 82 91 99 99
Number of studentsenrolled in work-study programs 4 7 193 7 303 7 577 8 407 3 400 4 035 3 961 3 813
Number of programscurrently being adapted tothe work-study approach 5 91 63 55 53 33 62 38 17
Investments(in millions of dollars) 3 981 3 770 4 049 4 182 3 530 4 383 3 904 3 186
Trends in enrollments, projects and investments in work-study programs (Québec as a whole, from 2002-2003 to 2005-2006)
1. Institutions that offered at least one work-study program (with at least one student registered) during the year in question, as indicated in DFCS records at the MELS.
2. Programs with a work-study approach offered by an institution and in which there is at least one registration during the year in question.
3. Programs with a work-study approach offered at least once during the year in question.4. Students taking a program with a work-study approach and who are accordingly registered in the declaration
of enrollments database.5. Programs that are in the process of being adapted to the work-study approach.
Source: MELS, Direction de la formation continue et du soutien (DFCS), 2007

29Vocational and Technical Training in Québec: Overview
1998- 1999
1997- 1998
1996- 1997
1999- 2000 2
2000- 2001 2
2001- 2002 2
2002- 2003 2
2003- 2004
2004- 2005
2005- 2006
Underage 20 3 24 530 25 818 25 208 24 623 24 335 24 044 23 255 23 847 24 530 24 627
Malestudents 14 663 15 324 15 074 14 854 15 064 14 899 14 681 15 125 15 533 15 802
Femalestudents 9 867 10 494 10 134 9 769 9 271 9 145 8 574 8 722 8 997 8 825
Age 20and over 48 460 49 968 51 919 51 267 52 153 55 351 57 033 60 705 63 626 66 052
Malestudents 25 975 26 906 27 837 27 771 28 808 31 215 31 657 33 342 34 533 35 731
Femalestudents 22 485 23 062 24 082 23 496 23 345 24 136 25 376 27 363 29 093 30 321
Total 72 990 75 786 77 127 75 890 76 488 79 395 80 288 84 552 88 156 90 679
Malestudents 40 638 42 230 42 911 42 625 43 872 46 114 46 338 48 467 50 066 51 533
Femalestudents 32 352 33 556 34 216 33 265 32 616 33 281 33 950 36 085 38 090 39 146
Enrollments in vocational and technical training, by gender (Québec as a whole, from 1996-1997 to 2005-2006)
The data for 2005-2006 are preliminary.1. Regular paths only (Diploma of Vocational Studies, Certificate of Vocational Studies, Attestation of Vocational Specialization
and Attestation of Vocational Education).2. Figures do not include self-financed students enrolled in the Fire Safety Techniques program (5691/5191).3. This category includes students in the youth sector and those under the age of 20 in the adult sector.
A) Secondary-level vocational training 1
DCS(technicaltraining) 90 457 90 959 90 442 88 964 87 500 86 836 84 685 81 566 80 076 78 218
Malestudents 41 932 42 566 42 077 40 658 39 066 37 945 36 397 34 432 32 900 31 626
Femalestudents 48 525 48 393 48 365 48 306 48 434 48 891 48 288 47 134 47 176 46 592
ACS, CECand DPEC 31 766 32 534 35 646 32 805 32 441 29 674 26 269 24 322 22 596 20 376
Malestudents 11 625 12 037 14 398 14 067 13 802 12 717 11 277 10 581 9 527 8 241
Femalestudents 20 141 20 497 21 248 18 738 18 639 16 957 14 992 13 741 13 069 12 135
Total 122 223 123 493 126 088 121 769 119 941 116 510 110 954 105 888 102 672 98 594
Malestudents 53 557 54 603 56 475 54 725 52 868 50 662 47 674 45 013 42 427 39 867
Femalestudents 68 666 68 890 69 613 67 044 67 073 65 848 63 280 60 875 60 245 58 727
The data for 2005-2006 are preliminary.1. Figures include students enrolled in the following programs: DCS: Diploma of College Studies; ACS: Attestation of College
Studies; CEC: certificat d’études collégiales (certificate of college studies); and DPEC: diplôme de perfectionnement de l’enseignement collégial (diploma of advanced college studies).
Source: MELS, Données diverses sur la formation professionnelle et technique, DRSI, November 2006
B) College-level technical training 1
1998- 1999
1997- 1998
1996- 1997
1999- 2000
2000- 2001
2001- 2002
2002- 2003
2003- 2004
2004- 2005
2005- 2006

30 Vocational and Technical Training in Québec: Overview
1998-19991997-19981996-1997
1. Regular paths only (Diploma of Vocational Studies, Certificate of Vocational Studies, Attestation of Vocational Specialization and Attestation of Vocational Education).
2. Figures do not include self-financed students enrolled in the Fire Safety Techniques program (5691/5191).
Gaspésie–Îles-de-la-Madeleine 604 596 793
Bas-Saint-Laurent 2 554 2 966 3 020
Saguenay–Lac-Saint-Jean 4 728 5 260 5 770
Capitale-Nationale 8 979 8 583 8 562
Chaudière-Appalaches 4 053 4 077 4 219
Mauricie 2 372 2 621 2 590
Centre-du-Québec 1 935 2 239 2 302
Estrie 3 208 3 533 3 531
Montérégie 9 958 9 927 9 669
Montréal 18 706 19 309 19 601
Laval 4 650 4 635 4 705
Lanaudière 1 734 1 887 1 913
Laurentides 3 567 3 755 4 071
Outaouais 2 865 2 935 2 890
Abitibi-Témiscamingue 1 832 1 979 2 066
Côte-Nord 941 1 002 1 062
Nord-du-Québec 304 482 363
Québec as a whole 72 990 75 786 77 127
Enrollments in secondary-level vocational training, 1 by administrative region(Québec as a whole, from 1996-1997 to 2005-2006)
1. Figures include students enrolled in the following programs: DCS: Diploma of College Studies; ACS: Attestation of College Studies; CEC: certificat d’études collégiales (certificate of college studies); and DPEC: diplôme de perfectionnement de l’enseignement collégial (diploma of advanced college studies).
Gaspésie–Îles-de-la-Madeleine 1 183 1 232 1 306
Bas-Saint-Laurent 6 555 6 587 6 517
Saguenay–Lac-Saint-Jean 7 513 7 354 7 612
Capitale-Nationale 14 297 14 925 16 128
Chaudière-Appalaches 4 660 4 690 4 941
Mauricie 6 206 5 917 5 929
Centre-du-Québec 3 028 3 125 3 203
Estrie 5 200 5 103 5 106
Montérégie 13 499 13 795 13 916
Montréal 42 193 43 141 44 402
Laval 3 462 3 554 3 485
Lanaudière 3 323 3 153 2 715
Laurentides 5 041 5 017 4 959
Outaouais 2 938 2 887 2 870
Abitibi-Témiscamingue 1 846 1 767 1 824
Côte-Nord 1 222 1 195 1 122
Nord-du-Québec 57 51 53
Québec as a whole 122 223 123 493 126 088
Enrollments 1 in college-level technical training, by administrative region(Québec as a whole, from 1996-1997 to 2005-2006)
1998-19991997-19981996-1997

31Vocational and Technical Training in Québec: Overview
The data for 2005-2006 are preliminary.Source: MELS, Données diverses sur la formation professionnelle et technique, DRSI, November 2006
1 021 832 826 1 069 1 128 1 127 1 125
2 616 2 668 2 631 2 571 2 639 2 621 2 706
5 442 4 920 4 948 4 690 4 828 4 809 4 697
8 641 9 095 9 817 9 748 10 005 10 605 11 816
4 081 4 037 4 129 4 100 4 377 4 553 4 481
2 808 2 869 3 031 3 145 3 288 3 291 3 347
2 213 2 288 2 132 1 983 1 966 2 049 2 073
3 272 3 145 3 115 3 353 3 477 3 574 3 671
9 948 9 713 9 862 9 619 10 250 11 065 11 707
19 330 20 257 20 837 21 707 23 529 24 283 25 056
4 755 5 434 5 482 5 005 5 304 6 152 6 043
1 805 1 817 2 005 2 092 2 070 2 164 2 328
4 079 4 009 5 098 5 565 5 810 5 966 5 545
2 707 2 522 2 514 2 704 2 911 3 011 2 864
1 844 1 725 1 742 1 632 1 793 1 714 1 921
1 040 879 857 907 796 814 897
288 278 369 398 381 358 402
75 890 76 488 79 395 80 288 84 552 88 156 90 679
2005-20062004-20052003-20042002-2003 22001-2002 22000-2001 21999-2000 2
The data for 2005-2006 are preliminary.Source: MELS, Données diverses sur la formation professionnelle et technique, DRSI, November 2006
1 033 933 873 758 816 691 745
6 207 5 922 5 558 5 127 4 899 4 798 4 609
7 040 6 915 6 944 6 571 6 380 6 360 5 931
15 080 15 029 14 506 13 933 13 516 13 207 12 505
4 614 4 174 3 937 3 768 3 672 3 435 3 496
5 333 5 130 4 985 4 915 4 675 4 437 4 253
2 868 2 684 2 513 2 437 2 154 2 071 2 081
5 076 5 083 4 981 4 493 4 125 4 134 4 043
13 669 13 294 13 487 12 632 11 935 10 857 10 056
43 544 43 813 42 188 40 426 38 850 37 977 36 964
4 231 3 942 3 775 3 751 3 612 3 553 3 258
2 268 2 264 2 285 2 145 1 997 2 053 2 070
4 875 4 927 4 813 4 658 4 251 4 080 3 932
2 990 2 917 2 847 2 731 2 545 2 636 2 551
1 843 1 641 1 678 1 569 1 483 1 468 1 270
1 020 1 161 1 089 945 914 854 776
78 112 51 95 64 61 54
121 769 119 941 116 510 110 954 105 888 102 672 98 594
2005-20062004-20052003-20042002-20032001-20022000-20011999-2000

32 Vocational and Technical Training in Québec: Overview
1. Figures include students enrolled in the following programs: DCS: Diploma of College Studies; ACS: Attestation of College Studies; CEC: certificat d’études collégiales (certificate of college studies); and DPEC: diplôme de perfectionnement de l’enseignement collégial (diploma of advanced college studies).
DCS (technical training)
Gaspésie–Îles-de-la-Madeleine 935 938 915
Bas-Saint-Laurent 5 272 5 234 5 250
Saguenay–Lac-Saint-Jean 6 152 6 186 6 251
Capitale-Nationale 10 668 10 768 10 853
Chaudière-Appalaches 3 994 4 021 4 089
Mauricie 4 805 4 859 4 838
Centre-du-Québec 2 016 2 183 2 221
Estrie 3 861 3 698 3 688
Montérégie 9 622 10 121 10 134
Montréal 30 282 30 110 29 473
Laval 2 440 2 688 2 714
Lanaudière 2 014 1 891 1 772
Laurentides 3 509 3 524 3 507
Outaouais 2 334 2 272 2198
Abitibi-Témiscamingue 1 524 1 499 1 562
Côte-Nord 986 932 948
Nord-du-Québec 43 35 29
Québec as a whole 90 457 90 959 90 442
Enrollments1 in college-level technical training, by administrative region,(Québec as a whole, from 1996-1997 to 2005-2006)
ACS, CEC and DPEC
Gaspésie–Îles-de-la-Madeleine 248 294 391
Bas-Saint-Laurent 1 283 1 353 1 267
Saguenay–Lac-Saint-Jean 1 361 1 168 1 361
Capitale-Nationale 3 629 4 157 5 275
Chaudière-Appalaches 666 669 852
Mauricie 1 401 1 058 1 091
Centre-du-Québec 1 012 942 982
Estrie 1 339 1 405 1 418
Montérégie 3 877 3 674 3 782
Montréal 11 911 13 031 14 929
Laval 1 022 866 771
Lanaudière 1 309 1 262 943
Laurentides 1 532 1 493 1 452
Outaouais 604 615 672
Abitibi-Témiscamingue 322 268 262
Côte-Nord 236 263 174
Nord-du-Québec 14 16 24
Québec as a whole 31 766 32 534 35 646
1998-19991997-19981996-1997
1998-19991997-19981996-1997

33Vocational and Technical Training in Québec: Overview
The data for 2005-2006 are preliminary.
Source: MELS, Données diverses sur la formation professionnelle et technique, DRSI, November 2006
756 684 680 601 557 579 592
5 124 4 884 4 589 4 467 4 256 4 144 3 985
6 107 5 918 5 870 5 614 5 560 5 448 5 157
11 078 11 325 11 385 11 416 11 049 10 821 10 530
3 952 3 614 3 468 3 431 3 311 3 134 3 104
4 550 4 383 4 255 4 200 4 035 3 841 3 794
2 035 1 729 1 643 1 483 1 273 1 268 1 351
3 622 3 552 3 529 3 411 3 360 3 341 3 346
10 164 9 938 9 810 9 261 8 757 8 486 8 125
29 359 29 501 29 566 28 965 28 003 27 515 27 051
2 748 2 676 2 657 2 614 2 469 2 582 2 620
1 481 1 537 1 561 1 587 1 553 1 613 1 624
3 490 3 493 3 616 3 467 3 257 3 147 3 056
2 044 2 070 2 126 2 112 2 078 2 198 2 096
1 533 1 308 1 310 1 316 1 328 1 254 1 142
877 831 737 710 681 666 618
44 57 34 30 39 39 27
88 964 87 500 86 836 84 685 81 566 80 076 78 218
277 249 193 157 259 112 153
1 083 1 038 969 660 643 654 624
933 997 1 074 957 820 912 774
4 002 3 704 3 121 2 517 2 467 2 386 1 975
662 560 469 337 361 301 392
783 747 730 715 640 596 459
833 955 870 954 881 803 730
1 454 1 531 1 452 1 082 765 793 697
3 505 3 356 3 677 3 371 3 178 2 371 1 931
14 185 14 312 12 622 11 461 10 847 10 462 9 913
1 483 1 266 1 118 1 137 1 143 971 638
787 727 724 558 444 440 446
1 385 1 434 1 197 1 191 994 933 876
946 847 721 619 467 438 455
310 333 368 253 155 214 128
143 330 352 235 233 188 158
34 55 17 65 25 22 27
32 805 32 441 29 674 26 269 24 322 22 596 20 376
2005-20062004-20052003-20042002-20032001-20022000-20011999-2000
2005-20062004-20052003-20042002-20032001-20022000-20011999-2000

34 Vocational and Technical Training in Québec: Overview
1997-19981996-19971995-1996
The data for 2004-2005 are preliminary.
1. The data were updated as of 1998-1999 only up to the most recent years.2. Figures include diplomas awarded in the youth sector and to graduates under the age of 20 in the adult sector.
Under age 20 2 5 328 6 579 6 855
Male students 2 975 3 702 3 891
Female students 2 353 2 877 2 964
Age 20 and over 19 983 22 331 22 880
Male students 10 983 12 437 12 734
Female students 9 000 9 894 10 146
Total 25 311 28 910 29 735
Male students 13 958 16 139 16 625
Female students 11 353 12 771 13 110
The data for 2004 are preliminary.
DCS: Diploma of College StudiesCEC: certificat d’études collégiales (certificate of college studies)DPEC: diplôme de perfectionnement de l’enseignement collégial (diploma of advanced college studies)1. The majority of registrations in programs other than technical DCS programs are in those leading to an Attestation
of College Studies (ACS). These diplomas are awarded directly by the colleges, which have been required to declare them to the MELS since 2000.
B) College-level technical training
A) Secondary-level vocational training
199719961995
DCS (technical education) 15 615 16 174 16 748
Male students 6 591 6 615 6 813
Female students 9 024 9 559 9 935
ACS, CEC and DPEC 1 2 278 1 607 2 210
Male students 1 157 751 1 043
Female students 1 121 856 1 167
Total 17 893 17 781 18 958
Male students 7 748 7 366 7 856
Female students 10 145 10 415 11 102
Number of diplomas awarded in vocational and technical training, by gender(Québec as a whole, from 1995-1996 to 2004-2005)

35Vocational and Technical Training in Québec: Overview
8 046 8 449 6 671 6 359 6 369 6 365 6 346
4 527 4 745 3 745 3 692 3 812 3 821 3 869
3 519 3 704 2 926 2 667 2 557 2 544 2 477
22 927 23 612 24 093 26 648 27 486 28 957 29 915
12 292 12 564 13 275 14 999 15 313 16 189 16 091
10 635 11 048 10 818 11 649 12 173 12 768 13 824
30 973 32 061 30 764 33 007 33 855 35 322 36 261
16 819 17 309 17 020 18 691 19 125 20 010 19 960
14 154 14 752 13 744 14 316 14 730 15 312 16 301
2004-2005
Source: MELS, Données diverses sur la formation professionnelle et technique, DRSI, November 2006
2003-20042002-20032001-20022000-20011999-20001998-1999 1
16 814 17 631 17 986 17 998 18 732 18 165 17 970
6 789 7 270 7 468 7 532 7 497 7 071 6 986
10 025 10 361 10 518 10 466 11 235 11 094 10 984
3 403 4 131 8 922 11 069 11 644 11 220 10 991
1 608 2 088 3 909 4 927 5 243 4 975 5 216
1 795 2 043 5 013 6 142 6 401 6 245 5 775
20 217 21 762 26 908 29 067 30 376 29 385 28 961
8 397 9 358 11 377 12 459 12 740 12 046 12 202
11 820 12 404 15 531 16 608 17 636 17 339 16 759
2004200320022001200019991998
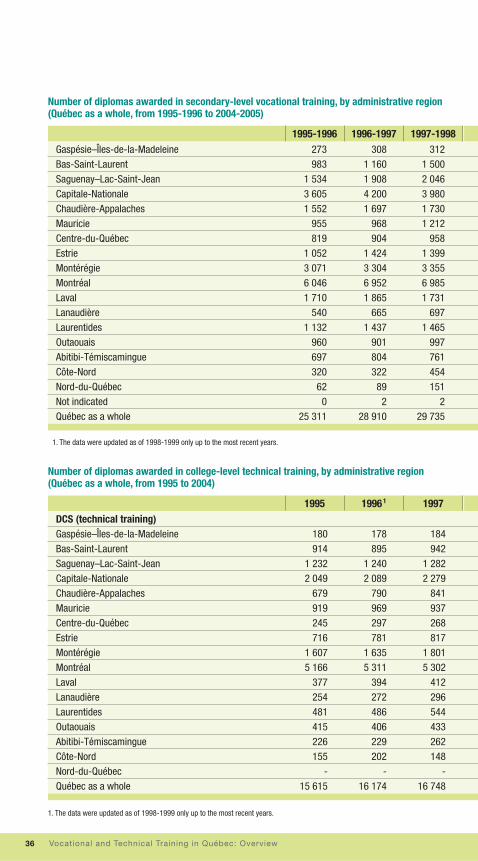
36 Vocational and Technical Training in Québec: Overview
Gaspésie–Îles-de-la-Madeleine 273 308 312
Bas-Saint-Laurent 983 1 160 1 500
Saguenay–Lac-Saint-Jean 1 534 1 908 2 046
Capitale-Nationale 3 605 4 200 3 980
Chaudière-Appalaches 1 552 1 697 1 730
Mauricie 955 968 1 212
Centre-du-Québec 819 904 958
Estrie 1 052 1 424 1 399
Montérégie 3 071 3 304 3 355
Montréal 6 046 6 952 6 985
Laval 1 710 1 865 1 731
Lanaudière 540 665 697
Laurentides 1 132 1 437 1 465
Outaouais 960 901 997
Abitibi-Témiscamingue 697 804 761
Côte-Nord 320 322 454
Nord-du-Québec 62 89 151
Not indicated 0 2 2
Québec as a whole 25 311 28 910 29 735
Number of diplomas awarded in secondary-level vocational training, by administrative region (Québec as a whole, from 1995-1996 to 2004-2005)
DCS (technical training)Gaspésie–Îles-de-la-Madeleine 180 178 184
Bas-Saint-Laurent 914 895 942
Saguenay–Lac-Saint-Jean 1 232 1 240 1 282
Capitale-Nationale 2 049 2 089 2 279
Chaudière-Appalaches 679 790 841
Mauricie 919 969 937
Centre-du-Québec 245 297 268
Estrie 716 781 817
Montérégie 1 607 1 635 1 801
Montréal 5 166 5 311 5 302
Laval 377 394 412
Lanaudière 254 272 296
Laurentides 481 486 544
Outaouais 415 406 433
Abitibi-Témiscamingue 226 229 262
Côte-Nord 155 202 148
Nord-du-Québec - - -
Québec as a whole 15 615 16 174 16 748
Number of diplomas awarded in college-level technical training, by administrative region(Québec as a whole, from 1995 to 2004)
1997-19981996-19971995-1996
19971996 11995
1. The data were updated as of 1998-1999 only up to the most recent years.
1. The data were updated as of 1998-1999 only up to the most recent years.

37Vocational and Technical Training in Québec: Overview
289 385 460 412 434 498 442
1 500 1 244 1 223 1 241 1 171 1 227 1 151
2 258 2 375 2 207 2 394 2 274 2 179 2 310
3 921 4 115 3 976 4 309 4 332 4 398 4 675
1 821 1 790 1 650 1 907 1 909 1 995 2 174
1 214 1 275 1 312 1 313 1 473 1 452 1 366
1 032 959 993 950 918 802 875
1 496 1 564 1 407 1 362 1 493 1 551 1 499
3 605 3 920 3 864 4 025 3 881 4 095 4 314
7 425 7 586 7 200 8 386 8 848 9 584 9 885
1 727 1 802 1 763 1 757 1 918 1 940 2 146
763 724 765 824 786 802 828
1 587 1 877 1 720 1 953 2 200 2 307 2 275
1 006 1 034 943 967 1 112 1 209 1 144
834 781 759 780 663 726 778
362 535 413 321 343 377 332
109 90 102 103 97 180 67
24 5 7 3 3 - -
30 973 32 061 30 764 33 007 33 855 35 322 36 261
The data for 2004 are preliminary.Source: MELS, Données diverses sur la formation professionnelle et technique, DRSI, November 2006
179 168 172 149 159 121 146
962 1 025 1 039 1 116 1 108 1 023 1 045
1 313 1 477 1 432 1 416 1 496 1 380 1 396
2 344 2 504 2 486 2 504 2 682 2 697 2 692
827 845 901 854 770 820 790
999 1 073 1 105 1 018 1 043 941 976
248 343 358 334 339 346 305
779 785 795 771 841 773 773
1 729 1 865 2 065 2 020 2 116 2 038 1 961
5 132 5 180 5 290 5 465 5 737 5 559 5 455
525 554 510 555 599 601 572
312 275 286 284 282 311 331
580 645 676 674 699 754 743
434 380 415 388 385 373 367
263 328 281 295 294 259 287
188 184 175 155 182 169 131
- - - - - - -
16 814 17 631 17 986 17 998 18 732 18 165 17 970
2004-20052003-20042002-20032001-20022000-20011999-20001998-1999 1
2003 200420022001200019991998
The data for 2004-2005 are preliminary.Source: MELS, Données diverses sur la formation professionnelle et technique, DRSI, November 2006
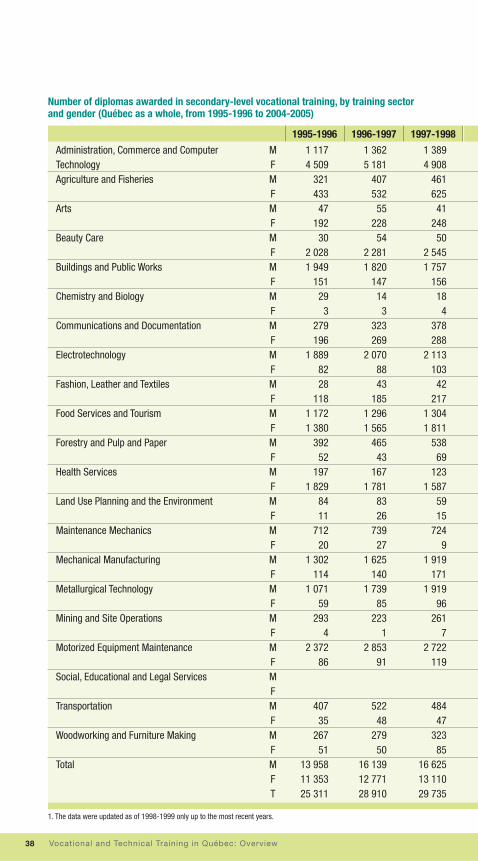
38 Vocational and Technical Training in Québec: Overview
Administration, Commerce and Computer M 1 117 1 362 1 389 Technology F 4 509 5 181 4 908 Agriculture and Fisheries M 321 407 461 F 433 532 625 Arts M 47 55 41 F 192 228 248 Beauty Care M 30 54 50 F 2 028 2 281 2 545 Buildings and Public Works M 1 949 1 820 1 757 F 151 147 156 Chemistry and Biology M 29 14 18 F 3 3 4 Communications and Documentation M 279 323 378 F 196 269 288 Electrotechnology M 1 889 2 070 2 113 F 82 88 103 Fashion, Leather and Textiles M 28 43 42 F 118 185 217 Food Services and Tourism M 1 172 1 296 1 304 F 1 380 1 565 1 811 Forestry and Pulp and Paper M 392 465 538 F 52 43 69 Health Services M 197 167 123 F 1 829 1 781 1 587 Land Use Planning and the Environment M 84 83 59 F 11 26 15 Maintenance Mechanics M 712 739 724 F 20 27 9 Mechanical Manufacturing M 1 302 1 625 1 919 F 114 140 171 Metallurgical Technology M 1 071 1 739 1 919 F 59 85 96 Mining and Site Operations M 293 223 261 F 4 1 7 Motorized Equipment Maintenance M 2 372 2 853 2 722 F 86 91 119 Social, Educational and Legal Services M F Transportation M 407 522 484 F 35 48 47 Woodworking and Furniture Making M 267 279 323 F 51 50 85 Total M 13 958 16 139 16 625 F 11 353 12 771 13 110 T 25 311 28 910 29 735
Number of diplomas awarded in secondary-level vocational training, by training sector and gender (Québec as a whole, from 1995-1996 to 2004-2005)
1997-19981996-19971995-1996
1. The data were updated as of 1998-1999 only up to the most recent years.

39Vocational and Technical Training in Québec: Overview
1 343 1 457 1 312 1 785 2 274 2 439 2 4005 197 5 425 4 629 4 548 4 784 5 096 5 393
506 449 454 539 529 505 394661 598 528 587 534 516 52369 43 42 30 51 46 46
372 373 286 359 344 347 35646 43 30 22 20 33 35
2 603 2 515 2 236 2 312 2 216 2 098 2 2242 010 2 171 2 308 2 453 2 891 3 554 3 906
187 253 252 297 343 402 39712 24 16 16 29 33 30
4 11 4 7 14 17 14361 349 328 333 381 335 287357 415 381 429 387 363 302
2 213 2 407 2 156 2 164 2 411 2 642 2 80199 130 112 122 109 119 12430 34 28 33 29 9 17
287 285 267 227 178 171 1301 269 1 235 1 121 1 099 1 095 1 123 1 1471 943 1 921 1 656 1 533 1 394 1 329 1 330
624 717 669 680 605 660 75491 110 94 87 80 93 68
103 158 213 268 341 409 5451 635 1 923 2 303 2 737 3 244 3 712 4 446
65 57 82 87 105 67 7629 23 24 37 35 31 25
897 890 756 841 783 707 66548 46 46 33 31 22 25
2 100 2 184 2 148 2 612 1 945 1 513 1 035221 262 322 340 305 219 160
1 698 1 557 1 657 1 685 1 600 1 399 1 239101 115 121 144 112 100 85276 289 315 368 363 416 480
7 12 8 16 13 12 182 244 2 144 2 109 1 983 1 992 2 375 2 432
111 94 108 74 118 126 151 3 6 1 2 2 1 8 24 22 26 38
568 732 850 1 210 1 179 1 194 1 19076 99 154 150 173 205 174
385 366 420 482 500 551 479125 141 205 253 294 308 318
16 819 17 309 17 020 18 691 19 125 20 010 19 96014 154 14 752 13 744 14 316 14 730 15 312 16 30130 973 32 061 30 764 33 007 33 855 35 322 36 261
2004-20052003-20042002-20032001-20022000-20011999-20001998-1999 1
The data for 2004-2005 are preliminary.Source: MELS, Données diverses sur la formation professionnelle et technique, DRSI, November 2006
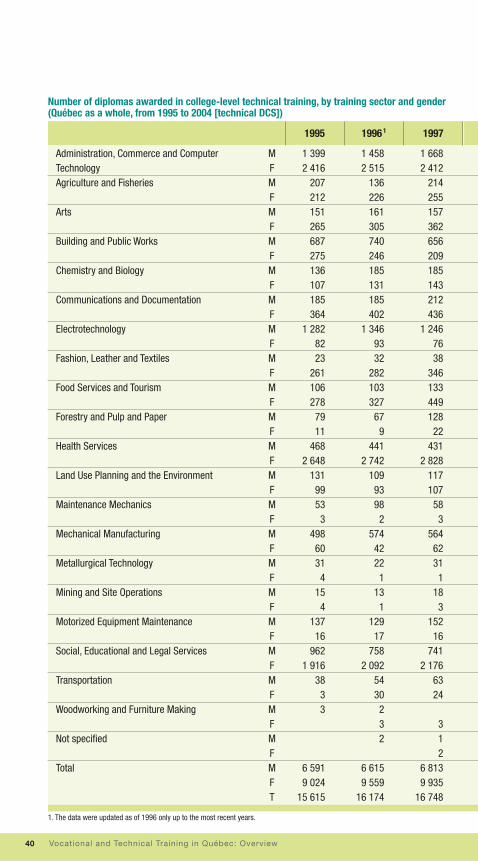
40 Vocational and Technical Training in Québec: Overview
Administration, Commerce and Computer M 1 399 1 458 1 668 Technology F 2 416 2 515 2 412 Agriculture and Fisheries M 207 136 214 F 212 226 255 Arts M 151 161 157 F 265 305 362 Building and Public Works M 687 740 656 F 275 246 209 Chemistry and Biology M 136 185 185 F 107 131 143 Communications and Documentation M 185 185 212 F 364 402 436 Electrotechnology M 1 282 1 346 1 246 F 82 93 76 Fashion, Leather and Textiles M 23 32 38 F 261 282 346 Food Services and Tourism M 106 103 133 F 278 327 449 Forestry and Pulp and Paper M 79 67 128 F 11 9 22 Health Services M 468 441 431 F 2 648 2 742 2 828 Land Use Planning and the Environment M 131 109 117 F 99 93 107 Maintenance Mechanics M 53 98 58 F 3 2 3 Mechanical Manufacturing M 498 574 564 F 60 42 62 Metallurgical Technology M 31 22 31 F 4 1 1 Mining and Site Operations M 15 13 18 F 4 1 3 Motorized Equipment Maintenance M 137 129 152 F 16 17 16 Social, Educational and Legal Services M 962 758 741 F 1 916 2 092 2 176 Transportation M 38 54 63 F 3 30 24 Woodworking and Furniture Making M 3 2 F 3 3 Not specified M 2 1 F 2 Total M 6 591 6 615 6 813 F 9 024 9 559 9 935 T 15 615 16 174 16 748
Number of diplomas awarded in college-level technical training, by training sector and gender (Québec as a whole, from 1995 to 2004 [technical DCS])
19971996 11995
1. The data were updated as of 1996 only up to the most recent years.

41Vocational and Technical Training in Québec: Overview
1 945 2 238 2 562 2 535 2 517 2 315 2 1462 541 2 905 2 792 2 537 2 260 2 044 1 802
183 175 218 186 210 201 194287 356 316 376 423 405 389161 177 168 171 188 170 168371 435 474 459 568 487 643562 544 413 423 447 462 493201 208 202 160 168 179 199207 219 199 192 150 126 117151 214 261 229 207 148 124211 228 212 218 255 295 319477 489 522 525 595 559 578
1 171 1 272 1 374 1 386 1 295 1 181 1 11975 101 87 103 106 99 6522 29 29 25 26 15 22
252 309 309 374 451 419 417121 132 128 109 122 97 116433 530 599 520 569 488 492134 159 162 183 182 151 13728 31 36 40 43 31 29
349 270 244 240 283 305 3182 736 2 121 2 088 2 334 2 962 3 316 3 198
124 96 101 96 122 85 9787 112 153 165 141 161 11776 117 95 100 99 101 96
3 7 5 3 7 9 3554 644 671 733 634 622 604
59 86 107 88 99 78 4826 20 31 31 39 25 343 3 6 9 7 6 3
17 43 36 39 31 12 138 9 18 8 10 12 7
142 173 140 156 147 128 14711 15 17 16 17 14 13
715 650 604 585 621 666 7362 273 2 386 2 478 2 460 2 514 2 592 2 801
64 67 68 103 102 95 9226 39 37 45 67 34 385 16 12 21 26 19 181 5 10 14 20 12 17
1 1 1 2 1 1 1 1 1
6 789 7 270 7 468 7 532 7 497 7 071 6 98610 025 10 361 10 518 10 466 11 235 11 094 10 98416 814 17 631 17 986 17 998 18 732 18 165 17 970
2004200320022001200019991998
The data for 2004 are preliminary.Source: MELS, Données diverses sur la formation professionnelle et technique, DRSI, November 2006
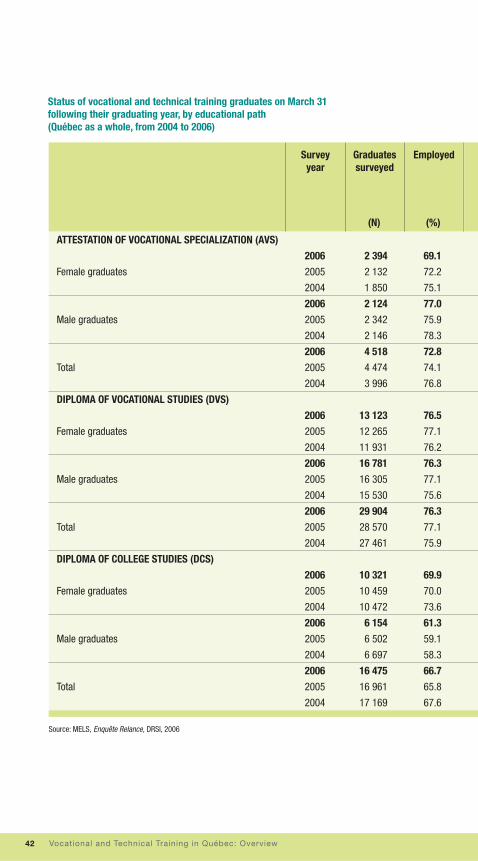
42 Vocational and Technical Training in Québec: Overview
EmployedGraduates surveyed
Survey year
Source: MELS, Enquête Relance, DRSI, 2006
ATTESTATION OF VOCATIONAL SPECIALIZATION (AVS)
2006 2 394 69.1
Female graduates 2005 2 132 72.2
2004 1 850 75.1
2006 2 124 77.0
Male graduates 2005 2 342 75.9
2004 2 146 78.3
2006 4 518 72.8
Total 2005 4 474 74.1
2004 3 996 76.8
DIPLOMA OF VOCATIONAL STUDIES (DVS)
2006 13 123 76.5
Female graduates 2005 12 265 77.1
2004 11 931 76.2
2006 16 781 76.3
Male graduates 2005 16 305 77.1
2004 15 530 75.6
2006 29 904 76.3
Total 2005 28 570 77.1
2004 27 461 75.9
DIPLOMA OF COLLEGE STUDIES (DCS)
2006 10 321 69.9
Female graduates 2005 10 459 70.0
2004 10 472 73.6
2006 6 154 61.3
Male graduates 2005 6 502 59.1
2004 6 697 58.3
2006 16 475 66.7
Total 2005 16 961 65.8
2004 17 169 67.6
(N) (%)
Status of vocational and technical training graduates on March 31 following their graduating year, by educational path (Québec as a whole, from 2004 to 2006)
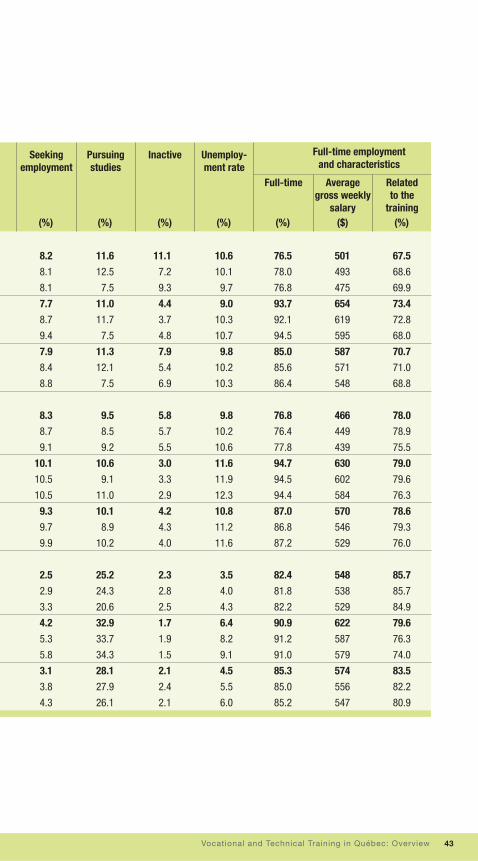
43Vocational and Technical Training in Québec: Overview
8.2 11.6 11.1 10.6 76.5 501 67.5
8.1 12.5 7.2 10.1 78.0 493 68.6
8.1 7.5 9.3 9.7 76.8 475 69.9
7.7 11.0 4.4 9.0 93.7 654 73.4
8.7 11.7 3.7 10.3 92.1 619 72.8
9.4 7.5 4.8 10.7 94.5 595 68.0
7.9 11.3 7.9 9.8 85.0 587 70.7
8.4 12.1 5.4 10.2 85.6 571 71.0
8.8 7.5 6.9 10.3 86.4 548 68.8
8.3 9.5 5.8 9.8 76.8 466 78.0
8.7 8.5 5.7 10.2 76.4 449 78.9
9.1 9.2 5.5 10.6 77.8 439 75.5
10.1 10.6 3.0 11.6 94.7 630 79.0
10.5 9.1 3.3 11.9 94.5 602 79.6
10.5 11.0 2.9 12.3 94.4 584 76.3
9.3 10.1 4.2 10.8 87.0 570 78.6
9.7 8.9 4.3 11.2 86.8 546 79.3
9.9 10.2 4.0 11.6 87.2 529 76.0
2.5 25.2 2.3 3.5 82.4 548 85.7
2.9 24.3 2.8 4.0 81.8 538 85.7
3.3 20.6 2.5 4.3 82.2 529 84.9
4.2 32.9 1.7 6.4 90.9 622 79.6
5.3 33.7 1.9 8.2 91.2 587 76.3
5.8 34.3 1.5 9.1 91.0 579 74.0
3.1 28.1 2.1 4.5 85.3 574 83.5
3.8 27.9 2.4 5.5 85.0 556 82.2
4.3 26.1 2.1 6.0 85.2 547 80.9
(%) (%) (%) (%) (%) ($) (%)
Related to the
training
Average gross weekly
salary
Full-time
Unemploy- ment rate
InactivePursuing studies
Seeking employment
Full-time employment and characteristics

44 Vocational and Technical Training in Québec: Overview
Response rate
Graduates surveyed
GenderTYPE OF DIPLOMA
Source: MELS, Enquête Relance, DRSI, 2006
Graduates under age 20
Male 3 049 75.0
Diploma of Vocational Studies (DVS) Female 1 897 70.4
Total 4 946 73.3
Male 123 74.8
Attestation of Vocational Specialization (AVS) Female 170 72.4
Total 293 73.4
Male 388 80.2
Diploma of College Studies (DCS) Female 685 76.4
Total 1 073 77.7
Graduates aged 20 to 24
Male 6 392 68.9
Diploma of Vocational Studies (DVS) Female 4 130 62.0
Total 10 522 66.2
Male 591 69.7
Attestation of Vocational Specialization (AVS) Female 462 64.1
Total 1 053 67.2
Male 4 587 71.4
Diploma of College Studies (DCS) Female 7 368 72.0
Total 11 955 71.8
Graduates aged 25 and over
Male 7 340 59.7
Diploma of Vocational Studies (DVS) Female 7 096 63.1
Total 14 436 61.4
Male 1 410 58.7
Attestation of Vocational Specialization (AVS) Female 1 762 62.2
Total 3 172 60.7
Male 1 179 62.4
Diploma of College Studies (DCS) Female 2 268 66.4
Total 3 447 65.1
Status of vocational and technical training graduates on March 31, 2006,by type of diploma, age group and gender (Québec as a whole)
(N) (%)

45Vocational and Technical Training in Québec: Overview
73.3 7.4 17.1 2.2 9.2 95.5 5 580 77.3
76.6 4.6 16.5 2.3 5.6 77.0 6 401 74.0
74.5 6.3 16.9 2.2 7.8 88.5 5 525 76.2
69.6 2.2 27.2 1.1 3.0 90.6 4 554 81.0
77.2 4.9 16.3 1.6 5.9 73.7 5 383 75.7
74.0 3.7 20.9 1.4 4.8 80.5 5 459 78.1
46.9 3.9 47.3 1.9 7.6 93.8 5 562 83.2
57.4 1.7 39.4 1.5 2.9 81.3 5 512 85.7
53.5 2.5 42.3 1.7 4.5 85.4 5 529 84.8
78.0 8.2 11.3 2.4 9.6 95.7 6 601 78.4
77.5 5.3 12.3 4.9 6.4 81.9 6 443 73.9
77.8 7.2 11.7 3.3 8.4 90.6 6 551 76.9
81.8 5.3 10.7 2.2 6.1 96.7 4 593 80.4
74.7 5.1 12.8 7.4 6.4 77.8 4 445 70.9
78.8 5.2 11.6 4.4 6.2 89.2 4 545 77.1
58.3 3.9 36.1 1.7 6.3 91.0 7 610 77.9
68.2 2.4 27.7 1.7 3.4 82.8 6 534 84.3
64.4 3.0 30.9 1.7 4.4 85.7 6 562 81.9
76.0 13.3 6.6 4.1 14.9 93.2 6 689 80.4
75.8 11.1 5.7 7.3 12.8 73.8 7 502 81.9
75.9 12.2 6.2 5.7 13.8 83.4 6 608 81.1
75.5 9.4 9.3 5.8 11.1 92.3 6 723 68.6
66.7 9.4 10.8 13.1 12.4 76.5 6 552 65.5
70.5 9.4 10.1 10.0 11.8 83.8 6 640 67.1
81.0 5.4 12.4 1.2 6.3 89.9 7 676 84.1
80.6 3.3 11.6 4.4 4.0 81.2 5 601 90.1
80.7 4.0 11.9 3.4 4.7 84.0 6 627 88.0
Employed Seeking employ-
ment
Pursuing studies
Inactive Unemploy- ment rate
Full-time Duration of survey
Average gross
weekly salary
Related to the
training
Full-time employment and characteristics
(%) (%) (%) (%) (%) (%) (weeks) ($) (%)
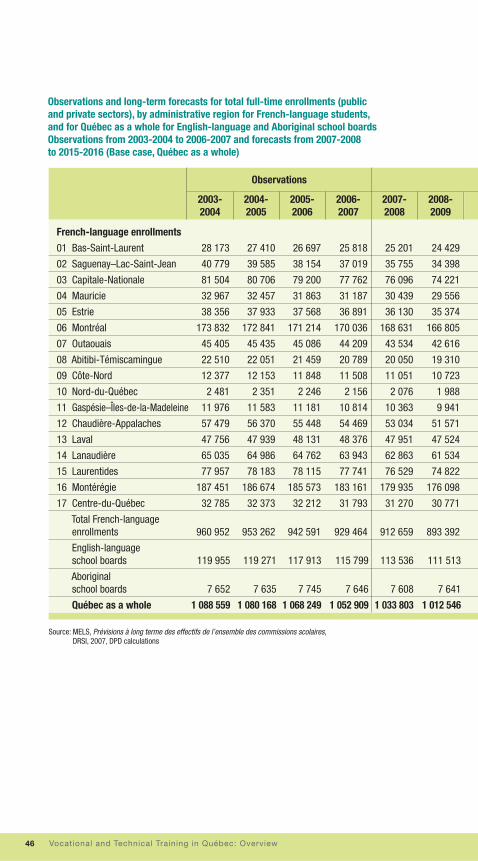
46 Vocational and Technical Training in Québec: Overview
Observations
2006- 2007
2003- 2004
2004- 2005
2005- 2006
2007- 2008
2008- 2009
Source: MELS, Prévisions à long terme des effectifs de l’ensemble des commissions scolaires, DRSI, 2007, DPD calculations
01 Bas-Saint-Laurent 28 173 27 410 26 697 25 818 25 201 24 429
02 Saguenay–Lac-Saint-Jean 40 779 39 585 38 154 37 019 35 755 34 398
03 Capitale-Nationale 81 504 80 706 79 200 77 762 76 096 74 221
04 Mauricie 32 967 32 457 31 863 31 187 30 439 29 556
05 Estrie 38 356 37 933 37 568 36 891 36 130 35 374
06 Montréal 173 832 172 841 171 214 170 036 168 631 166 805
07 Outaouais 45 405 45 435 45 086 44 209 43 534 42 616
08 Abitibi-Témiscamingue 22 510 22 051 21 459 20 789 20 050 19 310
09 Côte-Nord 12 377 12 153 11 848 11 508 11 051 10 723
10 Nord-du-Québec 2 481 2 351 2 246 2 156 2 076 1 988
11 Gaspésie–Îles-de-la-Madeleine 11 976 11 583 11 181 10 814 10 363 9 941
12 Chaudière-Appalaches 57 479 56 370 55 448 54 469 53 034 51 571
13 Laval 47 756 47 939 48 131 48 376 47 951 47 524
14 Lanaudière 65 035 64 986 64 762 63 943 62 863 61 534
15 Laurentides 77 957 78 183 78 115 77 741 76 529 74 822
16 Montérégie 187 451 186 674 185 573 183 161 179 935 176 098
17 Centre-du-Québec 32 785 32 373 32 212 31 793 31 270 30 771
Total French-language enrollments 960 952 953 262 942 591 929 464 912 659 893 392
English-language school boards 119 955 119 271 117 913 115 799 113 536 111 513
Aboriginal school boards 7 652 7 635 7 745 7 646 7 608 7 641
Québec as a whole 1 088 559 1 080 168 1 068 249 1 052 909 1 033 803 1 012 546
Observations and long-term forecasts for total full-time enrollments (public and private sectors), by administrative region for French-language students, and for Québec as a whole for English-language and Aboriginal school boardsObservations from 2003-2004 to 2006-2007 and forecasts from 2007-2008 to 2015-2016 (Base case, Québec as a whole)
French-language enrollments

47Vocational and Technical Training in Québec: Overview
Forecasts
23 714 23 195 22 749 22 439 22 155 21 968 21 869 -15.3%
33 129 32 098 31 452 30 768 30 232 29 806 29 599 -20.0%
72 336 70 811 69 781 68 825 67 947 67 497 67 218 -13.6%
28 676 27 929 27 335 26 766 26 333 26 057 25 953 -16.8%
34 655 34 164 33 815 33 583 33 456 33 441 33 596 -8.9%
165 069 163 602 162 112 160 710 159 728 159 000 158 997 -6.5%
41 565 40 798 40 315 39 959 39 792 39 654 39 718 -10.2%
18 534 18 024 17 589 17 167 16 716 16 445 16 225 -22.0%
10 509 10 270 10 087 9 812 9 559 9 366 9 175 -20.3%
1 874 1 788 1 700 1 641 1 585 1 542 1 502 -30.3%
9 475 9 082 8 771 8 449 8 182 7 957 7 801 -27.9%
50 402 49 446 49 135 48 710 48 429 48 341 48 463 -11.0%
47 004 46 399 45 855 45 371 45 068 44 885 44 943 -7.1%
60 298 59 026 58 102 57 243 56 746 56 608 56 874 -11.1%
73 365 72 145 71 197 70 631 70 289 70 277 70 651 -9.1%
172 519 169 752 167 496 165 760 164 500 163 881 164 156 -10.4%
30 226 29 869 29 634 29 356 29 271 29 193 29 225 -8.1%
875 025 860 041 848 743 838 791 831 578 827 504 827 554 -11.0%
109 182 107 471 105 651 103 920 102 903 102 265 102 232 -11.7%
7 601 7 633 7 608 7 640 7 648 7 648 7 685 0.5%
991 808 975 145 962 002 950 351 942 129 937 417 937 471 -11.0%
2015- 2016
2009- 2010
2010- 2011
2011- 2012
2012- 2013
2013- 2014
2014- 2015
Variation
2006-2007to
2015-2016

48 Vocational and Technical Training in Québec: Overview
Fore
cast
s
Sour
ce: M
ELS,
Sys
tèm
e pr
évis
ionn
el S
IPEE
C, D
RSI,
Sprin
g 20
06
01 B
as-S
aint
-Lau
rent
5
307
5 27
2 5
288
5 34
7 5
341
5 18
5 5
023
4 78
1 4
625
4 44
2 4
254
-19.
8%
02 S
ague
nay–
Lac-
Sain
t-Je
an
7 71
0 7
617
7 54
3 7
759
7 77
0 7
600
7 14
0 6
741
6 40
0 6
136
5 78
9 -2
4.9%
03 C
apita
le-N
atio
nale
17
621
17
893
18
595
19
417
19
821
19
719
19
172
18
456
17
885
17
168
16
371
-7
.1%
04 M
auric
ie
5 06
7 4
998
5 16
9 5
349
5 41
0 5
380
5 21
8 5
038
4 85
2 4
576
4 29
7 -1
5.2%
05 E
strie
6
321
6 49
5 6
855
7 08
6 7
233
7 04
6 6
846
6 67
1 6
593
6 41
1 6
181
-2.2
%
06 M
ontré
al
49 2
45
50 8
92
53 6
08
55 7
64
56 9
33
57 4
22
57 2
24
56 5
63
55 3
28
53 7
78
51 5
73
4.7%
07 O
utao
uais
4
487
4 83
6 5
203
5 53
1 5
706
5 61
9 5
463
5 23
9 5
006
4 83
3 4
672
4.1%
08 A
bitib
i-Tém
isca
min
gue
2 18
0 2
211
2 25
6 2
338
2 34
3 2
279
2 14
0 2
011
1 97
8 1
877
1 77
6 -1
8.5%
09 C
ôte-
Nord
1
188
1 18
1 1
211
1 25
7 1
246
1 22
0 1
168
1 11
0 1
070
1 01
6 98
4 -1
7.2%
10 N
ord-
du-Q
uébe
c 92
74
67
60
61
58
56
51
48
45
42
-5
4.3%
11 G
aspé
sie–
Îles-
de-la
-Mad
elei
ne
1 17
1 1
207
1 27
7 1
291
1 31
1 1
244
1 16
8 1
091
1 04
9 99
2 92
6 -2
0.9%
12 C
haud
ière
-App
alac
hes
5 39
9 5
272
5 43
8 5
585
5 64
2 5
522
5 24
1 5
057
4 92
0 4
747
4 54
4 -1
5.8%
13 L
aval
4
863
5 16
4 5
574
5 90
5 6
179
6 33
3 6
325
6 20
3 6
043
5 83
0 5
544
14.0
%
14 L
anau
dièr
e 3
952
4 22
1 4
461
4 66
3 4
847
4 97
6 4
913
4 74
7 4
561
4 33
8 4
051
2.5%
15 L
aure
ntid
es
6 99
1 7
587
8 32
5 8
980
9 41
3 9
627
9 61
1 9
367
9 03
7 8
729
8 33
0 19
.2%
16 M
onté
régi
e 17
272
17
795
18
586
19
556
20
100
20
147
19
659
19
101
18
459
17
771
16
878
-2
.3%
17 C
entre
-du-
Québ
ec
2 54
2 2
665
2 80
4 2
898
2 98
2 2
949
2 83
7 2
768
2 69
5 2
618
2 55
6 0.
6%
Qu
ébec
as
a w
hole
14
1 40
9 14
5 31
8 15
2 32
0 15
8 95
3 16
2 45
8 16
2 23
1 15
9 04
0 15
4 82
6 15
0 44
6 14
5 30
6 13
8 89
5 -1
.8%
Obse
rvat
ions
(200
5) a
nd fo
reca
sts
(200
6-20
15) f
or tr
ends
in e
nrol
lmen
ts in
full-
time
regu
lar c
olle
ge e
duca
tion,
by
adm
inis
trat
ive
regi
on (Q
uébe
c as
a w
hole
, pub
lic s
ecto
r)
2015
2006
2007
2008
2009
2010
2011
2012
2013
2014
Varia
tion
2005
- 20
15
Obs.
2005
Notes
49Vocational and Technical Training in Québec: Overview

50 Vocational and Technical Training in Québec: Overview


17-9
814A