voc emissions control from industrial and commercial sources dr. miriam lev-on the levon group, llc...
TRANSCRIPT
VOC Emissions Control from Industrial
and Commercial Sources
VOC Emissions Control from Industrial
and Commercial Sources
Dr. Miriam Lev-On
The LEVON Group, LLC
SP7: Current Control Strategies for Industrial EmissionsBAQ 2006, Yogyakarta, Indonesia, 13-15 December 2006

OutlineOutline Why Control VOCs ? What are the trends of
VOC Emissions? How can we control VOCs
and Air Toxics ?Large Stationary SourcesSmall Urban and Commercial Sources
Examples Summary

Why control VOCs ?Why control VOCs ?
VOCs are precursors to Ozone (smog) formationOzone is readily formed in the atmosphere by the reaction of VOCs and NOx in the presence of sunlight
VOCs are a blend of hundreds of volatile organic compounds some of which are chemically reactive,
Examples: ethylene, propylene, formaldehyde, xylene Some of the VOCs are known Hazardous Air
Pollutants (HAPs), or Air Toxics Examples: benzene, toluene, perchlorethlyene, methylene chloride
What are the Primary VOC Emitters?What are the Primary VOC Emitters?
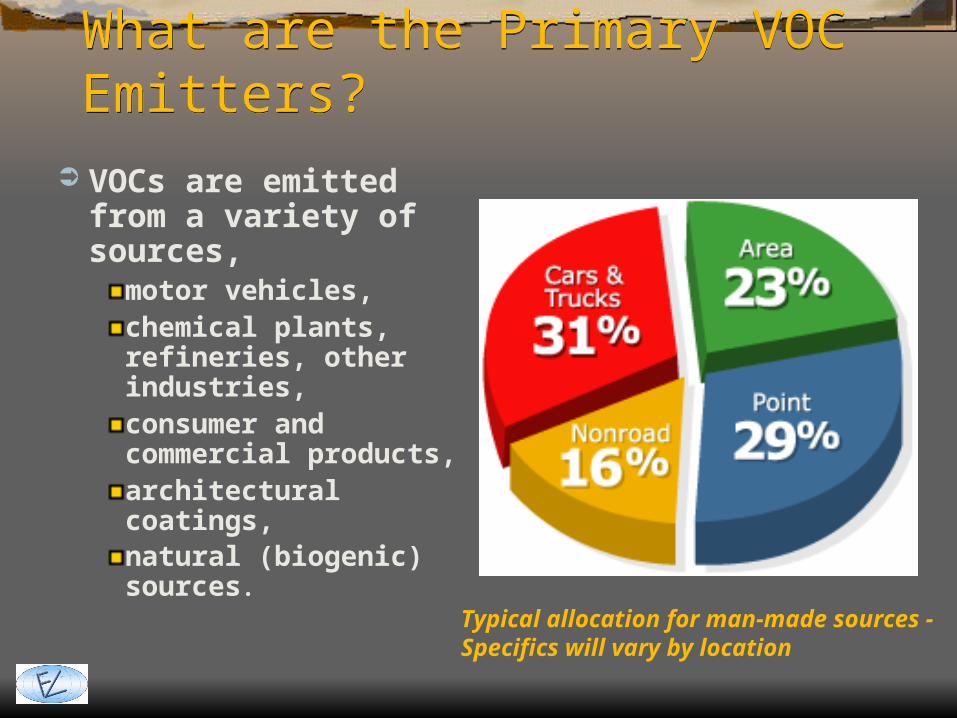
VOCs are emitted from a variety of sources,
motor vehicles, chemical plants, refineries, other industries, consumer and commercial products, architectural coatings, natural (biogenic) sources.
Typical allocation for man-made sources - Specifics will vary by location
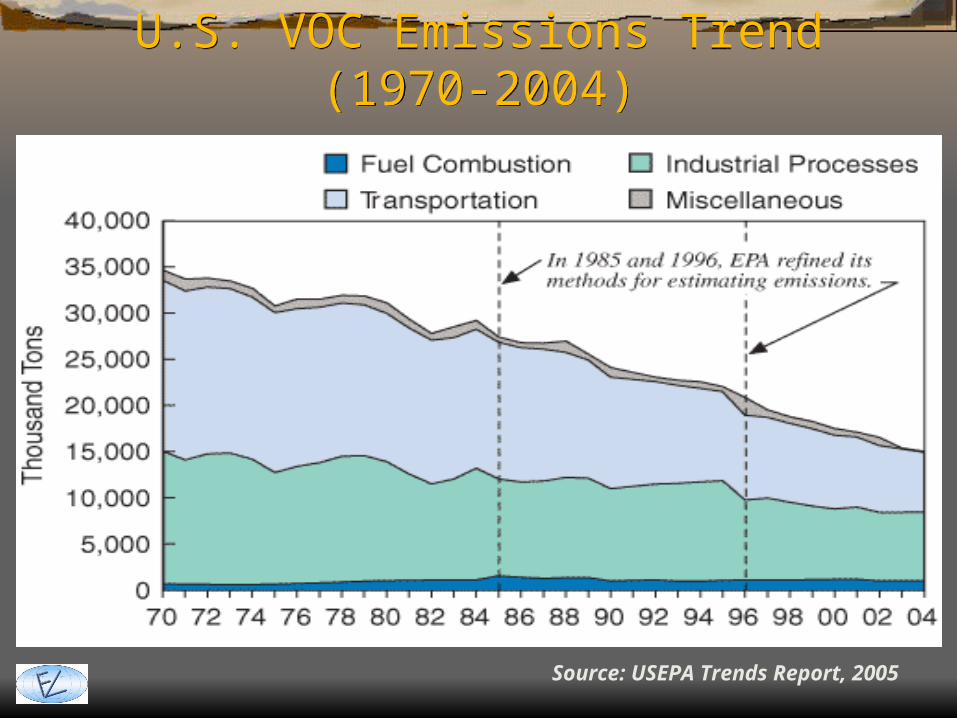
U.S. VOC Emissions Trend (1970-2004)
U.S. VOC Emissions Trend (1970-2004)
Source: USEPA Trends Report, 2005
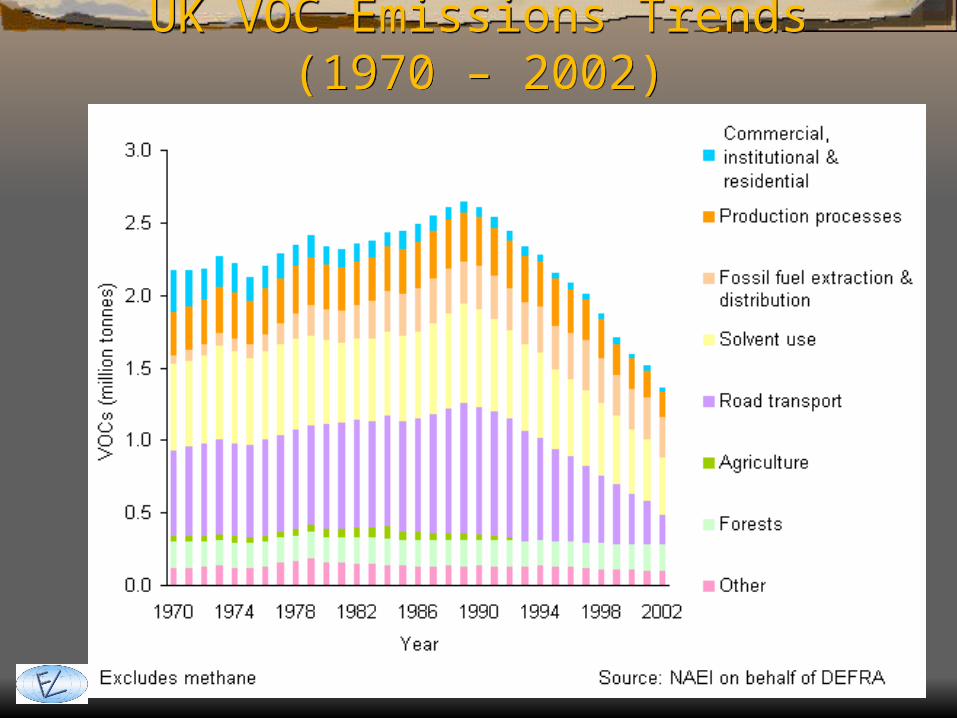
UK VOC Emissions Trends (1970 – 2002)
UK VOC Emissions Trends (1970 – 2002)

Asia VOC Emission Trends by Country
Asia VOC Emission Trends by Country
Asia VOC Trends
- 5.0 10.0 15.0 20.0 25.0 30.0 35.0 40.0 45.0
China
India
Indonesia
Japan
Korea
Sum (5-countries)
Region total
Million metric tons per year
2000
1995
1990
Source: WRI Earth Trends Data

Sources of VOC Emissions (1995)
Sources of VOC Emissions (1995)
0%
10%
20%
30%
40%
50%
60%
70%
80%
90%
100%
China Korea, Rep of Japan
Transport Fuel proc.& distr. Solvent useChemical Industry Combustion Other
Source: IIASA, 2004, RAINS simulation

VOC Emission Trends and Projections in East Asia
VOC Emission Trends and Projections in East Asia
(Mt VOC)
0
5
10
15
20
25
30
35
1990 1995 2030-CLE 2030-NFC
Mill
ion
tons
OtherCombustion (industry, residential)Chemical industrySolvent useFuel processing & distributionTransport
Source: IIASA, 2004, RAINS simulation
Hierarchy of Emission Control Strategies
Hierarchy of Emission Control Strategies
Reduce the volume, or eliminate emissions, of volatile organics including toxics by
process changes, substitution of materials, or other modifications;
Enclose systems or processes to eliminate emissions; Collect, capture, or treat these pollutants when
released from a process vent, stack, storage, or fugitive emissions sources;
Design equipment, implement work practice, or operational standards
requirements for operator training or certification

Stationary Source ControlsStationary Source Controls
Sources IFC Recommended Techniques (*)
Fugitive emissions from Process Equipment Leaks
Design modification, new process componentsLeak Detection and Repair (LDAR)Pressure balancing during cargo loading
Handling of chemicals in open vats and mixing processes
Substitution of less volatile substances Storage of materials with specially fitted roofsCollection of vapors through air extractors with possible treatment with selected devices
Collection of VOCs and treatment by destructive devices
Catalytic incinerators of exhaust gases exiting paint spray booths, ovens, and other process operationsThermal Incineration of gas stream at 700º to 1,300ºCEnclosed Oxidizing flares that are used to convert VOCs into CO2 and H2O by way of direct combustion
(*) IFC Draft General EH&S Guideline, September 2006
Example: Korea’s Paint VOC Content StandardExample: Korea’s Paint VOC Content Standard
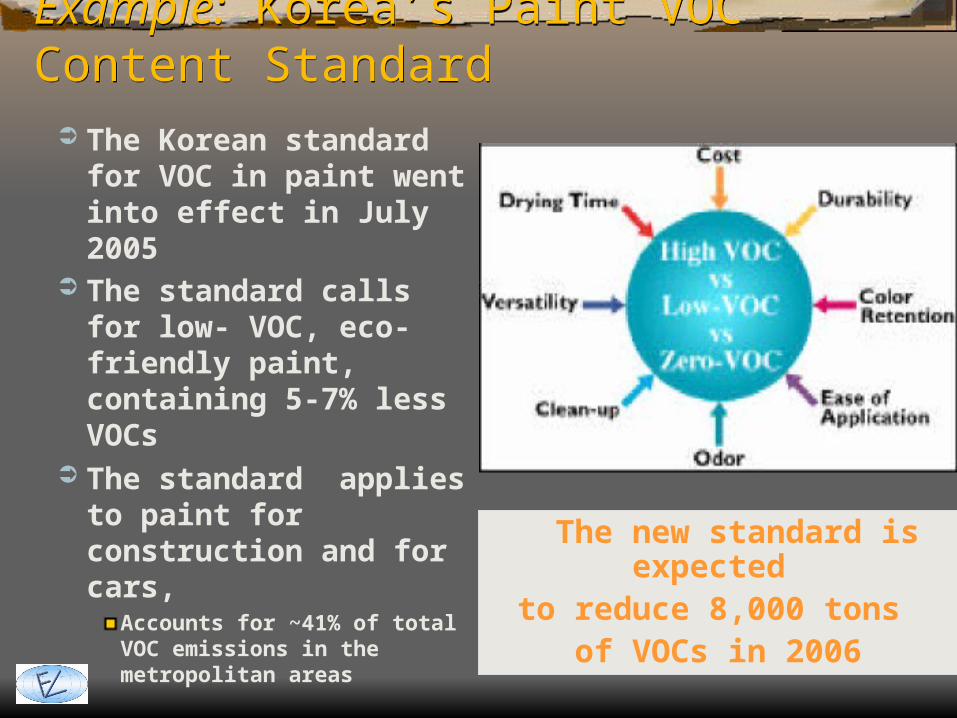
The Korean standard for VOC in paint went into effect in July 2005
The standard calls for low- VOC, eco-friendly paint, containing 5-7% less VOCs
The standard applies to paint for construction and for cars,
Accounts for ~41% of total VOC emissions in the metropolitan areas
The new standard is expected
to reduce 8,000 tons of VOCs in 2006

Example: VOC content in Adidas Footwear ManufacturingExample: VOC content in Adidas Footwear Manufacturing Corporate Commitment since 2000 to reduce VOC emissions in footwear
factories in Asia due to solvents used in manufacturing process Target: an average of 20 grams/pair of shoes Footwear suppliers have reduced VOC emissions from 140 grams/pair in
2000 to 20.5 grams/pair in 2005 Graphical depiction of monthly average for supplier from China, Vietnam
and Indonesia (~ 95% of supply)

SummarySummary It is important to reduce VOC emissions in order to minimize
smog formation and population exposure to potentially toxic compounds,
It takes political will as well as technical know-how to develop VOC reduction measures that are appropriate for the myriad of sources - large and small,
Product reformulation and emission containment have proven to be the most successful VOC reduction strategies,
The Air & Waste Management Association is in a position to help by providing technical information exchange; training courses; engineering manuals; and specialty conferences
http://www.awma.org