vmware view performance study best practices technical white paper
TRANSCRIPT

VMware View® 5.0
Performance and Best
Practices
Performance Study
T E C H N I C A L W H I T E P A P E R

T E C H N I C A L W H I T E P A P E R / 2
VMware View 5.0 Performance and Best Practices
Table of Contents
Introduction ..................................................................................................................................................... 4
View 5.0 New Features ................................................................................................................................... 5
End User Experience Monitoring ................................................................................................................ 5
Support for 3D Graphics ............................................................................................................................. 5
Continuity Services..................................................................................................................................... 5
Performance Improvements in View 5.0 ......................................................................................................... 5
PCoIP Protocol Improvements ................................................................................................................... 5
Platform Improvements with VMware vSphere 5.0..................................................................................... 5
CPU Scheduler ...................................................................................................................................... 5
Memory Footprint Reduction ................................................................................................................. 5
Conservative Ballooning ........................................................................................................................ 6
PCoIP Protocol Improvements in View 5.0 ...................................................................................................... 6
Bandwidth Improvements ........................................................................................................................... 6
Lossless Codec Optimizations ............................................................................................................... 6
Client-side Caching ................................................................................................................................ 6
Build-to-Lossless ................................................................................................................................... 7
Overall Bandwidth Reductions ............................................................................................................... 8
CPU Improvements .................................................................................................................................... 8
Idle CPU Usage ..................................................................................................................................... 8
Code Optimization ................................................................................................................................. 8
SIMD Acceleration ................................................................................................................................. 9
Performance Results – View PCoIP Improvements ........................................................................................ 9
Experimental Setup .................................................................................................................................... 9
Network Conditions ................................................................................................................................ 9
Performance Metrics ............................................................................................................................ 10
Workload.............................................................................................................................................. 10
Performance Improvements Compared to View 4.5 ................................................................................. 10
Application Response Time ................................................................................................................. 10
Bandwidth Usage.................................................................................................................................. 11
CPU Usage ........................................................................................................................................... 11
Comparison with Other Remote Display Protocols .................................................................................. 12
Response Time .................................................................................................................................... 13
Bandwidth Usage................................................................................................................................. 13
CPU Usage .......................................................................................................................................... 14
Performance Results – vSphere 5.0 Platform Improvements ....................................................................... 15
Comparison with View 4.5 ........................................................................................................................ 15

T E C H N I C A L W H I T E P A P E R / 3
VMware View 5.0 Performance and Best Practices
CPU Usage .......................................................................................................................................... 15
Memory Overhead Reduction .................................................................................................................. 16
Storage ..................................................................................................................................................... 17
View Composer ........................................................................................................................................ 18
View 5.0 Best Practices ................................................................................................................................ 19
Platform best practices ............................................................................................................................. 19
CPU Consolidation .............................................................................................................................. 19
Memory Consolidation ......................................................................................................................... 19
Storage ................................................................................................................................................ 20
Guest Best Practices ................................................................................................................................ 20
View PCoIP Best Practices ...................................................................................................................... 21
Network optimizations .............................................................................................................................. 23
Conclusion .................................................................................................................................................... 24
References .................................................................................................................................................... 25
About the Authors .......................................................................................................................................... 25
Acknowledgements .................................................................................................................................. 25

T E C H N I C A L W H I T E P A P E R / 4
VMware View 5.0 Performance and Best Practices
Introduction VMware View liberates the end user identity from being locked to a particular system and enables anywhere
computing. It transforms IT by simplifying and automating desktop management. IT administrators can
compose virtual desktops on demand, based on locations and profiles, and can deliver at any time to
desktops and devices anywhere. As shown in Figure 1, by centrally maintaining desktops, applications, and
data, VMware View reduces costs, improves security, and, at the same time, increases availability and
flexibility for end users.
Figure 1. View Architecture Diagram
VMware View 5 offers the best end-user experience and performance over LAN, WAN, and extreme WAN.
The VMware View PCoIP display protocol’s adaptive technology provides an optimized virtual desktop
delivery on both the LAN and the WAN. View 5 addresses the broadest list of use cases and deployment
options with a single protocol and enables access to personalized virtual desktops complete with
applications and end-user data and settings anywhere and at any time. View 5 also reduces the overall
costs of desktop computing by centralizing management, administration, and resources and by removing IT
infrastructure from remote offices.
T E C H N I C A L W H I T E P A P E R / 5
VMware View 5.0 Performance and Best Practices
View 5.0 New Features In addition to the significant performance optimizations that are discussed in later sections, VMware View 5
also introduces a number of new key features.
End User Experience Monitoring
View 5 provides users easy access to key PCoIP protocol performance metrics. There are over 30 individual
statistics collected, ranging from imaging statistics to network bandwidth information. Not only do these
metrics allow users and administrators to use WMI based tools, such as perfmon, to quickly troubleshoot
individual desktop issues, but these metrics are available to VMware vCenter Operations and other third
party management solutions to provide improved monitoring fidelity.
Support for 3D Graphics
VMware vSphere 5 introduced support for non-hardware accelerated 3D graphics in VMs (support is
provided for DirectX 9 and OpenGL 2.1). View 5 takes full advantage of this support, enabling basic 3D
applications in View desktops like Aero, Office 2010, or those requiring OpenGL or DirectX without the need
for specialized graphics cards or client devices.
Continuity Services
View 5 delivers a seamless end-user experience regardless of network reliability. The PCoIP protocol
automatically detects network interruptions and automatically attempts to reconnect the session. The PCoIP
protocol will try for up to 30 seconds to reconnect the session, eliminating the requirement to re-launch and
re-authenticate sessions as a result of temporary network interruptions. Additionally, continuity services
provide better session resilience in networks with high packet loss.
Performance Improvements in View 5.0
PCoIP Protocol Improvements
In View 5.0, there are significant performance improvements in PCoIP protocol including, WAN optimizations
with substantial bandwidth reduction and reduced CPU usage. These improvements are discussed in detail
in subsequent sections.
Platform Improvements with VMware vSphere 5.0
VMware vSphere 5.0 brings with it some great performance improvements which allow more desktops to be
consolidated on a single ESXi server.
CPU Scheduler
VMware has improved CPU scheduling for desktop workloads especially on hyper-threaded processors. The
result is that desktop workloads have good out-of-the-box performance on ESXi servers. In vSphere 4.1, an
advanced scheduler option was required to get the best performance for desktop workloads (KB 1020233),
but this is no longer necessary with vSphere 5.0.
Memory Footprint Reduction
In addition to the VRAM assigned to a virtual machine, ESXi maintains book-keeping memory on behalf of a
virtual machine. In vSphere 5.0, the book-keeping memory scheme has changed by allocating memory on
demand and by implementing a swap mechanism which lets more of the guest VRAM to stay in the main

T E C H N I C A L W H I T E P A P E R / 6
VMware View 5.0 Performance and Best Practices
memory. The footprint reduction is as much as 60%, which leads to a better consolidation ratio.
Conservative Ballooning
In vSphere 5.0, the ballooning mechanism was changed to a more conservative one compared to vSphere
4.1. In vSphere 4.1 and earlier, the balloon driver in the virtual machines used to get activated when the
system free memory dropped below 6% of the total memory. On servers with a large amount of main
memory, 6% free memory is sufficiently large that ballooning is not really required. Hence vSphere 5.0
implements a slab-based ballooning mechanism that keeps the threshold at 6% for machines with less
memory and as low as 1% for machines with a large amount of memory. This greatly improves VM
consolidation on large servers.
PCoIP Protocol Improvements in View 5.0 VMware View 5.0 introduces a variety of important optimizations to the PCoIP protocol that deliver a
significant reduction in the PCoIP protocol's resource utilization, benefiting users in almost all usage
scenarios. Broadly speaking, these optimizations fall into two broad categories: bandwidth optimizations and
compute optimizations.
Bandwidth Improvements
Controlling network bandwidth utilization is obviously a key consideration for VDI display protocols. This is
especially true in the WAN environment, where network bandwidth can be a relatively scarce and highly
shared resource. View 5.0 makes significant improvements in the efficiency with which the PCoIP protocol
consumes this resource, while maintaining user experience. In many typical office user environments,
bandwidth consumption is reduced by up to 75% (around 4X improvement). In the following section, the
optimizations that deliver these gains are discussed.
Lossless Codec Optimizations
In the VDI environment, a user’s screen is frequently composed of many forms of content, including icons,
graphics, motion video, photos, and text. It is the responsibility of the VDI display protocol to actively monitor
the type of content the user is viewing and dynamically manage the compression algorithms utilized for each
screen region to ensure the best user experience. For instance, naively applying lossy compression
techniques to text-orientated content can result in blurred text edging, which can be very noticeable to users.
Accordingly, the PCoIP protocol uses an efficient lossless compression algorithm that has been developed
with text compression as a key consideration in order to minimize both bandwidth and CPU utilization.
With View 5.0, PCoIP protocol debuts a major enhancement to its lossless compression codec. The
improved lossless compression algorithm delivers both greater compression ratios and improved
robustness. As an example, the improved algorithm delivers twice the compression of its predecessor when
applied to content containing anti-aliased fonts (for example, ClearType).
If you consider the desktop belonging to the typical office user, there’s frequently significant text content—
text on web pages, emails, presentations, and PDF documents. Accordingly, a significant proportion of the
imaging data being transmitted to the client device is frequently compressed using lossless compression
algorithms. As a result, View 5.0’s improved lossless compression algorithm delivers a 30% to 40%
reduction in bandwidth consumption for typical office user workflows.
Client-side Caching
PCoIP protocol is tasked, among its many responsibilities, with efficiently communicating desktop screen
updates to the client device for local display. In many instances, only a small region of the screen may
change. VDI protocols such as PCoIP protocol perform spatial filtering and only send information related to
T E C H N I C A L W H I T E P A P E R / 7
VMware View 5.0 Performance and Best Practices
the portion of the screen that changed (rather than naively sending the entire screen). However, in additional
to spatial filtering, temporal analysis can also be performed. For instance, consider minimizing an
application, dragging a window, flicking through a slide-set, or even scrolling through a document. In all
these examples, each successive screen update will be largely composed of previously seen (potentially
shifted) pixels. As a result, if the client device maintains a cache of previously seen image blocks, PCoIP
protocol can deliver significant bandwidth savings by merely encoding these portions of the screen update
as a series of cache indices rather than retransmitting the blocks.
View 5.0 introduces a client-side image cache, providing bandwidth savings of 30% in many instances (of a
typical office user’s workflow). This cache is not merely a simple fixed position cache, but captures both
spatial and temporal redundancy in the screen updates. In addition to providing bandwidth optimizations for
obvious operations (for example, window minimize/maximize, start menu), the image cache also significantly
reduces the bandwidth consumption for many interactive operations, such as scrolling and window dragging,
ensuring smooth, highly responsive operations even in WAN environments with very constrained bandwidth.
For instance, consider scrolling through a PDF document. As we scroll down, new content appears along
the bottom edge of the window, and the oldest content disappears from the top edge. All the other content in
the application window remains essentially constant merely shifted upward. The PCoIP protocol image
cache is capable of detecting this spatial and temporal redundancy. As a result, for scrolling operations, the
display information sent to the client device is primarily just a sequence of cache indices—delivering
significant bandwidth savings.
This efficient scrolling has a couple of key benefits;
On LAN networks, where bandwidth is relatively unconstrained, there’s sufficient bandwidth available for
high quality scrolling even when client-side caching is disabled. In these situations, enabling client-side
image caching delivers significant bandwidth savings—experimenting with a variety of different
applications and content types (text heavy, image heavy, and so on), we see bandwidth reductions of
over 4X (compared with caching disabled. mileage may vary, but we see this fairly consistently).
On WAN networks, where bandwidth is fairly scarce, when client-side caching is disabled, scrolling
performance is often degraded to stay within the available bandwidth. In these situations, in addition to
bandwidth reductions (which vary based on the degree to which scrolling performance is degraded when
client-side caching is disabled), client-side caching also ensures smooth, highly responsive scrolling
operations even in WAN environments with very constrained bandwidth.
Build-to-Lossless
In combination, the compression improvements and image caching deliver bandwidth savings of around
60% (a 2.5X improvement) out-of-the-box in both LAN and WAN use cases for typical office users.
Additional bandwidth improvements can be obtained in View 5.0 by leveraging the new image quality
controls that have been introduced. By default, PCoIP protocol will build to a lossless image—when a screen
update occurs, PCoIP will almost immediately transmit an initial image for display on the client. In rapid
succession PCoIP will continue to refine the client’s image until a high quality lossy image is achieved. In
PCoIP vernacular, this is termed building to a ―perceptually lossless‖ image. If the screen remains constant,
PCoIP will, in the background, continue to refine the image on the client until a lossless image is obtained
(that is, PCoIP builds to lossless (BTL)). In certain application-spaces, building to a lossless image is a key
feature. However, for many office users, the BTL support can be disabled without impact on image quality
(indeed, in many cases it is almost impossible to discern any quality difference). And disabling BTL can
deliver significant bandwidth savings—in many situations disabling BTL will provide up to around 30%
reduction in bandwidth.
In many situations, the difference between fully lossless and perceptually lossless images can be virtually
impossible to discern. This can be visually apparent, as illustrated in Figure 2, which shows a zoom-in of two
small images. For both images, View fully lossless and View BTL images are shown side-by-side for
comparison, clearly illustrating how difficult it is, even when zoomed, to see differences.

T E C H N I C A L W H I T E P A P E R / 8
VMware View 5.0 Performance and Best Practices
Figure 2. Comparing Fully Lossless and Perceptually Lossless Image Quality
In addition to qualitative analysis, a more quantitative analysis with PSNR (peak signal to noise ratio) and
RMS (root-mean-square) error data is also interesting. For a fairly complex image—a fall-colors landscape
with significant fine detail in the background tree colors—comparing the perceptually lossless build to a fully
lossless build (RGB space), yields a PSNR value of 45.8dB, and RMS error value of 1.3. This clearly
illustrates how little loss in quality is associated with perceptually lossless images. For instance, consider the
RMS error of 1.3; for 32-bit colors, each RGBA component has 8-bits of precision, with values ranging from
0 to 255. For this image, perceptually lossless is introducing an average error of +/-1.3 to these values—
fairly negligible for most use cases.
Overall Bandwidth Reductions
Combining the compression improvements, client caching and disabling BTL commonly delivers a
bandwidth improvement of up to 75% (a 4X improvement), for typical office workloads.
CPU Improvements
In VDI environments, desktop consolidation is a key consideration. The more user desktops that can be
handled per system (that is, the higher the consolidation ratio), the better the cost savings that can be
realized for the VDI deployment. Accordingly, the CPU overheads introduced by the VDI protocol must be
carefully constrained. With View 5.0, PCoIP protocol has been further enhanced to minimize its CPU
overhead in a number of significant ways.
Idle CPU Usage
From the VDI protocol’s perspective, unless the user is viewing a video, the user is idle for a large proportion
of the time. For instance, if a user loads a new web page, there is a flurry of activity as the web page loads
and the screen update is displayed, but many seconds or even minutes may elapse with the screen
remaining static, as the user reads the content of the page. For a VDI protocol, it is not only important to
encode any screen changes efficiently, but to minimize the overheads associated with all background
activities that occur during these idle periods. With View 5.0, VMware has significantly optimized these code
paths, and PCoIP protocol’s idle CPU consumption is now negligible. Further, the session keep-alive
(heartbeat) bandwidth has been reduced by a factor of 2 for many workloads.
Code Optimization
In View 5.0, many of the hottest image processing and compression functions have been reexamined, their

T E C H N I C A L W H I T E P A P E R / 9
VMware View 5.0 Performance and Best Practices
algorithms tweaked for efficiency and their implementations further optimized.
SIMD Acceleration
Image manipulation operations are typically suitable to acceleration via the use of SIMD (Single Instruction
Multiple Data) instructions, such as the SSE instructions supported on recent x86 processors. With View 5.0,
PCoIP protocol has been optimized to take even greater advantage of the SSE SIMD support available on
x86 processors, not only providing an expanded coverage of the code base, but also, when available,
leveraging the SSE instructions available on the very latest processors (for example, SSE 4.2 and AES-NI).
Performance Results – View PCoIP Improvements In this section, we present the performance results on View 5.0 PCoIP improvements. In the next section,
we present the performance improvements in View due to integration with vSphere 5.0 platform.
The following sections first present the details of the experimental setup used to analyze the performance
improvements, followed by the results comparing View 5.0 to View 4.5. Also presented is a comparative
study of different remote display protocols including Citrix PortICA (XenDesktop 5.0) and Microsoft RDP
(RDP 7.0).
Experimental Setup
All the protocol experiments used the same setup, which is shown in Figure 3. An IBM blade with a 2.53GHz
Intel Xeon 5400 processor and 32GB physical memory hosted the desktop VM. This blade was connected to
an NFS storage array. The desktop VM ran Windows 7 32-bit with 1 vCPU and 1GB of virtual memory. For
the comparison study, a screen resolution of 1152 x 864 was used. A Windows XP 32-bit client connected to
a remote desktop with the PCoIP protocol. The build-to-lossless (BTL) setting in PCoIP protocol was
disabled to build to perceptually lossless quality (which is hard to differentiate from a fully lossless quality for
an office user workload).
Figure 3. Experimental Setup for Comparing Remote Display Protocols Performance
Network Conditions
Since the remote desktop can be accessed from a main office, branch office, or home office, the network
T E C H N I C A L W H I T E P A P E R / 1 0
VMware View 5.0 Performance and Best Practices
conditions will be significantly different in all these cases. Therefore, three typical network conditions were
used as shown in the experimental setup diagram.
LAN – Plentiful bandwidth available with almost no latency.
WAN – Bandwidth is limited (2 Mbps) and there is 100ms round-trip latency.
Extreme WAN – Bandwidth is severely limited (300 kbps) and there is 100ms round-trip latency.
Performance Metrics
In a typical VDI deployment, it is important to consider:
1) How many users can be supported on a given hardware platform and a network link
2) How to minimize the cost of the deployment
3) How to maximize the VDI user experience
For (1) user consolidation and (2) costs, the numbers of users per CPU core are relevant to look at. This
number represents the guest CPU usage for a typical office user workload. For (2) costs and (3) better user
experience, the application response time and the bandwidth usage for WAN environments need to be
examined. So, from a performance perspective, three important metrics that stand out are:
Application response time – To measure the user experience
Bandwidth usage – How many users can be supported on a shared network link
CPU usage – How many users can be supported per core on a given platform
Workload
For all the experiments, we have used VMware View Planner, a workload generator that simulates typical
office user operations, such as typing a word in MS Word, playing a PowerPoint slideshow, reading Outlook
emails, browsing PDF pages, browsing Web pages, watching video, and so on. More details about the View
Planner are described in the VMware View Planner user guide [5].
Performance Improvements Compared to View 4.5
The VMware View Planner workload was run for three network conditions (LAN, WAN, and extreme WAN)
for both View 4.5 and View 5.0. Performance results were collected including application response time,
downlink bandwidth usage, and the guest CPU usage. Chart data shows results that were normalized to the
―maximum‖ values seen in View 4.5 and View 5.0 in all network conditions. For example, if View 4.5 with a
LAN configuration had the highest bandwidth usage, then it is normalized to 1.0 and other values are scaled
with respect to that. In this example, View 4.5 with LAN is used as the baseline for comparison.
Application Response Time
To maximize the user experience, a lower application response time is needed in any network conditions.
Due to recent bandwidth improvements, better response times are seen with the PCoIP protocol in extreme
WAN conditions. The normalized response time comparing View 5.0 and View 4.5 is shown in Figure 4.
T E C H N I C A L W H I T E P A P E R / 1 1
VMware View 5.0 Performance and Best Practices
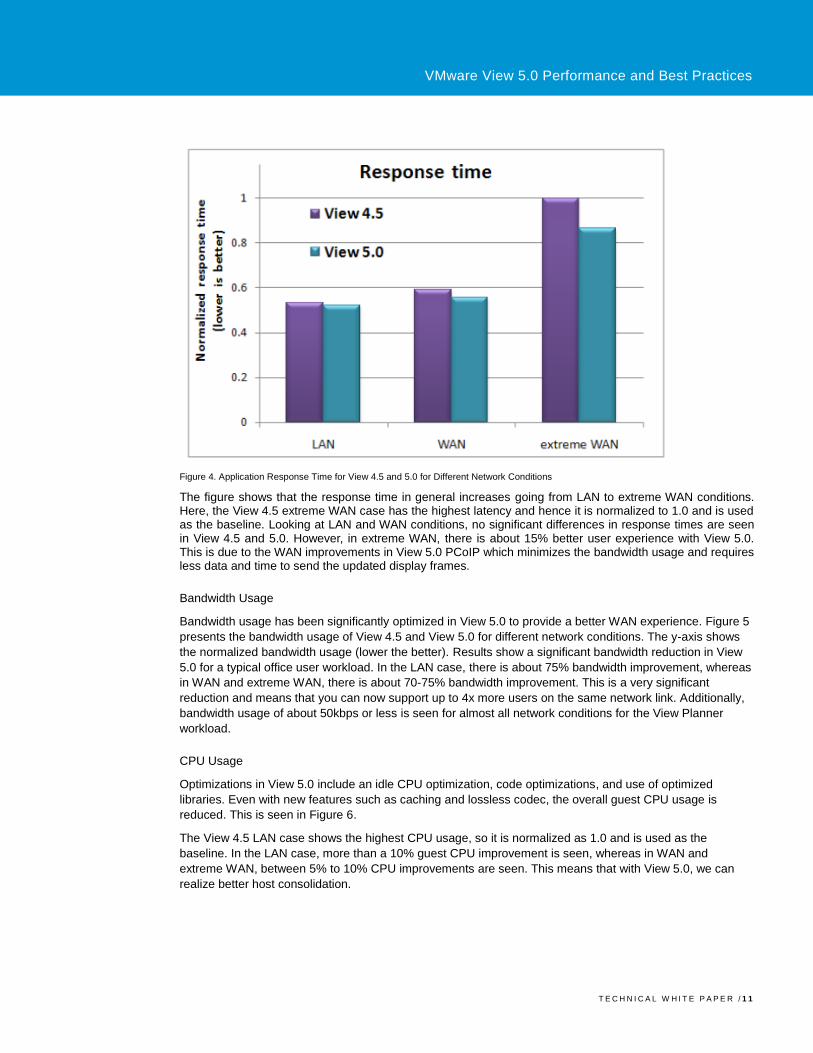
Figure 4. Application Response Time for View 4.5 and 5.0 for Different Network Conditions
The figure shows that the response time in general increases going from LAN to extreme WAN conditions. Here, the View 4.5 extreme WAN case has the highest latency and hence it is normalized to 1.0 and is used as the baseline. Looking at LAN and WAN conditions, no significant differences in response times are seen in View 4.5 and 5.0. However, in extreme WAN, there is about 15% better user experience with View 5.0. This is due to the WAN improvements in View 5.0 PCoIP which minimizes the bandwidth usage and requires less data and time to send the updated display frames.
Bandwidth Usage
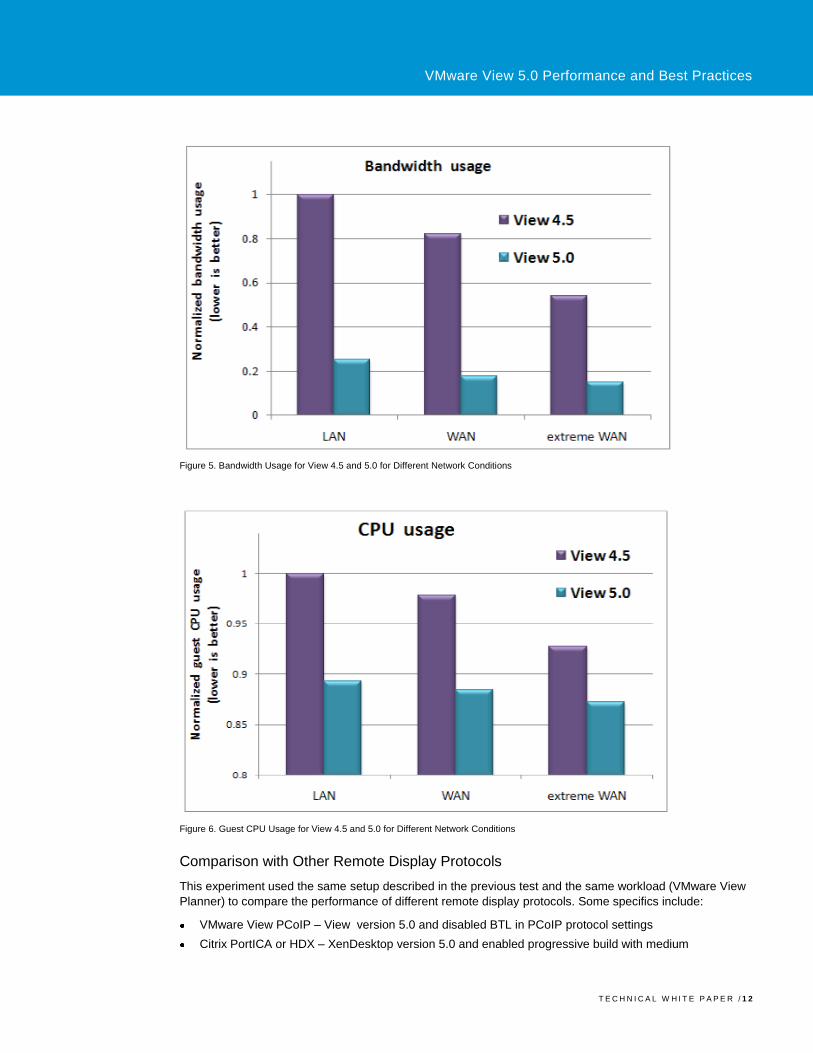
Bandwidth usage has been significantly optimized in View 5.0 to provide a better WAN experience. Figure 5
presents the bandwidth usage of View 4.5 and View 5.0 for different network conditions. The y-axis shows
the normalized bandwidth usage (lower the better). Results show a significant bandwidth reduction in View
5.0 for a typical office user workload. In the LAN case, there is about 75% bandwidth improvement, whereas
in WAN and extreme WAN, there is about 70-75% bandwidth improvement. This is a very significant
reduction and means that you can now support up to 4x more users on the same network link. Additionally,
bandwidth usage of about 50kbps or less is seen for almost all network conditions for the View Planner
workload.
CPU Usage
Optimizations in View 5.0 include an idle CPU optimization, code optimizations, and use of optimized
libraries. Even with new features such as caching and lossless codec, the overall guest CPU usage is
reduced. This is seen in Figure 6.
The View 4.5 LAN case shows the highest CPU usage, so it is normalized as 1.0 and is used as the
baseline. In the LAN case, more than a 10% guest CPU improvement is seen, whereas in WAN and
extreme WAN, between 5% to 10% CPU improvements are seen. This means that with View 5.0, we can
realize better host consolidation.
T E C H N I C A L W H I T E P A P E R / 1 2
VMware View 5.0 Performance and Best Practices
Figure 5. Bandwidth Usage for View 4.5 and 5.0 for Different Network Conditions
Figure 6. Guest CPU Usage for View 4.5 and 5.0 for Different Network Conditions
Comparison with Other Remote Display Protocols
This experiment used the same setup described in the previous test and the same workload (VMware View
Planner) to compare the performance of different remote display protocols. Some specifics include:
VMware View PCoIP – View version 5.0 and disabled BTL in PCoIP protocol settings
Citrix PortICA or HDX – XenDesktop version 5.0 and enabled progressive build with medium
T E C H N I C A L W H I T E P A P E R / 1 3
VMware View 5.0 Performance and Best Practices
compression settings
Microsoft RDP – RDP version 7.0 is used with MMR enabled and network condition is set accordingly
Results are normalized to the ―maximum‖ value that was seen across all protocols and all network
conditions
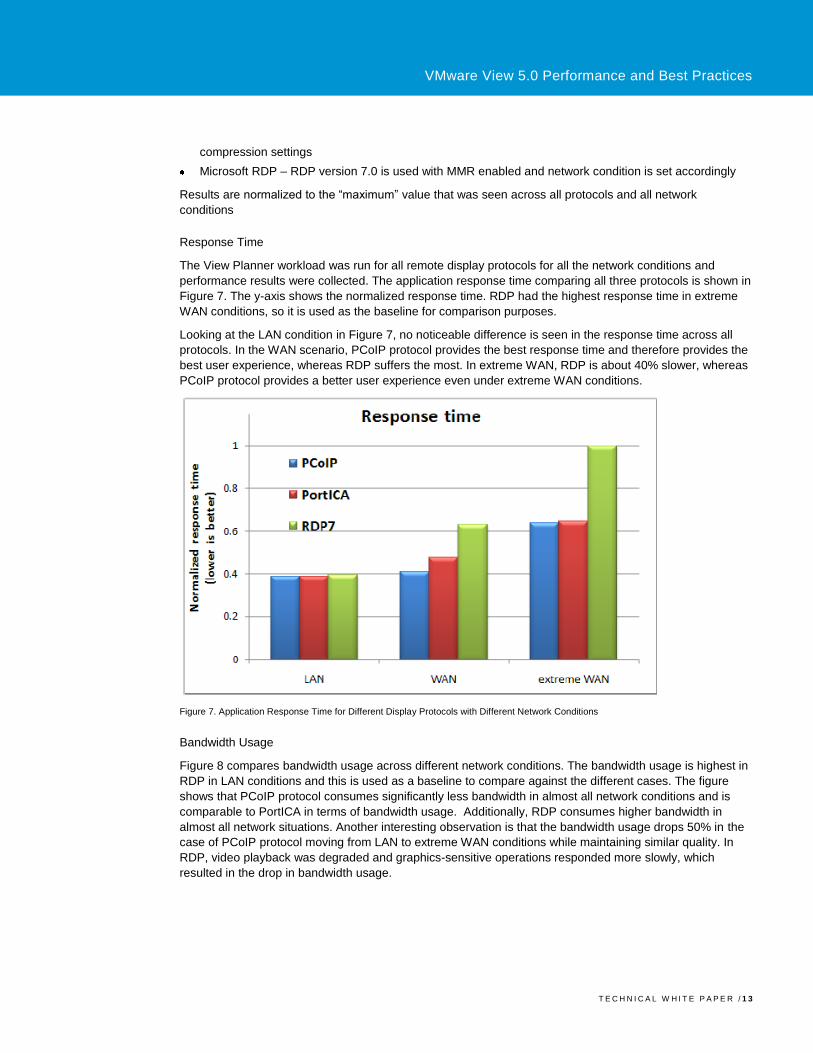
Response Time
The View Planner workload was run for all remote display protocols for all the network conditions and
performance results were collected. The application response time comparing all three protocols is shown in
Figure 7. The y-axis shows the normalized response time. RDP had the highest response time in extreme
WAN conditions, so it is used as the baseline for comparison purposes.
Looking at the LAN condition in Figure 7, no noticeable difference is seen in the response time across all
protocols. In the WAN scenario, PCoIP protocol provides the best response time and therefore provides the
best user experience, whereas RDP suffers the most. In extreme WAN, RDP is about 40% slower, whereas
PCoIP protocol provides a better user experience even under extreme WAN conditions.
Figure 7. Application Response Time for Different Display Protocols with Different Network Conditions
Bandwidth Usage
Figure 8 compares bandwidth usage across different network conditions. The bandwidth usage is highest in
RDP in LAN conditions and this is used as a baseline to compare against the different cases. The figure
shows that PCoIP protocol consumes significantly less bandwidth in almost all network conditions and is
comparable to PortICA in terms of bandwidth usage. Additionally, RDP consumes higher bandwidth in
almost all network situations. Another interesting observation is that the bandwidth usage drops 50% in the
case of PCoIP protocol moving from LAN to extreme WAN conditions while maintaining similar quality. In
RDP, video playback was degraded and graphics-sensitive operations responded more slowly, which
resulted in the drop in bandwidth usage.

T E C H N I C A L W H I T E P A P E R / 1 4
VMware View 5.0 Performance and Best Practices
Figure 8. Bandwidth Usage for Different Display Protocols with Different Network Conditions
CPU Usage
Minimizing guest CPU usage is very important in providing the needed user consolidation on a given
hardware platform. Figure 9 compares the guest CPU usage of the View Planner workload for the View
PCoIP, PortICA, and RDP7 protocols for LAN, WAN, and extreme WAN conditions. Figure 9 shows that
PortICA in the LAN condition has the highest CPU usage. PCoIP protocol provides about 10% better CPU
usage compared to PortICA in the LAN condition and similar improvements are also seen in both the WAN
and extreme WAN conditions. In extreme WAN, lower CPU usage is seen with RDP because of excessive
slowness of video and high graphics-intensive operations.
Figure 9. Guest CPU Usage for Different Display Protocols with Different Network Conditions

T E C H N I C A L W H I T E P A P E R / 1 5
VMware View 5.0 Performance and Best Practices
Performance Results – vSphere 5.0 Platform Improvements
Comparison with View 4.5
The CPU and memory optimizations in vSphere 5.0 help achieve a higher consolidation ratio of desktops.
The memory optimizations especially help Windows 7 deployments, because Windows 7 consumes more
memory resources than Windows XP. The following graph gives an overview of the consolidation
improvement that vSphere 5.0 achieves in comparison to vSphere 4.1, for Windows 7 deployments.
Figure 10. Windows 7 Consolidation Comparison with VMware vSphere 4.1 and 5.0
Figure 10 depicts the number of desktops that successfully passed Quality of Service requirements using
the VMware View Planner workload. A run is considered passed if application response times are below 1.5
seconds, and failed otherwise. vSphere 4.1 could achieve 11 Windows 7 VMs per core, while vSphere 5.0 is
able to achieve 14.5 VMs per core. The following sections present some of the performance metrics that
were measured during the View Planner run.
CPU Usage
VMware vSphere 5.0 has CPU scheduler optimizations, especially those related to hyper-threading. These
optimizations make efficient use of the CPU by optimally scheduling the different desktops on hyper-
threaded cores. Figure 11 shows the histogram of CPU utilization for Windows 7 VMs on vSphere 5.0.
T E C H N I C A L W H I T E P A P E R / 1 6
VMware View 5.0 Performance and Best Practices
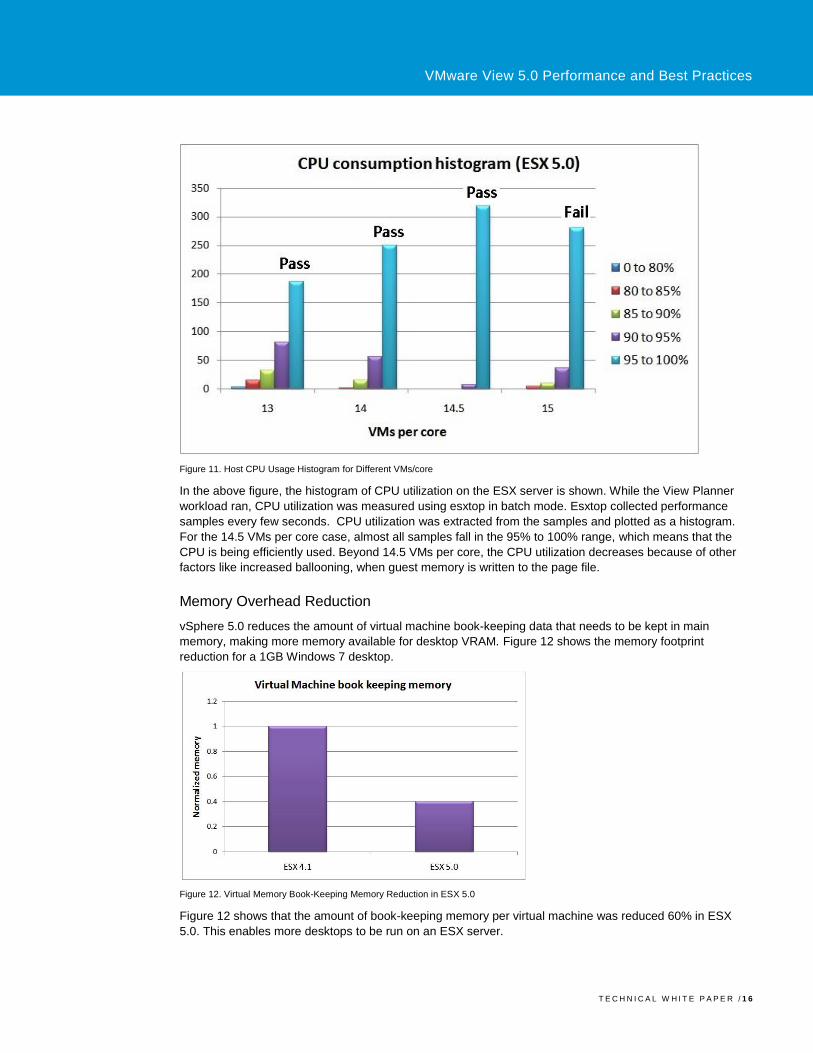
Figure 11. Host CPU Usage Histogram for Different VMs/core
In the above figure, the histogram of CPU utilization on the ESX server is shown. While the View Planner
workload ran, CPU utilization was measured using esxtop in batch mode. Esxtop collected performance
samples every few seconds. CPU utilization was extracted from the samples and plotted as a histogram.
For the 14.5 VMs per core case, almost all samples fall in the 95% to 100% range, which means that the
CPU is being efficiently used. Beyond 14.5 VMs per core, the CPU utilization decreases because of other
factors like increased ballooning, when guest memory is written to the page file.
Memory Overhead Reduction
vSphere 5.0 reduces the amount of virtual machine book-keeping data that needs to be kept in main
memory, making more memory available for desktop VRAM. Figure 12 shows the memory footprint
reduction for a 1GB Windows 7 desktop.
Figure 12. Virtual Memory Book-Keeping Memory Reduction in ESX 5.0
Figure 12 shows that the amount of book-keeping memory per virtual machine was reduced 60% in ESX
5.0. This enables more desktops to be run on an ESX server.
T E C H N I C A L W H I T E P A P E R / 1 7
VMware View 5.0 Performance and Best Practices
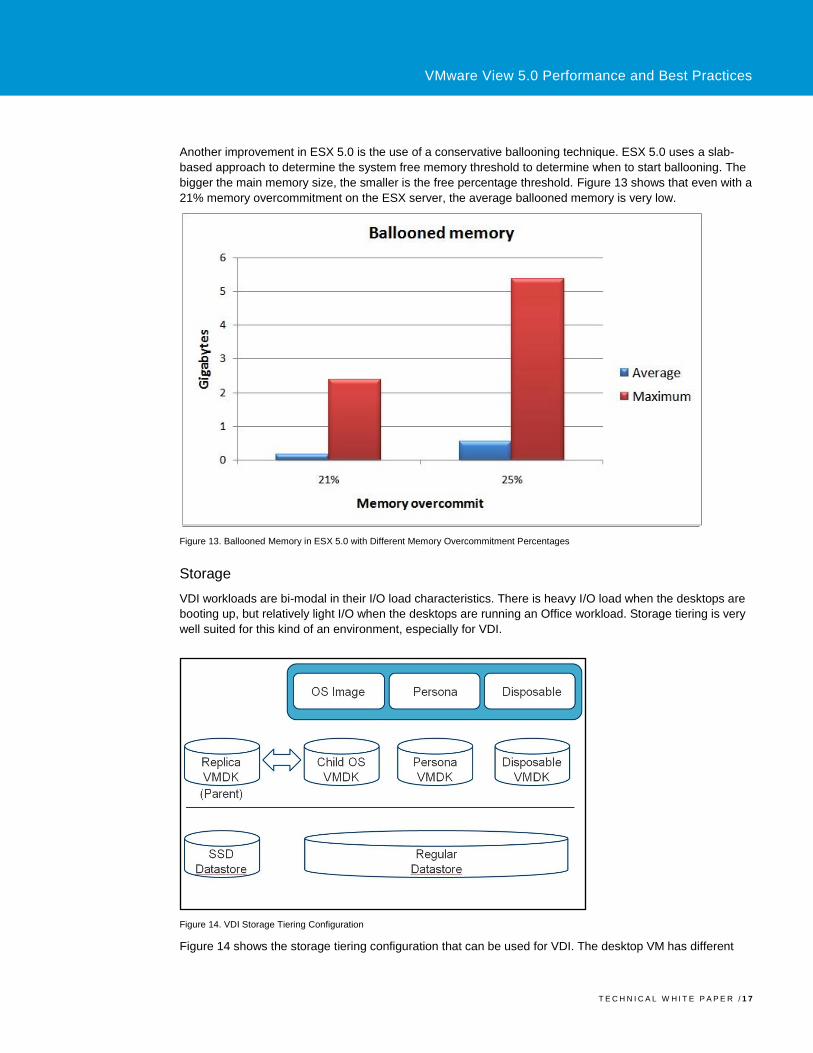
Another improvement in ESX 5.0 is the use of a conservative ballooning technique. ESX 5.0 uses a slab-
based approach to determine the system free memory threshold to determine when to start ballooning. The
bigger the main memory size, the smaller is the free percentage threshold. Figure 13 shows that even with a
21% memory overcommitment on the ESX server, the average ballooned memory is very low.
Figure 13. Ballooned Memory in ESX 5.0 with Different Memory Overcommitment Percentages
Storage
VDI workloads are bi-modal in their I/O load characteristics. There is heavy I/O load when the desktops are
booting up, but relatively light I/O when the desktops are running an Office workload. Storage tiering is very
well suited for this kind of an environment, especially for VDI.
Figure 14. VDI Storage Tiering Configuration
Figure 14 shows the storage tiering configuration that can be used for VDI. The desktop VM has different

T E C H N I C A L W H I T E P A P E R / 1 8
VMware View 5.0 Performance and Best Practices
virtual disks including OS image, persona management data and a disposable disk for page file. I/O
generated during boot is primarily targeted at the OS image disk. The OS image disk is typically a linked
clone that has the replica disk as its parent. Therefore to get best performance during a boot storm, store the
replica disk on an SSD datastore that can support the required amount of I/O load. The other disks can be
stored on a regular datastore composed of slower spinning media to support the lighter Office workloads
during steady state.
View Composer
Desktop provisioning in View depends on a variety of factors, as it makes use of services provided by the
vSphere platform and the underlying hardware resources. The concurrency of operations determines how
many simultaneous requests can be sent out to the vSphere platform. The default value has been adjusted
such that it works for most typical hardware installations. But if the hardware can handle the load, then a
couple of concurrency parameters can be increased in order to speed up the provisioning process.
Figure 15. Provisioning Time Taken in View 4.5 and View 5.0
Figure 15 shows the relative provisioning performance of View 4.5 and View 5.0. It can be seen that View
5.0 has better performance compared to View 4.5 even with default settings. When the concurrency
parameters are set, the provisioning time in View 5.0 further decreases by about 30%. Table 1 enumerates
the concurrency settings that can be applied in the ADAM server.
ADAM PARAMETER VALUE
pae-VCAllRefitRampFactory 12
pae-SVICreateRampFactor 20
Table 1. ADAM parameters for View provisioning

T E C H N I C A L W H I T E P A P E R / 1 9
VMware View 5.0 Performance and Best Practices
View 5.0 Best Practices This section describes all the best practices that can be applied to the guest, platform, protocol, or even at
the network layer.
Platform best practices
Figure 16. Platform Best Practices
CPU Consolidation
vSphere 5.0 successfully runs up to 14.5 Windows 7 desktops per core with good performance. This number
is for light to medium Office workloads. Heavier workloads will cause more CPU consumption and will result
in reduced consolidation ratios.
Memory Consolidation
For Windows 7 desktop VMs with 1GB of memory, vSphere 5.0 can support more desktops per memory real
estate. The following numbers can be used as rough examples:
PHYSICAL MEMORY
(GB)
NUMBER OF VMS IN ESX
4.1
NUMBER OF VMS IN ESX 5.0
96 84 91
256 223 242
512 446 483
Table 2. Increased Consolidation of VMs in ESX 5.0
From Table 2 it is apparent that for Windows 7 VMs with 1GB, administrators can consolidate around 8%
more on vSphere 5.0 compared to vSphere 4.1.
T E C H N I C A L W H I T E P A P E R / 2 0
VMware View 5.0 Performance and Best Practices
Storage
Use storage tiering for VDI environments. While provisioning the desktop pool, create the replicas on an
SSD datastore to support boot storm and login storm. For the other virtual disks, use regular datastores
made up of spinning media of appropriate speed and capacity as the situation requires.
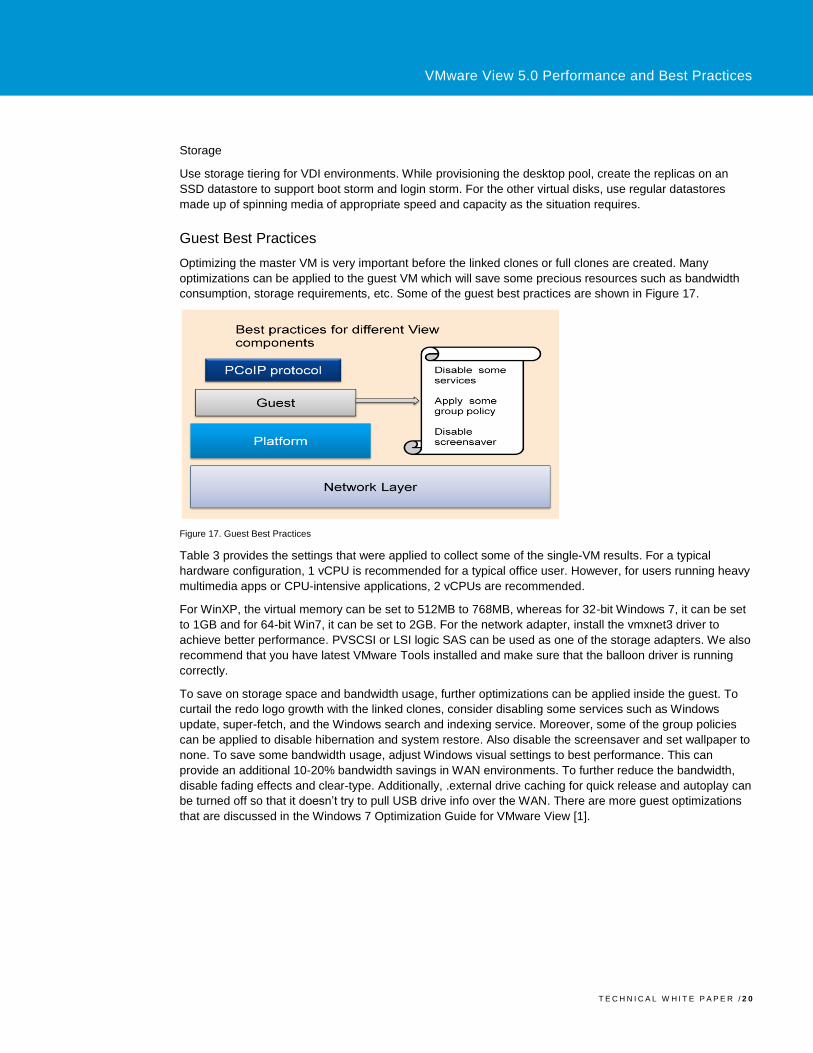
Guest Best Practices
Optimizing the master VM is very important before the linked clones or full clones are created. Many
optimizations can be applied to the guest VM which will save some precious resources such as bandwidth
consumption, storage requirements, etc. Some of the guest best practices are shown in Figure 17.
Figure 17. Guest Best Practices
Table 3 provides the settings that were applied to collect some of the single-VM results. For a typical
hardware configuration, 1 vCPU is recommended for a typical office user. However, for users running heavy
multimedia apps or CPU-intensive applications, 2 vCPUs are recommended.
For WinXP, the virtual memory can be set to 512MB to 768MB, whereas for 32-bit Windows 7, it can be set
to 1GB and for 64-bit Win7, it can be set to 2GB. For the network adapter, install the vmxnet3 driver to
achieve better performance. PVSCSI or LSI logic SAS can be used as one of the storage adapters. We also
recommend that you have latest VMware Tools installed and make sure that the balloon driver is running
correctly.
To save on storage space and bandwidth usage, further optimizations can be applied inside the guest. To
curtail the redo logo growth with the linked clones, consider disabling some services such as Windows
update, super-fetch, and the Windows search and indexing service. Moreover, some of the group policies
can be applied to disable hibernation and system restore. Also disable the screensaver and set wallpaper to
none. To save some bandwidth usage, adjust Windows visual settings to best performance. This can
provide an additional 10-20% bandwidth savings in WAN environments. To further reduce the bandwidth,
disable fading effects and clear-type. Additionally, .external drive caching for quick release and autoplay can
be turned off so that it doesn’t try to pull USB drive info over the WAN. There are more guest optimizations
that are discussed in the Windows 7 Optimization Guide for VMware View [1].

T E C H N I C A L W H I T E P A P E R / 2 1
VMware View 5.0 Performance and Best Practices
PARAMETER CONFIGURATION
vCPU 1 for WinXP and Win7, 2 for multimedia intensive apps
Memory 512-768 MB for WinXP, 1GB for 32-bit Win7, 2GB for 64-bit Win7
1.5-2GB for WinXP and Win732-bit and 3GB for Win7 64-bit for memory intensive
apps
Network adapter Vmxnet3, flexible
Storage adapter PVSCSI or LSI logic SAS
VMware Tools Latest installed
Visual settings ―Adjust to best performance‖
Disable services Windows Update, Super-fetch, Windows Index
Group policy settings Disable Hibernation
System restore disable
Screensaver to None
Other settings Turn off clear-type
Disable fading effects
Disable autoplay and external drive caching for quick release
Disable last access timestamps
Table 3. Guest Best Practices to Save Bandwidth and Storage Resources
View PCoIP Best Practices
After optimizing the master VM, you can apply some PCoIP protocol best practices to realize the best user
experience as shown in Figure 18.

T E C H N I C A L W H I T E P A P E R / 2 2
VMware View 5.0 Performance and Best Practices
Figure 18. PCoIP Protocol Best Practices
Table 4 lists some of the GPO settings that you can apply to improve the user experience for WAN
environments. The first two settings in the table can be made regardless of network conditions—these
changes will save lot of bandwidth with almost no discernible difference in quality.
SETTING DEFAULT RECOMMENDATION DESCRIPTION
Build to lossless On Turn Off Enables the ability to enable or disable
build to lossless
Session Audio BW
limit 500Kbps 50 - 100Kbps
Reduces BW usage of audio with usable
quality
Maximum frame
rate 30
Change to 10-15 based on
network settings
In WAN conditions, this will be helpful for
video playback and fast graphics
operations
Maximum session
bandwidth -
Set it as per network
conditions Good for better bandwidth estimation
Table 4: PCoIP Protocol GPO Settings and Best Practices

T E C H N I C A L W H I T E P A P E R / 2 3
VMware View 5.0 Performance and Best Practices
The first setting of disabling build-to-lossless is quite important as for perceptually lossless quality (which is
hard to differentiate from fully lossless quality for an Office user workload), you will save 20-30% bandwidth
savings. We also suggest limiting the session audio bandwidth to be in the range of 50-100kbps and it will
still provide the usable audio quality with significant lower bandwidth usage. The last two settings of
maximum frame rate and maximum session bandwidth can be set as per the network conditions. The default
value of maximum frame rate is 30 and it can be lowered to anywhere between 10 to 15 for typical WAN
conditions and it will provide decent video playback performance. The last setting of maximum session
bandwidth can be set as per your link bandwidth and this will help in maximizing the users experience
sharing the same link and will also help the PCoIP protocol in better bandwidth estimation. There are more
PCoIP protocol settings which are discussed in View Network optimization guide that can be found on
VMware site.
Network optimizations
This section describes the network optimizations and best practices that realize the best experience from
end-to-end. Some of these practices include assigning right traffic priority, minimizing packet loss, and using
UDP for VPN connections, as shown in Figure 19.
Figure 19. Network Best Practices for PCoIP Protocol Traffic
In the end-point device, View 5.0 adds new ways to monitor PCoIP protocol performance (about 30 new
performance counters that can be analyzed in a WMI based tool) and can be used for performance
monitoring and troubleshooting.

T E C H N I C A L W H I T E P A P E R / 2 4
VMware View 5.0 Performance and Best Practices
Figure 20. Network Best Practices at Edge Routers and End-Point Devices
Figure 20 shows the network architecture diagram and the best practices that can be applied at the edge
routers, and the end-point devices. If you find deep UDP buffers in your edge routers, this will increase
latency and since PCoIP protocol is an adaptive protocol, this may affect the performance a bit. So, we
suggest taking a look at the UDP buffers at the routers and configuring it to absorb about 50 to 100ms of
traffic. We also recommend taking a look at the packet re-ordering and packet loss in the network and
minimizing it if seen. Assigning a good traffic priority is also very essential for the PCoIP protocol traffic to
realize better performance. You may consider assigning higher priority than TCP traffic, but it may be lower
than the VoIP traffic. To do better congestion avoidance, we recommend using weighted random early drop
(WRED) policy instead of tail drop technique. Another thing that comes up at the backbone or edge routers
is data fragmentation if the packets are bigger than a particular size, for example, 1500 bytes. The
fragmentation and reassembly adds unnecessary delay to the traffic and may not be optimal, hence the
GPO settings can be applied accordingly to limit the PCoIP MTU to 1300 bytes.
To provide secure remote PCoIP connections, you can use PCoIP security gateway (PSG) shipped with
View 4.6 version and onwards. However, if you are using VPN to connect to the desktop, we have seen
VPN over UDP or VPN in DTLS mode provides better performance and hence, UDP/DTLS must be used for
VPN connections.
Conclusion The combination of View 5 and vSphere 5 deliver significant improvements in user experience and
consolidation ratios, while at the same time delivering significant reductions in bandwidth consumption. This
paper highlighted how enhancements to View’s PCoIP lossless compression algorithm and support for
client-side image caching in combination deliver up to 75% bandwidth reduction in both WAN and LAN
conditions when compared with the previous release of View.
Further, this paper illustrated how, across all network configurations, View 5 delivers improved user
experience compared with other VDI solutions, while consuming significantly less bandwidth and CPU
resources than Microsoft RDP7 and comparable bandwidth to Citrix HDX.
Finally, while View 5 PCoIP protocol dynamically adapts to changing network and CPU constraints, ensuring
great user experience out-of-the-box, this paper listed a number of environment variables and VDI best
practices that ensure users can get the most out of their VDI environment.

T E C H N I C A L W H I T E P A P E R / 2 5
VMware View 5.0 Performance and Best Practices
References 1. Windows 7 Optimization Guide for VMware View
2. Using PCoIP Host Cards Brokered by VMware View 4
3. Using PCoIP Zero Clients with PCoIP Host Cards
4. VMware View documentation:
VMware View Architecture Planning
VMware View Administration guide
VMware View Installation guide
VMware View Upgrades guide
VMware View Clients documentation
VMware View Integration guide
5. VMware View Planner: Scaling and Characterization tool for Large scale VDI deployments
6. Performance Best Practices for VMware vSphere 5.0
About the Authors Dr. Banit Agrawal is a Sr. Performance Engineer at R&D performance team at VMware. He has expertise
in VMware View and remote display protocols including PCoIP protocol, performance characterization using
suite of display benchmarks, View Planner and performance troubleshooting.
Dr. Lawrence Spracklen is a Senior Performance Engineer at VMware. His current research focus is VDI
deployments, specifically protocol optimization and multimedia quality analysis.
Sunil Satnur has worked for VMware performance engineering for the past five years. During this time, he
has focused on improving storage scalability for desktop and cloud environments. He has implemented and analyzed desktop workload generators and holds a patent in the area of display benchmarking.
Rishi Bidarkar is Sr. Manager in the performance team at VMware. He leads the VDI Performance and
View Planner team. He has filed several patents in the area of VDI performance and display benchmarking.
Acknowledgements
We would like to thank Uday Kurkure, Mason Udeya, View development team, Teradici team, and Julie
Brodeur for their invaluable feedback and suggestions.

VMware, Inc. 3401 Hillview Avenue Palo Alto CA 94304 USA Tel 877-486-9273 Fax 650-427-5001 www.vmware.com
Copyright © 2011 VMware, Inc. All rights reserved. This product is protected by U.S. and international copyright and intellectual property laws. VMware products are covered by one or more patents listed at http://www.vmware.com/go/patents.
VMware is a registered trademark or trademark of VMware, Inc. in the United States and/or other jurisdictions. All other marks and names mentioned herein may be trademarks of their respective companies. Item: PS-View-102011-00
VMware View 5.0 Performance and Best Practices