vmware performance and capacity management - second edition - sample chapter
TRANSCRIPT
P r o f e s s i o n a l E x p e r t i s e D i s t i l l e d
Master SDDC operations with proven best practices
VMware Performance and Capacity ManagementSecond EditionIw
an 'e1' Rahabok
VMw
are Performance and C
apacity Managem
ent Second Edition
VMware Performance and Capacity Management Second Edition
Performance management and capacity management are the two foremost issues faced by enterprise IT when performing virtualization. The second edition expands on the fi rst, with added information and a reorganization of the book into three logical parts.
The fi rst part provides the technical foundation of SDDC management. It explains the difference between a software-defi ned data center and a classic physical data center and how it impacts both architecture and operations. The second part puts the theories together and provides real-life examples created together with customers. It provides the reasons behind using each dashboard. The last part acts as a reference section. It provides a complete reference to vSphere and vRealize Operations counters, explaining their dependencies and providing practical guidance on the values you should expect in a healthy environment.
Who this book is written forThis book is primarily for any system administrator or cloud infrastructure specialist who is interested in performance management and capacity management using VMware technologies.
$ 59.99 US£ 38.99 UK
Prices do not include local sales tax or VAT where applicable
Iwan 'e1' Rahabok
What you will learn from this book
Simplifying the task of performance and capacity management
Mastering the counters in vCenter and vRealize Operations and understanding their dependencies on one another
Educating your peers and management about SDDC operations
Completing your SDDC monitoring to include non-VMware components
Performing SDDC performance troubleshooting
Exploring real-life examples of how super metrics and advanced dashboards work
Introducing and implementing a performance SLA
Accomplishing capacity management by taking into account service tiering and performance SLAs
P U B L I S H I N GP U B L I S H I N G
professional expert ise dist i l led
P U B L I S H I N GP U B L I S H I N G
professional expert ise dist i l led
Visit www.PacktPub.com for books, eBooks, code, downloads, and PacktLib.
Foreword by Nathan Owen, CEO, Blue Medora and Paul Strong, CTO, Global Field, VMware
Free Sample
In this package, you will find: The author biography
A preview chapter from the book, Chapter 5 'Capacity Monitoring'
A synopsis of the book’s content
More information on VMware Performance and Capacity Management -
Second Edition

About the Author
Iwan 'e1' Rahabok was the fi rst VMware SE for strategic accounts in ASEAN. Joining VMware in 2008 from Sun Microsystems, he has seen how enterprises adopt virtualization and cloud computing and reap the benefi ts while overcoming the challenges. It is a journey that is very much ongoing and the book refl ects a subset of that undertaking. Iwan was one of the fi rst to achieve the VCAP-DCD certifi cation globally and has since helped others to achieve the same, via his participation in the community. He started the user community in ASEAN, and today, the group is one of the largest VMware communities on Facebook. Iwan is a member of VMware CTO Ambassadors program since 2014, representing the Asia Pacifi c region at the global level and representing the product team and CTO offi ce to the Asia Pacifi c customers. He is a vExpert since 2013, and has been helping others to achieve this global recognition for their contribution to the VMware community. After graduating from Bond University, Australia, Iwan moved to Singapore in 1994, where he has lived ever since.

Preface
PrefaceFirst of all, thank you for the feedback on the fi rst edition. You will see that this second edition goes above and beyond the feedback. It actually has more new content than the existing content, enabling us to cover the topic deeper and wider.
The strongest feedback Packt Publishing and I got was to make it more pleasant to read as infrastructure is a dry topic. The topics we cover in the book are complex in nature, and the book goes deep into operationalizing performance and capacity management.
Another common feedback was to give more examples on the dashboards. You want more practical solution that you can implement. You want the book to guide you in your journey to operationalize your IaaS platform.
These two feedback plus other feedback and goals made the publisher and me took a fresh look on the topic. You will fi nd the 2nd edition more complete, yet easier to read.
• In terms of ease of read, we have made the writing style more conversational.It should read less like a formal technical whitepaper and more like a spokenconversation among colleagues. We've also made the pictures clearer andadded more diagrams to explain the topics better. We use more bullets andtables to improve the layout. We use shorter sentence, hence, we only use sheinstead of she/he in the book. It applies to both genders.
• In terms of completeness, you will fi nd that the topics are expandedsignifi cantly. For example, the 2nd edition has fi ve chapters on dashboards,compared with just one chapter on the 1st edition. Chapter wise, the booknow has 15 chapters instead of 8 in the 1st edition.

Preface
What this book coversContent wise, the book is now distinctly split into three main parts. Each part happens to have fi ve chapters each:
• Part 1 provides the technical foundation of SDDC management. It aims tocorrect deep-rooted misunderstanding of knowledge that is considered basic.Terms such as VM and SDDC will be redefi ned, and we hope that you willgain new perspective. Part 1 is also written for VMware specialists who needto explain these topics to their peers, customers, or management.
• Part 2 provides the actual solution that you can implement in yourenvironment. We provide the reasons behind each dashboard, so youget the understanding on why it is required and what problem it solves.
• Part 3 acts as a reference section. If you need to know the meaning behinda specifi c counter and how it relates to other counters, Part 3 has over 100pages on this topic.
Chapter 1, VM – It Is Not What You Think!, aims to clear up the misunderstandings that customers have about virtualization. It explains why a VM is radically different from a physical server.
Chapter 2, Software-Defi ned Data Centers, takes the concept further and explains why a virtual data center is fundamentally different from a physical data center. You will see how it differs architecturally in almost all aspects.
Chapter 3, SDDC Management, covers the aspects of management that are affected with the new architecture.
Chapter 4, Performance Monitoring, takes the topic of the previous chapter deeper by discussing how performance management should be done in a virtual data center. It introduces a new paradigm that redefi nes the word Performance.
Chapter 5, Capacity Monitoring, complements Chapter 4 by explaining why capacity management needs to take into account performance before utilization. This chapter wraps up Part 1 of the book.
Chapter 6, Performance-Monitoring Dashboards, kicks off Part 2, where we cover the practical aspects of this book, as they show how sample solutions are implemented. We start by showing the steps to implement dashboards to monitor performance.
Chapter 7, Capacity-Monitoring Dashboards, takes the dashboards in Chapter 6 further by adding capacity monitoring requirement. You will see how they are closely related.

Preface
Chapter 8, Specifi c-Purpose Dashboards, complements those dashboards by covering specifi c use cases. They are often used by specifi c roles, such as network team, storage team, and senior management.
Chapter 9, Infrastructure Monitoring Using Blue Medora, takes the dashboards beyond VMware. It covers non-VMware components of your IaaS. Blue Medora is contributing their expertise here.
Chapter 10, Application Monitoring Using Blue Medora, completes our scope by going above the infrastructure layer. It covers commonly used applications in your VMware-based SDDC. This chapter also wraps up Part 2 of the book.
Chapter 11, SDDC Key Counters, sets the technical foundations of performance and capacity management by giving you a tour of the four infrastructure elements (CPU, RAM, network, and storage). It also maps these four elements into all the vSphere objects, so you know what is available at each level.
Chapter 12, CPU Counters, covers CPU counters in detail. It is the fi rst of four chapters that cover the core infrastructure element (CPU, RAM, network, and storage). If you do not fully understand the various counters in vSphere and vRealize Operations, how they impact one another, and what values you consider healthy, then these four chapters are good for you. They dive deep into the counters, comparing the counters in vCenter and vRealize Operations. Knowing the counters is critical, as choosing the wrong counters or interpreting the values wrongly will lead to a wrong conclusion.
Chapter 13, Memory Counters, continues the deep dive by covering memory counters. It explains why memory is one of the most complex area to monitor and troubleshoot in SDDC.
Chapter 14, Storage Counters, continues the deep dive by covering storage counters. It explains the multiple layers of storage that occur as a result of virtualization. It also explains that distributed storage requires different monitoring approach.
Chapter 15, Network Counters, completes the deep dive by covering network counters and wraps up the book.
[ 75 ]
Capacity MonitoringCapacity management changes drastically with virtualization. In this chapter, we will learn why it is one of the areas that are greatly impacted by virtualization. We will cover the following topics:
• The changes in capacity management• How you should perform capacity management• How many resources are consumed by the SDDC itself• When peak utilization is not what it actually is• How you should perform capacity management• VM rightsizing
Some well-meaning but harmful adviceCan you fi gure out why the following statements are wrong? They are all well-meaning pieces of advice on the topic of capacity management. I'm sure you have heard them, or even given them.
Regarding cluster RAM:
• We recommend a 1:2 overcommit ratio between physical RAM and virtualRAM. Going above this is risky.
• Memory usage on most of your clusters is high, around 90 percent.You should aim for 60 percent as you need to consider HA.
• Active memory should not exceed 50-60 percent. You need a buffer betweenactive memory and consumed memory.
• Memory should be running at a high state on each host.

Capacity Monitoring
[ 76 ]
Regarding cluster CPU:
• The CPU ratio in cluster X is high at 1:5, because it is an important cluster.• The rest of your clusters' overcommit ratios look good as they are around 1:3.
This gives your some buffer for spike and HA.• Keep the overcommitment ratio at 1:4 for tier 3 workload.• CPU usage is around 70 percent on cluster Y. Since they are User Acceptance
Testing (UAT) servers, don't worry. You should be worried only when they reach 85 percent.
• The rest of your clusters' CPU utilization is around 25 percent. This is good! You have plenty of capacity left.
The scope of these statements is obviously a VMware vSphere Cluster. From a capacity-monitoring point of view, a cluster is the smallest logical building block, due to HA and DRS. So, it is correct that we perform capacity planning at the cluster level and not at the host or data center level.
Can you fi gure out where the mistakes are?
You should notice a trend by now. The statements have something in common. Here is another hint—review this great blog by Mark Achtemichuk, a performance expert on VMware: https://blogs.vmware.com/vsphere/2015/11/vcpu-to-pcpu-ratios-are-they-still-relevant.html. In the blog, he explains why static counters such as vCPU:pCPU are no longer suffi cient. You need something that refl ects the actual live situation in the data center.
The earlier statements are wrong as they focus on the wrong item. They are looking at the cluster, when they should be looking at the VM.
Remember the restaurant analogy we covered in Chapter 3, SDDC Management? Those well-meant pieces of advice were looking at the supplier (provider), when they should have been focusing on the consumer (customer). What's important is your VM.
The way you perform capacity monitoring changes drastically once you take into account performance and availability.
Chapter 5
[ 77 ]
A shift in capacity managementBefore we discuss how to perform capacity management in SDDC, let's discuss what changes drastically.
Let's take our restaurant analogy further:
Do you know how much food your diners should consume? You probably do. You've seen a lot of people dining in your restaurant, and you know roughly how much food a person, given his size and age, can consume.
Now, do you have authority on how much food they can order? No, you do not. If a diner wants to order three servings of fried rice for himself, it is his right. You can advise him, but you know you are not the one eating.
Let's take this to our IaaS now. It is up to the VM owner how big a VM he wants to order. In other words, capacity management no longer covers the VM. This is a big shift in capacity management. There is no capacity management for VMs. It has been replaced by VM rightsizing, which is handled by the application team.
Your scope has been reduced to the SDDC layer. Does it become simpler?
Not at all.
The SDDC layer needs to be planned as one integrated block. Remember, the SDDC transforms the infrastructure team into the service provider model. You need to see the application team as a customer who does not need to know about the detailed specifi cation of your infrastructure. You provide them a service. To achieve this, you need to unify the three components (compute, network, and storage) as one integrated capacity planning model. It is no longer suffi cient to look at them as three separate components managed by three different teams.
There is another reason why it is harder. SDDC means what used to be storage, network, and security are now taking the form of software. So there is no longer a physical boundary that says, "This is where server ends and storage starts."
With that, let's look at the three resources.

Capacity Monitoring
[ 78 ]
SDDC capacity planningAs the SDDC architect, you look at the big picture. Hence, it is important that you know your architecture well. One way to easily remember what you have is to keep it simple. Yes, you can have different host specifi cations—CPU speed, amount of RAM, and so on—in a cluster. But that would be hard to remember if you have a large farm with many clusters.
You also need to know what you actually have at the physical layer. If you don't know how many CPUs or how much RAM the ESXi host has, then it's impossible to fi gure out how much capacity is left. Sounds obvious, right? Who does not know how much physical resource he has!
Well, it's not so easy, actually.
We will use storage as an example to illustrate why it is hard to know what you actually have. Do you know how many IOPS your storage actually has?
Indeed. You only know roughly. There are too many "it depends" factors in the answer.
Once you know the actual raw capacity, you are in a position to fi gure out the usable portion. The next fi gure shows the relationship. The raw capacity is what you physically have. The Infrastructure as a Service (IaaS) workload is all the workload that is not caused by a VM. For example, the hypervisor itself consumes CPU and RAM. When you put an ESXi host into maintenance mode, it will trigger a mass vMotion for all the VMs running on it. That vMotion will take up the CPU and RAM of both ESXi hosts and the network between them. So, the capacity left for VM, the usable capacity, is Raw Capacity (IaaS workload + Non vSphere workload).
The main consumers of the IaaS capacity

Chapter 5
[ 79 ]
So what are these IaaS workloads?
Think of the S in SDDC.
All the services or functionalities your SDDC provides to the consumer (the VM) run as software. Storage services (for example, Virtual SAN and vSphere Replication), network services (for example, an L3 switch in NSX and a fi rewall), security services (for example, Trend Micro antivirus), and availability services (for example, Storage vMotion) the list goes on. It is software, and software consumes physical resources. The next table lists all the IaaS workloads. It is possible that the list will get outdated as more and more capabilities are moved into software. For each of the workloads, I have not put an estimate on the impact, as it varies widely. Let's consider two examples:
• Performing vMotion on a small and idle VM will have minimal impact. Putting a host into maintenance mode, and hence triggering mass vMotion on ten large memory-intensive VMs, will have high impact.
• Replicating an idle VM with a Recovery Point Objective (RPO) of 24 hours will generate minimal traffic. Replicating many write-intensive VMs with an RPO of 15 minutes will generate high network traffic.
The blank spaces are for you to fi ll. Going through the exercise will make you think and understand your environment better.
IaaS workload Compute impact
Network impact
Storage impact
vMotion and DRS.Storage vMotion and storage DRS.VM operation—snapshot, cloning, hibernate, shutdown, bootup.Fault-tolerant VM.HA and cluster maintenance (can result in all VMs being evacuated from an affected host).Hypervisor-based storage services: vSphere Replication.Virtual storage (for example, VSAN, SimpliVity, and so on).

Capacity Monitoring
[ 80 ]
IaaS workload Compute impact
Network impact
Storage impact
Backup (for example, VDP, VADP API) with de-dupe.Backup vendor can provide the info here.For VDP, you can see the actual data in vSphere.Hypervisor-based network services: AV, IDS, IPS, FW, and L3 switch (NSX).Edge-of-network services (for example, NSX Edge, and F5).DR test or actual (with SRM).
Can you notice a popular workload that has not been included in the table? It's something that you probably already have.
You are right—Virtual Desktop Infrastructure (VDI).
VMware Horizon workloads behave differently than server workloads, so they need their own separate breakdowns of workload, which have not been included in the table. A VDI (desktop) and VSI (server) farm should be separated physically for performance reasons and so that you may upgrade your vCenter servers independently. If that is not possible in your environment, then you need to include IaaS workloads specifi c to VMware Horizon (recompose, refresh, rebalance, and so on) in your calculations. If you ignore these and only include desktop workloads, you may not be able to perform desktop recomposition during offi ce hours.
Good capacity management begins with a good design.
A good design creates standards that simplify capacity management. If the design is fl awed and complex, capacity management may become impossible.

Chapter 5
[ 81 ]
Capacity planning at the compute levelIn a large environment, having dedicated clusters for each service tier makes capacity management easier. We can compare the task of managing the needs of virtual machines to how an airline business manages the needs of passengers on a plane: the plane has dedicated areas for fi rst class, business class, and economy class. It makes management easier as each class has a dedicated amount of space to be divided among the passengers, and the passengers are grouped by service level, so it is easier to tell whether the service levels for each class are being met overall. You also avoid a situation where a fi rst-class passenger complains of slow service because your resources are busy serving the economy class passengers.
With this operations consideration in mind, we can see that three smaller clusters will be easier to manage than one large, mixed cluster serving all three tiers. Of course, there are situations where it is not possible to have small clusters; it all depends on the requirements and budget. Additionally, there are benefi ts of having one large cluster, such as lower cost and more resources to handle peak periods. In situations where you choose to mix VMs of different tiers, you should consider using shares instead of reservations.
You should use reservation sparingly as it impacts vSphere HA slot size, increases management complexity, and prevents you from oversubscribing. In tier 1, where there is no oversubscription because you are guaranteeing resources to every VM, reservation becomes unnecessary from a capacity-management point of view. You may still use it if you want a faster boot, but that's not concerned with the capacity point of view. In tier 3, where cost is the number-one factor, using reservation will prevent you from oversubscribing. This negates the purpose of tier 3 in the fi rst place.
You should avoid using limits as they lead to unpredictable performance. The Guest OS does not know that it is artifi cially limited.
Capacity planning at the storage layerFor the storage node, capacity management depends on the chosen architecture. Storage is undergoing an evolution with the arrival of converged storage, which introduces an alternative to the traditional, external array.
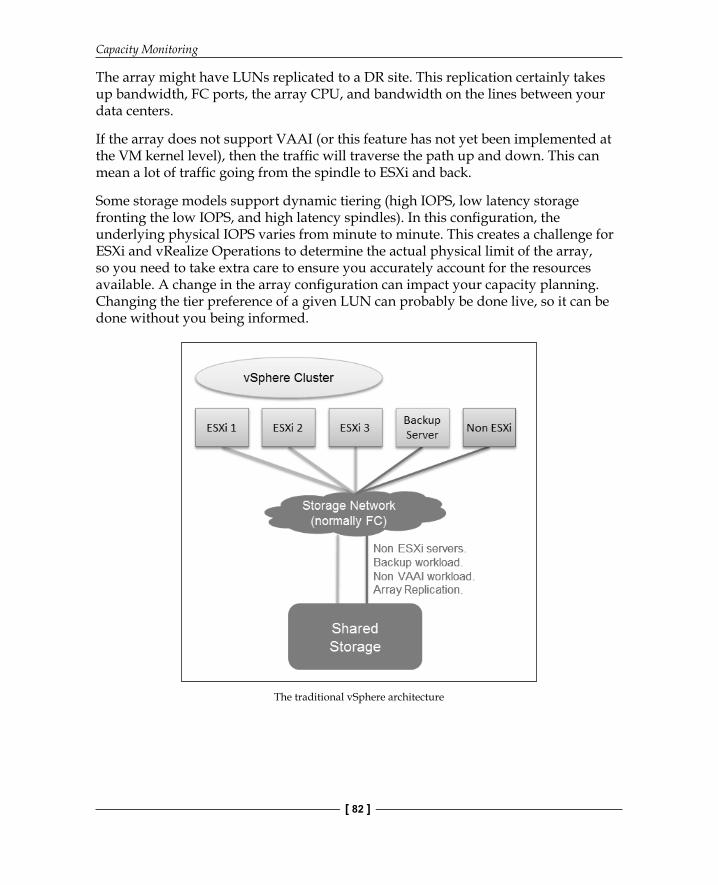
In the traditional, external storage model, there is a physical array (for example, EMC VNX, HDS, HUS, and NetApp). As most environments are not yet 100-percent virtualized, the physical array is shared by non-ESXi servers (for example, Unix). There is often a physical backup server (for example, Symantec NetBackup) that utilizes the VMware VADP API.
Capacity Monitoring
[ 82 ]
The array might have LUNs replicated to a DR site. This replication certainly takes up bandwidth, FC ports, the array CPU, and bandwidth on the lines between your data centers.
If the array does not support VAAI (or this feature has not yet been implemented at the VM kernel level), then the traffi c will traverse the path up and down. This can mean a lot of traffi c going from the spindle to ESXi and back.
Some storage models support dynamic tiering (high IOPS, low latency storage fronting the low IOPS, and high latency spindles). In this confi guration, the underlying physical IOPS varies from minute to minute. This creates a challenge for ESXi and vRealize Operations to determine the actual physical limit of the array, so you need to take extra care to ensure you accurately account for the resources available. A change in the array confi guration can impact your capacity planning. Changing the tier preference of a given LUN can probably be done live, so it can be done without you being informed.
The traditional vSphere architecture
Chapter 5
[ 83 ]
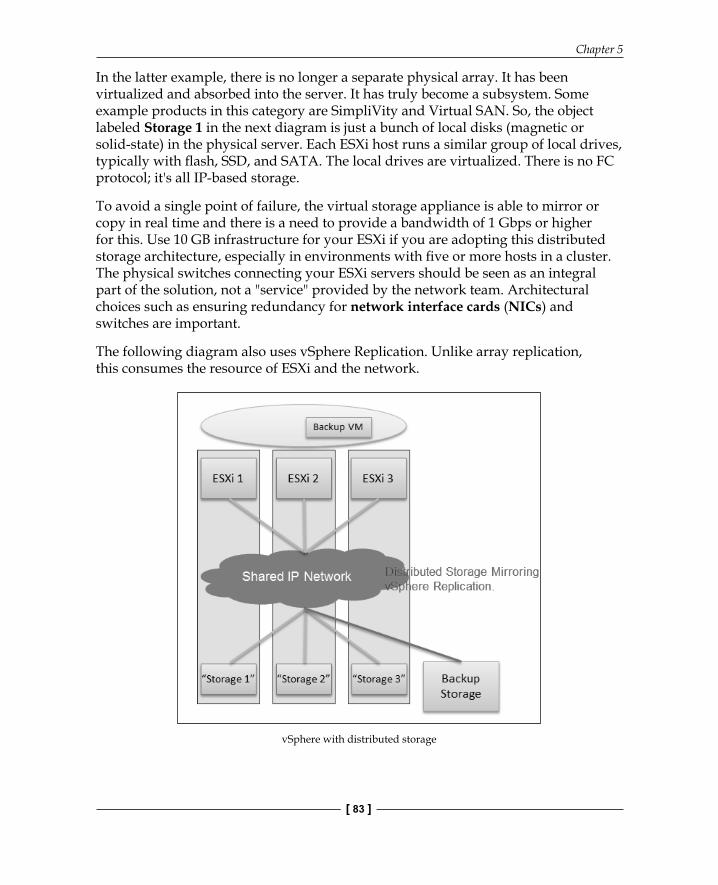
In the latter example, there is no longer a separate physical array. It has been virtualized and absorbed into the server. It has truly become a subsystem. Some example products in this category are SimpliVity and Virtual SAN. So, the object labeled Storage 1 in the next diagram is just a bunch of local disks (magnetic or solid-state) in the physical server. Each ESXi host runs a similar group of local drives, typically with fl ash, SSD, and SATA. The local drives are virtualized. There is no FC protocol; it's all IP-based storage.
To avoid a single point of failure, the virtual storage appliance is able to mirror or copy in real time and there is a need to provide a bandwidth of 1 Gbps or higher for this. Use 10 GB infrastructure for your ESXi if you are adopting this distributed storage architecture, especially in environments with fi ve or more hosts in a cluster. The physical switches connecting your ESXi servers should be seen as an integral part of the solution, not a "service" provided by the network team. Architectural choices such as ensuring redundancy for network interface cards (NICs) and switches are important.
The following diagram also uses vSphere Replication. Unlike array replication, this consumes the resource of ESXi and the network.
vSphere with distributed storage
Capacity Monitoring
[ 84 ]
Once you have confi rmed your storage architecture, you will be in a position to calculate your usable capacity and IOPS. Let's now dive deeper into the fi rst architecture, as this is still the most common architecture.
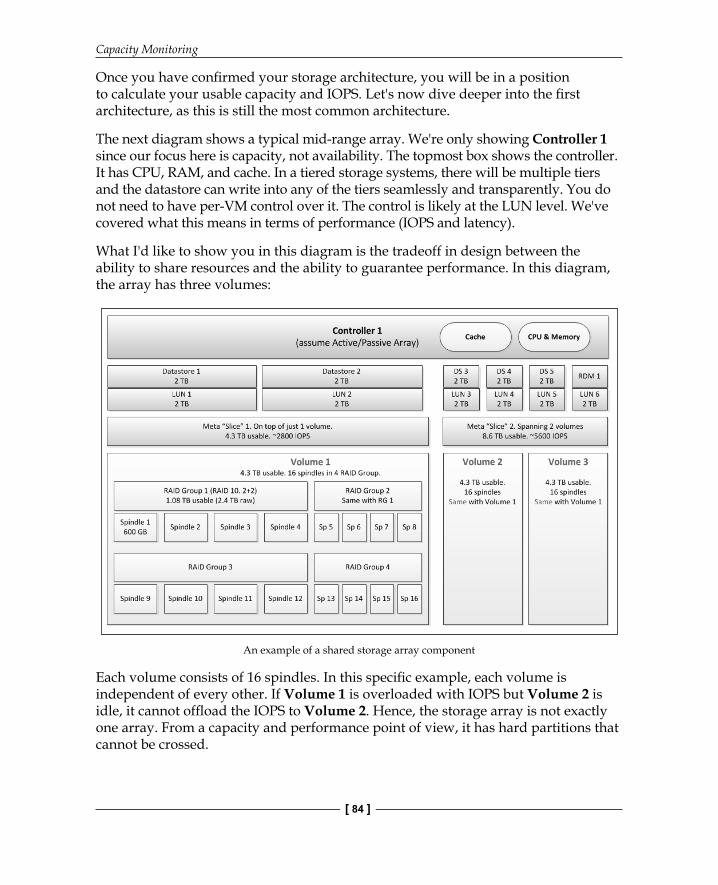
The next diagram shows a typical mid-range array. We're only showing Controller 1 since our focus here is capacity, not availability. The topmost box shows the controller. It has CPU, RAM, and cache. In a tiered storage systems, there will be multiple tiers and the datastore can write into any of the tiers seamlessly and transparently. You do not need to have per-VM control over it. The control is likely at the LUN level. We've covered what this means in terms of performance (IOPS and latency).
What I'd like to show you in this diagram is the tradeoff in design between the ability to share resources and the ability to guarantee performance. In this diagram, the array has three volumes:
An example of a shared storage array component
Each volume consists of 16 spindles. In this specifi c example, each volume is independent of every other. If Volume 1 is overloaded with IOPS but Volume 2 is idle, it cannot offl oad the IOPS to Volume 2. Hence, the storage array is not exactly one array. From a capacity and performance point of view, it has hard partitions that cannot be crossed.

Chapter 5
[ 85 ]
Does this then mean that you create one giant volume so that you can share everything?
Probably not; the reason is that there is no concept of shares or priority within a single volume. From the diagram, Datastore 1 and Datastore 2 live in Volume 1. If a non-production VM in Datastore 1 is performing a high-IO task (say someone runs IOmeter), it can impact a production VM in Datastore 2.
Storage I/O control (SIOC) will not help you in this case. The scope of SIOC is within a datastore. It does not ensure fairness across datastores. Review Cormac Hogan's blog at http://cormachogan.com/2013/07/11/sioc-and-datastores-spread-across-all-spindles-in-the-array. Duncan Epping has also written articles on the topic, and a good starting point is this one: http://www.yellow-bricks.com/2010/10/19/storage-io-control-best-practices. If you have many datastores, SIOC has the highest chance of hitting fairness across datastores when the number of VMs per datastore is consistent.
As a VMware admin performing capacity management, you need to know the physical hardware your VMware environment is running on at all layers. As VMware professionals, we often stop at the compute layer and treat storage as just a LUN provider. There is a whole world underneath the LUNs presented to you.
Now that you know your physical capacity, the next thing to do is estimate your IaaS workload. If you buy an array with 100,000 IOPS, it does not mean you have 100,000 IOPS for your VM. In the next example, you have a much smaller number of usable IOPS. The most important factors you need to be aware of are:
• Frontend IOPS• Backend IOPS
There are many calculations on IOPS as there are many variables impacting it. The numbers in this table are merely examples. The point I hope to get across is that it is important to sit down with the storage architect and estimate the number for your specifi c environment.
Components IOPS Remarks
Raw capacity 100,000 Backend IOPS.
Front-end IOPS 50,000 Use RAID 10. RAID 5 or RAID 6 will be slower.
Non ESXi workload 5,000 Not recommended to mix this as we cannot perform QoS or storage IO control.

Capacity Monitoring
[ 86 ]
Components IOPS Remarks
Back up workload 5,000 You can get the data from the physical array since the backup server is typically a physical server connected to the array.Included in vSphere if VDP is used.
Array replication 5,000. If used.
vSphere replication 5,000. If used.
Distributed storage mirroring
0. Not applicable in this example as it uses a shared array.
Net available 30,000. Only 30 percent left for the VM workload!
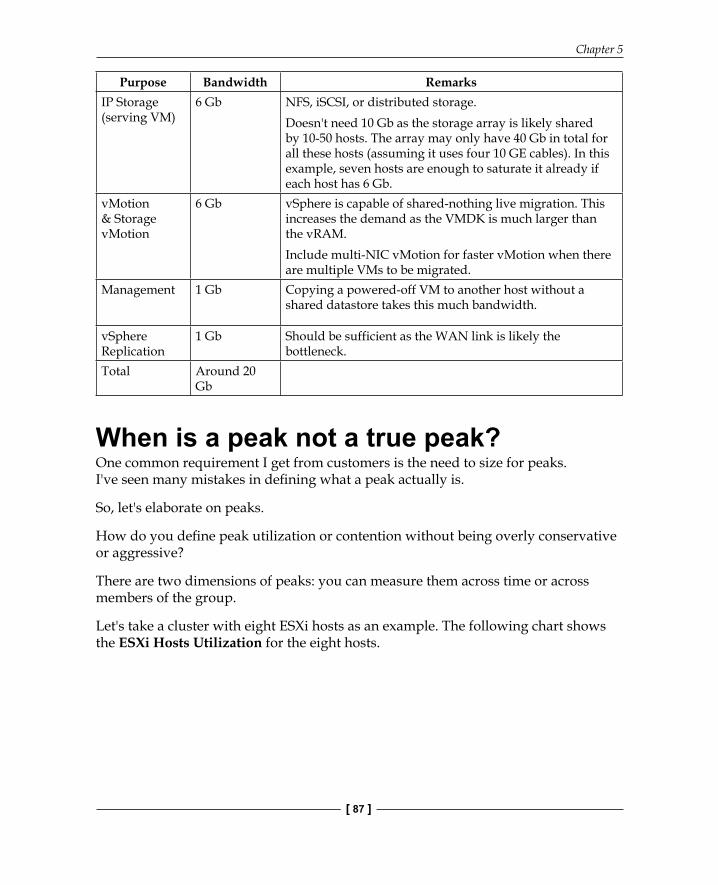
Capacity planning at the network layerSimilar to calculating capacity for storage, understanding capacity requirements for your network requires knowledge of the IaaS workloads that will compete with your VM workload. The following table provides an example using IP storage. Your actual design may differ compared to it. If you are using fi ber channel storage, then you can use the available bandwidth for other purposes.
Purpose Bandwidth RemarksVM 4 Gb For around 20 VMs.
An NSX Edge VM needs a lot of bandwidth as all the traffic passes through it. Ideally, you dedicate a separate cluster for network edge functions.
ESXi Agent An appliance VM that exists per ESXi.For example, a Trend Micro Deep Security appliance.
Heartbeat 1 Mb Minimal as it's purely for the heartbeat. Used by Symantec Veritas clusters.
FT network 2 Gb Four vCPU FTs can easily hit more than 1 Gb, especially if you are planning to have more than one FT VM.
Chapter 5
[ 87 ]
Purpose Bandwidth RemarksIP Storage (serving VM)
6 Gb NFS, iSCSI, or distributed storage.Doesn't need 10 Gb as the storage array is likely shared by 10-50 hosts. The array may only have 40 Gb in total for all these hosts (assuming it uses four 10 GE cables). In this example, seven hosts are enough to saturate it already if each host has 6 Gb.
vMotion & Storage vMotion
6 Gb vSphere is capable of shared-nothing live migration. This increases the demand as the VMDK is much larger than the vRAM.Include multi-NIC vMotion for faster vMotion when there are multiple VMs to be migrated.
Management 1 Gb Copying a powered-off VM to another host without a shared datastore takes this much bandwidth.
vSphere Replication
1 Gb Should be sufficient as the WAN link is likely the bottleneck.
Total Around 20 Gb
When is a peak not a true peak?One common requirement I get from customers is the need to size for peaks. I've seen many mistakes in defi ning what a peak actually is.
So, let's elaborate on peaks.
How do you defi ne peak utilization or contention without being overly conservative or aggressive?
There are two dimensions of peaks: you can measure them across time or across members of the group.
Let's take a cluster with eight ESXi hosts as an example. The following chart shows the ESXi Hosts Utilization for the eight hosts.

Capacity Monitoring
[ 88 ]
What's the cluster peak utilization on that day?
The two dimensions of peaks
As you can see from the graphs, it is not so simple. Let's elaborate:
• Approach 1: You measure across time. You take the average utilization of the cluster, roll up the time period to a longer time period, and calculate the peak of that longer time period. For example, the average cluster utilization peaks at 65 percent at 9:05 am. You roll up the data for one day. This means the peak utilization for that day is 65 percent. This is the most common approach. The problem of this approach is that it is actually an average. For the cluster to hit 80 percent average utilization, some hosts have to hit over 80 percent. This means you can't rule out the possibility that one host might hit near 100 percent. The same logic applies to a VM. If a VM with 16 vCPUs hits 80 percent utilization, some cores probably hit 100 percent. This method results in under-reporting since it is an average.
• Approach 2: You measure across members of the group. For each data sample, calculate the utilization from the host with the highest utilization. In our cluster example, at 9:05 am, host number 1 has the highest utilization among all hosts. It hits 80 percent. We then infer that the peak cluster utilization at 9:05 am is also 80 percent. You repeat this process for each sample period. You may get different hosts at different times. You will not know which host provides the peak value as it varies from time to time. This method results in over-reporting, as it is the peak of a member. You can technically argue that this is the true peak.
Chapter 5
[ 89 ]
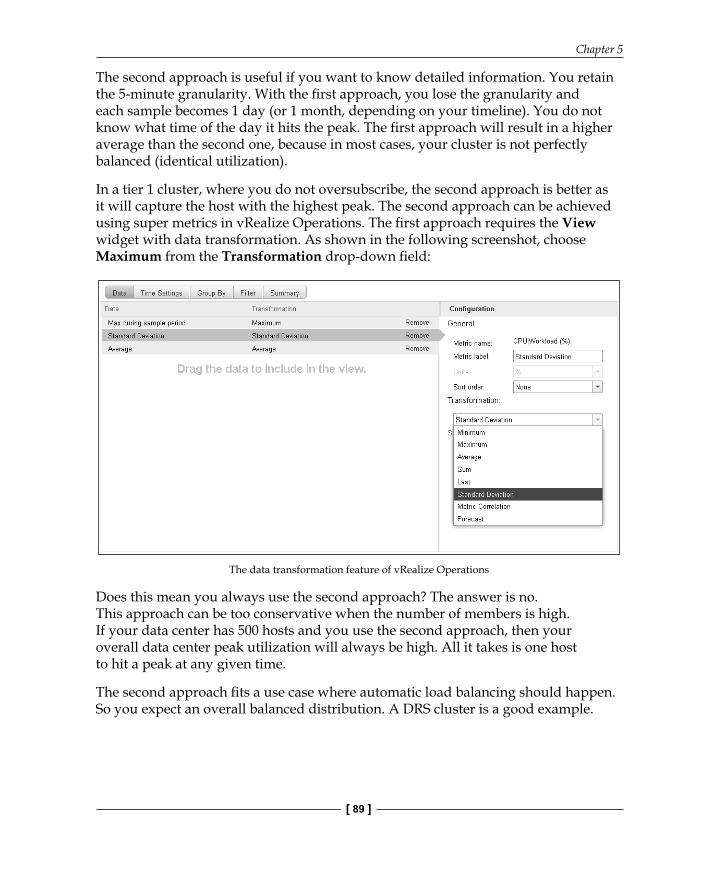
The second approach is useful if you want to know detailed information. You retain the 5-minute granularity. With the fi rst approach, you lose the granularity and each sample becomes 1 day (or 1 month, depending on your timeline). You do not know what time of the day it hits the peak. The fi rst approach will result in a higher average than the second one, because in most cases, your cluster is not perfectly balanced (identical utilization).
In a tier 1 cluster, where you do not oversubscribe, the second approach is better as it will capture the host with the highest peak. The second approach can be achieved using super metrics in vRealize Operations. The fi rst approach requires the View widget with data transformation. As shown in the following screenshot, choose Maximum from the Transformation drop-down fi eld:
The data transformation feature of vRealize Operations
Does this mean you always use the second approach? The answer is no. This approach can be too conservative when the number of members is high. If your data center has 500 hosts and you use the second approach, then your overall data center peak utilization will always be high. All it takes is one host to hit a peak at any given time.
The second approach fi ts a use case where automatic load balancing should happen. So you expect an overall balanced distribution. A DRS cluster is a good example.

Capacity Monitoring
[ 90 ]
Putting it all togetherWe've covered a lot of foundation. This is important as we need to get the theory right so we know that we understand reality correctly, because it will match the theory. You should have the expected result or baseline.
The way you perform capacity management changes drastically once you take into account performance and availability. Let's consider an example to drive the point. We'll take storage, as it's the easiest example:
• Say your physical SAN array has 200 TB usable capacity.• It supports 1000 VMs, which take up 100 TB.• It has 100 TB usable capacity left. That's plenty of space.• Assuming an average VM occupies 100 GB of space, you can fit almost
1000 VMs!
My question is this: how many additional running VMs can that array support?
1000? 500? 1?
You are right—it depends on the VM IOPS. Just because there is space does not mean the array can handle the workload.
Now, what if the existing 1000 VMs are already experiencing high latency? Users are complaining as latency is hitting 100 milliseconds, impacting many VMs randomly.
Should you add more VMs? The answer is clearly no. Adding VMs will make performance worse. For all practical purposes, the array capacity is full.
It is common practice to perform capacity management by looking at the utilization of the infrastructure (IaaS Utilization). That's a costly mistake. You should stop looking at it as the primary indicator.
Chapter 5
[ 91 ]
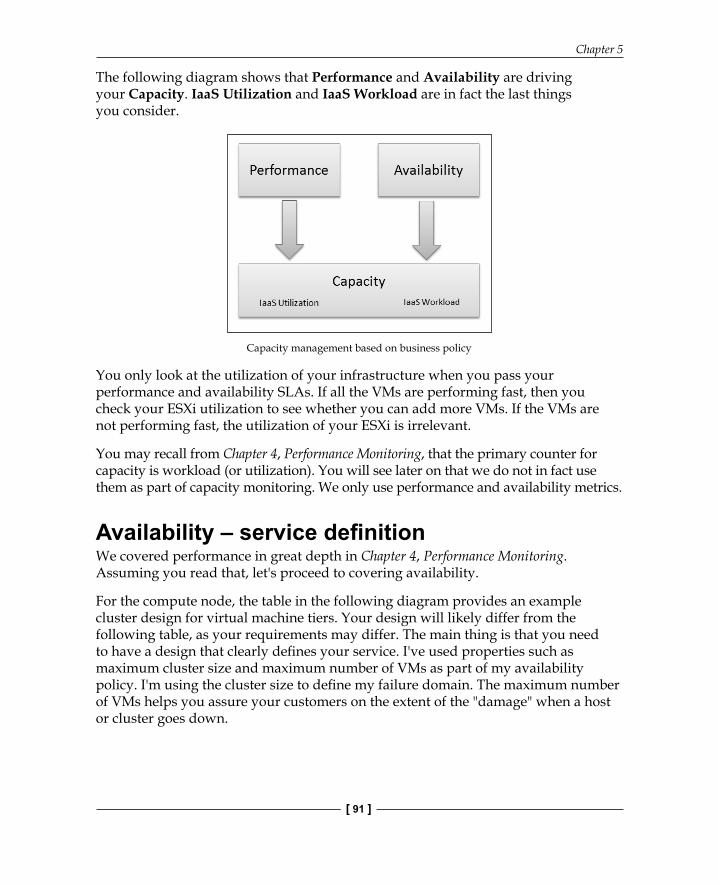
The following diagram shows that Performance and Availability are driving your Capacity. IaaS Utilization and IaaS Workload are in fact the last things you consider.
Capacity management based on business policy
You only look at the utilization of your infrastructure when you pass your performance and availability SLAs. If all the VMs are performing fast, then you check your ESXi utilization to see whether you can add more VMs. If the VMs are not performing fast, the utilization of your ESXi is irrelevant.
You may recall from Chapter 4, Performance Monitoring, that the primary counter for capacity is workload (or utilization). You will see later on that we do not in fact use them as part of capacity monitoring. We only use performance and availability metrics.
Availability – service defi nitionWe covered performance in great depth in Chapter 4, Performance Monitoring. Assuming you read that, let's proceed to covering availability.
For the compute node, the table in the following diagram provides an example cluster design for virtual machine tiers. Your design will likely differ from the following table, as your requirements may differ. The main thing is that you need to have a design that clearly defi nes your service. I've used properties such as maximum cluster size and maximum number of VMs as part of my availability policy. I'm using the cluster size to defi ne my failure domain. The maximum number of VMs helps you assure your customers on the extent of the "damage" when a host or cluster goes down.

Capacity Monitoring
[ 92 ]
You may, and probably do, use other properties in your environment.
This is for the compute portion. It is not applicable to the network portion as it is an interconnect, as described in Chapter 11, SDDC Key Counters.
Let's now look at the storage portion. It depends on the architecture. The principle of availability remains the same, though. As you know well, mission-critical VMs have to be better protected than development VMs. You would go the extra mile to ensure redundancy. In the event of failure, you also want to cap the degree of the damage. You want to minimize the chance of human error too.
I've provided an example in the following diagram. Just like the compute portion, you need to come up with your own policy. For example, if you are using VMFS, you may have a policy that says no more than 50 mission-critical VMs are allowed in a single VMFS datastore:
Let's now see how we can translate this policy into a solution.

Chapter 5
[ 93 ]
We are using line charts so that we can see the trend across time. All the timelines should be about 1 month, with a maximum of 3 months. This allows you to spot trends early, as it takes weeks to buy hardware. A timeline longer than 3 months will result in you buying hardware too early.
Let's begin with tier 1 as it's the easiest. We'll cover tier 2 and tier 3 together, as they have the same nature. They both have overcommitment.
Network will be covered separately as it has the same solution for all tiers.
Tier 1 compute monitoringFor the compute portion of capacity management, monitoring becomes much simpler, as there is no overcommitment. Your ESXi will have low utilization almost all of the time. Even if all VMs are running at 100 percent, the ESXi will not hit contention as there are enough physical resources for everyone. As a result, there is no need to track contention as there won't be any. This means you do not need to check capacity against your performance SLA. You just need to check against your availability SLA.
To help you monitor, you can create fi ve line charts, three for compute and two for storage. Here are the line charts for compute:
• A line chart showing the total number of vCPUs left in the cluster• A line chart showing the total number of vRAM left in the cluster• A line chart showing the total number of VMs left in the cluster
Look at the previous three charts as one group. Take the one with the lowest number.
If the lowest number is approaching a low number, it's time to add capacity. How low that number should be depends on how fast you can procure hardware. I will explain this in detail in Chapter 7, Capacity-Monitoring Dashboards.
Yup, that's all you need for compute. There's nothing about ESXi or vSphere Cluster utilization as they are irrelevant. In tier 1, you are driven by availability, not performance.

Capacity Monitoring
[ 94 ]
Tier 2 and 3 compute monitoringFor the compute portion, tier 2 and 3 are more complex than tier 1, as there is now the possibility of contention. You need to check against both the performance and availability SLAs.
Here are the line charts for compute:
• A line chart showing the maximum and average CPU contention experienced by any VM in the cluster
• A line chart showing the maximum and average RAM contention experienced by any VM in the cluster
• A line chart showing the total number of VMs left in the cluster
How do you use the maximum and average lines to track capacity? Here's how:
• The maximum number has to be lower than the SLA you promise at all times. If the maximum latency number hits your threshold, it's time to add capacity. Adding a VM will breach your performance SLA.
• If the maximum is below your SLA but your minimum number is approaching your threshold, the capacity is near full. Adding VMs may breach your performance SLA as the maximum number may exceed it.
• If the maximum is well below your SLA, it means that you overprovisioned the hardware.
Look at these three charts as one group. Take the one with the value closest to your SLA. The fi rst two lines are from your performance SLA and the third line is from your availability SLA.
Storage monitoringI've separated storage as you can use the same solution for all tiers. You will use the same line charts. The only difference is your threshold. Keeping a consistent solution makes operations simpler.
Unlike compute, storage is driven by performance and utilization for all service tiers. Here are the line charts for storage:
• A line chart showing the maximum and average storage latency experienced by any VM in the datastore cluster
• A line chart showing the disk capacity left in the datastore cluster

Chapter 5
[ 95 ]
You should group your datastores into a datastore cluster. Other than the primary benefi ts, it also makes capacity management easier. If you use it, you need not manually exclude local datastores. You also need not manually group shared datastores, which can be complex if you have multiple clusters.
Can you guess why the fi rst line chart is based on the datastore cluster, since it was based on the compute cluster when we discussed it in Chapter 4, Performance Monitoring?
The reason is that we use the compute cluster when we track performance based on ease of operation. In addition, performance is about the VM, not your IaaS. It does not matter where the VM disk resides; slow means slow.
Capacity is different. It is about your IaaS, not the VM. There are two reasons why storage capacity monitoring cannot be based on the compute cluster:
• Local datastores: They complicate capacity monitoring because they are included by default in the compute cluster storage capacity. You do not include local datastores in capacity management.
• A datastore spanning multiple compute clusters: You will get partial data if you perform calculations based on the compute cluster. This is another reason why your design should have a 1:1 mapping between the datastore cluster and compute cluster.
With these line charts, we are tracking both performance and utilization. Take the lower of these two dimensions, because adding one capacity dimension gives you the other. This also keeps your storage in a simple building block.
What if you are using all-fl ash storage?
All-fl ash storage is becoming a common option in 2016. With SSDs, even with large capacity ones, there is a chance of you being bound by disk space and not performance. The second line chart helps you track the space left (in GB).
What if you are using distributed storage, such as VSAN?
This changes capacity management as you cannot perform compute and storage differently.
Since your storage is part of your compute, you need to look at them as one unit. So, look at the fi ve line charts together.

Capacity Monitoring
[ 96 ]
Adding compute means adding storage. It is true that adding storage does not mean adding compute if you have spare physical slots. However, that requires advance planning and intentionally choosing a server model with enough disk slots.
For VSAN, there is only one datastore, so there is no need for a datastore cluster.
Network monitoringFor network, you should use the same standard regardless of the tier. You should not expect dropped packets in your data center.
The ideal counter to measure is network latency. However, this is costly to measure at the VM level. It is also costly to measure for all packets. You could certainly generate a sample packet that measures the point-to-point latency at a given interval. However, that is not the actual latency experienced by the business. As a result, we have to use dropped packets as a proxy.
It's 2016. Your SDDC should be on 10 GE, as the chance of ESXi saturating one GE is not something you can ignore. The chance of ESXi saturating two 10 GE links is relatively lower, unless you run vSphere FT and VSAN (or another form of distributed storage).
To help you monitor, you can create the following:
• A line chart showing the maximum network dropped packets at the physical data center level. It is applied at the physical data center and not the vSphere cluster, as they eventually share the same core switches.
• A line chart showing the maximum and average ESXi vmnic at the same level as in the previous point. This will tell you whether any of your vmnics are saturated.
Here's a quiz to help you fi gure out the logic:
• In the first line chart, notice it only has the maximum line. We're not tracking the average dropped packets. Why is that so?
• In the second line chart, we're tracking at the vmnic level, not any other level (for example, distributed port group, distributed switch, or ESXi). Why is that so?
Chapter 5
[ 97 ]
ConclusionI hope the discussion in this section has given you a fresh perspective on how you should do capacity management in SDDC. Indeed, a few line charts are all you need for managing capacity. Yes, it is not a fully automated solution. However, our customers will fi nd it logical and easy to understand. It follows the 80/20 principle, where you are given 20 percent room to make a judgement call as the expert.
Ronald Buder and Sunny Dua, in their review of this book, shared that there are situations where you need to use the 95th percentile. This lets you have greater confi dence in your monitoring, as you can see whether the 5 percent is an exception. We will include this when we implement the dashboards in Part 2 of the book.
VDI capacity planningWe've covered a lot about SDDC. Let's include VDI, as it shows how capacity management changes when you include higher-level services (above your IaaS).
VDI differs from SDDC at the business level. It is much more than server workload versus desktop workload. With VDI, it is DaaS, which runs on top of the IaaS. So, the scope goes beyond IaaS. It includes the VDI VM (for example, Windows 7 and Windows 2008) and the Horizon infrastructure VM.
As a result, there are three areas where you need to monitor for capacity:
• The user's VDI VM: This is typically Windows 7 or Windows 10 64-bit. Different users have different workload profiles, even though they may use the same set of applications. I've seen users who use Microsoft Excel with large files and it needs six vCPUs!
• The Horizon server VM: This includes non-VMware products that complete your DaaS offering. Some products, such as F5 and Trend Micro, are in the data path, so you need to monitor them as their performance can impact the users' experience.
• The IaaS layer: This includes vSphere and the layer below it.

Capacity Monitoring
[ 98 ]
Other than the scope of the business, the workload itself differs. The table in the following fi gure summarizes the key differences:
VM rightsizingRemember the story in Chapter 4, Performance Monitoring, where you got blamed for a non-performing VM?
Well, part of it was your fault. You meddled with someone else's business.
Many IaaS teams are eager to help application teams downsize the VM. The number one reason is to save the company money. However, this approach is wrong. You need to approach it with respect to benefi t, not cost.
There are some tips you can give your customers and policies you can set to encourage VM rightsizing from the beginning.
For a start, keep the building blocks simple—one VM, one OS, one application, and one instance. So, avoid doing things such as having one OS running the web, app, and DB server or one Microsoft SQL server running fi ve instances of databases. The workload can become harder to predict as you cannot isolate them.
Implement a chargeback model that encourages the right behavior (for example, non-linear costing, where an eight-vCPU VM is charged more than eight times the cost of a one-vCPU VM).
Chapter 5
[ 99 ]
Adjust the size based on the peak workload for a production environment. A month-end VM needs to be sized based on the month-end workload. For a non-production environment, you may want to tell the application team to opt for a smaller VM, because the vSphere cluster where the VM is running is oversubscribed. The large VM may not get the CPUs it asks for if it asks for too many.
Be careful with VMs that have two distinct peaks, one for CPU resources and another for memory resources. I have seen this with a telecommunications client running Oracle Hyperion. For example, the fi rst peak needs eight vCPUs and 12 GB vRAM, and the second peak needs two vCPUs and 48 GB vRAM. In this case, the application team tendency is to size for 8 vCPUs and 48 GB vRAM. This results in an unnecessarily large VM, which can result in poor performance for both peaks. It is likely that there are two different workloads running in the VM, which should be split into two VMs.
Size correctly. Educate the application team that oversizing results in slower performance in the virtual world. Besides wasting company resources, there are several disadvantages of oversized VMs:
• It takes longer to boot. If a VM does not have a reservation, vSphere will create a swap file the size of the configured RAM.
• It takes longer to vMotion.• The RAM or CPU may be spread over a single socket. Due to the NUMA
architecture, the performance will be inferior.• It will experience higher CPU co-stop and CPU ready time. Even if not all
vCPUs are used by the application, the Guest OS will still demand all the vCPUs be provided by the hypervisor.
• It takes longer to snapshot, especially if a memory snapshot is included. With newer technology such as Virtual SAN, snapshots are faster and more scalable. Regardless, you should still aim for the right size.
• The processes inside the Guest OS may experience ping-pong. Depending on your configuration, the Guest OS may not be aware of the NUMA nature of the physical motherboard and may think it has a uniform structure. It may move processes within its own CPUs, as it assumes it has no performance impact. If the vCPUs are spread into different NUMA nodes, for example, a 20-vCPU VM on an ESXi host with two sockets and 20 cores, it can experience a ping-pong effect. For more details, read http://blogs.vmware.com/vsphere/2013/10/does-corespersocket-affect-performance.html by Mark Achtemichuk.

Capacity Monitoring
[ 100 ]
• There is a lack of performance visibility at the individual vCPU or virtual core level. As covered earlier in this book, a majority of the counters are at the VM level, which is an aggregate of all of its vCPUs. It does not matter whether you use virtual sockets or virtual cores.
Although standardization of VM size helps in making operations simpler, you should be fl exible for large cases. For example, once you pass six vCPUs, you need to consider every additional CPU carefully and ensure that the application can indeed take advantage of the extra threads.
You also need to verify that the underlying ESXi has suffi cient physical cores, as it will affect your consolidation ratio and, hence, your capacity management. You may see an ESXi that is largely idle yet the VMs on it are not performing, therefore impacting your confi dence about adding VMs.
At the VM level, you need to monitor the following fi ve components:
• Virtual CPU• Virtual RAM• Virtual network• Virtual disk IOPS• Usable disk capacity left in the Guest OS
Getting vCPUs and vRAM into a healthy range requires fi nding a balance. Undersizing leads to poor performance and oversizing leads to monetary waste as well as poor performance. The actual healthy range depends upon your expected utilization, and it normally varies from tier to tier. It also depends on the nature of the workload (online versus batch). For example, in tier 1 (the highest tier), you will have a lower range for the OLTP type of workload as you do not want to hit 100 percent at peak. The overall utilization will be low as you are catering for a spike. For batch workloads, you normally tolerate a higher range for long-running batch jobs, as they tend to consume all the resources given to them.
In a non-production environment, you normally tolerate a higher range, as the business expectation is lower (because they are paying a lower price).
Between CPU and RAM, you focus on CPU fi rst. Here are the reasons why reducing RAM should come secondary:
• If the VM has no RAM shortage, reducing RAM will not speed up the VM. With CPU, the VM will perform faster as it will have lower CPU contention.
• RAM monitoring is best done with counters inside the Guest OS. If you do not have this visibility, your recommendation can be wrong.
Chapter 5
[ 101 ]
• Reducing RAM requires manual reduction for apps that manage their own RAM (such as Java, SQL, and Oracle). VMware vCenter, for example, has three JVM instances and each has its RAM recommendation documented in vSphere.
• Reducing RAM can trigger more internal swapping in the Guest. This in turn generates I/O, making the storage situation worse.
• It's hard enough to ask the application team to reduce CPU, so asking them to reduce both CPU and RAM will be even harder. It's better that you ask for one thing and emphasize it well. In addition, if there is any issue after you reduce both CPU and RAM, you have to bring both back up, even though it was caused by just one of them.
Generally speaking, a virtual network is not something that you need to worry about from a capacity point of view. You can create a super metric in vRealize Operations that tracks the maximum of your entire vNIC utilization from all VMs. If the maximum is, say, 80 percent, then you know that the rest of the VMs are lower than that. You can then plot a chart that shows this peak utilization in the last three months. We will cover this in more detail in one of the use cases discussed in the fi nal chapter.
You should monitor the usable disk capacity left inside the Guest OS. Although vCenter does not provide this information, vRealize Operations does—provided your VM has VMware Tools installed (which it should have, as part of best practice).
Chapter 7, Capacity-Monitoring Dashboards, will include a dashboard that helps you rightsize VMs.
SummaryIn this chapter, we discussed how you should approach capacity management in a virtual data center. We saw that there is a fundamental shift, resulting in a two-tier model. The application team performs capacity management at the VM layer, and the infrastructure team performs it at the infrastructure layer.
In the infrastructure layer, we covered the three service tiers and how they differ in terms of capacity management. We covered the actual line charts you need for each service tier.
In Chapter 4, Performance Monitoring, we learned in depth how you should monitor things. We are now ready to dive deeper into the actual dashboards. Chapter 6, Performance-Monitoring Dashboards, will kick off the dashboard series. I'll start by showing you the performance dashboards.

Where to buy this book You can buy VMware Performance and Capacity Management - Second Edition from the
Packt Publishing website.
Alternatively, you can buy the book from Amazon, BN.com, Computer Manuals and most internet
book retailers.
Click here for ordering and shipping details.
www.PacktPub.com
Stay Connected:
Get more information VMware Performance and Capacity Management - Second Edition