vmw q2 fy2020 earnings conference callpat gelsinger, ceo ... (2) (4) $ 1.56 $ 0.43 $ ² $ 0.09 $...
TRANSCRIPT

©2019 VMware, Inc.
VMW Q2 FY2020 Earnings Conference Call

©2019 VMware, Inc. 22
Pat Gelsinger, CEO
▪
▪
▪

©2019 VMware, Inc. 33
Driving our customers’ digital transformation agenda
build, run, manage, connect and protect

©2019 VMware, Inc. 44
Pat Gelsinger, CEO
▪
o
o
o

©2019 VMware, Inc. 55
Pat Gelsinger, CEO
▪
o
o
o
o

©2019 VMware, Inc. 66
Pat Gelsinger, CEO
▪
▪
o
o

©2019 VMware, Inc. 77
Pat Gelsinger, CEO
▪
▪
▪
▪
▪
▪
▪

©2019 VMware, Inc. 88
Pat Gelsinger, CEO
▪
▪
▪
▪
▪
▪

©2019 VMware, Inc. 99
Pat Gelsinger, CEO
▪
▪
▪
▪
▪
▪

©2019 VMware, Inc. 1010
Pat Gelsinger, CEO
▪
▪
▪
▪
▪

©2019 VMware, Inc. 1111
Overview of Results: Revenue Highlights

©2019 VMware, Inc. 1212
Hybrid Cloud Subscription and SaaS

©2019 VMware, Inc. 1313
Income Statement Highlights

©2019 VMware, Inc. 1414
Select Financial Measures
©2019 VMware, Inc. 1515
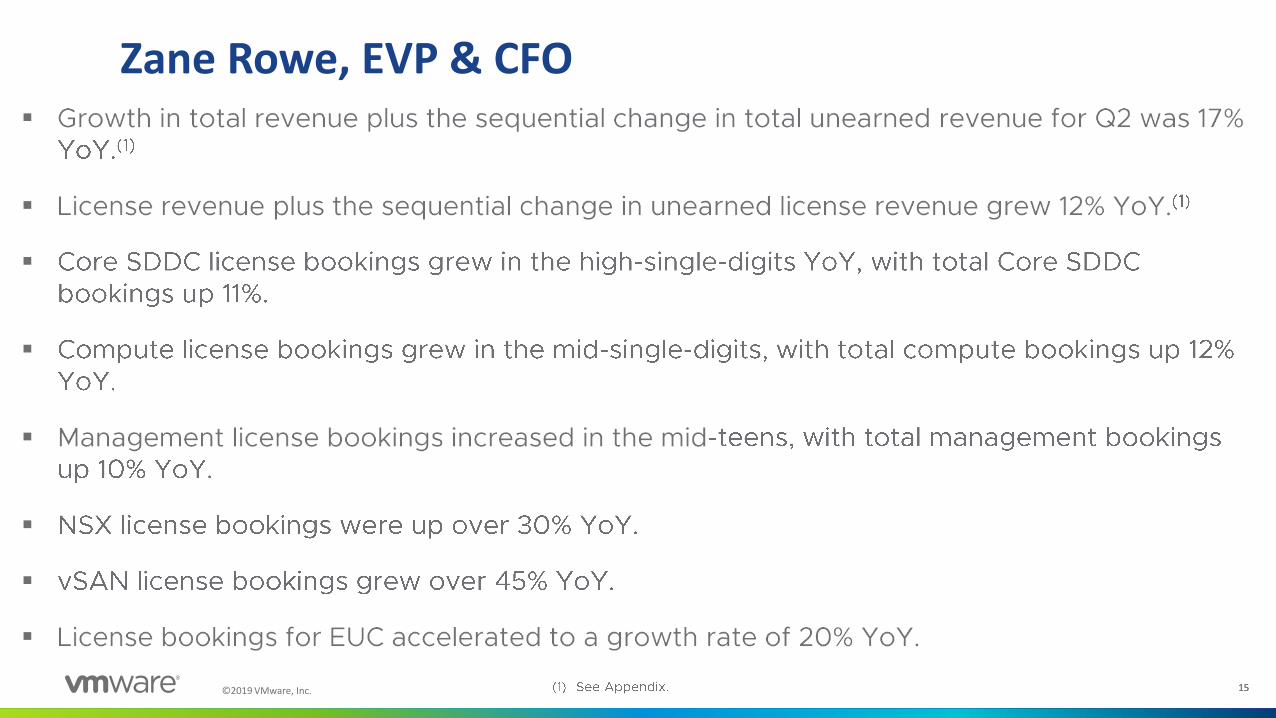
▪
▪
▪
▪
▪
▪
▪
▪
Zane Rowe, EVP & CFO

©2019 VMware, Inc. 1616
Guidance
FY20
Total Revenue $10.030B 11.8% YoY
License Revenue $4.215B 11.3% YoY

©2019 VMware, Inc. 1717
Guidance
FY20
Non-GAAP Operating Margin (1) 33%
Diluted Non-GAAP Net Income per share (1) $6.54
Diluted Share Count 417M
Non-GAAP Tax Rate(2) 16%
GAAP Tax Rate(2) See footnote 3

©2019 VMware, Inc. 1818
Guidance
FY20
Cash Flow From Operations $3.950B
CapEx $320M
Free Cash Flow(1) $3.630B

©2019 VMware, Inc. 1919
Guidance
Q3FY20
Total Revenue $2.405B 9.3% YoY
License Revenue $950M 7.5% YoY
Growth in total revenue plus the sequential
change in total unearned revenue Approximately 13% YoY

©2019 VMware, Inc. 2020
Guidance
Q3FY20
Non-GAAP Operating Margin (1) 30.3%
Diluted Non-GAAP Net Income per share (1) $1.42
Diluted Share Count 416M
Non-GAAP Tax Rate(2) 16%
GAAP Tax Rate(2) Approximately 8 to 10 points lower
than non-GAAP tax rate

©2019 VMware, Inc. 2121Confidential │ ©2018 VMware, Inc.
Our “any, any, any” vision continues to resonate
•
•
•

©2019 VMware, Inc. 22
accelerate our strategyWe are expanding our portfolio to
Pivotal
Carbon Black
Any Cloud | Any App | Any Device
Build Run Manage Connect Protect
©2019 VMware, Inc. 23
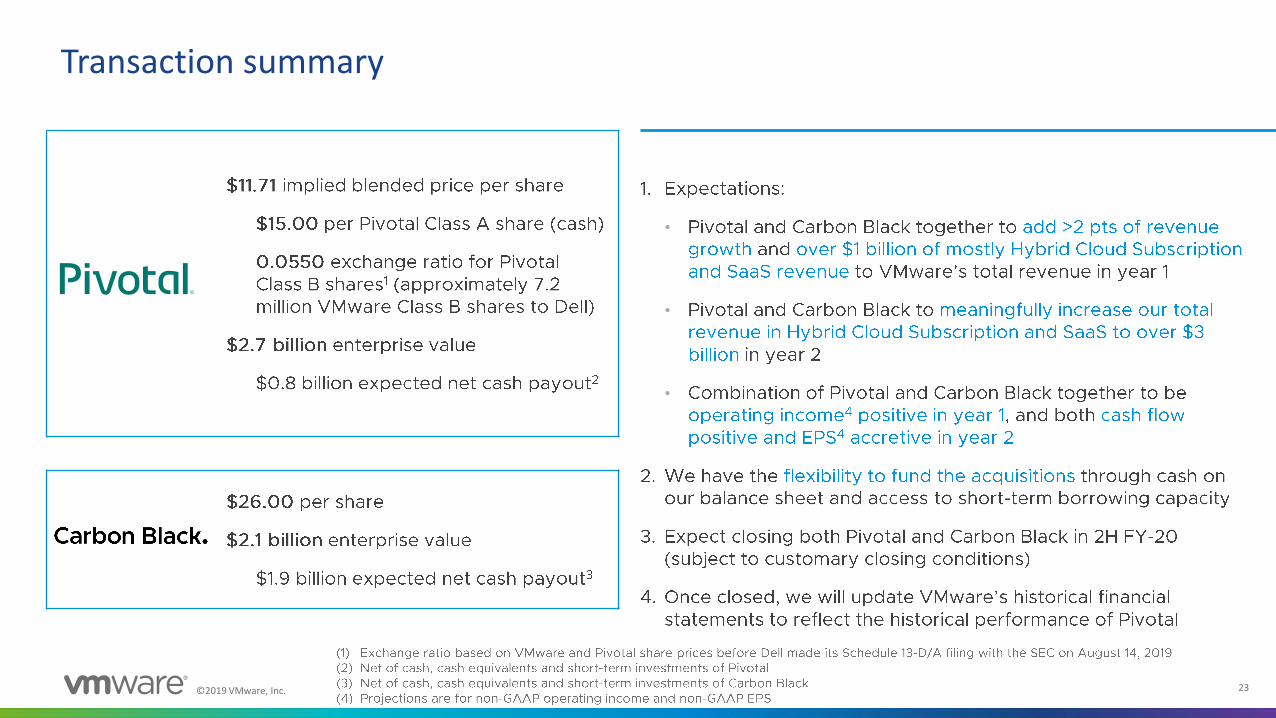
Transaction summary
•
•
•

24©2019 VMware, Inc. 24
Q&A

©2019 VMware, Inc. 2525
Appendix
Enterprise Agreements
47% of total bookings
14 deals over $10M
10 of the top 10 deals included EUC
10 of the top 10 deals included Management
9 of the top 10 deals included NSX
8 of the top 10 deals included vSAN

©2019 VMware, Inc. 2626
AppendixVMware, Inc.
RECONCILIATION OF GAAP TO NON-GAAP DATA
For the Three Months Ended August 2, 2019
(amounts in millions, except per share amounts, and shares in thousands)
(unaudited)
GAAPStock-Based
Compensation
EmployerPayroll Taxeson Employee
StockTransactions
IntangibleAmortization
Acquisition,Dispositionand Other
ItemsTax
Adjustment(1)
Non-GAAP,as adjusted
(2)
Operating expenses:
Cost of license revenue $ 50 — — (34) — — $ 16
Cost of services revenue $ 315 (17) — (1) — — $ 297
Research and development $ 554 (101) — — — — $ 452
Sales and marketing $ 797 (60) (4) (10) — — $ 724
General and administrative $ 200 (30) — — (22) — $ 148
Operating income $ 523 208 4 45 22 — $ 802
Operating margin(2) 21.5% 8.5% 0.1% 1.8% 0.9% — 32.9%
Other income (expense), net(3)
$ (502) — — — 515 — $ 12
Income before income tax $ 1 208 4 45 537 — $ 794
Income tax provision (benefit) $ (4,925)(4)
5,052 $ 127
Tax rate(2)
N/M(4)
16.0%
Net income $ 4,926 208 4 45 537 (5,052) $ 667
Net income per weighted-average share,diluted for Classes A and B
(2) (5)$ 11.83 $ 0.50 $ 0.01 $ 0.11 $ 1.29 $ (12.14) $ 1.60
N/M - Tax rate calculated on a GAAP basis is not considered meaningful.
(1) Non-GAAP financial information for the quarter is adjusted for a tax rate equal to our annual estimated tax rate on non-GAAP income. This rate is based on our estimated annual GAAP income tax rate forecast, adjusted to
account for items excluded from GAAP income in calculating the non-GAAP financial measures presented above as well as significant tax adjustments. Our estimated tax rate on non-GAAP income is determined annually
and may be adjusted during the year to take into account events or trends that we believe materially impact the estimated annual rate including, but not limited to, significant changes resulting from tax legislation, material
changes in the geographic mix of revenue and expenses, changes to our corporate structure and other significant events. Due to the dif ferences in the tax treatment of items excluded from non-GAAP earnings, as well as the
methodology applied to our estimated annual tax rates as described above, our estimated tax rate on non-GAAP income may differ from our GAAP tax rate and from our actual tax liabilities.
(2) Totals may not sum, due to rounding. Operating mar gin, tax rate and net income per weighted average share information are calculated based upon the respective underlying, non-rounded data.
(3) Non-GAAP adjustment to other income (expense), net includes gains or losses on equity investments, whether realized or unrealized. During the three months ended August 2, 2019, this adjustment primarily included an
unrealized loss of $538 million, which related to VMware's investment in Pivotal to adjust it to its fair value.
(4) During the second quarter of fiscal 2020, we completed an intra-group transfer of certain of our intellectual property rights to our Irish subsidiary , where our international business is headquartered. A discrete tax benefit of
$4.9 billion was recorded as a deferred tax asset. Due to the impact of the discrete tax benefit of $4.9 billion, the tax rate calculated on a GAAP basis is not considered meaningful.
(5) Calculated based upon 416,288 diluted weighted-average shares for Classes A and B.

©2019 VMware, Inc. 2727
AppendixVMware, Inc.
RECONCILIATION OF GAAP TO NON-GAAP DATA
For the Three Months Ended August 3, 2018
(amounts in millions, except per share amounts, and shares in thousands)
(unaudited)
GAAPStock-Based
Compensation
EmployerPayroll Taxeson Employee
Stock Transactions
IntangibleAmortization
Acquisition,Dispositionand Other
ItemsTax
Adjustment(1)
Non-GAAP,as adjusted
(2)
Operating expenses:
Cost of license revenue $ 45 — — (30) — — $ 16
Cost of services revenue $ 260 (12) — (1) (1) — $ 246
Research and development $ 481 (90) — — (1) — $ 390
Sales and marketing $ 696 (49) (2) (7) 1 — $ 637
General and administrative $ 182 (26) — — (7) — $ 150
Realignment and loss on disposition $ 1 — — — (1) — $ —
Operating income $ 509 177 2 38 9 — $ 735
Operating margin(2) 23.4% 8.2% 0.1% 1.7% 0.4% — 33.8%
Other income (expense), net(3)
$ 240 — — — (239) — $ 1
Income before income tax $ 772 177 2 38 (230) — $ 759
Income tax provision $ 128 (7) $ 121
Tax rate(2)
16.6% 16.0%
Net income $ 644 177 2 38 (230) 7 $ 638
Net income per weighted-average share,diluted for Classes A and B
(2) (4) $ 1.56 $ 0.43 $ — $ 0.09 $ (0.56) $ 0.02 $ 1.54
(1) Non-GAAP financial information for the quarter is adjusted for a tax rate equal to our annual estimated tax rate on non-GAAP income. This rate is based on our estimated annual GAAP income tax rate forecast, adjusted to
account for items excluded from GAAP income in calculating the non-GAAP financial measures presented above as well as significant tax adjustments, such as adjustments resulting from the U.S. Tax Cuts and Jobs Act
enacted on December 22, 2017 (the "2017 Tax Act"). Our estimated tax rate on non-GAAP income is determined annually and may be adjusted during the year to take into account events or trends that we believe
materially impact the estimated annual rate including, but not limited to, significant changes resulting from tax legislation, material changes in the geographic mix of revenue and expenses and other significant events. Due
to the differences in the tax treatment of items excluded from non-GAAP earnings, as well as the methodology applied to our estimated annual tax rates as described above, our estimated tax rate on non-GAAP income may
differ from our GAAP tax rate and from our actual tax liabilities.
(2) Totals may not sum, due to rounding. Operating mar gin, tax rate and net income per weighted average share information are calculated based upon the respective underlying, non-rounded data.
(3) Non-GAAP adjustment to other income (expense), net includes gains or losses on equity investments, whether realized or unrealized. During the three months ended August 3, 2018, this adjustment primarily included an
unrealized gain of $231 million, which related to VMware's investment in Pivotal to adjust it to its fair value.
(4) Calculated based upon 413,286 diluted weighted-average shares for Classes A and B.

©2019 VMware, Inc. 2828
AppendixVMware, Inc.
GROWTH IN REVENUE PLUS SEQUENTIAL CHANGE IN UNEARNED REVENUE
(in millions)
(unaudited)
Growth in Total Revenue Plus Sequential Change in Unearned Revenue
Three Months Ended
August 2, August 3,
2019 2018
Total revenue, as reported $ 2,439 $ 2,174
Sequential change in unearned revenue (1) 414 274
Total revenue plus sequential change in unearned revenue $ 2,853 $ 2,448
Change (%) over prior year, as reported 17%
Growth in License Revenue Plus Sequential Change in Unearned License Revenue
Three Months Ended
August 2, August 3,
2019 2018
Total license revenue, as reported $ 1,011 $ 900
Sequential change in unearned license revenue(2)
35 33
Total license revenue plus sequential change in unearned license revenue $ 1,046 $ 933
Change (%) over prior year, as reported 12%
(1) Sequential change in unearned revenue consists of the change in total unearned revenue from the preceding quarter . Total unearned revenue consists of current and non-current unearned revenue amounts presented in the condensed consolidated balance sheets.
(2) Unearned license revenue primarily consists of the allocated portion of VMware's SaaS offerings.

©2019 VMware, Inc. 2929
Appendix
GAAP Operating Margin 17.5% - 18.8% Projected 21.4% - 22.2% Projected
Stock-based Compensation 9.3% Estimated 8.5% Estimated
Employer Payroll Tax on Employee
Stock Transactions0.1% Estimated 0.1% Estimated
Intangible Amortization 1.7% Estimated 1.6% Estimated
Acquisition, Disposition and Other
Related Items0.7% Estimated 0.6% Estimated
Non-GAAP Operating Margin 30.3% Projected 33.0% Projected
(1) Values of items excluded from GAAP operating margin are estimates. While the aggregate of estimates may not foot,
in total we expect GAAP operating margin to be 11 to 13 percentage points less than non-GAAP operating margin.
(2) Values of items excluded from GAAP operating margin are estimates. While the aggregate of estimates may not foot,
in total we expect GAAP operating margin to be 11 to 12 percentage points less than non-GAAP operating margin.
Reconciliation of GAAP to Non-GAAP Operating Margin Guidance
Q3FY20 (Projected) FY20 (Projected)
(2)(1)
©2019 VMware, Inc. 3030
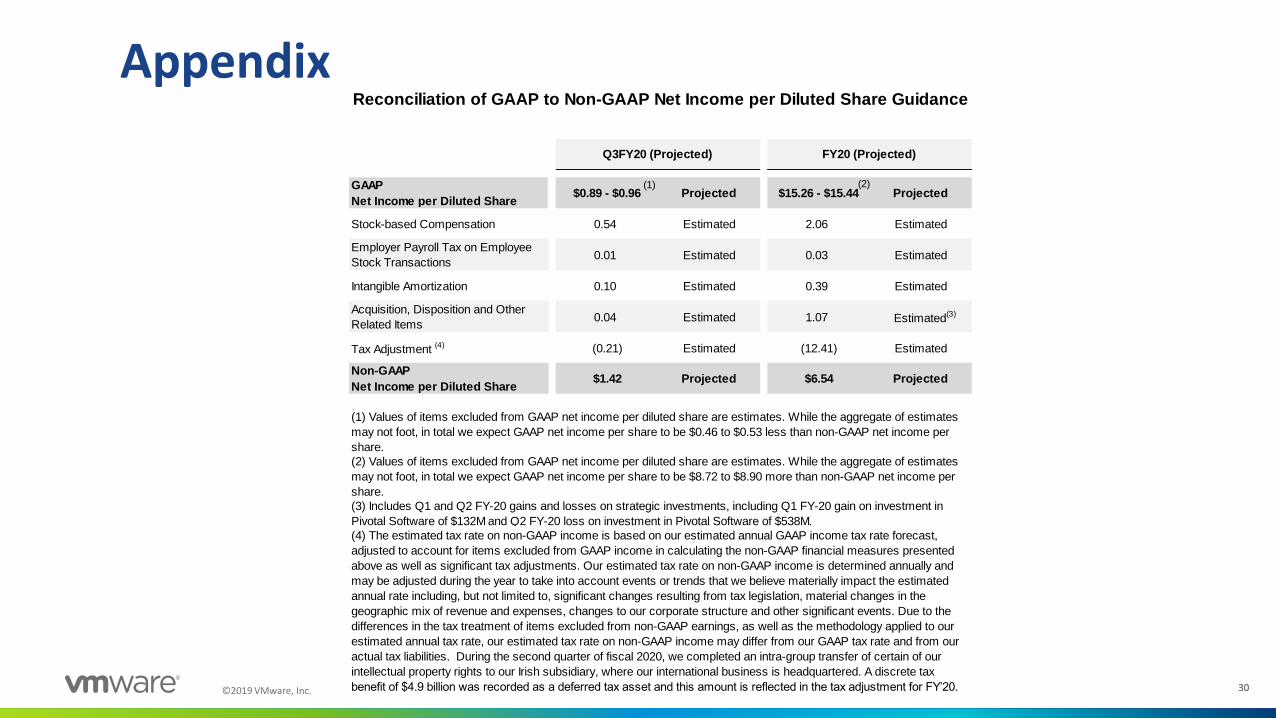
Appendix
GAAP
Net Income per Diluted Share$0.89 - $0.96 Projected $15.26 - $15.44 Projected
Stock-based Compensation 0.54 Estimated 2.06 Estimated
Employer Payroll Tax on Employee
Stock Transactions0.01 Estimated 0.03 Estimated
Intangible Amortization 0.10 Estimated 0.39 Estimated
Acquisition, Disposition and Other
Related Items0.04 Estimated 1.07 Estimated(3)
Tax Adjustment (4) (0.21) Estimated (12.41) Estimated
Non-GAAP
Net Income per Diluted Share$1.42 Projected $6.54 Projected
(4) The estimated tax rate on non-GAAP income is based on our estimated annual GAAP income tax rate forecast,
adjusted to account for items excluded from GAAP income in calculating the non-GAAP financial measures presented
above as well as significant tax adjustments. Our estimated tax rate on non-GAAP income is determined annually and
may be adjusted during the year to take into account events or trends that we believe materially impact the estimated
annual rate including, but not limited to, significant changes resulting from tax legislation, material changes in the
geographic mix of revenue and expenses, changes to our corporate structure and other significant events. Due to the
differences in the tax treatment of items excluded from non-GAAP earnings, as well as the methodology applied to our
estimated annual tax rate, our estimated tax rate on non-GAAP income may differ from our GAAP tax rate and from our
actual tax liabilities. During the second quarter of fiscal 2020, we completed an intra-group transfer of certain of our
intellectual property rights to our Irish subsidiary, where our international business is headquartered. A discrete tax
benefit of $4.9 billion was recorded as a deferred tax asset and this amount is reflected in the tax adjustment for FY’20.
(1) Values of items excluded from GAAP net income per diluted share are estimates. While the aggregate of estimates
may not foot, in total we expect GAAP net income per share to be $0.46 to $0.53 less than non-GAAP net income per
share.
(2) Values of items excluded from GAAP net income per diluted share are estimates. While the aggregate of estimates
may not foot, in total we expect GAAP net income per share to be $8.72 to $8.90 more than non-GAAP net income per
share.
Reconciliation of GAAP to Non-GAAP Net Income per Diluted Share Guidance
Q3FY20 (Projected) FY20 (Projected)
(3) Includes Q1 and Q2 FY-20 gains and losses on strategic investments, including Q1 FY-20 gain on investment in
Pivotal Software of $132M and Q2 FY-20 loss on investment in Pivotal Software of $538M.
(2)(1)

©2019 VMware, Inc. 3131
Forward-Looking Statements

©2019 VMware, Inc. 3232
Additional Information about the Pivotal Software Acquisition and Where to Find It

©2019 VMware, Inc. 3333
Additional Information about the Carbon Black Tender Offer & Where to Find It