vlrorjlfdoelrpdunhuvri3dunlqvrq ¬v glvhdvh john b
TRANSCRIPT

Journal of Neural Engineering
PAPER • OPEN ACCESS
Rapid motor fluctuations reveal short-timescaleneurophysiological biomarkers of Parkinson’sdiseaseTo cite this article: Minkyu Ahn et al 2020 J. Neural Eng. 17 046042
View the article online for updates and enhancements.
Recent citationsMulti-Dimensional, Short-TimescaleQuantification of Parkinson's Disease andEssential Tremor Motor DysfunctionJohn B. Sanderson et al
-
This content was downloaded from IP address 68.226.89.88 on 20/01/2021 at 23:35
J. Neural Eng. 17 (2020) 046042 https://doi.org/10.1088/1741-2552/abaca3
Journal of Neural Engineering
OPEN ACCESS
RECEIVED
9 March 2020
REVISED
24 July 2020
ACCEPTED FOR PUBLICATION
5 August 2020
PUBLISHED
24 August 2020
Original content fromthis work may be usedunder the terms of theCreative CommonsAttribution 4.0 licence.
Any further distributionof this work mustmaintain attribution tothe author(s) and the titleof the work, journalcitation and DOI.
PAPER
Rapid motor fluctuations reveal short-timescaleneurophysiological biomarkers of Parkinson’s diseaseMinkyu Ahn1,2,7,8, Shane Lee1,2,8, Peter M Lauro1,2,3, Erin L Schaeffer1, Umer Akbar3,4,5
andWael F Asaad1,2,3,4,6,91 Department of Neuroscience, Brown University, Providence, RI 02912, United States of America2 Robert J. and Nancy D. Carney Institute for Brain Science, Brown University, Providence, RI 02912, United States of America3 The Warren Alpert Medical School, Brown University, Providence, RI 02903, United States of America4 Norman Prince Neurosciences Institute, Rhode Island Hospital, Providence, RI 02903, United States of America5 Department of Neurology, Rhode Island Hospital, Providence, RI 02903, United States of America6 Department of Neurosurgery, Rhode Island Hospital, Providence, RI 02903, United States of America
E-mail: [email protected]
Keywords: Parkinson’s disease, neurophysiology, subthalamic nucleus, deep brain stimulation, biomarker, machine learning,motor behavior, oscillations
Supplementary material for this article is available online
AbstractObjective. Identifying neural activity biomarkers of brain disease is essential to provide objectiveestimates of disease burden, obtain reliable feedback regarding therapeutic efficacy, and potentiallyto serve as a source of control for closed-loop neuromodulation. In Parkinson’s disease (PD),microelectrode recordings (MER) are routinely performed in the basal ganglia to guide electrodeimplantation for deep brain stimulation (DBS). While pathologically-excessive oscillatory activityhas been observed and linked to PD motor dysfunction broadly, the extent to which these signalsprovide quantitative information about disease expression and fluctuations, particularly at shorttimescales, is unknown. Furthermore, the degree to which informative signal features are similar ordifferent across patients has not been rigorously investigated. We sought to determine the extent towhich motor error in PD across patients can be decoded on a rapid timescale using spectral featuresof neural activity. Approach.Here, we recorded neural activity from the subthalamic nucleus (STN)of subjects with PD undergoing awake DBS surgery while they performed an objective, continuousbehavioral assessment that synthesized heterogenous PD motor manifestations to generate a scalarmeasure of motor dysfunction at short timescales. We then leveraged natural motor performancevariations as a ‘ground truth’ to identify corresponding neurophysiological biomarkers.Mainresults. Support vector machines using multi-spectral decoding of neural signals from the STNsucceeded in tracking the degree of motor impairment at short timescales (as short as one second).Spectral power across a wide range of frequencies, beyond the classic ‘β’ oscillations, contributedto this decoding, and multi-spectral models consistently outperformed those generated using moreisolated frequency bands. While generalized decoding models derived across subjects were able toestimate motor impairment, patient-specific models typically performed better. Significance. Theseresults demonstrate that quantitative information about short-timescale PD motor dysfunction isavailable in STN neural activity, distributed across various patient-specific spectral components,such that an individualized approach will be critical to fully harness this information for optimaldisease tracking and closed-loop neuromodulation.
7 Current address: School of Computer Science and Electrical Engineering, Handong Global University, Pohang, South Korea.8 These authors contributed equally.9 Author to whom any correspondence should be addressed.
© 2020 The Author(s). Published by IOP Publishing Ltd

J. Neural Eng. 17 (2020) 046042 M Ahn et al
AUC area under-the-curveCT computed tomographyDBS deep brain stimulationLFP local field potentialMER microelectrode recordingsMES motor error scoreMRI magnetic resonance imagingPD Parkinson’s diseaseROC receiver operating characteristicSTN subthalamic nucleusSVM support vector machineSVR support vector regressionUPDRS Unified Parkinson’s Disease Rating
Scale
1. Introduction
Parkinson’s disease (PD), one of the most preval-ent neurodegenerative conditions [1], is typified bymotor and cognitive dysfunction that occur in thesetting of pathologically-increased oscillatory neuralactivity in the basal ganglia [2–5]. Lower frequencyoscillations, particularly those in the β (~12–30 Hz)range, have emerged as potential biomarkers forPD motor dysfunction based primarily upon rel-atively longer timescale observations of abundantβ oscillations in the unmedicated PD state anddecreased β power in response to therapy (dopam-inergic medications or DBS) [6–11]. Critically, therelevance of those observations for the moment-to-moment, ongoing manifestation of symptoms onshorter timescales is less well understood. Much ascold temperature is permissive but not causal of snow,it may be the case that β oscillations reflect con-ditions favorable for the expression of PD symp-toms, while separate or additional features of neuralactivity modulate the immediate dynamics of motordysfunction.
PD is characterized by a range of signs and symp-toms that may include bradykinesia, rigidity, rest-ing tremor, and postural/gait instability, which areheterogeneously manifested across individuals [12–15]. Disease severity is typically measured using theUnified Parkinson’s Disease Rating Scale (UPDRS).Unfortunately, although well-validated [16–18], thisscale ultimately relies upon subjective patient andclinician assessments and is not intended to cap-ture fluctuations in motor behavior on the times-cale of seconds. More objective, quantitative exam-ination of PD patients’ movements revealed that,within individuals, a large dynamic range of move-ment speed is preserved but shifted towards slowermovements [19, 20]. Remarkably, faster movementsthat approach normal subject velocities (and thatmaintain normal movement accuracies) can be eli-cited [21], highlighting the impressive residual motorcapacity that persists in this condition. Meanwhile,
PD patients are notably impaired in their abilityto correct for visible target deviations during ongo-ing movement [22]. Based upon these observations,we hypothesized that quantifying natural motorvariability in the context of a simple, continuous-performance, visual-motor task may allow the identi-fication of neurophysiological biomarkers associatedwith fluctuating motor states.
Our overall strategy was as follows: (1) Engage PDsubjects in a continuous motor performance task toelicit natural motor variability and quantify this vari-ability with an array of metrics at short timescales;(2) Apply a machine learning algorithm to determ-ine weights for each of these metrics that maxim-ally differentiate each patient’s motor performancefrom that of control subjects performing the sametask to generate an objective, patient-specific, scalarmeasure of motor impairment in each short timeinterval; (3) Examine oscillatory activity in the sub-thalamic nucleus (STN)while subjects performed thistask to determine the manner and extent to whichneural signals capture each patient’s fluctuatingmotor impairment.
2. Materials &methods
2.1. SubjectsAll patients undergoing routine, awake placementof deep brain stimulating electrodes for intractable,idiopathic PD between June 2014 and September2018 were invited to participate in this study. PDpatients were selected and offered the surgery by amulti-disciplinary teambased solely upon clinical cri-teria, and the choice of the target (STN vs. Globus pal-lidus internus) was made according to each patient’sparticular circumstance (disease manifestations, cog-nitive status and goals). In this report, we focusedon patients undergoing STN DBS (n = 22). Patientswere off all anti-Parkinsonian medications for at least12 h in advance of the surgical procedure (meanand standard deviation of UPDRS III scores was50.95 ± 13.6, n = 21). Approximately age-matchedcontrols (often patients’ partners) also participated inthis study (n= 15); patients were aged 47.5–78.5 years(mean 64.3), and controls were aged 48.3–79.2 years(mean 62.6) at the time of testing (t-test compar-ing the age distributions: p = 0.56). Controls wererequired simply to be free of any diagnosed or sus-pected movement disorder and to have no physicallimitation preventing them from seeing the display ormanipulating the joystick. There was a strong male-bias in the patient population (20M, 2 F) and a femalepreponderance in the control population (3M, 12 F),reflecting weaker overall biases in the prevalenceof PD and the clinical utilization of DBS therapy[23].
2
J. Neural Eng. 17 (2020) 046042 M Ahn et al
Patients and other subjects agreeing to parti-cipate in this study signed informed consent, andexperimental procedures were undertaken in accord-ance with an approved Rhode Island Hospital humanresearch protocol (Lifespan IRB protocol #263157)and the Declaration of Helsinki. Data from allpatients who enrolled and took part in this study arepresented here.
2.2. Behavioral taskWe employed a target-tracking task to estimate thedegree of motor dysfunction in a continuous fash-ion. Specifically, while PD subjects reclined on theoperating bed in a ‘lawn-chair’ position, a joystickwas positioned within their dominant hand, and aboom-mounted display was positioned within theirdirect line-of-sight at a distance of ~60–90 cm. Thetask was implemented in MonkeyLogic [24, 25] andrequired subjects to follow a green target circle thatmoved smoothly around the screen by manipulat-ing the joystick with the goal of keeping the whitecursor within the circle (figure 1(a)). The target circlefollowed one of several possible paths (invisible tothe subject), with each trial lasting 10–30 s. Eachsession consisted of up to 36 trials (~13 min oftracking data), and subjects performed 1–4 sessionsduring the operation, as time and patient comfortallowed. Control subjects performed this task in anextra-operative setting.
2.3. Motor metrics &motor error score (MES)Several measures of motor performance were appliedto this task in a small time windows. These meas-ures consisted of tremor (the magnitude of the 3–10 Hz band-pass filtered x- and y- joystick traces)and other metrics calculated after low-pass filteringthe x- and y-joystick traces below 3 Hz. Eight metricswere defined from the movement of the cursor andthe target. The cursor position at time t was definedas C(t) = (xc (t) ,yc (t)), and the target position wasdefined similarly as T(t) = (xT (t) ,yT (t)).
Tremor magnitude (TM) was calculated by tak-ing ∥ Ca (t) ∥, where ∥ · ∥ was defined as the Euc-lidean norm, taken of the analytic signal Ca (t),which was derived from applying the Hilbert trans-form to the tremor-filtered components of C(t).Absolute distance (AD) was defined as ∥ C(t)−T(t) ∥. Vector Error (VE) was defined as the vec-tor difference Tt − Ct between the cursor vectorsegment Ct = CtCt+∆t and the target vector seg-ment Tt = TtTt+∆t, for ∆t= 1 ms. Instantaneouscursor speed was defined as Sct =∥ Ct ∥ /∆t, andsimilarly, target speed was STt =∥ Tt ∥ /∆t. Slow-ness (SL) was defined as an exponential decay ofthe cursor speed, exp(−0.042 · Sct). Speed differ-ence (SD) was defined as the difference in cursorspeed and target speed at time t, Sct − STt . Excur-sion difference (ED) was defined as the difference
in the excursions of the cursor and target from theorigin at the center of the display, ∥ T(t) ∥ − ∥C(t) ∥. Vector angle (VA) was defined as the anglebetween Ct and Tt:
cos−1(
Ct·Tt
∥Ct∥∥Tt∥
).
Correction angle (CA) was defined as the anglebetween the Tt and the vector segment representingthe optimal path Ot from C(t) to the target, CtTt:
cos−1(
Ot·Tt
∥Ot∥∥Tt∥
).
Metrics were initially calculated using 100 mscontiguous, non-overlapping epochs for the behavi-oral timescale analysis. Metrics were subsequently re-calculated over longer epochs (1–10 s) to align withneural data at the relevant timescale for each analysis.Because the motor manifestations of PD are hetero-genous, for each PD subject we sought to determ-ine the combination of metric weights that maxim-ally captured their individualmotor signs.We applieda linear support vector machine (SVM) algorithmto define the hyperplane in the eight-dimensionalmetric-space that optimally separated a PD sub-ject’s performance from that of controls. In otherwords, for each PD subject, the distribution of eight-dimensional data points for each epoch of perform-ance was compared to the aggregate distribution ofcontrol subject data points (sub-sampled as needed tomaintain equal numbers across groups for SVM bin-ary classification). In all these cases, 100-fold MonteCarlo cross validation was performed using a 2:1 splitof the data into training and testing portions. Theparameters defining this hyperplane corresponded tothe weights applied to the different metrics. The nor-mal distance from each PD subject’s data points (eachrepresenting performance during one epoch) to thehyperplane was defined as the ‘Motor Error Score’(MES).
2.4. Surgical procedureMicroelectrode recordings (MER) from the region ofthe STN of awake patients are routinely obtained inorder to map the target area and guide DBS electrodeimplantation. A single dose of short-acting sedativemedication (typically propofol or dexmedetomidine)was administered before the start of each procedure,at least 60–90min prior tomicroelectrode recordings.The initial trajectory planned for three electrodes(anterior, center, and posterior) was determined onhigh-resolution (typically 3 T) magnetic resonanceimages (MRI) co-registered with CT images demon-strating previously-implanted skull-anchor fiducialmarkers. A 3D printed stereotactic platform (STar-Fix micro-targeting system, FHC Inc. Bowdoin, ME)was then created such that it could be affixed to theseanchors, providing a precise trajectory to each target[17]. Microdrives were attached to the platform and
3

J. Neural Eng. 17 (2020) 046042 M Ahn et al
Figure 1.Motor task and behavior. (A) A continuous motor performance task was used to assess fluctuations in PD motorperformance at short timescales. Subjects were instructed to manipulate a joystick to direct a cursor (white) to follow a movingtarget (green circle) as closely as possible. Yellow arrows depict example trajectories (not displayed to the subjects) with the targetfollowing a preset path, (also invisible to the subject, shown here as a dark lemniscate). (B) A library of eight motor metrics wascreated to quantify potential deviations of the cursor from the target. The calculation of three metrics is depicted here (all eightmetrics are defined below). The per-epoch estimates of each metric created a distribution in 8-dimensional space; the distributionfor a PD subject was compared to those of control subjects via SVM classification. The normal distance from the SVM-definedhyperplane to each point was then defined as the MES for that epoch. (C) Initially, the MES was calculated in contiguous 100 msepochs, and the autocorrelation was computed to determine the approximate timescale of motor fluctuations. Based on a 3-sigmathreshold, the central peak spanned ~ 1 s in controls and ~ 7.2 s in PD subjects. (D) The PD and control distributions of MESscores at the 7 s timescale were highly discriminable (mean AUC across individuals= 0.99; dark lines= average distributions;lighter lines= individual participants; other timescales shown in supplementary figure 1(C))stacks.iop.org/JNE/17/046042/mmedia.
then loaded with microelectrodes. Recordings weretypically conducted along the anterior, center, andposterior trajectories, corresponding to the axis ofhighest anatomical uncertainty based upon the lim-ited visualization of the STN on MRI. Additional lat-eral and medial electrodes were utilized when neces-sary for the clinical care. Electrodes were arranged in aBen-gun configuration and were separated by 2 mm.Recordings were referenced to all six or more cannu-lae inserted bilaterally along each target-specific tra-jectory, with each terminating 15mmabove theMRI-estimated target.
MER began about 10–12 mm above the MRI-estimated target, which was chosen to lie near theinferior margin of the STN, about two-third of thedistance laterally from its medial border. The STNwas identified electrophysiologically as a hyperactiveregion typically first encountered about 3–6 mm
above estimated target. At variable intervals, whenat least one electrode was judged to be within theSTN, electrode movement was paused in order toassess neural activity and determine somatotopic cor-respondence, as per routine clinical practice. At thesetimes, if patients were willing and able, additionalrecordings were obtained in conjunction with patientperformance of the visual-motor task.
2.5. Neurophysiological signals & analysisNeural signals from the first four patients wereacquired with FHC tungsten electrodes and an FHCdata acquisition system (FHC Inc. Bowdoin, ME,USA), with signals split into a Plexon MAP system(Plexon Inc. Dallas, TX, USA); data for the sub-sequent 18 patients were recorded using ‘Neuro-Probe’ tungsten electrodes and Neuro Omega dataacquisition systems (Alpha Omega, Inc. Nazareth,
4

J. Neural Eng. 17 (2020) 046042 M Ahn et al
Israel). Electrode impedances were typically400–700 kΩ.
Patients performed up to four sessions of thetask, with electrodes positioned at different depthsfor each session. Electrodes were not independ-ently positionable, so some signals were necessarilyacquired outside of the STN. All recorded signalswere nevertheless considered and analyzed. Behavi-oral data from each session were processed throughan SVM model, as above, to generate the MESdistributions, which were then compared againstneural activity acquired simultaneously on individualelectrodes.
Data were analyzed in MATLAB (Mathworks,Natick, MA) and Python 3 (python.org). Local fieldpotentials (LFPs) from the microelectrodes were ini-tially acquired at 40–44 kHz. Offline, signals werenotch filtered at 60 Hz and its first four harmonics.Time series were z-scored, and artifacts above fourstandard deviations were removed. These signals werebandpass filtered from 3–400 Hz and then down-sampled to 1 kHz. Spectral estimates were obtainedthrough fast Fourier transform (FFT) convolutionof LFPs with finite impulse response filters. Filterswere calculated at 1 Hz intervals with a bandwidth of2 Hz, covering 3–400 Hz (the use of non-overlappingfrequency bins resulted in qualitatively similar res-ults). The power was calculated by multiplying theconjugate of the Hilbert Transform by the filteredsignal in each band. For visualization (figures 2(c)and 3(c)), spectral power was log-normalized andmin-max scaled from 0 to 1 for each electrode.We defined six ‘canonical’ frequency bands (θ/α
def=
4–12 Hz, βdef= 12–30 Hz, γlow
def= 30–60 Hz, γmid
def= 60–100 Hz, γhigh
def= 100–200 Hz, ‘very high fre-
quency’ or vhfdef= 200–400 Hz), each consisting of
seven sub-bands (supplementary figure 2). The widthof each band scaled approximately with the fre-quency because a particular absolute interval in a
higher frequency range was likely to be less inform-ative than the same interval in a lower frequencyrange. Activity in the vhf range, which is thought toreflect multiunit spiking activity, was included spe-cifically in consideration of evidence that PD may bemarked by pathological spike-field coupling with β
oscillations [27–30].Our goal was to determine which spectral fea-
tures best corresponded to the MES on short times-cales (corresponding to 1–10 s epochs of task per-formance and neural data acquisition). To this end,the Spearman correlation of MES with LFP power inparticular frequency bands was calculated. Further,to understand if a combination of spectral featuresmight serve as a better marker for MES, continuousdecoding of MES was undertaken with a support vec-tor regression (SVR) processing layer using the nor-malized power-spectral features of the LFP signals.
For any particular set of spectral features, SVR estima-tion accuracy was assessed with 100-foldMonte Carlocross-validation using a 2:1 training/testing split ofeach data set. The max-normalized SVR weightswere examined to understand the contribution ofparticular frequency bands to MES classificationaccuracy [31]. Both non-linear (radial basis kernel,ε = 0.01) and linear SVR were employed, the formerto assess the performance capability of this tech-nique and the latter to allow examination of feature-weight coefficients. Both methods yielded qualitat-ively similar overall decoding performance acrosstimescales (1–10 s).
To make certain machine learning models werenot overtrained and/or reliant on spurious associ-ations between behavior and neural activity, a boot-strap procedure was performed in which the corres-pondence between MES and neural activity in eachepoch was randomized and additional SVR modelswere then generated using the same parameters andcross-validation techniques. Decoding performanceof these models was generally quite poor and there-fore suggested the performance obtained in the ori-ginal models was not spurious or due to overfitting.The results of these control analyses are shown in therelevant figures.
SVR coefficients (‘weights’) were examined tounderstand what neural features contributed to MESdecoding. Permutation tests were used to determ-ine the significance of these SVR weights and pat-terns. To assess whether there were clusters of fre-quency bands with higher or lower weights thanexpected by chance, a contiguity-sensitive permuta-tion test was performed where the mean SVRweight values were shuffled with respect to frequencyover 10 000 iterations and the null distribution ofweights over 3–7 contiguous bands was computed.The probability of the observed weight distribu-tions over multiple, adjacent frequency bands wasthen determined using this null distribution as ref-erence. To determine if cross-frequency patterns ofSVR weight assignments existed, a cross correlationbetween feature weights for every pair of frequen-cies was calculated, across SVR models; autocorrel-ations (points along the diagonal) were excludedfrom this calculation (diagonal points were filled-inwith the means of the adjacent non-diagonal pointsfor the purposes of visualization). Areas of signi-ficance within this matrix were computed using abootstrap procedure in which the assignment of fre-quency feature weight to LFP signal was shuffled1000 times to create null distributions for eachpoint on the matrix; the probability of an observedvalue was then calculated with respect to this nulldistribution.
Unless otherwise specified, statistical testscomparing observed classification or estimationaccuracies with those from shuffled MES-neural data
5
J. Neural Eng. 17 (2020) 046042 M Ahn et al
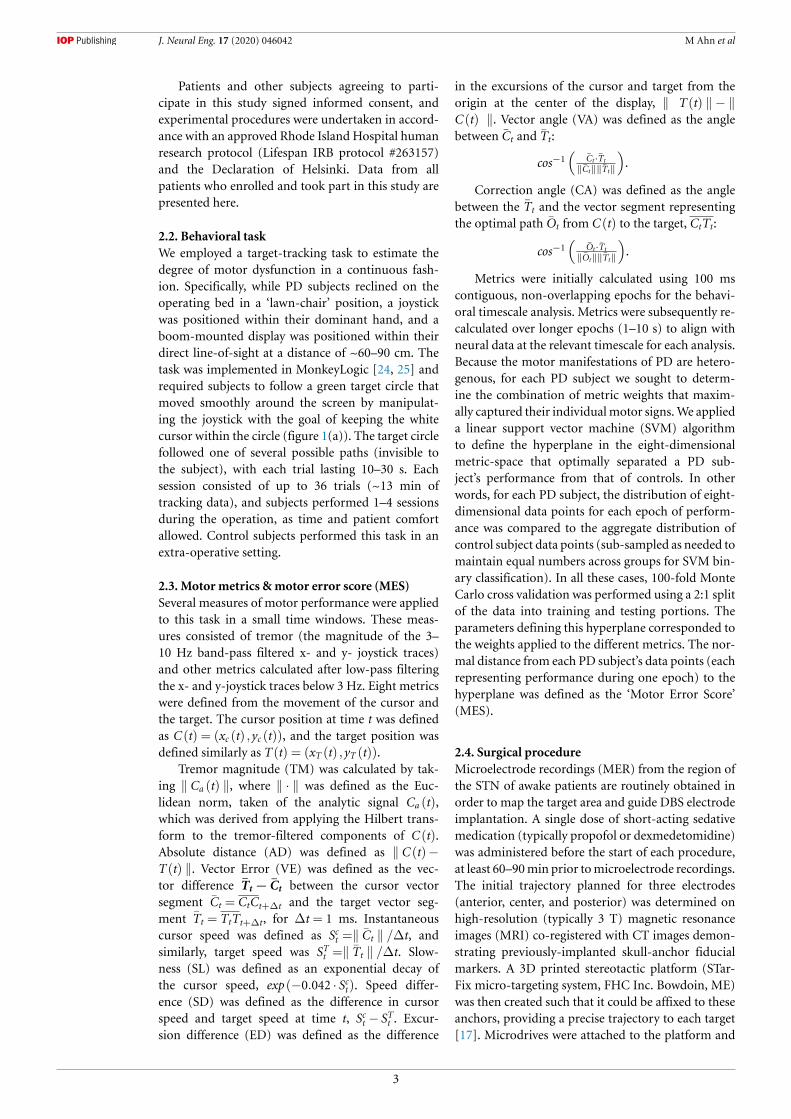
Figure 2. Recording trajectories, locations and signals. (A) Typical trajectories through the STN. (B) Density plot of recordinglocations on an MNI reference volume, with the approximate outline of the STN overlaid in black. Data are plotted for the 20 of22 patients (140 of 161 recordings) for whom adequate imaging was available. (C) Three examples of neural data aligned tobehavior from three different PD subjects, including decomposition of the LFP signal into the corresponding spectrogram. In thetop panel of each example, X- and Y-cursor position (dark red and blue, respectively) are plotted over X- and Y-target position(lighter red and blue, respectively). The MES at corresponding time points is shown below those panels (green). The analyticalstrategy presented here focused on relationships between spectral features of the STN LFP and the MES.
sets were performed using a Mann-Whitney U test.TheWilcoxon paired test was employed when distinctmodels were run on identical cross-validation datasets. Where appropriate, p-values were adjusted formultiple comparisons using the Benjamini-Hochbergprocedure (false discovery rate, q= 0.05) [32].
2.6. Classification of Symptom ProfilesFor some analyses, we assigned patients to one oftwo subtype categories: tremor dominant (TD) ornon-tremor dominant (nTD) (21 total patients withUPDRS scores, 9 TD, 12 nTD), based on UPDRSsub-score ratios of Jancovic and colleagues [33].All patients that failed to meet threshold for tremordominance (ratio of tremor to PIGD sub-scores lessthan 1.5) were classified as nTD. To assess correl-ations between tracking task metrics and UPDRS-III components, we considered items (Rest/Posturaltremor, Finger Taps, Hand Opening/Closing, Rapid
Alternating Movements, Rigidity) pertaining tothe upper extremity relevant to the subject’s taskperformance.
2.7. Anatomical reconstruction of recording sitesPatients typically underwent pre-, intra- and post-operative imaging. Preoperatively, stereotactic pro-tocol Magnetic Resonance (MR) images wereobtained (Siemens Vario 3.0 T scanner) that includedT1- and T2-weighted sequences (T1: MPRAGEsequence; TR: 2530 ms, TE: 2.85 ms, matrix size:512 512, voxels: 0.5 0.5 mm2 in-plane resolu-tion, 224 sagittal slices, 1 mm slice thickness; T2:SPACE sequence, TR: 3200 ms, TE: 409 ms, matrixsize: 512 512, voxels: 0.5 0.5 mm2 in-plane res-olution, 224 sagittal slices, 1 mm slice thickness).Pre-operative, intra-operative (in most cases), andpost-operative (in some cases) computed tomo-graphy (CT) scans were also acquired (Extra-Op CT:
6

J. Neural Eng. 17 (2020) 046042 M Ahn et al
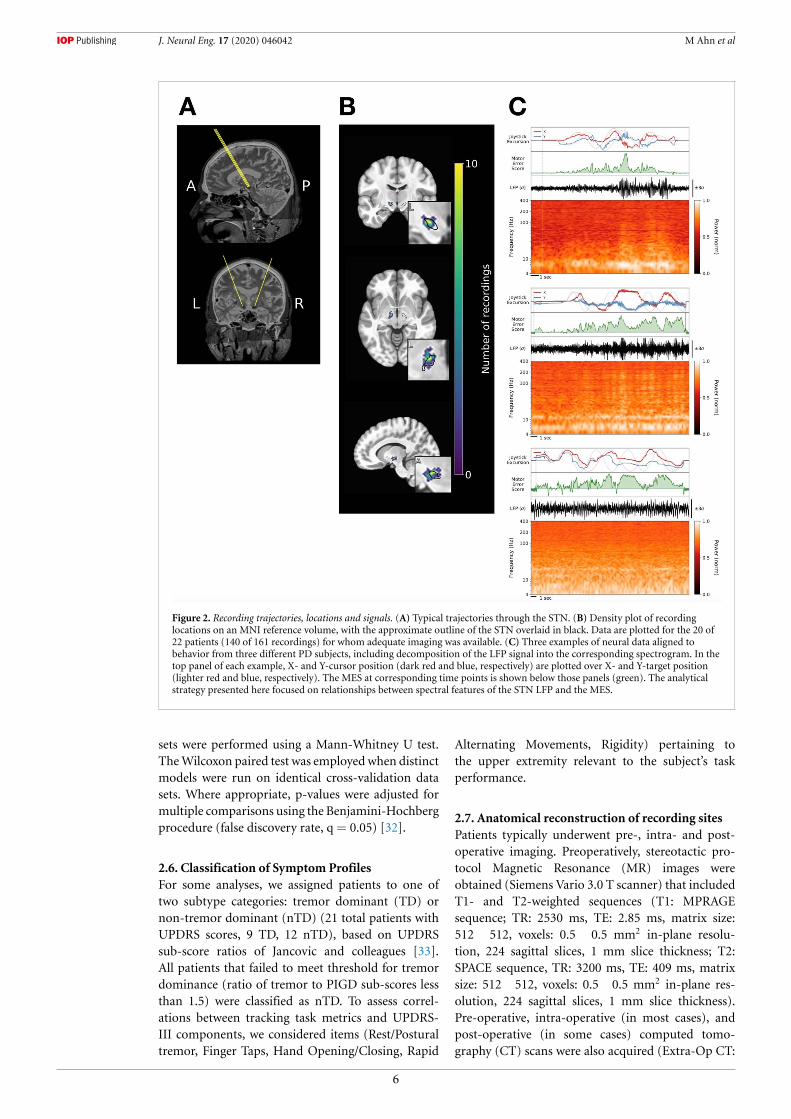
Figure 3. Correlations between STN neural activity and MES. (A) Examples from six PD subjects demonstrating relationshipsbetween β power (blue) and motor performance fluctuations as measured by the MES (green). Horizontal scale bars (black)indicate 10 s. (B) Distribution of Spearman correlation magnitudes between MES and θ/α (4–12 Hz), β (13–30 Hz), low γ(30–60 Hz), mid γ (60–100 Hz), high γ (100–200 Hz) or vhf (200–400 Hz) activity across all 22 PD subjects and 161 recordings;red portions of bars denote significant correlations (p < 0.05, corrected for multiple comparisons). Note the increasing presenceof signals with significant negative correlations in the higher frequency bands. Sig. positive corr.: θ/α (49), β (35), low γ (27), midγ (28), high γ (35) or vhf (32). Sig. negative corr.: θ/α (8), β (5), low γ (3), mid γ (1), high γ (16) or vhf (27). (C) Spectrogramexamples with epochs (7 s time slices) sorted according to increasing MES. The overlaid white line shows the corresponding MESacross epochs.
GE Lightspeed VCT Scanner; Tube voltage: 120 kV,Tube current: 186 mA, data acquisition diameter:320 mm, reconstruction diameter: 250 mm, matrixsize: 512 512 voxels, 0.488 0.488 mm2 in-planeresolution, 267 axial slices, 0.625 mm slice thickness;Intra-Op CT: Mobius Airo scanner, Tube voltage: 120kV, Tube current: 240 mA, data acquisition diameter:1331 mm, reconstruction diameter: 337 mm, matrixsize: 512 × 512 voxels, 0.658 × 0.658 mm2 in-planeresolution, 182 axial slices, 1 mm slice thickness). MRand CT images were then fused via linear registra-tion using a mutual information algorithm in FHCWaypoint Planner software (version 3.0, FHC Inc.Bowdoin, ME, USA). Localization of the target reliedupon a combination of direct and indirect targeting,utilizing the visualized STN as well as standard ste-reotactic coordinates relative to the anterior and pos-terior commissures. Appropriate trajectories to thetarget were then selected to avoid critical structuresand to maximize the length of intersection with theSTN.
Postoperative MR images (Siemens MagnetomAera 1.5 T scanner, T1: MPRAGE sequence, TR:2300 ms, TE: 4.3 ms, matrix size: 256 256 voxels, 1.0 1.0 mm2 in-plane resolution, 183 axial slices, 1 mmslice thickness, specific absorption rate < 0.1 W g−1)were typically obtained 1–2 d after the operation toconfirm proper final electrode location.
To reconstruct recording locations, MR and CTimages were co-registered using the FHC Waypo-int Planner software. The raw DICOM images and
the linear transform matrices were exported andapplied to reconstructed image volumes using theAFNI command ‘3dAllineate,’ bringing them into acommon coordinate space [34]. Depths were calcu-lated by combining intraoperative recording depthinformation with electrode reconstructions obtainedfrom intra- or postoperative images using methodsdescribed previously [35, 36].
To determine the anatomical distribution ofrecording sites across patients, pre-operative T1-weightedMR images were registered to a T1-weightedMNI reference volume (MNI152_T1_2009 c) usingAFNI’s ‘3dQwarp’ command [26]. The resultingpatient-specific transformation was then applied torecording site coordinates. MNI-warped recordingcoordinates were then assessed for proximity tothe STN as delineated on the MNI PD25 atlas[38–40].
2.8. Data availabilityDe-identified data and relevant analysis code may beshared upon request for collaborativeworkwith otherresearch groups.
3. Results
3.1. Quantification of PDmotor behavior on shorttimescalesPD patients undergoing awake implantation of STNDBS electrodes (n = 22) and control subjects in
7
J. Neural Eng. 17 (2020) 046042 M Ahn et al
the clinic setting (n = 15) performed a track-ing task in which they followed an on-screen tar-get using a joystick-controlled cursor (figure 1(a)).Because the heterogeneity of motor impairment inPD was unlikely to be associated with some nar-row aspect of performance on this task, we defineda library of eight–motor metrics that tiled the spaceof potential movement error. We sought to under-stand whether distinct symptoms of PD were mani-fested uniquely within this task. To understand howthe metrics were related to symptom profile, acrossall subjects, we correlated the median of each met-ric distribution (7 s estimates) with UPDRS III sub-scores, which predictably demonstrated significantcorrelation between Tremor Magnitude and UPDRSResting Tremor (supplementary figure 4(A); Spear-man ρ = 0.70, p = 0.0001, comparison to bootstrapnull distribution of 1000 samples, corrected for mul-tiple comparisons).
We next combined the individual metrics into asingle score reflecting the degree of motor impair-ment within each time window. Specifically, a lin-ear support vector machine (SVM) was applied tothe metric values in each epoch to determine, foreach patient, the optimal weighting of those met-rics to achieve maximal separation of PD perform-ance from control performance. Patients who were‘tremor dominant’ (TD), based upon the ratio oftheir tremor related vs. postural/gait-related UPDRSIII sub-scores (see Methods), tended to have greaterweights assigned to the Tremor Magnitude met-ric, whereas ‘non-tremor dominant’ (nTD) patientstended to have greater weights assigned to Abso-lute Distance and Correction Angle (supplementaryfigure 4(b)). To obtain a scalar measure of move-ment quality for each epoch of motor performance,we defined the ‘motor error score’ (MES) as thenormal distance from a motor performance epochdata point to the SVM hyperplane in metric space.Higher MES reflected increased motor impairment(figure 1(b)). The MES served as a single compos-ite measure of motor error weighted according tothose particular metrics that best distinguished anindividual patient’s behavior from that of controlsubjects.
The PD vs. control MES distributions were dis-tinct (Control: mean ± Std = − 1.99 ± 2.28; PD:5.88 ± 10.66, p < 0.0001 by Mann-Whitney U-test). To determine the relevant timescale of motorfluctuations, the MES autocorrelation was com-puted for PD and control subjects (figure 1(c)).The central peak was broader in the PD group,in which the timescale incorporating the signi-ficant portion (> 3 standard deviations abovebaseline) was ~7.2 s, while for controls it wasonly ~1 s. Importantly, the MES distributions forPD subjects and controls were highly discriminable(figure 1(d) shows distributions at the 7 s times-cale; other timescales presented in supplementary
figure 1(B)); the receiver operating characteristic(ROC) area-under-the-curves (AUC) comparingeach PD subject to aggregated control subject per-formance ranged from 0.95 to 0.99 (mean ROCAUC ± S.E.M. = 0.99 ± 0.01; all p-values < 0.001).These observations that the PD vs. control MES dis-tributions differed in timescale, range, and valuesupport the proposition that the tracking taskprovided an appropriate platform for detectingPD motor impairment.
3.2. Correlations of STN neural activity with shorttimescale motor fluctuationsSTN local field potentials (LFPs) were recorded frommicroelectrodes traversing the region of the STN(figure 2(a)) from 22 PD patients while they per-formed the target tracking task. Patients performed1–4 sessions of the task, with recordings obtainedat different depths in each session, for a total of 53intra-operative sessions. At any particular depth, datawere acquired from 2–4 microelectrodes, resultingin a total of 161 recordings from the region of theSTN across electrodes, sessions, and patients (fig-ure 2(b)). Neural signals from the STN contralat-eral to the hand used to perform the task werealigned to motor performance (the MES) for analysis(figure 2(c)).
Oscillations in the β frequency band are con-sidered a likely biomarker for PD symptom expres-sion, and indeed there was often a correlationbetween β power and motor performance (fig-ure 3(a)). However, short timescale correlationsbetween spectral power and MES were not restric-ted to the β-band. Significant positive Spearman cor-relations were observed on 49 electrodes for θ/α(4–12 Hz), compared to 35 for β (12–30 Hz), gen-erally of similar magnitude, and significant correla-tions were often observed between MES and higherfrequency bands as well (figure 3(b)). Significantnegative correlations were also observed, most oftenin the vhf band (200–400 Hz) on 32 electrodes,suggesting greater power in these higher frequen-cies may in some cases reflect better motor per-formance. In summary, these correlations revealedthat information about motor performance waspotentially available throughout the tested spectrum(4–400 Hz).
When the spectrogram was sorted not accord-ing to time but rather according to motor perform-ance, some LFP signals yielded clear patterns wherethe power in particular frequency bands varied asa function of MES (figure 3(c)). There was strik-ing heterogeneity in the particular frequencies thatcomprised these patterns, but the fact that visually-evident patterns could emerge when spectrogramswere sorted in this manner further supported theutility of natural motor fluctuations as a founda-tion to identify neurophysiological biomarkers of PDbehavior.
8

J. Neural Eng. 17 (2020) 046042 M Ahn et al
Figure 4. Neural decoding of motor performance: time-series.Multi-spectral decoding of motor performance using neural signalsobtained from the STN is demonstrated at the 7 s timescale (A) the 3 s timescale (B) and the 1 s timescale (C). In each case, timeseries for the 10 subjects with the highest decoding accuracies at each timescale are shown (in descending order) to provide asense of the capabilities of this approach. In each panel, the observed MES (green) is plotted against the SVR-decoded MES(black); SVR estimates are plotted against MES segments with associated neural data that were not used for training thecorresponding decoding models.
3.3. Decoding the quality of motor performanceusing STN LFPsWe next sought to investigate the extent to whichSTN neural activity could be used to estimate fluc-tuatingmotor impairment. Support vector regression(SVR) was applied toward multi-spectral decodingof the MES. Decoding was performed using spec-tral power across six ‘canonical’ frequency bands(θ/α; β; low γ; mid γ; high γ; vhf ; supple-mentary figure 2), each divided into seven sub-bands (yielding a total of 42 spectral features across4–400 Hz). The data were separated into train-ing and testing portions (2:1) and 100-fold cross-validation was performed. Because the main ques-tion related to how well, for any given patient,neural signals might be used to estimate motorimpairment, we were interested specifically in themost informative signal from each patient. Note thatbecause recordings were obtained opportunisticallywhen the procedure allowed, and simultaneous elec-trodes were not independently positionable, manysignals were necessarily acquired from suboptimallocations, including outside the STN, sowewould not
expect all signals to support high-levels of decodingperformance.
Indeed, STN neural activity could be used todecode short-timescale motor impairment (figure 4).Significant decoding capability was evident in everyPD subject, with MES decoding accuracy varyingfrom 0.17 to 0.84 (r-values correlating SVR estim-ates to MES in 7 s epochs: mean = 0.49). Decod-ing accuracy was generally better at somewhat longertimescales (figure 5(a)), reaching a plateau aroundan 8 s epoch size, but average decoding accur-acy with even just 1 s of neural data was nev-ertheless 0.39 (range: 0.14 to 0.69), increasing to0.53 (0.29 to 0.88) with 10 s epochs, across all PDsubjects.
There was wide variation in the success of MESdecoding across signals even within the same sub-ject (figure 5(b)). To determine if this heterogen-eity might result from the anatomic source of theneural signals, we next determined the location ofthe most informative signals by contrasting the topvs. bottom thirds of the decoding models (using all140 recorded signals across subjects with adequate
9

J. Neural Eng. 17 (2020) 046042 M Ahn et al
Figure 5. Neural decoding of motor performance: timescales and anatomic localization. (A) The mean of subjects’ peak decodingaccuracies are shown as a function of timescale. Accuracy tended to increase with increasing window size, though a relativeplateau in decoding accuracy was observed at about the 8 s timescale. (B) A wide range of decoder performance was observedacross signals, within individuals. Decoding accuracies (r-values, here at the 7 s timescale) are grouped in increasing order bysubject. The highest values, reflecting the best achieved decoding performance for each subject, are shown in red. Gray lines showthe means of the control analysis in which decoding was performed on neural data shuffled with respect to the MES. (C) Todetermine if the best decoding performance tended to arise from signals that were anatomically clustered, recordings yielding thehighest (top third) and lowest (bottom third) accuracies were localized on an MNI reference volume (approximate outline of STNoverlaid in black), and the differences between these were plotted to reveal the sources of the most informative signals. Coronal,axial, and sagittal slices are shown through the region of peak accuracy, observed near the dorsolateral border of the STN (insets:L= lateral; A= anterior).
neuroimaging). The best performing signals arosefrom the dorsolateral STN, corresponding roughly tothe motor subdivision that is classically targeted forDBS therapeutic effect (figure 5(c)). Signals recor-ded within a region-of-interest (ROI) comprising a2 mm radius around the center of this ‘hot-spot’(MNI coordinate: x = ±14, y = −12, z = −6) yiel-ded higher decoding accuracies than those recordedoutside this ROI (Mann-Whitney U-test: p = 0.001;inside ROI: r= 0.385, n= 28; outside ROI: r= 0.238,n= 112).
In general, broadband, multi-spectral decodingof MES performed better than decoding by indi-vidual canonical frequency bands (figure 6(a)), con-sistent with the presence of significant power-MEScorrelations across all bands, above. To determine thecontributions of particular frequency bands to MESdecoding, the feature weights of a linear SVR model
were examined (figure 6(b)). High positive weights(signifying positive correlations between high LFPpower and high MES) were typically assigned to theθ/α and low β bands. Meanwhile, negative weightswere more typically assigned to the high β bandand vhf bands, suggesting higher LFP power in thesefrequency ranges was often associated with bettermotor performance (lower MES). To assess whethera global relationship existed between the SVR spec-tral weights and peak spectral power in any canon-ical frequency band, we calculated a Spearman cor-relation across all recordings and observed no signi-ficant correlations (figure S3), suggesting decodingmodels did not simply leverage the most prominentspectral features.
We hypothesized patterns of weight assignmentsmight exist across frequencies, such that weightsassigned to particular bands might co-vary with
10

J. Neural Eng. 17 (2020) 046042 M Ahn et al
Figure 6. Informative spectral features for MES decoding. (A) The performance of broadband (4–400 Hz) SVR models to estimateMES is compared against canonical band performance. Each point represents the difference in accuracy for a given LFP signalprocessed using broadband features vs. features restricted to the indicated band. SVR models were generated and accuracies weredetermined in identical fashion otherwise. The box plots show the inter-quartile range of each distribution, and the whiskersrepresent± 1.5 the interquartile range. The density of each distribution is depicted in the shaded regions immediately to theright, with the mean value shown by the overlying line. The ratio displayed below each box plot provides the number ofrecordings for which the broadband accuracy was better (top of ratio) or worse (bottom). The means of all distributions weresignificantly greater than zero (p < 0.001 by Wilcoxon Signed Rank Test), reflecting generally better performance of thebroadband classifier in every case. (B) The average performance-weighted coefficients of a linear SVR computed for every signalare shown. Positive or negative weights reflected positive or negative relationships with MES. Error bars show the standard errorsof the means across subjects, over 100 cross-validation folds. The gray line near the origin shows the mean weights (± standarderrors) for the bootstrap SVR feature weight distributions calculated on shuffled MES↔ neural data. Horizontal bars near thetop of the graph represent regions where weights were greater than would be expected by chance, and bars near the bottomrepresent regions where weights were lower, based upon a contiguity-sensitive permutation test (p= 0.0002–0.0064; seeMethods). (C) To determine if cross-frequency patterns of SVR weight assignments existed, a cross correlation between featureweights for every pair of frequencies was calculated, across SVR models. This is plotted (top) along with the mean absolutecorrelation for a particular frequency in relation to all others (bottom). The contours on the correlation matrix depict significance(α) levels of 0.001 and 0.01 (dark and light contours, respectively) computed using a bootstrap permutation test to create ‘null’distributions for each point on the matrix (see Methods). The overlaid region on the lower area plot includes the mean (red line)and mean± 3 standard deviations (yellow line) as determined using the same bootstrap distributions as for the correlationmatrix. Several significant peaks are visible above this range, most notably in the θ/α and low β ranges, in the low/mid γ range,and in the vhf range, confirming cross-frequency interactions were most consistently observed across these ranges.
weight assignments to other bands; the existenceof such higher-order patterns would strengthen thenotion that those involved bands were consistentlymeaningful and might provide insight into poten-tially shared oscillatorymechanisms. Indeed, signific-ant positive correlations were observed across adja-cent bands in the θ/α and β ranges, and within thevhf band (figure 6(c)); this reflected the coexistenceof positive weights in the former and negative weightsin the latter. In addition, local positive correlationswere observed in the mid/high γ band as well. Inter-estingly, relatively strong negative correlations wereobserved between the vhf and γhigh bands, imply-ing effective decoding relied concurrently on low vhfpower as well as increasedγhigh power. Likewise, a rel-atively prominent negative correlation was observed
between the γlow and θ ranges. A variety of other sig-nificant correlations were observed as well, suggestingthese potentially interesting cross-frequency interac-tions may underlie the spectral ‘fingerprint’ of PDmotor dysfunction.
We also examined whether feature patternsdepended on disease subtype by examining SVRweights separately for TD and nTD subjects. Wefound that SVR decoding of MES using STN neuralsignals was generally better for TD compared to nTDpatients (figure 7(a)). Furthermore, TD patients’decodingmodels exhibited amore consistent spectralprofile (figure 7(b), top), with positive weights dis-tributed throughout θ/ and low β frequency bands(~10–25 Hz) and significant negative weights inthe high β/γlow range. Decoding models for nTD
11

J. Neural Eng. 17 (2020) 046042 M Ahn et al
Figure 7.MES decoding by disease subtype. (A)Mean SVR decoding accuracy was greater for tremor dominant (TD) than fornon-tremor dominant (nTD) patients (p= 0.0161 by Mann-Whitney U test; bars show means± S.E.M.). (B) The mean SVRfeature weights for the TD group (top; n= 9) and nTD group (bottom; n= 12). Conventions as in figure 6(b). Note that SVRdecoding models for TD patients demonstrated significant contiguous positive spectral feature weights distributed within the θ/αand low β sub-bands (~10–25 Hz) and significant negative weights distributed within the high β and γlow bands (~26–40 Hz),while decoding models for nTD patients, on average, did not exhibit a consistent pattern of positive or negative weights.
patients, on the other hand, did not exhibit a con-sistent pattern of weight assignments (figure 7(b),bottom).
These averaged patterns of SVR weights beliednoteworthy individual variability. ‘Generic’ mod-els constructed from mean spectral feature weightssignificantly outperformed patient-specific decodersfor 4 of 22 subjects with PD, while patient-specificdecoders significantly outperformed generic mod-els in 16 of 22 cases (Wilcoxon paired test). Never-theless, generic models did demonstrate some suc-cess in estimating the MES, with significant decod-ing above chance for 16 of 22 patients (signi-ficant r values ranging from 0.07–0.82, Wilcoxonpaired test, figure 8(a)). Generic models generatedand tested independently for each PD subtype (TDor nTD) yielded similar patterns of results: Whengeneric models were created from only the TDpatients’ data, significant decoding above chancewas observed for 8 of 9 of these patients (r values:0.07–0.86). For one patient, the generic model out-performed the patient-specific model, while for sevenpatients, the patient-specific model was better. Like-wise, constructing a generic model for only the nTDpatients, we observed that 10 out of 12 nTD patientshad generic models that significantly outperformedchance (r values: 0.17–0.59), while generic models forthree patients outperformed patient-specific models,and 8 patient-specific models outperformed genericmodels.
Likewise, patient-specificity was evident in across-decoding analysis where the training and test-ing of SVRmodels was conducted across pairs of sub-jects (figure 8(b)). For any given patient, decodingmodels trained on that individual’s signals (‘auto-logous’ conditions, on the diagonal) usually out-performed decoders trained using another’s sig-nals (‘homologous’ conditions, off-diagonal). It maybe relevant, however, that the highest-performingquadrant of this matrix (top-right) had some-what higher cross-decoding success than the lowest-performing quadrant (bottom-left) suggesting that,even though the autologous decoders (along thediagonal) had superior accuracy, there was never-theless evidence for slightly improved generalizab-ility across the best-performing multi-spectral SVRmodels and subjects.
4. Discussion
We examined endogenous fluctuations in move-ment quality to elucidate the neural correlates ofmotor dysfunction at short timescales. We used anaturalistic task that elicited goal-directed actionsuch that deviations from the intended target couldbe quantified to provide an objective measure ofimmediate motor impairment in PD subjects. Multi-dimensional assessment of behavioral performanceon this task discriminated between PD subjects andcontrols in a highly accurate manner and organized
12

J. Neural Eng. 17 (2020) 046042 M Ahn et al
Figure 8. Generalizability of MES decoding models. (A) A ‘generic’ classifier was constructed using the average,performance-weighted linear SVR model coefficients, across patients, for each frequency feature. The performance of the genericdecoder (x-axis) was compared against SVR decoders generated for each subject (y-axis). Significant, above-chance decoding wasobserved using the generic decoder for 16 of 22 patients (red). Directly comparing the generic and patient-specific decoders, fourpatients had significantly greater decoding with the generic decoder compared to the patient-specific decoder, while 16 showedsignificantly greater decoding with the patient-specific decoder. (B) To determine if there might be particular decoding modelsderived from individual subjects that generalized well to others, decoders were trained on one subject’s data and tested onanother’s data to estimate the latter’s MES, across all pairs of subjects. The results are plotted in a cross-decoding matrix where thebest result across each pair of subjects is shown (selected from among all the recording pairs between those subjects). The casesalong the diagonal (where the same subject’s data were used for training and testing) are referred to as ‘autologous,’ whereas theoff-diagonal cases (reflecting training and testing across subjects) are termed ‘homologous’ conditions. Because there are morecombinations of homologous electrode pairs across subjects than there are autologous cases within subjects, this analysispotentially was biased against the autologous condition. Nonetheless, the best-performing cases were typically found on thediagonal. Furthermore, the lack of horizontal banding in the matrix demonstrates there was no ‘special’ decoder that succeeded ingeneralizing across patients, and the lack of vertical banding demonstrates there was no particular patient whoseneurophysiological ‘fingerprint’ was sufficiently simple that it could be estimated successfully using some broad set ofhomologous decoders that happened to emphasize some simple feature.
neural activity in a sufficiently meaningful waythat it could be used to decode the quality ofmovement. Specifically, the power spectral featuresof the STN LFP correlated with fluctuating beha-vior and enabled the quality of motor perform-ance to be decoded by SVR using as little as 1 s ofneural data from a single microelectrode. Import-antly, decoding relied upon a broad range of fre-quency bands in a patient-specific manner. Thelinks between neural rhythms andmotor dysfunctionon these short timescales suggest that such oscilla-tions do not simply set a broad state within whichmotor performance fluctuates but rather that therapid dynamics of these oscillations correlate dir-ectly with impairments in immediate, ongoingmotorbehavior.
With a few notable exceptions, prior workexamining the relationships between oscillatoryactivity and PD manifestations considered onlylonger timescales, corresponding to on vs. off medic-ation states, or on vs. off DBS stimulation. Some ofwhat those studies found mirrors what we observedhere at shorter timescales, such as a possible dis-tinction between high and low frequency β activ-ity [41–44], the importance of sub-β (i.e. θ/α)activity [45], and the possible relationship betweenhigher-frequency activity and more fluid motor
output [46, 47]. Phase amplitude coupling betweencortical β-range and vhf activity has also been pro-posed as a potential biomarker of PD and has beenshown to be reduced by DBS [29], and recent workhas suggested that at least some symptom improve-ment due to dopaminergic medication is relatedto a shift in coupling in the basal ganglia ratherthan a total suppression [30]. Here we show thatpower across a wide gamut of frequencies was sig-nificantly associated with PD motor dysfunction.Furthermore, combining multiple spectral featuressignificantly improved motor performance decod-ing. Interestingly, we observed novel interactionsbetween activity across different portions of thespectrum, such as negative correlations betweenα/low-β and high-β and between mid/high γ andvhf. Such interactions may provide clues about theunderlying mechanisms that generate PD-relevantactivity.
The few notable studies that have examined PDneural activity in relation to shorter-timescale motorbehavior have focused on specific frequency bands.For example,β ‘bursts’ immediately precedingmove-ment were found to be associated with impairedmovement dynamics [48], and these bursts werelinked to bradykinesia during repetitive movements[49], consistent with our results in the low, but not
13
J. Neural Eng. 17 (2020) 046042 M Ahn et al
high, β range. Meanwhile, γ activity was observed tocorrelate positively with movement velocity at shorttimescales [50]. In contrast, we found that vhf activ-ity was most consistently reflective of effective motoroutput.
The increased performance of multi-spectralmotor performance decoding, compared to single-band decoding, may result from better estimationof multiple dimensions of motor signs, or it couldreflect better estimation of individual motor featuresthat have representations in multiple parts of thespectrum. In addition, the wide range of informat-ive frequency bands could reflect cognitive processingrelated to the recognition, evaluation, or attemp-ted correction of motor errors [51, 52]. This mighthelp to explain the presence of significant informa-tion about motor performance throughout the recor-ded region, outside the dorsolateral, sensorimotor‘hot spot.’
The precise pattern of informative oscillationsvaried across individuals. Some of this may reflectanatomical differences (inexact correspondenceof STN subregions recorded across patients). Forexample, the distributions of β and α activities maydiffer topographically across the STN [53]. Here,neural recordings were performed opportunistic-ally when the operative procedure allowed; thismay have been in part responsible for the variab-ility of symptom state decoding accuracy and fea-ture weights across patients. Furthermore, there islikely an interaction between spatial location andsymptomatic subtype in determining the particu-lar pattern of neural oscillations [46, 54]. Nonethe-less, we observed relatively poorer generalizabilityof neural decoders across individuals, suggestingthat while there may be some common substratesof particular symptoms within certain regions ofthe STN, there is nevertheless significant heterogen-eity that may be harnessed to yield more optimaldecoders using patient-specific biomarkers. Further-more, because microelectrode-derived LFP record-ings detect more spatially-restricted signals, our useof micro-LFP signals rather than macro-electrode(e.g. DBS electrode) LFPs may have highlightedindividual differences. Consistent with this, prom-inent STN signal heterogeneity has been observedusing experimental DBS electrodes with smallerelectrical contacts [55].
Our approach to decoding ongoing motor dys-function using neural activity may potentially be fur-ther optimized. On the front-end, while the continu-ous visual-motor tracking task succeeded in differen-tiating the behavior of subjects with PD from controlsto a high degree, it is unlikely this task captures the full‘ground truth’ of motor disability, even for the singleupper extremity for which it was evaluated. Improvedmethods to quantify motor signs, including perhaps
over the entire span of bodily movement, may furtherenhance decoding accuracy.
Additional limitations may have also influencedthese results. Control subjects performed the taskin a clinical setting, and patients were necessarily inthe intraoperative setting for these sessions. Short-acting medications such as propofol and dexme-detomidine are often administered at the begin-ning of a case; even though at least 60 min elapsedbetween drug administration and task performance,there is the possibility that lingering pharmacolo-gic effects altered neural activity. Our patient popu-lation also demonstrated a stronger male bias thanreported literature [23]. Lastly, the extent to whichneurophysiological activity observed in any givenmoment is necessarily Parkinsonian or whether itmight also reflect more general aspects of brain statesassociated with task engagement (e.g. attention) isunknown.
On the back-end, for MES decoding, we restric-ted the input feature space to LFP power at differ-ent frequencies. This ignored significant informationthat is likely present in the phases of these oscil-lations, particularly when combined with amp-litude information [27, 44, 54, 56]. Further optim-ization of the feature sets and algorithms (e.g.artificial neural network approaches) may yieldmore precise decoders of motor impairment, thoughwhether decoding remains stable over longer peri-ods of time remains to be investigated. Nonethe-less, our use of simple features and models forneurophysiologically-basedMES decoders allowed usto focus on the links between specific aspects ofneural activity and quantified behavior in a relativelystraightforward manner.
Short timescale neurophysiological biomarkers ofPD motor dysfunction may enable several import-ant, practical applications. Specifically, the abilityto estimate and track motor quality continuouslyover time would allow objective feedback about real-world, ‘in the wild’ disease burden and so may facilit-ate adjustments of medical therapy. Likewise, closed-loop DBS, in which stimulation is delivered dynam-ically, as needed, requires a control signal that reflectsthe immediate or impending presence of symptoms.Our results suggest that proposed strategies focus-ing largely on broad β-band activity may be subop-timal and not fully generalizable across patients andSTN sites. Note also that STN β decreases just beforeand during movement [57–59], including tremor[60], so its use as a surrogate for PD motor dys-function during ongoing behavior might be limited[61]. Furthermore, β oscillations are not necessar-ily pathological, even in PD [62], and some evid-ence exists that β activity may not be causal of Par-kinsonian symptoms [63]. Therapeutic stimulationmay even enable the brain to regulate appropriate
14

J. Neural Eng. 17 (2020) 046042 M Ahn et al
cortical β power [64], so stimulating simply to dis-rupt β might have unanticipated adverse influenceson motor behavior. That and other work [11, 51]have suggested targeting longer β episodes mightmore selectively address PD symptoms. We showhere that patient-specific, multi-spectral decoding ofmotor impairment can further refine the strategyfor implementing closed-loop DBS. Ultimately, abetter understanding of the links between neuralactivity and motor behavior on the relevant times-cales, and novel algorithms to fully exploit theselinks, will guide the design of more advancedtherapies to realize the full potential of neuro-physiology and neuromodulation for optimal patientbenefit.
Acknowledgments
We are grateful for the generous participation of ourpatients in this study. We thank Kelsea Laubenstein-Parker for technical assistance, David Segar, TinaSankhla, and Daniel Shiebler for early implementa-tion of a version of the motor task, Karina Bertschfor administrative support, and Ann Duggan-Winklefor clinical support. WFA, MA & SL designed theexperiment; MA, SL, PML, JG, ELS, UA and WFAconducted the experiment; MA, SL, PML and WFAperformed the analyses; WFA, SL and PML wrotethe manuscript; all authors reviewed and edited themanuscript.
Funding
This work was supported by a Doris Duke Clin-ical Scientist Development Award (#2014101)to WFA, an NIH COBRE Award: NIGMS P20GM103645 (PI: Jerome Sanes) supporting WFA,a Neurosurgery Research and Education Found-ation (NREF) grant to WFA, the Lifespan Nor-man Prince Neurosciences Institute, and the BrownUniversity Carney Institute for Brain Science. Por-tions of this research were conducted using thecomputational resources and services of the Cen-ter for Computation and Visualization, BrownUniversity.
Competing interests
The authors declare no competing interests related tothis work.
ORCID iDs
Minkyu Ahn https://orcid.org/0000-0001-6512-0167Shane Lee https://orcid.org/0000-0001-7264-5658Peter M Lauro
https://orcid.org/0000-0002-8569-6427Wael F Asaad https://orcid.org/0000-0003-4406-9096
References
[1] Pringsheim T, Jette N, Frolkis A and Steeves T D L 2014 Theprevalence of Parkinson’s disease: a systematic review andmeta-analysisMov. Disord. 29 1583–90
[2] Brown P, Oliviero A, Mazzone P, Insola A, Tonali P and DiLazzaro V 2001 Dopamine dependency of oscillationsbetween subthalamic nucleus and pallidum in Parkinson’sdisease J. Neurosci. 21 1033–8
[3] Weinberger M et al 2006 Beta oscillatory activity in thesubthalamic nucleus and its relation to dopaminergicresponse in Parkinson’s disease J. Neurophysiol.96 3248–56
[4] Wingeier B, Tcheng T, Koop MM, Hill B C, Heit G andBronte-Stewart H M 2006 Intra-operative STN DBSattenuates the prominent beta rhythm in the STN inParkinson’s disease Exp. Neurol. 197 244–51
[5] Tinkhauser G, Pogosyan A, Tan H, Herz D M, Kühn A A andBrown P 2017 Beta burst dynamics in Parkinson’s diseaseOFF and ON dopaminergic medication Brain 140 2968–81
[6] Lewis S J G, Foltynie T, Blackwell A D, Robbins T W,Owen A M and Barker R A 2005 Heterogeneity ofParkinson’s disease in the early clinical stages using a datadriven approach J. Neurol. Neurosurg. Psychiatr. 76 343–8
[7] Kalia L V and Lang A E 2015 Parkinson’s disease Lancet386 896–912
[8] Martínez-Martín P, Gil-Nagel A, Gracia L M, Gomez J B,Martínez-Sarries J and Bermejo F 1994 Unified Parkinson’sdisease rating scale characteristics and structure. Thecooperative multicentric groupMov. Disord. 9 76–83
[9] Siderowf A et al 2002 Test-retest reliability of the unifiedParkinson’s disease rating scale in patients with earlyParkinson’s disease: results from a multicenter clinical trialMov. Disord. 17 758–63
[10] Ballanger B, Thobois S, Baraduc P, Turner R S, Broussolle Eand Desmurget M 2006 “Paradoxical kinesis” is not ahallmark of Parkinson’s disease but a general property of themotor systemMov. Disord. 21 1490–5
[11] Baraduc P, Thobois S, Gan J, Broussolle E and Desmurget M2013 A common optimization principle for motor executionin healthy subjects and Parkinsonian patients J. Neurosci.33 665–77
[12] Mazzoni P, Hristova A and Krakauer J W 2007 Why don’t wemove faster? Parkinson’s disease, movement vigor, andimplicit motivation J. Neurosci. 27 7105–16
[13] Desmurget M, Gaveau V, Vindras P, Turner R S, Broussolle Eand Thobois S 2004 On-line motor control in patients withParkinson’s disease Brain 127 1755–73
[14] Rumalla K, Smith K A, Follett K A, Nazzaro J M and ArnoldP M 2018 Rates, causes, risk factors, and outcomes ofreadmission following deep brain stimulation for movementdisorders: analysis of the U.S. nationwide readmissionsdatabase Clin. Neurol. Neurosurg. 171 129–34
[15] Asaad W F and Eskandar E N 2008 A flexible software toolfor temporally-precise behavioral control in Matlab J.Neurosci. Methods 174 245–58
[16] Asaad W F, Santhanam N, McClellan S M and Freedman D J2012 High-performance execution of psychophysical taskswith complex visual stimuli in MATLAB J. Neurophysiol. 109249–60
[17] Konrad P E et al 2011 Customized, miniaturerapid-prototype stereotactic frames for use in deep brainstimulator surgery: initial clinical methodology andexperience from 263 patients from 2002 to 2008 Stereotact.Funct. Neurosurg. 89 34–41
[18] Lopez-Azcarate J et al 2010 Coupling between beta andhigh-frequency activity in the human subthalamic nucleus
15

J. Neural Eng. 17 (2020) 046042 M Ahn et al
may be a pathophysiological mechanism in Parkinson’sdisease J. Neurosci. 30 6667–77
[19] Ozturk M, Abosch A, Francis D, Wu J, Jimenez-Shahed J andInce N F 2020 Distinct subthalamic coupling in the ON statedescribes motor performance in Parkinson’s diseaseMov.Disord. 35 91–100
[20] Guyon I, Weston J, Barnhill S and Vapnik V 2002 Geneselection for cancer classification using support vectormachinesMach. Learn. 46 389–422
[21] Benjamini Y and Hochberg Y 1995 Controlling the falsediscovery rate: A practical and powerful approach tomultiple testing J. R. Stat. Soc. B 57 289–300
[22] Jankovic J et al 1990 Variable expression of Parkinson’sdisease: a base-line analysis of the DATATOP cohort. TheParkinson Study Group Neurology 40 1529–34
[23] Cox R W 1996 AFNI: software for analysis and visualizationof functional magnetic resonance neuroimages Comput.Biomed. Res. 29 162–73
[24] Lauro P M et al 2016 DBSproc: an open source process forDBS electrode localization and tractographic analysis Hum.Brain Mapp. 37 422–33
[25] Lauro P M, Lee S, Ahn M, Barborica A and Asaad W F 2018DBStar: an open-source tool kit for imaging analysis withpatient-customized deep brain stimulation platformsStereotact. Funct. Neurosurg. 96 13–21
[26] Fonov V S, Evans A C, McKinstry R C, Almli C R and CollinsD L 2009 Unbiased nonlinear average age-appropriate braintemplates from birth to adulthood NeuroImage47 S102
[27] Xiao Y, Beriault S, Pike G B and Collins D L 2012Multicontrast multiecho FLASHMRI for targeting thesubthalamic nucleusMagn. Reson. Imaging 30 627–40
[28] Xiao Y et al 2017 A dataset of multi-contrastpopulation-averaged brain MRI atlases of a Parkinson’sdisease cohort Data Brief 12 370–9
[29] Fogelson N, Williams D, Tijssen M, van Bruggen G,Speelman H and Brown P 2006 Different functional loopsbetween cerebral cortex and the subthalmic area inParkinson’s disease Cereb. Cortex 16 64–75
[30] van Wijk B C M et al 2016 Subthalamic nucleusphase-amplitude coupling correlates with motor impairmentin Parkinson’s disease Clin. Neurophysiol. 127 2010–9
[31] Hirschmann J et al 2016 Parkinsonian rest tremor isassociated with modulations of subthalamic high-frequencyoscillationsMov. Disord. 31 1551–9
[32] Sharott A et al 2014 Activity parameters of subthalamicnucleus neurons selectively predict motor symptom severityin Parkinson’s disease J. Neurosci. 34 6273–85
[33] Swann N C et al 2016 Gamma oscillations in thehyperkinetic state detected with chronic human brainrecordings in Parkinson’s disease J. Neurosci. 36 6445–58
[34] de Hemptinne C et al 2015 Therapeutic deep brainstimulation reduces cortical phase-amplitude coupling inParkinson’s disease Nat. Neurosci. 18 779–86
[35] Torrecillos F et al 2018 Modulation of beta bursts in thesubthalamic nucleus predicts motor performance J. Neurosci.38 8905–17
[36] Lofredi R et al 2019 Beta bursts during continuousmovements accompany the velocity decrement inParkinson’s disease patients Neurobiol. Dis.127 462–71
[37] Lofredi R et al 2018 Dopamine-dependent scaling ofsubthalamic gamma bursts with movement velocity inpatients with Parkinson’s disease Elife 7
[38] Lardeux S, Pernaud R, Paleressompoulle D and Baunez C2009 Beyond the reward pathway: coding reward magnitudeand error in the rat subthalamic nucleus J. Neurophysiol.102 2526–37
[39] Tan H et al 2014 Human subthalamic nucleus in movementerror detection and its evaluation during visuomotoradaptation J. Neurosci. 34 16744–54
[40] Horn A, Neumann W-J, Degen K, Schneider G-H and KühnA A 2017 Toward an electrophysiological “sweet spot” for
deep brain stimulation in the subthalamic nucleus Hum.Brain Mapp. 38 3377–90
[41] Telkes I et al 2018 Local field potentials of subthalamicnucleus contain electrophysiological footprints of motorsubtypes of Parkinson’s disease Proc. Natl Acad. Sci. 115E8567–76
[42] Bour L J et al 2015 Directional recording of subthalamicspectral power densities in Parkinson’s disease and the effectof steering deep brain stimulation Brain Stimul. 8 730–41
[43] Yang A I, Vanegas N, Lungu C and Zaghloul K A 2014Beta-coupled high-frequency activity and beta-lockedneuronal spiking in the subthalamic nucleus of Parkinson’sdisease J. Neurosci. 34 12816–27
[44] Foffani G and Priori A Group P-SP-PDBSS 2004Involvement of the human subthalamic nucleus inmovement preparation Neurology 63 195–6
[45] Yugeta A et al 2013 Modulation of Beta oscillations in thesubthalamic nucleus with prosaccades and antisaccades inParkinson’s disease J. Neurosci. 33 6895–904
[46] Qasim S E, de Hemptinne C, Swann N C, Miocinovic S,Ostrem J L and Starr P A 2016 Electrocorticography revealsbeta desynchronization in the basal ganglia-cortical loopduring rest tremor in Parkinson’s disease Neurobiol. Dis.86 177–86
[47] Johnson L A, Nebeck S D, Muralidharan A, Johnson M D,Baker K B and Vitek J L 2016 Closed-loop deep brainstimulation effects on Parkinsonian motor symptoms in anon-human primate - is beta enough? Brain Stimul. 9 892–6
[48] Deffains M, Iskhakova L, Katabi S, Israel Z and Bergman H2018 Longer β oscillatory episodes reliably identifypathological subthalamic activity in ParkinsonismMov.Disord. 33 1609-18
[49] Jackson N, Cole S R, Voytek B and Swann N C 2019Characteristics of waveform shape in Parkinson’s diseasedetected with scalp electroencephalography eNeuro 60151–19
[50] Polar C A, Gupta R, Lehmkuhle M J and Dorval A D 2018Correlation between cortical beta power and gait speed issuppressed in a Parkinsonian model, but restored bytherapeutic deep brain stimulation Neurobiol. Dis.117 137–48
[51] Tinkhauser G et al 2017 The modulatory effect of adaptivedeep brain stimulation on beta bursts in Parkinson’s diseaseBrain 140 1053–67
[52] Priori A et al 2004 Rhythm-specific pharmacologicalmodulation of subthalamic activity in Parkinson’s diseaseExp. Neurol. 189 369–79
[53] Kühn A A, Trottenberg T, Kivi A, Kupsch A, Schneider G-Hand Brown P 2005 The relationship between local fieldpotential and neuronal discharge in the subthalamic nucleusof patients with Parkinson’s disease Exp. Neurol. 194 212–20
[54] Pogosyan A et al 2010 Parkinsonian impairment correlateswith spatially extensive subthalamic oscillatorysynchronization Neuroscience 171 245–57
[55] Neumann W-J et al 2016 Subthalamic synchronizedoscillatory activity correlates with motor impairment inpatients with Parkinson’s diseaseMov. Disord. 31 1748–51
[56] Shreve L A et al 2016 Subthalamic oscillations and phaseamplitude coupling are greater in the more affectedhemisphere in Parkinson’s disease Clin. Neurophysiol.128 128–37
[57] Neumann W-J and Kühn A A 2017 Subthalamic betapower-Unified Parkinson’s disease rating scale IIIcorrelations require akinetic symptomsMov. Disord.32 175–6
[58] Selikhova M, Williams D R, Kempster P A, Holton J L,Revesz T and Lees A J 2009 A clinico-pathological study ofsubtypes in Parkinson’s disease Brain 132 2947–57
[59] Thenganatt M A and Jankovic J 2014 Parkinson diseasesubtypes JAMA Neurol. 71 499–504
[60] Ramaker C, Marinus J, Stiggelbout A M and Van Hilten B J2002 Systematic evaluation of rating scales for impairmentand disability in Parkinson’s diseaseMov. Disord. 17 867–76
16

J. Neural Eng. 17 (2020) 046042 M Ahn et al
[61] Xiao Y, Fonov V, Beriault S, Al Subaie F, Chakravarty MM,Sadikot A, Pike G B and Collins D L 2014 Multi-contrastunbiased MRI atlas of a Parkinson’s disease population Int. J.CARS. 10 329–41
[62] Litvak V et al 2011 Resting oscillatory cortico-subthalamicconnectivity in patients with Parkinson’s disease Brain134 359–74
[63] Little S, Tan H, Anzak A, Pogosyan A, Kühn A and Brown P2013 Bilateral functional connectivity of the basal ganglia inpatients with Parkinson’s disease and its modulation bydopaminergic treatment PloS One 8 e82762
[64] Kühn A A et al 2004 Event-related beta desynchronization inhuman subthalamic nucleus correlates with motorperformance Brain 127 735–46
17