viva industrial trust 1q2017 results presentation
TRANSCRIPT
Viva Industrial Trust
1Q2017
Results Presentation
1

VIVA ITRUST 2
This presentation is for information purposes only and does not constitute or form part of an offer, invitation or solicitation of any
offer to purchase or subscribe for any Stapled Securities of Viva Industrial Trust (“VIT”) in Singapore or any other jurisdiction nor
should it or any part of it form the basis of, or be relied upon in connection with, any contract or commitment whatsoever.
The value of the Stapled Securities and the income derived from them may fall as well as rise. The Stapled Securities are not
obligations of, deposits in, or guaranteed by, Viva Industrial Trust Management Pte. Ltd., in its capacity as manager of Viva
Industrial Real Estate Investment Trust (“VI-REIT”, and the manager of VI-REIT, the “REIT Manager”), Viva Asset Management
Pte. Ltd., in its capacity as trustee-manager of Viva Industrial Business Trust (“VI-BT”, and the trustee-manager of VI-BT, the
“Trustee-Manager”, and collectively with the REIT Manager, the “Managers”), Perpetual (Asia) Limited (formerly known as The
Trust Company (Asia) Limited), as trustee of VI-REIT, or any of their respective affiliates.
An investment in the Stapled Securities is subject to investment risks, including the possible loss of the principal amount invested.
Stapled Securityholders have no right to request that the Managers redeem or purchase their Stapled Securities while the Stapled
Securities are listed. It is intended that Stapled Securityholders may only deal in their Stapled Securities through trading on
Singapore Exchange Securities Trading Limited (“SGX-ST”). Listing of the Stapled Securities on the SGX-ST does not guarantee a
liquid market for the Stapled Securities.
This presentation may contain forward-looking statements that involve assumptions, risks and uncertainties. Actual future
performance, outcomes and results may differ materially from those expressed in forward-looking statements as a result of a
number of risks, uncertainties and assumptions. Predictions, projections or forecasts of the economy or economic trends of the
markets are not necessarily indicative of the future or likely performance of VIT. The forecast financial performance of VIT is not
guaranteed. A potential investor is cautioned not to place undue reliance on these forward-looking statements, which are based on
the Managers’ current view of future events.
Important Notice

VIVA ITRUST 3
Contents
Key Highlights and Financial Performance
Portfolio Update
Update on Jackson Square
Update on Growth Drivers
Outlook & Strategic Focus
VIVA ITRUST 4
Key Highlights & Financial Performance

VIVA ITRUST 5
Robust Y-o-Y Performance in 1Q2017
Distribution
Yield¹
9.5%Gross Revenue
24.9% 28.8%
13.2%25.9%
S$27.4m
Net Property
Income
S$17.8m
Distributable
Income
S$20.3m
Distribution
per Unit²
1.854c
Total Assets³
NAV per Unit³
S$1.33b
79.2c
1 Based on annualised 1Q2017 DPS and closing price of S$0.795 as at 31 March 2017.2 Annualised distribution of 7.519 cents.3 As at 31 March 2017.
VIVA ITRUST 6
Year-On-Year
Comparison
Quarter-On-Quarter
Comparison
1Q2017 1Q2016 Variance 4Q2016 Variance
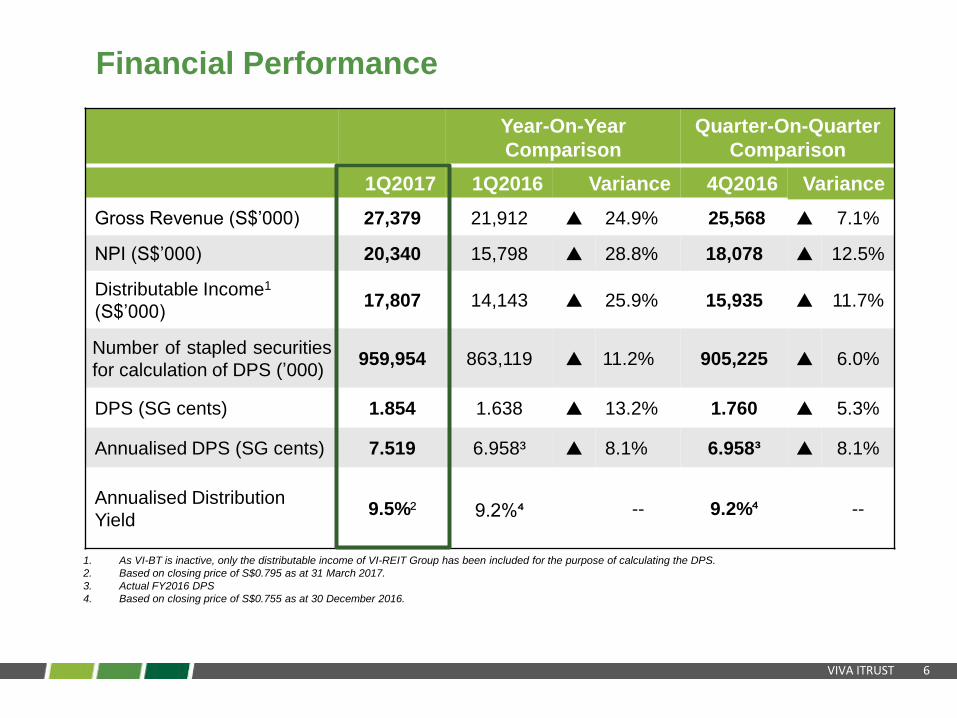
Gross Revenue (S$’000) 27,379 21,912 24.9% 25,568 7.1%
NPI (S$’000) 20,340 15,798 28.8% 18,078 12.5%
Distributable Income1
(S$’000)17,807 14,143 25.9% 15,935 11.7%
Number of stapled securities
for calculation of DPS (’000)959,954 863,119 11.2% 905,225 6.0%
DPS (SG cents) 1.854 1.638 13.2% 1.760 5.3%
Annualised DPS (SG cents) 7.519 6.958³ 8.1% 6.958³ 8.1%
Annualised Distribution
Yield 9.5%² 9.2%⁴ -- 9.2%⁴ --
1. As VI-BT is inactive, only the distributable income of VI-REIT Group has been included for the purpose of calculating the DPS.
2. Based on closing price of S$0.795 as at 31 March 2017.
3. Actual FY2016 DPS
4. Based on closing price of S$0.755 as at 30 December 2016.
Financial Performance
VIVA ITRUST 7
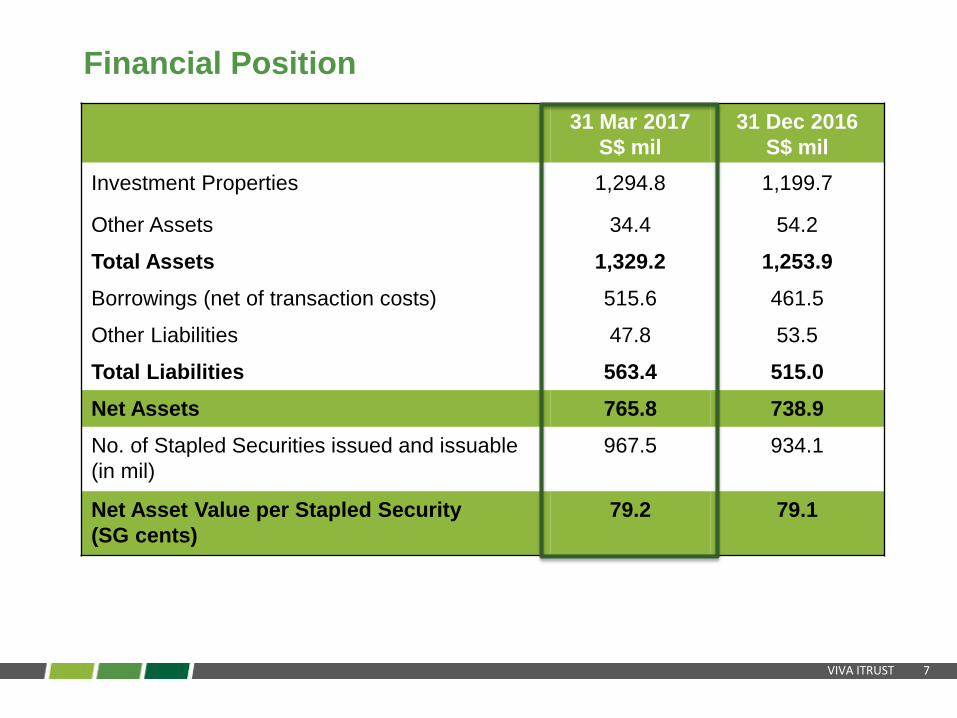
31 Mar 2017
S$ mil
31 Dec 2016
S$ mil
Investment Properties 1,294.8 1,199.7
Other Assets 34.4 54.2
Total Assets 1,329.2 1,253.9
Borrowings (net of transaction costs) 515.6 461.5
Other Liabilities 47.8 53.5
Total Liabilities 563.4 515.0
Net Assets 765.8 738.9
No. of Stapled Securities issued and issuable
(in mil)
967.5 934.1
Net Asset Value per Stapled Security
(SG cents)
79.2 79.1
Financial Position

VIVA ITRUST 8
1. Excludes the revolving credit facility of S$50 million.
2. Based on outstanding borrowings as at 31 March 2017.
As at 31 March 2017
Gross Borrowings S$521 million
Gearing Ratio (Gross Borrowings over Total Assets) 39.2%
All-in Borrowing Cost 3.9%
Weighted Average Debt Maturity1 3.1 years
Interest Rate Exposure Fixed2 80.6%
Interest Cover 4.55 times
135 135100
073
22
140
140
0
50
100
150
200
250
2016 2017 2018 2019 2020 2021 2022
S$
mill
ion
Debt Maturity Profile1
Proactive Capital Management

VIVA ITRUST 9
Distribution Details
1Q2017 Distribution Details for Main Counter
Distribution Period 1 January 2017 – 31 March 2017
Distribution per Stapled Security
(Singapore cents)
1.854 comprising
(a) taxable income – 1.581
(b) tax exempt income – 0.273
Ex-Date 5 May 2017
Books Closure Date 9 May 2017
Distribution Payment Date 31 May 2017

VIVA ITRUST 10
Distribution Details
1Q2017 Distribution Details for Temporary Counter ‘A’¹
Distribution Period 16 January 2017 – 31 March 2017
Distribution per Stapled Security
(Singapore cents)
1.573 comprising
(a) taxable income – 1.334
(b) tax exempt income – 0.239
Ex-Date 5 May 2017
Books Closure Date 9 May 2017
Distribution Payment Date 31 May 2017
¹ The temporary VIT ‘A’ stock counter will be aggregated and traded under the existing main VIT stock counter on the Main Board of the SGX-ST after the last day of “cum-
distribution” trading i.e. 5 May 2017.
VIVA ITRUST 11
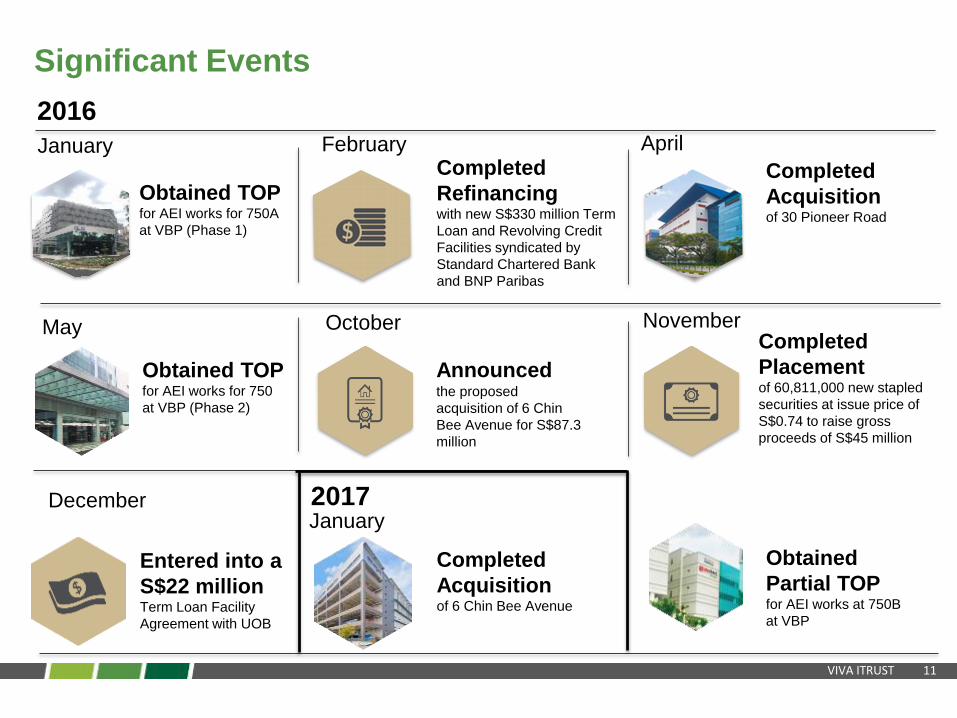
Significant Events
2016
January
Obtained TOPfor AEI works for 750A
at VBP (Phase 1)
FebruaryCompleted
Refinancingwith new S$330 million Term
Loan and Revolving Credit
Facilities syndicated by
Standard Chartered Bank
and BNP Paribas
April
Completed
Acquisitionof 30 Pioneer Road
May
Obtained TOPfor AEI works for 750
at VBP (Phase 2)
October
Announcedthe proposed
acquisition of 6 Chin
Bee Avenue for S$87.3
million
NovemberCompleted
Placementof 60,811,000 new stapled
securities at issue price of
S$0.74 to raise gross
proceeds of S$45 million
Obtained
Partial TOPfor AEI works at 750B
at VBP
December
Entered into a
S$22 millionTerm Loan Facility
Agreement with UOB
2017January
Completed
Acquisitionof 6 Chin Bee Avenue

VIVA ITRUST 12
1Q16 1Q17
Business Park Light Industrial Logistics Hotel
Gross Revenue
(by Asset Type)
59%
$16.2m
12%
$3.2m
21%
$5.7m
8%
$2.3m
61%
$13.4m
26%
$5.7m
11%
$2.4m
2%
$0.5m
$1.1m21%
$1.6m29%
$2.5m45%
$0.3m5%
Contribution to YoY Revenue Growth
30 Pioneer Road
Newly acquired 6 Chin Bee Avenue
AEI and other income contributions at Viva BusinessParkOthers
Key Revenue drivers
Increasingly diversified portfolio underpinned by resilient business park assets
1Q17 Total
Gross
Revenue
grew by
$5.5m
Y-o-Y

VIVA ITRUST 13
VIT’s DPS Remains Resilient and Trending Up
1.64
1.75
1.81
1.76
1.85
1.4
1.6
1.8
2.0
Quarter ended 31Mar 2016
Quarter ended 30Jun 2016
Quarter ended 30Sep 2016
Quarter ended 31Dec 2016
Quarter ended 31Mar 2017
VIT DPS Trendcents
VIT continues to deliver improving DPS performance despite uncertain market conditions

VIVA ITRUST 14
VIT offers high yield and defensiveness to market volatility
Viva provides good risk and return matrix compared to other REITs
0
2
4
6
8
10
12
14
0.2 0.3 0.4 0.5 0.6 0.7 0.8
Yie
ld
Beta¹
Yield and Beta comparisons between Viva and other Industrial REITs
Cache
Logistics
AIMS AMP
Industrial REIT
Soilbuild Business
Space REIT
Cambridge
Industrial Trust
Mapletree
Logistics Trust
Ascendas REIT
Viva
Industrial
Trust
Sabana
Shari’ah
Compliant
Industrial
REIT
Source: Shareinvestor as at 5 April 2017
1. Benchmarked against the STI
* Size of bubbles represent market capitalisation
Mapletree Industrial Trust

VIVA ITRUST 15
4Q20131 1Q2014 2Q2014 3Q2014 4Q2014 1Q2015 2Q2015 3Q2015 4Q2015 1Q2016 2Q2016 3Q2016 4Q2016 1Q2017
Price at Quarter End
(S$)0.775 0.770 0.795 0.805 0.795 0.805 0.795 0.735 0.710 0.720 0.710 0.790 0.755 0.795
Cumulative DPS (SG
cents)21.080 2.802 4.525 6.212 7.913 9.783 11.632 13.279 14.913 16.551 18.301 20.111 21.871 23.725
Price Appreciation (%) (0.6) (1.3) 1.9 3.2 1.9 3.2 1.9 (5.8) (9.0) (7.7) (9.0) 1.3 (3.2) 1.9
Cumulative Distribution
Yield (%)1.4 3.6 5.8 8.0 10.1 12.5 14.9 17.0 19.1 21.2 23.5 25.8 28.0 30.4
Total Return (%)3 0.8 2.3 7.7 11.2 12.0 15.7 16.8 11.2 10.1 13.5 14.5 27.1 24.8 32.3
1. Relates to the period from the Listing Date (4 November 2013) to 31 December 2013.
2. Assume that a Stapled Securityholder has been holding the Stapled Securities in VIT since the listing of VIT on 4 November 2013.
3. Sum of cumulative distribution and capital appreciation over the IPO issue price of S$0.780.
Scenario: Distribution yield based on annualised 1Q2017 DPS of S$0.07519
Price S$0.750 S$0.760 S$0.770 S$0.780 S$0.790 S$0.800 S$0.810 S$0.820 S$0.830 S$0.840 S$0.850
Annualised
Distribution Yield 10.0% 9.9% 9.8% 9.6% 9.5% 9.4% 9.3% 9.2% 9.1% 9.0% 8.8%
Attractive Return on Investment since IPO
IPO Price on 4 Nov 2013:
S$0.780
Closing Price on 31 Mar 2017:
S$0.795
VIVA ITRUST 16
Portfolio Update

VIVA ITRUST 17
Mauser Singapore
30 Pioneer Road
Viva Business Park
Home-Fix Building
11 Ubi Road 1
Jackson Design Hub
UE BizHub EAST
(Hotel & Business Park)
Proposed
MRT
Extension
Business
Park
Properties
Light
Industrial
Properties
Logistics
Properties
Proposed
MRT
Extension
Well-Spread, Strategically Located Assets in Singapore
9Property Assets
3.9mSq ft GFA
S$1.294bTotal Portfolio Valuation
Singapore Focused
Portfolio
Major
Business Park
Cluster
GULCIRCLE
TUAS CRESCENT
TUAS WEST
TUAS CHECKPOINT
PSA TERMINAL
CHANGI AIRPORT
LOYANG / CHANGI
TUAS LINK
CHANGI BUSINESS
PARK
WOODLANDSCHECKPOINT
ONE-NORTH
WOODLANDS/ KRANJI
ANG MO KIO / SERANGOON
NORTH
TOA PAYOH
UPPER CHANGI
EXPOINTERNATIONALBUSINESS PARK
6 Chin Bee Avenue
Planned development of Tuas Port, where all
of Singapore’s port operations will be
consolidated
Jackson Square
PAYA LEBAR / UBI
/ KAKI BUKIT
GFA: 324,166 sq ft
Valuation: S$94.3 m
GFA: 107,566 sq ft
Valuation: S$28.0 m
GFA: 418,586 sq ft
Valuation: S$80.0 m
GFA: 85,070 sq ft
Valuation: S$33.4 m
GFA: 1,526,762 sq ft
Valuation: S$353.5 m
GFA: 783,415 sq ft
Valuation: S$515.0 m
GFA: 281,090 sq ft
Valuation: S$55.0 m
GFA: 253,058 sq ft
Valuation: S$87.0 m
GFA: 120,556 sq ft
Valuation: S$47.8 m
VIVA ITRUST 18
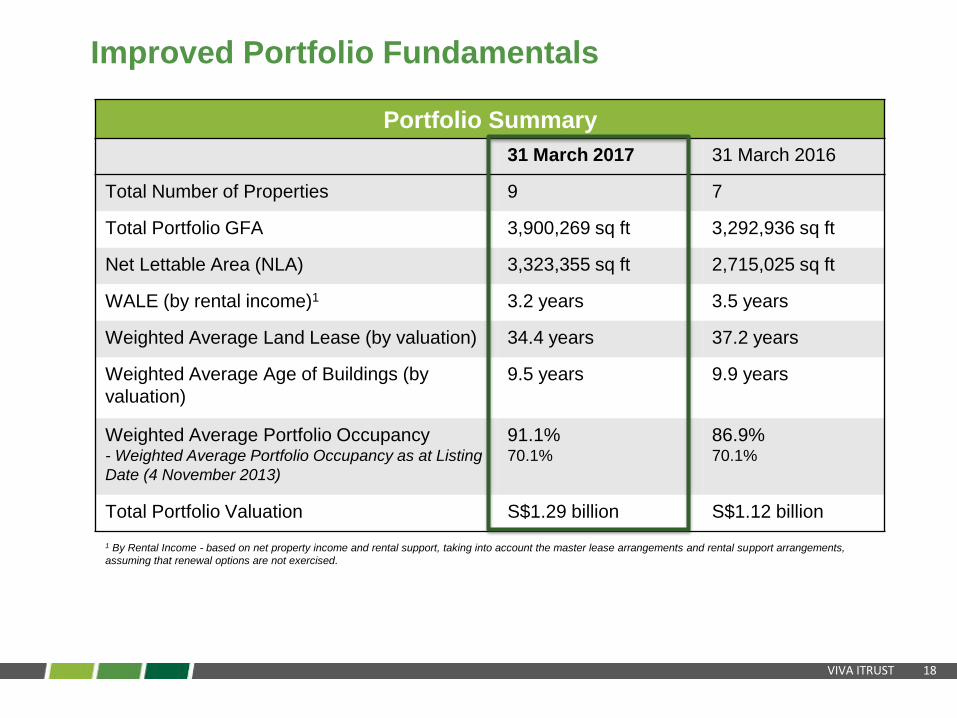
Portfolio Summary
31 March 2017 31 March 2016
Total Number of Properties 9 7
Total Portfolio GFA 3,900,269 sq ft 3,292,936 sq ft
Net Lettable Area (NLA) 3,323,355 sq ft 2,715,025 sq ft
WALE (by rental income)1 3.2 years 3.5 years
Weighted Average Land Lease (by valuation) 34.4 years 37.2 years
Weighted Average Age of Buildings (by
valuation)
9.5 years 9.9 years
Weighted Average Portfolio Occupancy- Weighted Average Portfolio Occupancy as at Listing
Date (4 November 2013)
91.1%70.1%
86.9%70.1%
Total Portfolio Valuation S$1.29 billion S$1.12 billion
Improved Portfolio Fundamentals
1 By Rental Income - based on net property income and rental support, taking into account the master lease arrangements and rental support arrangements,
assuming that renewal options are not exercised.

VIVA ITRUST 19
ICT /Information Technology
25.4%
E-Business / Data Centre14.1%
Retail9.6%
Lifestyle & Services
7.3%
F&B4.7%
General Engineering / Engineering
Services16.0%Warehouse &
Logistics12.5%
Electronics2.6%
Packaging & Storage
2.0%
Self-storage1.7%
Others1.8%
Healthcare1.9%
Energy0.4%
MNC,56.2%
SME, 39.6%
GLC,4.2%
Diversified Quality Tenant Mix
* Based on monthly gross rental income for the month of March 2017, excluding the rental income from the UEBH Hotel Leased Premises.
Breakdown of Tenant Type
by Underlying Gross Rental
Income*
Breakdown of Trade Sector by
Underlying Gross Rental
Income*
• Total of 149 tenants, of which 39.5% of tenants are in information technology, e-business or data
centre operations.
• 60.4% of tenants are multinational corporations or government-linked corporations.
VIVA ITRUST 20
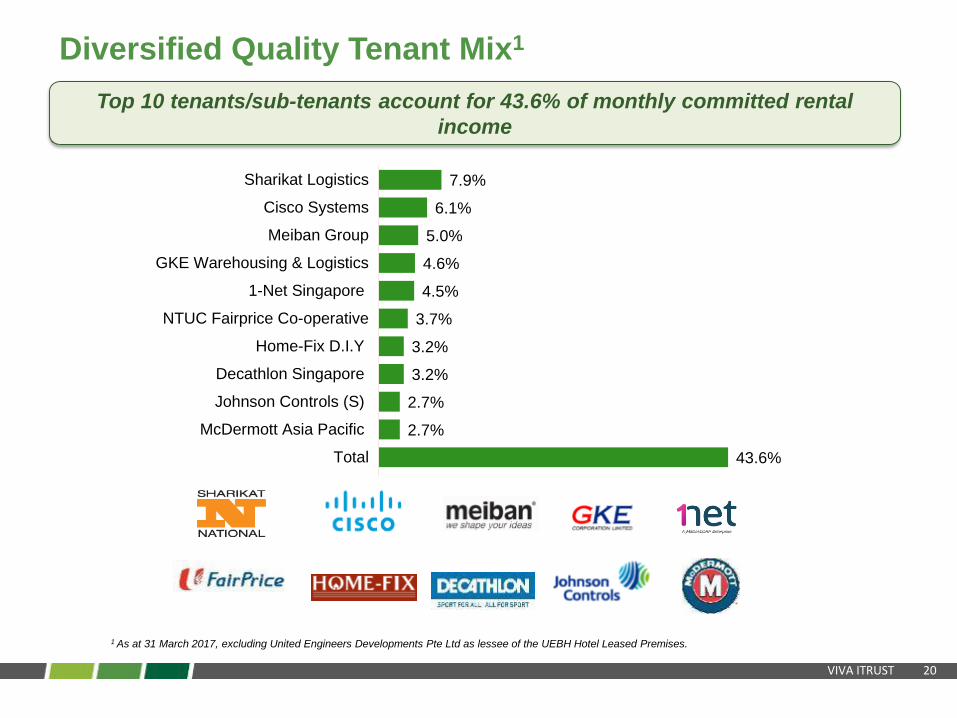
1 As at 31 March 2017, excluding United Engineers Developments Pte Ltd as lessee of the UEBH Hotel Leased Premises.
7.9%
6.1%
5.0%
4.6%
4.5%
3.7%
3.2%
3.2%
2.7%
2.7%
43.6%
Sharikat Logistics
Cisco Systems
Meiban Group
GKE Warehousing & Logistics
1-Net Singapore
NTUC Fairprice Co-operative
Home-Fix D.I.Y
Decathlon Singapore
Johnson Controls (S)
McDermott Asia Pacific
Total
Diversified Quality Tenant Mix1
Top 10 tenants/sub-tenants account for 43.6% of monthly committed rental
income

VIVA ITRUST 21
0%
10%
20%
30%
40%
FY 2017 FY 2018 FY 2019 FY 2020 FY 2021 & Beyond
Expiry by % of Underlying Gross Rental Income1
VBP UE BizHub East Jackson Square Others
Staggered Lease Expiry Provides Income Stability
1. Based on committed leases as at 31 March 2017, assuming renewal options are not exercised and excluding United Engineers Developments Pte Ltd as
lessee of the UEBH Hotel Leased Premises.
• VIT secured approximately 95,000 square feet of lease renewals and new leases in
1Q2017
• Majority of leases expiring in 2017 are at VBP and Jackson Square

VIVA ITRUST 22
Business Park Rentals Vary Across the Island
Business
Parks – East
Region
$3.00 - $5.50
International
Business Park
– West Region
$2.77 - $4.50
Science Park –
Central Region
$3.80 - $6.20
One-north –
West Region
$4.95 - $6.50
Viva Business Park
$3.00 - $3.90
UE Bizhub EAST
$4.50 - $5.00
Source: CBRE Singapore Industrial & Logistics Asking Rental Guide. March 2017.
Rentals at Business Parks in the East are competitive compared with Central/Western areas
Asking Rents Across Key Business Parks in Singapore (S$ psf / mth)
VIVA ITRUST 23
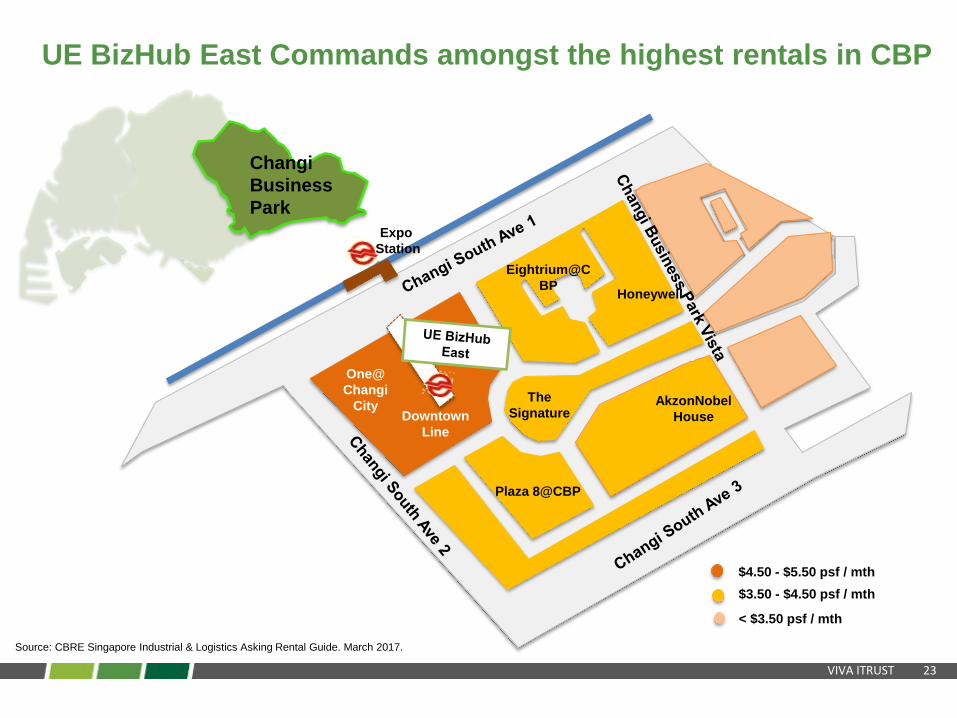
Source: CBRE Singapore Industrial & Logistics Asking Rental Guide. March 2017.
UE BizHub East Commands amongst the highest rentals in CBP
Expo
Station
Honeywell
AkzonNobel
House
The
SignatureDowntown
Line
One@
Changi
City
Eightrium@C
BP
Plaza 8@CBP
$4.50 - $5.50 psf / mth
$3.50 - $4.50 psf / mth
< $3.50 psf / mth
Changi
Business
Park

VIVA ITRUST 24
Opportunities for Positive Rental Reversion and Improved
Occupancy at UE BizHub East
66.4%
85.0%88.0%
90.0%
4Q2013 FY2014 FY2015 FY2016
0.6%
24.6%
45.7%
0.0%
12.7%16.4%
0%
10%
20%
30%
40%
50%
FY 2017 FY 2018 FY 2019 FY 2020 FY 2021 Beyond
UE BizHub East Lease Expiry Profile
Increased Accessibility
• Downtown line station completed by H2 2017
• Direct Access to MRT via underpass at property
• Connected to Changi City Point by outdoor Urban
Plaza
DTL
UE BizHub East
Occupancy Rate
Positive Rental Rate and Occupancy Uptrend Positive Rental Reversion Catalysts in 2018 and 20191 2
Source: Google Maps

VIVA ITRUST 25
Update on Jackson Square

VIVA ITRUST 26
Updates on Jackson Square
Jackson International Pte Ltd (JIPL), that provides rental support for Jackson Square and owns
subsidiaries leasing space at the property, filed for liquidation leading to potential loss of rental
income. However this is mitigated by the Rental Support Bank Guarantee (RSBG).
• JIPL will no longer be able to fulfill its obligations under the rental support arrangement which would have expired in November 2019
• Arrangement was to top up shortfall if gross rental collection fell below $11.6m per annum
Early termination of
Rental Guarantee
• Three of the tenants of Jackson Square are subsidiaries of JIPL
• These subsidiaries have not filed for liquidation or defaulted on rent payments
Potential Loss of Rental Income
• Draw down on RSBG of $3.87m provided by JIPL mitigates potential losses so that we do not expect any material impact on FY2017 financials
RSBG mitigates any
potential losses
10,0368,955
1,5642,645
0
2,000
4,000
6,000
8,000
10,000
12,000
14,000
2016 2015$
(,0
00
)
Lower Rental Top Up in 2016
Gross Revenue Rental Support
Rental guarantee of $11.6m per year

VIVA ITRUST 27
Updates on Jackson Square
Given Jackson Square’s central location at Toa Payoh, occupancy at the property
has proven to be resilient
Other Tenants
50%
Vacant26%
JIPL Subsidiaries²
24%
Jackson Square Current Committed Occupancy¹
¹ Based on the existing committed leases at Jackson Square excluding McDermott and assuming none of the tenants (other than JIPL subsidiaries) default on their leases
² JIPL subsidiaries include Store-11 Pte Ltd, Twinklekidz Playhouse Pte Ltd and Jackson Cafe
91%
80%
89%
91%
99% 99%
91% 91% 91% 91%
70%
80%
90%
100%
4Q14 1Q15 2Q15 3Q15 4Q15 1Q16 2Q16 3Q16 4Q16 1Q17
Jackson Square Occupancy
• New leases have been signed at Jackson Square from the ICT and technology sector such that
committed occupancy excluding JIPL subsidiaries is 50%
• Main JIPL subsidiary that is a tenant at Jackson Square is Store-11, a self storage company with an
operating business
• Track record of occupancy at Jackson Square shows that given the central location of the
property, it has a proven ability to revert to previous occupancy levels after dips
VIVA ITRUST 28
Update on Growth Drivers

VIVA ITRUST 29
Reaping the fruits of Successful AEI at Viva Business Park
Converting low yielding spaces to higher yielding ‘white’ retail space results in higher
footfall and visits to the property as proxied by increased carpark income at VBP
150
200
250
300
350
400
450
S$
(,0
00
)
VBP Quarterly Carpark
Income
White space optimisation
From carparks,
loading bays and
unproductive space
To exciting
Lifestyle &
Retail
concepts¹ Adjusted for increase in carpark rates from January 2017
VIVA ITRUST 30
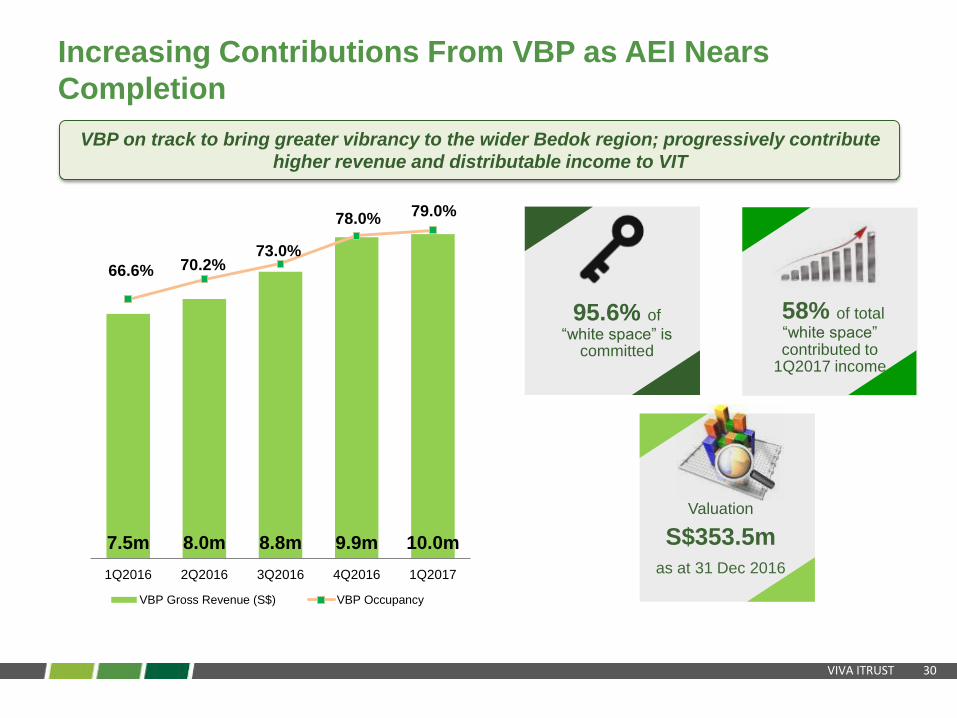
Increasing Contributions From VBP as AEI Nears
Completion
VBP on track to bring greater vibrancy to the wider Bedok region; progressively contribute
higher revenue and distributable income to VIT
7.5m 8.0m 8.8m 9.9m 10.0m
66.6% 70.2%73.0%
78.0%79.0%
1Q2016 2Q2016 3Q2016 4Q2016 1Q2017
VBP Gross Revenue (S$) VBP Occupancy
95.6% of
“white space” is committed
58% of total
“white space” contributed to
1Q2017 income
Valuation
S$353.5m
as at 31 Dec 2016
VIVA ITRUST 31
Outlook & Strategic Focus

VIVA ITRUST 32
Recent Economic Data Trends Signal Positive Industrial
Demand
50.9
51.2
49
50
51
52
Sep-16 Oct-16 Nov-16 Dec-16 Jan-17 Feb-17 Mar-17
Purchasing Managers’ Index
+0.3 pts
Sources: SIPMM Academy, RHB research and Economic Development Board
• Total Singapore’s manufacturing output in Feb 2017 rose 12.6 per cent from a year ago, on the back
of strong growth in electronics and precision engineering clusters
• Purchasing Managers’ Index (PMI ) in March 2017 recorded a faster expansion rate of 51.2, up
0.3 points from the month before
22.1
3.8
12.6
-15
0
15
30
Fe
b-1
6
Ma
r-16
Apr-
16
Ma
y-1
6
Ju
n-1
6
Ju
l-1
6
Aug
-16
Sep
-16
Oct-
16
Nov-1
6
Dec-1
6
Ja
n-1
7
Fe
b-1
7
Singapore’s Manufacturing OutputYear-on-Year Growth (%)
VIVA ITRUST 33
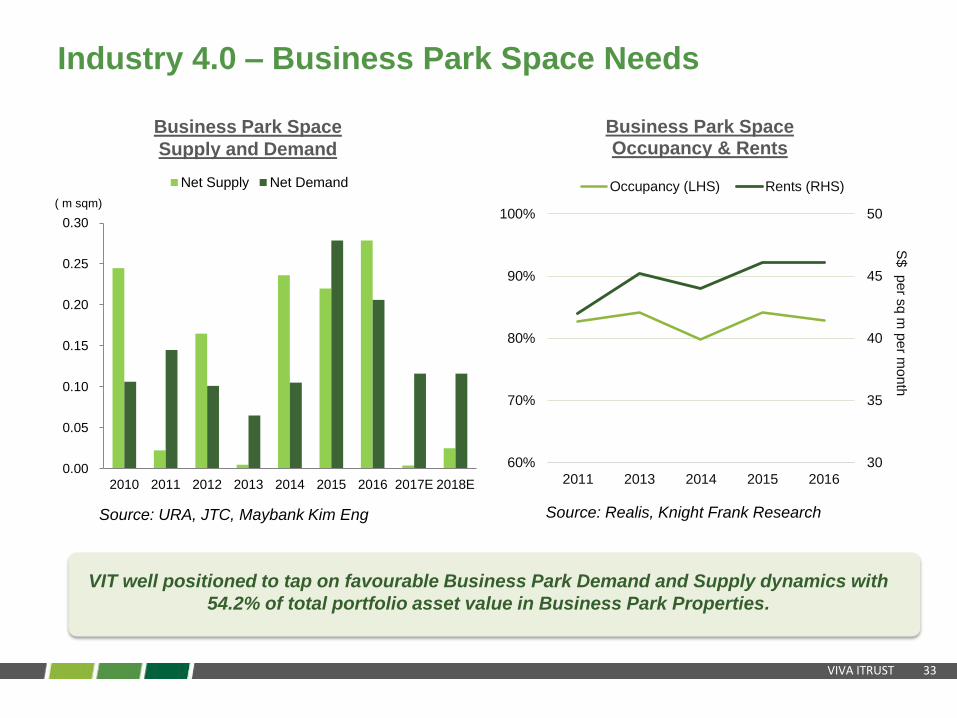
Industry 4.0 – Business Park Space Needs
30
35
40
45
50
60%
70%
80%
90%
100%
2011 2013 2014 2015 2016
S$
pe
r sq
m p
er m
on
th
Business Park Space Occupancy & Rents
Occupancy (LHS) Rents (RHS)
Source: Realis, Knight Frank ResearchSource: URA, JTC, Maybank Kim Eng
VIT well positioned to tap on favourable Business Park Demand and Supply dynamics with
54.2% of total portfolio asset value in Business Park Properties.
0.00
0.05
0.10
0.15
0.20
0.25
0.30
2010 2011 2012 2013 2014 2015 2016 2017E 2018E
Net Supply Net Demand
( m sqm)
Business Park Space
Supply and Demand
VIVA ITRUST 34
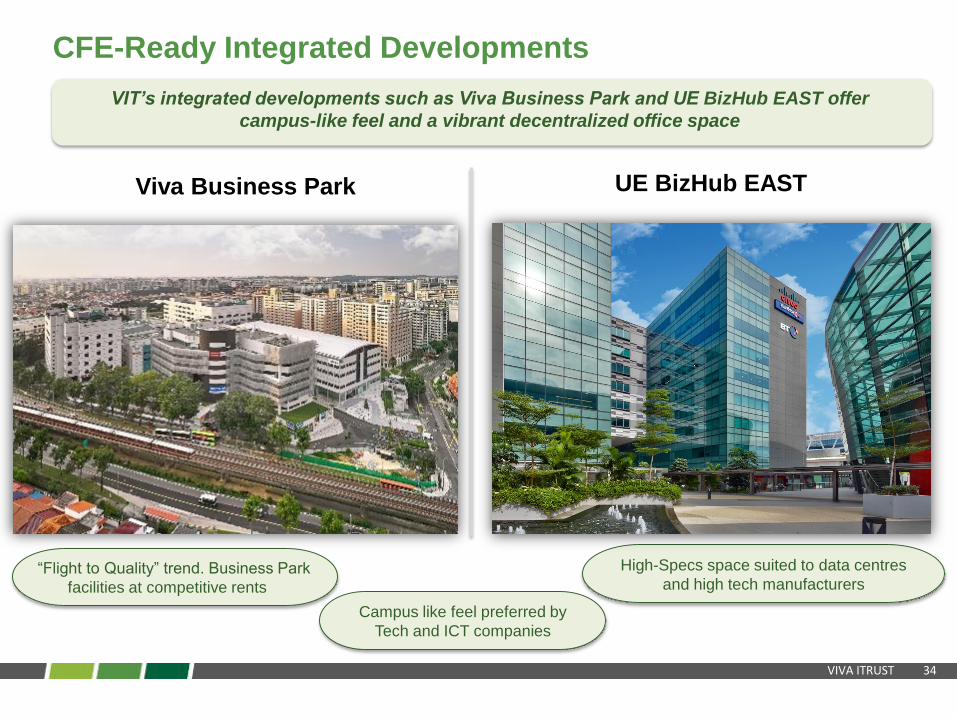
CFE-Ready Integrated Developments
VIT’s integrated developments such as Viva Business Park and UE BizHub EAST offer
campus-like feel and a vibrant decentralized office space
UE BizHub EASTViva Business Park
“Flight to Quality” trend. Business Park
facilities at competitive rents
Campus like feel preferred by
Tech and ICT companies
High-Specs space suited to data centres
and high tech manufacturers

VIVA ITRUST 35
Timely delivery of AEI works
within budget
Build pipeline of yield
accretive acquisitions in
Singapore and overseas
Clear Strategy to Enhance VIT’s Value
Value Creating
Investment Management
Maximise tenant retentions
with positive rental reversions
Unlock value through asset
enhancements
Effective asset operating cost
management
Proactive Asset &
Lease Management
1 2
Maintain stable DPS
Maintain prudent financial
policy with gearing ratio
below 40%
Diversify sources of funding
Prudent Capital &
Risk Management3
Near-term focus on creating a vibrant VBP while seeking out defensive acquisitions against
the backdrop of a subdued economy
Focus on retaining tenants while increasing
portfolio occupancy
Drive long-term growth and enhancement of
VIT’s value

Summary
36
Best in Class Portfolio Anchored by Sizeable Integrated
Business Park Developments
• Integrated Business Park developments attract quality tenants by providing
complementary amenities that enliven the workplace.
• UE BizHub East is an unique business park development integrated with a
251-room hotel, convention centre and retail component, while Viva Business
Park has significant “white” component.
Clear Growth Strategy for 2017
• VBP’s AEI has been successful in revitalising the Business Park, and is
contributing to rising revenues and distributions amidst subdued
macroeconomic conditions.
• Completion of yield accretive acquisition of 6 Chin Bee Avenue taps on the
strong potential of Singapore’s growing and recession-resilient food services
sector.
In-line with Government’s Pro-Growth Programs
• High-specs Industrial and Business Park properties meet the needs of firms
transformed by Singapore’s economic remodelling efforts and the Committee
on the Future Economy (CFE) strategies.
• VIT has a large number of tenants from key sectors identified in the CFE
strategies that will digitize the economy and enhance productivity.
1
2
3

Thank you