vitamin nutrition of dairy cows: nrc vs. today’s reality weiss.pdf · vitamin nutrition of dairy...
TRANSCRIPT

Vitamin Nutrition of Dairy Cows: NRC vs. Today’s Reality
Bill Weiss
Dept of Animal Sciences
OARDC/The Ohio State University
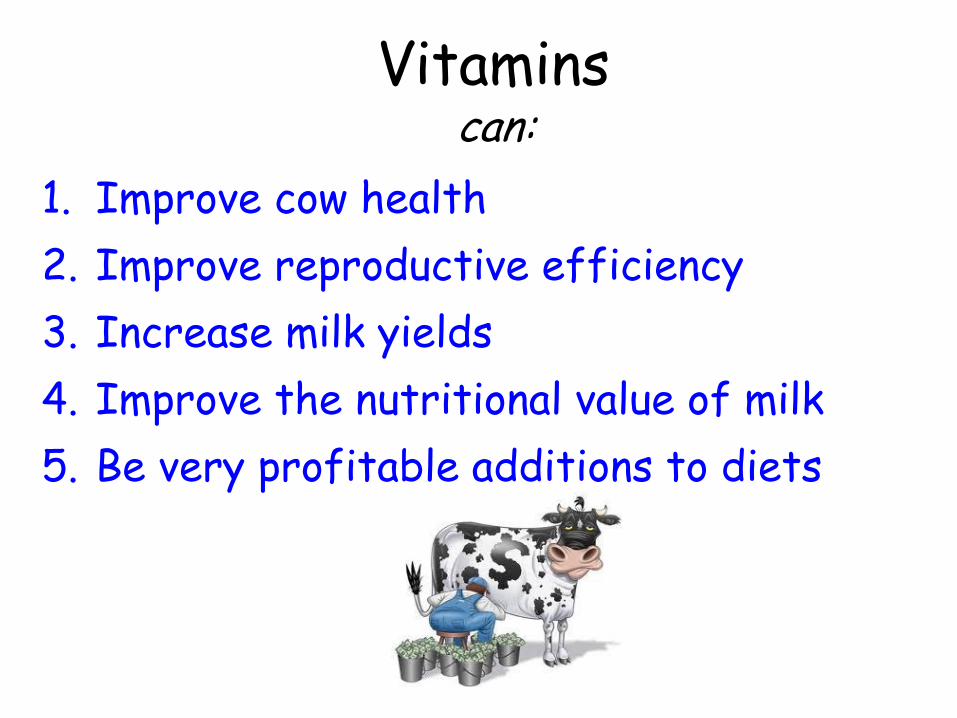
Vitamins
1. Improve cow health
2. Improve reproductive efficiency
3. Increase milk yields
4. Improve the nutritional value of milk
5. Be very profitable additions to diets
can:

Vitamins
1. Be detrimental to cow health
2. Reduce milk yields
3. Inflate feed costs
4. Reduce profitability
can:

Hypothetical response function to nutrient supply
0
20
40
60
80
100
120
0 1 2 3 4 5 6 7 8 9 10 11 12 13
Resp
on
se
Supply
“Requirement” Max. tolerable level (MDL)

Hypothetical response function to vitamin intake
0
20
40
60
80
100
120
0 1 2 3 4 5 6 7 8 9 10 11 12 13
Resp
on
se
Supply
“Requirement” Max. tolerable level (MDL)
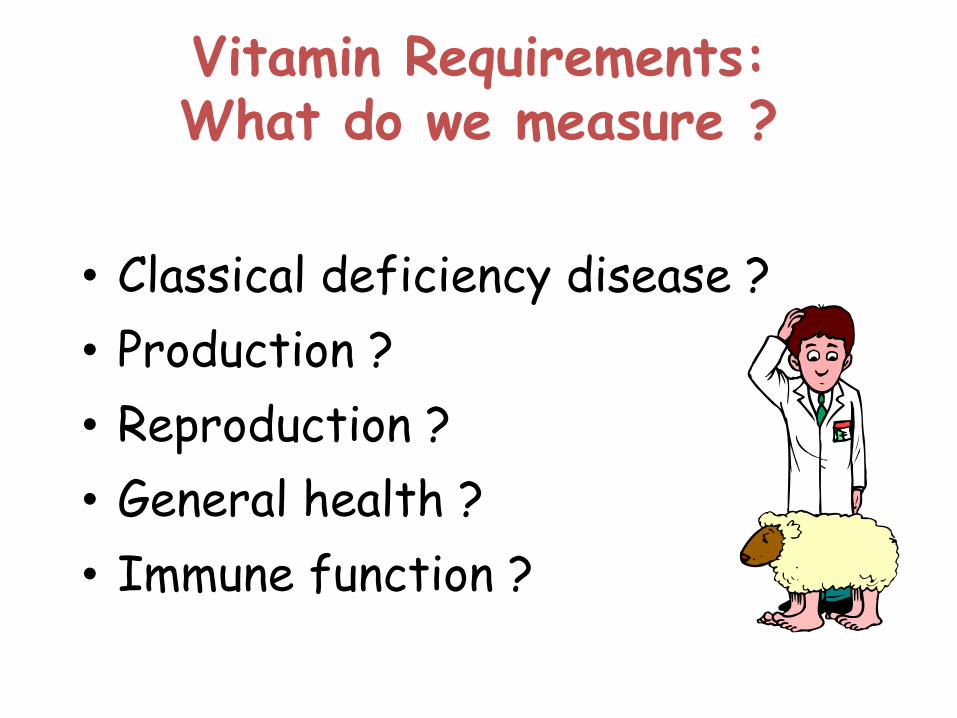
Vitamin Requirements: What do we measure ?
• Classical deficiency disease ?
• Production ?
• Reproduction ?
• General health ?
• Immune function ?

If you thought measuring response was hard ….
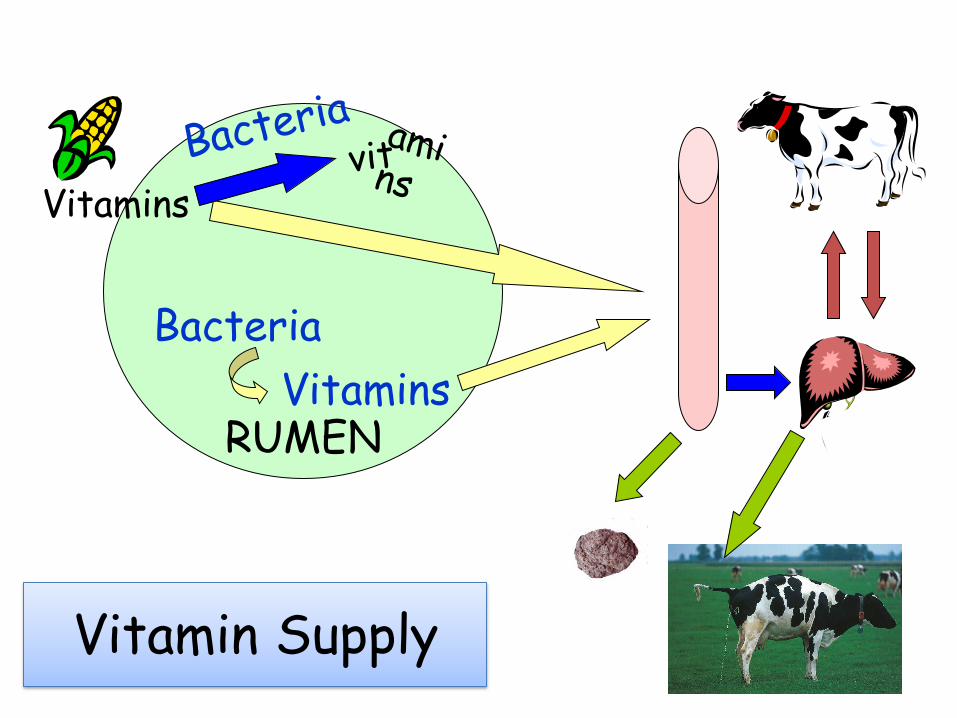
Vitamins
RUMEN
Bacteria
Vitamins
Vitamin Supply

Vitamin Flow to Duodenum (Estimated DMI = 23 kg)
0
50
100
150
200
250
300
Niacin Folic B-12 Biotin Biotin
mg
/da
y
Intake Rumenx 10
Santschi et al., 2005; Schwab et al., 2006
?

Rumen Disappearance of supplemental vitamins
0
20
40
60
80
100
120
Niacin Folic B-12 Biotin
Ru
me
n D
isa
pp
ea
ran
ce
, %
= SE Santschi et al., 2005

Change in Intestinal Supply (@ common supplementation rates)
0,0
0,5
1,0
1,5
2,0
2,5
Niacin (6g) Niacin (12 g) Biotin (20 mg) Biotin (20 mg)
Su
pp
l./c
on
tro
l
+7% +14% +6%
+212%
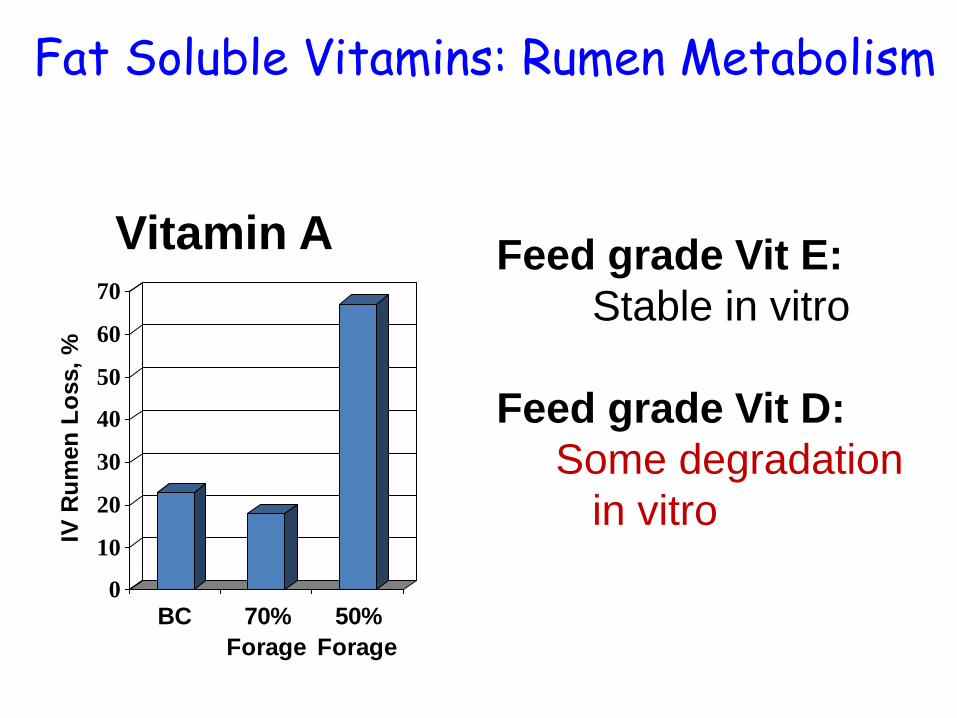
Vitamin A
0
10
20
30
40
50
60
70
IV R
um
en
Lo
ss,
%
BC 70%
Forage
50%
Forage
Fat Soluble Vitamins: Rumen Metabolism
Feed grade Vit E:
Stable in vitro
Feed grade Vit D:
Some degradation
in vitro
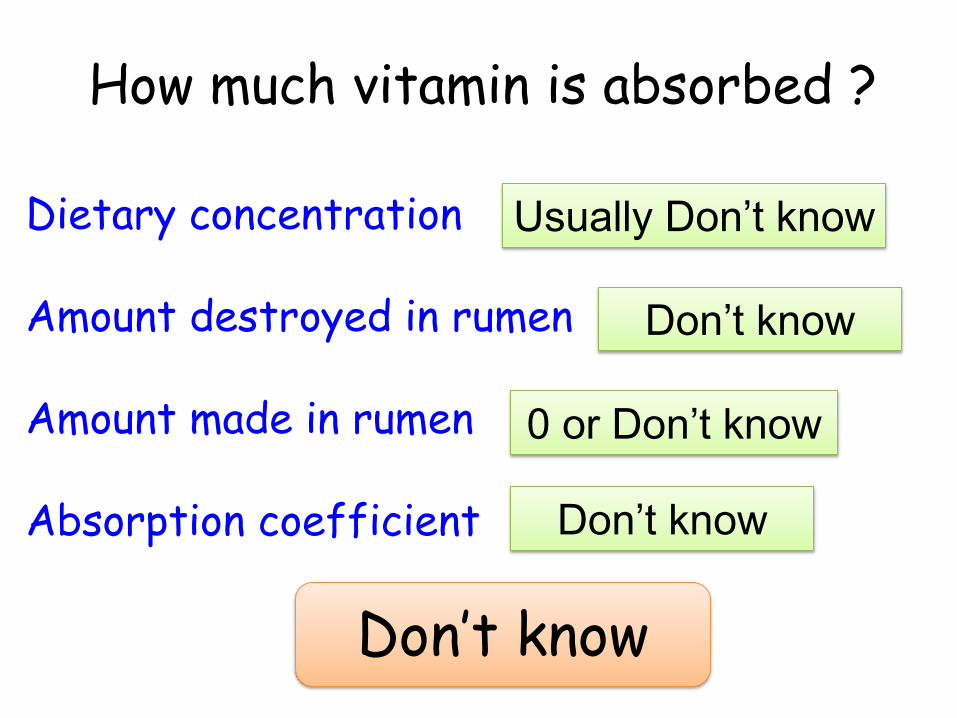
How much vitamin is absorbed ?
Dietary concentration Amount destroyed in rumen Amount made in rumen Absorption coefficient
Usually Don’t know
Don’t know
0 or Don’t know
Don’t know
Don’t know

Underfeeding
Potentially reduced production and repro, increased health problems
Overfeeding
Potential toxicity, antagonism, higher feed costs
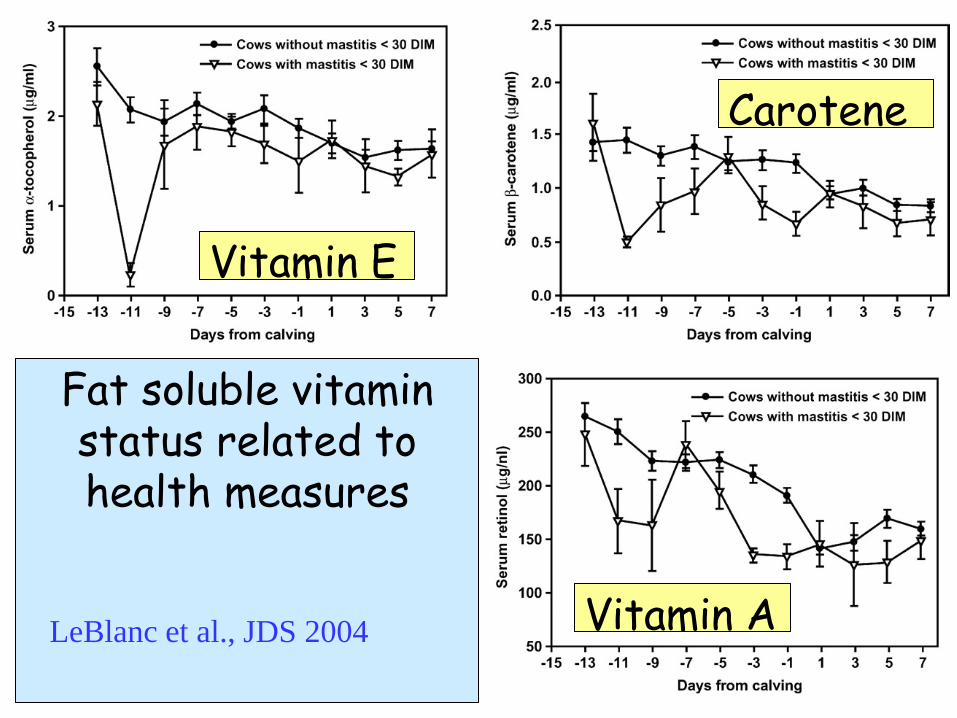
Fat soluble vitamin status related to health measures
LeBlanc et al., JDS 2004
Carotene
Vitamin A
Vitamin E

Requirement: 110 IU supplemental/kg BW
Safety Factor: 1.1 to 1.5X
Potential responses:
- RP
- Abortions
- Mastitis
- Milk
Vitamin A
Potential Risks:
- Activity during storage
- Rumen breakdown
- Vit E absorption
- Toxicity
No data showing NRC is not adequate

Vitamin A (retinyl acetate) is destroyed in the rumen
0
10
20
30
40
50
60
70
IV R
um
en
Lo
ss,
%
BC 70%
Forage
50%
Forage
Vitamin A is labile - pelleting - heat - humidity - etc.
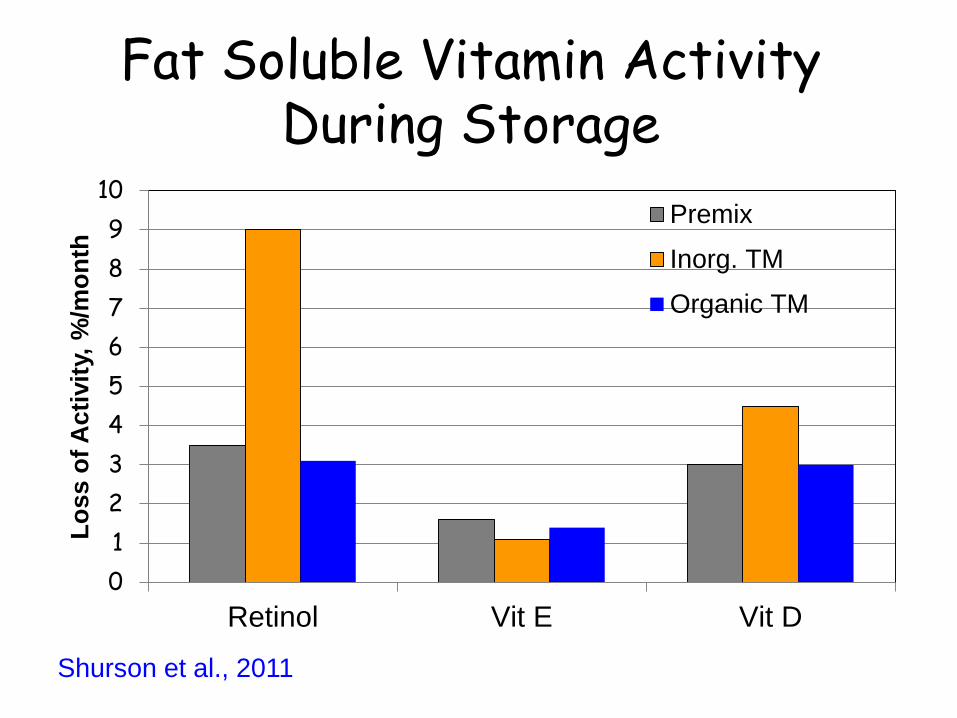
Fat Soluble Vitamin Activity During Storage
0
1
2
3
4
5
6
7
8
9
10
Retinol Vit E Vit D
Lo
ss o
f A
cti
vit
y, %
/mo
nth
Premix
Inorg. TM
Organic TM
Shurson et al., 2011
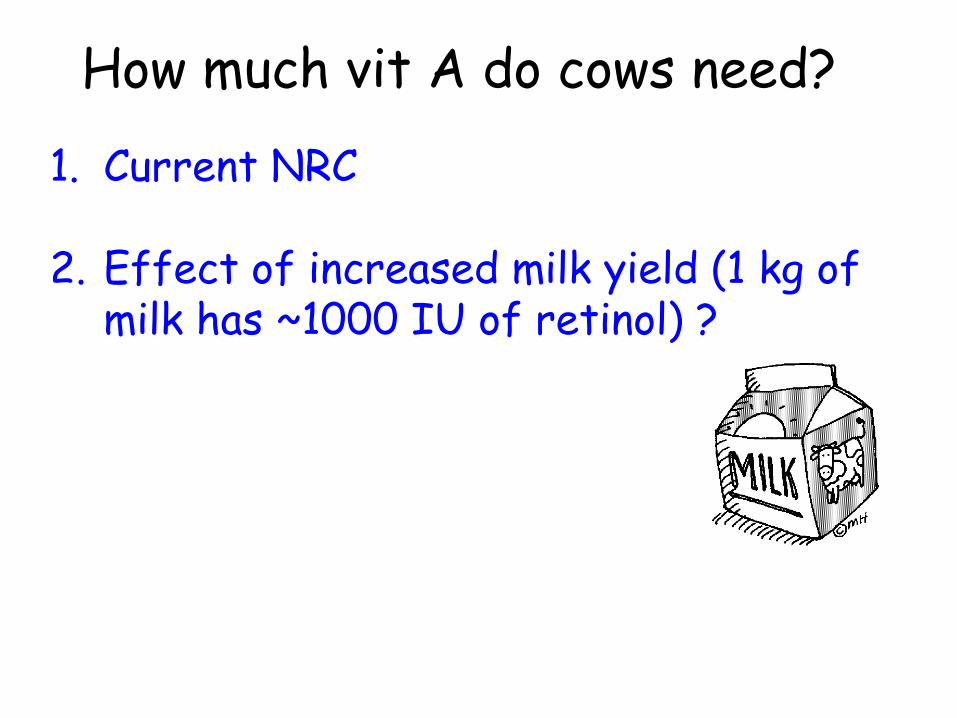
How much vit A do cows need?
1. Current NRC
2. Effect of increased milk yield (1 kg of milk has ~1000 IU of retinol) ?
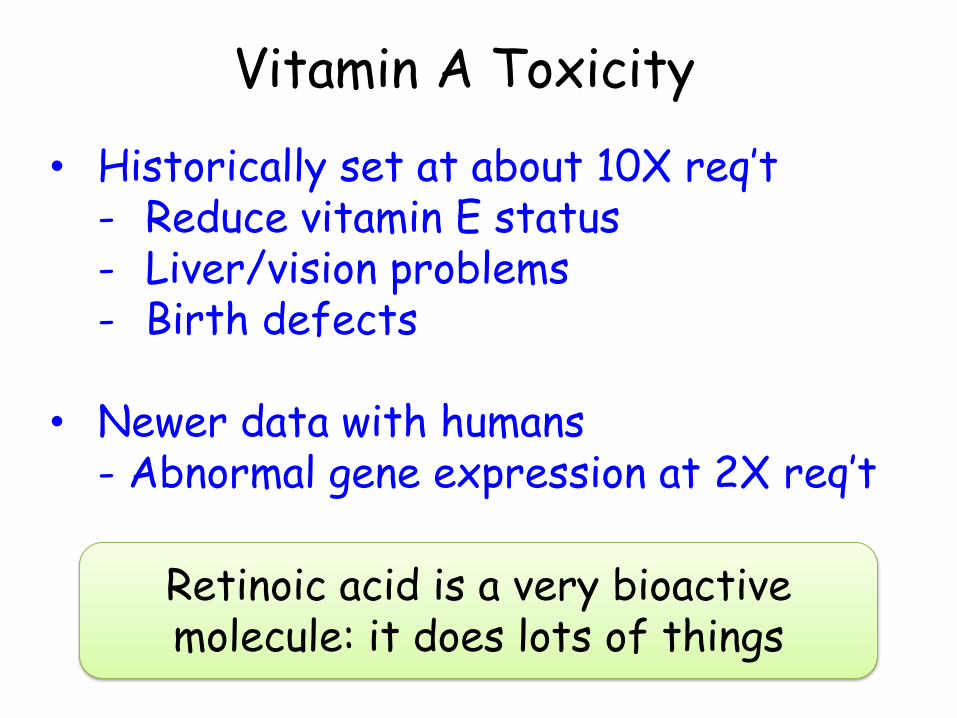
Vitamin A Toxicity
• Historically set at about 10X req’t - Reduce vitamin E status - Liver/vision problems - Birth defects
• Newer data with humans
- Abnormal gene expression at 2X req’t
Retinoic acid is a very bioactive molecule: it does lots of things
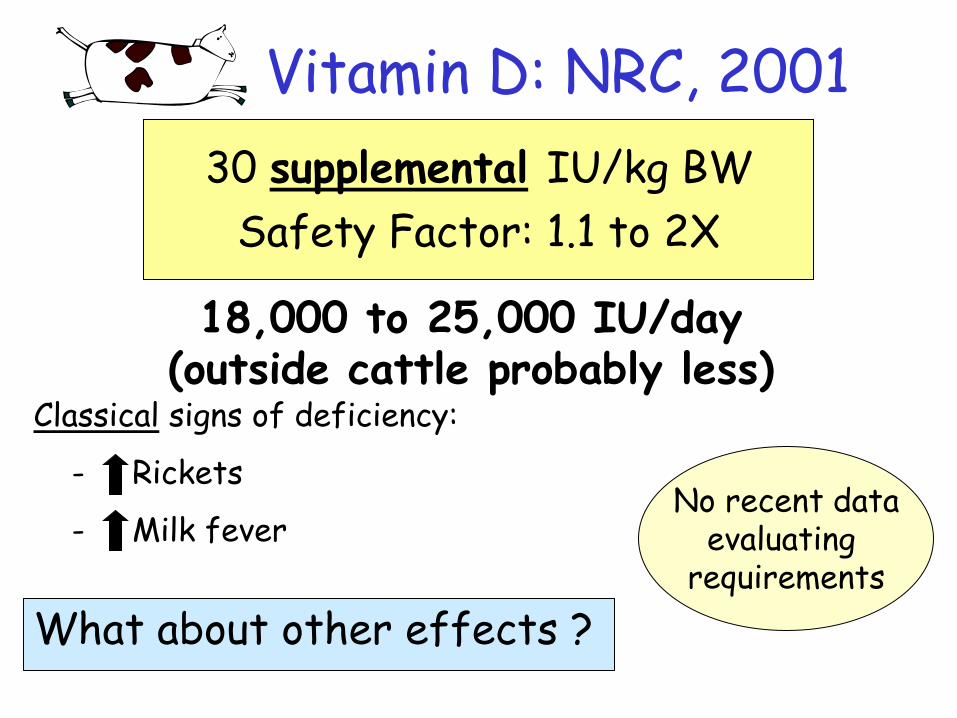
Vitamin D: NRC, 2001
30 supplemental IU/kg BW
Safety Factor: 1.1 to 2X
18,000 to 25,000 IU/day (outside cattle probably less)
Classical signs of deficiency:
- Rickets
- Milk fever No recent data
evaluating requirements
What about other effects ?

Vitamin D and Immune Function
Humans: Low plasma 25-OH D = macrophage kill
Mice: In vitro +vit D; neutrophil kill
Cattle: • With infection PMN: Vit D receptor up-regulated 1-α-OH-ase up-regulated • Mastitis cure increased with IMa 25-OH
vit D
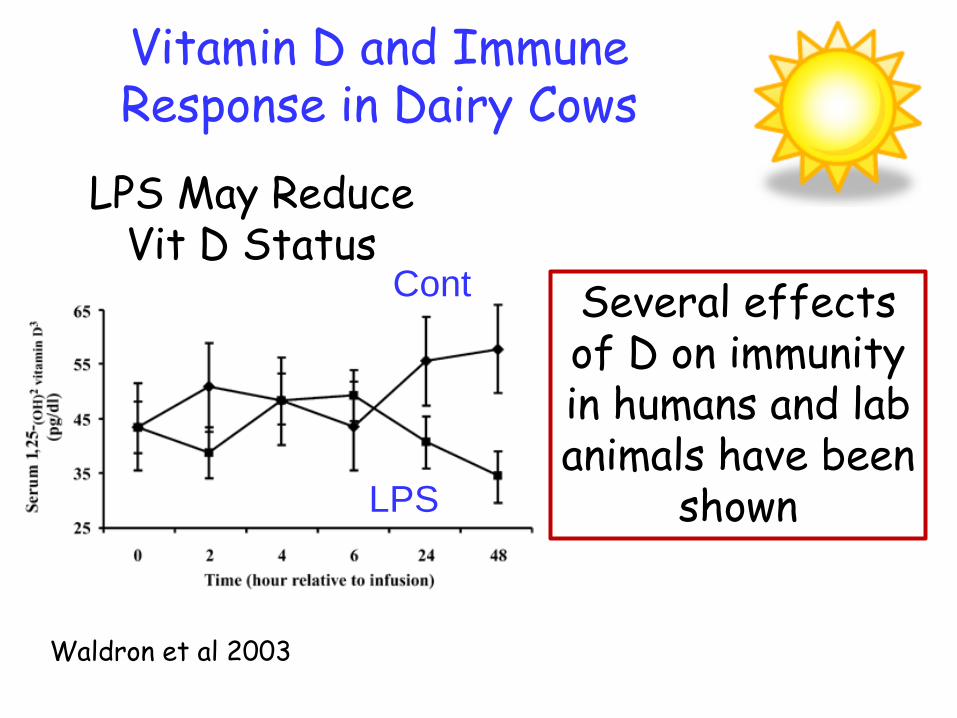
Vitamin D and Immune Response in Dairy Cows
LPS May Reduce Vit D Status
LPS
Cont
Waldron et al 2003
Several effects of D on immunity in humans and lab animals have been
shown
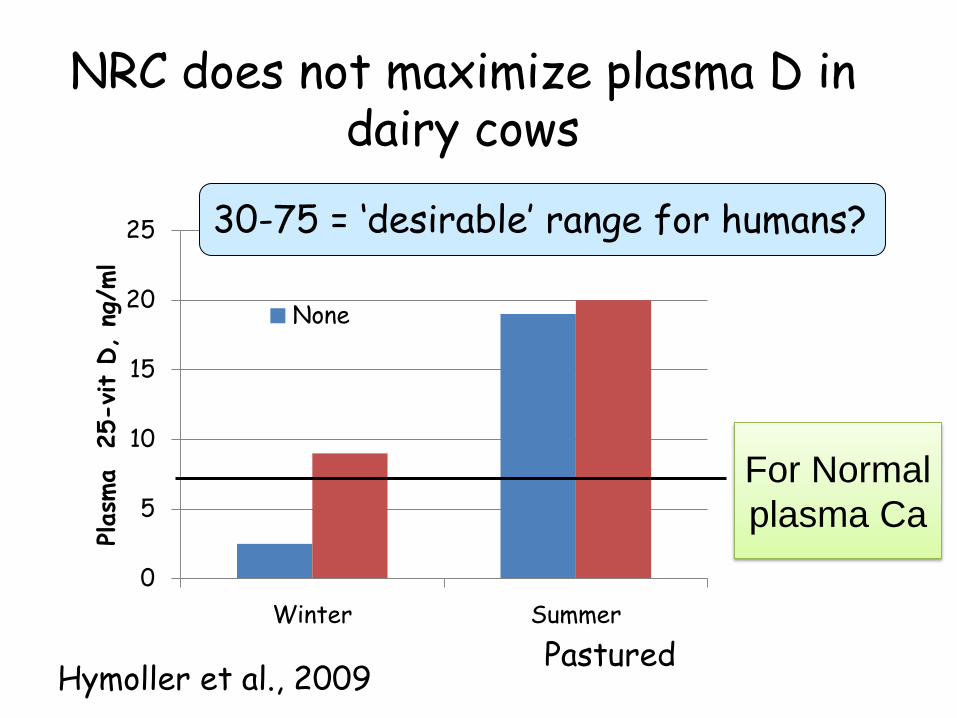
NRC does not maximize plasma D in dairy cows
0
5
10
15
20
25
Winter Summer
Plasm
a 25-vit
D, ng
/ml
None
Hymoller et al., 2009 Pastured
30-75 = ‘desirable’ range for humans?
For Normal
plasma Ca
Vitamin D and Dairy Cows
1. Current recommendations clearly adequate with respect to Ca
2. Probably affects immune response
3. Some old data show milk yield response (~2X current NRC)
4. Time for some new research

Lactating: ~500 IU/day (SF: 1 – 1.2 X)
Dry: ~1000 IU/day (SF: 1 to 1.2X)
Pre-fresh: ~1000 IU/day (SF:2 to 4X)
Vitamin E Low-Med. Risk, Med-High Reward
Main risk: Cost Main benefit: Less disease
Substantial pasture: much less, may be none
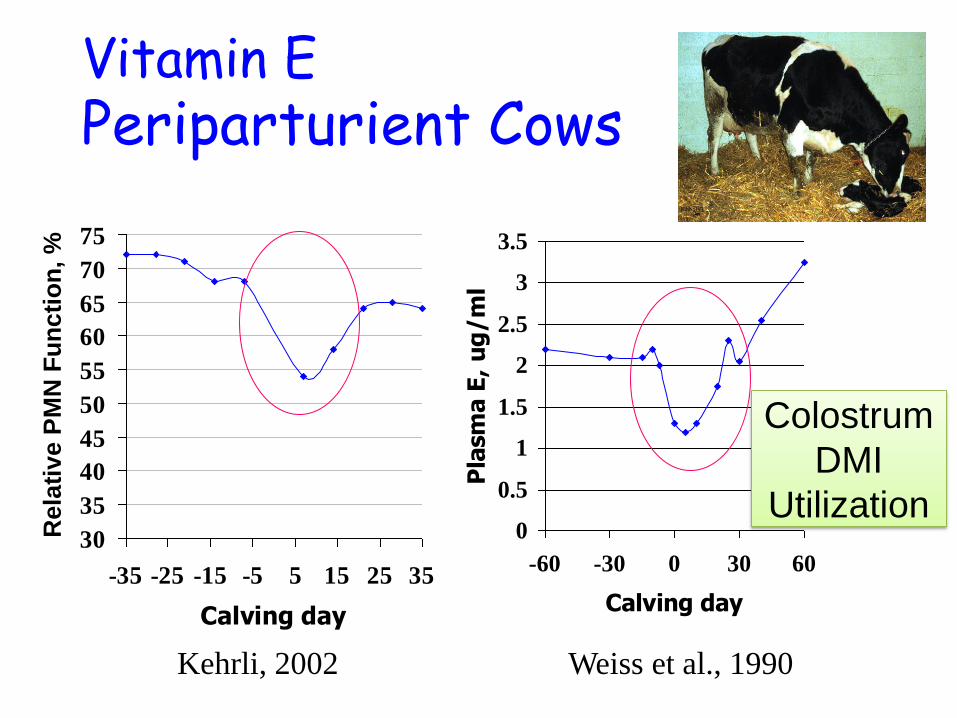
Periparturient Cows
0
0.5
1
1.5
2
2.5
3
3.5
-60 -30 0 30 60
Calving day
Pla
sm
a E
, u
g/m
l
Weiss et al., 1990
30
35
40
45
50
55
60
65
70
75
-35 -25 -15 -5 5 15 25 35
Calving day
Rela
tiv
e P
MN
Fu
nc
tio
n,
%
Kehrli, 2002
Colostrum
DMI
Utilization
Vitamin E

Natural vs. “Really Natural’
Grazing Cows
0
1
2
3
4
5
6
7
8
9
-20 -15 -10 -5 0 5 10 15 20
Toco
ph
erol,
mg/L
Day Relative to Calving
+2500 IU/d Supplement
0
1
2
3
4
5
6
7
8
9
-20 -15 -10 -5 0 5 10 15 20
Day
Cont
Natural
Syn
Sanchez, 2005 Weiss et al., 2009

Vitamin E and Periparturient Cows
0
5
10
15
20
25
30
35
IMI Mastitis
Prev.,
%
100 IU 1000 IU 1000/4000 IU
Weiss et al., 1997
4
4.5
5
5.5
log
SC
C
7 d 14 d
1000 IU 2000 IU
Baldi et al., 2000
Adequate Se Low Se

Vitamin E and Mastitis: Clinical Data
5 Studies: Improved mammary gland health 2 Studies: No effect 1 Study: Negative
Various studies (all confined cattle) None vs. ~1000/500 None vs high at transition ~500 vs extra at transition High during dry period Both all-rac and RRR tocopherol
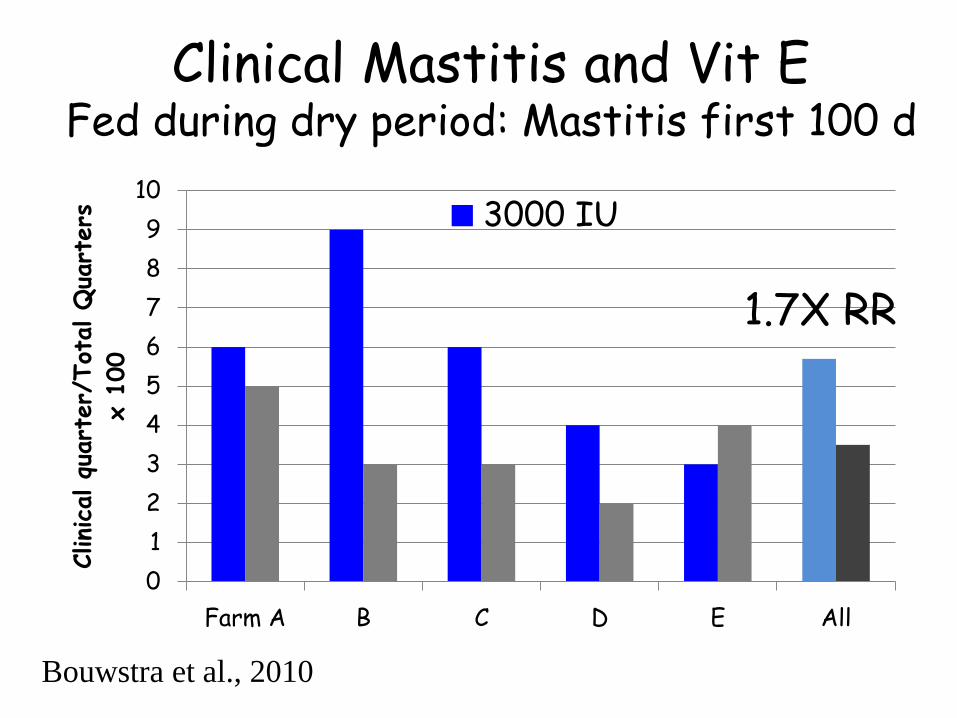
Clinical Mastitis and Vit E Fed during dry period: Mastitis first 100 d
0
1
2
3
4
5
6
7
8
9
10
Farm A B C D E All
Clinica
l qu
art
er/
Tot
al Q
uart
ers
x 1
00
3000 IU
1.7X RR
Bouwstra et al., 2010
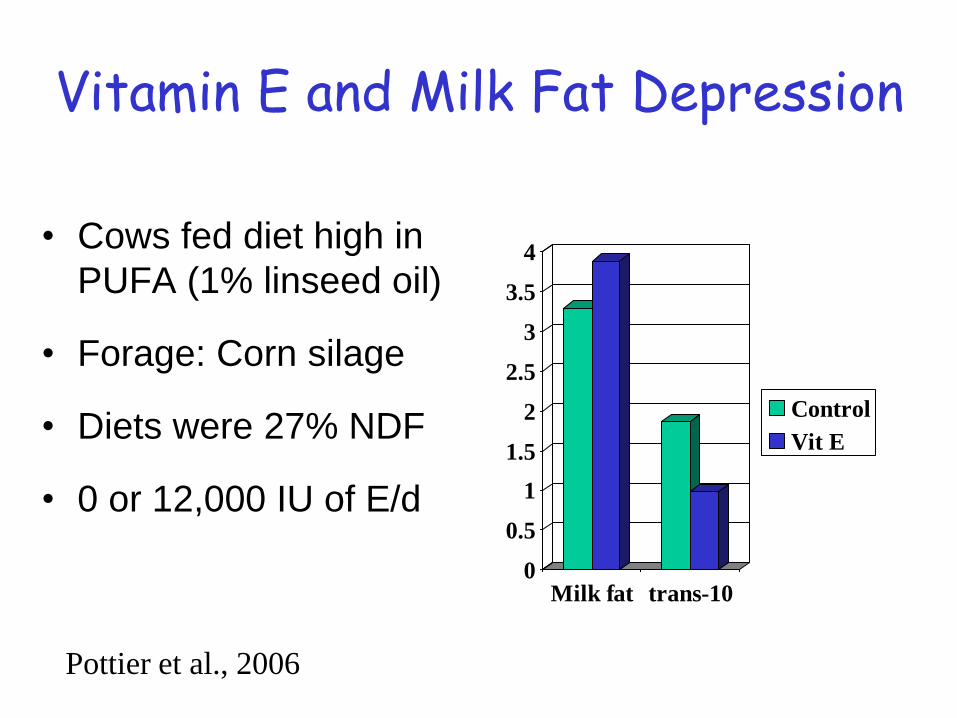
Vitamin E and Milk Fat Depression
• Cows fed diet high in
PUFA (1% linseed oil)
• Forage: Corn silage
• Diets were 27% NDF
• 0 or 12,000 IU of E/d
0
0.5
1
1.5
2
2.5
3
3.5
4
Milk fat trans-10
Control
Vit E
Pottier et al., 2006
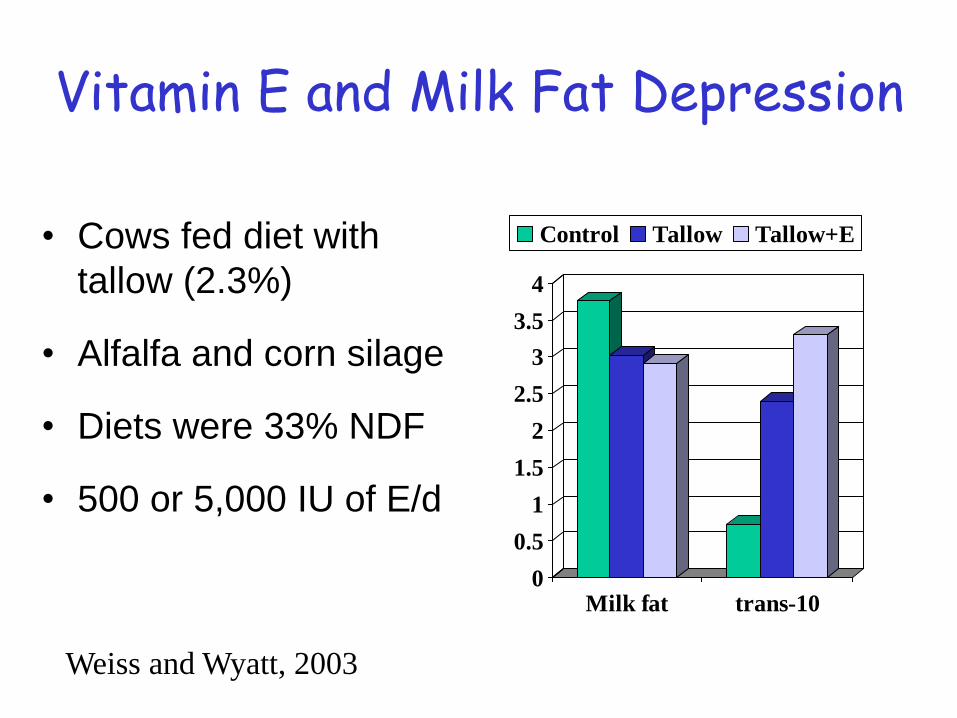
Vitamin E and Milk Fat Depression
• Cows fed diet with
tallow (2.3%)
• Alfalfa and corn silage
• Diets were 33% NDF
• 500 or 5,000 IU of E/d
0
0.5
1
1.5
2
2.5
3
3.5
4
Milk fat trans-10
Control Tallow Tallow+E
Weiss and Wyatt, 2003

Water Soluble Vitamins
Health and Production, Sometimes

Water soluble vitamins
- Biotin
- Choline (?)
- Folic acid
- Niacin
-Vitamin B-12
-Vitamin C
- Riboflavin
- Thiamin
- Vitamin B6
- Pantothenic acid

- White line separation
- Heel warts
- Sole hemorrhage
- “Lameness”
Feeding about 20 mg of biotin/d for several months reduces hoof
lesions and lameness

Biotin: Milk Response (meta-analysis) = 1.3 kg/d
(Lean and Rabiee, 2011)
0
10
20
30
40
50
60
70
80
90
100
Au OH 1 WI FL UK OH 2 OH 2 Iran
Milk
, lb
s/d
ay
Control
20 mg
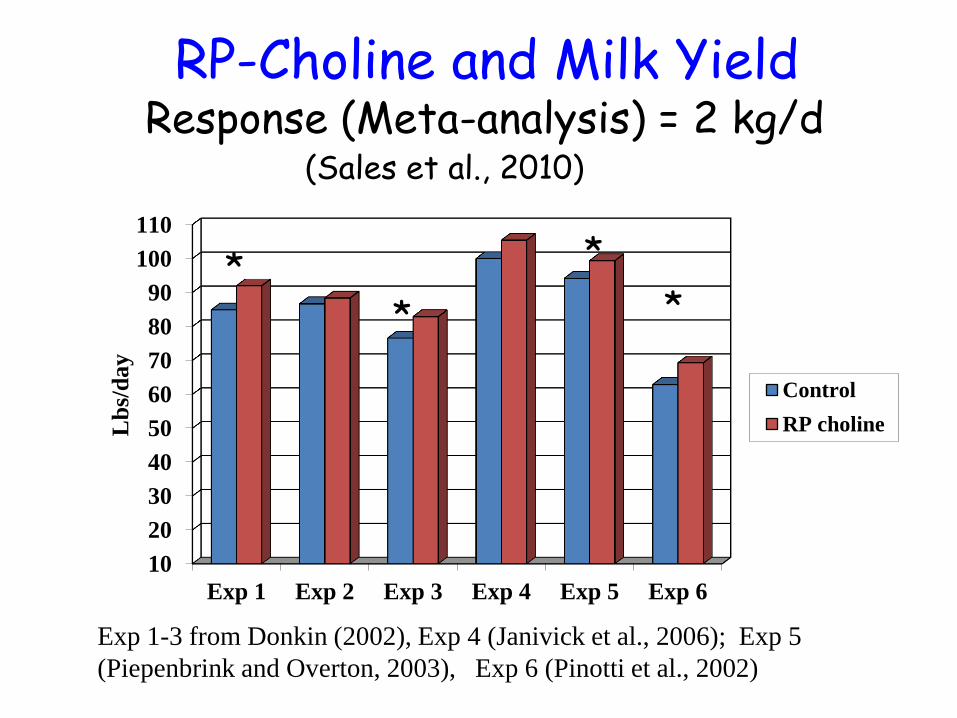
RP-Choline and Milk Yield
10
20
30
40
50
60
70
80
90
100
110
Exp 1 Exp 2 Exp 3 Exp 4 Exp 5 Exp 6
Lb
s/d
ay
Control
RP choline
Exp 1-3 from Donkin (2002), Exp 4 (Janivick et al., 2006); Exp 5
(Piepenbrink and Overton, 2003), Exp 6 (Pinotti et al., 2002)
* *
*
Response (Meta-analysis) = 2 kg/d
*
(Sales et al., 2010)

RPC reduced liver fat build up in cows with -NEB
Cooke et al., 2007
In 2nd expt, RPC increase export of liver fat in cows in +NEB
RP-Choline and Fatty Liver
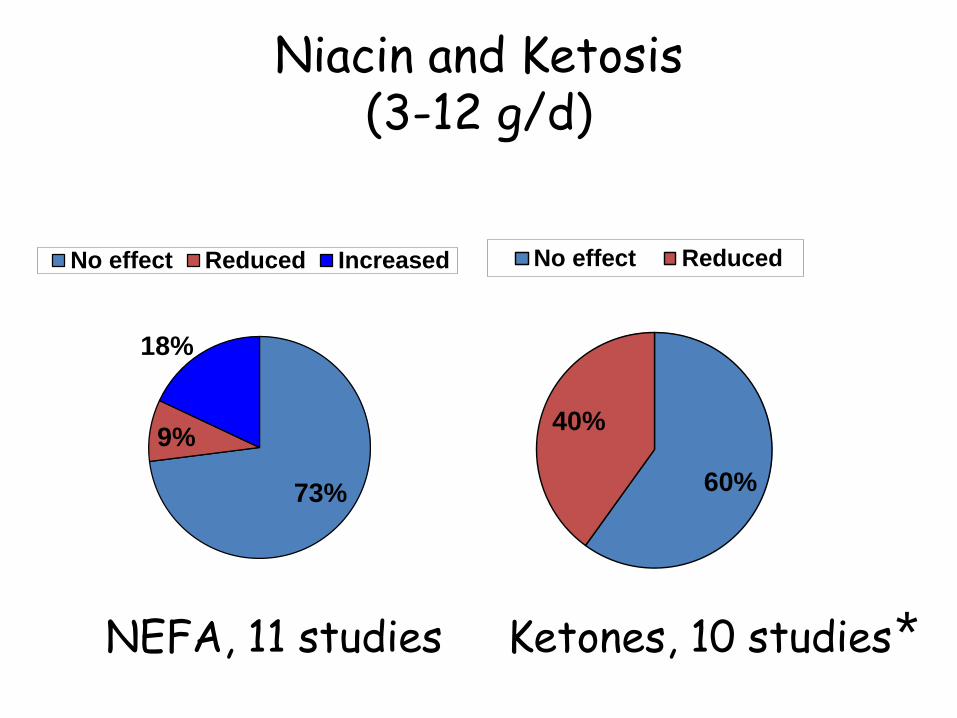
Niacin and Ketosis (3-12 g/d)
73%
9%
18%
No effect Reduced Increased
60%
40%
No effect Reduced
NEFA, 11 studies Ketones, 10 studies *

High Dose Niacin (abstract only) • Jersey cows • 0 or 48 g nicotinic acid/day • 30 d pre until calving
0
200
400
600
800
1000
1200
1400
um
ol/
L
NEFA
Control Niacin
0
5
10
15
20
25
lbs/
da
y
DMI
French, 2004
In 2006, expt repeated with Holsteins and did
NOT work

Niacin and Milk Production
Schwab et al., 2005 Meta-analysis
6 g/d: No effect on production
12 g/d: + 0.5 kg/d milk
+ 26 g/d fat
+ 17 g/d protein
Profitability depends on milk price

Fat Soluble Vitamin Summary
Vitamin A • Stability risk: 1.2 X NRC
Vitamin D • NRC adequate for Ca metabolism • Other responses? : 1.0 to 2.0 X NRC
Vitamin E • NRC adequate for dry/lactating • 2000 to 5000 IU for transition cows

Water Soluble Vitamins
Biotin: Low Risk/High Reward Feed 20 mg/d
No
RP-Choline: High Risk-High Reward
Risk: High cost Reward: More milk (~4 lbs) Maybe less ketosis
Niacin: Low Risk/Low Reward

Bottom Line Feed enough minerals and vitamins
(usually a little extra) but
not too much

http://dairy.osu.edu