vital and health statistics; series 10, no. 50 (2/69)
TRANSCRIPT

NATIONAL CENTER Series 10For HEALTH STATISTICS Number 50
VITAL and HEAZTH STATISTICS
DATA FROM THE NATIONAL HEALTH SURVEY
PersonsHospitalizedby number of hospital episodes
and days in a year
United States - July 1965- June 1966
Statistics on persons with one or more episodes inshort-stay hospitals during an average year, accord-
ing to number of episodes, days hospitalized, andpatterns of stay. Based on data COI Iected in house-hold interviews during the period July 1965-June 1966.
U.S. DEPARTMENT OF HEALTH, EDUCATION, AND WELFARE
Public Health Service
Health Services and Mental Health Administration
Washington, D.C. February 1969

Publ]c Health %?rv,cc Publication No. 10IX)-Series 1O-NO. 50
For sale by the Super] ntc,ndpnt of Documents, L.S. GO\ernmc.nt Printing Office
Washington, D. C.. 20402 - Price ,5.5 cents

NATIONAL CENTER FOR HEALTH STATISTICS
THEODORE D. WOOLSEY, Director
PHILIP S. LAWRENCE, SC. D., Associate Director
OSWALD K. SAGEN, Ph. D., Assistant Director /or Health Statistics Development
WALT R. SIMMONS, M. A., Assistant Director /or Research and Scientific Development
ALICE hi. WATERHOUSE, M. D., Medical Consultant
JAMES E. KELLY, D. D. S., Dental Advisor
EDWARD E. MINTY, Executive O//icer
MA RGERY R. CUNNINGHAM, Information Officer
DIVISION OF HEALTH INTERVIEW STATISTICS
ELIJAH L. WHITE, Director
ROBERT R. FUCHSBERG, Deputy Director
KENNETH HAASE, s~ecia~ Assistant to Director
RONALD W. \VILSON, Cbie/, Survey Methods Branch
GERALDINE A. GLEESON, Chic/, Analysis and Reports Branch
COOPERATION OF THE BUREAU OF THE CENSUS
[Jndcr the legislation establishing the National Health
Survey, the Public Health Service is authorized to use, insofaras possible, the swviccs or facilities of other Federal, St,ate,
or private agencies.
In accordance with specifications established by the
National Health Survey, the Bureau of the Census, under a
contractual arrangement, participates in most aspects of sur-
vey planning, selects the sample, collects the data, and carries
ou t rcrtain parts of the statistical processing.
Public Health Service Publication No. 1000-Series 1O-NO. 50
Library 01 Congress Catalog Card Number 68-62234

CONTENTSPage
Introduction ----------------------------------------------------------
Comparison Witi Earlier HIS Data --------------------------------------
Selected Ftidings -----------------------------------------------------
Source
Special
and Limitations of Data -----------------------------------------
Definitions and Inclusions ---------------------------------------
Persons Hospitalized --------------------------------------------------Age---------------------------------------------------------------Sex --- - -- --- --- - - -- - - ----- - -------- -- - ----------- ----- -- - - - - - -----
Color -------------------------------------------------------------Region ------------------------------------------------------------Residence ---------------------------------------------------------Family Mcome -----------------------------------------------------htarital Status ------------------------------------------------------Living Arrangements -----------------------------------------------
Detailed Tables -------------------------------------------------------
Appendix I. Technical Notes on Mefiods -------------------------------Background of This Report -------------------------------------------Statistical Desi~of tie Healti Interview Survey -----------------------General Qualifications ----------------------------------------------Reliability of Estimates ---------------------------------------------Guide toUseof Relative Standard ErrorCharts ------------------------
Appendix II. Definitions of Certain Terms Used in’This Report -----------Terms Relating to Hospitalization ------------------------------------Demographic, Social, and EconomicTerms ----------------------------
Appendix III. Questionnaire Items Referring to Hospitalization ------------
1
2
3
6
6
77
10101010111111
12
434343444446
494949
51

IN THIS REPORT statistics ave presented from the Health Interview
Survey on the hospital expedience of individual pevsons over a 12-month
peviod, the data being collected duving the peviod July 1965-June 1966,Information on pe~sons of age 65 or oldev should be of special inteves t
since it p~ovides a baseline on hospital episodes just prior to the enact-
ment of the Medicave lep”sla tion.
The 19.1 million pevsons hospitalized in this vefevence period vepve -sent an annual rate of 100 peYsons with one or more episodes pev 1,000population. These figwes ave higher than those based on data collected
duving the period July 1960-June 1962 when 16.6 million pevsons, 93with one or more episodes per 1,000 population, wave hospitalized duv -ing an avevage year. The vate of persons hospitalized with one short-stay hospital episode pev 1,000 population increased from 80 duying theearlier interval to 86 during the period July 1965-June 1966, while therate of multiple episodes peY 1,000 population increased only sli~htly,
@om 13 to 14.
With the exception of females in the 15-44 age vange, an age span duvingwhich theve are many hospitalizations for deliveries, the rate of hospi-talization pev 1,000 population incveased with age. The female vate ofhospitalization was approximately 50 pevcent highev than that fov males.
A single hospital episode of 1-7 days was the most common pattern of
hospital stay, with 63.8 percent of the persons hospitalized experiencingthis pattern. The persons hospitalized duving an average year repre-
sented 10 pe-rcent of the total population, and they experienced approxi-mately 179 million hospital days, an avevage of 9.4 hospital days perperson hospitalized duving the 12-month period ending in June 1966.
SYMBOLS
I Data not available ------------------------ --- ICategory not applicable ------------------- . . .
I Quantity zero ---------------------------- - IQuantity more than O but less than 0.05 ---- 0.0
Figure does not meet standards ofreliability or precision ------------------ *

PERSONS HOSPITALIZED
BY NUMBER OF HOSPITAL EPISODES AND DAYS IN A YEAR
Michael S. Backenheimer, Ph. D., Division of Health Interview Statistics
Prior to
INTRODUCTION
the release of the Vital and HealthStatistics publication, Series 13, No. 1, from theDivision of Health Records Statistics (HospitalDischarge Survey) in October 1966, all of thestatistics on hospitalization issued by the Na-tional Center for Health Statistics were derivedfrom data collected in the Health InterviewSurvey (HIS). With the advent of this and sub-sequent publications based on the Hospital Dis-charge Survey (HDS), differences in short-stayhospital discharge estimates were found to existbetween the two surveys. In each instance, therates of short-stay hospitalizations published byHDS were higher than those published by HIS.
Some of this variation in rates can be ex-plained by differences in the definitions whichwere employed and in the scope of the two sur-veys, and by the sources of data utilized. Esti-mates produced by HDS are based on hospitalrecords and include stays of less than 1 nightas well as hospitalizations that are terminatedby death. In HIS, data are collected by householdinterview, and the experience of persons not livingat the time of interview is excluded from the data.Hospital stays of less than 1 night and hospitalstays by military personnel and institutionalizedpersons (population groups which are not includedin the survey) are also excluded from HIS esti-mates. A detailed reconciliation of hospital dis-
charge estimates derived from the two surveyscan be found in appendix II of Series 13, No. 2.
It is possible to derive two kinds of hospitali-zation estimates from data collected in the HealthInterview Survey. One type of estimate dealswith the number of hospital discharges as a uni-verse without considering the number of personsinvolved. Two publications by the Division ofHealth Interview Statistics (Series B, No. 32, andSeries 10, No. 30) are devoted exclusively to hos-pital discharges and the length of stay in short-stay hospitals. One table in each report of theCurrent Estimates series published by the Divi-sion of Health Interview Statistics (the latestbeing Series 10, No. 43) is also devoted to sum-mary data on hospital discharges. The othertype of hospitalization statistics produced by theHealth Interview Survey consists of estimatesof persons with short-stay hospital episodesduring a year. This report updates findingspresented in Series 10, No. 20, which was thefirst publication of this type.
Using person experience as a basis forestimation, it was found that 19.1 million per-sons in the civilian, noninstitutionalized popu-lation had one or more episodes lasting for 1night or longer in short-stay hospitals for the12-month period, July 1965- June 1966. Thisdiffers materially from the 24.2 million dis-charges per year (also based on health interviewdata and collected during the same period), be-
1
cause itrepresentsa countofpersons,some of
whom had more thanone episodeina year,while
estimatesof dischargesdescribethetotalnum-
ber of hospitalizationsregardlessofthenumber
ofpersons involved.
COMPARISONWITH EARLIER HIS DATA
The 19.1 millionpersons who were hospital-
ized during the 12-month period July 1965-
June 1966 representa rate of 100 persons with
one or more episodes per 1,000 population.
These figuresare substantiallyhigher than the
annualestimate,basedondatacollectedduringthe
period July 1960-June 1962, when 16.6 millionpersons, or 93 persons with one or more epi-
sodes per 1,000 population,were hospitalizedduringan average year.
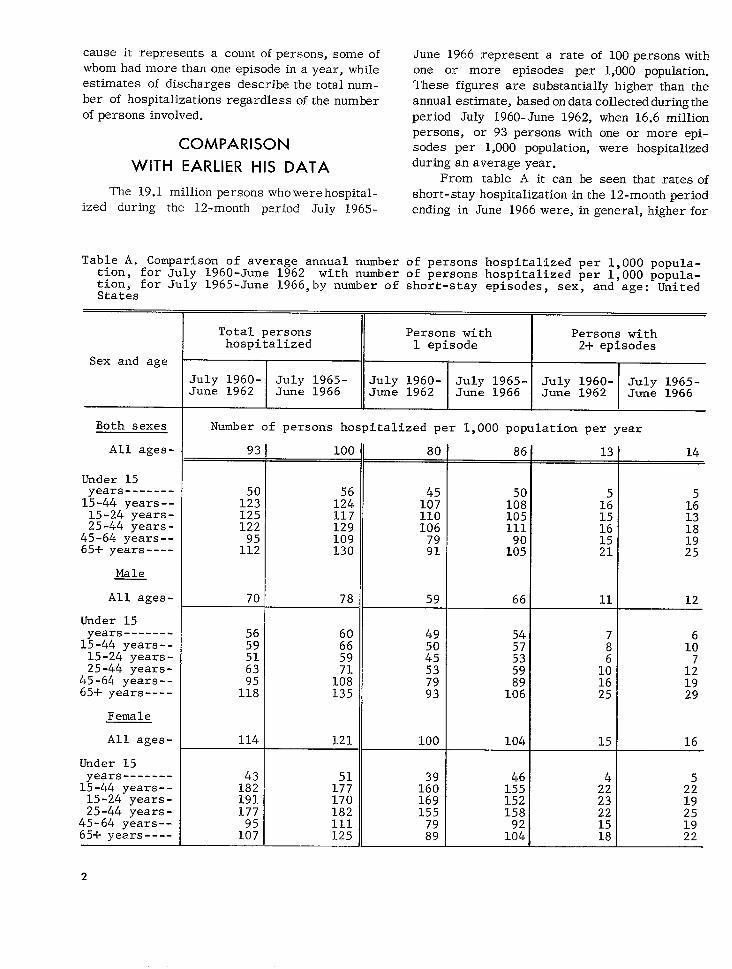
From table A itcan be seen thatratesof
short-stayhospitalizationinthe 12-month period
ending in June 1966 were, ingeneral,higherfor
Table A. Comparison of average annual number of persons hospitalized per 1,000 popula-tion, for July 1960-June 1962 with number of persons hospitalized per 1,000 popula-tion, for July 1965-June 1966,by number of short-stay episodes, sex, and age: UnitedStates
Sex and age
Both sexes
All ages-
Under 15years-------15-44 years--15-24 years-25-44 years-
45-64 years-.65+ years----
Male
All ages-
Under 15years-------15-44 years--15-24 years-25-44 years-
45-64 years--65+ years----
Female
All ages-
Under 15years-------15-44 years--15-24 years-25-44 years-
45-64 years--65+ years----
Total persons Persons with Persons withhospitalized 1 episode 2+ episodes
July 1960- July 1965- July 1960- July 1965- Jllly 1960- July 1$165-
June 1962 June 1966 June 1962 June 1966 June 1962 June 1966
Number of persons hospitalized per 1,000 population per year
93 100
12:117129109130
78
606659
1::135
121
51177170182111125
80
45107
59
49
100
39160169
54 75753 :59 10
161% 25
104 15
m
14
12
J1929
16
1922
2

both sexes than comparable rates based on datacollected from July 1960- June 1962. The singledeviation from this increasing rate of short-stayhospitalization is to be found among females aged15-24 years who showed a decrease of 21 per-sons hospitalized per 1,000 population. This de-crease probably reflects the declining fertilityrate in the United States which is defined asthe number of live births per 1,000 women aged15-44 years. In calendar year 1965, the fer-tility rate in the United States was 96.6 whilethe same rate for 1961 was 117.2.1
The increasing rate of short-stay hospi-talization noted above is particularly prominentfor persons of both sexes who are 65 years orolder. This may, in part, be due to the fact thatthe incidence of acute conditions was higher duringthe most recent time period (Series 10, Nos. 1 and38). k is important to realize that no part df thisincrease in persons hospitalized can be attributedto Medicare since the basic legislation providingfor hospital coverage of those persons aged 65years and over did not become effective untiIJuly 1, 1966.
It is also evident from table A that most ofthe increase in hospital episodes can be attributedto persons having only one short-stay hospitalepisode in the reference period and not to anylarge increase in multiple episodes. The rate ofpersons hospitalized with one short-stay hospitalepisode per 1,000 population increased from 80 to86 while the rate of multiple episodes per 1,000population increased only slightly, from 13 to 14.The finding that there were approximately 14readmission for every 100 persons with hos-pital episodes compares favorably with a study,carried out in England, that shows between 10 and25 readmission for every 100 persons admittedto a hospital in a year’s time. 2
For both males and females, and white andnonwhite persons, there were increases in thenumber of persons hospitalized per 1,000 popu-lation. Again, most of this gain was among per-sons having only one short- stay hospital episode.
l~ational Center for Health Statistics: VitaZ Statistics ofthe United States, 1965, Vol. L Public Health Service. Wash-
ington. U.S. Government Rintin~ Office, 1966.
I,oIume \/1, I{umber ~, hfaj’ 19~L?.2BIue Cross Reports, ,
From table B it can also be seen that, by region,
the South showed the largest increase in the num-ber of persons hospitalized per 1,000 population.
Days per person hospitalized per year (forpersons with one or more short-stay hospitalepisodes) were also compared for the two timeperiods (table C). In general, hospital episodeswere slightly shorter in the July 1965-June 1966reference period than in the July 1960-June 1962reference period. For both periods of time, males15 years or older consistently had longer averagestays than did females. A single episode of I-7days was the most common pattern of hospitalstay in both time periods with 63.9 percent ofthe persons hospitalized experiencing this patternin the earlier reference period and 63.8 percentexperiencing this pattern in the July 1965-June1966 reference period (table 25).
SELECTED FINDINGS
During the period July 1965-June 1966,19.1million persons were hospitalized in short-stayfacilities, a rate of 100 persons with one or moreepisodes per 1,000 population. As shown in figure1, the rate among males increased with advancingage. Among females, however, this consistent
MALE FEMALE
200
[ 177
I150 L
Figure 1. Number of persons
Fopulatiar{ per year,
hospital ized per 1,000
k.y age ar,cl %JX.
3

Table B. Comparison of average annual number of persons hospitalized per 1,000 popula-tion, for July 1960-June 1962 with number of persons hospitalized per 1,000 popula-tion, for July 1965-June 1966, by number of short-stay episodes and selected demo-graphic characteristics: United States
Character-istic
Aze
All ages-
Under 15years-------15-44 years--45-64 years--65+ years----
Sex
Male ---------Female -------
Color
White --------Nonwhite -----
Region
Northeast----NorthCentral-----South--------West ---------
Total persons Persons with Persons withhospitalized 1 episode 2+ episodes
July 1960- July 1965- July 1960- July 1965- July 1960- July 19fj5-
June 1962 June 1966 June 1962 June 1966 June 1962 June 1966
Number of persons hospitalized per 1,000 population per year
93
5012395
112
9573
89
969293
100
56124109130
lx
10381
95
102105
97
80
45107
H
1::
86
1::90
105
1X
8871
84
868984
13
1:H
1115
1310
11
13
::
14
1216
1510
11
161613
patternwas broken by thehighrateamong those vitalizedexperiencingthispattern.Othercommonaged 15-44 years, an age intervalduringwhich
there are many hospitalizationsfor deliveries.
About 85.8percentofthepersonswithoneor more
hospitalepisodeshad onlyone episodeofhospital-.
ization in the year; 14.2 percent had multipleepisodes including 2.8 percent who had more than
two episodes (table 3). Among persons with hos-pital episodes, multiple episodes were most fre-quent among persons with low family income,living alone or with nonrelatives, divorced orseparated, or living in the North Central orSouth Regions (table 21).
As was stated earlier, a single episode of
1-7 days was the most common pattern ofhos-
pital stay, with 63.8 percent of thepersonshos-
patterns of stay, in order of frequency, were oneepisode of 8-14 days and one episode of 15-30days (table 25). Among persons with family in-comes less than $3,000, 53.5 percent experiencedsingle episodes of 1-7 days compared with 66.5percent for those with family incomes of $3,000or over.
The persons hospitalized during an averageyear represented 10 percent of the total popula-
tion (table 1), and theyexperiencedapproximately179 million hospital days, an average of9.4hos-pital days per person hospitalized during thel2-month period ending June 1966 (table 4).
The many hospitalizations fordeliveryamong
females 15-44 years were responsible, to agreat
A
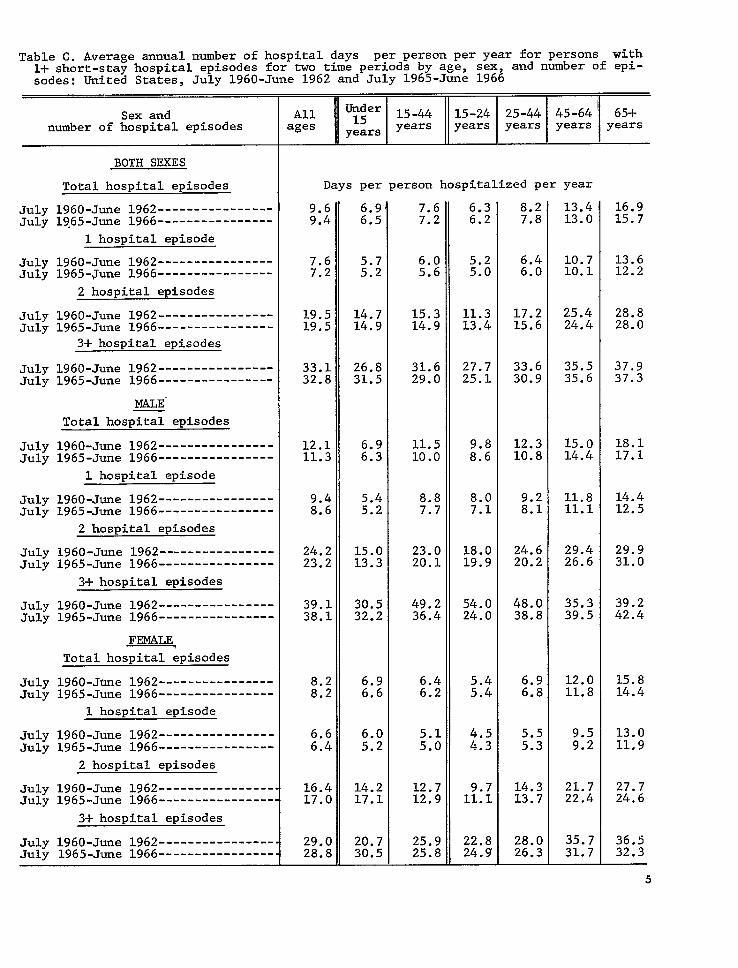
Table C. Average annual number of hospital days per person per year for persons with1+ short-stay hospital episodes for two time periods by age, sex, and number of epi-sodes: United States, July 1960-June 1962 and July 1965-June 1966
Sex andnumber of hospital episodes
JulyJuly
JulyJuly
JulyJuly
JulyJuly
JulyJuly
JulyJuly
JulyJuly
JulyJuly
JulyJuly
JulyJuly
JulyJuly
JulyJuly
BOTH SEXES
Total hospital episodes
1960-June 1962----------------19,65-June 1966----------------
1 hospital episode
1960-June 1962----------------1965-June 1966----------------
2 hospital episodes
L960-June 1962----------------1965-June 1966----------------
3+ hospital episodes
1960-June 1962----------------1965-June 1966----------------
MALE-
Total hospital episodes
1960-June 1962----------------1965-June 1966----------------
1 hospital episode
1960-June 1962----------------1965-June 1966----------------
2 hospital episodes
1960-June 1962----------------1965-June 1966----------------
3+ hospital episodes
1960-June 1962----------------1965-June 1966----------------
FEMALE,
Total hospital episodes
1960-June 1962----------------1965-June 1966----------------
1 hospital episode
1960-June 1962----------------1965-June 1966----------------
2 hospital episodes
1960-June 1962-----------------1965-June 1966----------------”
3+ hospital episodes
1960-June 1962-----------------1965-June 1966-----------------
Allages
Under15
years
15-44years
15-24 25-44years years
45-64years
Days per person hospitalized per year
9.69.4
7.67.2
19.519.5
33.132.8
12.111.3
;.:.
24.223.2
39.138.1
8.28.2
6.66.4
16.417.0
29.028.8
6.96.5
5.75.2
14.714.9
26.831.5
n
5.45.2
15.013.3
30.532.2
6.96.6
6.05.2
14.217.1
20.730.5
7.67.2
6.05.6
15.314.9
31.629.0
11.510.0
8.87.7
23.020.1
49.236.4
6.46.2
5.15.0
12.712.9
25.925.8
6.36.2
5.25.0
11.313.4
27.725.1
9.88.6
8.07.1
18.019.9
54.024.0
5.45.4
4.54.3
1;:;
22.824.9
8.27.8
6.46.0
17.215.6
33.630.9
12.310.8
9.28.1
24.620.2
48.038.8
6.96.8
5.55.3
14.313.7
28.026.3
13.413.0
10.710.1
25.424.4
35.535.6
15.014.4
11.811.1
29.426.6
35.339.5
12.011.8
9.59.2
21.722.4
35.731.7
65+years
16.915.7
13.612.2
28.828.0
37.937.3
18.117.1
14.412.5
29.931.0
39.242.4
15.814.4
13.011.9
27.724.6
36.532.3
5

extent, for a comparatively low number of hos-pital days per person in this group (fig. 2). Fe-males in this age group averaged 6.2 days in ayear compared with 8.2 days for females of allages. Children under 15 years had comparative-ly few hospital days during the year, withaverages of 6.3 days for males and 6.6 days forfemales. Except for this youngest age group,
males had on the average more hospital daysannually than did females (table C).
MALE
171
FEMALE
14.4
Under M 15-4445.64 6!5+ Under 15 15-4445-64 65+years years years years years years years yeors
igure 2. Average number of days hospital ized per per-son, by age and sex.
SOURCE AND LIMITATIONS
OF DATA
The data for hospitalized persons containedin this publication were derived from householdinterviews in the Health Interview Survey of theNational Center for Health Statistics. These inter-views were conducted in a probability sample ofthe civilian, noninstitutional population of the
United States. The sample is so designed thatinterviews are conducted each week in a repre-
sentative sample of the Nation’s households bytrained personnel of the Bureau of the Census.
6
During the 52-week period from July 1965-June1966, the sample was composed of approximately42,000 households containing about 134,000 per-sons living at the time of the interview. Eachweek interviews were conducted in a differentsample of households. The hospital experience ofhousehold members during the 12 months priorto the interview was elicited, as well as infor-mation on other health and demographic charac-teristics.
A further description of the statistical design
of the survey, of the methods of estimation, andof general qualifications of the data obtained ispresented in appendix I. Since all dats includedin this report are estimates based on a sampleof the population rather than on the entire popu-lation, they are subject to sampling error. Thesampling errors for most of the estimates areof relatively low magnitude. However, where anestimated number of the numerator or denomi-nator of a rate or percentage is small, the sam-pling error may be high. Charts from whichapproximate sampling errors may be estimatedand instructions for their use are also presentedin appendix L
Definitions of certain terms used in the re-
port are given in appendti II. Since many of the
terms have specialized meanings it is suggestedthat the reader familiarize himself with thesedefinitions, as well as with the qualifications of
the interview data as described in the followingsection of this report.
SPECIAL DEFINITIONS AND
INCLUSIONS
Estimates shown in this report describehospitalization only for those members of thecivilian, noninstitutional population of the UnitedStates who were living at the time of the interview.These data on hospitalized persons do not there-fore represent the maximum care which can beprovided by hospitals in the Nation.
The persons included are discussed in re-lation to certain demographic characteristics and
by the extent to which these factors influenced theperson’s pattern of hospital utilization or stay inthe year preceding interview. “Pattern of hospitalstay” is a term used in this report to describethe relationship of the number of hospital daysduring the year to the number of episodes the

person had (for example, a single episode of1-7 days was the most usual pattern of stay).
Stays in short-stay hospitals discussed in thisreport have been referred to as “episodes” and,unlike discharges, are not necessarily hospital-izations completed prior to the interview. Hos-pital days for persons with one or more episodesinclude only those hospital days which occurredwithin the 12-month period prior to the week ofinterview. More significantly, this report dealswith persons, some of whom had more than oneepisode in a year, whereas counts of hospitaldischarges represent the total number of dis-charges during a year without regard to the num-ber of persons involved.
Detailed data from the Health Interview Sur-vey on hospital discharges are contained inthe Vital and Health Statistics report, Series10, No. 30.
PERSONS HOSPITALIZED
Basic to any discussion of persons hospital-ized is the question of what factors cause per-sons to be hospitalized. The patterns of seekingand receiving hospital care in the Nation aredetermined, to a great extent, by an intricateset of interrelated variables. Present medicalpractice and knowledge exert a heavy weight indetermining what conditions and illnesses arebest diagnosed and treated in a hospital. Physi-cians recommend, for example, that deliveriestake place in a hospital setting, that certain diag-nostic tests be administered by hospital facili-ties, and that disabIing and threatening disordersbe observed and treated under hospital care, withsurgery when required.
One prime consideration in ascertainingwhether or not a person will be hospitalized is thecondition to be cared for. Certain conditions,physiologic or pathologic, which are best treatedin the hospital, are characteristic of some agegroups but not of others, or are common to onesex but not the other. Therefore, hospital experi-ence will vary to a great degree according to theage and sex of the person, as well as with otherdemographic characteristics.
It is, however, not just the orientation ofphysicians nor the age and sex of a person thatdictates whether or not he will be hospitalized.
Of prime consideration is the person’s realiza-tion or knowledge of his condition and his atti-tudes toward disease, illness, and the medicalprofession. These factors decide at what point intime a person will seek medical consultationand services, and to what extent he will makeuse of preventive medical care.
Other factors such as a determined programof health education, increased and extended healthinsurance plans, and free hospital care to somesegments of the population have made access tohospital care and treatment easier than in pastgenerations.
Of the selected characteristics of the popu-lation shown in table 1, sex, age, marital status,and living arrangements are important character-istics in relation to the frequency of hospitaliza-tion. The high proportion of hospital episodes fordelivery is, of course, the basic factor causingthe variations noted for these four populationtraits. The infIuence of the high rate of deliveriesis brought into focus by the age-sex data shown intable 2; the percentage of females 15-44 years ofage with hospital episodes (17.7 percent) isapproximately three times that for males :.1 thesame age group (6.6 percent).
The remainder of the detailed tables (3-2!5),exclusive of those showing the population data bythe various characteristics (tables 26- 29), arerestricted to persons with one or more hospitalepisodes. Percent distribution by number ofepisodes and number of hospital days during ~year are shown according to the populatioi~characteristics outlined in table 1.
The foIlowing discussion will focus on shol t-stay hospital episodes and hospital days as tbare related to selected demographic character-ist its. Table D provides the base for most ofthe following discussion. Since the survey coversonly the living members of the household, thefindings are applicable only to the survivorswith hospital episodes.
Age
As might be expected, age shows itself asa potent variable in determining the distributionof short-stay hospitalizations. In general, epi-sodes of short-stay hospitalizations increase withage. The lone exception to this general pattern
7

Table D. Number of persons by age groups hospitalized per 1,000 population per year,by number of short-stay episodes and selected demographic characteristics: UnitedStates, July 1965-June 1966
Characteristic
All ages--------------
Male ------------------------Female----------------------
Color
White -----------------------Nonwhite --------------------
Region
Northeast -------------------North Central---------------South-----------------------West ------------------------
Residence
SMSA’S----------------------Outside SMSA’S:
Nonfarm -------------------Farm----------------------
Family income
Under $3,000----------------$3,000-$4,999---------------$5,000-$6,999---------------$7,000-$9,999---------------$10,000+--------------------
Marital status-17+ vears
Ever married ----------------Married ---------------------Widowed ---------------------Divorced --------------------Separated-------------------Never married ---------------
Living arrangements-17+ years
Living alone or withnonrelatives ---------------Living with relatives-married --------------------Living with relatives-other----------------------
Totalpersons
hospital-ized
All ages
Persons with:
m
Under 15 years
Totalpersons
hospital-ized
Persons with:
1 2+epi- epi-sode sodes
Number of persons hospitalized per 1,000 population
100
78121
10381
1:;10597
96
11094
1071061069689
13513513012815372
112
136
65
86
66104
8871
84868984
84
9278
::918479
11411510710312364
93
115
57
per year
14
1216
;:
11161613
12
1816
2016151310
212123
H8
18
21
8
56
6051
;:
58565259
54
%
4953616052
...
...
...
...
...
...
...
...
...
50
5446
:;
;;4754
49
5343
:255
::
...
...
...
...
...
...
...
...
...
5
65
5*
5655
5
7*
*
;
z
...
...
...
...
...
...
...
...
...
8

Table D. Number of persons by age groups hospitalized per 1,000 population per year,by number of short-stay episodes and selected demographic characteristics: UnitedStates, July 1965-June 1966—Con.
15-44 years 45-64 years 65+ years
Persons with:
m
Totalpersons
ho;:@~al-
Totalpersons
hospital-ized
Persons with: Persons with:Totalpersons
hospital-ized
1epi-sode
2+epi-sodes&!-_E!&
Number of persons hospitalized per 1,000 populationper year
12/ 108 10! 90 19 130 10: 25
1?
12!12(
11[12(13;Ilf
11$
13;11:
13114:13511$
101
15415412314017368
84
154
82
57155
108107
105107114104
105
11896
11512612110289
13313310911314062
73
134
72
lC22
1>1:
1:
::14
15
2019
::181712
2120**9C7
*
20
10
10/11:
1919
20*
;:2320
16
2619
2920201714
20
;;7’<-k*
231
19
18
135125
13479
117129150117
125
139128
125126148112150
131127134160
11;
130
127
135
106104
10865
10110211792
102
110102
R116100136
1051011119C
9;
109
100
111
2922
26*
;23324
23
29*
272632**
252723***
22
27
25
11:8:
9:llL
12:lot
111
81
122
110
91
9
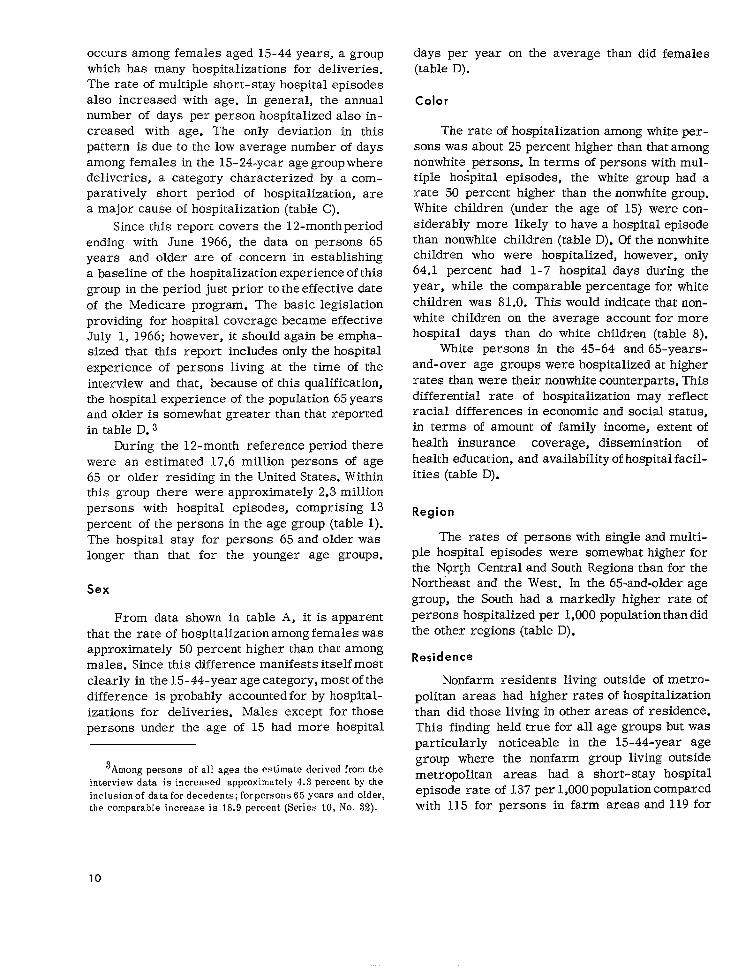
occurs among females aged 15-44 years, a groupwhich has many hospitalizations for deliveries.The rate of multiple short- stay hospital episodesalso increased with age. In general, the annualnumber of days per person hospitalized also in-creased with age. The only deviation in thispattern is due to the low average number of daysamong females in the 15-24-year age group wheredeliveries, a category characterized by a com-paratively short period of hospitalization, area major cause of hospitalization (table C).
Since this report covers the 12-month periodending with June 1966, the data on persons 65years and older are of concern in establishinga baseline of the hospitalization experience of this
group in the period just prior to the effective dateof the Medicare program. The basic legislationproviding for hospital coverage became effectiveJuly 1, 1966; however, it should again be empha-sized that this report includes only the hospital
experience of persons living at the time of theinterview and that, because of this qualification,the hospital experience of the population 65 yearsand older is somewhat greater than that reportedin table D. 8
During the 12-month reference period therewere an estimated 17.6 million persons of age65 or older residing in the United States. Withinthis group there were approximately 2.3 millionpersons with hospital episodes, comprising 13percent of the persons in the age group (table 1).The hospital stay for persons 65 and older waslonger than that for the younger age groups.
Sex
From data shown in table A, it is apparentthat the rate of hospitalization among females wasapproximately 50 percent higher than that amongmales. Since this difference manifests itself mostclearly in the 15-44-year age category, most of thedifference is probably accounted for by hospital-izations for deliveries. Males except for thosepersons under the age of 15 had more hospital
34mong persons of all ages the estimate derived from theinterview data is increased approximately 4.3 percent by the
inclusion of data for decedents; for persons 65 yeare and older,the comparable increase is 18.9 percent (Series 10, No. 32).
days per year on the average than did females(table D).
Color
The rate of hospitalization among white per-sons was about 25 percent higher than that amongnonwhite persons. In terms of persons with mul-tiple hospital episodes, the white group had arate 50 percent higher than the nonwhite group.White children (under the age of 15) were con-
siderably more likely to have a hospitad episodethan nonwhite children (table D). Of the nonwhitechildren who were hospitalized, however, only64.1 percent had 1-7 hospital days during theyear, while the comparable percentage for whitechildren was 81.0. This would indicate that non-white children on the average account for morehospital days than do white children (table 8).
White persons in the 45-64 and 65-years-and- over age groups were hospitalized at higher
rates than were their nonwhite counterparts. Thisdifferential rate of hospitalization may reflectracial differences in economic and social status,in terms of amount of family income, extent of
health insurance coverage, dissemination ofhealth education, and availability of hospital facil-ities (table D).
Region
The rates of persons with single and multi-ple hospital episodes were somewhat higher forthe Nor~h Central and South Regions than for theNortheast and the West. In the 65-and-older age
group, the South had a markedly higher rate ofpersons hospitalized per 1,000 population than didthe other regions (table D).
Residence
Nonfarm residents living outside of metro-politan areas had higher rates of hospitalizationthan did those living in other areas of residence.This finding held true for all age groups but wasparticularly noticeable in the 15-44-year age
group where the nonfarm group living outsidemetropolitan areas had a short-stay hospital
episode rate of 137 per 1,000 population comparedwith 115 for persons in farm areas and 119 for
10

those residing in standard metropolitan statis-tical areas (SMSA’S) (table D).
Family Income
The rate of persons with episodes was in-versely related to the amount of family income;this relationship was noted for both those withsingle and with multiple episodes. Persons in thehighest family income group—$lO,OOO or more—had the lowest short-stay hospital episode rate inthe 15-44 and 45-64-year age groups; however, inthe 65-and- over age group, this income levelhad the highest rate of persons hospitalized (tableD). This turnabout may be due to the fact that
the $10,000 and over family income group is betterable to afford hospital care (and thus receive itwhen necessary) than are persons in other incomegroups.
Marital Status
The rate of hospitalization was appreciablyhigher among persons 17 years and older whowere ever married than among those who werenever married, with a markedly high rate forpersons in, the “separated” status for both singleand multiple episodes (table D).
Due to the high proportion of female hospital-izat ions for deliveries, the marital status of thosepersons between 17 and 44 years of age appearsas a salient variable. Persons in this age groupliving with relatives and married had a rate ofhospitalization of 154 per 1,000 population, whilepersons in other living arrangements had a
rate of only 83. From table D it can be seenthat all of the ever married groups (married,widowed, divorced, or separated) had substantiallyhigher rates of hospital episodes than did persons17 years or older in the never married group.Certainly a part of this difference can be attrib-uted to the fact that females in the never marriedgroup were not “at risk” to the same extent as
females in the “married” group in terms of ex-periencing a hospital episode for delive~.Another notable difference by marital status inthe 17-4-. -year age group is that about 25 per-cent of the married and never married personswith episodes had stays totaling eight or morehospital days during the year while for the di-vorced and separated groups, this estimateapproximated 35 percent (based on data in table20).
Those persons who were married or had everbeen married in the 45-64-year age group weremore likely to have a hospital episode than weretheir never married counterparts. The evermarried group had 111 hospital episodes per1,000 population while the never married grouphad only 81 per 1,000 population (table D). Marriedpersons had shorter stays of hospitalization thandid persons in other marital status groups; 50.7percent of those with hospital episodes among themarried had 7 hospital days or less. For personsin all other marital status groups, this percentageapproximated 40 percent (table 20).
Living Arrangements
Those persons 17 years and older living withrelatives and married had a short-stay hospitalepisode rate of 136 per 1,000 population. Thisrate, which was considerably higher than thosefor other categories of living arrangements, is,in view of the rate for those aged 17-44 years(154 per 1,000 population), explainable in termsof deliveries.
For those persons living with relatives butnot married, episodes of short-stay hospitaliza-tion increased with age. This pattern indicates,to some extent, that in this category there areadults in the 17-44- year age group living with
their parents, and widowed parents in the 65-
years-and-older age group living with their off-spring. Those persons living alone or with non-relative also demonstrated an increasing rateof hospital episodes with advancing age.
000
11
DETAILED TABLES
Table 1.
2.
3.
4.
5.
6.
7.
8.
9.
10.
11.
12.
13.
14.
15.
Total population and number and percent distribution of total persons in the pop-ulation, by number of hospital episodes according to selected characteristics:United States, July 1965-June l966-----------------------------------------------
SEX AND AGE
Total population and number and percent distribution of total persons in the pop-ulation, by number of hospital episodes according to sex and age: United States,July 1965-June l966--------------------------------------------------------------
Number and percent distribution of persons with 1+ short-stay hospital episocles,~;6~mber of episodes according to sex and age: United States, July 1965-J~une
------------------------------------------------------------------------..---
Number of hospital days and number of hospital days per person per year for per-sons with 1+ short-stay hospital episodes, by number of episodes, sex, and age:United States, July 1965-June l966-----------------------------------------------
Number and percent distribution of persons with 1-1-short-stay hospital episocles,by number of hospital days during the year according to age and number of epi-sodes: United States, July 1965-June 1966----------------------------------------
Number and percent distribution of persons with 1+ short-stay hospital episocles,by number of hospital days during the year according to sex and number of epi-sodes: United States, July 1965-June 1966----------------------------------------
COLOR, AGE, AND SEX
Number and percent distribution of persons with 1+ short-stay hospital episocles,by number of episodes according to color, age, and sex: United States,July 1965-June l966------------------------------------------------------------------------
Number and percent distribution of persons with 1+ short-stay hospital episocles,by number of hospital days during the year according to color,age,and sex:UnitedStates, July 1965-June l966------------------------------------------------------
Number and percent distribution of persons with 1+ short-stay hospital episoc[es,by number of hospital days during the year according to color and number of epi-sodes: United States, July 1965-June 1966---------------------------------------
REGION AND RESIDENCE
Number and percent distribution of persons with 1+ short-stay hospital episocles,by number of episodes according to geographic region and age: United States,Jkly1965-June l966-------------------------------------------------------------------
Number and percent distribution of persons with 1+ short-stay hospital episocles,by number of hospital days during the year according to geographic region andage: United States, July 1965-June 1966------------------------------------------
Number and percent distribution of persons with 1+ short-stay hospital episocles,by number of hospital days during the year according to geographic region andnumber of episodes: United States, July 1965-June 1966---------------------------
Number and percent distribution of persons with 1+ short-stay hospital episocles,by number of episodes according to place of residence and age: United States,July 1965-June l966--------------------------------------------------------------
Number and percent distribution of persons with 1+ short-stay hospital episocles,by number of hospital days during the year according to place of residence andage: United States, July 1965-June 1966-----------------------------------------
Number and percent distribution of persons with 1+ short-stay hospital episodes,by number of hospital days during the year according to place of residence, age,and number of episodes: United States, July 1965-June 1966----------------------
Page
14
15
16
17
18
18
19
20
21
22
23
24
25
26
27
12

DETAILED TABLES—Con.
Page
Table 16.
17.
18.
19.
20.
21.
22.
23.
24.
25.
26.
27.
28.
29.
-FAMILY INCOME
Number and percent distribution of persons with 1-1-short-stay hospital episodes,by number of episodes according to family income and age: United States, July1965-June l966------------------------------------------------------------------
Number and percent distribution of persons with 1+ short-stay hospital episodes,by number of hospital days during the year according to family income and age:United States, July 1965-June l966----------------------------------------------
Number and percent distribution of persons with 1+ short-stay hospital episodes,by number of hospital days during the year according to family income and numberof episodes: United States, July 1965-June 1966---------------------------------
MARITAL STATUS AND LIVING ARRANGEMENTS
Number and percent distribution of persons 17 years or older with 1-1-short-stayhospital episodes, by number of episodes according to marital status and age:United States, July 1965-June l966----------------------------------------------
Number and percent distribution of persons 17 years or older with 1+ short-stayhospital episodes, by number of hospital days during the year according to mari-tal status and age: United States, July 1965-June 1966--------------------------
Number and percent distribution of persons 17 years or older with 1+ short-stayhospital episodes, by number of hospital days during the year according to mari-tal status and number of episodes: United States, July 1965-June 1966-----------
Number and percent distribution of persons with 1+ short-stay hospital episodes,by number of episodes according to living arrangements and age: United States,July 1965-June l966-------------------------------------------------------------
Number and percent distribution of persons with 1+ short-stay hospital episodes,by number of hospital days during the year according to living arrangements andage: United States, July 1965-June 1966-----------------------------------------
Number and percent distribution of persons with 1+ short-stay hospital episodes,by number of hospital days during the year according to living arrangement, age,and number of episodes: United States, July 1965-June 1966----------------------
PATTERN OF HOSPITAL STAY
Percent distribution of persons with 1+ short-stay hospital episodes during ayear, by pattern of hospital stay according to selected demographic characteris-tics: United States, July 1965-June 1966----------------------------------------
POPULATION
Population used in obtaining rates shown in this publication, by color, familyincome, sex, and age: United States, July 1965-June 1966------------------------
Population used in obtaining rates shown in this publication, by place of resi-dence, geographic region, sex, and age: United States, July 1965-June 1966------
Population used in obtaining rates shown in this publication, by living arrange-ments, sex, and age: United States, July 1965-June 1966-------------------------
Population used in obtaining rates shown in this publication, by marital status,sex, and age: United States, July 1965-June 1966--------------------------------
28
29
30
31
32
33
34
35
36
37
39
40
41
42
13

Table 1. Total population and number and percent distribution of total persona in the population, bynumber of hospital episodes according to selected characteristics: United States, July 1965-.June 1966
[Dataam based on household interviews of the civilian, noninstitutional population. The survey design, general qua~fications, and informd,io. on the
reliahilityof the estimates are given in Appendix I. Definitions oftarms aregiven in Appendix II]
Characteristic
All personsl -------------
Sex—
Male ---------------------------Female -------------------------
Age—
Under 15 years-----------------15-44 years--------------------45-64 years--------------------65+ years----------------------
Color
White--------------------------Nonwhite -----------------------
Geographic region
Northeast ----------------------North Central------------------South--------------------------West---------------------------
Residence
SMSA’S -------------------------
Outaide SMSA’S:Nonfarm --------------- -------Farm -------------------------
Familv income
Under $3,000-------------------$3,000-$4,999------------------$5,000-$6,999------------------$7,000-$9,999------------------$10,000+-----------------------
Marital status
Under 17 years-----------------Married------------------------Widowed------------------------Divorced-----------------------Separated----------------------Never married------------------
Living arrangement
Living alone or withnonrelatives------------------Living with relatives,married-----------------------Living with relatives,other-------------------------
Number of hosuital eDisodesTotal
populationNone 1 2 3+
Number of persons in thousands
190,710
92,32398,387
59,86874,55038>71317,578
167,95322,757
47,50353,13358,89131,184
122,000
57,75710,954
31,01732,65438,29740,61540,471
66,84087,58410,1383,4422,39920,308
12,961
87,088
90,660
171,590
85,07886,511
56,54265,27134,47915,299
150,68220,908
43,00847,72352,70528>153
110,247
51,4209,923
27,68929,19334,23636,71236,871
63,16975,7248,8213,0002,03318,843
11,511
75,283
84,795
16,405
6,13410,271
3,0028,0693,4951,839
14,7801,625
3,9704,5685,2532,614
10,234
5,313857
2,7212,9393,5043,3953,180
3,31010,0641,080356295
1,300
1,211
10,017
5,178
2,179
883L,296
265986587341
1,991188
418690739332
1,221
812146
482411457417336
2941,43218667
12:
190
1,427
563
535
227308
2X15399
499+<
10615119385
297
211$<
125111100
H
3:;51?<9C?<
Y<
362
124
Total None 1 2 3+
Percent distribution
100.0
100.0100.0
100.0100.0100.0100.0
100.0100.0
100.0100.0100.0100.0
100.0
100.0100.0
100.0100.0100.0100.0100.0
100.0LOO.0LOO.0100.0LOO.0LOO.0
100.0
100.0
100.0
90.0
92.287.9
94.487.689.187.0
89.791.9
90.589.889.590.3
90.4
89.090.6
89.389.489.490.491.1
94.586.587.087.284.792.8
88.8
86.4
93.5
8.6
1:::
li:~
1;:;
8.87.1
:::
H
8.4
9.27.8
8.89.09.18.47.9
5.0L1.5LO.7LO.3L2.36.4
9.3
11.5
5.7
1.1
1.01.3
0.41.31.51.9
::;
0.91.31.31.1
1.0
1.41.3
1.61.31.21.03.8
).4L.6L.8L.92.4).7
1.5
1.6
0.6
0.3
0.20.3
0.10.30.40.6
0.3*
0.20.30.30.3
3.2
3.47’<
).43.31.3).2).2
).1).41.59<**
*
0.4
0.1
lIncludes unknown income.
NOTE: For official population estimates for more general use,see Bureau of the Census reports on thecivilian population of the United States. in Current Population ReDorta. Series P-20. P-25. and P-60.
14

Table 2. Total population and number and percent distribution of total persons in the population,by number of hospital episodes according to sex and age: United States, July 1965-June 1966
[D.tawe based on household interview of the civilian, noninstitutional population. The survey design, general qualifications, and informationon thereliabllity of the estimates aregiven inAppendixI. Definitions of terms are giveninAppendixII]
Number of hospital episodesTotal
populationNone 1 2 3-f-
Sex and age
Total IINone ! 1 12!3+
Both sexes
All ages-----------
Under 15 years-----------
15-44 years--------------
15-24 years------------
25-44 years------------
45-64 years--------------
65+ years-----------------
Number of persons in thousands Percent distribution
190.710 171.590 16.405 2,179
265
986
308
678
587
341
883
535 100.0 90.0 8.6 1.1 0.3
94.4
87.6
88.3
87.1
89.1
87.0
92.2
59,868
74,550
29,365
45,185
38,713
17,578
92.323
56,542
65,271
25,919
39,352
34,479
15,299
85,078
3,002
8,069
3,070
4,999
3,495
1,839
6.134
60
224
67
156
153
99
227
100.0
100.0
100.0
100.0
100.0
100.0
100.0
5.0
10.8
10.5
11.1
9.0
10.5
6.6
0.4
1.3
1.0
1.5
1.5
1.9
1.0
0.1
0.3
0.2
0.3
0.4
0.6
0.2
Male
All ages -----------
15 years-----------
years--------------
30,460
35,575
13,994
21,581
18>597
7,691
98,387
1,648
2,020
742
1,278
1,651
815
10,271
100.0
100.0
100.0
100.0
100.0
100.0
100.0
94.0
93.4
94.1
92.9
89.2
86.5
87.9
94*9
82.3
83.0
81.8
88.9
87.5
5.4
5.7
5.3
5,9
8.9
10,6
10.4
4.6
15.5
15.2
15.8
9.2
10.4
0.5
0.8
0.6
0.9
1.5
2.3
1.3
0.4
1.8
1.5
2.0
1.5
1.7
Under
15-44
28,628
33,212
13,162
20,049
16,590
6,650
86,511
151
276
80
196
280
177
1,296
*
68
*
57
77
*
308
*
0.2
*
0.3
0.4
*
0.3—
*
0.4
0.4
0.4
0,4
0.5
15-24 years------------
25-44 years------------
45-64 years--------------
65+ years----------------
Female
All ages-----------
Under 15 years-----------
15-44 years--------------
15-24 years------------
25-44 years------------
45-64 years--------------
65+ years ----------------
29,408
38,975
15,371
23,605
20,116
9,887
27,914
32,059
12,757
19,302
17,889
8,649
1,354
6,050
2,329
3,721
1,844
1,024
114
711
228
482
307
164
*
156
57
99
76
50
100.0
100.0
100.0
100.0
100.0
100.0
NOTE : For official population estimates for more general use,see Bureau of the Census reportson the civilian population of the United States,in Current Population Reports: Series P-20, P-25,and P-60.
15

Table 3. Number and percent distribution of persons with 1+ short-stay hospital episodes,by num-ber of episodes according to sex and age: United States, July 1965-June 1966
[Data are based cm household interviews of the civilian, noninstitutional population. The survey design, general qualifications, and informationonthereliability of the estimates are given in Appendix I. Definitions of terms are given in Appendix II]
Sex and age
Both sexes
All ages-----------------------------
Under 15 years-----------------------------
15-44 years--------------------------------
M-24 years------------------------------
25-44 years------------------------------
45-64 years--------------------------------
65+ years----------------------------------
Male
All ages-----------------------------
Under 15 years-----------------------------
15-44 years--------------------------------
15-24 years------------------------------
25-44 years------------------------------
45-64 years--------------------------------
65+ years----------------------------------
Female
All ages-----------------------------
Under 15 years-----------------------------
15-44 years--------------------------------
15-24 years------------------------------
25-44 years------------------------------
45-64 years--------------------------------
65+ years----------------------------------
Number of hospital episodes
Total 1 2 3-!-
Number of personsin thousands
19.120
3,326
9,280
3,446
5,834
4,235
2,279
7,245
1,832
2,363
832
1,531
2,007
1,042
11.876
1,494
6,916
2,614
4,302
2,227
1,238
16.405
3,002
8,069
3,070
4,999
3,495
1,839
6,134
1,648
2,020
742
1,278
1,651
815
10,271
1,354
6,050
2,329
3,721
1,844
1,024
2,179—
265
986
308
678
587
341
883
151
276
80
196
280
177
1,296
114
711
228
482
307
164
535
60
224
67
156
153
99
227
*
68
.2
57
77
.%
308
*
156
.57
99
76
50
Percent distribution
100.0
100.0
100,0
100.0
100.0
100.0
100.0
100.0
100,0
100.0
100.0
100.0
100.0
100.0
100.0
100.0
100.0
100.0
100.0
100.0
100,0
85.8_
90,3
87.0
89.1
85.7
82.5
80.7
84.7
90.0
85,5
89.2
83.5
82.3
78.2
86.5
90.6
87.5
89.1
86.5
82.8
82,7
11,4_
8.0
10.6
8.9
11.6
13,9
15.0
12.2
8.2
11.7
9.6
12.8
14.0
17.0
10.9
7,6
10.3
8.7
11.2
13.8
13.2
2,8.
1.8
2.4
1.9
2.7
3.6
4.3
3,1—
*
2.9
*
3.7
3.8
-2
2,6—
*
2.3
2,2
2.3
3.4
4.0
16

Table 4. Number of hospital clays and number of hospital days per person per year for personswith1+ short-stayhospital episodes,by number of episodes,sex, and age: United States, July 1965-June 1966
~ata are based on household interviews of the civilian, nonim%itutiontd population. The survey design, general qualifications, and informationon thereliability of the estimates aregiven in,4ppendix I. Definitions of terms aregiven in.4ppendix II]
Sex and age
Both sexes
All ages ---------------------
Under 15 years---------------------
15-44 years------------------------
15-24 years----------------------
25-44 years----------------------
45-64 years------------------------
65+ years--------------------------
Male
All ages---------------------
Under 15 years---------------------
15-44 years------------------------
15-24 years----------------------
25-44 years ----------------------
45-64 years------------------------
65+ years --------------------------
Female
All ages---------------------
Under 15 years---------------------
15-44 years------------------------
15-24 years----------------------
25-44 years----------------------
45-64 years------------------------
65-I-years--------------------------
Nuraberof hospital episodes
Total
Number of hospital daysin thousands
178.958
21,469
66,771
21,243
45,528
55,050
35,668
81,922
11,628
23,627
7,161
16,465
28,873
17,793
97,036
9,840
43,144
14,081
29,063
26,177
17,875
118.915
15,625
45,552
15,424
30,127
35,298
22,440
52,770
8,555
15,594
5,303
10,291
18,398
10,222
66,145
7,070
29,958
10,122
19,836
16,900
12,218
42,513—
3,956
14,718
4,135
10,583
14,303
9,536
20,497
2,009
5,559
1,594
3,965
7,434
5,495
22.016
1,947
9,159
2,541
6,618
6,869
4,041
17,53C—
1,88E
6,501
1,682
4,817
5,448
3,69?
8,655
1,064
2,472
264
2,209
3,040
2,077
8,875
824
4,027
1,419
2,608
2,408
1,616
ElmEDays per person
hospitalizedper year
9.4—
6.5
7.2
6.2
7.8
13.0
15.7
11.3
6.3
10.0
8.6
10.8
14.4
17.1
8.2
6.6
6.2
5.4
6.8
11.8
14.4
7.2.
5.2
5.6
5.0
6.0
.0.1
.2.2
8.6
5.2
7.7
7.1
8.1
,1.1
,2.5
6.4
5.2
5.0
4.3
5.3
9.2
1.9
19.5-
14.9
14.9
13.4
15.6
24.4
28.0
23.2
13.3
20.1
19.9
20.2
26.6
31.0
17.0
17.1
12.9
11.1
?.3.7
22.4
24.6
32.8—
31.5
29.0
25.1
30.9
35.6
37.3
38.1
32.2
36.4
24.0
38.8
39.5
42.4
28.8
30.5
25.8
24.9
26.3
31.7
32.3
17

Table 5. Number and percent distribution of persons with 1+ short-stay hospital episodes, by number of hos-pital days during the year according to age and number of episodes: United States, July 1965-June 1966
[Dataarebad m hous.hulcl ,ntm’,ew of the ci,tlim. no.in.ti(.,iorml .opulatm.. The Survey design, ge.eral q.alificat.ions, and in formatum on the relirihilityof th(, wbmnt(,. nrc vlton tn $rm.nd:x I. Ik.fln]tions of krms we given in Appendix 111
Age and number of episodes
All ages
All episodes ---------------------
1 episode ------------------------------2+ episodes ----------------------------
Under 15 years
All episodes ---------------------
1 episode ------------------------------2+ episodes ----------------------------
15-44 years
All episodes ---------------------
1 episode ------------------------------2+ episodes ----------------------------
45-64 years
All episodes ---------------------
1 episode ------------------------------2+ episodes ----------------------------
65+ years
All episodes ---------------------
1 episode ------------------------------2+ episodes ----------------------------
Number of hospital days
Total 1-7 8-14 15-30 31+ Total 1-7 8-14 15-30 31+
Number of persons in thousands Percent distribution
19,120
16,4052,715
3,326
3,002324
9,280
8,0691,210
4,235
3,495740
2>279
1,839440
12,6911 3,4841 1,975 1970 100.0, 1 1 ,
2,630 379 214 103 100.OI
2,540 272 134 57 100.091 107 81 $? 100.0
m++-=I+=
66.4_
74,418.0
79.1
84.628,1
76.6
84,326.0
48.5
57,42,<
39,2
46.7>,,
IT18,2 10.3 5.1
16.230,3 3!:: 1;:?
11.4] 6.41 3.1
F14.3 6.4 2.6
11.3 3.3 1.134.4 27,3 12.4
27,3 15,6 8.6
27.2 1,1.0 4.428.0 37.2 28,2
mTable 6. Number and percent distribution of persons with 1+ short-stay hospital episodes, by number of hos-
pital days during the year according to sex and number of episodes: United States, July 1965-June 1966. .
Sex and number of episodes
Both sexes
All episodes ---------------------
1 episode ------------------------------2+ episodes ----------------------------
Male
All episodes ---------------------
1 episode ------------------------------2+ episodes ----------------------------
Female
All episodes ---------------------
1 episode ------------------------------2+ episodes ----------------------------
[See headnote cm table 5]
Number of hospital days
Total 1-7 8-14 15-30 31+ Total 1-7 8-14 15-30 31+
Number of persons in thousandsI
Percent distribution
19,120—
16,4052,715
7,245
6,1341,110
11,876
10,2711,604
12,691—
12,202489
4,456
4,282175
8,235
7,921314
m3,484 1,975 970 100,0
2,661 1,108 434 100,0823 867 535 100,0
w2,155 1,075 410 100,0
1,592 589 169 100,0563 486 241 100,0
m..10.3 5.1
74.4 16.218.0 30.3 3::: &
%i-3-tJ18

Table 7. Number and percent distribution of persons with 1+ short-stay hospital episodes, by num-ber of episodes according to color, age, and sex: United States, July 1965-June 1966
[Data are based on household interviews of tbe sivilirm, noninstitutional population. Tbe survey design, general qualifications, snd informationonthereliahility oftbe estimates aregiven in Appendix I. Definitions of terms scegiven in Appendix II]
Number of hospital episodes
Total 1 2+ EzlEEPercent distribution
Color, age, and sex
Number of personsin thousandsTotal
19,120 16,405 2,715All ages-------------------------------- 100.0 85./ 14.2
Under 15 years--------------------------------
15-44 years -----------------------------------
45-64 years-----------------------------------
65+ years-------------------------------------
3,326
9,280
4,235
2,279
17,271
2,944
8,226
3,931
2,170
1,849
3,002
8,069
3,495
1,839
14,780
2,668
7,132
3,232
1,749
1,625
324
1,210
740
440
2,490
276
1,094
699
421
224
100.0
100.0
100.0
100.0
100.0
100.0
100.0
100.0
100.0
100.0
90.:
87.(
82.!
80.;
85.C
90.(
86.;
82.>
80.C
87.5
9.7
13.0
17.5
19.3
14.4
9.4
13.3
17.8
19.4
12.1
White
All ages--------------------------------
Under
15-44
45-64
15 years--------------------------------
years-----------------------------------
years-----------------------------------
65+ years-------------------------------------
Nonwhite
All ages ------------------ --------- -----
Under 15 years--------------------------------
15-44 years-----------------------------------
45-64 years-----------------------------------
65+ years-------------------------------------
Total
Both sexes------------------------------
Male------------------------------------------
Female----------------------------------------
White
Both sexes------------------------------
Male ------------------------------------------
Female ----------------------------------------
Nonwhite
Both sexes------------------------------
Male ------------------------------------------
Female ----------------------------------------
382
1,054
304
109
19,120
7,245
11,876
17,271
6,610
10,661
1,849
334
938
263
90
16,405
*
116
*
*
2,715
100.0
100.0
100.0
100.0
100.0
87.4
89.C
86.5
82.6
85.8
*
11.0
*
*
14.2
6,134
10,271
14,780
5,580
9,200
1,625
1,110
1,604
2,490
1,029
1,461
224
100.0
100.0
100.0
84.7
86.5
85.6
15.3
13.5
14.4
100.0
100.0
100.0
84.4
86.3
87.9
15.6
13.7
12.1
635
1,214
554
1,071
81
143
100.0
100.0
87.2
88.2
12.8
11.8
19
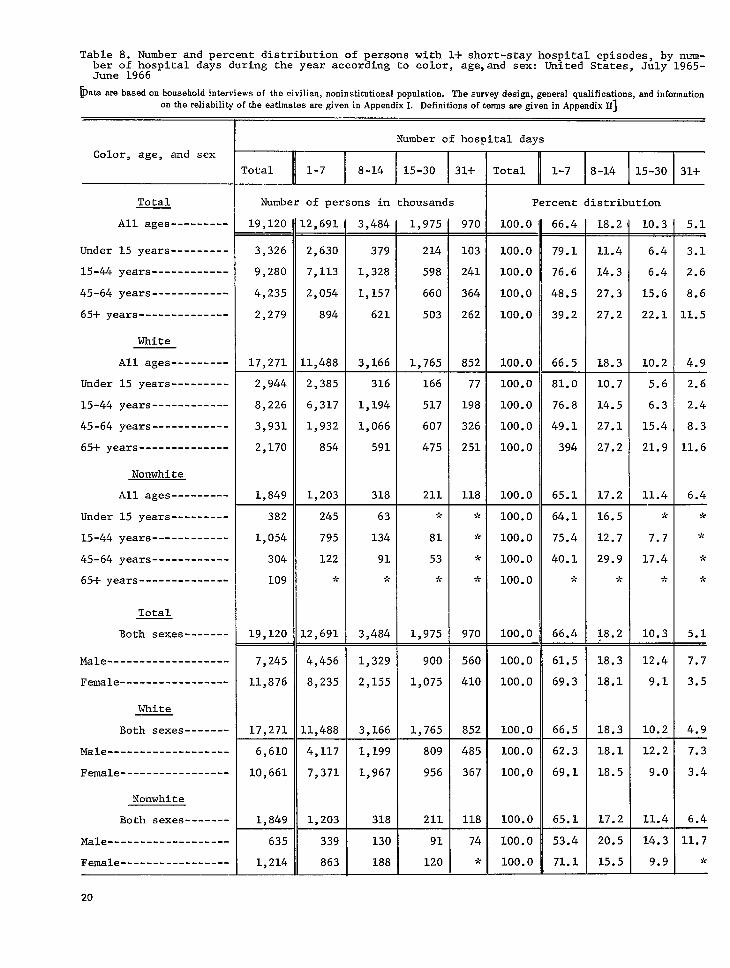
Table 8. Number and percent distribution of persons with 1+ short-stay hospital episodes, by num-ber of hospital days during the year according to color, age,and sex: United States, July 1965-June 1966
~ata are based on household interviews of the civilian, noninstitutional population. The survey design, general qualifications, and informationonthereliability oftbeestimates megiven in Appendix I. Definitions ofterms aregiven in Appendix II]
Number of hospital days
~otal 1-7 8-14 15-30 31+
Number of persons in thousands
Color, age, and sex
rotal 1-7 8-14 15-30 31+
Percent distributionTotal
All ages---------
Under 15 years---------
15-44 years------------
45-64 years------------
65+ years--------------
White
All ages---------
Under 15 years---------
15-44 years------------
45-64 years------------
65+ years--------------
19,120 !2,691 3,484 1,975 970 100.0 66.4 18.2 10.3 5.1
3,326
9,280
4,235
2,279
17,271
2,944
8,226
3,931
2,170
1,849
382
1,054
304
109
19,120
2,630
7,113
2,054
894
L1,488
2,385
6,317
1,932
854
1,203
379
1,328
1,157
621
3,166
316
1,194
1,066
591
318
214
598
660
503
1,765
166
517
607
475
211
103
241
364
262
852
100.0
100.0
100.0
100.0
100.0
100.0
100.0
100.0
100.0
100.0
100.0
100.0
100.0
100.0
100.0
11.4
14.3
27.3
27.2
18.3
10.7
14.5
27.1
27.2
17.2
6.4
6.4
15.6
22.1
10.2——
5.6
6.3
15.4
21.9
11.4
*
7.7
17.4
*
1.0.3
79.1
76.6
48.5
39.2
66.5
81.0
76.8
49.1
394
65.1
3.1
2.6
8.6
11.5
4.9
2.6
2.4
8.3
11.6
6.4
77
198
326
251
118
Nonwhite
All ages---------
15 years---------
years------------
years------------
245
795
122
>’f
12,691
63
134
91
;’<
3,484
64.1
75.4
40.1
>’<
66.4
16.5
12.7
29.9
9<
18.2
Under
15-44
45-64
-k
81
53
>’<
1,975
*
*
$c
*
5.1-
7.7
3.5
4.9
65+ years--------------
Total
Both sexes-------
Male -------------------
Female-----------------
White
Both sexes-------
Male -------------------
Female-----------------
Nonwhite
Both sexes-------
Male-------------------
Female-----------------
20
——
7,245
11,876
17,271
6,610
10,661
1,849
635
1,214
4,456
8,235
L1,488
4,117
7,371
1.203
1,329
2,155
3,166
1,199
1,967
318
900
1,075
1,765
560
410
852
100.0
100.0
100.0
61.5
69.3
66.5
18.3
18.1
18.3
1,2.4
9.1
10.2
809
956
211
485
367
118
100.0
100.0
100.0
62.3
69.1
65.1
18.1
18.5
17.2
12.2
9.0
1.1.4
7.3
3.4
6.4
100.0
100.0
53.4
71.1
20.5
15.5
1.4.3
9.9
339
863
130
188
91
120
74
-k

Table 9. Number and percent distribution of persons with 1+ short-stay hospital episodes, by numb-er of hospital days during the year according to color and number of episodes: United States,July 1965-June 1966
[Data are based on household interviews of the civilian, noninstitutional population. Thesurvey design, general qualifications, and information
on thereliabllityof the estimates are given in Appendix I. Definitions of ternrs are given in Appendix II]
Number of hospital days
Color and number of episodes
Total II 1-7 ] 8-14 I 3.5-30 I 31+
Total
All episodes---------------------------------
1 episode------------------------------------------
2+ episodes----------------------------------------
White
All episodes---------------------------------
1 episode------------------------------------------
2+ episodes----------------------------------------
Nonwhite
All episodes---------------------------------
1 episode------------------------------------------
2+ episodes----------------------------------------
Total
All episodes---------------------------------
1 episode------------------------------------------
2+ episodes----------------------------------------
White
All episodes---------------------------------
1 episode---------------------------k--------------
2-!-episodes----------------------------------------
Nonwhite
All episodes---------------------------------
1 episode------------------------------------------
2+ episodes----------------------------------------
Number of persons in thousands
19.120 12.691 3,484
2,661
823
3,166
970
434
535
852
1,975
1,108
867
1,765
16,405
2,715
12,202
489
11,48817,271
14,780
2,490
11,035
454
1,203
1,167
*
2,410
756
318
251
67
972
793
211
364
488
118
70
*
5.1—
2.6
19.7
4.9
2.5
19.6
6.4
4.3
*
1,849
1,625 136
74224
Percent distribution
100.0 66.4
74.4
18.0
66.5
+100.0
100.0
16.2
30.3
6.8
31.9
100.0 18.3 10.2
100.0
100.0
74.7
18.2
65.1
16.3 6.6
30.4 31.8
100.0 17.2 11.4
100.0
100.0
71.8
*
15.4 8.4
29.9 33.0
21

Table 10. Number and percent distribution of persons with 1+ short-stay hospital episodes, bynumber of episodes according to geographic region and age: United States, July 1965-Jtine 1966
[Data are based on household interviews of tbe civilian, noninstitutional population. The survey design, general qualifications, and informationontbereliability of the estimates aregiven in Appendix I. Definitions of terms aregiven in Appendix II]
Region and age
All regions
All ages-------------------------------------
Under 15 years-------------------------------------
15-44 years----------------------------------------
45-64 years----------------------------------------
65+ years------------------------------------------
Northeast
All ages-------------------------------------
Under 15 years-------------------------------------
15-44 yeara----------------------------------------
45-64 years----------------------------------------
65+ years------------------------------------------
Under
15-44
45-64
North Central
All ages-------------------------------------
15 years-------------------------------------
years----------------------------------------
years----------------------------------------
65+ years------------------------------------------
South
All ages-------------------------------------
Under 15 years-------------------------------------
15-44 years----------------------------------------
45-64 years----------------------------------------
65+ years------------------------------------------
Under
15-44
45-64
West
All ages-------------------------------------
15 yeara-------------------------------------
years----------------------------------------
years----------------------------------------
65+ years------------------------------------------
Number of hospital episodes
Z!zlEzENumber of persona
in thousands
19.120
3,326
9,280
4,235
2,279
4,495
805
2,155
964
571
5,409
922
2,587
1,249
651
6,185
1,002
3,068
1,362
752
3,031
597
1,470
660
305
16.405
3,002
8,069
3,495
1,839
3,970
731
1,919
828
493
4,568
818
2,201
1,032
517
5,253
909
2,657
1,099
588
2,614
544
1,292
536
241
2,71:_
32L
1,21C
74C
44C
524
75
236
136
78
841
104
386
217
134
93:
94
411
26:
165
417
52
178
124
64
=lFFPercent distribution
100.0
100.0
100.0
100.0
100.0
100.0
100.0100.0100.0100.0
100.0
100.0100.0100.0100.0
100.0
100.0100.0100.0100.0
100.0
100.0
100.0
100.0
100.0
85.8—.
90.3
87’.0
82..5
8CI .7
88,.3——
9oI.8
89.0
851.9
86.3
84..5——
88.7
85.1
82.6
79.4
84.9——
90.7
86.6
80.7
78.2
86.2—.
91.1
87.9
81.2
79.0——
14.2—
9.7
13.0
17.5
19.3
11.7
9.3
11.0
14.1
13.7
15.5
11.3
14.9
17.4
20.6
15.1
9.4
13.4
19.3
21.9
13.8
8.7
12.1
18.8
21.0
22

Table 11. Number and percent distribution of persons with 1+ short-stay hospital episodes, bynumber of hospital-days during the year according to geographic region and age: United States,July 1965-June 1966
[Data are basedm household interviews of the civilinn, noninstitutional population. The survey design, general qualifications, andinfonnationon the rehablhtyofthe estimates are given in Appendix I. Definitions of terms are given in Appendix II]
Number of hospital days
Total 1-7 8-14 15-30 31-1-
Region and age
Total II1-7 8-14 I15-30 31+
All regions
All ages--------------
Under 15 years --------------
15-44 years-----------------
45-64 years-----------------
65+ years-------------------
Northeast
All ages--------------
Under 15 years--------------
15-44 years-----------------
45-64 years -----------------
65+ years -------------------
North Central
All ages--------------
Under 15 years--------------
15-44 years-----------------
45-64 years-----------------
65+ years-------------------
South
All ages--------------
Under 15 years--------------
15-44 years-----------------
45-64 years-----------------
65+ years-------------------
Number of persons in thousands Percent distribution
19,120
3,326
9,280
4,235
2,279
4.495
L2,691—
2,630
7,113
2,054
894
2.807
1,975 970.
103
241
364
262
285—
-k
72
93
86
291—
*
70
116
79
268—
*
72
9969
126—
-2
-k
55*
100.0 66.4 18.2 5.13,484 10.3
379
1,328
1,157
621
895
214
598
660
503
508
100.0100.0
100.0
100.0
100.0
79.1
76.6
48.5
39.2
62.4
11.4
14.3
27.3
27.2
19.9
6.4
6.4
15.6
22.1
11.3
3.1
2.6
8.6
11.5
6.3
75.5
74.8
40.1
34.9
63.8
78.7
72.9
47.5
38.1
68.2
79.6
78.0
52.4$2.0
72.9
*
3.3
9.6
15.1
5.4
*
2.7
9.3
12.1
4.3
‘*
2.3
7.3
9.2
4.2
805
2,155
964
571
5,409
922
2,587
1,249
651
6,185
1,002
3,068
1,362
752
3,031
608
1,612
387
199
3,453
726
1,886
593
248
4,220
798
2,392
714316
2,211
90
337
312
156
1,056
120
424
339
172
1,087
117
407
360203
446
74
133
171
130
609
50
206
200
153
611
61
196
189
165
247
100.0
100.0
100.0
100.0
100.0
100.0
100.0
100.0
100.0
100.0
100.0
100.0
100.0
100.0
100.0
11.2
15.6
32.4
27.3
19.5
13.0
16.4
27.1
26.4
17.6
9.26.2
17.7
22.8
11.3
5.4
8.0
16.0
23.5
9.9
6.1
6.4
13.9
21.9
8.1
11.7
13.3
26.4
27.0
14.7
West
All ages--------------
15 years--------------
years-----------------
years-----------------
Under
15-44
45-64
597
1,470
660
305
498
1,222
360
131
52
159
145
90
.L-
62
100
55
100.0
100.0
100.0
100.0
63.4
83.1
54.5
43.0
8.7
10.8
22.0
29.5
$r
4.2
15.2
18.0
**
8.3*65+ years-------------------
23

Table 12. Number and percent distribution of persons with 1+ short-stay hospital episodes, bynumber of hospital days during the year according to geographic region and number of episodes:United States, July 1965-June 1966
[Data are based on household interviews of the civilian, noninstitutional population. The survey design, general qualifications, andinfonnationonthereliability of the estimates are given in Appendix I. Definitions oftenns aregiven in Appendix II]
Number of hospital daysRegion and number
of episodesTotal 1-7 8-14 15-30 31+
Number of persons in thousands
Total 1-7*
All regions
All episodes----------
1 episode-------------------
2+ episodes-----------------
Northeast
All episodes----------
1 episode-------------------
2+ episodes-----------------
North Central
All episodes----------
1 episode-------------------
2+ episodes-----------------
South
All episodes----------
1 episode-------------------
2+ episodes-----------------
West
All episodes----------
1 episode-------------------
2+ episodes-----------------
Percent distribution
100.0 66.4 18.2 10.319,120
16,405
2,715
4,495
3,970
524
5,409
.2,691—
.2,202
489
2,807
2,725
81
3,453
3,484 1,975 970 5.1
2,661
823
895
762
133
1,056
L,108
867
508
344
165
609
434
535
285
100.0
100.0
100.0
100.0
100.0
100.0
74.4
18.0
62.4
68.6
15.5
63.8
16.2
30.3
19.9
19.2
25.4
19.5
6.8
31.9
11.3
8.7
3:L.5
l:L.3
2.6
19.7
6.3
3.5
27.7
5.4
140
145
291
4,568
841
6,185
5,253
933
3,031
2,614
417
3,319
134
4,220
796
260
1,087
330
279
611
124
168
268
100.0
100.0
100.0
72.7
15.9
68.2
17.4
30.9
17.6
‘7.2
33.2
9.9
2.7
20.0
4.3
2.1
16.6
4.2
76.8
19.8
72.9
6.1
3:L.1
3.1
4,035
185
2,211
2,123
89
784
302
446
319
128
320
290
247
114
133
112
155
126
100.0
100.0
100.0
100.0
100.0
14.9
32.4
14.7
59
67
81.2
21.3
12.2
30.7
4.4
31.9
2.3
16.1
24

Table 13. Number and percent distribution of persons with 1+ short-stay hospital episodes, bynumber of episodes according to place of residence and age: United States, July 1965-June .L966
[Dataam basedonhouseholdinterviewsofthecivilian,mmhstitutkmalpopulatkm.Thesurveydesign,generalqualifications,andinforrnationonthereliab]lityoftheestimatesaregiveninAppendixI.DefinitionsofterrnsaregiveninAppendixII]
Residence and age
All areas
All ages-------------------------------------
Under 15 years-------------------------------------
15-44 years ----------------------------------------
45-64 years ----------------------------------------
65-!=years ------------------------------------------
SMSA ‘S
All ages-------------------------------------
Under 15 years-------------------------------------
15-44 years----------------------------------------
45-64 years----------------------------------------
65+ years------------------------------------------
Outside SMSA’S: Nonfarm
All ages-------------------------------------
Under
15-44
45-64
15 years -------------------------------------
years ----------------------------------------
years ----------------------------------------
65-!- years ------------------------------------------
Outside SMSA’S: Farm
All ages-------------------------------------
Under 15 years-------------------------------------
15-44 years----------------------------------------
45-64 years ----------------------------------------
65+ years ------------------------------------------
Number of hospital episodes
EEIENumber of persons
in thousands
19,120
3,326
9,280
4,235
2,279
11,753
2,033
5,83$
2,564
1,318
6,336
1,120
3,017
1,378
821
1,031
173
424
293
141
16,405
3,002
8,069
3,495
1,839
10,234
1,859
5,127
2>171
1,078
5,313
995
2,587
1,082
649
857
148
355
242
112
2,71:
324
1,21C
74C
44C
1,518
174
711
39?
240
1,023
125
430
296
172
173
*
69
51
*
EznzlzPercent distribution
100.0
100.0
100.0
100.0
100.0
100.0
100.0
100.0
100.0
100.0
100.0
100.0
100.0
100.0
100.0
100.0
100.0
100.0
100.0
100.0
85.8
90.3
87.0
82.5
80.7
87.1
91.4
87.8
84.7
81.8
83.9
88.8
85.7
78.5
79.0
83.1
85.5
83.7
82.6
79.4
14.2
9.7
13.0
17.5
19.3
12.9
8.6
12.2
15.3
18.2
16.1
11.2
14.3
21.5
21.0
16.8
*
16.3
17.4
*
25

Table 14. Number and percent distribution of persons with 1+ short-stsy hospital episodea, bynumber of hospitsl days during the yesr according to place of residence and age: United States,July 1965-June 1966
~akarebasedon household inkrtiews of thetitilian, notinstitutionsl population. Tbesurvey desi~, general qualifications, andinfomationon tbe reliability of the estimates are given in Appendix I. Definitions oftemrs aregiven in Appendix II]
Number of hospital days
Cotal 1-7 8-14 15-30 31+
Residence and age
‘eta1
I
Percent distributionAll areas
All agea--------------
Number of persons in thousands
.00.0 56.4 18.2 10.3L9,120 12,691—
2,630
7,113
2,o54
894
7,692
1,588
4,440
1,185
479
4,302
892
2,358
702
350
697
!,484 1,975 )70.
.03
!41
)64
!62
;45—
72
164
!27
;82
!80—
*
65
113
72
*—
*
9<
*
*—
5.1
3,326
9,280
4,235
2,279
11,753
2,033
5,838
2,564
1>318
6,336
1,120
3,017
1,378
821
1,03
17
42
29
14
379
,,328
,,157
621
!,173
232
855
730
356
.,119
136
402
357
224
192
214
598
660
503
1,243
141
379
422
301
635
64
192
205
174
97
.00.0
,00,0
.00.0
.00.0
.00.0
.00.0
.00.0
.00.0
.00.0
.00.0
LOO .0
100.0
LOO.O
Loo .0
100.0
79.1
76.6
48.5
39.2
55.4
78.1
76.1
46.2
36.3
67.9
79.6
78.2
50.9
42.6
67.6
11.4
14.3
27.3
27.2
18.5
11.4
14.6
28.5
27.0
17.7
6.4
6.4
15.6
22.1
lCI.6——
6.9
6.5
16.5
22.8
10.0
3.1
2.6
8.6
.1.5
5.5
Under 15 years--------------
15-44 years-----------------
45-64 years-----------------
65+ years-------------------
SMSA ‘S
All agea--------------
15 years--------------
yeara-----------------
years-----------------
Under
15-44
45-64
3.5
2.8
8.9
.3.8
4.4
65+ years-------------------
Outside SMSA’S: Nonfarm
All ages--------------
12.1
13.3
25.9
27.2
18.6
5.7
6.4
14.9
21..2
9.4
9<
*
*
*
Under 15 years--------------
years-----------------
years-----------------
*
2.2
8.2
8.8,
*
15-44
45-64
years-------------------65+
Outside SMSA’S: Farm
All ages--------------
Under 15 years--------------
15-44 years-----------------
45-64 years-----------------
65+ years-------------------
100.0
100.0
100.0
100.0
87.?
74.:
57.(
46.1
*
*
*
9C
151
315
167
65
*
16.;
23.;
9
26

Table 15. Number and percent distribution of persons with 1+ short-stay hospital episodes, by number of hos-pital days during the year according to place of residence, age, and number of episodes: United States,July 1965-June1966
[Dataafebased on householdinterviewsofthecivilian,mmimtitutkxndpop.latiori.The SUrvey design, gemem.1 qualifications, and information on the reliabilityof theestimatss are given in Appendix 1. Definitions of terms are given in Appendix 1~
Number of hospitaldaysResidence,age, andnumber of episodes
rotal 1-7 8-14 15-30 31+ rotal 1-7 8-14 15-30 31+
Percent distributionAll areas
All ages-------------------------
Under 65 years
All episodes -----------------------
1 episode ------------------------------2+ episodes ----------------------------
65+ years
All episodes -----------------------
1 episode ------------------------------2-I-episodes ----------------------------
SMSA’s
All ages-------------------------
Under 65 years
All episodes -----------------------
1 episode ------------------------------2+ episodes ----------------------------
65+ years
All episodes -----------------------
1 episode ------------------------------2+ episodes ----------------------------
Outside SMSA’S: Nonfarm
All ages -------------------------
Under 65 years
All episodes -----------------------
1 episode ------------------------------2+ episodes ----------------------------
65+ years
All episodes -----------------------
1 episode ------------------------------2+ episodes ----------------------------
Outside SNSA’S: Farm
All ages -------------------------
Under 65 yeare
All episodes -----------------------
1 episode ------------------------------2+ episodes ----------------------------
65+ years
All episodes -----------------------
1 episode ------------------------------2+ episodes ----------------------------
Number of persons in thousands
19,120 1,975 970 100.0 18.2 10.3 I 5.1!2,691 3,484 56.4. .
-i
8.7 4.2
5.4 2.130.2 17.8
16,841
14,5662,274
2,279
1,839440
11,753
10,435
9,1571,278
1,318
1,078240
6,336
.1,797
.1,344453
894
2,863 1,472
787686
503
708 100.0 70.0
77.9L9.9
39.2
17.0
2,132731
621
303$05
262
100.0100.0
100.0
14.632.1
27.2
722.1 11.5
17.5 7.141.4 29.8
858J<
7,692
7,213
6,988225
479
465-2
4,302
52992
2,173
1,816
1,432385
356
30650
1,119
321182
1,243
942
52241E
301
21:82
635
461
234226
174
131131
645—
463—212251
182—
8893
280—
208—
1%’
72
100.0100.0
100.0
100.0
100.0100.0
100.0
100.0100.0
Loo.o
100.0
100.0100.0
100.0
k6.7->
55.4
69.1
76.317.6
36.3
43.1.1.
67.9
71.6
80.523.3
52.6
28.820.9
18.5
17.4--1-10.6 5.5
t
9.0 4.4
5.7 2.332.7 19.6
15.630,1
27.C
28.420.8
17.7
16.2
12.835.1
27.3
I
+
10.0 4.4
5,516
4,665851
821
3,952
3,754198
350
895
596299
224
-Q4-5.0 1.726.6 14.9
21.2 8.8
649172
1,031
51.3*
67.6 412.8 *52.9 *
9.4 *
7.9 *
333*
697
193>’;
192
8391
97
**
*
100.0100.0
100.0
29.7*
18.6
890
745145
141
632
602*
65
152
105.:.
*
* 100.0
100.0100.0
100.0
71.0
80.8*
46.1
17.1
14.1*
*
*I ***
*
* *
* ***
112*
61*
100.0*
54.5*
* ** *
*>,.-
**
**
—
27

Table 16. Number and percent distribution of persons with 1+ short-stay hospital episodes, bynumber of episodes according to family income and age: United States, July 1965-June 1966
[Data are based on household interviews of the civilian, noninstitutional population. The survey design, general qualifications, andinforrnationon the reliability oftheestimatee are given in Appendix I. Definitions of terms are given inAppendixII]
Family income and age
Number of hospital episodes
Tota 1 1 2+ Total 1 2+
Number of personsin thousands IPercent distribution
19,120
All incomesl
All ages -------------------------------------
Under 15 years-------------------------------------15-44 years----------------------------------------45-64 years----------------------------------------65+ years------------------------------------------ T
2,7151 100.0
324 100.01,210 100.0740 100.0440 100.0
85.8 14.216.405
3,3269,2804,2352,279
3,0028,0693,4951,839
2,721
3121,038
558812
2,939
90.387.082.580.7
81.8
86.487.275.678.2
84,9
R)17.519.3
18.2
12.;24.321.8
15.1
Under $3,000
All ages-------------------------------------
15 years-------------------------------------years----------------------------------------yeara----------------------------------------
3,328 607 100.0
3611,191738
1,039
100.0100.0100.0100.0
Under15-4445-64.-.
15;179227b5+ years ------------------------------------------
$3,000-$4,999
All ages-------------------------------------
Under 15 years-------------------------------------15-44 years----------------------------------------45-64 years----------------------------------------65+ years------------------------------------------
3,461 5211 100.0
5691,763699429
4961,526575342
3,504
73 100.0237 100.0125 100.087 100.0
87.286.682.379.7
86,,3
12.813.417.920.3
13.7
$5,000-$6,999
-1-557 100.04,061All ages-------------------------------------
Under 15 years-------------------------------------15-44 years----------------------------------------45-64 years----------------------------------------65+ yeara------------------------------------------
8272,215756264
7531,930614207
3,395
74 100.0285 100.0141 100.057 100.0
91,,187,,181,,278,,4
87,,0
12;18.721.6
13.01-508 100.0
$7,000-$9,999
All agea-------------------------------------
Under 15 yeara-------------------------------------15-44 years----------------------------------------45-64 years----------------------------------------65+ years------------------------------------------
3,903
100.0100.0100.0100.0
8372,109806151
7651,812(55;
3,180
91(,485,,984<,689,,4
88a,4
91.988,,086.,290.6
1:::15.4
*
11.6
1;:;13.8
*
$10.OOW. .
All ages-------------------------------------
15 years-------------------------------------vears----------------------------------------
3,599
Under15-44
6431,728992235
5911,521855213
53 100.0207 100.0137 100.0* 100.0
45-64 ~eara----------------------------------------65+ years------------------------------------------
28

Table 17. Number and percent distribution of persons with 1+ short-stay hospital episodes, bynumber of hospital days during the year according to family income and age: United States, July1965-June 1966
[Datsam basedmrhcmselmldM,erview’softbeeivili.n,n.ninstit.ticmalp.pulsticm.Thesurveyde<~, genemlqualificati..s,sndinformationonthemliabliityoftheestimatasaregiveninAppendixI.DefinitionsoftermsaregiveninAppendixIIl
Family income and age
~1
All ages--------------
Under 15 years--------------15-44 years-----------------45-64 years-----------------65+ years -------------------
Under $3,000
All ages--------------
Under 15 years--------------15-44 years-----------------45-64 years-----------------65+ years-------------------
Number of hospLtal days
Total 1-7 8-14 15-30 31+Total II 1-7 8-14 15-30 31+
Number of persons in thousands Percent distribution
19,12C 12,691—
2,6307,1132,054
894
1,861
233899310418
2,335
4311,411
315177
2,813
6491,728
34888
2,757
7061,57041665
2,477
3,484 1,975_
214598660503
488
9.:125224
355
10;12088
366
1;;11769
331
970—
103241364262
278
*
10:119
200—
**
;:
187—
5;77*
129
100.0—
100.0100.0100.0100.0
100.0
100.0100.0100.0100.0
100.0
100.0100.0100.0100.0
100.0
100.0100.0100.0100.0
100.0
66.4
79.176.6$8.539.2
55.9
64.575.542.C!0.2
67.5
75.760.045.1$1.3
69.3
78.578.0$6.033.3
70.6
18.2
11.414.327.327.2
21.1
10.3—
:::15.622.1
14.7
5.1_
3.12.6
1::;
8.4
3,3269,2804,2352,279
3,328
3611,191
7381,039
3,461
3791,3281,157
621
701
1;;203277
572
19.712.527.526.7
16.5
11.111.527.925.9
17.1
12.613.928.226.9
17.6
*
1::;21.6
10.3
*
1;::20.5
9.0
::;15.526.1
8.5
*
13.:11.5
5.8
**
1:;;
4.6
2.:10.2
*
3.3
$3,000-$4,999
All ages--------------
15 years --------------years-----------------years-----------------
Under15-4445-6465+ years-------------------
5691,763
699429
4,061
8272,215
756264
3,903
2:;195111
696
10430721371
685
$5,000-$6,999
All ages--------------
Under 15 years --------------15-44 years-----------------45-64 years-----------------65+ years-------------------
$7,000-$9,999
All ages--------------
Under 15 years--------------15-44 years-----------------45-64 years-----------------65+ years-------------------
8372,109
806151
3,599
6431,;;;
235
3;:221*
665
*140119*
329
****
128
100.0100.0100.0100.0
100.0
34.374.451.6\3.o
58.8
1:::27.4
*
18.5
6.;14.8
*
9.1
****
3.6
$10,000+
All ages--------------
Under 15 years--------------15-44 years-----------------45-64 years-----------------65+ years-------------------
5361,30354890
22:25670
100.0100.0100.0100.0
13.475.455.238.3
J::25.829.8
10;13953
*
1:::22.6
****
lIncludes unknown income.
29

Table 18. Number and percent distribution Of persons with 1+ short-stay hospital episodesnumber of hospital days during the year according to familY income and number of ePis~de~~United States, July 1965-June 1966
[Datiare based on bousebold interviews ofihecivilian, noninstitutional population. Thesurvey detign, general qualifications, andinfomationon the reliability of the estimates are given in Appendix I. Definitions of terms aregiven in Appendix IIl. .
Number of hospital daysFamily income and
number of episodes8-14 I 15-30 31+
All incomesl Numbe
19,120
16,405
2,715
3,328
2,721
607
3.461
)f persons in thousands Percent distribution
All episodes---------- 1.2,691 1,975 970.
434
535
278
100.C 66.43,484 18.2-
16.2
30.:
21.1
10.3.—
6.8
31.9
14.7——
1(0.1
35.1
10.3.—
6.3
32.4
!).0——
5.8
29.1
8.5
5.3
29.5
9.1——
6.0
32!.9——
5.1-
2.6
19.7
8.4
5.0
23.6
5.8
1 episode-------------------
2+ episodes-----------------
L2,202
485
1,861
2>661
823
701
1,108
867
488
100.0
100.0
100.0
74.4
18.C
55.9
Under $3,000
All episodes----------
1 episode-------------------
2+ episodes-----------------
1,780
81
2,335
2,236
99
2.813
531
170
572
432
140
696
275
213
355
136
143
200
100.0
100.0
100.0
65.4
13.3
67.5
19.5
28.0
16.5
$3,000-$4,999
All episodes----------
1 episode--------------------
2+ episodes-----------------
2,939
521
4,061
186
169
366
203
162
331
86
113
187
79
107
129
100.0
100.0
100.0
100.0
100.0
100.0
76.1
19.0
69.3
14.7
26.9
17.1
2.9
21.7
4.6
$5,000-$6,999
All episodes----------
1 episode-------------------
2+ episodes-----------------
3,504
557
3,903
3,395
508
3,599
3,180
419
2,708
105
2,757
513
183
685
77.3
18.9
70.6
14.6
32.9
17.6
15.2
33.1
18.5
16.7
31.7
2.3
19.2
3.3
1.5
15.6
3.6
$7,000-$9,999
All episodes----------
1 episode-------------------
2+ episodes-----------------
2,64t
112
2,477
2,400
77
517
168
665
181
150
329
50
79
128
100.0
100.0
100.0
77.9
22.0
68.8
$10,000+
All episodes----------
1 episode-------------------
2+ episodes-----------------
llncludes unknovm inccme.
532
133
191
138
57
71
100.0
100.0
75.5
18.4
1.8
16.9
30
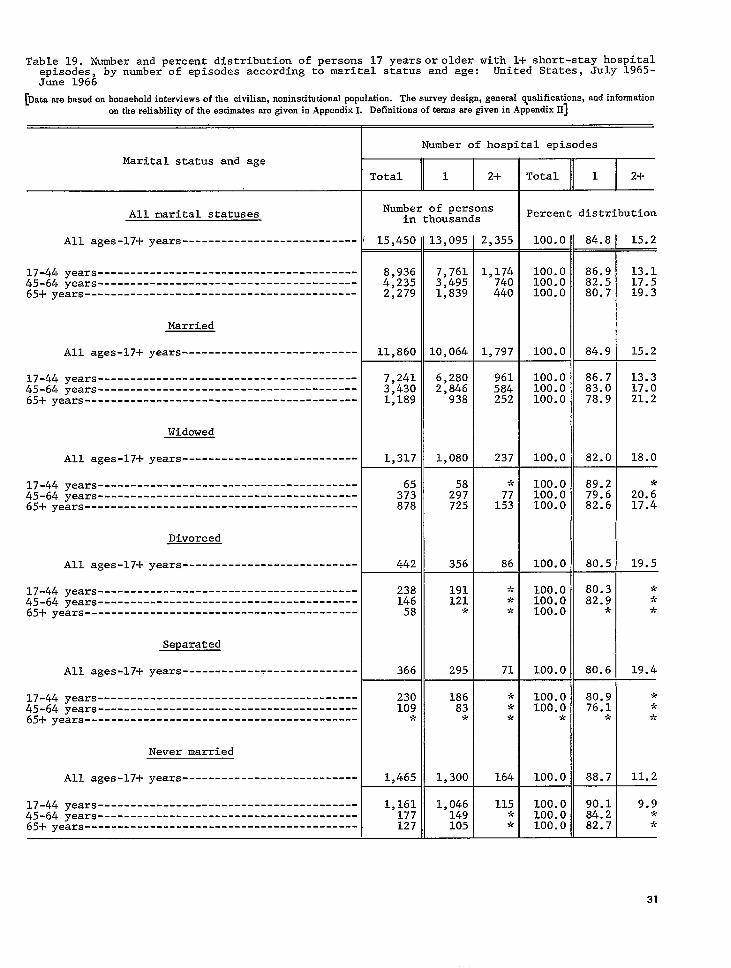
Table 19. Number and percent distribution of persons 17 years orolder with 1+ short-stay hospitalepisodes, by number of episodes according to marital status and age: United States, July 1965-June 1966
[Data are based on ho.sebold interviews of the civilisn, mminstitutionsl population. The survey design, general ~ualifications, and informationon the reliability of the estimates are given in Appendix I. Definitions of terms are given in Appendix II]
Number of hospital episodes
Marital status and age
All marital statuses
All ages-17+ years---------------------------
17-44 years----------------------------------------45-64 years----------------------------------------65-1-years------------------------------------------
Married
AU ages-17+ years---------------------------
17-44 years----------------------------------------45-64 years----------------------------------------65-1-years------------------------------------------
Widowed
All ages-17+ years---------------------------
17-44 years----------------------------------------45-64 years ----------------------------------------65+ years------------------------------------------
Divorced
All ages-17+ years---------------------------
17-44 years----------------------------------------45-64 years----------------------------------------65+ years------------------------------------------
Separated
AU ages-17+ years---------------------------
17-44 years----------------------------------------45-64 years----------------------------------------65+ years------------------------------------------
Never married
EzEIzNumber of persons
in thousandsPercent distribution
15.450 13.095 2.355 100.0 15.284.8
13.117.519.3
15.2
8,9364,2352,279
11,860
7,2413,4301,189
1,317
7,7613,4951,839
10,064
1.,174740440
1,797
100.0100.0100.0
100.0
86.982.580.7
84.9
6>2802,846
938
1,080
961584252
237
100.0100.0100.0
100.0
86.783.078.9
82.0
;3.;
82:6
80.5
13.317.021.2
18.0
20.:17.4
19.5
***
19.4
65373878
442
100.0100.0100.0
100.0
23814658
366
191121*
295
100.0100.0100.0
100.0
80.382.9
*
80.6
230109;!>.
1,465
18683*
1,300
100.0100.0
*
100.0
100.0100.0100.0
80.976.1
*
88.7
90.184.282.7
***
11.2
9.9**
-k
*
*
164All ages-17-!-years---------------------------
17-44 years----------------------------------------45-64 years----------------------------------------65-1-years------------------------------------------
1,161177127
1,046149105
115**
31

Table 20. Number and percent distribution of persons 17 years or older with 1+ short-stay hos-pital episodes, by number of hospital days during the year according to marital status and age:United States, July 1965-June 1966
[Data are based onhousehold inteniews of thetivilian, noninstitutional population. Thesumeydetign, general qualifications, andinfomationon thereliability of theestimatis megiven in Appendix I. Definitions of terms sregiven in Appendix II]
Number of hospital days
Marital status and age ~Total 1-7 8-14 15-30 31+
Percent distribution
Total II 1-7 I 8-14 15-30 31+
11 I I I
Number of persons in thousandsAll marital statuses
All ages-17+ years-----
17-44 years------------------45-64 years------------------65+ years--------------------
Married
All ages-17+ years-----
17-44 years------------------45-64 years------------------65+ years--------------------
Widowed
All ages-17+ years-----
17-44 years------------------45-64 years------------------65+ years--------------------
Divorced
All ages-17+ years-----
17-44 years------------------45-64 years------------------65+ years--------------------
Separated
All ages-17+ years-----
17-44 years------------------45-64 years------------------65+ years--------------------
Never married
All ages-17+-years-----
17-44 years------------------45-64 years------------------65+ years--------------------
15,450 9,782 3,071 1,739 858.
232364262
543—
151254138
146
?<
22
*
***
9<
63.3100.0 11.3 5.6
8,936;,;;;J
11,860
7,2413,4301,189
1,317
65373878
442
1,2931,157621
2,282
1,038929316
375
9<100253
105
***
79
6.4151.622,.1
10.0——
l::i20.5
21.3
17.;24.5
14.3—.
***
16.7——
***
9.8——
7.3k>!<
6,8342,054
894
7,845
5,6141,738493
515
15;320
241
576660503
~
439509244
281
9<
2;:
63
9<9<9<
61
100.0100.0100.0
100.0
100.0100.0100.0
100.0
100.0100.0100.0
100.0
100.0100.0100.0
100.0
76.548.539.2
66.1
14.5
27.?27.2
19.2
;::11.5
4.6
77.550.741.5
39.1
41.:36.4
54.5
14.327.126.6
28.5
2.1
Li::
I_l.1
26.;28.8
~3.8
L4.;1.O.3
*
23814658
366
2301099<
1,465
156589<
191
147*
*
990
65.539.7
*
52.2
?C
9<
*
21.6
-k
9<
k
?<
??-k
9<
229
9<
-k
*
103
100.0100.0
-k
100.0
63.9it9<
67.6
7?
*
9<
7.0
5.09<9<
1,161177127
87667SC
14255*
58**
100.0100.0100.0
75.537.9
9C
12.231.1
*
32

Table 21. Number and percent distribution of persons 17 years or older with 1+ short-stay hos-pital episodes, by number of hospital days during the year according to marital status and num-ber of episodes: United States, July 1965-June 1966
~atame based on household interviews of the civilian, noninstitutional population. Thesuwey design, general qualifications, and informationonthereliability of the estimates aregiven in Appendix I. Definitions of terms aregiven in Appendix II]
Number of hospital daysMarital status andnumber of episodes
Total 1-7 8-14 15-30 31+
Number of persons in thousands
+ *
All marital statuses
All episodes-----------
1 episode--------------------
2+ episodes------------------
Married
All episodes-----------
1 episode--------------------
2+ episodes------------------
Widowed
All episodes-----------
1 episode--------------------
2+ episodes------------------
Divorced
All episodes-----------
1 episode--------------------
2+ episodes------------------
Separated
All episodes-----------
1 episode--------------------
2+ episodes------------------
Never married
All episodes-----------
1 episode--------------------
2+ episodes------------------
Percent distribution
15,450
13,095
2,355
11,860
10,064
1,797
1,317
9,782 3,071 1,739—
961
777
1.191
858 100.0 63.3 19.9 11.3 5.6
),395
387
7.845
2,361
709
2,282
1,713
570
375
377
481
543
100.0
100.0
100.0
71.7
16.4
66.1
18.0
30.1
19.2
7.3
33.0
10.0
2.9
20.4
4.6
7,530
315
515
206
336
146
100.0
100.0
100.0
74.8
17.5
39.1
615
576
281
17.0
31.7
28.5
6.1
32.1
21.3
2.0
18.7
11.1
1,080
237
442
319
57
105
180
101
63
100.0
100.0
100.0
100.0
100.0
100.0
100.0
100.0
100.0
46.7
*
54.5
65.2
*
52.2
29.5
24.1
23.8
19.9
*
21.6
77
69
*
16.7
42.6
14.3
*
*
16.7
7.1
29.1
*
*
*
*
356
86
366
295
71
1,465
232
*
191
178
J<
990
71
*
79
59
-k
229
*
*
61
*
*
143
*
*
*
*
*
103
fjo.3
*
67.6
20.0
*
15.6
15.4
*
*
*
9.8
7.5
*
*
*
7.0
4.1
30.5
1,300
164
9.51
*
200
*
97
*
53
50
100.0
100.0
73.2
*
33

Table 22. Nuqber and percent distribution of persons with 1+ short-stay hospital episodes, bynumber of epxsodes according to living arrangement and age: United States, July 19fj5.Jll~e 1966
[Data are based onho"sehold interviews of thetivilian, noninstitutional pop"Iation. Thesuwey design, general qualifications, andinfomationon the reliability of the estimates are given in Appendix I. Definitions of terms are given in Appendix II]
I Number of hospital episodea
Living arrangement and age
Total 1 2+
All arrangements Number of personsin thousands
All ages------------------------------------- I 19,120
Under 17 years------------------------------------- 3,670
17-44 years---------------------------------------- 8,936
45-64 years---------------------------------------- 4,235
65-!-years------------------------------------------ 2,279
Living alone or with nonrelatives
All ages------------------------------------- 1,450
Under 17 years------------------------------------- ?’C
17-44 years---------------------------------------- 369
45-64 years---------------------------------------- 477
65+ years------------------------------------------ 597
Living with relatives-married
All ages------------------------------------- 11,805
Under 17 yeara------------------------------------- ...
17-44 years---------------------------------------- 7,222
45-64 years---------------------------------------- 3,413
65+ years------------------------------------------ 1,171
Living with relatives-other
All ages------------------------------------- 5,865
I
under 17 years ------------------------------------- 3,663
17-44 years---------------------------------------- 1,345
45-64 years---------------------------------------- 346
65+ years------------------------------------------ 511
16,405
3,310
7,761
3,495
1,839
1,211
+<
321
386
498
10,017
. . .
6,262
2,832
924
5,178
3,304
1,178
277
418
36C
1,174
740
440
239
*
~<
91
100
1,789
. . .
960
581
248
687
359
167
68
93
Percent distribution
100.0—
100.0
100.0
100.0
100.0
100.0
9<
100.0
LOO.0
Loo.0
100.0
...
100.0
100.0
100.0
100.0
100.0
100.0
100.0
100.0
85.8
90.2
86.9
82.5
80.7
83,5——
*
87,,0
80,,9
83<,4
84,,9——
.!).
86,,7
83,,0
78a,8
88,,3——
90,,2
87,,6
80(,1
81.88
14.2
9.8
13.1
17.5
19.3
16.5
$;
*
19.1
16.8
15.2
...
13.3
17.0
21.2
11.7
9.8
12.4
19.7
18.2
34

Table 23. Number and percent distribution of persons with 1+ short-stay hospital episodes, bynumber of hospital days during the year according to living arrangements and age:United States,July 1965-June 1966
@.ta are based on household interviews of the civilian,rmninstit.timrtd population. The survey design, general q..lificatirms, and informationon the reliability of the estimates are given in Appendix I. Definitions of terms are given in Appendix II]
Number of hospital daysLiving arrangement
and ageTotal II1-7 I 8-14 I 15-30 I 31+ Total 1-7 8-14 15-30 31+
All arrangements
All ages--------------
Number of persons in thousands Percent distribution
19.120 3,484—
414
1,293
1,157
621
358
970 66.4 18.2 5.1.2.691 1,975 100.0 10.3
6.5
6.4
15.6
22.1
16.6
3.1
2.6
8.6
11.5
11.2
*
*
12.8
12.9
4.5
Under 17 years--------------
17-44 years-----------------
45-64 years-----------------
65+ years-------------------
3,670
8,936
4,235
2,279
1,450
2,909
6,834
2,054
894
689
237
576
660
503
240
112
232
364
262
162
100.0
100.0
100.0
100.0
100.0
79.3
76.5
48.5
39.2
47.5
11.3
14.5
27.3
27.2
24.7
Living alone or withnonrelatives
All ages--------------
Under 17 years--------------
17-44 years-----------------
45-64 years-----------------
65+ years-------------------
*
369
477
597
11,805
...
7,222
3,413
1,171
5,865
3,663
1,345
346
511
*
259
185
239
7,816
...
5,603
1,728
485
4,186
2,903
973
142
169
.:.
61
140
157
2,273
*
-A
90
124
1,185
*
100.0
100.0
100.0
100.0
---
70.2
38.8
40.0
66.2
*
16.5
29.4
26.3
19.3
*
*
18.9
20.8
10.0
Living with relatives-married
All ages--------------
Under 17 years--------------
17-44 years-----------------
45-64 years-----------------
65+ years-------------------
. . .
1,037
926
310
853
414
196
90
153
. . .
436
507
242
550
237
114
62
137
. . .
147
251
134
276
110
63
51
51
. . .
100.0
100.0
100.0
100.0
100.0
100.0
100.0
100.0
. . .
77.6
50.6
41.4
71.4
79.3
72.3
41.0
33.1
. . .
14.4
27.1
26.5
14.5
11.3
14.6
26.0
29.9
. . .
6.o
14.9
20.7
9.4
6.5
8.5
17.9
26.8
. . .
2.0
7.4
11.4
4.7
3.0
4.7
14.7
10.0—.
35
Living.with relatives-other
All ages--------------
17 years--------------
years-----------------
years-----------------
Under
17-44
45-64
65+ years-------------------

Table 24. Number and percent distribution of persons with 1+ short-stay hospital episodes, by number of hos.pital days during the year according to living arrangements,July 1965-June 1966
age, and number of episodes: United States,
~ata W. based cm ho.wholcl tntcr,ivws of tb. <,i!inn,non,n.tt.ton.l pOP.18L,On. The survey dc=sign,general q.alifi.acimw, ..d in~cmmation cm the rc.liabilityof the wtinrntw rmc given In \ppcmdix 1. Ikfiniticms of twins are gi!en in \ppendix II]
Number of hospital daysLiving arrangement, age, and
number of episodesrotal II 1-7 I 8-1& 15-30 31+ Total 1-7 8-14 15-30 31+
Percent distributionAll living arrangements
All ages -------------------------
Number of persons in thousands
19,120 12,691 3.484 1,975 970 100.0 66.4 18.2 1.0.3.=
8.7
5.430.2
22.1
5.1
Under 65 years
All episodes ----------------------- 16,841
14,5662,274
2,279
11,797
11,344453
894
2,863
2,132731
621
1,472
787686
503
708
303405
262
100.0
100.0100.0
100.0
70.0
77.919.9
39.2
17.0
14.632.1
27.2
4.2
1%:
11.5
1 episode ------------------------------2+ episodes ----------------------------
65+ years
All episodes -----------------------
1 episode ------------------------------2+ episodes ----------------------------
1,839440
1,450
858.,,..
689
52992
358
321182
240
131131
162
100.0100.0
100.0
46.7-k
47.5
28.820.9
24.7
17.541.4
16.6
7.129.8
11.2
Living alone or with nonrelatives
All ages -------------------------
Under 65 years
All episodes ----------------------- 852 450
431;<
239
201
160>,?
157
142>?
2,273
L,963
1,448515
310
117
74*
124
75.J.
1,185
943
85—,,<
9<
77—
,!,.:
532
100.0
100.0100.0
100.0
100.0100.0
100.0
100.0
100.0100.0
100.0
52.8
60.4;,,
40.0
46.8$<
66.2
68.9
77.418.6
41.4
23.6
22.4?<
26.3
13.7——
10.4,,,
20.8
10.0
>,<*
12.9
1 episode ------------------------------2+ episodes ----------------------------
713139
597
65+ years
All episode s-----------------------
1 episode ------------------------------2+ episodes ----------------------------
498100
11,805
10,634
9,0941,541
1,171
923248
5,865
5,354
4,760594
511
233;:
7,816
7,330
7,043287
485
28.5;Ic
19.3
18.5
15.933.4
26.5
15.1>’C
10.0
8.9
3:::
20.7
*-k
4.5
3.7
1:::
11.4
Living with relatives:married
All ages -------------------------
Under 65 years
All episodes ----------------------- 398
1 episode ------------------------------2+ episodes ----------------------------
65-Fyears
All episodes -----------------------
461482
242
141256
134
1 episode ------------------------------2+ episodes ----------------------------
457-2
4.186
25753
853
15092
550
5975
276
100.0100.0
100.0
49.5>,<
71.4
27.821.4
14.5
16.337.1
9.4
3:::
4.7
Living with relatives-other
All ages -------------------------
Under 65 years
All episodes ----------------------- 4,017 699
525174
153
413
251161
137
225—
113112
51
100.0
100.0100.0
100.0
75.0
81.324.7
33.1
13.1
11.029.3
29.9
7.7
2;:?
26.8——
23.0-2
4.2
1;::
10.0
1 episode ------------------------------2+ episodes ----------------------------
3,870147
169
65+ years
All episodes -----------------------
1 episode ------------------------------2+ episodes ----------------------------
41893
168*129,!,
,,,*
100.0100.0
40.2,,, 30.9,!,,,(
*
36

Table 25. Percent distributionof personswith 1+ short-stayhospital episodesduring a year, bypattern of hospital stay according to selecteddemographiccharacteristics:United States,July1965-June1966
[Data are basedm hmsehddinterviews of t,be civilian,noninstitutional population. The survey design, geuersl qualifications, end informationon the reliability of the estimates are given in Appendix L Definitions of terms are given in Appendix II]
Characteristic
All personal----------------------------
SEX
Male ------------------------------------------Female----------------------------------------
COLOR
White-----------------------------------------Nonwhite--------------------------------------
Under 45 years--------------------------------Under 15 years------------------------------15-44 years---------------------------------
45+ years-------------------------------------45-64 years---------------------------------65+ years-----------------------------------
REGION
Northeast-------------------------------------North Central---------------------------------South-----------------------------------------West------------------------------------------
RESIDENCE
SMSA’S
Under 65 years--------------------------------65+ years-------------------------------------
Outside SMSA’S:Nonfam
Under 65 years------------------------------65+ years-----------------------------------
Outside SMSA’S:Farm
Under 65 years------------------------------65+ years-----------------------------------
Personswith 1+ short-stayhospital episodes
Percent distribution
100.0—
100.0100.0
100.0100.C
100.c100.0100.0100.0100.0100.0
100.0100.0100.0100.0
100.0100.0
100.0100.0
100.0100.0
63.8_
59.166.7
63.963.1
73.876.273.343.947.237.6
60.661.465.270.0
67.035.3
68.1!0.6
67.6k3.3
13.9_
l&.813.4
14.013.6
9.4
M22.722.423.2
17.014.712.710.5
13.723.2
10.823.5
11.820.6
5.8—
M
5.67.4
M
1;:;9.114.1
:::5.23.8
12::
1:::
1::;
4.3—
H
4.43.6
:.:
4:54.64.94.0
2:;4.94.2
3.73.8
::;
5.37.8
4.5—
2:?
4.64.0
H3.6
R8.0
3.7
::?4.4
4.06.3
4.111.1
4.75.7
7.6
10.16.1
7.68.3
;:;
1:::9.713.1
8.17.97.37.1
1:::
7.411.0
;:;
See footnoteat end of table.
37

Table 25. Percent distribution of persons with 1+ short-stay hospital episodes during a year, bypattern of hospital stay according to selected demographic characteristics: United States, July1965-June 1966—Con.
[Data are based on household interview of the civilian, noninstitutional population. The survey design, general qualifications, and informationon the reliability of the estimates are given in Appendix I. Definitions of terms are given in Appendix II]
Characteristic
FAMILY INCOME
Under $3,000----------------------------------
$3,000-$4,999---------------------------------
$5,000-$6,999--------------------------------
$7,000-$9,999---------------------------------
$10,000+--------------------------------------
MARITAL STATUS-17+ years
Married---------------------------------------
Widowed---------------------------------------
Divorced--------------------------------------
Separated-------------------------------------
Never married ---------------------------------
LIVING ARRANGEME~S
Living alone or with nonrelatives
Under 65 years--------------------------------
65+ years-------------------------------------
Living with relatives-married
Under 65 years--------------------------------
65+ years-------------------------------------
Living with relatives-other
Under 65 years--------------------------------
65-1-years-------------------------------------
1Includes unknown income.
Persons with 1+ short-stay hospital episodes
One episode with: Two+ episodeswith:
E
OtherTotal pattern
1-7 8-14 15-30 8-14 15-30 of stay
days days days days days
Percent distribution
100.0
100.0
100.0
100.0
100.0
100.0
100.0
100.0
100.0
100.0
100.0
100.0
100.0
100.0
100.0
100.0
53.5
64.6
66.7
67.8
66.7
63.5
38.3
52.5
48.6
64.9
50.6
39.0
66.2
39.0
72.3
32.9
16.0
12.5
12.6
13.2
14.8
14.4
24.2
16.1
16.1
13.7
18.8
23.8
13.6
21.9
9.8
25.2
8.3
5.4
5.0
4.6
5.3
5.2
13.7
8.1
8.7
6.6
8.7
12.6
4.3
12.8
4.7
18.8
5.1
4.0
4.5
4.3
3.7
4.8
4.3
7.7
5.5
2.0
4.9
2.5
4.8
4.5
3.2
4.7
6.4
4.9
4.0
3.8
3.8
4.9
7.7
6.1
7.9
3.1
4.9
8.0
4.5
7.9
3.0
8.0
10.8
8.6
7.2
6.2
5.7
7.2
11.9
9.3
12.8
9.7
12.1
14.2
6.4
13.8
6.9
10.2
38

Table 26. Population used in obtaining ratea shown in this publication, by color, family income,sex, and age: United States, July 1965-June 1966
[Dataare based cm household interviewsof the civilian,noninstitutionalpopulation.Thesurveydesign,generalqualifications,andinformationonthereliabilityoftheestimatasaregiveninAppendixI.DefinitionsoftermsaregiveninAppendixII]
Sex and age
Both sexes
All agea-------
Under 45 years-------
Under 15 years-----
15-44 years--------
45!-years------------
45-64 years--------
65+ years----------
Male
All agea-------
Under 45 yeara-------
Under 15 years-----
15-44 yeari--------
45t years------------
45-64 years--------
65+ yeara----------
Femsle
All ages-------
Under 45 years-------
Under 15 years-----
15-44 years--------
45+ years------------
45-64 years--------
65+ years ----------
Color Family income
Totalpopulation
White Non- Underwhite
$3’000- $5’000- $7’000- $10,000+$3,000 $4,999 $6,999 $9,999
Population in thousanda
190,710
134,418
59,868
74>550
56,292
38,713
17,578
92.323
66,034
30,460
35,575
26,288
18,597
7,691
98,387
68>384
29,408
38,975
30,003
20,116
9,887
167,953
116,707
50,953
65,754
51,246
35,048
16,198
81,465
57,539
25,995
31,543
23,926
16,863
7,063
86,488
59,168
24,958
34,210
27,320
18,185
9,135
22,757
17,712
8,915
8,797
5,045
3,666
1,380
10,858
8,496
4,464
4,031
2,362
1,734
628
11,899
9,216
4,451
4,765
2,683
1,931
752
31,017
16,490
7,428
9,062
14,527
6,218
8,310
13>518
7,777
3,731
4,046
5,741
2,36?
3,37e
17,49s
8,713
3,697
5,016
8>786
3,855
4,932
32,654
22,892
10,748
12,144
9,762
6,360
3,402
15,618
11,139
5,504
5,636
4,479
2,787
1,691
17,036
11,752
5,244
6,508
5,283
3,573
1,711
38,297
29,594
13,611
15,984
8,703
6,918
1,785
18,948
14,b37
6>933
7,705
4,311
3,443
868
19,349
14,957
6,678
8,279
4,392
3,475
917
40,615
31,818
14,045
L7,772
8,797
7,446
1,351
20,306
15,805
7,174
8>631
4,501
3,921
580
20,308
16,013
6,871
9,141
4,296
3,524
771
40,471
29>363
12,300
17,064
11,107
9,537
1,570
20,353
14,554
6,215
8,338
5,799
5,092
707
20,118
14,810
6,084
8,725
5,308
4,445
863
NOTE: For official population estimates for more general use, see Bureau of the Census reportson the civilian population of the United States, in Current Population Reports: Series P-20,P-25,and P-60.
39

Table 27. Population used in obtaining rates shown in this publication, by place of residence,geographic region, sex, and age: United States, July 1965-June 1966
[Datiare based onhousehold inhrviews of thetiviIian, noninstitutional population. Thesuwey desi@, general qualifications, andinfomationonthe reliability of the estimates aregiven in Appendix I. Definitions of terms aregiven in Appendix II]
Sex and age
Both sexes
All ages---------
Under 15 years---------
15-44 years------------
15-24 years----------
25-44 years----------
45-64 years------------
65+ years--------------
Male
All ages---------
Under 15 years---------
15-44 years------------
15-24 years----------
25-44 years----------
45-64 years------------
65+ years--------------
Female
All ages---------
Under 15 years---------
15-44 years------------
15-24 years----------
25-44 years----------
45-64 years------------
65+ years--------------
Totalpopulation
190.710
59,868
74,550
29,365
45,185
38,713
17,578
92,323
30,460
35,575
13,994
21,581
18,597
7,691
98,387
29,408
38,975
15,371
23,605
20,116
9,887
Place of residence Geographic region
Outside SMSA’S
SMSA‘S North- Northeast Central South West
Nonfarm Farnr
Population in thousands
122.000
37,800
48,875
18,766
30,109
24,753
10,571
58,771
19,109
23,309
8,882
14,427
11,857
4,496
63,229
18,691
25,567
9,884
15,683
12,895
6,075
57,757
18,622
21,986
8,986
13,001
11,244
5,904
27,914
9,542
10,428
4,276
6,152
5,323
2,621
29,842
9,080
11,558
4,710
6,848
5,921
3,283
10.954-
3,445
3,689
1,613
2,076
2,717
1,103
5,637
1,808
1,838
836
1,002
1,417
574
5,316
1,637
1,850
777
1,074
1,300
529
47.503-
13,882
18,294
6,827
11,466
10,453
4,873
22,939
7,128
8,750
3,301
5,449
5,001
2,060
24,564
6,754
9,543
3,526
6,017
5,453
2,814
53.133
16,574
20,557
8,248
12,309
10,936
5,065
25,824
8,333
9,879
3,932
5,947
5,318
2,294
27,309
8,241
10,678
4,316
6,362
5,618
2,771
58.891
19,329
23,329
9,580
13,749
11,210
5,022
28,299
9,773
11,053
4,533
6,519
5,313
2,160
30,592
9,556
12,276
5,046
7,230
5,898
2,862
31,184
10,082
12,371
4,710
7,661
6,113
2,617
15,261
5,225
5,893
2,227
3,666
2,966
1,178
15,922
4,857
6,478
2,483
3,995
3,148
1,439
NOTE: For official population estimates for more general use , see Bureau of the Census reportson the civilian population of the United States, in Current Population Reports: Series P-20,P-25,and P-60.
40

Table 28. Population used in obtaining rates shown in this publication, by living arrangements,sex, and age: United States, July 1965-June 1966
[Data are based on brmsehold interview’s of the civilian, noninstitutional population. Thesrrrvey design, general qualifications, and informationon thereliabllityof the estimates are given in Appendix I. Definitions of terms are given in Appendix II]
Sex and age
Both sexes
All ages-----------------------------------------
Under 17 years-----------------------------------------
17-44 years--------------------------------------------
46-64 years--------------------------------------------
65+ years----------------------------------------------
Under
17-44
45-64
~
All agea-----------------------------------------
17 years-----------------------------------------
years--------------------------------------------
years--------------------------------------------
65+ years----------------------------------------------
Under
17-44
45-64
Female
All ages-----------------------------------------
17 years-----------------------------------------
years---------------- ----------------------------
years--------------------------------------------
65+ years----------------------------------------------
Totalpopulation
Living arrangement
Living
h-
Living with
alone or relatives
with non-relative Married Other
Population in thousands
190.710
66,840
67,579
38,713
17,578
92,323
33,993
32,042
18,597
7,691
98,387
32,847
35,537
20,116
9,887
12.961
75
4,401
3,900
4,585
5,039
*
2,438
1,354
1,200
7,922
*
1,963
2,546
3,385
87.088
● ✎ ✎
46>847
31,025
9,216
43,170
...
21,443
16,145
5,582
43,919
● ✎ ✎
25,404
14,880
3,635
90.660
66,764
16,331
3,789
3,777
44,114
33,945
8,161
1,098
910
46,547
32,819
8,170
2,691
2,867
NOTE: For official population estimates for more general use, see Bureau of the Census reportson the civilian population of the United States, in Current Population Reports: Series P-20,P-25,and P-60.
41

Table 29. Population used in obtaining rates shown in this publication, by marital status, sex,and age: United Statea, July 1965-June 1966
[Data are basedMIhouseholdinterviewsof the civilian, noninstitutional population. The survey design, general qualifications, and informationon thereliability oftbe estimates are given i~ Appendix I. Definitions of terms aregiven in Appendix~l
Sex and age
17-44
45-64
Both sexes
All agea-17+ years--------------
years---------------------------
years---------------------------
65+ years-----------------------------
Male
All ages-17+ years--------------
17-44 years---------------------------
45-64 years---------------------------
65+ years-----------------------------
Femsle
All ages-17+ years--------------
17-44 years---------------------------
45-64 years---------------------------
65+ years-----------------------------
Marital status
Allstatuses
IE
Married Widowed Divorced Separated ~N~~i~d
Population in thousands
123,870
67,579
38,713
17,578
58,330
32,042
18,597
7,691.
65,540
35,537
20,116
9,887
87,584
47,051
31,201
9,332
43,448
21,562
16,248
5,638
44,136
25,489
14,954
3,694
10,138
530
3,073
6,536
1,849
79
453
1,317
8,289
451
2,619
5,218
3,442
1,694
1,385
363
1,229
567
506
156
2,213
1,127
879
207
2,399.
1,326
867
206
889
438
3;!5
1;!5
1,51.0
888
541
81
20,308
16,978
2,188
1,142
10,914
9,395
1,065
455
9,393
7,583
1,123
688
NOTE: For official population estimstea for more general use, “see Bureau of the .Censusreportson the civilian population of the United States, in Current Population Reports: Series P-20, P-25,and P-60.
42

APPENDIX I
TECHNICAL NOTES ON METHODS
Background af This Report
This report is one of a series of statistical reportsprepared by the National Health Survey. It is based oninformation collected in a continuing nationwide sampleof households in the Health Interview Survey, a majorpart of the program.
The Health Interview Survey utilizes a question-naire which, in addition to personal and demographiccharacteristics, obtains information on illnesses, in-juries, chronic conditions and impairments, and otherhealth topics. As data relating to each of these variousbroad topics are tabulated and analyzed, separate re-ports are issued which cover one or more of the spe-cific topics. The present report is based on the consoli-dated sample for 52 weeks of interviewing endingJune 1966.
The population covered by the sample for theHealth Interview Survey is the civilian, noninstitutionalpopulation of the United States living at the time of theinterview. The sample does not include members of theArmed Forces, U.S. nationals living in foreign countries,or crews of vessels. It should also be noted that theestimates shown do not represent a complete count ofepisodes of hospitalization in short-stay hospitals forthe specified calendar period since no adjustment hasbeen made for household members who were hospital-ized during the 12-month recall period but who diedprior to the time the household was interviewed.
Statistical Design of the
Health Interview Survey
General plan. —The sampling plan of the surveyfollows a multistage probability design which permitsa continuous sampling of the civilian population of theUnited States. The first stage of this design consistsof drawing a sample of 357 from about 1,900 geograph-ically defined primary sampling units (PSU’s) intowhich the United States has been divided. A PSU is acounty, a group of contiguous counties, or a standardmetropolitan statistical area.
With no loss in general understanding, the re-maining stages can be combined and treated in thisdiscussion as an ultimate stage. Within PSU’s, then,ultimate stage units called segments are defined insuch a manner that each segment contains an expectednine households. A segment consists of a cluster ofneighkxming households or addresses. Two generaltypes of segments are used (1) area segments whichare defined geographically, and (2) B segments whichare defined from a list of addresses horn the Decen-nial Census and Survey of Construction. Each week arandom sample of about 90 segments is drawn. In theapproximately 800 households in these segments, house-hold members are interviewed concerning factorsrelated to health.
Since the household members interviewed eachweek are a representative sample of the population,samples for successive weeks can be combined intolarger samples. Thus the design permits both contin-uous measurement of characteristics of high incidenceor prevalence in the population and, through the largerconsolidated samples, more detailed analysis of lesscommon characteristics and smaller categories. Thecontinuous collection has administrative and operationaladvantages as well as technical assets since it permitsfield work to be handled with an experienced, stablestaff.
Sample size and geographic detail. —The nationalsample plan for the 12-month period ending in Juneincluded abcmt 134,000 persons from 42,000 householdsin about 4,700 segments.
The overall sample was designed in such a fashionthat tabulations can be provided for each of the majorgeographic regions and for urban and rural sectorsof the United States.
Collection of ckzta.—Field operations for thehousehold survey are performed by the U.S. Bureau ofthe Census under specifications established by theNational Center for Health Statistics. In accordancewith these specifications the Bureau of the Censusselects the sample, conducts the field interviewingas an agent of the Center, and performs a manual
43

editing and coding of the questionnaires. The HealthInterview Survey, using Center electronic computers,carries out further editing and tabulates the editeddata.
Estimating methods. —Each statistic produced bythe survey– for example, the number of persons whoreported episodes of hospitalization—is the result oftwo stages of ratio estimation. In the first of these, thecontrol factor is the ratio of the 1960 decennial popu-lation count to the 1960 estimated population in theNational Health Survey’s first-stage sample of PSU’S.These factors are applied for some 25 color-residenceclasses.
Later, ratios of sample-produced estimates of thepopulation to official Bureau of the Census figures forcurrent population in about 60 age-sex-color classesare computed and serve as second-stage factors forratio estimating.
The effect of the ratio-estimating process is tomake the sample more closely representative of thepopulation by age, sex, color, and residence, thus re-ducing sampling variance.
As noted, each week’s sample represents the popu-lation living during that week and characteristics ofthis population. Consolidation of samples over a timeperiod, say a calendar quarter, produces estimates ofaverage characteristics of the U.S. population for thatcalendar quarter. Similarly, population data for a yearare averages of the four quarterly figures.
For statistics measuring the number of occurrencesduring a specified time period, such as the number ofhospital episodes or number of hospital days, a similarcomputational procedure is used, but the statistics areinterpreted differently. For these items, the question-naire asks for the respondent’s experience during theyear prior to the weelc of interview. Thus, consolidationof, say, samples in 52 successive weeks provides anestimate of 1 year’s experience for all persons in thepopulation; the specific year differs chronologicallyamong persons in samples in the different weeks, theexperience for each such person being that in the 52weeks prior to his week of interview.
General Qualifications
Nonyesponse. —Data were adjusted for nonresponseby a procedure which imputes to persons in a house-hold which was not interviewed the characteristics ofpersons in households in the same segment which wereinterviewed. The total noninterview rate was 5 percent—1 percent was refusal, and the remainder was pri-marily due to the failure to find any eligible house-hold respondent after repeated trials.
The intmview process. —The statistics presentedin this report are based on replies secured in inter-views of persons in the sampled households. Eachperson 19 years of age and over available at the timeof interview was interviewed individually. Proxy re-spondents within the household were employed for
children and for adults not available at the time of theinterview, provided the respondent was closely relatedto the person about whom information was being ob-tained.
There are limitations to the accuracy of diagnosticand other information collected in household interviews.For diagnostic information, the household respondentcan, at best, pass on to the interviewer only the infor-mation the physician has given to the family. For con-ditions not medically attended, diagnostic informationis often no more than a description of symptoms. How-ever, other facts, such as the number of disability dayscaused by the condition, can be obtained more accur-ately from household members than from any othersource since only the persons concerned are in aposition to report this information.
Rounding of num bexs. —The original tabulations onwhich the data in this report are based show all esti-mates to the nearest whole unit. All consolidations weremade from the original tabulations using the estimatesto the nearest unit. In the final published tables thefigures are rounded to the nearest thousand, althoughthese are not necessarily accurate to that detail. De-vised statistics, such as rates and percent distributions,are computed after the estimates on whiclh these arebased have been rounded to the nearest thousand.
Population figuves. —Some of the published tablesinclude population figures for specified categories. Ex-cept for certain overall totals by age and sex, whichare adjusted to independent estimates, these figuresare based on the sample of households in the NationalHealth Survey. These are given primarily to providedenominators for rate computation, and for this pur-pose are more appropriate for use with the accompany-ing measures of health characteristics than other popu-lation data that may be available. In some instancesthese will permit users to recombine published datainto classes more suitable to their specific needs. Withthe exception of the overall totals by age and sex,mentioned above, the population figures (differ fromcorresponding figures (which are derived from differ-ent sources) published in reports of the Bureau of theCensus. For population data for general use, see theofficial estimates presented in Bureau of the Censusreports in the P-20, P-25, and P-60 series.
Reliability of Estimates
Since the estimates are based on a sample, theywill differ somewhat from the figures that would havebeen obtained if a complete census had been takenusing the same schedules, instructions, and interview-ing personnel and procedures. As in any survey, theresults are also subject to measurement error.
The standard error is primarily a measure ofsampling variability, that is, the variations that mightoccur by chance because only a sample of the popu-lation is surveyed. As calculated for this report, thestandard error also reflects part of the variation
44

which arises in the measurement process. It doesnot include estimates of any biases which might lie inthe data. The chances are about 68 out of 100 that anestimate from the sample would differ from a completecensus by less than the standard error. The chancesare about 95 out of 100 that the difference would beless than twice the standard error and about 99 out of100 that it would be less than 2!4 times as large.
The relative standard error of an estimate isobtained by dividing the standard error of the estimateby the estimate itself and is expressed as a percent-age of the estimate. Included in this appendix arecharts from which the relative standard errors can bedetermined for estimates shown in the report. In orderto derive relative errors which would be applicable @a wide variety of health statistics and which could beprepared at a moderate cost, a number of approxima-tions were required. As a result, the charts providean estimate of the approximate relative standarderror rather than the precise error for any specific
aggregate or percentage.Three classes of statistics for the health survey
are identified for purposes of estimating variances.
Narrow vange. —This class consists of (1) statis-tics which estimate a population attribute, e.g., thenumber of persons in a particular income group, and(2) statistics for which the measure for a single individ-ual for the period of reference is usually either O or 1,on occasion may take on the value 2, and very rarelyis 3.
Medium vange. -This class consists of other sta-tistics for which the measure for a single individualfor the period of reference will rarely lie outside therange O to 5.
Wide range. —This class consists of statistics forwhich the measure for a single individual for the periodof reference frequently will range from O to a numberin excess of 5, e.g., the number of days of bed disabilityexperienced during the year.
In addition to classifying variables according towhether they are narrow-, medium-, or wide-range,statistics in the survey are further defined as:
Type A. —Statistics on prevalence and incidencedata for which the period of referencein the questionnaire is 12 months.
Type B. —Incidence-type statistics for which theperiod of reference in the questionnaireis 2 weeks.
Type C. —Statistics for which the reference periodis 6 months.
Only the charts on sampling error applicable todata contained in this report are presented.
General rules fw determining relutive samplingmovs. —The “guide” on page 46, together with thefollowing rules, will enable the reader to determine
approximate relative standard errors from the chartsfor estimates presented in this report.
Rule 1.
Rule 2.
Rule 3.
Rule 4.
Estimates of ag.gregates: Approximaterelative standard errors for estimates ofaggregates such as the number of personswith a given characteristic are obtainedfrom appropriate curves on page 47. Thenumber of persons in the total U.S. popu-lation or in an age-sex class of the totalpopulation is adjusted to official Bureauof the Census figures and is not subjectto sampIing error.
Estimates of percentages in a percentdistribution: Relative standard errors forpercentages in a percent distribution of atotal are obtained from appropriate curveson page 48. For values which do not fallon one of the curves presented in the chart,visual interpolation will provide a satis-factory approximation.
Estimates of rates where the numeratoris a subclass of the denominator: (Notrequired for statistics presented in thisreport.)
Estimates of Yates where the numerator isnot a subclass of the denominator: Thisrule applies where a unit of the numeratoroften occurs more than once for any oneunit in the denominator. For example, inthe computation of the number of personsinjured per 100 currently employed per-sons per year, it is possible that a per-son in the denominator could have sustainedmore than one of the injuries included inthe numerator. Approximate relativestandard errors for rates of this kind maybe computed as follows:
(a)
(b)
Where the denominator is the totalU.S. population or includes all personsin one or more of the age-sex groupsof the total population, the relativeerror of the rate is equivalent to therelative error of fie numerator whichcan be obtained directly from theappropriate chart.
In other cases, obtain the relativestandard error of the numerator andof the denominator from the appro-priate curve. Square each of theserelative errors, adti the resultingvalues, and extract the square rootof the sum. This procedure will resultin an upper lmund and often will over-state the error.
b5

Guide to Use of Relative Standard Error Charts
The code shown below identifies the appropriate (1) A = aggregate, P= percentage; (2) the number ofcurve to be used in estimating the relative standard calendar- quarters of data collection; (3) the type oferror of the statistic described. The four components the statistic as described on page 45, and (4) the rangeof each code describe the statistic as follows: of the statistic as described on page 45.
Statistic
Number of:Persons in the U.S. population, or any age-sex
category thereof-----------------------------------
Persons in any other population grope---------------
Hospital episodes per year--------------------------
Hospital days per year------------------------------
Percentage distribution of:Hospital episodes, or population characteristic -----
Number of hospital days per hospitalized personper year--------------------------------------------
Use:
I
Rule I Code orl page
Not subject to sampling errc)r
1
1
1
2
4(b)
A4AN
A4AN
A4AW
P4AN-M
{
Numer.: A4AWDenom.: A4AN
47
47
47
47
48
:;
46

Relative standard error.?for aggregates based on four qua?rbersof data doll.ectionfor data of all types end ranges
1 00
10
S2h
Sif+al
1~31% 1
1
100 1,000 10,000 100,000
Size of estimate (in thousands)
Exsmple of uee of chart: An aggregate of 2,000,000 (on scale at bottom of chart) for aNarrow range Type A statistic (code: A4AN) has a relative standard error of 3.6 percent,(read from scale at left side of chart), or a standard error of 72,000 (3.6 percent of2,000 ,000). For a Wide range Type B statistic (code: A4BW) , an aggregate of 6,000,000 hasa relative error of 16.0 percent or a standard error of 960,000 (16 percent of 6,000 ,000).
47

Relative standarderrorsfor percentagesbased on four quartersof datacdd.ectdonfor type A data, Narrow and Mediun range
(Base of percentage shown on curves in miKLions)
.*A
●
●
✎
.–: 2 3 “45 6789X 2 3 45 6789%
10 100
Estimated percentage
Exm@e of use of chart: Au estimate of 20 percent(onscaleat bottomof char%)basedonan est~te of’10,000,000 has a relative standard error of 3.2 percent (reaclfhm thesc~e at the left side of the chart),tie petit at which the curve for a base of 10,000,000intersectsthe verticalline for 20 percent. The stemdarderrorh percentagepoints iseqti to 20 percentx 3.2percentor 0.64percentage points.

DEFINITIONS
Terms Relating to Hospitalization
APPENDIX II
OF CERTAIN TERMS USED IN THIS REPORT
Hospital episode. —A hospital episode is any con-tinuous period of stay of one or more nights in a hos-pital as an inpatient, except the period of stay of a well,newborn infant. A hospital episode is recorded for afamily member whenever any part of his hospital stayis included in the 12-month period prior to the inter-view week.
Hospital. —For this survey a hospital is definedas any institution meeting one of the following criteria:(1) named in the listing of hospitals in the currentGuide Issues of Hospitals, the Journal of the AmericanHospital Association; (2) named in the listing ofhospitals in the Directories of the American Osteo-pathic Hospital Association; or (3) named in the an-nual inventory of hospitals and related facilities sub-mitted by the States to the Division of Hospital andMedical Facilities of the U.S. Public Health Servicein conjunction with the Hill-Burton program.
Shovt-stuy hospital. —A short-stay hospital is onefor which the type of service is general; maternity;eye, ear, nose, and throat; children’s; osteopathichospital; or hospital department of institution.
Hospital day. —A hospital day is a day on whicha person is confined to a hospital. The day is countedas a hospital day only if the patient stays overnight.Thus, a patient who enters the hospital on Mondayafternoon and leaves Wednesday noon is considered tohave had 2 hospital days.
Hospital akzys during the year. —The number ofhospital days during the year is the total number forall hospital episodes in the 12-month period prior tothe interview week. For the purposes of this estimate,episodes overlapping the beginning or end of the 12-month period are subdivided so that only those daysfalling within the period are included.
Demographic, Social, and Economic Terms
Age. —The age recorded for each person is theage at last birthday. Age is recorded in single yearsand grouped in a variety of distributions dependingupon the purpose of the table.
Cokw. —Color is recorded as “white,” or l’non-white. ‘‘ “Nonwhite” includes Negro, American Indian,Chinese, Japanese, and so forth. Mexican persons areincluded with “white” unless definitely known to beIndian or of another nonwhite race.
Mavitul status . —Marital status is recorded onlyfor persons 17 years of age or older. The marital sta-tus categories in this report are as follows:
uncle-v 17 includes all persons aged 0-16, regard-less of their marital status.
Mamied includes all married persons not sepa-rated from their spouses. Persons with common-law marriages are considered to be married.
~Ter)~ ma~vied includes persons who Were never
married and persons whose only marriage wasannulled.
Sepavated includes married persons who have le-gally separated or who have parted because ofother reasons. This does not include persons sep-arated from their spouses because of circum -stances of employment or because of service inthe Armed Forces; these persons are consideredmarried.
Widowed and diwrced include, re~pectively, allpersons who reported that they were either wid-owed or legally divorced.
lnconze of family or of unrelated individuals. —Each
member of a family is classified according to the totalincome of the family of which he is a member. Withinthe household all persons related to each other byblood, marriage, or adoption constitute a family. Un-related individuals are classified according to theirown income.
The income recorded is the total of all income re-ceived by members of the family (or by an unrelatedindividual) in the 12-month period ending with the weekof interview. Income from all sources is included, e.g.,wages, salaries, rents from property, pensions, helpfrom relatives, and so forth.
49

Residence.—The place of residence of a memberof the civilian, noninstitutional population is classifiedas being inside a standard metropolitan statistical area(SMSA) or outside an SMSA, according to farm or non-farm residence.
Standard metropolitan statistical areas. —The def-initions and titles of SMSA’s are established by theU.S. Bureau of the Budget with the advice of the FederalCommittee on Standard Metropolitan Statistical Areas.There were 212 SMSA’S defined for the 1960 DecennialCensus for which data may be provided by place ofresidence in the Health Interview Survey.
The definition of an individual SMSA involves twoconsiderations: first, a city or cities of specified pop-ulation which constitute the central city and identify thecounty in which it is located as the central county; and,second, economic and social relationships with contig-uous counties (except in New England) which are metro-politan in character, so that the periphery of the spe-cific metropolitan area may be determined. SMSA’S arenot limited by State boundaries.
Fam and nonfavm residence.-The population re-siding outside SMSA’s is subdivided into the farm popu-lation, which comprises all non-SMSA residents livingon farms and the nonfarm population, which comprisesthe remaining non-SMSA population. The farm popula-tion includes persons living on places of 10 acres ormore from which sales of farm products amounted to
$SO or more during the previous 12 months or on placesof less than 10 acres from which sales of farm productsamounted to $250 or more during the preceding 12months. Other persons living in non-SMSA territorywere classified as nonfarm if their household paidrent for the house but their rent did not include anyland used for farming.
Sales of farm products refer to the gross receiptsfrom the sale of field crops, vegetables, fruits, nuts,livestock and livestock products (milk, wool, etc.),poultry and poultry products, and nursery and forestproducts produced on the place and sold at any timeduring the preceding 12 months.
Region.— For the purpose of classifying the popu-lation by geographic area, the States are grouped into
four regions. These regions, which correspond to thoseused by the Bureau of the Census, are as follows:
Region
Northeast -------
North Central ---
South -----------
West -----------
States Included
Maine, New Hampshire, Vermont,Massachusetts, Rhode Island,Connecticut, New York,New Jersey, Pennsylvania
Michigan, Ohio, Indiana, Illinois,Wisconsin, Minnesota, Iowa,Missouri, North Dakota,South Dakota, Nebraska, Kansas
Delaware, Maryland, District ofColumbia, Virginia, West Virginia,North Carolina, South Carolina,Georgia, Florida, Kentucky,Tennessee, Alabama, Mississippi,Arkansas, Louisiana, Oklahoma,Texas
Montana, Idaho, Wyoming, Colorado,New Mexico, Arizona, Utah, Nevada,Alaska, Washington, Oregon,California, Hawaii
Living amangements. —The term “living arrange-ments” describes the individual’s relationship to otherpersons within the same household. For this reportthe definition includes these categories:
1. Living alone OY with nonrelatives.--A personliving in a one-member household, or in a house-hold with another person or persons none ofwhom are related to him by blood, marriage, oradoption.
2. Living with relatzves. —A person living in ahousehold with another person or persons ofwhom one or more are related to him by blood,marriage, or adoption. Persons living with rela-tives are further classified by marital statusas “married” and “other. ”
000
50

APPENDIX Ill- QUESTIONNAIRE ITEMS REFERRING TO HOSPITALIZATION
3.0. Has -- been In a hospital .? any time since a y.., ago? IncIude stnys in nursing homes, = Yes o No
If ,8 Y.s,99 ask: rest homes or similar places.
b. How many time. w.. -- in a hospital during that period?No. of hmes
(Exmdm ago. 1“ q.ostlon 3 for babies 1 paw old or trnder. For each child 1 Year old or under, esk 14a.) Month ~Day I Year
4.0. When was -- born? (If on or after the dot. stomped in 13.z ask 14b.L ------------------------- ---- ------------L ----L---
:i:i:::::i!ii:{i?i!;!;I::--------
1,
If uy,..,,, and .0 hospztoltzotions entered in his cdnnn, enter “I, * in 13b
If~ @’,:_a~g fi@s&@Z~t~O-n.i~ ~~-o~t:< ~o~ ~fy-lnctbgr-.-rnfbptiti .iOsk 14c-
~:__-
= Yes o No------- ---------------— -----
c. [S this hospital iz.at i.. included i. the number you gave me for - -? (If ,<IVO,,, cmrcct cnfry for nwthcr .“a baby) my= @ ONO
“d,
.
..*
(.
,1,
HOSPITAL PAGE ~ 1,Person nuwbcr~J:ku
Enter monlh, day, Y..K } Y.. sold !h.t -- w.. i. *h. hospitalif the exact d.tc i. notknown, obtain tho b.sh ~
(once, twlc.; t..) during the post par: ~~h
.atim.tc, 2. Wh.. did -- .nt.r th. hospl!ol
USEYOUR ~ (th. Io,t Nm.)?
,nte,n~~
CALENOAR ~Make . . . the YEAR —
is .wrect. ID
Do not include my nights Ii. int. rvi.w wc.k. If the I 3. How m.ny nigh!. w.. -- I.
exact number is not. known, ; the hospital?.ccc~l the best c,t, mme. } n
Complete question 4 from ~
~ ‘*r*in*h0posf12m0nrhs? m
,nwiem i“ qnc.tio”e z .nd ~~ 4.. H.w m.”~ .f th . . . . ..i~ht.
if not clew, ask theq.estio..,
l–-----––––––––- ..–––––––--–-––––– -----------------------
Do mot include nny night. ; b. HOW many of th.s.. - nights W.I.in interview week. lost weak o, the “cck b. for.?
nUSEYOUR ‘:-”;:wii:-:X i in iii hii;itoi ia.i-sund-:--o -ye~- -- ;: ;.- --- ‘“CALENOAR night for this h..pitolix.ati..?
Ask for .11 hos.it.lizati.ns. ~ 5. F.. what condition did -_ ..t.r th. hc..pit.l. do Y.. know *h.
If medical n.me not known, !m.di..l nom. ?
.ntcr . . od. quote
description,
EntT must show CAUSE,KIND, and PART OF BODYi. sm. detail ae requir.dfar the Condition p.gc.
I If nnm. of operation is .01known, dcscribewh.t wondo”..
EM., the full name of thehospital, the 81rec1 orhighway on which it islocated, ond the city andStat.; if the city is notk.w+n, enter the c.u”ty.
U*,
..+,.
m,..,,,.
For delivery ask: Was this o normal doliwy? “
For newborn, a.k: Was th. baky nerm.f .1 bkth? “
“[f ‘“No” ask: What W.. th. mutt.,? {ffw “,d ,. .- C,>ndzlwn., /,”> ,
Cond!tom
II ,
6a. W.r. any op.ra~lon. p.rformed on _-duri”g thi. stay at *h. hospital? : Yes ‘: No -GO m 7
. . . . . . —————. ..— —————————-..b. What w.. th. nom. of th. .p.rntion?
Owrsflwl
L I. . . . . .
. . Any .th.r op.r.tims? 0 Yes - Dcscribc abow c, No
7. What IS ih. nom. ond .addr.ss of th. h.spit.l?
Nane Of Hmplld
Address
C!ly (or county) :state
1 I
N)ghts
Q. No.13 14 C+er
Olag.
DqmslsSWST.OIIYtr.et.d
%-N.. 1
OP.,., !.. 2
O.r.ti.n 3
S.f.t . .
Olm.,shtp
WIImacudeo! hawed
Ofh. Acs.1..”> ,:,.<
[C or alum.cede
IF THE CONDITION IN QUESTION 5 OR 6 lNDICATES THAT AN ACCfDENT OR lNJURY WAS INVOLVED,
FILL QUESTIONS 8-77
80. Dld th. a.. id.rd happ.n during th. past 2 yqavs 9.. %S a ear, +,uck, bus ., eth., mat., ,.w b.for. that +Im.? kw.tv.d In th. accld.nt in .ny WOy? ,,.,,., :!
1.1. v., \ -G ,.,, ,.
I ./!-. N..
0 Ounng the past 2 years 0 Before 2 years (6) -Co 109., b. Was nmr. fham one vchicl. i.v.alv.d? ,,,,,., . .
Y.+ !& .
c. Was it (.ith.r c...) moving at th. tire.?.b. Wh.n did th. occld..t h.pp.. ? Enter month and
-,
vcar, mafk one cucle. 10.Wh.r. did th. accident hoppn?
F c ~:::~~
A?bm, (d,=. tiF.-#e? J.... .wee!:-4 *,;.-, ,IA”4, mti..arl,
,.!z.,,r p,x, ,,.<,A, ~,..,,,,,
— c+.!. Cp,,k pr-, .A,r. BC,,&.1kqpc”co :0 2weks-3rwmfbs(2)
G 3-12mMhs(4) 11. Was -- of work at his [.b or b.sin... Id.,w ,7 A. ‘. ,.
c l-2yeafs(6 ) wh. n th= .ccid.ni happsn.d ? ,8. ..: ?.% :-4 F..- :
NOTE TO /.YTERV/EEER If h amdlf!on 1. w.stl.. 5 or 6 1s m Cord A or B o, ,here .,. ,.1,- or morenigh!, I. we-,.. 46, //). cmd; tl.an MU,? ho.. o cmpl. fmd Condlf{on poze /[ tfI. cmd/f ion dxs not hove oCond,tlc.n pop, fill one offer mn,oleli”, .11 rewired H.axpliofhotkn w.s. ●m
,.,
* U. S. GOVERNMENT PRINTING OFFICE 19.69— 34204S/4051

OUTLINE OF REPORT SERIES FOR VITAL AND HEALTH Statistics
Public Health Service Publication No. 1000
Seyies 1.
Sevies 2.
Sevies 3.
Sevzes 4.
Series 10.
Se)-ies 11.
Series 12.
Seuies 1,3.
Proqvams and collection procedures .- Reports which kscrihe the general programs of the NationalCenter for Health Statistics and its offices and divisions, data collection methods used, clefinitions,
and other material necessary for understanding the data.
Data evaluation and methods ?“esearch. —Studies of new statistical methodology including: experi-mental tests of new survey methods, studies of vital statistics collection methods, new analyticaltechniques, objective evaluations of reliability of collected data, contributions to statistical theory.
Analytical str.rdies. -Reports presenting analytical or interpretive studies hased on vital and healthstatistics, carrying the analysis further than the expository types of report~ in the other series.
L)ocuwrents and committee reports. - Final reporth of major committees concerned with vital andhealth statistics, and documents such as recommended moclel vital re~istration laws and revised birthand ~ieath certificates.
Data fvom the Health Intev(iew SuYvey. —Statistic~ on illness, accidental injuries, disability, use of
hospital, medical, dental, and other services, and other he:llth-rel,~ted topics. hase~ on data collectedin o continuing national household interview survey.
L)ata from the Health Exrz)nination Survey.- l)ata from direct examination. testing, and n]easure-n]~mt of national samples of the population pro~,ide the basis for two types of reports: ( 1) estimatesof the rnedicallv defined prevalence of specific diseases in the L!nited States and the distributions ofthe population with respect to physical, physiological, and pfi} chological characteristics; and (?).In Ilysis of relationships ~rnong the v.~rious mc~surements without reference to .m explicit finiteul]iicrsc of persons.
Dtitu f;.OHZ the Institutzo?zal Population Stt}-~:eys. —St:ltistics rel.lting h) the health characteristics Ofpers(ms in institutions, and on medical, nursing. and pt, rs(mal care received, based on nationals.Imples of establishments providing these services and samples of the residents or patients.
L)tita j“rotn the Hos~ital Disc flavge Surzle~. —Statistics relatin~ h) discharged patients in short-stayh[)>~>itals, based on a sample of patient records in a nati(>n.1] s:i)l]l>le of h(~sl)italb.
sales !4.
Series 20.
Sei.les 21.
Se).ies 22.
txtc on health }-PSOWCPS: nzarrpowev and facilities. —S[at~_~lL> In tile numbers, iyXIgI-aphIC distri -huLI(JIn, and charactet-istics of health resources iucluding phy=l~ldns, d.ntists, II UI-SL>S,other healthn].l~]po~vcr occupations, hospitals, nulsinc homus, .lnd outpa [lent .lnd (nh CI- ]npatic, nt facilities.
Da[ti OF? )pzo),tality.—V;lriou6 st~tistics on n],~rt:]lit~- other LII:III ab included in annual or Inonthly:-ep,]rts-special anal~ses by cause of death, aSC,, and (]thcr denl(]gr.lphic variables, JISO geographicanL titnc> series analy.se.s.
LJut(~O}L}tataLtty, wza}.~-iag,c,alu[dit,o~ce. —Variou$ htati>tic> ,~n nita]ity, n]arria~e, and divorce other
th,ln as included in annual or monthly report~—. spcciai ,In,ll,>cs bv demo~raphic variables, also~cw~raphic and time series analyses, studies of ferti!~ty.
deaths not available from the vital records, based (m sanlplc SU: i’t,~;> stenlming from the~e records,inrlud ins such topics as m(]l-talitv b), socioecon(~rnic cla~fi, [ncdi~<il experience in the last year oflile characteristics of pregnanc~-. ~v .
101- .I list (ji’:itlu~ of reports puhlisbcd in these series, write [(): ( )fficc, i)f Ini~Jrnl<ition\,ltl(m.11 r..c,lr~,r for lk>. ilth St,ltistics
L’.S. l’(ihlic Ilc’cllth Service\h,’,~shiIlg[olJ,, 1).(”. ~0201
