visualizing spatial and temporal variability in coastal observatories walter h. jimenez wagner t....
TRANSCRIPT

Visualizing Spatial and Temporal Visualizing Spatial and Temporal Variability in Coastal ObservatoriesVariability in Coastal Observatories
Walter H. Jimenez Wagner T. CorreaClaudio T. Silva Antonio M. Baptista
OGI School of Science & Engineering, Oregon Health & Science University
Originally Published in the Proceedings of the14th IEEE Visualization Conference (VIS’03)
Bob ArmstrongBob ArmstrongMSIM 842MSIM 842
28 Feb 200728 Feb 2007
Summary of this PaperSummary of this Paper
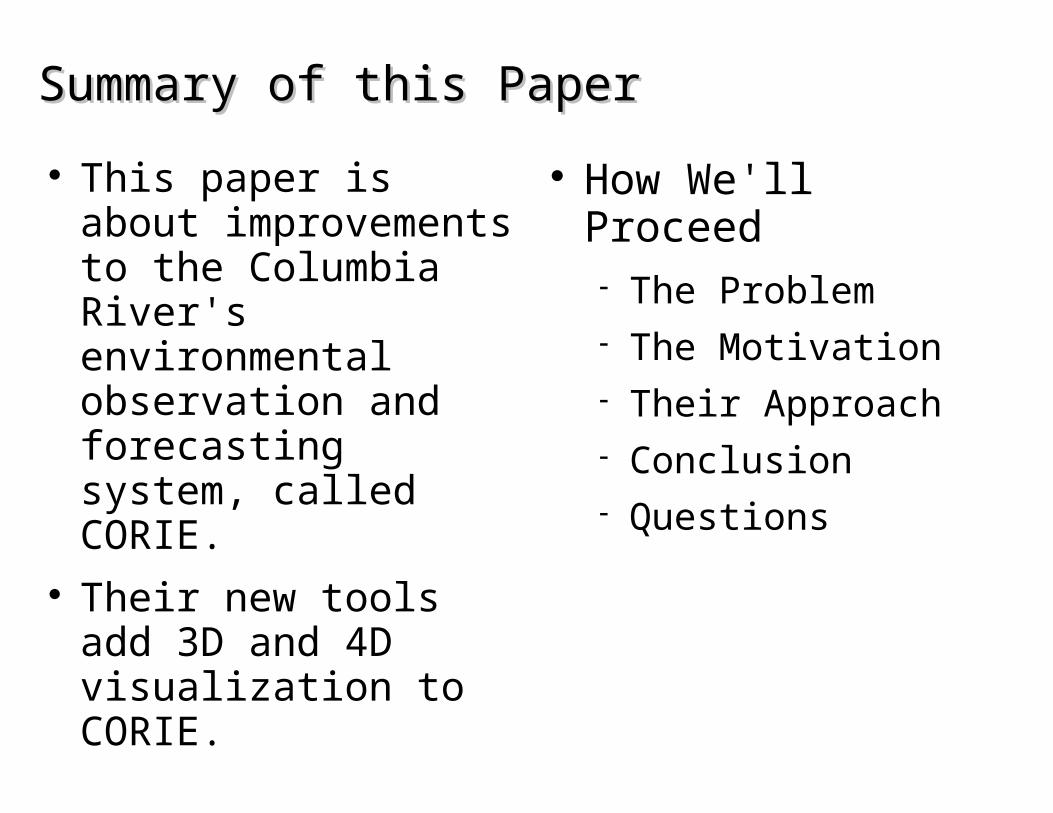
This paper is about improvements to the Columbia River's environmental observation and forecasting system, called CORIE.
Their new tools add 3D and 4D visualization to CORIE.
How We'll Proceed The Problem The Motivation Their Approach Conclusion Questions

The Big PictureThe Big Picture
SEATTLE
PORTLAND
This is the areaof
CORIE sensors

The Big PictureThe Big Picture
This is the areaof
CORIE sensors
Take off, you hoser.

The CORIE Sensor FieldThe CORIE Sensor Field
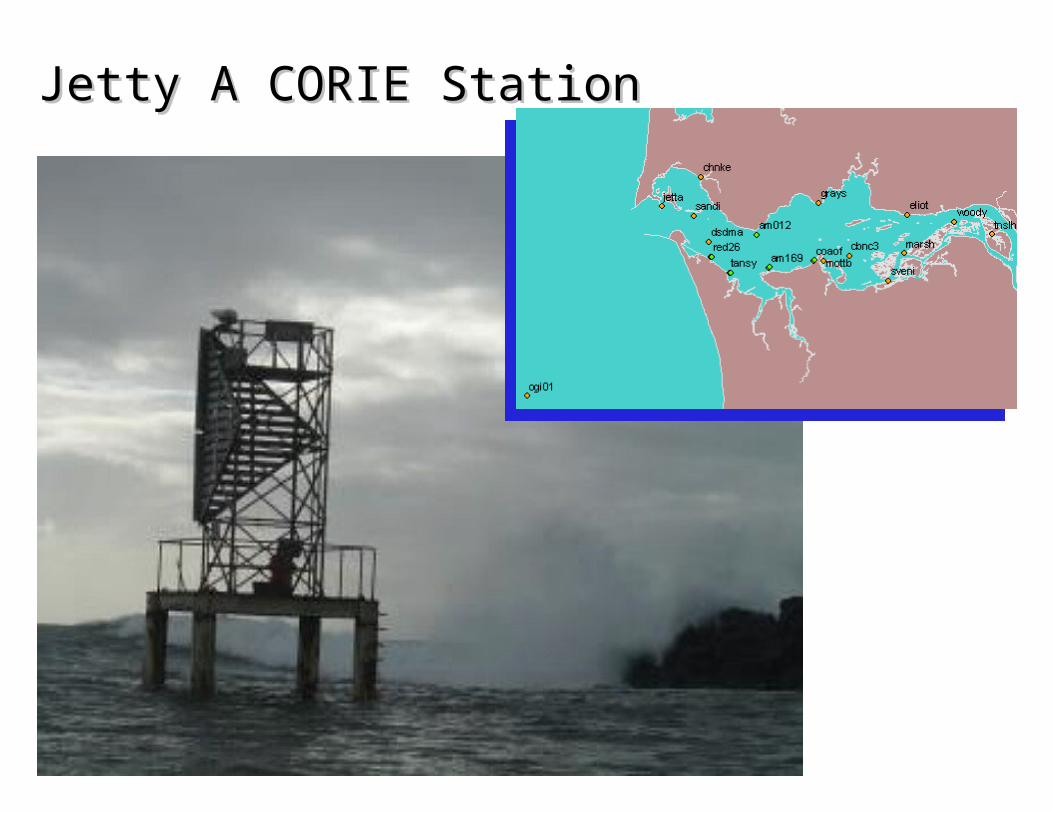
Jetty A CORIE StationJetty A CORIE Station

The ProblemThe Problem
In 2003, there was a mismatch between CORIE's simulation capabilities and generated data System based on high-resolution time-varying 3D
unstructured grids Also included a visualization component that for the
large part only generates 1D or 2D plots Some 3D information can be inferred from depth
plots, which slice the 3D data CORIE is the region's Environmental Observation
and Forecasting Systems (EOFS)

Forecast of Velocity MagnitudesForecast of Velocity Magnitudes

Location of CORIE StationsLocation of CORIE Stations
Environmental Observation and Forecasting Environmental Observation and Forecasting SystemsSystems Seek to generate and deliver quantifiably reliable
information about the environment Rely heavily on modeling and visualization CORIE
Observation Network Real-Time telemetry from over 20 stations
Advanced Modeling System Models the complex circulation in the river and plume
Information Management System Web Publishing of Processed Data
Why should we care about this problem?Why should we care about this problem?
Interesting visualizations They desire volume rendering versus isometric
surface renderings Very easy to interpret output
Vector treatment is logical Colorization is logical and very telling
Moving towards real-time representation of large-scale fluid fields

Preprocessing of CORIE OutputPreprocessing of CORIE Output
CORIE output data must be converted in order to be visualized
Volume rendering of the salinity scalar Requires an unstructured grid of tetrahedrons Each vertex is associated with one salinity scalar Rendering of the bathymetry requires a grid of
triangles representing the ground surface Velocity field visualization
Requires an unstructured grid of points Vector attributes associated with each point
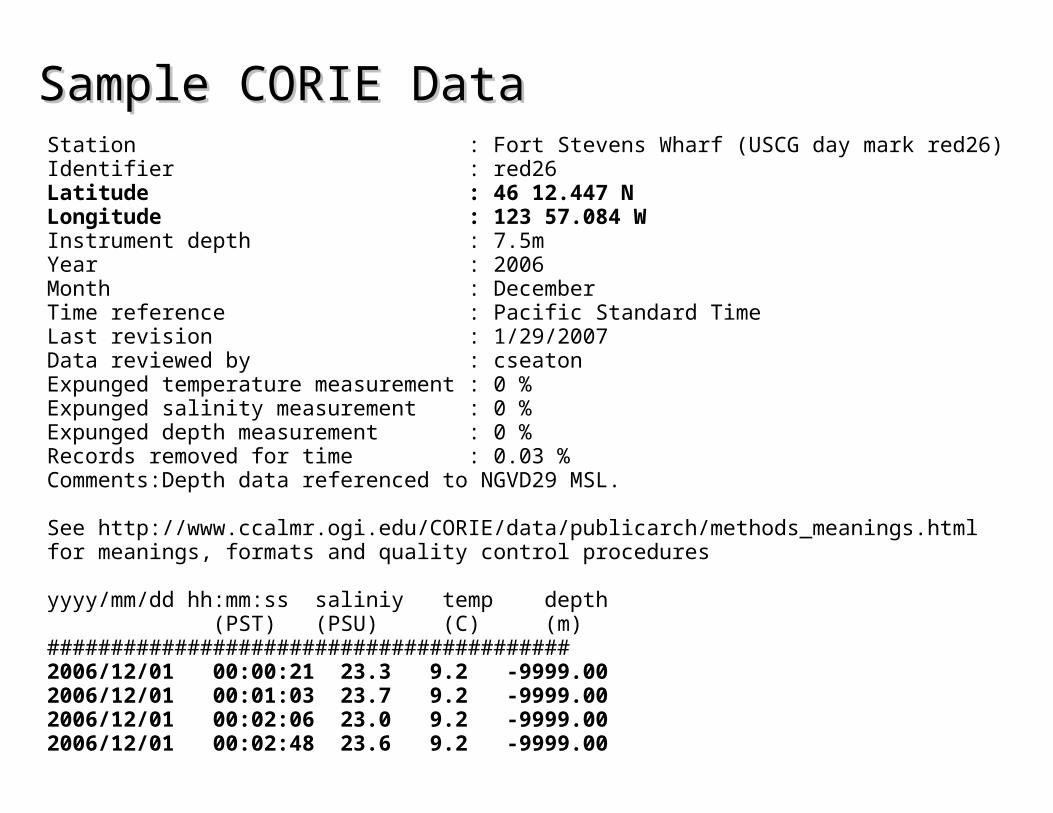
Sample CORIE DataSample CORIE DataStation : Fort Stevens Wharf (USCG day mark red26)Identifier : red26Latitude : 46 12.447 NLongitude : 123 57.084 WInstrument depth : 7.5mYear : 2006Month : DecemberTime reference : Pacific Standard TimeLast revision : 1/29/2007Data reviewed by : cseatonExpunged temperature measurement : 0 %Expunged salinity measurement : 0 %Expunged depth measurement : 0 %Records removed for time : 0.03 %Comments:Depth data referenced to NGVD29 MSL.
See http://www.ccalmr.ogi.edu/CORIE/data/publicarch/methods_meanings.htmlfor meanings, formats and quality control procedures
yyyy/mm/dd hh:mm:ss saliniy temp depth (PST) (PSU) (C) (m)#########################################2006/12/01 00:00:21 23.3 9.2 -9999.002006/12/01 00:01:03 23.7 9.2 -9999.002006/12/01 00:02:06 23.0 9.2 -9999.002006/12/01 00:02:48 23.6 9.2 -9999.00
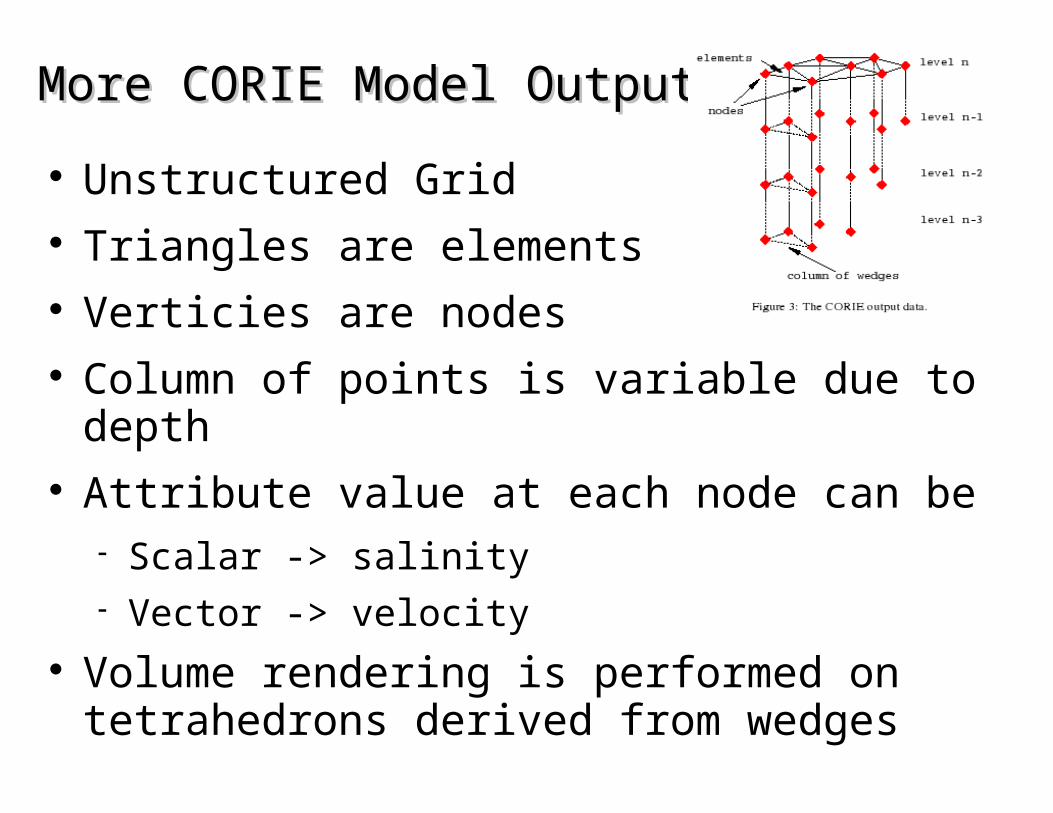
More CORIE Model OutputMore CORIE Model Output
Unstructured Grid Triangles are elements Verticies are nodes Column of points is variable due to depth Attribute value at each node can be
Scalar -> salinity Vector -> velocity
Volume rendering is performed on tetrahedrons derived from wedges

CORIE Output DataCORIE Output Data
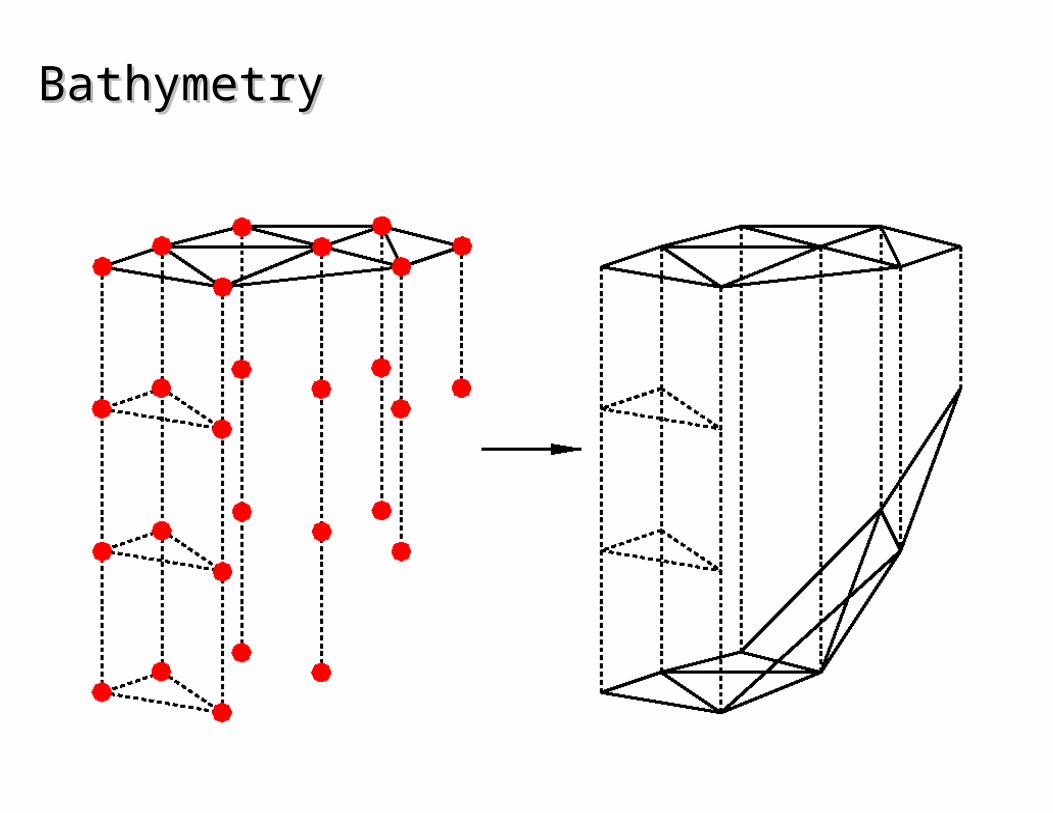
BathymetryBathymetry
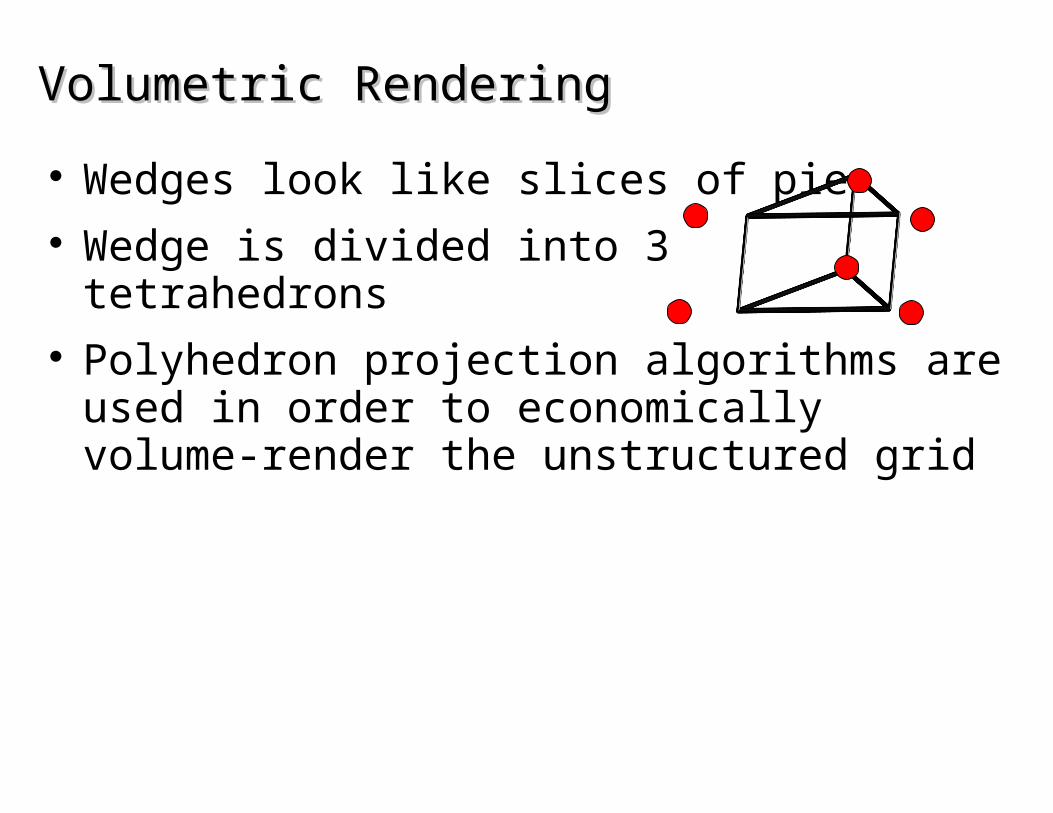
Volumetric RenderingVolumetric Rendering
Wedges look like slices of pie Wedge is divided into 3
tetrahedrons Polyhedron projection algorithms are used in
order to economically volume-render the unstructured grid

Wedges into Three TetrahedraWedges into Three Tetrahedra
n1
n2
n3
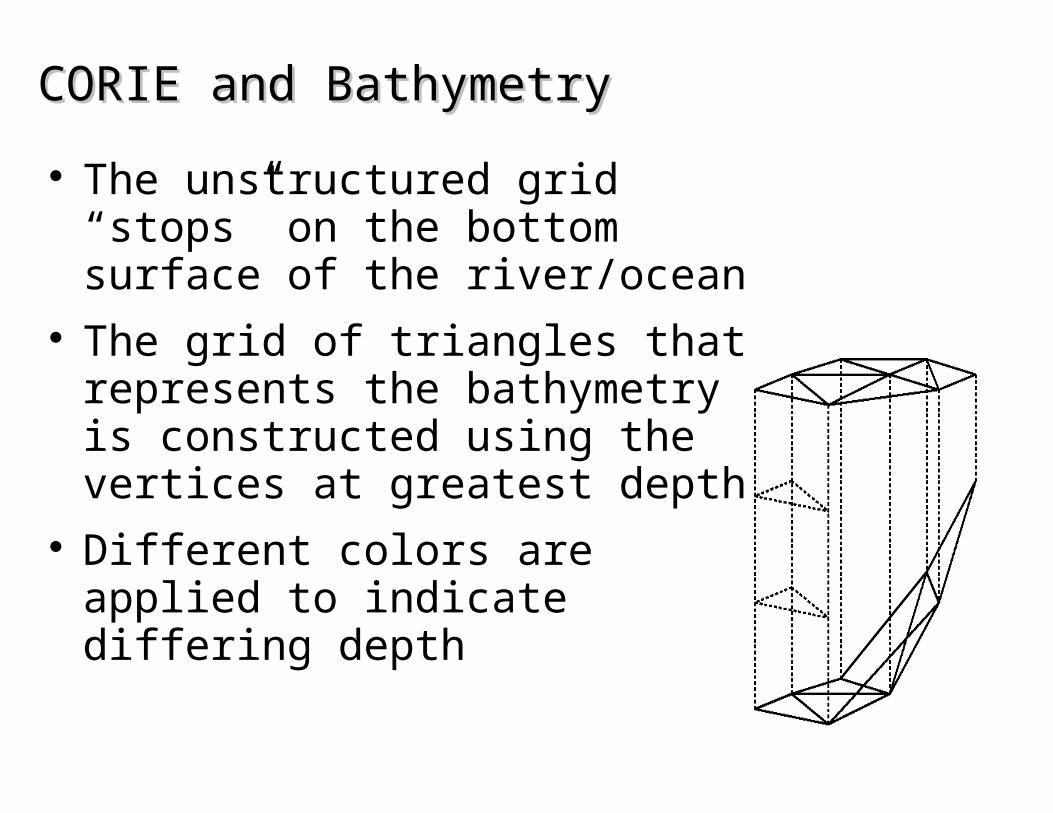
CORIE and BathymetryCORIE and Bathymetry
The unstructured grid “stops” on the bottom surface of the river/ocean
The grid of triangles that represents the bathymetry is constructed using the vertices at greatest depth
Different colors are applied to indicate differing depth

Columbia River Topology and BathymetryColumbia River Topology and Bathymetry

Columbia River Insertion into Continental Columbia River Insertion into Continental ShelfShelf

Representation of Salinity FieldsRepresentation of Salinity Fields
Rely on volume rendering Allows for study of fine detail between high and low
salinity regions Blue = high salinity Yellow = low salinity Red = interface regions
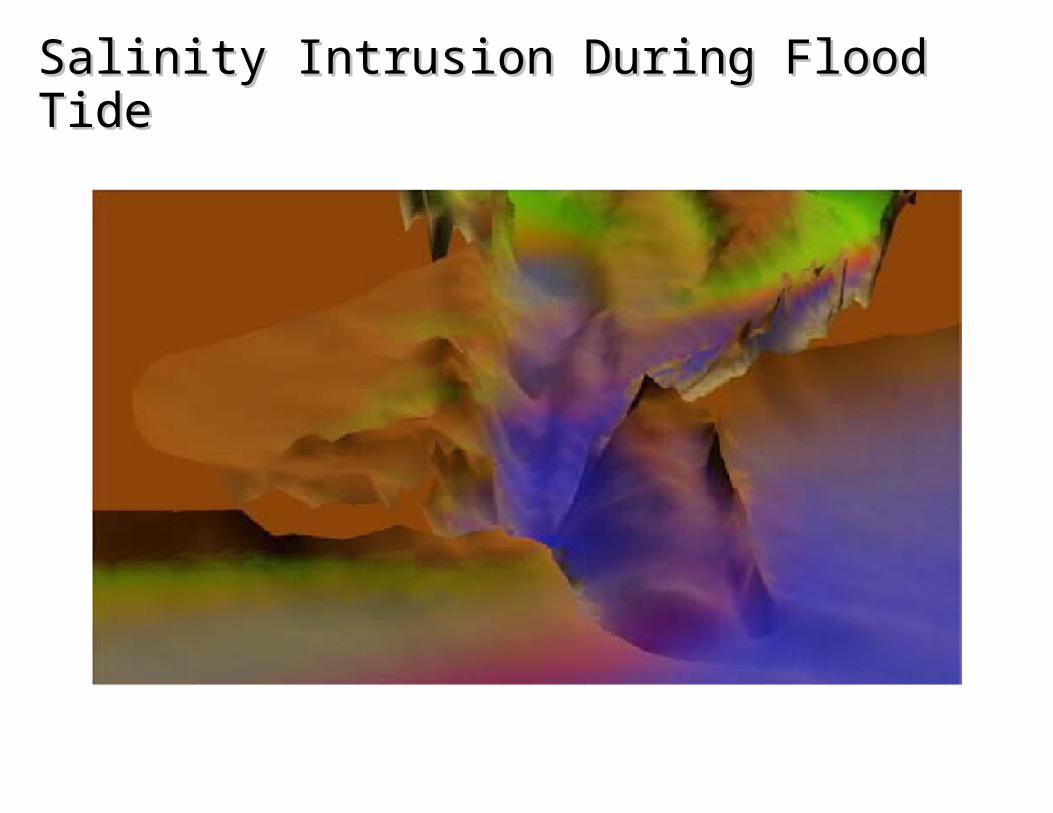
Salinity Intrusion During Flood TideSalinity Intrusion During Flood Tide
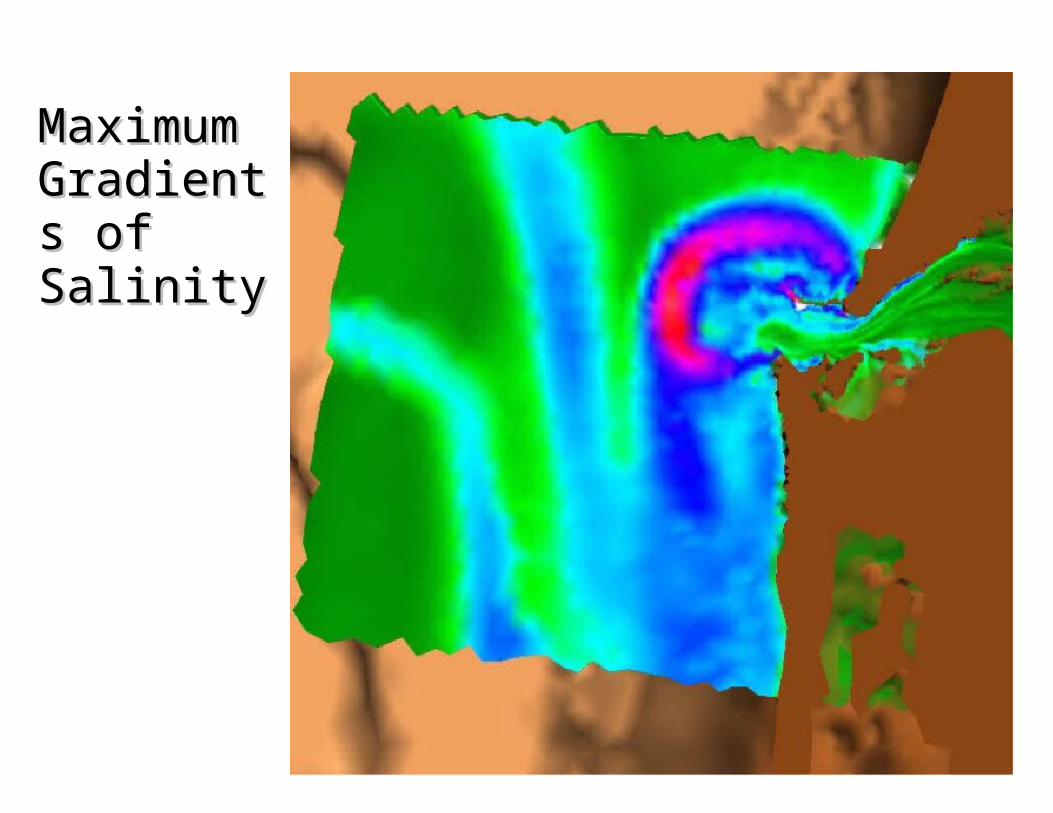
Maximum Maximum Gradients Gradients of Salinityof Salinity
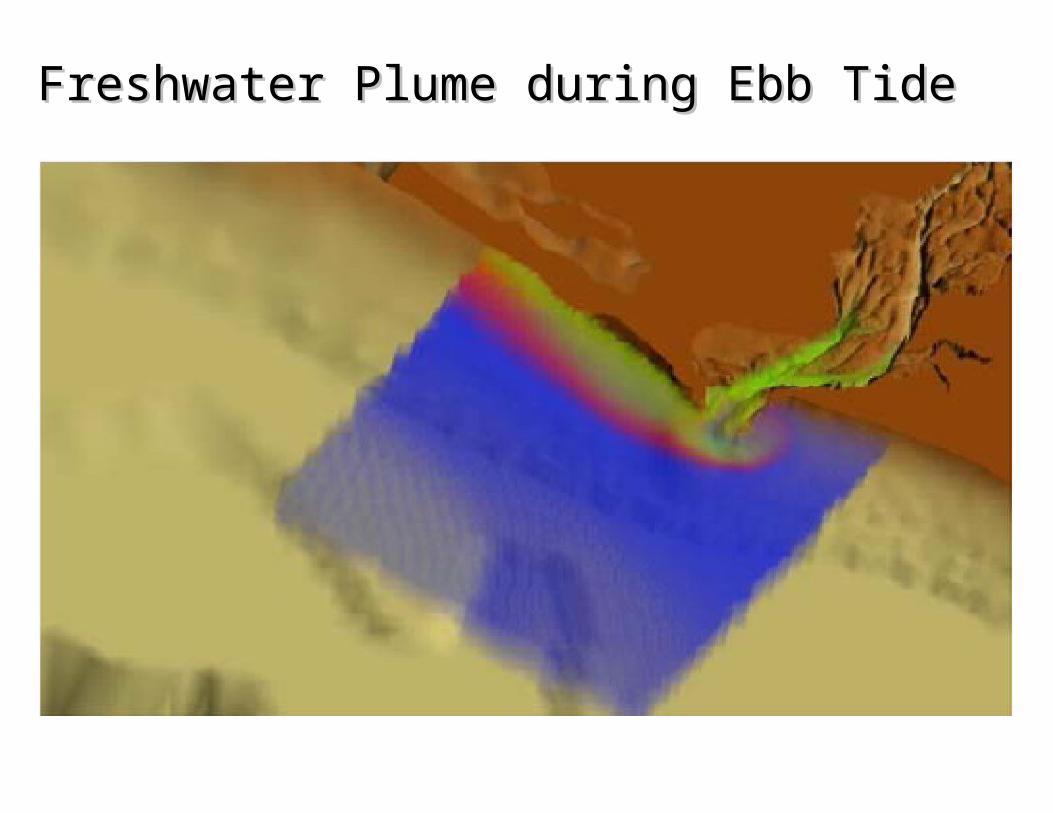
Freshwater Plume during Ebb TideFreshwater Plume during Ebb Tide
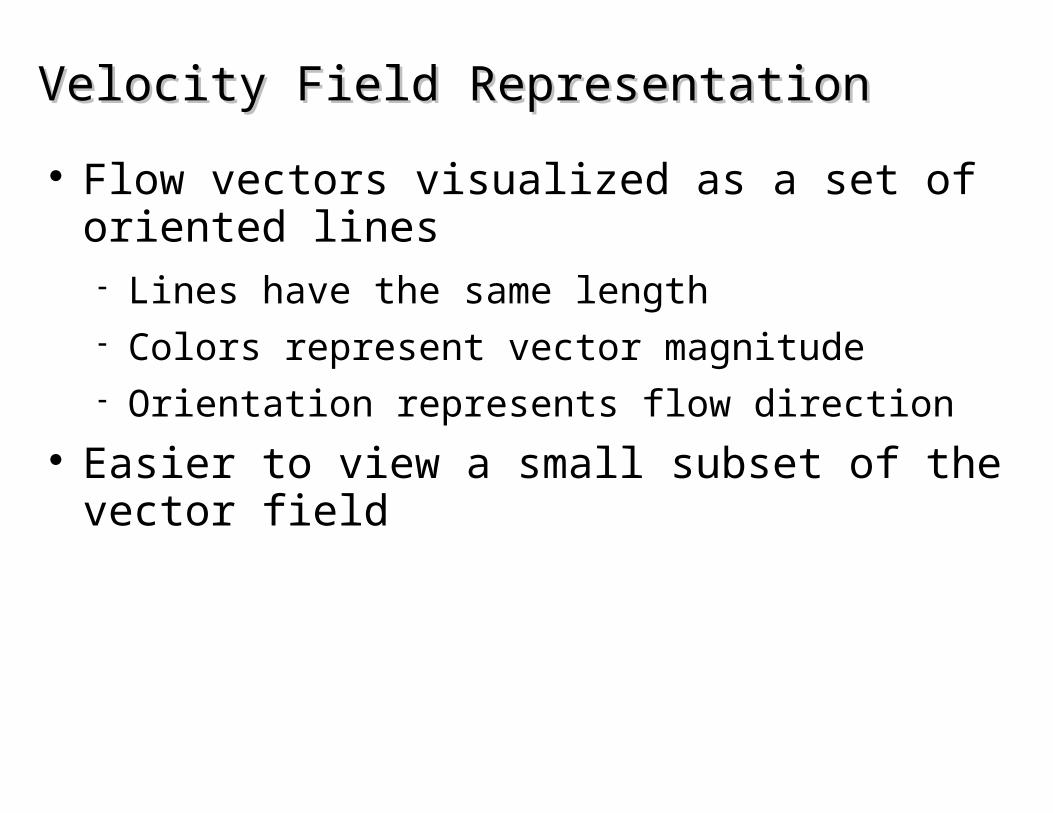
Velocity Field RepresentationVelocity Field Representation
Flow vectors visualized as a set of oriented lines Lines have the same length Colors represent vector magnitude Orientation represents flow direction
Easier to view a small subset of the vector field

Velocity Field during Ebb TideVelocity Field during Ebb Tide

Use of the Model in SimulationUse of the Model in Simulation
Historical data is used extensively in simulation Simulation can be “validated” by the use of
drifters Drifters are floating data and position collection
devices Helpful to validate simulation behaviors
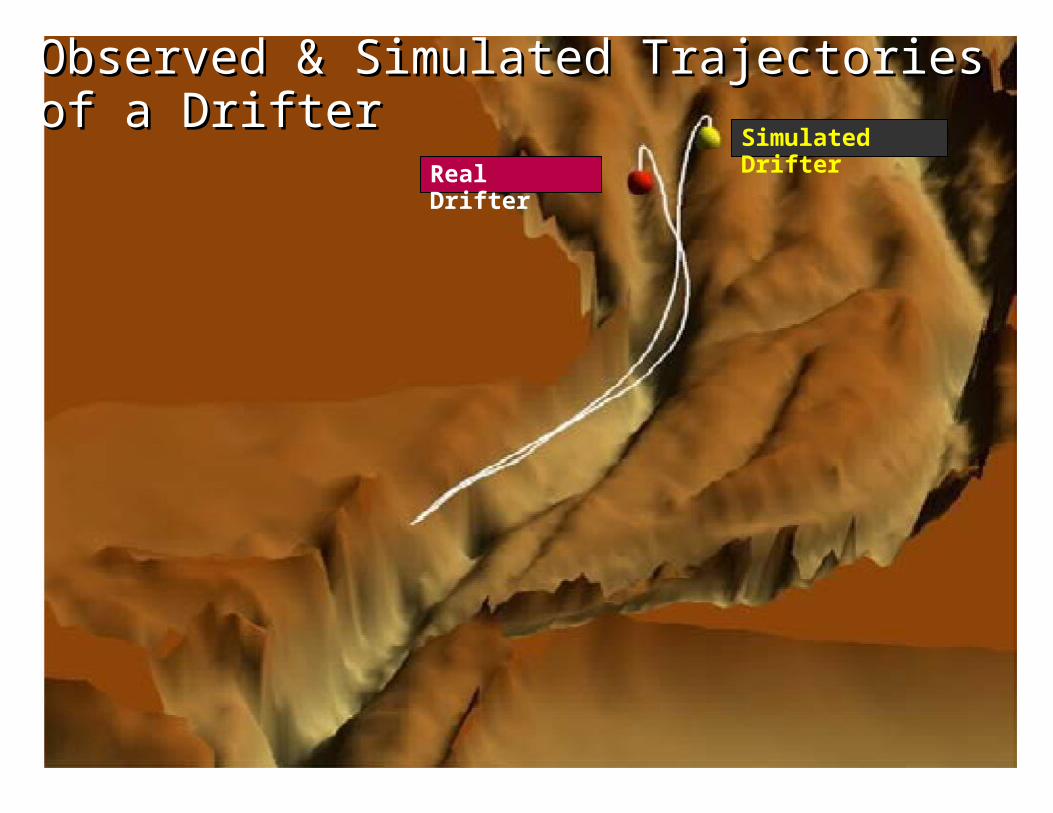
Observed & Simulated Trajectories of a Observed & Simulated Trajectories of a DrifterDrifter
Real Drifter
Simulated Drifter
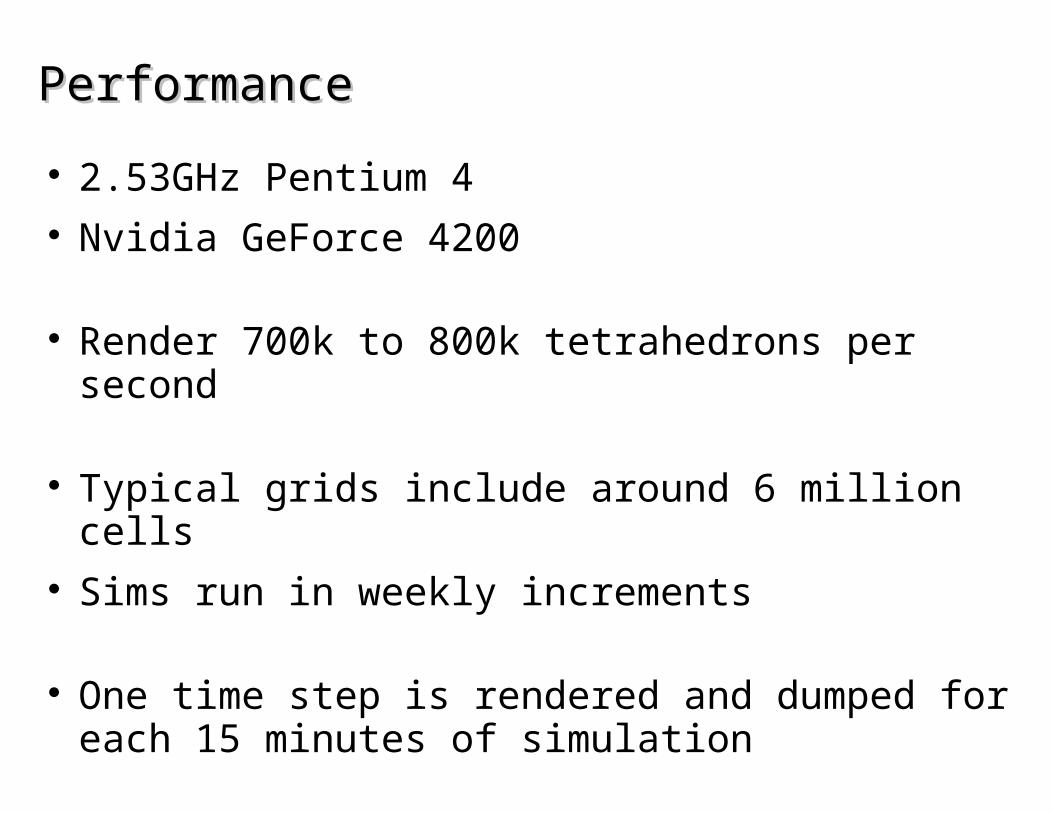
PerformancePerformance
2.53GHz Pentium 4 Nvidia GeForce 4200
Render 700k to 800k tetrahedrons per second
Typical grids include around 6 million cells Sims run in weekly increments
One time step is rendered and dumped for each 15 minutes of simulation
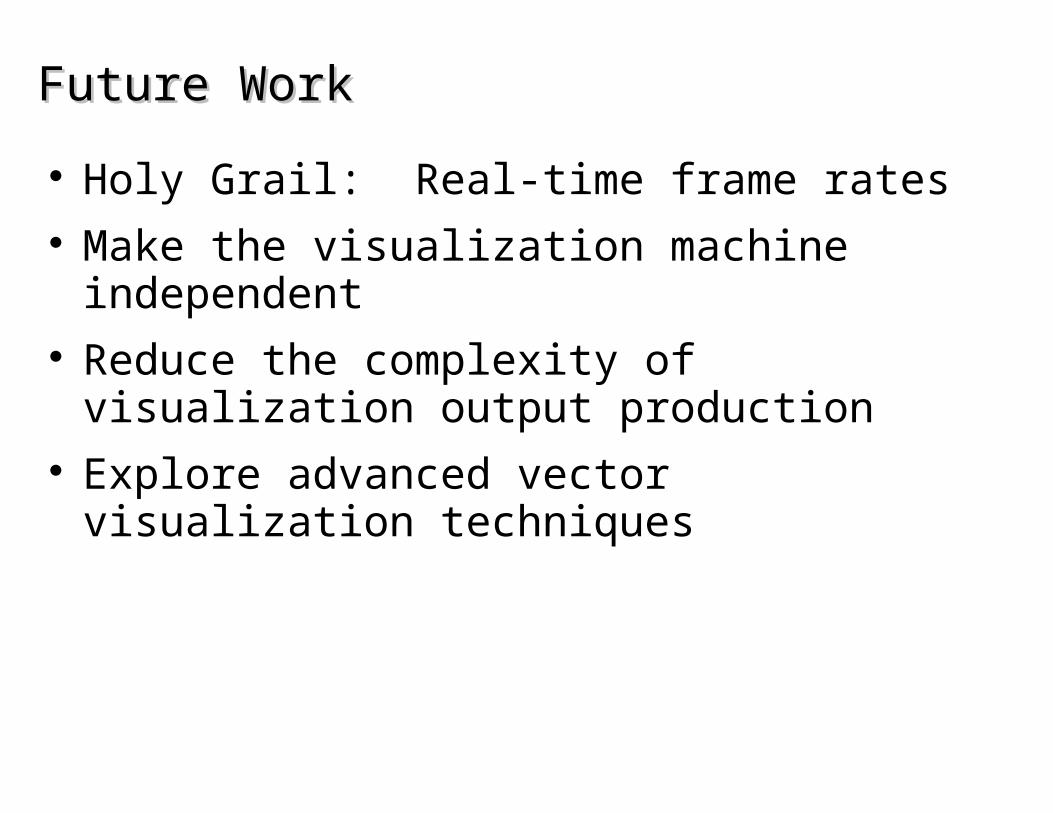
Future WorkFuture Work
Holy Grail: Real-time frame rates Make the visualization machine independent Reduce the complexity of visualization output
production Explore advanced vector visualization techniques

QuestionsQuestions
Could this type of visualization be used for atmospheric data?
Is 3D volumetric rendering worth the cost?
Why is volumetric rendering the right approach here?