visualizing solutions in network analysis with visual basic for applications
TRANSCRIPT

Asia Pacific Management Review (2003) 8(4), 523-543
523
Visualizing solutions in network analysis with visual basic for applications
Larry J. LeBlanc∗
( received October 2003; accepted November 2003 )
Network models have been very useful for analyzing problems involving telecommunica-tions, supply chains, vehicle routing, and other areas. In this paper I discuss the importance of visualization for network optimization. Reasons include explaining the model to non-technical managers and obtaining better solutions for the network model. Better solutions can be a direct result of visualization (when human intuition identifies a solution from the network picture) or an indirect result (when human intuition identifies improved procedures in algorithmic design, which then result in superior solutions). I discuss the importance of Visual Basic for Applica-tions (VBA) for drawing networks directly within Microsoft Excel. I show how to use VBA efficiently to draw these networks using various Excel drawing objects.
Keywords: Visual interactive optimization; Network optimization; Network graphing; Supply chains; Visual Basic for Applications 1. Introduction
Network models are essential for many firms with telecommunication systems, supply chains, vehicle delivery systems, etc. These network models are the basis for analyzing optimal facility locations, flows, and capacities for communications, freight shipments, and vehicle routings. Most large firms have extensive telecommunication requirements as an inherent part of their business. For example, a bank has ongoing remote database queries regarding account-balances, withdrawals and deposits to record, and updates to remote databases such as new customer information and new addresses for existing ones. An insurance company faces similar queries regarding quotes for new customers which require remote data base access. E-mail, file transfers, web-page access, video conferencing and image transfers are other examples. These firms need communication networks with sufficient link capacities (bandwidth) to support their communication requirements. An ongoing important management problem is to find the topology and capacity of the network, i.e., to choose capacity for each possible link, and to find the best routes for data traffic over this network.
∗ Owen Graduate School of Management, Vanderbilt University, 401 21st Avenue South Nashville, TN 37203, Working Paper Number 02-22, July 17, 2002, Revised October 6, 2003, Revised November 26, 2003.

Larry J. LeBlanc
524
A firm’s telecommunications facilities are usually modeled by a net- work whose nodes represent server sites and locations where traffic originates and terminates [13-14, 27-28, 30-33, 41, 46-47]. These include the firm’s own offices and Internet and other access facilities (both dial-up and dedicated access) for vendors and customer sites. Network links represent either phys- ical connections between pairs of locations, or logical connections, i.e., a transmission path. Manufacturers have also realized the importance of effi-cient coordination of their supply chains [5-6, 18-19, 25-26, 34, 45, 48]. This includes forward supply chains (manufacturer to central warehouses to local warehouses to retail stores) and backward supply chains (materials suppliers to the various tiers of vendors to the manufacturer). Supply chain network models use nodes to represent locations (warehouses, vendors and retail stores), and links to represent the flows of materials and information. Similarly, railroad networks are used to determine cost effective routing for locomotives and rail cars, and urban road networks are used to determine efficient routes for vehicles and to predict traffic flows [4, 8-9, 11-12, 17, 29, 35, 38-39, 43-44].
2. Network Optimization
There has been enormous research effort addressed at developing effi- cient algorithms for solving algebraic optimization models for improved design of networks and for routing within a given network. An algebraic optimization model is a quantitative representation of the problem using numbers, variables, equations and inequalities to form the objective function and constraints. 0-1decision variables are often used to model the selection of links and/or nodes to include in the network and (in cases where a single route must be selected) the route to use. Algebraic models are very helpful, but they are abstract and difficult to explain to non-technical managers. In this case, visualizing the network model is helpful for explanation to managers.
Furthermore, it is well known that in many cases large models can- not be solved to exact optimality. In this case, visualization of the network can be valuable directly in the solution process. For example, the telecom- munications network shown at the top of Figure 1 would benefit from adding links (5,6), (6,7), and (7,8), which are currently un-chosen, and simultaneous- ly deleting the much longer link (3,9) which is proposed and chosen. How- ever, deleting link (3,9) and adding any one of the three shorter links individually would not be feasible, since the network would then be un-connected. A pair-wise swap algorithm would fail to realize this; a human observer, however, could guide the algorithm by directing that all three

Larry J. LeBlanc
525
shorter three links be included and link (3,9) be deleted. In cases such as this, human intuition is superior to a computer in combinatorial issues. Obviously, the opposite is true in most other cases involving a combinatorial nature.
The transportation network shown at the bottom of Figure 1 gives a similar example of adding link (6,9) instead of links (5,8), (8,11) and (11,14).
Chosen Link Un-Chosen Link
Figure 1 Intermediate Network Design Solution—Chosen and Un-Chosen
Links
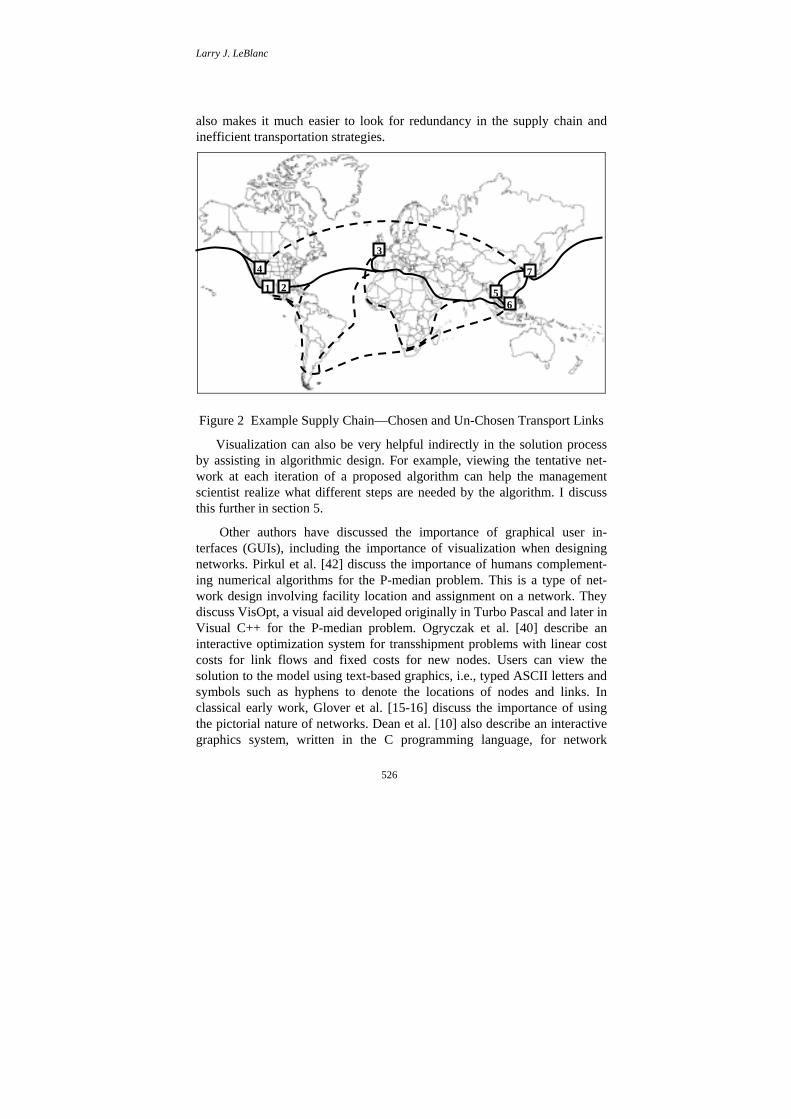
Network visualization is also helpful to supply chain managers when choosing vendors and mode of transportation. For example, Kia Motors sources parts for its Sorento Sport Utility Vehicle from locations as diverse as Wales, Mexico, Malaysia, Thailand, and the U.S. [37] transporting components through the Suez Canal or around the Straits of Malacca. Furthermore, components move through numerous countries before final assembly in South Korea. Visualization (Figure 2) by plotting various manufacturing plants (nodes) and connections makes it much easier and faster to understand changes to this complex supply chain to react to contingencies and ensure a smooth manufacturing operation. Visualization
Riv
er
1
24
3
876
10
11
9
5
1
2 4
3 7
6
5 8
10
11
9
14
13
12
15
17
16
Larry J. LeBlanc
526
also makes it much easier to look for redundancy in the supply chain and inefficient transportation strategies.
Figure 2 Example Supply Chain—Chosen and Un-Chosen Transport Links
Visualization can also be very helpful indirectly in the solution process by assisting in algorithmic design. For example, viewing the tentative net- work at each iteration of a proposed algorithm can help the management scientist realize what different steps are needed by the algorithm. I discuss this further in section 5.
Other authors have discussed the importance of graphical user in- terfaces (GUIs), including the importance of visualization when designing networks. Pirkul et al. [42] discuss the importance of humans complement- ing numerical algorithms for the P-median problem. This is a type of net- work design involving facility location and assignment on a network. They discuss VisOpt, a visual aid developed originally in Turbo Pascal and later in Visual C++ for the P-median problem. Ogryczak et al. [40] describe an interactive optimization system for transshipment problems with linear cost costs for link flows and fixed costs for new nodes. Users can view the solution to the model using text-based graphics, i.e., typed ASCII letters and symbols such as hyphens to denote the locations of nodes and links. In classical early work, Glover et al. [15-16] discuss the importance of using the pictorial nature of networks. Dean et al. [10] also describe an interactive graphics system, written in the C programming language, for network
1 2
3
4
65
7

Larry J. LeBlanc
527
modeling and optimization. Steiger et al. [49] describe a graphical interface for network modeling, which involves a simultaneous display of the model overview and network details for help in model validation. More recently, Kim et al. [23] develop an algorithm for developing trees as an aid to understanding navigational paths in a proxy server.
There is a significant advantage of using customized software develop- ed by the user for his/her specific purpose. This allows the user to highlight certain network links or nodes with various colors depicting different cus- tomer types, etc. Furthermore, developing software in VBA within Excel, with its greater user-friendliness for many analysts than the C programming language, has obvious advantages. Thus, rather than use software for the specific types of problems referred to in the previous paragraph or developed in C, VBA/Excel offers distinct advantages. In the next sections I give an overview of VBA within Microsoft Excel and discuss its application for efficient drawing of networks.
3. Overview of VBA
Microsoft’s Visual Basic for Applications (VBA) is a programming language which is very helpful for management science applications within Microsoft Excel (and Access, PowerPoint and Word). Because VBA’s development environment is integrated into Excel, programmers can easily work with data, viewing intermediate results directly in Excel.
VBA for Excel combines the original BASIC programming language [1-3, 7, 20-22, 36] with new features inherent to Excel, such as those refer- ring to the values and formats for Excel ranges, drawing objects such as lines and textboxes, fields and buttons within custom dialog boxes, cell com- ments, Excel charts, etc. Because VBA is an object-oriented programming language, users can easily manipulate these features within Excel. Further- more, because VBA is integrated into Excel, all of Excel’s functions can be used directly within VBA. For example, rather than use a loop to find the average, maximum, and minimum values of a range of data, VBA can in- voke Excel’s AVERAGE, MAX, and MIN worksheet functions. In cases where one must determine which interval contains a given number, VBA can use the very powerful Excel worksheet functions HLOOKUP or VLOOKUP. An example of this is looking up a given shipment quantity in a shipping rate table with values for 1 – 10 kilos, 10 – 50 kilos, 50 – 100 kilos, etc. In contrast to VBA, Microsoft’s Visual Basic (VB) is a stand-alone application that lacks the efficiency of being able to work directly within Excel. Similarly C++ and FORTRAN lack these advantages of VBA.

Larry J. LeBlanc
528
VBA’s fundamental control logic, shown in Figure 3, consists of Subroutine definition and Ending statements, Dimension statements to de- clare variable types, statements for assigning values to variables, For…Next loops, If Then Else logic, GoTo statements, and statement labels.
4. VBA for Drawing Networks
Networks can be drawn very efficiently using VBA in Excel by using standard Excel generated drawing objects. The network nodes can be represented using geometric shapes such as rectangles, ovals, or textboxes, using embedded text to identify the node. Links can be represented using straight lines. The logic for drawing a network, either the final result or an intermediate solution from a network design algorithm, has three fundament- al steps:
i. Initialize For each node, read the X and Y coordinates, traffic de- mand, type of node, etc.
ii. Draw Nodes1 Add a drawing object such as a textbox or circle representing each node at the corresponding coordinates.
iii. Draw Links For each link (i, j), draw a line from the tail node i to the head node j.
When drawing the nodes, the symbol representing node i can contain the number i or the name of node i for identification purposes. Different symbols or colors or border widths can be used to represent different types of nodes, such as supply vs. demand vs. transshipment points in a supply chain network and company offices vs. client sites in a telecommunications network. When plotting links, different line thicknesses or styles (solid, dashed, dotted) can be used to represent the amount of flow on the link or the type of link (high speed vs. low speed).
Figure 4 shows a completed network created using VBA code with textboxes to represent nodes. Using this figure as a reference, I show how to build a network with VBA for Excel using drawing objects. Although this example has only 20 nodes for simplicity, I have used the code to draw much larger networks. I discuss this in Appendix B.
1 A “Delete” step can be inserted between “Initialize” and “Draw Nodes” to delete any existing network drawing before a new network is drawn. The details of this operation are given in Appendix A.

Larry J. LeBlanc
529
Sub Demo()
Dim NodeFlow(2000) As Integer
Nodes = ActiveSheet.Range(“B3”).Value If Nodes > 2000 Then MsgBox (“There are too many nodes to process”) GoTo MyLabel End If If Nodes > 1500 Then MsgBox (“Long processing due to number of nodes”) For i = 1 To Nodes
.
. Next i .
. MyLabel: MsgBox (“Aborting Execution”) End Sub
Figure 3 Common VBA Statements
Define the beginning of a new subroutine
Single line If statement has no “End If” statement
Multiple line If statement needs “End If”
Begin a loop for i = 1, 2, 3, …, Nodes
Jump to statement labeled “MyLabel”
Define the end of the current subroutine
Assign the value of the VBA variable “Nodes” to equal the value in cell B3
Dimension the array “NodeFlow” with 2,000 integer entries
Inform the Excel user with a message (dialog) box

Larry J. LeBlanc
530
Figure 4 Excel Worksheet with Node Data and Corresponding Network
4.1 Initialization
The first step is to save the coordinates of each node. These will be used to identify the locations, in points, of the upper left corners of the text-boxes that represent the nodes. In Excel, there are 72 points per inch (ap-proximately 28 points per centimeter) for drawing objects when they are printed. Figure 5A shows that the origin of the coordinates is at the upper left corner of the first cell in the Excel window. Thus, to move a node lower on the screen, its Y-axis coordinate is increased. This is in contrast with con- ventional axes (Figure 5B) in which decreasing the Y-axis coordinate lowers the node.
A: Excel Coordinates B: Traditional Coordinates
Figure 5 X-Y Coordinates
X-Axis Coordinates
Y-A
xis C
oord
inat
es

Larry J. LeBlanc
531
In Figure 4, the Excel range C2:G21 contains the node names, coordi-nates, and the other nodes that each node is connected to. In the VBA code shown below, these coordinates are stored in the array variables XCoord() and YCoord(). These arrays are initially Dimensioned as single precision with unknown size (a “dynamic array”). In the next step, the actual number of nodes to be drawn is determined, and only then is the size of these arrays specified. The VBA variable “Nodes” represents the number of nodes and therefore textboxes in the network. This variable, which in this case equals 20, is initialized in VBA from cell A2. After determining this number of nodes, the sizes of the array variables are ReDimensioned to allow storing data for each node. In Figure 4, columns D – G contain the node names, coordinates, and connected nodes, respectively. A For…Next loop is used to input this data for each node in the Excel range, storing them in the appropriate arrays.
'Dimension these as arrays of unknown size. "Single" means single precision: Dim XCoord() As Single, YCoord() As Single, ToNode() As Single Dim BoxWidth() As Single, BoxHeight() As Single, NodeName() As String 'Read the number of nodes from A2 in Excel; re-dimension each array to this size: Nodes = ActiveSheet.Range("A2").Value ReDim XCoord(Nodes), YCoord(Nodes), ToNode(Nodes), BoxHeight(Nodes) ReDim BoxWidth(Nodes), NodeName(Nodes) 'Read the node names, coordinates, and connections to other nodes from D1...: For i = 1 To Nodes NodeName(i) = ActiveSheet.Range("D1") .Offset(i, 0).Value XCoord(i) = ActiveSheet.Range("E1") .Offset(i, 0).Value YCoord(i) = ActiveSheet.Range("F1") .Offset(i, 0).Value ToNode(i) = ActiveSheet.Range("G1") .Offset(i, 0).Value Next i
4.2 Draw Nodes Using TextBoxes
Using the stored X and Y coordinate values, each node’s textbox can be created and located on the Excel worksheet. This is done using the following VBA commands embedded in a For…Next Loop.
“Offset” by i rows and no columns from cell G1

Larry J. LeBlanc
532
'Place textboxes representing nodes. Upper left coordinates are (XCoord, YCoord): For i = 1 To Nodes ActiveSheet.TextBoxes.Add(XCoord(i), YCoord(i), 1, 1).Select Selection.Characters.Text= NodeName(i) 'Put the name of node i in the ith textbox Selection.HorizontalAlignment = xlCenter 'Center the name in the textbox Selection.AutoSize = True 'Size the textbox to fit the text BoxHeight(i) = Selection.Height 'Store box height and width for later BoxWidth(i) = Selection.Width 'centering of links Next i
The “Add” method requires the X-axis and Y-axis coordinates, as well as the width and height dimensions of the textbox. The width and height of the textbox can be set to any number (1 in the code above), since they will be automatically adjusted later to the number of characters contained in it using the “Autosize” method.
4.3 Draw Links Using Lines
Adding lines for each link also requires the X- and Y-axis coordinates for both the beginning and ending of the line. This is also accomplished using the “Add” method. Because the lines are the last objects added they will appear of top of each textbox. For cosmetic reasons, it is desirable to place them behind the textboxes, as shown in Figure 6. These lines can be placed behind each textbox by using the ZOrder method with the attribute, “msoSendToBack.” 'Place the lines representing the links: For i = 1 To Nodes j = ToNode(i) 'The line points from node i to node j If j = 0 Then GoTo SkipNode
'Plot line from CENTER of boxes, so offset by half the height and width: ActiveSheet.Lines.Add(XCoord(i) + BoxWidth(i)/2, YCoord(i) + BoxHeight(i)/2, _ XCoord(j) + BoxWidth(j)/2, YCoord(j) + BoxHeight(j)/2)_ .Select Selection.ShapeRange.Line.Weight = 2 'Make the line thick Selection.ShapeRange.ZOrder msoSendToBack 'Put the line behind the textboxes SkipNode: Next i
Textbox width and height = any number. They will be reset using “AutoSize.”
“SkipNode” is the label shown below

Larry J. LeBlanc
533
Figure 6 Link Connecting Nodes—In Front vs. Behind Nodes
The execution of these commands produces the network in Figure 4, which is a visual representation of the node coordinates and connecting links shown in the worksheet range C2:G21. The completed VBA code is sum- marized in Appendix C.
Most programmers object to excessive use of “go to” statements, and some programmers object to any use at all of this statement. In my opinion, however, occasional use of these statements is perfectly acceptable. For readers wishing to avoid these statements, the line:
If j = 0 Then GoTo SkipNode
can be replaced with:
If j <> 0 Then
'Plot line from CENTER of boxes, so offset by half the height and width:
ActiveSheet.Lines.Add (etc.—continue with logic above)
End If
5. Visualization for Use in Algorithm Design
I illustrate the importance of visualization with an example of design- ing an algorithm for optimizing telecommunication virtual private networks (VPNs). These are used for secure communication of voice, data, digital im- ages, and video, etc. among various corporate offices, remote employees, key vendors, and customers. In [41], my co-authors and I developed an optimization model for the problem of VPN design using a combination of 1) leased lines and 2) switched multi-megabit data services (SMDS). With SMDS, data packets are inserted into the network without specifying a path just like letters get dropped off at a post office. We showed that substantial cost savings are possible by exploiting the difference between the two services with respect to their required network topologies, available link band-widths, and tariff structures.
In the optimization model, node 0 represents the SMDS service, and
White Bridge
WoodmontWoodmont
White Bridge
Larry J. LeBlanc
534
nodes 1, 2,…, n each represent a company or partner office site (called a network node). The communication demand at each network node is a given constant. The model has variables denoted by Flowi0 and Flowij. These respectively denote the one-way flow inserted into the SMDS system at each node i and the two-way flow on leased lines between nodes i and j. The model is denoted by Problem P:
)(
)(
,
0
ijij
jinodesnetwork
inodesnetwork
i
FlowostLeaseLineC
FlowSMDSCostMINIMIZE
∑
∑ +
The first term in the objective function is the cost of SMDS services from each node i. Of course, this cost depends on the total number of packets or bytes inserted at node i, Flowi0. The second term is the cost of leased lines between each pair of nodes i and j, which also depends on the flow that the line must accommodate. Constraints (which I do not show here) use 0-1 variables to require that each node must be connected either directly to the SMDS node or to another network node. Additional constraints are conservation of flow at the network nodes. This problem is known to be NP-Complete, and so it cannot normally be solved to optimality.
In [41], we developed a dedicated simulated annealing (SA) technique for solving Problem P. SA is a generic heuristic algorithm for solving dis- crete optimization models [24, 32]. The SA algorithm makes random changes to a small number of variables in a current solution to obtain a neighbor solution. If the neighbor has improved objective function value, it becomes the new current solution for the next iteration. Even if the neighbor has worse objective function value, it becomes the new current solution with a certain probability. The reason for occasionally accepting worse solutions is that the chance of getting stuck at a local optimum is decreased. If SA begins to converge to a non-optimal solution, subsequent random moves can lead to another solution from which SA can converge to the optimal solution.
We developed the five annealing types shown in Figure 8. At each SA iteration, one of these annealing types is randomly chosen, so each annealing type is typically used many times for each problem. However, when design- ing the SA algorithm’s moves shown in Figure 8, we did not have the benefit of drawing for visualization. If we had been able to visualize the intermed-

Larry J. LeBlanc
535
iate solutions obtained by SA, our algorithmic development time would have been much faster. For example, Figure 7A shows a possible final solution obtained by SA using only the first three annealing types shown in Figure 8. From Figure 7B, nodes 8 – 11, it is clear that annealing type 4 would result in an improved solution.
Figure 9 shows the excellent solution that we were able to obtain for a different telecommunication problem—access network design [43]. We attribute the success of our algorithmic development for the model for this problem to the use of visualization of the network at the intermediate iterations of the simulated annealing algorithm.
A: Solution Without Annealing Type 4 B: Improved Solution from Annealing Type 4
Figure 7 Network Solutions from Simulated Annealing
Type Before Annealing After Annealing Type Before Annealing After Annealing
1
4
2
5
3
Figure 8 Annealing Types for Access Network Design Problem
SMDS
1
234
5
6
7
8
910
11
1213
14 151
234
5
6
7
8
910
11
1213
14 15
SMDS
SMDS
SMDS
SMDS SMDS
SMDS
SMDS
SMDS
SMDS
SMDS
SMDS

Larry J. LeBlanc
536
6. Conclusions
Network models are useful for many different application areas, yet they can be difficult to solve to exact optimality. For this reason, visuali-zation is a very valuable tool for obtaining solutions and for explaining the model to non-technical managers. Visual Basic for Applications within Microsoft Excel has features which make it ideal software for drawing such networks for visualization of the process. I have shown how to use these features efficiently for such purposes.
A. Starting Cluster Solution (Switch B. Final Solution Connections Suppressed for Clarity)
Figure 9 Starting and Final Solution from Simulated Annealing Algorithm for Typical Telecommunication Access Design Problem
12
3
4
5
6
7
8
910
11
12
13
14
15
16
17
18
19
20
21
22
23
24
25
26
27
28
29
30
31
32
33
34
35
36
37
38
39
40
41
42
43
44
45
46
47
48
4950 1
2
3
4
5
6
7
8
910
11
12
13
14
15
16
17
18
19
20
21
22
23
24
25
26
27
28
29
30
31
32
33
34
35
36
37
38
39
40
41
42
43
44
45
46
47
48
4950
Switch node Client node Open ADM node Closed ADM node

Larry J. LeBlanc
537
References
[1]. Albright, S. 2001. VBA for Modelers. Duxbury Thomson Learning, Pacific Grove.
[2]. The basic programming language, http://www.engin.umd.umich.edu/CIS/course.des/cis400/basic/basic.html
[3]. Basic programming language, http://www.wikipedia.com/wiki/BASIC. [4]. Boyce, D., B. Ran, L. LeBlanc. 1995. Solving an instantaneous dyna-
mic user-optimal route choice model. Transportation Science 29(2) 128-142.
[5]. Cohen, M., A. Huchzermeier. 1999. Global supply chain management: A survey of research and applications. In S. Tayur, M. Magazine and R. Ganeshan (eds.). Quantitative Models for Supply Chain Management 669-702.
[6]. Copacino, W. 1997. Supply Chain Management: The Basics and Beyond. St. Lucie Press, Falls Creek.
[7]. Cummings, S. 1999. VBA for Dummies. IDG Books Worldwide, Foster City, CA.
[8]. Dafermos, S. 1972. The traffic assignment problem for multi-user transportation networks. Transportation Science 6 73 – 87.
[9]. Danganzo, C., Y. Sheffi. 1977. On stochastic models of traffic assign- ment. Transportation Science 11 253-274.
[10]. Dean, N., M. Mevenkamp, C. Monma. 1992. NETPAD: An interactive graphics system for network modeling and optimization. Computer Science and Operations Research 231-243.
[11]. Florian, M. 2000. Environmental networks: A framework for economic decision-making and policy analysis. Journal of Regional Science. Heightstown.
[12]. Friesz, T. 1981. An equivalent optimization problem for combined multi-class distribution, assignment and modal split which obviates symmetry restrictions. Transportation Research 15B 361-369.
[13]. Gavish, B. 1982. Topological design of centralized computer networks—Formulations and algorithms. Networks 12(4) 355 – 77.
[14]. ______. 1991. Topological design of telecommunication networks—Local access design methods. Annals of Operations Research 33(1-4) 17 – 71.
[15]. Glover, F., J. Hultz, D. Klingman. 1978. Improved computer-based planning techniques, Part I. Interfaces 8(4) 16-25.
[16]. ______, D. Klingman, C. McMillan. 1977. The NETFORM concept: A

Larry J. LeBlanc
538
more effective model form and solution procedure for large scale non- linear problems. Annual Proceedings of the ACM. October. 16-19 283-89.
[17]. Han, S., Y. Tabata. 2002. A hybrid genetic algorithm for the vehicle routing problem with controlling lethal gene. Asia Pacific Management Review 7(3) 405-426.
[18]. Handfield, R., E. Nichols. 1998. Introduction to Supply Chain Management Prentice Hall, New York.
[19]. Hill, J., D. Dilts, L. LeBlanc. 2002. Issues with information sharing in a supply chain: The impact of customer-variable orders. Working Paper, Owen Graduate School of Management, Vanderbilt University. 401, 21st Ave. South Nashville, TN 37203 USA.
[20]. http://msdn.microsoft.com/vba/ [21]. http://support.microsoft.com/default.aspx?scid=/support/excel/content/
vba101/default.asp (Excel for Windows Visual Basic for Applications 101)
[22]. http://www.microsoft.com/MSPress/books/5163.asp (Microsoft® Excel 2002 Visual Basic® for Applications Step by Step)
[23]. Kim, Y., B. Yum. 2002. Identification of navigational paths of users routed through proxy servers for web usage mining. Asia Pacific Management Review 7(4) 499-512.
[24]. Kirkpatrick, S., C. Gelatt, M. Vecchi. 1983. Optimization by simulated annealing. Science 220 671-680.
[25]. Kouvelis, P. 1999. Global sourcing strategies under exchange rate un- certainty. In S. Tayur, M. Magazine, and R. Ganeshan (Eds.). Quantita- tive Models for Supply Chain Management 625-668. Kluwer Academic Publishers, Boston.
[26]. Kuei, C., C. Madu. 2001. Identifying critical success factors for supply chain quality management (SCQM). Asia Pacific Management Review 6(4) 409-423.
[27]. LeBlanc, L. 1990. Design and operation of packet-switched networks with uncertain message requirements. IEEE Transactions on Commun- ications 38 (8) 1223-1230.
[28]. ______, J. Harder. 1994. Optimization models for design and routing in wide-area data-communication networks. Studies in Locational Analy- sis, Special Issue on Network Design 6 3-18.
[29]. ______, E. Morlok, W. Pierskalla. 1975. An efficient approach to solv- ing the road network equilibrium traffic assignment problem. Transportation Research 9 309-318.
[30]. ______, S. Narasimhan. 1994. Topological expansion of metropolitan

Larry J. LeBlanc
539
area networks. Computer Networks and ISDN Systems 26 1235-1248. [31]. ______, S. Narasimhan, B. Ran. 2002. Planning models for wide-area
communication network design with response-time-dependent offered traffic. Information Technology and Management 3(3) 229-245.
[32]. ______, J. Park, S. Narasimhan, J. Kalvenes. 1996. Topology design and bridge-capacity assignment for interconnecting token ring LANs: A simulated annealing approach. Telecommunication Systems 6 21-43.
[33]. ______, R. Simmons. 1989. Continuous models for capacity design of large packet-switched telecommunication networks. ORSA Journal of Computing 1(4) 271-286.
[34]. Lee, H., S. Whang. 1999. Decentralized multi-echelon supply chains: Incentives and information. Management Science 45(5) 633-640.
[35]. Mahmassani, H., S. Peeta, T. Hu, A. Ziliaskopoulos. 1993. Dynamic traffic assignment with multiple user classes for real-time ATIS/ATMS applications. Large Urban Systems: Proceedings of the Advanced Traffic Management Conference. S. Yagar and A. Santiago, eds. Federal Highway Administration, US Department of Transportation, Washington, DC 91-114.
[36]. Mashaw, B. 1985. Basic. Mayfield Publishing Company, London. [37]. McBride, S. 2003. Kia’s audacious Sorento plan—foreign parts—and
some careful planning—go into Korean car. Wall Street Journal A12. [38]. Nagurney, A. 1993. Network Economics: A Variational Inequality
Approach. Kluwer Academic Publishers, Norwell. [39]. Nguyen, S. 1974. An algorithm for the traffic assignment problem.
Transportation Science 8 203-216. [40]. Ogryczak, W., K. Studzinski, K. Zorychta. 1992. EDINET – A Network
Editor for Transshipment Problems with Facility Location 197-212, Exeter.
[41]. Park, J., L. LeBlanc, B. Lim. 2002. Network design using SMDS and leased lines. Telecommunication Systems 20 (1-2) 151-162.
[42]. Pirkul, H., R. Gupta, E. Rolland. 1999. VisOpt: A visual interactive optimization tool for p-median problems. Decision Support Systems 26 209-223.
[43]. Ran, B., D. Boyce, L. LeBlanc. 1993. A new class of instantaneous dy- namic user-optimal traffic assignment models. Operations Research 41 (1) 192-202.
[44]. Sheffi, Y. 1985. Urban transportation networks. Prentice-Hall, Engle- wood Cliffs, New Jersey.
[45]. Simchi-Levi, D., P. Kaminsky, E. Simchi-Levi. 1998. Designing and Managing the Supply Chain. Irwin/McGraw-Hill, New York.

Larry J. LeBlanc
540
[46]. Soni, S., S. Narasimhan, L. LeBlanc. Access network design with reli- ability constraints. Submitted to IEEE Transactions on Reliability.
[47]. Sridhar, V., J. Park. 2000. Benders-and-cut algorithm for fixed-charge capacitated network design problems. European Journal of Operational Research 125(3) 622-632.
[48]. Srinivasan, K., S. Kekre, T. Mukhopadhyay. 1994. Impact of electronic data interchange technology on JIT shipments. Management Science 40(10) 1291-1304.
[49]. Steiger, D., R. Sharda, B. LeClaire. 1992. Functional Description of a Graph-Based Interface for Network Modeling (GIN). Computer Science and Operations Research 213-229. Exeter.

Larry J. LeBlanc
541
Appendix A—Details of “Delete” Operation
Deleting the drawing an existing network is best accomplished using the “Name” property of each “Shape” object in the Excel worksheet. The system-generated names for buttons, textboxes and straight lines begin with “Button”, “Text” and “Line,” respectively. Using a For…Each loop to scroll through all shapes in the worksheet allows you to decide whether or not to delete each one. This is done using an If…Then conditional statement as seen in the code below. The VBA variable “MyShape” can be any user defined index for the loop. The function “Left(MyShape.Name, 6),” which returns the first 6 characters of the text, is used to identify whether or not the object is a button for running the VBA code. This will prevent the button for running the VBA code from being deleted along with all the other shapes. For Each MyShape In ActiveSheet.Shapes If Left(MyShape.Name, 6) <> "Button" Then MyShape.Delete Next MyShape
Appendix B—Solution Times for Different Size Networks
I tested the VBA for drawing random networks with number of nodes ranging from 500 to 5,000. Elapsed times on a 1.8 GHz PC are shown in the figure below. The “detail” times shown include times for centering text in the textboxes and auto-sizing the textboxes, as discussed in section 4.2. The times “Time 1” omit these steps and are approximately half of the detailed times.
<> means not equal.
500
1,00
0
2,00
0
3,00
0
4,00
0
5,00
0
0:00
1:00
2:00
3:00
4:00
5:00
6:00
Elap
sed T
ime
Number of Nodes
Elapsed Time to Graph Network (MM:SS)
Time 1 Time 2( Detail)

Larry J. LeBlanc
542
Appendix C—Complete Draw-Network VBA Routine
Sub DrawNetwork() 'Dimension these as arrays of unknown size. "Single" means single precision: Dim XCoord() As Single, YCoord() As Single, ToNode() As Single Dim BoxWidth() As Single, BoxHeight() As Single, NodeName() As String 'Read the number of nodes from A2 in Excel; re-dimension each array to this size: Nodes = ActiveSheet.Range("A2").Value ReDim XCoord(Nodes), YCoord(Nodes), ToNode(Nodes), BoxHeight(Nodes) ReDim BoxWidth(Nodes), NodeName(Nodes) 'Read the node names, coordinates, and connections to other nodes from D1...: For i = 1 To Nodes NodeName(i) = ActiveSheet.Range("D1"). Offset(i, 0).Value XCoord(i) = ActiveSheet.Range("E1"). Offset(i, 0).Value YCoord(i) = ActiveSheet.Range("F1"). Offset(i, 0).Value ToNode(i) = ActiveSheet.Range("G1"). Offset(i, 0).Value Next i 'Delete any existing network (textboxes & lines) but not the VBA button: For Each MyShape In ActiveSheet.Shapes If Left(MyShape.Name, 6) <> "Button" Then MyShape.Delete Next MyShape 'Place textboxes representing nodes at coordinates (XCoord, YCoord): For i = 1 To Nodes ActiveSheet.TextBoxes.Add(XCoord(i), YCoord(i), 1, 1).Select Selection.Characters.Text = NodeName(i) 'Put node i name in ith textbox Selection.HorizontalAlignment = xlCenter 'Center the text in textbox Selection.AutoSize = True 'Size the textbox to fit the text BoxHeight(i) = Selection.Height 'Store box height and width for BoxWidth(i) = Selection.Width 'later centering of links Next i 'Place the lines representing the links: For i = 1 To Nodes j = ToNode(i) 'The line points from node i to node j If j = 0 Then GoTo SkipNode
“SkipNode” is the label shown below
“Offset” by i rows and no columns from cell G1
Text box width and height = any number (reset later using “AutoSize.”)

Larry J. LeBlanc
543
'Plot line from CENTER of boxes, so offset by half the height and width: ActiveSheet.Lines.Add(XCoord(i) + BoxWidth(i)/2, YCoord(i) + BoxHeight(i)/2,_ XCoord(j)+ BoxWidth(j)/2, YCoord(j)+ BoxHeight(j)/2)_ .Select Selection.ShapeRange.Line.Weight = 2 'Make the line thick Selection.ShapeRange.ZOrder msoSendToBack 'Put line behind textbox SkipNode: Next i End Sub