visualizing relations in hierarchical data presented by soha makady 1
TRANSCRIPT

Visualizing Relationsin Hierarchical Data
Presented by
Soha Makady
1

Problem?• Dataset examples:
– A text book• Hierarchy: Book, chapters, sections, paragraphs,
…etc.• Relation: A section can be a pre-requisite for
understanding another section
– A software system:• Hierarchy: System, packages, classes, methods• Relations: inheritance, method calls …etc.
• How to visualize hierarchical and non-hierarchical relations in ONE visualization?
2

ArcTrees: Visualizing Relations in Hierarchical DataP. Neumann, S. Schlechtweg, S. Carpendale.
Proceedings of Eurographics, IEEE VGTC Symposium on Visualization (EuroVis2005)
3

ArcTrees – Basic Idea• Designed for viewing digital media• Represents the hierarchical structure by a
spanning tree• Represents the non-hierarchical relations by
edges/arcs• Play video*
4* Available from: http://innovis.cpsc.ucalgary.ca/Research/ArcTrees
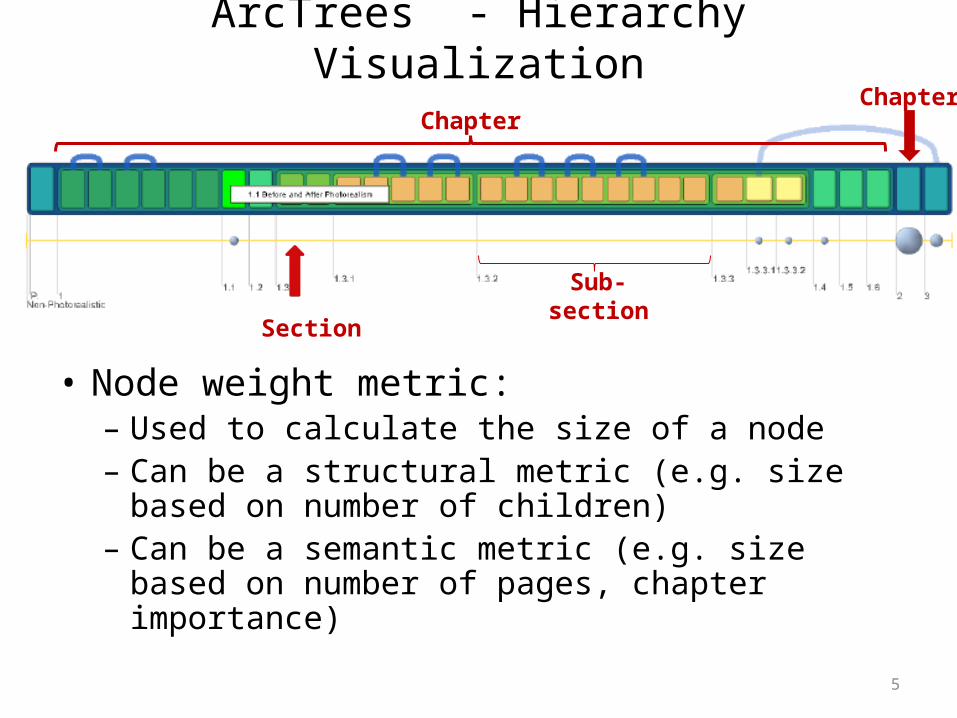
ArcTrees - Hierarchy Visualization
• Node weight metric:– Used to calculate the size of a node– Can be a structural metric (e.g. size based on number
of children)– Can be a semantic metric (e.g. size based on number of
pages, chapter importance)
5
ChapterChapter
SectionSub-section

ArcTrees - Hierarchy Visualization
• Color coding:– Clarifies the different levels in the hierarchy
6

ArcTrees - Relations Visualization
• Arcs are controlled in height to better utilize space• Transparent arcs connect collapsed nodes
7
Node1
Node3
Node2 (Expanded)

ArcTrees - Relations Visualization
• Arc weight metric:– Used to calculate the width of an arc– Can be structural or semantic– The width can indicate many relations between two nodes
8

ArcTrees – Interaction – Zoom & Filter
9

ArcTrees – Interaction – Focus + Context
• Glyph:– Indicates hidden relations– The diameter stands for the number of hidden
relations
10
Several connections
Glyph
Click on arc

ArcTrees – Interaction – Focus + Context
11Hidden relations within Ch(16) of Glyph
Expanded relations between Ch 15 & 16

ArcTrees in Acrobat Reader
12

Hierarchical Edge Bundles:
Visualization of Adjacency Relations in Hierarchical DataDanny Holten
InfoVis06, 2006
13

Hierarchical Edge Bundles
• Augments existing tree visualizations• Based on bundling the relations’ edges hence
reducing visual clutter
14

Relations within a Radial Layout
• Visualizes a call graph in a software system (caller in green, callee in red)
• Shows sparsely connected systems15

Bundling Strength
16
Shows node-to-node connectivity
Bundles reduce visual clutter
Shows implicit relations between parents

Bundle-based Interaction
17
User can inspect individual curves

Other Hierarchical Representations?
• Works for radial layout, balloon layout and treemaps
18

ArcTrees
Advantages• Edge crossing reduced (by arc
width)• Visual clutter reduced by
opacity• Uses little screen space• Clear
Limitations• Is it generic?• Scaling for large hierarchies?• Can it show patterns?• Can we follow paths?
19
Hierarchical Bundles
Advantages
• Visual clutter reduced
• It is generic
• It can show patterns of sparse/dense data
Limitations
• Bundles lead to losing information about edges’ numbers/weight/structure
• Ambiguous
• Can we follow paths?

Related Work: I. Software Landscapes*
20
Package(s)
Class
* M. Balzer et al., Software Landscapes: Visualizing the Structure of Large Software Systems. In Proc. Eurographics 2004, IEEE

Related Work: I. Software Landscapes*
* M. Balzer et al., Software Landscapes: Visualizing the Structure of Large Software Systems. In Proc. Eurographics 2004, IEEE
21
Relation(s)
• Occlusion?• Ambiguity?

Related Work – II. TimeRadarTrees*
* M. Burch and S. Diehl, TimeRadarTrees: Visualizing Dynamic Compound Digraphs. In Proc EuroVis2008
22
Edge 3
Edge 2
Edge 1
Edge 2
Edge 3
Edge 1

Related Work – TimeRadarTrees*
* M. Burch and S. Diehl, TimeRadarTrees: Visualizing Dynamic Compound Digraphs. In Proc EuroVis2008 23

TimeRadarTrees*
24
• Eliminates edge crossing• Readability?

My Project: Methods call graphs• Hierarchical relationships:
– Packages, classes, methods
• Non-hierarchical relationships:– Method calls (m1 calls m2 calls m3 …)
• Can I use ArcTrees? (Bundles … No way!)
• Call graph may include repeated branches
25
mx()
ma() me()md()
mg()mb() ma()
mb()

Using Nested Treemapsm1
m2
m3
m4
m5
m6
m7
ma
mb
mc
md me
m1
m4
m5
m6
m7
m4
m5
m5
m5
m5
ma
mb
md me
m1
m4
m5
m6
m7
m1
m2
m3
m1
m2
m3
mb
mc
ma
mb
md
m1
m4
m5
m6
m7
mb
mc
md me
md me
Package 1
Package 2Package 3
Package 4
Package 5
class1
class2
class3
class5
class6
class7
class8
class9class10
class8class7
class5class14

Click on a method to find affected methodsm1
m2
m3
m4
m5
m6
m7
ma
mb
mc
md me
m1
m4
m5
m6
m7
m4
m5
m5
m5
m5
ma
mb
md me
m1
m4
m5
m6
m7
m1
m2
m3
m1
m2
m3
mb
mc
ma
mb
md
m1
m4
m5
m6
m7
mb
mc
md me
md me
Package 1
Package 3
Package 4
Package 5
class1
class2
class3 class5
class6
class7
class8
class9class10
class8class7
class5class14
Legend
Direct
Level 2 to 4
Lowerthan 4
Package 2
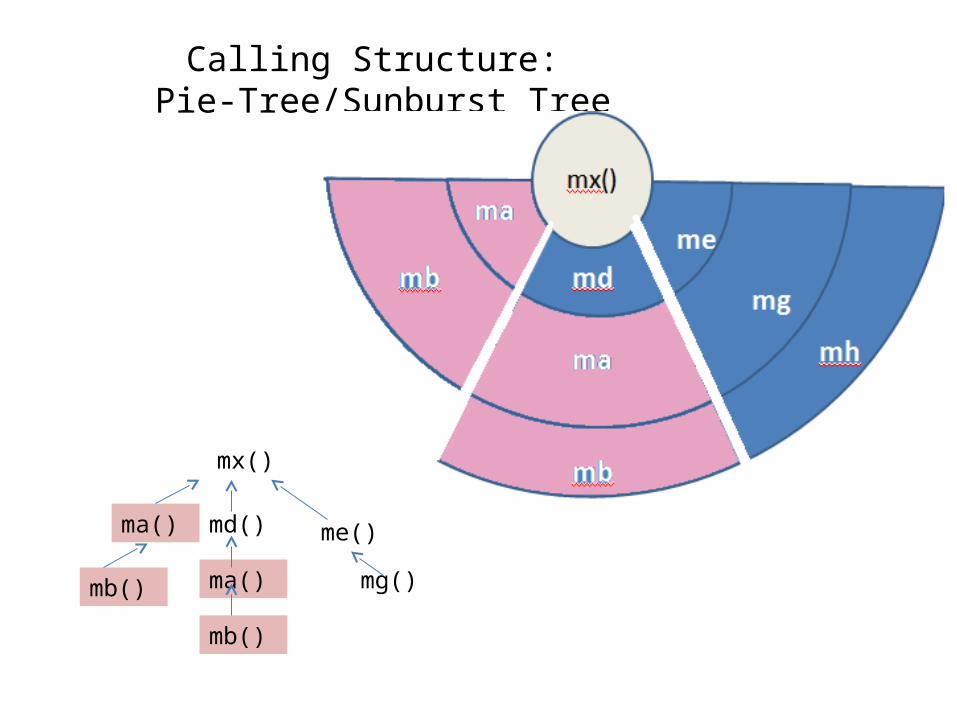
Calling Structure: Pie-Tree/Sunburst Tree
mx()
ma() me()md()
mg()mb() ma()
mb()
mg