visualize rna with single-molecule sensitivity and … rna with single-molecule sensitivity and...
TRANSCRIPT
ViewRNA® ISH Cell AssaysVisualize RNA with single-molecule sensitivity and single-cell resolution
ViewRNA ISH Cell Assays have the sensitivity and robustness
to directly detect single RNA molecules at single-cell
resolution and quantify gene expression. The assay employs
a proprietary fluorescent in situ hybridization (FISH) and
sequential branched-DNA (bDNA) amplification technique,
using independent but compatible signal amplification systems
to enable simultaneous detection of up to four RNA transcripts
in single cells using a standard epifluorescence microscope or
high-content imager.
Analyze sample heterogeneity
Study non-coding RNAs, including miRNA
and lncRNA, at the single-cell level
Track, visualize, and detect genomic viral RNA
High-throughput single-cell quantitation
and imaging of four RNA targets
excellence
2
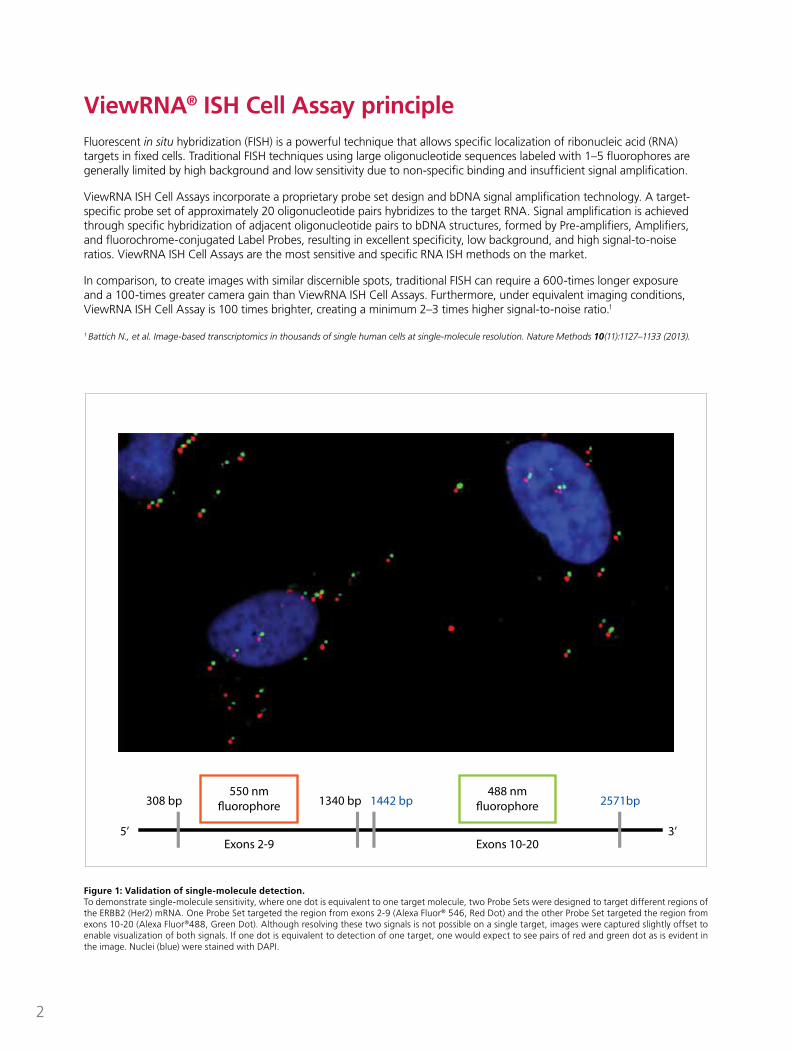
Figure 1: Validation of single-molecule detection.To demonstrate single-molecule sensitivity, where one dot is equivalent to one target molecule, two Probe Sets were designed to target different regions of the ERBB2 (Her2) mRNA. One Probe Set targeted the region from exons 2-9 (Alexa Fluor® 546, Red Dot) and the other Probe Set targeted the region from exons 10-20 (Alexa Fluor®488, Green Dot). Although resolving these two signals is not possible on a single target, images were captured slightly offset to enable visualization of both signals. If one dot is equivalent to detection of one target, one would expect to see pairs of red and green dot as is evident in the image. Nuclei (blue) were stained with DAPI.
5’ 3’
308 bp 1340 bp 1442 bp 2571bp550 nm
�uorophore
Exons 2-9
488 nm�uorophore
Exons 10-20
ViewRNA® ISH Cell Assay principle Fluorescent in situ hybridization (FISH) is a powerful technique that allows specific localization of ribonucleic acid (RNA) targets in fixed cells. Traditional FISH techniques using large oligonucleotide sequences labeled with 1–5 fluorophores are generally limited by high background and low sensitivity due to non-specific binding and insufficient signal amplification.
ViewRNA ISH Cell Assays incorporate a proprietary probe set design and bDNA signal amplification technology. A target-specific probe set of approximately 20 oligonucleotide pairs hybridizes to the target RNA. Signal amplification is achieved through specific hybridization of adjacent oligonucleotide pairs to bDNA structures, formed by Pre-amplifiers, Amplifiers, and fluorochrome-conjugated Label Probes, resulting in excellent specificity, low background, and high signal-to-noise ratios. ViewRNA ISH Cell Assays are the most sensitive and specific RNA ISH methods on the market.
In comparison, to create images with similar discernible spots, traditional FISH can require a 600-times longer exposure and a 100-times greater camera gain than ViewRNA ISH Cell Assays. Furthermore, under equivalent imaging conditions, ViewRNA ISH Cell Assay is 100 times brighter, creating a minimum 2–3 times higher signal-to-noise ratio.1
1 Battich N., et al. Image-based transcriptomics in thousands of single human cells at single-molecule resolution. Nature Methods 10(11):1127–1133 (2013).
3
Key benefits n Simultaneous analysis of up to four target RNAs per cell
n Single-copy sensitivity at single-cell resolution
n Ability to design probe sets for any RNA target
n Robust results in adherent or suspension cells
n One-day assay
ViewRNA® formats and specifications
mRNA ISH miRNA ISH High Content ISH
Cell SamplesCultured cells (adherent or suspension), circulating tumor cells (CTC)
Cultured cells (adherent or suspension)
Cultured cells (adherent or suspension)
Multiplexing Up to four RNA targetsone miRNA and up to two mRNA targets
Up to four RNA targets
Detection SignalFluorescence Alexa Fluor® 488, 546, 647, and 750 dyes
Fluorescence Fast Red for miRNA, Alexa Fluor® 488 and 750 dyes for mRNA
Fluorescence Alexa Fluor® 488, 546, 647, and 750 dyes
Automation Compatible No Yes Yes
InstrumentationFluorescence microscopy or high-content imaging system
Fluorescence microscopy or high-content imaging system
High-content imaging system
Assay FormatCoverslips mounted on slides or 96-well plates
Coverslips mounted on slides or 96-well plates
96- or 384-well plates
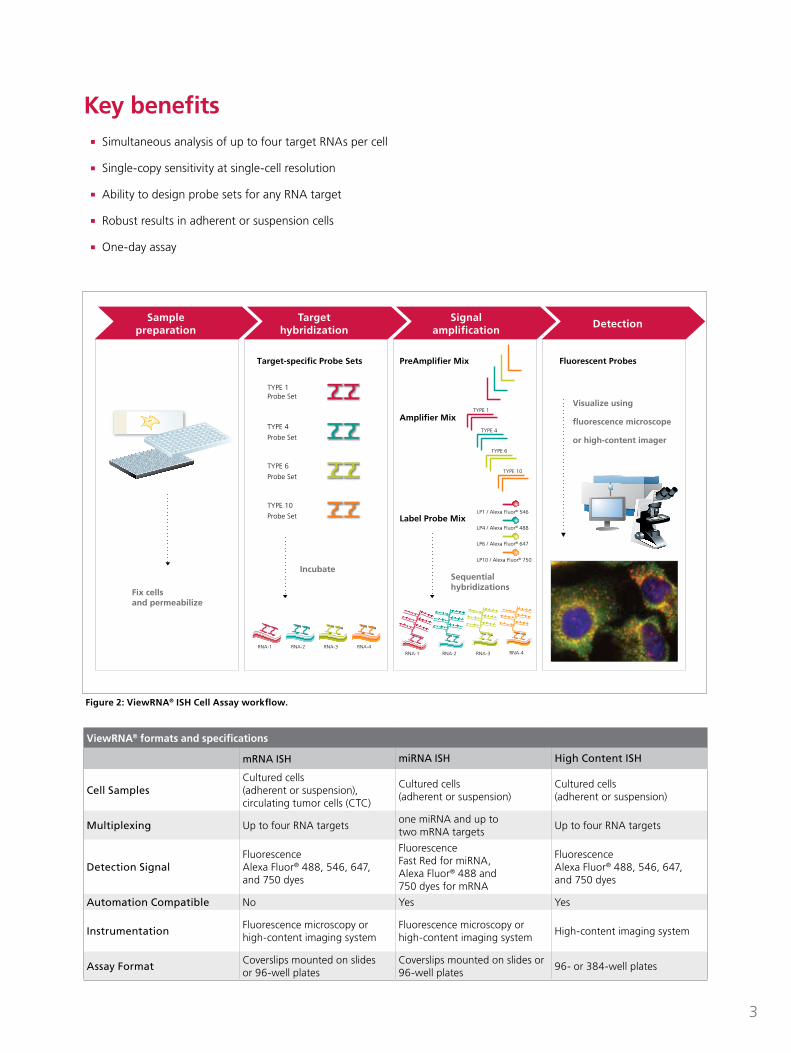
Fluorescent Probes
Fix cellsand permeabilize
RNA-1 RNA-2 RNA-3 RNA-4
Incubate
Target-specific Probe Sets PreAmplifier Mix
LP1 / Alexa Fluor® 546
LP4 / Alexa Fluor® 488
LP6 / Alexa Fluor® 647
LP10 / Alexa Fluor® 750
Sequentialhybridizations
TYPE 4
Probe Set
TYPE 1 Probe Set
TYPE 6
Probe Set
TYPE 10
Probe Set
TYPE 1
TYPE 6
TYPE 10
Amplifier Mix
RNA-4RNA-1 RNA-2 RNA-3
Label Probe Mix
Visualize using
fluorescence microscope
or high-content imagerTYPE 4
Samplepreparation
Targethybridization
Signalamplification
Detection
Figure 2: ViewRNA® ISH Cell Assay workflow.
4
Population heterogeneitymRNA is commonly assayed by quantitative RT-PCR (qRT-PCR) or lysate-based bDNA technology, such as QuantiGene® Plex Assay. Although informative, this results in bulk measurements that mask the difference in gene expression that occur at the single-cell level. In Figure 3, quantitation of Her2 in HeLa cells and SKBR3 cells is analyzed by both ViewRNA ISH Cell and QuantiGene Plex Assay. ViewRNA ISH Cell Assay accurately visualized Her2 in HeLa cells known to express an average of 4–6 copies per cell and in SKBR3 breast cancer cells known to have higher expression levels of Her2 (Figure 4A). Her2 spots were counted in 200 HeLa cells and plotted in a histogram (Figure 4B). The histogram of Her2 expression derived from 200 cells clearly indicates a high degree of expression variation from cell-to-cell, with a range of expression from 0–21 transcripts per cell and an average of 5.4 transcripts per cell (Figure 4B). QuantiGene Plex Assay was used to confirm these measurements, and the result of an average of 6.4 transcripts per cell correlated well with the results of ViewRNA ISH Cell Assay (Figure 4C).
Analyze sample heterogeneityCellular heterogeneity is present in any biological sample. However, most of our understanding of gene expression is based upon bulk population averages from qPCR, microarrays, or sequencing methodologies. These methods can mask the presence of rare cells, ignore essential cell-to-cell differences and reveal the importance of subcellular localization. To fully understand how gene expression levels among individual cells (such as those in co-cultures or homogenous cell lines that are cycling at different times) contribute to biological function, a single-cell approach must be applied. ViewRNA® ISH Cell Assays reveal the hidden story at the single-cell level.
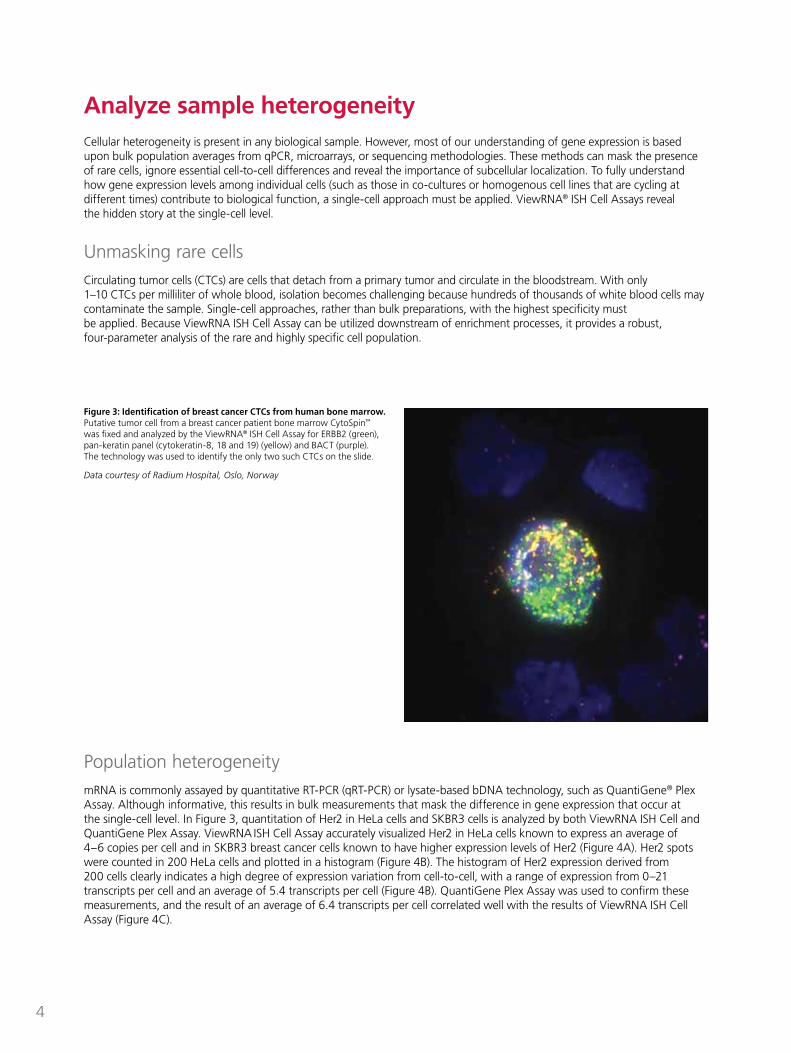
Unmasking rare cellsCirculating tumor cells (CTCs) are cells that detach from a primary tumor and circulate in the bloodstream. With only 1–10 CTCs per milliliter of whole blood, isolation becomes challenging because hundreds of thousands of white blood cells may contaminate the sample. Single-cell approaches, rather than bulk preparations, with the highest specificity must be applied. Because ViewRNA ISH Cell Assay can be utilized downstream of enrichment processes, it provides a robust, four-parameter analysis of the rare and highly specific cell population.
Figure 3: Identification of breast cancer CTCs from human bone marrow.Putative tumor cell from a breast cancer patient bone marrow CytoSpin™ was fixed and analyzed by the ViewRNA® ISH Cell Assay for ERBB2 (green), pan-keratin panel (cytokeratin-8, 18 and 19) (yellow) and BACT (purple). The technology was used to identify the only two such CTCs on the slide.
Data courtesy of Radium Hospital, Oslo, Norway

5
Figure 4: Visualization and quantitation of transcript heterogeneity in cell lines.A: ViewRNA® ISH Cell multiplex analysis of Her2 mRNA (green) and control 18S rRNA (red) in HeLa cells (left image) and SKBR3 cells (right image).
Nuclei were stained with DAPI (blue) and visualized by fluorescence microscopy. B: Histogram of Her2 expression per HeLa cell based on counting dots per cell for 200 cells. C: Comparison of Her2 expression results using the ViewRNA® in situ assay vs. the QuantiGene® 2.0 Lysate Assay.
In response to external stimuli, differential cell response is expected. While bulk averaging methods will identify the set of genes regulated by the stimuli, ViewRNA ISH Cell Assays reveal the unique response in each cell and discern the population heterogeneity.
Figure 5: Time course of cytokine induction at the single-cell level.HeLa cells were treated with PMA for 0-8 hours. Then, cells were fixed and analyzed by the ViewRNA® ISH Cell Assay for induction of IL-6 (red) and IL-8 expression (green) along with ACTB expression (green). Nuclei (blue) stained with DAPI. The results show post-induction peaks for IL-6 at 1-2 hours and 4 hours for IL-8. Furthermore the assay reveals the heterogeneity of individual cell responses.
4A
4B
4C
AssayAve. number of transcripts/cell
ViewRNA® ISH Cell Assay 5.4
QuantiGene® 2.0 Lysate Assay
6.4 ± 2.3
HeLa SKBR3
0
10
20
30
40
50
60
70
0 1−3 4−6 7−9 10−12 13−15 16−18 19−21 22−24
Nu
mb
er o
f H
eLa
cells
Her2 transcripts per cell
0 hour 0.5 hours 1 hour
2 hours 4 hours 8 hours
6
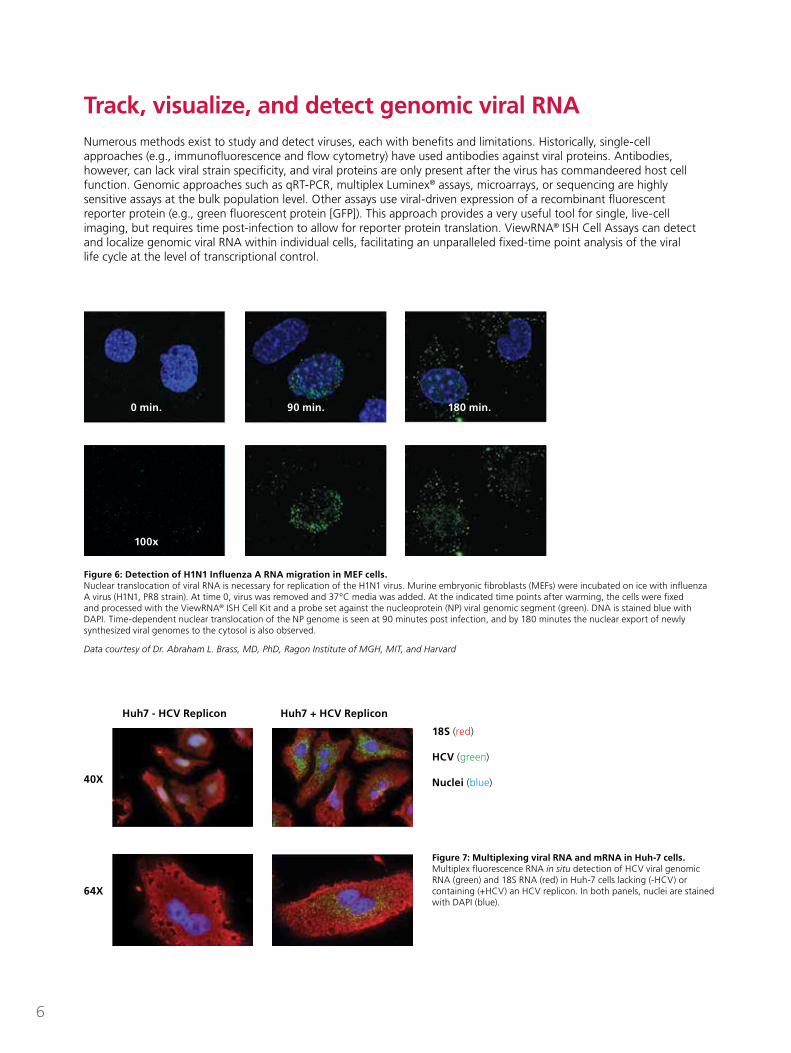
Track, visualize, and detect genomic viral RNANumerous methods exist to study and detect viruses, each with benefits and limitations. Historically, single-cell approaches (e.g., immunofluorescence and flow cytometry) have used antibodies against viral proteins. Antibodies, however, can lack viral strain specificity, and viral proteins are only present after the virus has commandeered host cell function. Genomic approaches such as qRT-PCR, multiplex Luminex® assays, microarrays, or sequencing are highly sensitive assays at the bulk population level. Other assays use viral-driven expression of a recombinant fluorescent reporter protein (e.g., green fluorescent protein [GFP]). This approach provides a very useful tool for single, live-cell imaging, but requires time post-infection to allow for reporter protein translation. ViewRNA® ISH Cell Assays can detect and localize genomic viral RNA within individual cells, facilitating an unparalleled fixed-time point analysis of the viral life cycle at the level of transcriptional control.
Figure 7: Multiplexing viral RNA and mRNA in Huh-7 cells.Multiplex fluorescence RNA in situ detection of HCV viral genomic RNA (green) and 18S RNA (red) in Huh-7 cells lacking (-HCV) or containing (+HCV) an HCV replicon. In both panels, nuclei are stained with DAPI (blue).
Figure 6: Detection of H1N1 Influenza A RNA migration in MEF cells. Nuclear translocation of viral RNA is necessary for replication of the H1N1 virus. Murine embryonic fibroblasts (MEFs) were incubated on ice with influenza A virus (H1N1, PR8 strain). At time 0, virus was removed and 37°C media was added. At the indicated time points after warming, the cells were fixed and processed with the ViewRNA® ISH Cell Kit and a probe set against the nucleoprotein (NP) viral genomic segment (green). DNA is stained blue with DAPI. Time-dependent nuclear translocation of the NP genome is seen at 90 minutes post infection, and by 180 minutes the nuclear export of newly synthesized viral genomes to the cytosol is also observed.
Data courtesy of Dr. Abraham L. Brass, MD, PhD, Ragon Institute of MGH, MIT, and Harvard
0 min. 90 min. 180 min.
100x
18S (red)
HCV (green)
Nuclei (blue)40X
64X
Huh7 - HCV Replicon Huh7 + HCV Replicon

7
Single-cell study of non-coding RNAs, including miRNA and lncRNAApproximately 75% of the human genome can be transcribed into RNA; however, only 1.5% of the human genome codes for mRNA, which typically gets translated into protein. The majority of non-translated RNA or non-coding RNAs is functionally involved in many cellular processes. Two critical epigenetic regulators are long-non-coding RNA (lncRNA) which often binds to chromatin-modifying proteins to help regulate gene expression, and microRNA (miRNA), short RNAs that have emerged as key translational regulators for 30% of all protein-coding genes in diverse biological processes.
With advances in transcriptomic techniques, researchers have been able to identify, profile, validate, and functionally analyze relevant non-coding RNAs in different models and diseases. However, analysis at the single-cell level, especially for miRNA, has been limited by low sensitivity and poor resolution. ViewRNA® ISH Cell and ViewRNA® miRNA ISH Cell Assays enable the simultaneous visualization and quantitation of non-coding RNA and miRNA, with single-molecule sensitivity and single-cell resolution. For ViewRNA miRNA ISH Cell Assay, an miRNA target probe set covering the entire mature miRNA sequence is used in combination with bDNA and Fast Red substrate signal amplification for increased sensitivity.
Figure 8: Multiplex miRNA and mRNA of various expression levels.Simultaneous detection of miRNA (Fast Red Substrate – Cy®3/550 channel) and mRNA (in FITC channel and/or in Cy7 channel) expression in any given cell. Shown are duplex assays showing expression of different miRNA and mRNA targets in HeLa cells. HPRT, ACTB, PPIB – in FITC channel. GAPD – in Cy7 channel. Based upon known expression levels, the data confirms accurate and precise study and visualization of miRNA and mRNA of various expression levels where one punctuated dot corresponds to one molecule of miRNA or mRNA target.
miR-93, HPRT miR-107, ACTB miR-30d, PPIB miR-17, PPIB Let-7a, GAPD
m
erge
d m
RNA
m
iRN
A
8
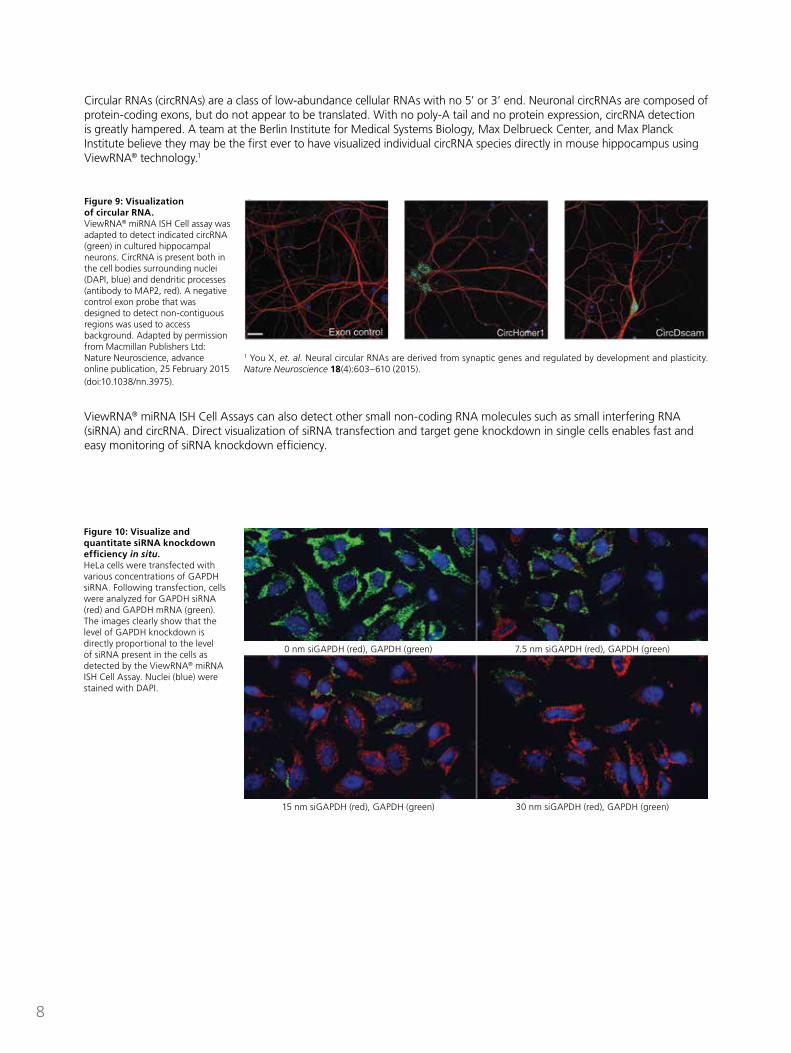
Figure 9: Visualization of circular RNA.ViewRNA® miRNA ISH Cell assay was adapted to detect indicated circRNA (green) in cultured hippocampal neurons. CircRNA is present both in the cell bodies surrounding nuclei (DAPI, blue) and dendritic processes (antibody to MAP2, red). A negative control exon probe that was designed to detect non-contiguous regions was used to access background. Adapted by permission from Macmillan Publishers Ltd: Nature Neuroscience, advance online publication, 25 February 2015 (doi:10.1038/nn.3975).
Figure 10: Visualize and quantitate siRNA knockdown efficiency in situ.HeLa cells were transfected with various concentrations of GAPDH siRNA. Following transfection, cells were analyzed for GAPDH siRNA (red) and GAPDH mRNA (green). The images clearly show that the level of GAPDH knockdown is directly proportional to the level of siRNA present in the cells as detected by the ViewRNA® miRNA ISH Cell Assay. Nuclei (blue) were stained with DAPI.
ViewRNA® miRNA ISH Cell Assays can also detect other small non-coding RNA molecules such as small interfering RNA (siRNA) and circRNA. Direct visualization of siRNA transfection and target gene knockdown in single cells enables fast and easy monitoring of siRNA knockdown efficiency.
Circular RNAs (circRNAs) are a class of low-abundance cellular RNAs with no 5’ or 3’ end. Neuronal circRNAs are composed of protein-coding exons, but do not appear to be translated. With no poly-A tail and no protein expression, circRNA detection is greatly hampered. A team at the Berlin Institute for Medical Systems Biology, Max Delbrueck Center, and Max Planck Institute believe they may be the first ever to have visualized individual circRNA species directly in mouse hippocampus using ViewRNA® technology.1
0 nm siGAPDH (red), GAPDH (green) 7.5 nm siGAPDH (red), GAPDH (green)
15 nm siGAPDH (red), GAPDH (green) 30 nm siGAPDH (red), GAPDH (green)
1 You X, et. al. Neural circular RNAs are derived from synaptic genes and regulated by development and plasticity. Nature Neuroscience 18(4):603–610 (2015).
9
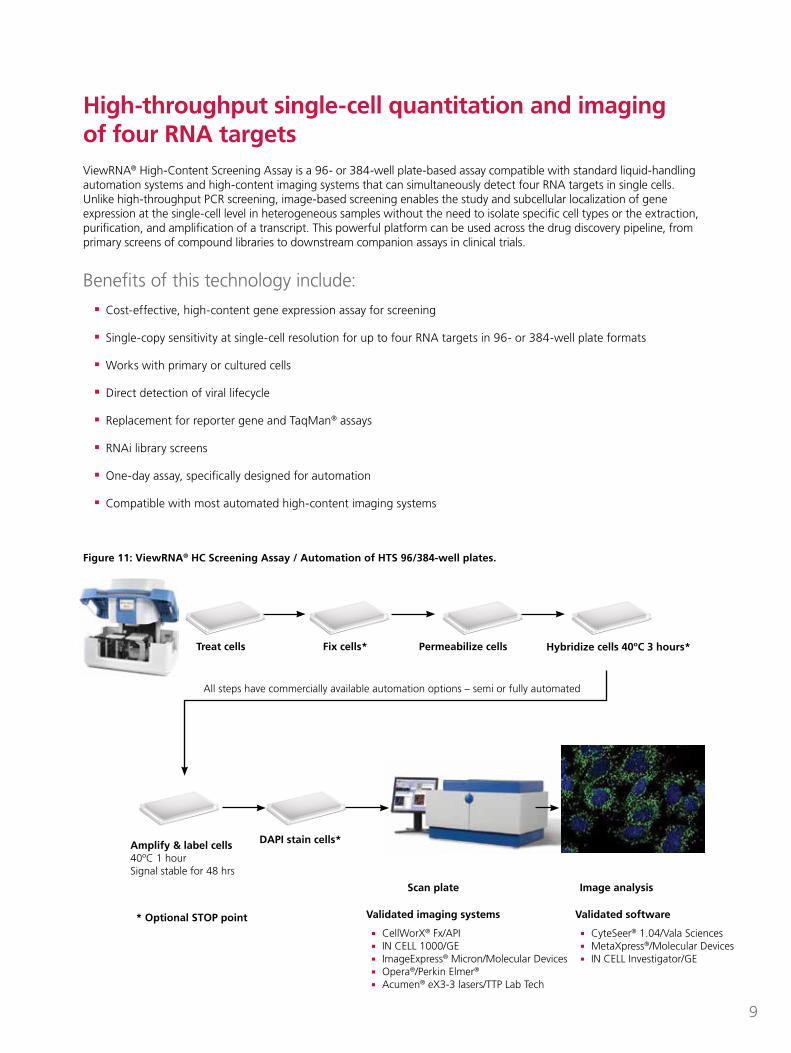
High-throughput single-cell quantitation and imaging of four RNA targetsViewRNA® High-Content Screening Assay is a 96- or 384-well plate-based assay compatible with standard liquid-handling automation systems and high-content imaging systems that can simultaneously detect four RNA targets in single cells. Unlike high-throughput PCR screening, image-based screening enables the study and subcellular localization of gene expression at the single-cell level in heterogeneous samples without the need to isolate specific cell types or the extraction, purification, and amplification of a transcript. This powerful platform can be used across the drug discovery pipeline, from primary screens of compound libraries to downstream companion assays in clinical trials.
Benefits of this technology include:
Cost-effective, high-content gene expression assay for screening
Single-copy sensitivity at single-cell resolution for up to four RNA targets in 96- or 384-well plate formats
Works with primary or cultured cells
Direct detection of viral lifecycle
Replacement for reporter gene and TaqMan® assays
RNAi library screens
One-day assay, specifically designed for automation
Compatible with most automated high-content imaging systems
Figure 11: ViewRNA® HC Screening Assay / Automation of HTS 96/384-well plates.
Treat cells Fix cells*
DAPI stain cells*
Scan plate Image analysis
Amplify & label cells40ºC 1 hourSignal stable for 48 hrs
* Optional STOP point Validated imaging systems
n CellWorX® Fx/API n IN CELL 1000/GE n ImageExpress® Micron/Molecular Devices n Opera®/Perkin Elmer®
n Acumen® eX3-3 lasers/TTP Lab Tech
Validated software
n CyteSeer® 1.04/Vala Sciences n MetaXpress®/Molecular Devices n IN CELL Investigator/GE
Permeabilize cells Hybridize cells 40ºC 3 hours*
All steps have commercially available automation options – semi or fully automated
10
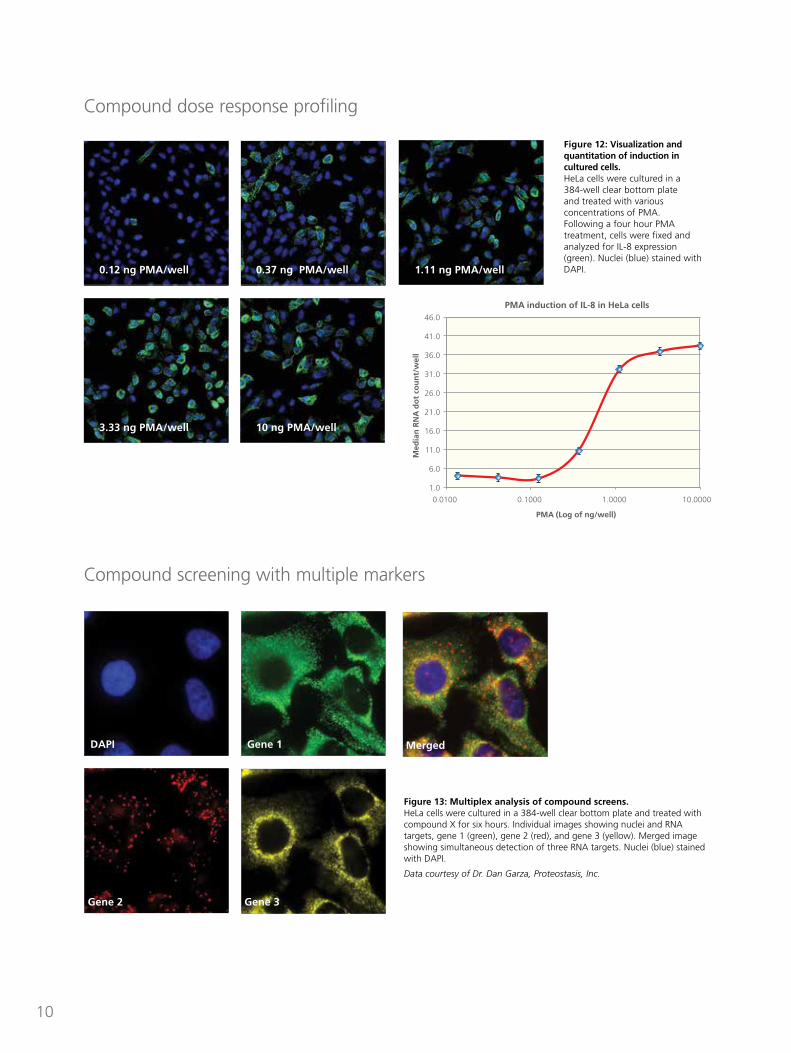
Figure 13: Multiplex analysis of compound screens. HeLa cells were cultured in a 384-well clear bottom plate and treated with compound X for six hours. Individual images showing nuclei and RNA targets, gene 1 (green), gene 2 (red), and gene 3 (yellow). Merged image showing simultaneous detection of three RNA targets. Nuclei (blue) stained with DAPI.
Data courtesy of Dr. Dan Garza, Proteostasis, Inc.
DAPI Gene 1 Merged
Gene 2 Gene 3
Compound screening with multiple markers
Compound dose response profiling
Figure 12: Visualization and quantitation of induction in cultured cells.HeLa cells were cultured in a 384-well clear bottom plate and treated with various concentrations of PMA. Following a four hour PMA treatment, cells were fixed and analyzed for IL-8 expression (green). Nuclei (blue) stained with DAPI.
1.0
6.0
11.0
16.0
21.0
26.0
31.0
36.0
41.0
46.0
0.0100 0.1000 1.0000 10.0000
Med
ian
RN
A d
ot
cou
nt/
wel
l
PMA (Log of ng/well)
PMA induction of IL-8 in HeLa cells
0.12 ng PMA/well
3.33 ng PMA/well
0.37 ng PMA/well
10 ng PMA/well
1.11 ng PMA/well

11
Ordering information
The ViewRNA® ISH Cell Assay requires the purchase of two products: n ViewRNA ISH Cell Assay Kit–contains all the assay reagents for signal amplification and detection required for
visualization of one to three target RNAs (mRNA and lncRNA) using adherent or suspension cells.
n ViewRNA® Probe Sets–target specific probes (TYPE 1, 4, 6, or 10). See the Probe Set Catalog.
Optional kits, each sold separately n ViewRNA® ISH Cell 740 Module–designed to be used in conjunction with ViewRNA ISH Cell Assay and allows
analysis of an additional RNA target in the 740 channel.
n ViewRNA® ISH Cell Accessory Kit–intended to provide many of the required components, not supplied in the reagent kit, in order to perform the assay. See the package insert for a complete list of materials provided in the kit.
ViewRNA ISH Cell Assay Kits
DescriptionProduct Size
Catalog Number
ViewRNA® ISH Cell Assay Kit Kit* QVC001
ViewRNA® miRNA ISH Cell Assay Kit Kit* QVCM0001
ViewRNA® ISH Cell 740 Module Kit* QVC0200
ViewRNA® High Content Screening Assay Kit
Contact local account manager
*24 assays when using cover slips in a 24-well plate, 96 assays when using cover slips mounted on glass slides (additional 10X PBS, Detergent Solution and Wash Buffer Components are required), 16 assays when using the four-chambered dish format (four-chambered dish is required), or 144 assays when using a 96-well plate (96-well optical bottom plate is required)
ViewRNA Probe Sets The ViewRNA Probe Sets are designed for use with the ViewRNA ISH Cell Assays, ViewRNA ISH Tissue Assays and PrimeFlow RNA Assay. Visit our website to view a complete listing of over 6,500 synthesized Probe Sets. By request, new Probe Sets can be designed and synthesized in less than two weeks with no additional costs.
Probe Sets
Temperature Validation KitThe ViewRNA® Temperature Validation Kit uses a calibrated thermometer to assess he accuracy of the temperature of the oven incubator used in the assay.
ViewRNA ISH Cell Assay Accessories
DescriptionProduct Size
Catalog Number
ViewRNA® ISH Cell Accessory Kit Kit QVC0700
Hydrophobic Barrier Pen* each QVC0500
Forceps* each QVC0501
Tissue-Tek Staining Dish (Clear)* each QVC0502
Tissue-Tek Slide Rack* each QVC0503
Tissue Culture 24-well Plate* each QVC0504
Microscope Slides* 12 each QVC0505
Rectangular Cover Glass* 15 each QVC0506
Cover Slips* 50 each QVC0507
Four-chambered Dish 10 each QVC0510
Hydrophobic Barrier Pen* each QVC0500
* Included in the ViewRNA® ISH Cell Accessory Kit
Product Product Size Catalog Number
ViewRNA® Probe Sets, Catalog*
30 assays** 110 assays** 360 assays** 1,800 assays**
VX#-#####-06 VX#-#####-01 VX#-#####-02 VX#-#####-03
ViewRNA® Probe Sets, By Request***
110 assays** 110 assays** 110 assays** 110 assays**
VX1-99999-01 VX4-99999-01 VX6-99999-01 VX10-99999-01
Product Product Size Catalog Number
ViewRNA® Temperature Validation Kit
Kit QV0523
*Catalog: Available Probe Sets, where “X” identifies the species (A=human, B=mouse, C=rat, X=others); “#”corresponds to the Probe Set TYPE (1 for TYPE1: 550 nm EX; 4 for TYPE4: 488 nm EX; 6 for TYPE6: 650 nm; and 10 for TYPE10: 740 nm EX), and “#####” is a unique number associated with each target.
** Number of assays based on 24-well assay format.
*** By request, Probe Sets can be designed and synthesized at no additional cost. Please provide the following informaton when ordering: accession number (including version or gi number) or RNA sequence for the target of interest, species, name, or symbol, Probe Set TYPE, and any special design requirements. Please allow 5–7days for delvery of a By Request ViewRNA Probe Set.

eBioscience (US) Tel: +1-888-999-1371 Tel: +1-858-642-2058 eBioscience (EU) Tel: +43 1 796 40 40-305 eBioscience (Japan) Tel: +81 (0)3 6430 4020 [email protected]
www.ebioscience.com Please visit our website for international distributor contact information.For Research Use Only. Not for use in diagnostic or therapeutic procedures.
FC05503-1 PLF ViewRNA® ISH 0715 © 2015 Affymetrix, Inc. All rights reserved. All trademarks and registered trademarks are the property of their respective owners.