visualization techniques to explore data mining results for
TRANSCRIPT

Visualization Techniques to Explore Data Mining Results for Document Collections
Ronen Feldman Willi Kliisgen
Math and Computer Science Dept. German National Research Center Bar-Ran University Information Technology - GMD
Ramat-Gan, ISRAEL 52900 D-53757 St. Augustin, Germany [email protected] [email protected]
Amir Zilberstein
Math and Computer Science Dept. Bar-Ran University
Ramat-Gan, ISRAEL 52900 [email protected]
Abstract Data mining has informally been introduced as large scale search for interesting patterns in data. It is often an explorative task iteratively performed within the process of knowledge discovery in databases. In this process, interactive visualization techniques are also successfully applied for data exploration. We deal with the synergy of these two complemental approaches. Whereas datamining typically relies on strategies for systematic search in large hypotheses spaces guided by the autonomous evaluation of statistical tests, interactive visualization activates the visual capacities of an analyst to identify patterns that may also stimulate the further direction of the exploration process. We demonstrate some possibilities to combine these approaches for the area of data mining in document collections. Document Explorer is a system that offers various preprocessing tools to prepare collections of text or multimedia documents which are available in distributed environments (e.g. Internet and Intranet) for data mining applications, and includes data mining methods based on searching for patterns like frequent sets or association rules. Keyword graphs are used in this system as an highly interactive technique to present the mining results. The user can operate on the visualized results, either to redirect the data mining process, to filter and structure the results, to link several graphs, or to browse into the document collection. Thus in the keyword graphs, the relations between interesting sets of keywords are presented (the sets may also be regarded as retrieval queries to be posed to the collection) and made operable to the analyst.
Introduction Document Explorer (Feldman, Klbsgen, and Zilberstein 1997) is a data mining system searching for patterns in document collections. These patterns provide knowledge on the application domain that is represented by the A-,...-,.-* --ll^^‘:-- I?..-L ̂ -..*a^..- ̂ “_ ..I^^ I-- ^^^_ ̂ ^ ^ ““c;UlllG‘ll Lz”LIOc;LI”LI. JLKII d plLL’;L” Cdl1 cl‘s” UC: soc;11 iis SL query or implying a query that, when addressed to the collection, retrieves a set of documents. Thus the data
Copyright 0 1997, American Association for Artificial Intelligence (www.aaai.org). All rights reserved.
mining tools also identify interesting queries which can be used to browse the collection. The system searches for interesting concept sets and relations between concept sets, using explicit bias for capturing interestingness. The bias is provided by the user specifying syntactical, background, quality and redundancy constraints to direct the search in the vast implicit spaces of pattern instances which exist in the collection. The patterns which have been verified as interestinn are structured and aresented in a visual user I---------- interface allowing the user to operate on the results to refine and redirect search tasks or to access the associated documents. The system offers preprocessing tools to con- struct or refine a knowledge base of domain concepts and to create an internal representation of the collection which will be used by all subsequent data mining operations. The source documents can be of text or multimedia type and be distributed, e.g. in Internet or Intranet.
A set of concepts (terms, phrases or keywords) directly corresponds to a query that can be placed to the collection for retrieving those documents that contain all the concepts of the set. Various quality measures can be defined for a concept set which are considered as necessary conditions for the interestingness of the set. Document Explorer provides a broad spectrum of quality measures, ranging from simple support conditions to statistical indices for the concept set, based on distributions of (target) variables or change patterns for dynamic collections. Frequent sets (Agrawal et al. 1993) are the basic, simply support con- strained concept sets in Document Explorer; they can be specialized by additional quality conditions.
Association rules (Agrawal et al. 1993) provide an use- ful construct for discovering sets of attributes that appear frequently together within the same row in a data base. In (Feldman and Hirsh 1995), we have shown that association rules can also be applied for analyzing textual collections. In that case. the 1;_4c_lT svstem identifies kevwOr& that --_ -__-- _---, ---- -, ------ _- -_______ - ---, appear frequently within the same document in a coilect- ion. Association rules are special binary relations between concept sets. Document Explorer can search for other binary relations, implied by similarity functions, or defined as maximal associations (Feldman et al. 1997b).
It is also useful in some occasions to analyze higher order connections between terms, e.g. by finding terms that
16 KDD-97
From: KDD-97 Proceedings. Copyright © 1997, AAAI (www.aaai.org). All rights reserved.

are connected through another term or a chain of terms. So even though two companies do not appear together in the same document, still we may be interested in finding if they are connected through a third company, meaning they L..,I. ..^...__ :- d:cc..-^-* .a^,...-..-r- . . . ..I. A.,. &LL,l 1^--,..... ulJul IXGUI 111 UlllGIGLIL uwulllGlIw Wllll UlG ulllu Gulllpmry. An analyst might use this information to infer about the indirect connection between the companies. This notion is useful also for structured databases. Consider a database reporting on transactions of money transfer performed between people. An IRS investigator is trying to find a connection between people, but they do not appear together in any single transaction. Then the investigator will try to show an indirect connection established through a third person or a chain of people. These higher order connections can be identified by the user in a graphical nresentation of the basic associations or derived via a &milarity function capturing the high order connections.
A group of concept sets can be represented as a graph referring to the natural partial ordering of concept sets (ordering by generality). Relations between concept sets imply a graph structure as well. Various operations on these graphs allow the analyst in Document Explorer to redirect a mining task, to filter or group mining results, and to browse into the document collection. Thus this graph provides an interaction medium for the analyst based on interactive visualization techniques.
After summarizing the role of visualization for KDD and text expioration, we introduce the main concepts of Document Explorer. Then we describe different types of keyword graphs. We compare similarity functions; they imply relations between sets of concepts which are presented in the association graphs. To control the complexity of the keyword graphs, we then introduce equivalence classes for associations and redundancy filters, overcoming the combinatorial explosion that is given by the large number of possible subsets of a set of concepts. Finally we present some more examples of keyword graphs and describe some classes of interactive operations the user can perform on the keyword graphs.
Visualization for KDD and Text Exploration Interactive visualization techniques are already success- fully applied within KDD processes. In the area of inter- active statistical graphics, visualizations combine, for example, scatter diagrams with bar charts and link selected subgroups of objects in one window with the correspond- ing objects in another window (Wills 1997), (Wilhelm, Unwin, and Theus 1995). New interaction methods such as namllel cnnrdinates fTnselher!z 1007k m&mm CALTA r----- _-- ________ L \--L-----gl -_ _ . ,, Analytics), or dynamic spational visualizat;on ‘cykks 1997) support an user in easily identifying patterns by studying and operating on visualizations of the data.
For example, a geographical presentation of mortality rates in a 3D map provides first hints on geographical clusters of regions with a high mortality. By studying para- llel coordinates graphs of exchange rates and economic indicators, one can detect concurrences. A netmap graph of
telephone calls between suspect callers, premium rate ser- vices, and mobile numbers can help to identify different fraudulent gangs at work (Roberts and Totton 1996). In all these cases, the user has to identify the patterns (regional ,I..“+,..” -r...~......,...~~n r.c IL.-.” .?....r\..“P.v., -,...*n ,.F .-.“#.A La”aLGl3, bu‘ILllIIwIL&J u1 uwca, GllLG,gGuL gluup VI (W~U’ ciations) in the graphical presentations. Because of the well-established visual capabilities, it is of course much easier for an analyst to detect these patterns in the pre- sented data visualizations than in the numerical raw data.
Datamining methods detect these patterns more autono- mously, e.g. by searching and evaluating clusters of neigh- bouring regions (Gebhardt 1997). A statistical test has to ensure that such a cluster is not a random result. Although the eye is quite efficient in detecting any regularities, the situation is not quite as easy. Often the user sees patterns in the visualizations that are not really statistically valid, or ignores existing patterns. Therefore a combination of data mining and visualization approaches is important.
Explorative visualization tools are mainly used within a KDD process in preprocessing tasks to get familiar with the data, e.g. by detecting main dependencies between variables. These insights are then used to focus the specification of a following data mining task, e.g. by selecting identified variables for this task. Visualization techniques can also be used to present the data mining results. These presentations should be interactive, so that the user can operate on the visualizations. Therefore, we deal in Document Expiorer wit interactrve visualizations to be applied for the exploration of data mining results. By this integrated data mining and visualization approach, we combine the complemental strengths of both methods.
The system applies data mining for the exploration of document collections. Document exploration refers to situations, when it is difficult to express a suitable retrieval query. Often the retrieval goals are vague and hard to describe because of the nature of the problem or the missing background knowledge of the user.
Existing text exploration methods mainly present a landscape of the documents in form of document clusters. These clusters are dervided by elementary methods (e.g. TextNavigator, IBM) or based on learning techniques like self-organizing maps (Lagus et al. 1996). Systems can be integrated in Web search engines (Live Topics in Alta Vista). Clustering of documents has also been studied in traditional retrieval (Salton 1989, Cutting et al. 1993).
Whereas clustering constructs sets of similar documents without describing them by concepts, Document Explorer visualizes the coocurrence relations between concepts that exist in a document collection.
Definitions We now shortly define those fundamental constructs of Document Explorer to which we refer in the remaining sections. A knowledge base includes domain knowledge about the document area. It includes a concept DAG (directed acyclical graph) of the relevant concepts for the domain. Several categories of concepts are hierarchically
Feldman 17

Function Similarity Characteristic support threshold d> d,, (step function) evaluates only d, independent from a - d, b - d association rule d>d, anddla> c, support and confidence threshold cosine s= dl Ja’;ri; lowweight of a-d,b-d
arithmetical mean s=2dl(a+ b) middle point between cosine and Tanimoto Tanimoto s= d/(a+ b-d) high weight of a - d, b - d information measure weighted documents only applicable, if weights are Easonable concept distribution Kullback-Leibler distance relative to concept distribution of a selected category statistical test threshold statist. quality typically for larger samples and covers
Table 1: Similarity Functions for two Concept Sets A, B a = support(A), b = support(B), d = support(A,B)
arranged in this DAG. For the Reuters newswire collec- tion, used in this paper as an application example, catego- ries correspond to countries, persons, topics, etc. with sub- categories like European Union, politicians, economic indicators. Additionally, the knowledge base contains background relations. These are binary relations between categories such as nationality (relation between persons and countries) or export partners (between countries). In preprocessing, the knowledge base and a target database are constructed. The target database contains binary tuples. A tuple represents a document and the concepts being relevant for the document. All data mining operations in Document Explorer are operated on a derived trie struc- ture, that is an efficient data structure to manage all aggre- gates existing in the target database (Amir et al. 1997).
A concept set is simply a set of concepts. A set of concepts can be seen as an intermediate concept that is given by the conjunction of the concepts of the set. For example, the concepts “data mining“ and “text analysis“ define a joint concept which can be interpreted as “data mining in text data “. Frequent concept sets are sets of concepts with a minimal support, i.e. all the concepts of the set must appear together in at least s documents. A context is given by a concept set and is used as a sub- selection of the document collection. Then only the documents in this subcollection are analyzed in a search task. The system derives, for example, patterns ,,in the context of crude oil“ for the documents that contain crude oil as a phrase or are annotated by crude oil using text categorization algorithms.
A binary relation between concept sets is a subset of the crossproduct of the set of all concept sets. An association (see table 1) is a binary relation given by a similarity function. To measure the degree of connection (similarity) between two sets of concepts, we usually rely on the support of those documents in the collection, that include all the concepts of the two sets. If there is no document that contains all the concepts, then the two concept sets will have no connection (similarity = 0). If all the concepts of the two sets always appear together, the strongest
18 KDD-97
connection measurable by the document collection (similarity = 1) is given. An association ruZe is a special association, defined as usual by a minimal support and conf&eence. Furthermore, the similarity of two concept sets relative to a category can be measured by comparing the conditional distributions of the concepts of the category with respect to the two concept sets (we use the Kullback- Leibler distance, (Feldman and Dagan 1995)).
A keyword graph is a pair consisting of a set of nodes and a set of edges. Each edge connects two nodes. Quality measures are calculated for each node and each edge. A node corresponds to a concept set and an edge to an element of a binary relation. Special subsets of nodes and connections can be defined, e.g. a cEique is a subset of nodes of a keyword graph, for which all pairs of its elements are connected by an edge. A path connects two nodes of a keyword graph by a chain of connected nodes.
A search task is specified in Document Explorer by sytactical, background, quality and redundancy constraints for searching spaces of concept sets or of associations (Feldman, KliSsgen, and Zilberstein 1997). The result of a search task is a group of concept sets or associations satisfying the specified constraints. These groups of results are arranged in keyword graphs offering to the user interactive operations on the nodes and edges of the graph.
Types of Keyword Graphs Keyword graphs are used to present several types of connections between keywords (concepts) or between sets of keywords in an interactive way so that the user can operate on the graphs. At first we distinguish set graphs from association graph. A set graph visualizes a subset of concept sets with respect to their partial ordering. An association graph presents associations.
Figure 1 shows a set graph for frequent sets arranged in a tree structure. The user can operate on this graph, e.g. by selecting nodes, opening and closing nodes, or defining new search tasks with respect to these nodes, for instance to expand the nodes. The first level in figure 1 relates to

country keywords, sorted by a simple quality measure (support of the frequent set). The node “USA“ (support: 12814 documents) is expanded by person keywords (alphabetically sorted), next expansions relate to economic topic keywords (e.g. expansion of the node “James Baker“: 124 documents, 0 %) and country keywords.
Figure 1: Graph representing concept sets
Next, we distinguish simple association graphs consisting of singleton vertices from multi vertices graphs, where the edges can consist of a set of several concepts. A simple association graph connects concepts of a selected category (e.g. countries category). At each vertex of a simple asso- ciation graph, there is only one concept, and two concepts are connected by an edge, if their simikarity with respect to a similarity function is larger than a given threshold. In Table 1, some similarity functions are summarized. Figure 2 shows this kind of keyword graph for the country category in the context of crude oil and a simple similarity function based on the number of documents in which the countries co-occur. The following observations can be easily studied: USA, Iran, and Iraq are the most connected countries, Greece and Turkey are the only members of a separate component of the graph, Canada is only connected to USA, etc.. Several of such properties for nodes and subgraphs can be highlighted by the system.
This type of graph can be induced from the connection matrix calculated for a studied category and a simikarity function. A more complex type of graph allows that vertices will represent subsets of concepts from a category. Three subtypes of this graph can be defined by studying connections only between sets where one set is a subset of the other, between disjoint sets, or overlapping sets (but not subsets). In this case, vertices represent frequent sets of concepts and vertices are connected by an edge, if the
union of their concepts has a significant support. Several criteria are selectable that define this significance.
Another type of graph presents the associations between different categories, e.g. contries and economic topics. The singleton vertix version of this graph is arranged in a netmap like technique, where different arcs of a circle are used to include the concepts of categories, and edges (between countries and topics) present the associations. Figure 3 shows an example of this kind of graph, where we use a bi-partite graph to represent the connections between G7 countries and economic indicators.
Figure 2: Association graph (single vertex, single category)
countries in the context of crude oil
Similarity Functions for Association Graphs Now we summarize some quality constraints that are used in the search for interesting concept sets or associations. We concentrate here on associations; statistical patterns for set evaluation are described in more detail by Klosgen (1996), and Feldman and Dagan (1995).
Association rules are mostly introduced in an undirected way and specified by a support and a confidence threshold. A tixed confidence threshold is often not very reasonable, because it is independent from the support of the RHS of the rule. Therefore, an association should have a significantly higher confidence than the share of the RHS in the whole context to be considered as interesting. Significance is then measured by a statistical test, e.g. t-test or chi-square.
With this addition, the relation given by an association rule is undirected. An association between A and B in the
Feldman 19

direction A =+ B implies also the association B =+ A. This equivalence can be explained by the fact that the construct of a statistically significant association is different from implication (which might be suggested by the notation A * B). It can easily be derived that, if B is over- proportionally represented in A, then A is also over- proportionally represented in B.
A connection between two sets of concepts is, for example related to a threshold (e.g. 10%) for the cosine similarity (table 1 summarizes other functions and their main properties). This means, that the two concept sets are connected, if the support of the document subset that hold all the concepts of both sets is larger than 10% of the geometrical mean of the support values of the two concept sets. The threshold holds a property of monotony: if it is increased, some connections existing for a lower threshold disappear, but no new connections are established. This property is used as one technique to tune the complexity of a keyword graph. Another approach based on redundancy filters is described in the next section.
Equivalence Classes, Partial Orderings, Redundancy Filters
Very many pairs of subsets can be built from a given category of concepts, e.g. all pairs of country subsets for the set of all countries (given by the country category). Each of these pairs is a possible association between subsets of concepts, and even, if the threshold of the similarity function is increased, the resulting graph can have a too complex structure. We define now several equivalence relations to build equivalence classes of associations. Only a representative association from each class will then be included in the keyword graph in the default case.
A first equivalence is called cuver equivalence. Two associations are cover-equivalent, iff they have the same cover. E.g., (Iran, Iraq) => (Kuwait, USA) is equivalent to (Iran, Iraq, Kuwait) => USA, because they both have the same cover (Iran, Iraq, Kuwait, USA). The association with the highest similarity is selected as the representative from a cover equivalence class.
Context equivulence is a next equivalence relation. Two associations are context-equivalent, iff they are identical up to a different context. That means that the two associations are identical, when from each association those concepts are eliminated which appear on both sides. E.g., (Iran, Iraq) => (Iran, USA) is equivalent to (Kuwait, Iraq) => (Kuwait, USA). The first association establishes a connection between Iraq and USA in the context of Iran, whereas the second association is related to the context of Kuwait. The context-free association (or the most general elements with a sufficient quality) <are selected a? the repre- senta tives from this equivalence class (e.g. Iraq => USA).
The next definition relates to a partial ordering of asso- ciations (not an equivalence relation). An association Al is stronger than an association A2, iff the cover of Al is a subset of the cover of A2. As special cases of this ordering,
the right and left hand sides are treated separately. Redundancy filters are defined for these equivalences
and partial orderings. Selecting the representative of an equivalence class or the strongest associations is applied as a basic redundancy filter. Additionally criteria can refine these filters. E.g., for the context equivalence, a context conditioned association is selected additionally to the context-free association, iff the similarity of the context conditioned association is much higher (e.g. defined by a significance criterium).
There is a duality between frequent sets of concepts and associations. For a given set of frequent concepts, the implied set of all associations between fieqent concepts of the set can be introduced. On the other side, for a given set of associations, the set of all frequent concepts appearing as left or right hand sides in the associations can be implied. In the application area of document collections, we are mainly interested in freqent concept sets, when we concentrate on retrieval or browsing aspects. These freqent concepts are considered as retrieval queries which are discovered as interesting by the system. When aspiring to gain some knowledge on the domain represented by the document collection, association rules are more interesting. In the keyword graphs, the concept sets are therefore in~l~~dd QP ~~tkw nnrlrx lortivstinno B nmwtv tn thP A.IVAUYYY U” U”L&.” I.“U”” \U”L. .UC’..b u q”“‘, *” I...” collection when selected by the user). Additionally, also complementary and intersection sets (e.g. related to the cover of an association) are provided as active nodes.
Some More Examples of Keyword Graphs As a next example, associations between two or more categories are presented in a netmap-like way. Categories are arranged on arcs of a circle, and lines connect the (single-vertex) elements of the categories. Figure 3 demonstrates a simplified bi-partite version for connect- ions between countries and economic topics.
Figure 4 shows connections between sets of concepts, e.g. countries in the context of crude oil. The graph in figure 2 offers a first overview on the connections between single countries. An user can handle the complexity of this graph by selecting subregions, limiting the number of con- net tions either explicitely (top 30 connections) or impli- citely by modifying the threshold of the simikuity function. When a set connection graph is requested for the whole figure 2 graph with a relatively high similarity threshold (set to 0.30 in the example), the complexity of the resulting multiple vertices graph (figure 4) is still moderate. The user can easily infer from this graph, that the strongest simple association (for pairs of countries) is given for Iran and Iraq which has a significant specialization in the context of Kuwait. There is another association between Kuwait and USA, valid only in the context of Iran, its generalization is valid at a level 0.19 which is below the threshold. Specialization and generalization relations are underlined by special graphical elements (same colour).
20 KDD-97
D housing
Figure 3: Association graph (single vertex, several categories)
0.52 25 \ 0.77 1
0.49 13
I 0.19 18
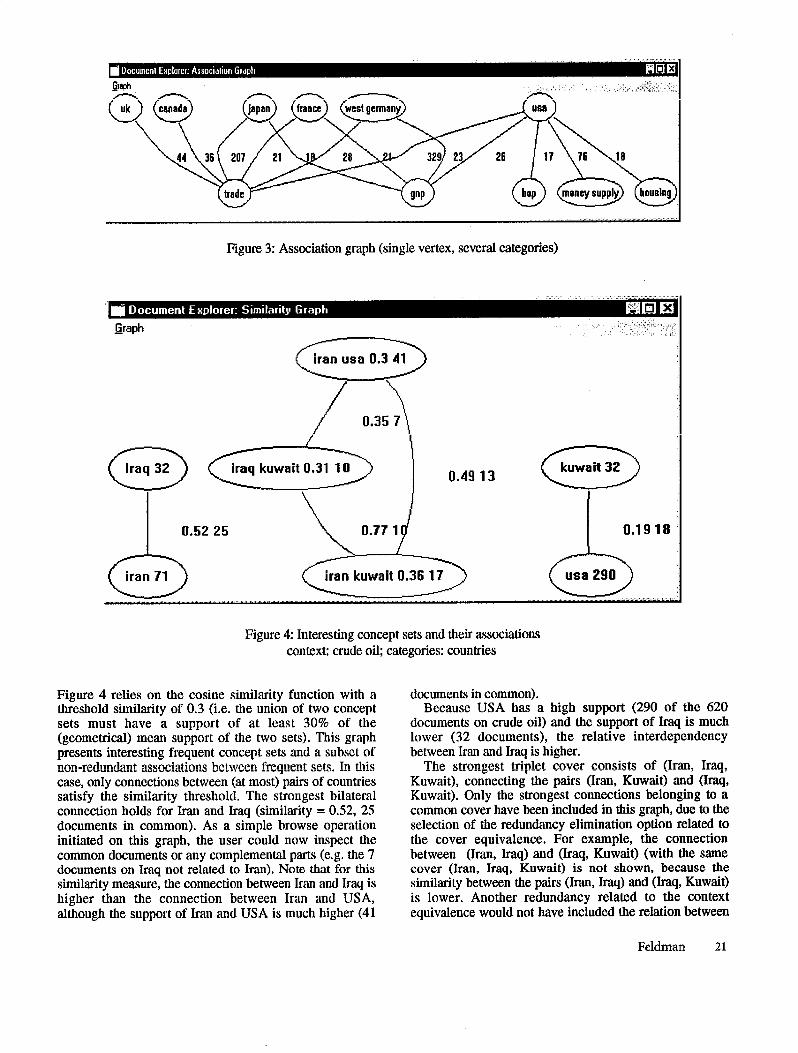
Figure 4: Interesting concept sets and their associations context: crude oil; categories: countries
Figure 4 relies on the cosine similarity function with a threshold similarity of 0.3 (i.e. the union of two concept sets must have a support of at least 30% of the (geometrical) mean support of the two sets). This graph presents interesting frequent concept sets and a subset of mm-rdnndnnt nccnrintinnc hp.twem fremlent nets Tn this ..-.. aw-“..-.w IYYUI-I..Y..Y Y-1 ..--_. -‘-l I__.” 1-1. --- ---I case, only connections between (at most) pairs of countries satisfy the similarity threshold. The strongest bilateral connection holds for Iran and Iraq (similarity = 0.52, 25 documents in common). As a simple browse operation initiated on this graph, the user could now inspect the common documents or any complemental parts (e.g. the 7 documents on Iraq not related to Iran). Note that for this similarity measure, the connection between Iran and Iraq is higher than the connection between Iran and USA, although the support of Iran and USA is much higher (41
documents in common). Because USA has a high support (290 of the 620
documents on crude oil) and the support of Iraq is much lower (32 documents), the relative interdependency between Iran and Iraq is higher.
The strongest triplet cover consists of (Iran, Iraq: Kuwait), connecting the pairs (Iran, Kuwait) and (Iraq, Kuwait). Only the strongest connections belonging to a common cover have been included in this graph, due to the selection of the redundancy elimination option related to the cover equivalence. For example, the connection between (Iran, Iraq) and (Iraq, Kuwait) (with the same cover (Iran, Iraq, Kuwait) is not shown, because the similarity between the pairs (Iran, Iraq) and (Iraq, Kuwait) is lower. Another redundancy related to the context equivalence would not have included the relation between
Feldman 21

(Iran, Kuwait) and (Iraq, Kuwait), because this is a specialization of the already included relation between Iran and Iraq. This redundancy option has been chosen with an additional condition requiring a much higher similarity for the specialized connection (0.77 compared to 0.52 in this example).
However, the next triplet consisting of (Iran, Kuwait, USA) connecting (Iran, Kuwait) and (Iran, USA) is not a specialization of a more general rule related to context equivalence, because Kuwait and USA are not connected for the given threshold (similarity 0.19 is below the threshold of 0.30). Therefore Kuwait and USA are only connected in the context of Iran.
The quadrupel consisting of Iran, Iraq, Kuwait, USA connects (Iran, USA) and (Iraq, Kuwait) (highest simi- larity between all partitioning subsets of Iran, Iraq, Kuwait, USA). Again, the complementary sets could be interesting too, e.g. the three documents about (Iraq, Kuwait) which are not related to (Iran, USA). This connection would have been eliminated by the redundancy filter belonging to the partial ordering, because it is redundant compared to the connection between Iraq and Iran. In figure 4, this filter was not selected by the user, so the connection is included in the graph, but indicated as redundant (e.g. indicated by line type).
As a summary of many existing associations between countries in the context of crude oil, the system presents a subset of associations selected by Altering and redundancy elimination rules. This sets are arranged in a graph allowing the user to operate on the graph, e.g. by selecting nodes, edges or associated complemental nodes for browsing, by applying further filtering or redundancy elimination operations on the graph, or by defining new search tasks. As an example of a new search task, all specializations of a selected node (e.g. the association between Iran and Iran), also with respect to (other) categories, could be found.
Other graph operations on the connection graph shown in figure 2 are possible, e.g. identification of cliques or other distinguished subsets like skvs. A clique of countries requires stronger constraints than those discussed above for figure 4. All pairwise relations must hold for a clique. The group consisting of Iran, Iraq, USA is not a clique, since Kuwait and USA are not connected (based on the cosine similarity measure and the selected threshold).
Operation Types for Keyword Graphs Keyword graphs are defined by their graphical presentation approaches and the types of interactive operations that can he nerfnrmd cm thp. ornnhc Tn thir wrtinn wp. &z] wj~b .,I ~.,.‘..“..~U V.. Y.l b’..,“.‘. A.. Y.-Y L.‘“v*.*.., these interactions. Some interactive operations on the keyword graphs have already been discussed in the previous examples. Now we will give a more systematical overview on several types of useful interactions. A first interaction class relates to diverse presentution options for the graphs. It includes such operations as sorting (e.g. different aspects of quality measures), expanding or
collapsing, filtering or finding, zooming or unzooming nodes or edges.
Browsing operations enable accessing the underlying document collections. A concept set corresponds to a query which can be forwarded to the collection retrieving those documents (or their titles as a first summary information) which include all the concepts of the set. Therefore, each concept set appearing in a graph can be activated for browsing purposes. Moreover, derived sets based on set operations (e.g. difference and intersection) can be activated for retrieval.
Search operations define new search tasks related to nodes or associations selected in the graph. A graph presents the results of a (former, already performed) search task and thus puts together sets of concepts or sets of associations. In a graphical user interface, the user can specify these search constraints: syntactical, background, quality and redundancy constraints; see (Feldman, Klosgen Zilberstein 1997) for details on the constraint language. The former search can now be refined by a selection of reference sets or associations in the result graph. Some of the search constraints may be modified. In refinement operations, the user can e.g. increase the number of elements that are allowed in a concept set. For example, selected concept sets in figure I or selected associations in figure 4 can be expanded by modifying restrictions on the maximum number of elements in concept sets.
Link opertltions combine several keyword graphs. Elements in one graph are selected and corresponding elements are highlighted in the second graph. Three types of linked graphs can be distinguished: links between set graphs, between association graphs, and between set and association graphs. When linking two set graphs, one or several sets are selected in one graph and corresponding sets are highlighted in the second graph. A correspondence for sets can rely, e.g., on the conjunctions of a selected set with the sets in the other graph. Then all those sets are highlighted in the second graph, that have a high quality conjunction with a selected set in the first graph. When selected elements in a set graph are linked with an association graph, associations in the second graph are highlighted with a cover that has a high quality conjunction with a selected set. For instance, in a country graph (figure 2) all country nodes are highlighted that have a large inter- section of documents with a selected topic in a an economic topic graph. Thus, linkage of graphs relies on the construct of a correspondence between two objects (set or association) which can be deflned by various criteria.
Conclusions Keyword graphs have been introduced in this paper to summarize in one picture, for large collections of documents, the patterns which have been identified in a data mining search task as interesting. Interestingness is captured in a data mining task of Document Explorer by evaluating syntactical, background, quality and redundancy constraints. Further aspects of interestingness are then
22 KDD-97

:..,.,,,,,.,A L.. &I%, _.“^_ . ..L- -r..A:^- .I.- I-^-*__.^- 3 I^^_ L" nlullpLJlalGu uy luc USGI wllv YluuIGs UIG kic;ywv1u g1aplls
and detects patterns in these graphs using her/his capacities for visual perceptions. Thus the systematical search approach of data m ining is combined with a user centred approach stimulated by visualizations. Keyword graphs provide an efficient exploration tool for getting fam iliar with a document collection. The main benefit of these visualizations is their interactivity, i.e. the user can click on each node or edge and get the documents supporting them, -- -,.-- I-eAtyL- ----.---q -.*.-. ~..... --.- ~~~ I~ ~. or cdn inmdte various ocuer operauons on me grapns. Exploration is further supported by linking several graphs. Thus the relevance of selected aspects of one graph can be studied in the context of another graph. Since many sim ilar patterns will typically be found in search tasks of data m ining, e.g. associations that contain sim ilar elements, it is often very hard to make sense out of them. Therefore we introduced redundancy falters based on equivalence classes and partial orderings to extract nodes and relations for the visualizations helping us to get some order in the vast amount of m ined patterns.
Document Explorer is a system available for PC with a first still qualitatively lim ited set of keywords graphs shown in the preceding figures. Currently we are extending the statistical quality evaluation functions, augmenting the graphical quality of the offered keyword graphs, and implementing further types and interaction operations for interactive result presentation.
References
Amir, A.; Aumann, Y.; Feldman, R.; and Katz 0. 1997. Efficient Algorithm for Association Generation. Technical Report, Department of Computer Science, Bar-Ilan University, Israel.
Agrawal, A.; Imielinski, T.; and Swami, A. 1993. M ining association rules between sets of items in large databases. In Proc. of the ACM SIGMOD Conference on M&q;?aoemftnt nf Wita p-------. ..- -..-.
Cutting, C.; Karger, D.; and Petersen, J. 1993. Constant interaction time scatter/gather browsing of very large document collections. In Proceedings of ACM-SIGIR Conference on Information Retrieval. .I~~.--_ T en-- I , . . n -.. . I a. tykes, J, IYY 1. Aaamg apauar m rormation on Statistical Plots of Geographical Data. In New TechnoEogies and Techniquesfor Stufistics, ed. by Eurostat, Amsterdam: 10s PKSS.
Feldman, R., and Dagan, I. 1995. KDT - knowledge discovery in texts. In Proceedings of the First International Conference on Knowledge Discovery (KDD-95). Menlo Park, CA: AAAI Press.
Feldman, R.; Klosgen, W.; and Zilberstein, A. 1997. Document Explorer: Discovering Knowledge in Document
T(~ll..~r:~~~ T- n ^^^^ .tf--” -C.L.. IT:-.4 l-7 .__^ -^^- n---- LVIIG:CUV~S. III nwxwiuga V A ulc rusi cuwpwu i3yuq.m
sium on Principles of KDD, eds. Komorowski, J., and Zytkow, J. Berlin: Springer.
Feldman, R., and Hirsh, H. 1995. M ining Associations in Text in the Presence of Background Knowledge. In Proceedings of the Second International Conference on Knowledge Discovery (KDD-96). Menlo Park, CA: AAAI Press.
Feldman, R.; Kliisgen, W.; Amir, A.; Zilberstein, A. 1997a. Constraints to Discover Knowledge in Document Collections. Technical Report, Department of Computer Science, Bar-Ilan University, Israel.
Feldman, R.; Amnann, Y.; Amir, A.; Kliisgen, W. 1997b. Maximal Associations: A New Method for M ining Document Collections. In Proceedings of the Third International Conference on Knowledge Discovery (KDD- 97. Menlo Park, CA: AAAI Press.
Gebhardt, F. 1997. Finding Spatial Clusters. In Proceedings of the First European Symposium on Principles of KDD, eds. Komorowski, J., and Zytkow, J. Berlin: Springer.
Inselberg, A. 1997. Parallel Coordinates for Visualizing Multidimensional Geometry. In New Technologies and Techniques.for Stutistics, ed. by Eurostat, Amsterdam: 10s Press.
g+;gen, w* i996* Cvnlnr.3. A hdnmltinottam on.4 Mnrl& “*p”lu. ‘ L *.I”AC.pLLC”sn‘ LLLIU I .AU&Y-
strategy Discovery Assistant. In Advances in Knowledge Discovery m l Dutu M ining, eds. U. Fayyad, G. Piatetsky- Shapiro, P. Smyth, and R. Uthurusamy, Cambridge, M A : M IT Press.
Lagus, C.; Honkela, T.; Kaski, S.; and Kohonen, T. 1996. Self-Organizing Maps of Document Collections. In Proceedings of the Second International Conference on ~nr\~lriPrinan~.F~,m~, -"a n,t, hdininn .dr cimndiE E. ~n."w~vug" Lsnorurvn, au." UUUL .rn*mnng, -. "uAL""U.U, u.,
Han, J.; and Fayyad, U. Menlo Park, CA: AAAI Press.
Roberts, H., and Totton, K. 1996. Data M ining in BT. Proceedings of the UNICOM Data M ining Seminar 1996. London: UNICOM.
Salton, G. i989. Automatic Text Processing. Reading, M A : Addison-Wesley.
Wilhelm, A.; Uuwin, A.; and Theus, M . 1995. Software for Interactive Statistical Graphics - A Review. In Statistical Software 5, Softstat 95, eds. Faulbaum, F., and Bandilla, W ., Stuttgart: Lucius & Lucius.
Wills, G. 1997. Visual Exploration of Large Structured Data Sets, In ivew Technoiogies and Techniques for St&tics, ed. by Eurostat, Amsterdam: 10s Press.
Feldman 23