visualization of the gap in scapholunate joint haoyu...
TRANSCRIPT

Visualization of the Gap in Scapholunate Joint
Haoyu Wang
Department of Manufacturing & Construction Management
Central Connecticut State University
1615 Stanley Street, New Britain, CT 06050
Frederick W. Werner, Jason K. Green, and Walter H. Short
Department of Orthopedic Surgery, SUNY Upstate Medical University
505 Irving Ave., Syracuse, NY 13210
ABSTRACT - Instability of the scapholunate joint is
frequently manifested by wrist pain and is sometimes
visualized by a 2 to 4 mm gap between the scaphoid
and lunate. Surgical repairs have had limited success,
in part due to the surgeon being unsure which ligament
or ligaments have been torn until the time of surgery.
Various methods have been used to describe this gap
between the bones and various levels of instability have
been described. Ideally a surgeon would have an
imaging technique (x-ray, CT scan or MRI) that would
help in determining which ligaments have been
damaged by visualizing the gap between the bones. We
proposed and implemented three measurements, a 1D
minimum gap between the bones, a 2D area descriptor
of the gap (fig. 4), and a 3D volume descriptor of the
gap (fig. 5). Cadaver wrists were moved through cyclic
flexion-extension (FE) and radioulnar deviation (RU)
motions under computer control. Three dimensional
scaphoid and lunate motion data were collected in the
intact specimens and after sequentially sectioning three
ligaments, in two sequences. Data were again collected
after 1000 cycles of motion to mimic continued use
after injury. CT scan images of each wrist were
contoured and stacked with imaging software. The
surface models (dxf) were converted to solid objects
(IGES). A DLL (Dynamic Link Library) was created in
C++ to interface with SolidWorks®. The
experimentally collected kinematic data of the carpal
bones were used to move the virtual bone models
through the DLL in SolidWorks®. The articulating
surface on each bone is a 3D surface with 3D curves as
boundary. The 1D, 2D, and 3D gaps are created and
calculated by the DLL in SolidWorks® automatically
while the scaphoid and lunate are in motion. They can
help the surgeon in better visualizing the injury.
I. Introduction
Damage to the ligaments of the wrist is a common
injury, but one that is not well publicized. In 1999,
traumatic wrist injuries were reported by 88,000
workers in private industry and by 580,000 people
whose ligamentous injuries were related to consumer
products1,2. In particular, injuries due to recreational
activities such as snowboarding, skateboarding, and
riding scooters has increased at a rate of 15% per year.
One region of the wrist that is commonly injured
after falling on an outstretched hand is the scapholunate
(SL) joint (Figure 1). An impact to the wrist may
produce carpal instability where the stabilizing
1 Bureau of Labor Statistics
2 National Electronic Injury Surveillance System (NEISS)
63rd Annual ASEE/EDGD Mid-Year Conference Proceedings, Berkeley, California – January 4-7, 2009

ligaments of the wrist are compromised (Figure 2). The
instability pattern between the scaphoid and lunate may
cause pain and the inability to grasp tools or lift objects.
As noted by Garcia-Elias et al (2006) the adverse
effects of the ligament tears are underestimated and the
injury is frequently untreated or poorly managed.
Numerous surgical treatments have been developed
with varying success (Manuel, J. et al, 2007).
The purpose of this study was to develop a
methodology to determine if various joint gap
measurements between the scaphoid and lunate could
be related to specific ligament injuries through three-
dimensional (3D) computer models of the scapholunate
joint. 3D models are useful tools for the study of
complex joint motions. In vitro 3D animations and
models have been based on motion of the forearm at
various static positions (Fischer et al., 2001), dynamic
vertebral motion (Cripton et al., 2001), passive motion
of extremities (Van Sint Jan et al., 2002), and passive
motion of carpal bones (Patterson et al., 1998). In vivo
motions have been modeled using biplanar radiographs
at static joint angles (Asano et al., 2001), high-speed
biplanar radiographs in a canine (You et al., 2001), and
3D model fitting of fluoroscopic videos (Dennis et al.,
1996). Multiple in vivo 3D CT data sets, taken at
various static joint positions, have been animated by
Crisco et al. (1999) and Snel et al. (2000). These
different techniques have quantified and illustrated
rotation angles, motion axes, contact areas, and ranges
of motion.
Although each method has its inherent benefits, no
single technique animates dynamic human joint motion
with commercial software. Static and passive motion
studies may not account for kinematic changes due to
dynamic tendon loads, and the need for custom
software development can be overwhelming. The goals
of this paper were to present a technique to (a) Develop
methodology to characterize separation of scaphoid and
lunate with ligamentous sectioning, (b) Determine
which wrist positions might best differentiate these
effects. These interbone gaps help describe bone
motions and kinematic changes due to ligamentous
injury.
II. Methods and Materials
A servo-hydraulic simulator was used to move
cadaver hands through repeatable wrist motions (Short
et al., 2002a, b; Werner et al., 1996). Fastrak motion
sensors (Polhemus, Colchester, VT) collected
kinematic data at 27 Hz for the scaphoid, lunate, and
radius, and at 82 Hz for the 3rd metacarpal. A wrist
flexion-extension motion (50° of third metacarpal
flexion to 30° of extension) and a radial-ulnar deviation
Figure 1. Scapholunate joint
Figure 2. Stabilizing ligaments injury due to impact
63rd Annual ASEE/EDGD Mid-Year Conference Proceedings, Berkeley, California – January 4-7, 2009

(10° radial to 20° ulnar) were done. After testing, each
arm was removed from the simulator and rigidly fixed
within a Styrofoam box using expanding urethane
foam. Fastrak kinematic data were collected and the
arm was CT scanned. The post-test kinematic data were
used to establish a spatial relationship between the
sensor data and the location and orientation of the
bones in the CT slices (Figure 3).
The CT images were segmented with SliceOmatic
imaging software (Tomovision, Montreal, Canada) to
produce surface shells (polygonal models) of the bones.
This software uses a proprietary algorithm to
automatically contour regions of high gray-level
contrast. The user traces an area by using a mouse and
cursor to place points around the structure to be
contoured. The algorithm then uses the original gray-
level gradient of the image to place a contour near the
user-selected points, based on the highest contrast in
that immediate area. The user-selected points are
replaced with software-generated points along the
gradient that are spaced at two pixels apart. The user
can limit the amount of curvature allowed in the
contour. For this study, the carpal bones were
contoured at the subchondral bone/ cartilage interface
and at the outer edges of the magnetic coils for the
sensors.
To calculate interbone gaps, the polygonal bone models
were exported from 3DStudio-MAX and converted to
NURBS (Non-Uniform Rational B-Spline) surface
models using Geomagic Studio (Raindrop Geomagic,
Research Triangle Park, NC). NURBS (.igs ) are
smooth continuous surfaces defined over a quadrilateral
region based upon vertex points and allow the models
to be analyzed with three-dimensional CAD software.
The polygons were decimated, refined and replaced
with a grid pattern to fit a closed surface. The surface
consisted of 1000 patches per bone.
Animations of the bones’ solid models and
interbone gaps calculations for each frame of an
animation were implemented in Solidworks 3D CAD
software (Solidworks Corp., Concord, MA). We have
developed in-house software, ORTHOPEDICS, in
C++, using the SolidWorks API (Application
Programming Interface) on a Windows platform. The
software has the form of DLL (Dynamic Link Library)
which is easily loaded and unload in SolidWorks just
like any other standard add-ins.
ORTHOPEDICS automatically created separate
CAD assemblies, based upon the Fastrak carpal data, to
replicate each animation frame produced in
3DStudioMAX. Instead of the conventional rotation
matrix, Quaternions are used in calculating motions of
carpal bones (scaphoid and lunate) because they are
more efficient and more numerically stable. For each
assembly, the software computed 1D, 2D, and 3D
interbone gaps between scaphoid and lunate.
1. 1D gap calculation
We define the 1D gap as the minimum distance
between the carpal bones. The minimum distance is
calculated by what we call a “pingpong algorithm.” The
top image in Figure 4 illustrates this method. If we
open and separate the bones like a book, we can see the
articulating surfaces as in the lower image in Figure 4.
The SolidWorks API is capable of locating a point on a
face that is closest to a point in the space. We start from
a point that is in between the scaphoid and lunate. We
CT
reconstruction
Polygon
model
Solid
model
Figure 3. CT slice model, polygon model, and solid model
63rd Annual ASEE/EDGD Mid-Year Conference Proceedings, Berkeley, California – January 4-7, 2009
can get a point on one of the articulating faces of
scaphoid. Now use this point as the starting point to
find the closest point on the face of the lunate. For each
patch-to-patch comparison, points were compared
based upon a user-defined spacing (tolerance) of 1 mm.
The algorithm searched for an individual point in one
patch that was closest to a second point on the other
bone. It ‘ping-ponged’ between these two patches (one
point to another point) until the newest point on one
patch was within 1mm of the previous point. To
increase the efficiency of the algorithm, the user
selected the patches to be examined for distance
computation. A line was drawn between the bones to
represent the minimum distance, and the CAD
assembly saved. The algorithm created the next
assembly in the motion, calculated the minimum
distance, and saved the distances to a text file. Methods
of validation of the minimum distance can be found in
(Green, J et al, 2004).
Minimum
Distance
Scaphoid
Lunate
Scaphoid and Lunate
Opened Like a Book
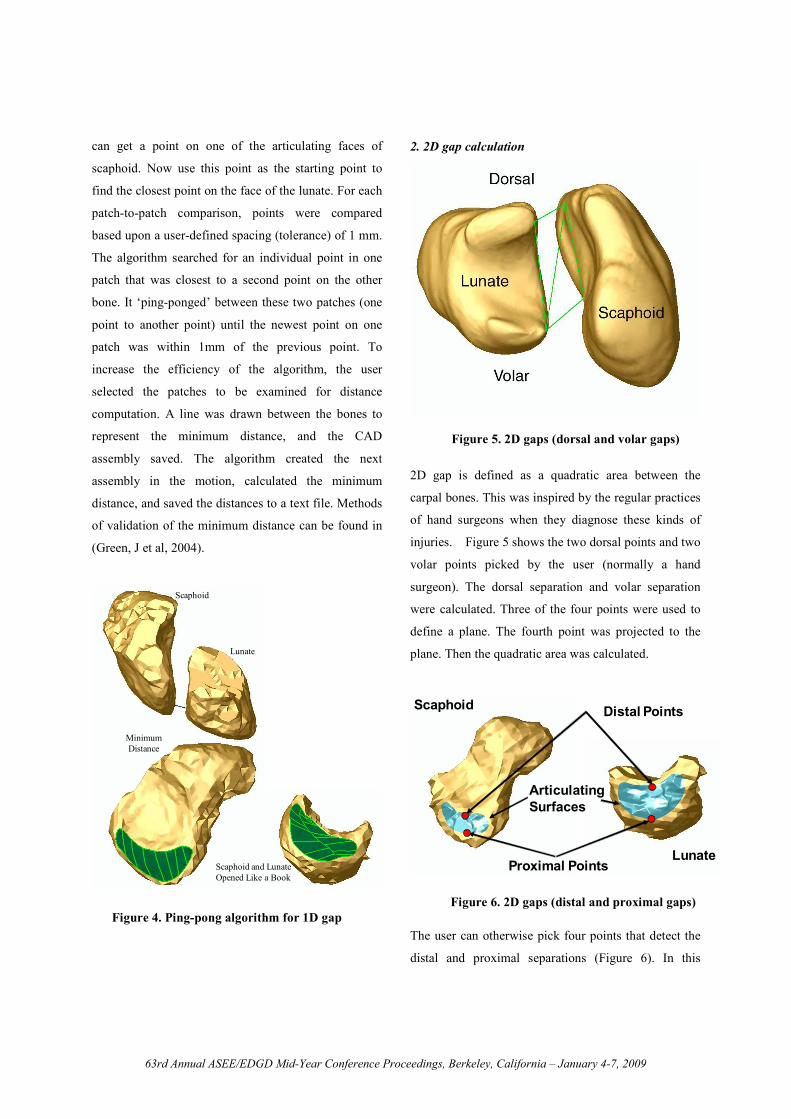
2. 2D gap calculation
2D gap is defined as a quadratic area between the
carpal bones. This was inspired by the regular practices
of hand surgeons when they diagnose these kinds of
injuries. Figure 5 shows the two dorsal points and two
volar points picked by the user (normally a hand
surgeon). The dorsal separation and volar separation
were calculated. Three of the four points were used to
define a plane. The fourth point was projected to the
plane. Then the quadratic area was calculated.
Scaphoid Distal Points
Proximal PointsLunate
Articulating
Surfaces
The user can otherwise pick four points that detect the
distal and proximal separations (Figure 6). In this
Figure 4. Ping-pong algorithm for 1D gap
Figure 5. 2D gaps (dorsal and volar gaps)
Figure 6. 2D gaps (distal and proximal gaps)
63rd Annual ASEE/EDGD Mid-Year Conference Proceedings, Berkeley, California – January 4-7, 2009

figure, one can also see the articulating surfaces, which
are highlighted as light blue. These were used to
generate the volume between the scaphoid and lunate.
3. 3D gap calculation
3D gap is defined as the lofted volume between the
articulating surfaces of the carpal bones (Figure 7).
Since CAD software can only calculate the volume and
surface area of a complex shape when the model is a
solid, it was necessary to first describe a contained
volume between the scaphoid and lunate. As the
articulating surface on each bone is a 3D surface with a
3D curve as a boundary, we chose to use the idea of
lofting to generate the volume between the two
articulating surfaces. Lofting creates a feature by
making transitions between profiles. Using the lofting
method to generate the volume has two advantages.
First, the 3D boundary curves and 3D surfaces of both
articulating surfaces are used directly instead of being
approximated when generating the volume. Second, we
have the flexibility to change the definition of the
volume by changing the guide curves of the loft. For
any frame of motion of the carpal bones, the volume
between the articulating surfaces is generated
physically by using the Solid Lofting feature provided
in SolidWorks.
Lofted Volume
There are five ligaments that are thought to
stabilize the scaphoid and lunate. The scapholunate
interosseous ligament (Figure. 8), known as SLIL,
connects the scaphoid and lunate. On the dorsal side of
the wrist, there are the dorsal intercarpal ligament,
known as DIC, and the dorsal radio carpal ligament,
known as DRC. On the volar aspect of the wrist, there
are the radioscapho-capitate ligament, known as RSC
and the scapho-trapezium ligament, known as ST.
Dorsal View Volar View
DIC, DRC, SLIL ST, RSC
STT
In each of 19 fresh frozen cadaver forearms that
were tested for this study, we mounted Fastrak
electromagnetic motion sensors onto the scaphoid,
lunate, third metacarpal, and distal radius to measure
their 3D motion and electromagnetic sources were
mounted onto a platform attached to the ulna.
Four groups of arms were studied. For each group
of arms, three ligaments were sequentially sectioned in
the sequences shown below.
Group 1: SLIL, RSC, ST, 1000 cycles of motion - 5
arms
Group 2: ST, SLIL, RSC, 1000 cycles of motion - 4
arms
Group 3: DRC, DIC, SLIL, 1000 cycles of motion - 5
arms
Group 4: DIC, SLIL, DRC, 1000 cycles of motion - 5
arms
Figure 7. 3D gaps (lofted volume)
Figure 8. Ligamentous stabilizers
63rd Annual ASEE/EDGD Mid-Year Conference Proceedings, Berkeley, California – January 4-7, 2009

We measured the motion of the scaphoid and lunate
with the wrist intact, after each ligament was sectioned
for each of the 3 sequences shown here, and after 1000
cycles of motion.
III. Results
During wrist flexion/extension (Figure. 9), the
minimum distances were computed for each level of
sectioning. Increase of the minimum distance was
observed only when SLIL was sectioned. This was
accentuated with sectioning of the RSC ligament and
even more so with the addition of 1000 cycles of
repetitive motion. It is important to note that the
maximum gap always occured during wrist flexion.
Figure 10 shows another average minimum
distance plot during wrist flexion/extension but with a
different sectioning sequence. Increase of minimum
distance happened only after the SLIL was sectioned. A
further increase was observed after 1000 cycles of
motion. Again the maximum gap measured by
minimum distance appeared during wrist flexion.
During radial/ulnar deviation, an increase in the
minimum distance was observed only after SLIL was
sectioned. In addition, maximum value of the minimum
distance was detected in ulnar deviation.
Figure 9. 1D gap after section of ST, SLIL, and RSC
Figure 10. 1D gap after section of DRC, DIC, and SLIL
Figure 11. 1D gap as on an X-Ray
Figure 12. Actual 1D gap between carpal bones
63rd Annual ASEE/EDGD Mid-Year Conference Proceedings, Berkeley, California – January 4-7, 2009

Figure 11 shows the dorsal view of the wrist joint
as if we were making measurements on an X-ray. The
distance A and B look similar in length.
But actually they have very different lengths
(Figure. 12). It is better illustrated from this view. This
is why the minimum distance in this study based on the
3D model is a much better descriptor than the distance
measured in 2D on an X-ray.
Measurement of the dorsal and volar gaps between
the scaphoid and lunate showed an increase in the
distance between the scaphoid with ligamentous
sectioning (Figure. 13). This graph shows the %
increase in gap after all ligaments have been cut and
after 1000 cycle. As shown here in this series of arms,
the dorsal and volar distances increased the most in
wrist flexion after all the ligaments were sectioned.
Also the dorsal gap increased more than the volar gap.
The bones did not separate evenly.
The distances between the proximal and distal
points on the articulating surfaces also increased with
ligamentous sectioning (Figure 14). As shown here, the
increase was greater in flexion than in extension and
the dorsal distance increased more than the proximal
distance during only a small part of the motion.
During the wrist flexion/extension motion, the
volume of the gap changes (Figure 15). The volume of
the gap is great in flexion and correlates well with the
1D minimum distance changes for both when the
ligaments are intact and after all have been sectioned.
Intuitively we consider volume as a better gap
descriptor because it is 3D in nature and more
informative. How it could help us in describing the gap
between the scaphoid and lunate is under study.
V. Conclusions
Our conclusions of this study are:
1) Changes in carpal bone position are better detected
using 3-D visualization techniques.
2) Accuracy of measuring a scapholunate gap on a 2-D
x-ray with the wrist positioned in neutral is questioned.
Figure 13. 2D dorsal gap
Figure 14. 2D volar gap
Figure 15. Correlation between 3D gap and 1D gap
63rd Annual ASEE/EDGD Mid-Year Conference Proceedings, Berkeley, California – January 4-7, 2009

3) Three methodologies have been developed to
characterize these changes (minimum distance, four
point area, and volume).
4) Changes due to DIC or ST sectioned alone were not
yet detected.
5) Detection of major SL gap changes may be best
detected in wrist ulnar deviation and flexion.
VI. References
Asano, T., Akagi, M., Tanaka, K., Tamura, J.,
Nakamura, T., 2001. In vivo three-dimensional knee
kinematics using a bi-planar imagematching technique.
Clinical Orthopaedics and Related Research 388, 157–
166.
Cripton, P.A., Sati, M., Orr, T.E., Bourquin, Y.,
Dumas, G.A., Nolte, L.-P., 2001. Animation of in vitro
biomechanical test. Journal of Biomechanics 34, 1091–
1096.
Crisco, J.J., McGovern, R.D., Wolfe, S.W., 1999.
Noninvasive technique for measuring in vivo three-
dimensional carpal bone kinematics. Journal of
Orthopaedic Research 17 (1), 96–100.
Dennis, D.A., Komistek, R.D., Hoff, W.A., Gabriel,
S.M., 1996. In vivo knee kinematics derived using an
inverse perspective technique. Clinical Orthopaedics
and Related Research 331, 107–117.
Fischer, K.J., Manson, T.T., Pfaeffle, H.J., Tomaino,
M.M., Woo, S.L.-Y., 2001. A method for measuring
joint kinematics designed for accurate registration of
kinematic data to models constructed from CT data.
Journal of Biomechanics 34, 377–383.
Garcia-Elias, M., A.L. Lluch, and J.K. Stanley (2006),
Three-ligament tenodesis for the Treatment of
Scapholunate Dissociation: Indications and Surgical
Technique. Journal of Hand Surgery, 31A: p. 125-134.
Jason K. Green, Frederick W. Werner, Haoyu Wang,
Marsha M. Weiner, Jonathan Sacks, Walter H. Short
(2004), Three-Dimensional Modeling and Animation of
Two Carpal Bones: A Technique, Journal of
Biomechanics, Volume 37, Issue 5, May 2004, Pages
757-762
Manuel, J. and S.L. Moran (2007), The Diagnosis and
Treatment of Scapholunate Instability. Orthopaedic
Clinics of North America, 2007. 38: p. 261-277.
Patterson, R.M., Nicodemus, C.L., Viegas S, F., Elder,
K.W., Rosenblatt, J., 1998. High-speed, three-
dimensional kinematic analysis of the normal wrist.
Journal of Hand Surgery [Am] 23 (3), 446–453.
Snel, J.G., Venema, H.W., Moojen, T.M., Ritt, J.P.,
Grimbergen, C.A., den Heeten, G.J., 2000. Quantitative
in vivo analysis of the kinematics of carpal bones from
three-dimensional CT images using a deformable
surface model and a three-dimensional matching
technique. Medical Physics 27 (9), 2037–2047.
Van Sint Jan, S., Salvia, P., Hilal, I., Sholukha, V.,
Rooze, M., Clapworthy, G., 2002. Registration of 6-
DOFs electrogoniometry and CT medical imaging for
3D joint modeling. Journal of Biomechanics 35, 1475–
1484.
You, B.M., Siy, P., Anderst, W., Tashman, S., 2001. In
vivo measurement of 3-D skeletal kinematics from
sequences of biplane radiographs: application to knee
kinematics. IEEE Transactions on Medical Imaging 20
(6), 514–525.
Acknowledgments
Funded by CDC Grant R49/CCR21681
Funded by NIH grant 1R01 AR050099-02
63rd Annual ASEE/EDGD Mid-Year Conference Proceedings, Berkeley, California – January 4-7, 2009