visualization of the cell-selective distribution of pufa ... · lipid res. 2009. 50: 1776–1788....
TRANSCRIPT

1776 Journal of Lipid Research Volume 50, 2009Copyright © 2009 by the American Society for Biochemistry and Molecular Biology, Inc.
This article is available online at http://www.jlr.org
Much progress has recently been made in studies of brain lipids. Neural lipids play a role in synaptic vesicle fu-sion ( 1, 2 ), regulation of receptors and ion channels ( 3, 4 ), and formation of raft microdomains for neuronal cel-lular communications ( 5–7 ). Among brain lipids, glycero-phospholipids (GPLs) are the most abundant, comprising a large molecular family in which phosphoric acid in the ester form is bound to a glycerolipid. GPLs are subdivided into distinct classes [e.g., phosphatidylcholines (PCs) and phosphatidylinositols] based on the structure of the head group linked to the phosphate, attached at the sn -3 posi-tion of the glycerol backbone. In brain membrane GPLs, many PUFAs, such as arachidonic acid (AA) and docosa-hexaenoic acid (DHA), are stored at the sn -2 position in an asymmetrical manner ( 8 ). Such PUFAs are mainly re-leased from GPLs by the activity of phospholipase A 2 (PLA 2 ) ( 9 ), and are metabolized into various important bioactive lipids ( 7 ) involved in PUFA-mediated signaling pathways ( 10, 11 ). The systemic analysis of diverse lipids, “lipidomics,” plays a crucial role in understanding lipid signaling ( 12–14 ). It is also crucial to determine the neu-ronal distributions of GPLs, especially PUFAs, to under-stand their possible roles in brain function. Until recently,
Abstract Previous studies have shown that MALDI-imaging mass spectrometry (IMS) can be used to visualize the distri-bution of various biomolecules, especially lipids, in the cells and tissues. In this study, we report the cell-selective distri-bution of PUFA-containing glycerophospholipids (GPLs) in the mouse brain. We established a practical experimental procedure for the IMS of GPLs. We demonstrated that op-timization of the composition of the matrix solution and spectrum normalization to the total ion current (TIC) is critical. Using our procedure, we simultaneously differenti-ated and visualized the localizations of specifi c molecular species of GPLs in mouse brain sections. The results showed that PUFA-containing phosphatidylcholines (PCs) were dis-tributed in a cell-selective manner: arachidonic acid- and docosahexaenoic acid-containing PCs were seen in the hip-pocampal neurons and cerebellar Purkinje cells, respec-tively. Furthermore, these characteristic localizations of PUFA-PCs were formed during neuronal maturation. The phenomenon of brain cell-selective production of specifi c PUFA-GPLs will help elucidate the potential physiological functions of PUFAs in specifi c brain regions. — Sugiura, Y., Y. Konishi, N. Zaima, S. Kajihara, H. Nakanishi, R. Taguchi, and M. Setou. Visualization of the cell-selective distribution of PUFA-containing phosphatidylcholines in mouse brain by imaging mass spectrometry. J. Lipid Res . 2009. 50: 1776–1788.
Supplementary key words MALDI • imaging MS • LC ESI-MS/MS • phospholipids • development
This work was supported by the SENTAN program of the Japan Science and Technology Agency and a WAKATE-S grant from the Japan Society for the Pro-motion of Science to M.S.
Manuscript received 4 February 2009 and in revised form 28 April 2009.
Published, JLR Papers in Press, May 5, 2009. DOI 10.1194/jlr.M900047-JLR200
Visualization of the cell-selective distribution of PUFA-containing phosphatidylcholines in mouse brain by imaging mass spectrometry
Yuki Sugiura,* ,†,§§ Yoshiyuki Konishi, †,§§ Nobuhiro Zaima, †,§§ Shigeki Kajihara, § Hiroki Nakanishi,** ,†† Ryo Taguchi,** ,†† and Mitsutoshi Setou 1,†, §§
Department of Bioscience and Biotechnology,* Tokyo Institute of Technology, 4259 Nagatsuta-cho, Midori-ku, Yokohama, Kanagawa 226-8501, Japan; Mitsubishi Kagaku Institute of Life Sciences, † 11 Minamiooya, Machida, Tokyo 194-8511, Japan; Technology Research Laboratory, § Shimadzu Corporation, 3-9-4, Hikaridai, Seika-cho, Souraku-gun, Kyoto 619-0237, Japan; Department of Metabolome,** Graduate School of Medicine, University of Tokyo, 7-3-1 Hongou, Bunkyo-ku, Tokyo 113-0033, Japan; Core Research for Evolutional Science and Technology, †† 4-1-8 Honcho, Kawaguchi, Saitama 332-0012, Japan; and Department of Molecular Anatomy, §§ Hamamatsu University School of Medicine, Handayama 1-20-1, Hamamatsu, Shizuoka 431-3192, Japan
Abbreviations: AA, arachidonic acid; DHA, docosahexaenoic acid; DHB, dihydroxybenzoic acid; GPL, glycerol phospholipid; IMS, imag-ing mass spectrometry; ITO, indium-tin-oxide; PC, phosphatidylcho-line; PCA, principle component analysis; PLA 2, phospholipase A 2 ; QIT, quadrupole ion trap; SIMS, secondary IMS; TIC, total ion current; TOF, time-of-fl ight.
1 To whom correspondence should be addressed. e-mail: [email protected]
The online version of this article (available at http://www.jlr.org) contains supplementary data in the form of eight tables.
by guest, on Septem
ber 23, 2018w
ww
.jlr.orgD
ownloaded from
0.DC1.html http://www.jlr.org/content/suppl/2009/05/18/M900047-JLR20Supplemental Material can be found at:

Visualization of PUFA-phospholipid distribution by imaging MS 1777
mouse brain sections. In particular, our novel observations on PUFA-PCs suggest the brain cell-selective production of specifi c PUFA-GPLs in specifi c brain regions.
MATERIALS AND METHODS
Chemicals Methanol, trifl uoroacetic acid, potassium acetate, and lithium
acetate were purchased from Wako Chemical (Tokyo, Japan). Calibration standard peptide and 2,5-dihydroxybenzoic acid (DHB) were purchased from Bruker Daltonics (Leipzig, Ger-many). Synthesized 17:0 lyso-PC was purchased from Avanti Polar Lipid (Alabaster, AL).
Euthanization of animals and tissue extraction All experiments with mice were conducted according to the
protocols approved by the Animal Care and Use Committee of the Mitsubishi Kagaku Institute of Life Sciences. The brains of male C57BL/6J Cr mice at the indicated ages (1 and 12 postnatal days, 7 and 96 postnatal weeks) were used. Mouse brains were extracted within a minute (typically in 40 s) after euthanization. Postmortem degradation of GPLs was observed within 15 min by
however, lack of lipid visualization systems has made lipid distributions diffi cult to determine.
Imaging mass spectrometry (IMS) is a unique detection technique that allows visualization of the distribution of various biomolecules in tissue sections ( 15, 16 ). Several studies have shown that MALDI-IMS can be used to visualize the distribution of endogenous metabolites in cells and tis-sues ( 17–19 ), especially GPLs ( 20–25 ) and drug metabolites ( 26–28 ), as well as imaging with SIMS based IMS ( 29–32 ). One of the advantages of IMS is the ability to discriminate among structurally heterogeneous molecules by their masses ( 33, 34 ) and image them simultaneously. A recent breakthrough in statistical IMS ( 35–38 ) has enabled com-prehensive imaging analysis of GPL molecular families.
This article presents and demonstrates an improved ex-perimental procedure that further enables highly qualitative IMS. This technical improvement in IMS contributes toward in situ lipidomics, allowing profi ling of large-scale changes in lipid composition or determining the topographical distribu-tion of individual lipid species in neural cells. Using our procedure, we simultaneously differentiated and visualized the localizations of specifi c molecular species of GPLs in
Fig. 1. Generation of multiple molecular ions from a single PC molecular species was reduced by adding an alkali-metal salt to the matrix solution. A: Spectra obtained from sections of mouse brain-homogenate using matrix solution with/without potassium acetate. The use of the salt-added matrix solution allowed multiple molecular ion-forms of PCs to be reduced to a single potassiated molecular ion form. B: Ion intensities of two PC species, PC (diacyl-16:0/16:0) and PC (diacyl-16:0/18:1), in three molecular ion forms, protonated, sodiated, and potassiated molecules. Error bars indicate SD.
by guest, on Septem
ber 23, 2018w
ww
.jlr.orgD
ownloaded from
0.DC1.html http://www.jlr.org/content/suppl/2009/05/18/M900047-JLR20Supplemental Material can be found at:
1778 Journal of Lipid Research Volume 50, 2009
slides (Bruker Daltonics) and ITO-coated sheets (Tobi Co., Ltd., Kyoto, Japan). The slides were used for tandem time-of-fl ight (TOF/TOF) measurements and the sheets were used for quadru-pole ion trap (QIT)-TOF measurements. Prepared sections were subjected to matrix application within 5 min.
Spray-coating of the matrix solution A DHB solution (40 mg/ml DHB, 20 mM potassium acetate,
70% MetOH, 0.1% trifl uoroacetic acid) was used as the matrix solution for imaging of PCs. The matrix solution was sprayed over the tissue surface using a 0.2-mm nozzle caliber airbrush (Procon Boy FWA Platinum; Mr. Hobby, Tokyo, Japan). Matrices were applied simultaneously to the tissue sections that were to be compared with equalized analyte extraction and cocrystallization conditions. The distance between the nozzle tip and the tissue
IMS in a series of mouse brains extracted at different times (15, 30, 60, and 120 min, see also supplementary Fig. I), presumably because of stimulation by phospholipase A (PLA) under ische-mic conditions ( 39, 40 ). The trimmed tissue blocks were imme-diately frozen in powdered dry ice, allowing tissues to be frozen without cracks, and stored at –80°C until use.
Tissue section preparation Tissues blocks were sectioned at –16°C using a cryostat (CM
3050; Leica, Germany) to a thickness of 5 µm, as described in previous reports ( 41, 42 ). Although brain blocks were held by an optimum cutting temperature polymer, they were not embedded into it, because it was thought that any residual polymer on the tissue slices might degrade the mass spectra ( 42 ). The frozen sec-tions were thaw-mounted on indium-tin-oxide (ITO)-coated glass
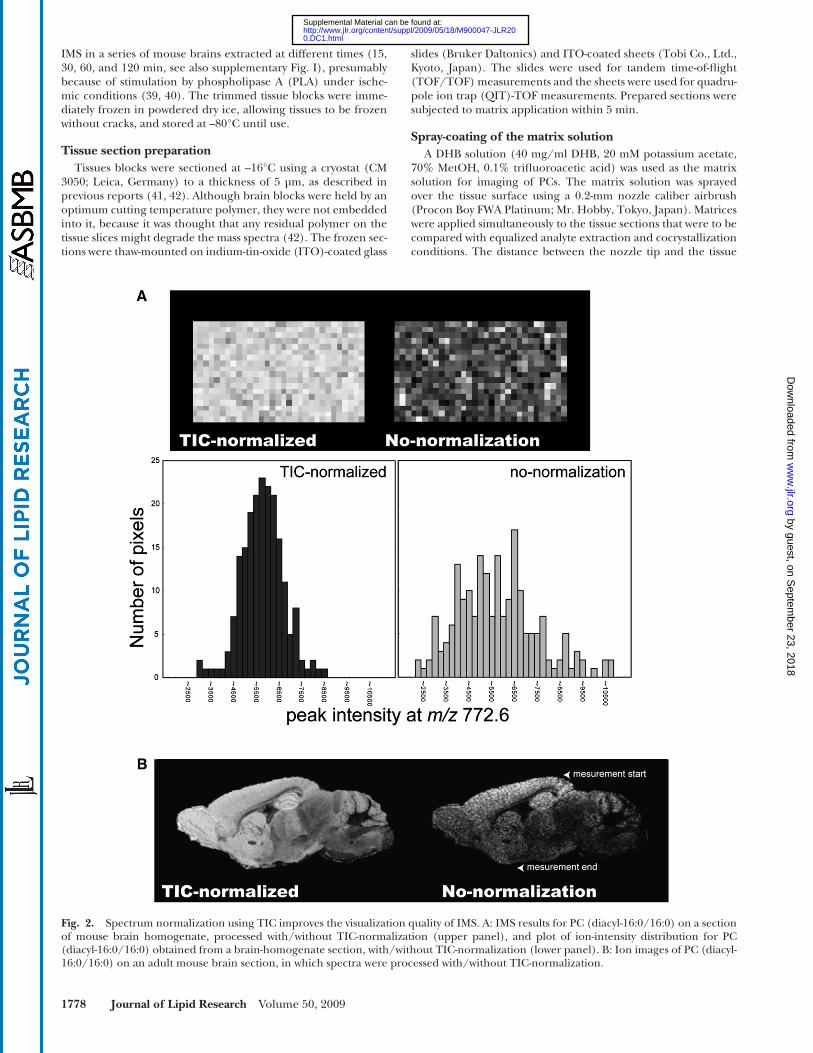
Fig. 2. Spectrum normalization using TIC improves the visualization quality of IMS. A: IMS results for PC (diacyl-16:0/16:0) on a section of mouse brain homogenate, processed with/without TIC-normalization (upper panel), and plot of ion-intensity distribution for PC (diacyl-16:0/16:0) obtained from a brain-homogenate section, with/without TIC-normalization (lower panel). B: Ion images of PC (diacyl-16:0/16:0) on an adult mouse brain section, in which spectra were processed with/without TIC-normalization.
by guest, on Septem
ber 23, 2018w
ww
.jlr.orgD
ownloaded from
0.DC1.html http://www.jlr.org/content/suppl/2009/05/18/M900047-JLR20Supplemental Material can be found at:

Visualization of PUFA-phospholipid distribution by imaging MS 1779
by guest, on Septem
ber 23, 2018w
ww
.jlr.orgD
ownloaded from
0.DC1.html http://www.jlr.org/content/suppl/2009/05/18/M900047-JLR20Supplemental Material can be found at:

1780 Journal of Lipid Research Volume 50, 2009
surface was held at 10 cm and the spraying period was fi xed at 5 min. Approximately 100 � l of matrix solution was sprayed onto each brain section.
A properly handled spray-coating step created a uniform ma-trix crystal layer on the surface (supplementary Fig. IA), and awareness of some technical points contributed to success. First, too small a distance between the airbrush and the tissues (<10 cm) often resulted in large droplets of matrix solution and inho-mogeneous crystals (supplementary Fig. IIB). Second, humidity is also important factor. Room humidity was held under 25% at room temperature (25°C). High humidity tends to cause forma-tion of needle-like crystals, as shown in supplementary Figure IIC (>80%, at room temperature).
Reduction of the generation of multiple molecular ions from a single PC molecular species by addition of an alkali-metal salt to the matrix solution
PCs undergo preferential cationization with alkalis to form metal-adduct molecules ( 22, 43, 44 ). Because tissue sections are rich in sodium and potassium salts, such alkali-metal adduct phospholipids, rather than protonated molecules, are preferen-tially generated ( Fig. 1A ). Molecular ionization with such mul-tiple ion forms from a single species often hampers IMS experiments for several reasons. First, the distribution image of GPLs might not refl ect the actual distribution of GPLs but rather the heterogeneous distribution of salts. Second, because GPLs have many molecular species, a single peak might contain multi-ple types of ions. Indeed, for example, a protonated PC (diacyl-16:0/20:4) molecule is detected as having the same mass as a sodiated PC (diacyl-16:0/18:1) ion at m/z 782 ( Fig. 1A ). To over-come this problem, it is important to reduce the potential ion forms to a single alkali-metal adduct form. In this study, potas-sium salt was added to the matrix solution (20 mM potassium acetate). As a result, the molecular ion forms were limited to po-tassium adducts and the spectra were simplifi ed ( Fig. 1A, B ). Consequently, the two types of PCs detected at m/z 782 described above could be separated at m/z 820 and m/z 798.
Tandem mass spectrometry Molecular identifi cation was performed with tandem mass
spectrometry (MS n ) analysis using a QIT-TOF mass spectrometer (AXIMA-QIT; Shimadzu, Kyoto, Japan) to ensure molecular as-signment only by mass. The MS n analysis was performed directly on the mouse brain sections. Acquisition was performed in the mid-mass range mode ( m/z 750–2000) at a stage voltage of 18 V in the positive-ion detection mode. Calibration was performed using an external calibration method. To perform accurate mo-lecular identifi cation of PC molecular species by using the QIT-TOF instrument, we performed MS 3 analysis following MS 2 analysis by using ions at [M-59 u] + , which correspond to the ions with neutral loss of trimethylamine groups. We assigned ions to PC molecules that showed neutral loss of phosphate acid groups (–124 u) during MS 3 analysis, because this loss indicates that the analyzed molecules contain trimethylamine and phosphate groups. Owing to the instrumental specifi city of QIT devices, they cannot trap small ions ( m/z < 200) in the “mid-range mode” and therefore cannot detect signals in the small m/z region dur-ing MS n analysis.
IMS conditions IMS was performed using a MALDI TOF/TOF-type instru-
ment (Ultrafl ex 2 TOF/TOF; Bruker Daltonics) with modifi ed laser focusing system. This instrument was equipped with a 355 nm Nd:YAG laser. The data were acquired in the positive refl ec-tron mode under an accelerating potential of 20 kV using an ex-ternal calibration method. Signals between m/z 400 and 1000 were collected. Raster scans on tissue surfaces were performed automatically using FlexControl and FlexImaging 2.0 software (Bruker Daltonics). The number of laser irradiations was 100 shots in each spot. Image reconstruction was performed using FlexImaging 2.0 software.
Spectrum normalization with TIC improves quantitation and visualization quality in IMS
The addition of salt to the matrix solution effectively reduces the molecular ion forms of GPLs. However, salts interfere with the matrix-analyte crystallization process and thus, lead to the develop-ment of heterogeneous crystals, which in turn results in spot-to-spot variance of signal intensities ( 45, 46 ). This problem was solved using a spectrum-normalization procedure with TIC ( Fig. 2 ).
We performed spectrum normalization with TIC for each mass spectrum by using software that we developed. The obtained spectra were multiplied with arbitrary variables such that all spectra had equal TIC values [i.e., equal integral values of the measured m/z re-gion (400 < m/z < 900)]. Such TIC normalization is also available with the “Normalize Spectra” function of FlexImaging 2.0 software with fi lter function to exclude a number of noise spectra from the normalization process (see details in the software manual).
To evaluate the effect of the normalization procedure, we pre-pared a section of mouse brain homogenate that had a uniform distribution of biomolecules. Fig. 2A shows the ion images for m/z 772.6 corresponding to PC (diacyl-16:0/16:0), with and with-out spectrum normalization. After the normalization procedure, the image was corrected such that the ion distribution was uni-form throughout the section. The signal intensity was then plotted and found to have a Gaussian distribution. Spectrum normaliza-tion with TIC improved the results of the IMS of mouse brain sections. Fig. 2B shows the ion images of a mouse brain section for PC (diacyl-16:0/16:0), with and without spectrum normaliza-tion. In the ion image without normalization, the ion distribution was heterogeneous, even between adjacent pixels. Furthermore, the signal intensity was found to decrease with time (arrowhead). In contrast, when the normalization procedure was used, a clear ion-distribution pattern that correlated well with the anatomical features of the brain section was obtained.
LC/ESI-MS/MS To identify the PC species, precursor ion scanning was performed
using the 4000Q-TRAP instrument; these methods are effective for detecting PCs because characteristic fragment ions are generated by collision-induced dissociation ( 47 ) (for details regarding the experi-mental conditions, see the supplementary information).
Multivariate statistical analysis An N-by-P data matrix was constructed from the intensity of N
pixels and P peaks and then principle component analysis
Fig. 3. Primary PC molecular species simultaneously detected in mouse brain sections by IMS. A: An averaged mass spectrum obtained from an entire mouse brain section. In the spectrum, intense mass peaks corresponding to nine abundant PCs were assigned according to mass. B: Results of MS n structural analysis of ions corresponding to the PCs. Both MS 2 and MS 3 product ion spectra show that the mass peaks are derived from the PCs. Neutral losses (NL) of 59 u and 124 u from precursor ions, corresponding to trimethylamine and cyclophos-phate, respectively, were used as diagnostic ions. Also refer to Table 2 .
by guest, on Septem
ber 23, 2018w
ww
.jlr.orgD
ownloaded from
0.DC1.html http://www.jlr.org/content/suppl/2009/05/18/M900047-JLR20Supplemental Material can be found at:

Visualization of PUFA-phospholipid distribution by imaging MS 1781
brain sections were visualized (see also supplementary Figs. III–V). For this purpose, a TOF/TOF mass spec-trometer was used that had high sensitivity in single-stage MS. Figure 4 shows the IMS results for the primary brain PCs. Whereas the most abundant molecular PC species, PC (diacyl-16:0/18:1), was uniformly distributed across the entire gray matter region of each section, other PC molecular species showed rather heterogeneous distri-bution patterns. In particular, the PUFA-PCs, which are both AA-PCs and DHA-PCs, showed characteristic pat-terns. Three AA-containing species, PC (diacyl-16:0/20:4), PC (diacyl-18:0/20:4), and PC (diacyl-18:1/20:4), were abundant and commonly concentrated in the pyra-midal and granular cell layer regions in the hippocampal formation (arrowheads). Two DHA-containing species, PC (diacyl-16:0/22:6) and PC (diacyl-18:1/22:6), were abundant and commonly enriched in the granule cell layer of the cerebellum, whereas PC (diacyl-18:0/22:6) showed a characteristic dotted distribution pattern near the same layer. Among PCs with monounsaturated fatty acids (MUFA), PC (diacyl-16:0/18:1) was enriched in the white matter or in the region containing the myelin sheath.
PUFA-containing PCs were highly detected in specifi c neural cell types
The characteristic localization of PUFA-containing PCs was then determined. To study their distribution in more detail, high-magnifi cation IMS was performed at an instru-mental raster step size (raster size) of 15 � m. In the magni-fi ed images of the hippocampal formation, all three abundant AA-PCs were found in the regions correspond-ing to the hippocampal cell layers, i.e., the pyramidal and granule cell layers of the dentate gyrus ( Fig. 5 ). On the other hand, PC (diacyl-16:0/16:0) was enriched outside of the pyramidal and granule cell layers ( Fig. 5B ). Also, an intensive dotted distribution pattern of PC (diacyl-18:0/22:6) was observed in the cerebellum ( Fig. 4 ). Using high-magnifi cation IMS of the cerebellar cortex, PC (diacyl-18:0/22:6) was found to be enriched in the Purkinje cell layer ( Fig. 6 ). Optical observation of successive hema-toxylin-eosin (HE)-stained brain sections also suggested that PC (diacyl-18:0/22:6) was selectively detected in Purkinje cells ( Fig. 6 , arrowheads) and in molecular layers in which dendrites of Purkinje cells exist. In contrast, granule cells were impoverished in PC (diacyl-18:0/22:6). Interestingly, a complementary distribution of two other
TABLE 1. Results of MS and MSn with the intense mass peaks obtained directly from the mouse brain sections
Observed MassObserved Ions
in MS 2 Observed Ions
in MS 3 Assigned Molecular
Species
772.4 713.1 588.9 [PC(diacyl-16:0/ 16:0)+K] +
798.4 739.3 615.1 [PC(diacyl-16:0/ 18:1)+K] +
820.5 761.3, 637.0 637.0 [PC(diacyl-16:0/ 20:4)+K] +
826.5 767.3 643.0, 605.0 [PC(diacyl-18:0/ 18:1)+K] +
844.5 785.3 661.0, 623.0 [PC(diacyl-16:0/ 22:6)+K] +
846.5 787.4 663.2 [PC(diacyl-18:1/ 20:4)+K] +
848.5 789.4 665.2 [PC(diacyl-18:0/ 20:4)+K] +
870.6 811.5, 687.3 687.3 [PC(diacyl-18:1/ 22:6)+K] +
872.6 813.4 689.1 [PC(diacyl-18:0/ 22:6)+K] +
TABLE 2. Molecular species of PCs from mouse whole brain lysate identifi ed by UPLC/ESI-MS/MS (n = 3)
Molecular Species Relative Abundance SD
16:0/18:1 10016:0/16:0 58.5 4.418:0/18:1 48.2 2.516:0/22:6 35.1 3.216:0/20:4 29.3 3.818:0/22:6 19.8 1.818:0/20:4 14.7 0.818:1/20:4 10.2 1.518:1/22:6 8.5 0.7
(PCA) was performed using MATLAB ™ software (Mathworks, Inc., Sherborn, MA) (for details, see the supplementary informa-tion).
RESULTS
Determination of the composition of PC molecular species in the mouse brain
First, IMS of sagittal mouse brain sections was performed using the positive ion detection mode, and approximately 150 mass peaks in the mass range of 700 < m / z < 900 ( Fig. 3A ) were detected. Among these, nine intense mass peaks were assigned using their masses to abundant PC molecu-lar species and one sphingomyelin, all of which contain a trimethylamine head group. In addition, these assignments were verifi ed with structural analysis of each peak using MS n ( Fig. 3B ). For this purpose, a QIT-TOF mass spectrom-eter was used. This instrument can identify molecules us-ing a highly sensitive MS n from mixture ions generated on the tissue surface ( 48 ). Table 1 summarizes the results of MS and MS n . In each mass peak, the presence of a trime-thylamine head group and phosphate was confi rmed (neu-tral losses of 59 u and 124 u from precursor ions, corresponding to trimethylamine and cyclophosphate, re-spectively), and these were used as diagnostic ions in prod-uct ion mass spectra ( 48–50 ) ( Fig. 3 ).
In addition, we determined the accurate abundance ra-tios for PC-molecular species in the mouse brain. For this purpose, LC/ESI-MS/MS was employed, which enabled quantitative analysis of GPLs and identifi cation of the fatty acids linked at the sn- 1 and sn- 2 positions ( 51 ). Table 2 summarizes the quantitative composition of PC molecular species in the total brain lysate.
Distinct distributions of PC molecular species in the mouse brain
Next, the tissue distributions of the nine major PC mo-lecular species in the entire and various regions of the
by guest, on Septem
ber 23, 2018w
ww
.jlr.orgD
ownloaded from
0.DC1.html http://www.jlr.org/content/suppl/2009/05/18/M900047-JLR20Supplemental Material can be found at:

1782 Journal of Lipid Research Volume 50, 2009
Fig. 4. Differential distribution of PC molecular species in sagittal mouse brain sections. MALDI-IMS spectra of a brain section simultane-ously identifi ed the heterogeneous distributions of several PCs. Schema of the mouse brain sagittal section and ion images of PCs obtained by IMS are shown. Ion images of PCs are arranged according to their fatty acid (FA) composition. PCs with identical FA compositions at the sn-1 position are arranged lengthwise, whereas those with identical FA compositions at the sn-2 position are arranged sideways. The structures of PCs are also presented. Among the PCs, AA-PCs showed characteristic localization in the hippocampal cell layers (arrow-heads). Among DHA-containing species, two abundant species, PC (diacyl-16:0/22:6) and PC (diacyl-18:1/22:6), were commonly enriched in the granule layer of the cerebellum, whereas PC (diacyl-18:0/22:6) showed a characteristic dotted distribution pattern near the cell layer (arrows). CBX, cerebellar cortex; CP, corpus striatum; CTX, cerebral cortex; HPF, hippocampal formation; TH, thalamus.
abundant DHA-PCs, PC (diacyl-16:0/22:6) and PC (diacyl-18:1/22:6), was observed in the granule cells of the cere-bellum ( Fig. 6C, D ).
Statistical analysis revealed temporal and spatial changes in PCs with age
Having demonstrated the cell-selective distribution of PUFA-PCs in the adult mouse brain, changes in the distri-bution and amount of PC molecular species at various ages were evaluated. Studies of humans and several other mam-malian species have shown that some PUFAs, including AA and DHA, are selectively incorporated and accumulated in GPL bilayers during brain development ( 52–55 ), but information on the locations of these PUFAs in the brain has not been available. Knowledge of when and where the changes occur would provide insight into the possible functions of PUFAs at specifi c brain locations. PC molecu-lar species were comprehensively analyzed and their PUFA-PC distribution patterns and amounts in a develop-
mental series of brain sections were obtained postnatally at 1 day, 12 days, 7 weeks, and 96 weeks.
To extract important information from such large IMS data sets (40,000 data points for the four developing brain sections), PCA, an unsupervised multivariate data analysis technique ( 37, 38, 56 ), was used. PCA is useful for obtain-ing an overview of entire data sets (i.e., general trends in fl uctuations in GPLs’ expression with development) be-fore proceeding to a more detailed data analysis (i.e., vi-sualization of individual GPLs). For a detailed description of the procedure and results of PCA, see the supplemen-tary information. Table 3 summarizes the results and in-terpretation of the PCA. To locate the brain regions or developmental time points with spectral fl uctuations, the principal components were scored by color at each data point ( Fig. 7 , top line of each panel). It was assumed that components 2, 3, and 4 contained important information because of their heterogeneous distributions of compo-nent scores among sections. Eventually, it was determined
by guest, on Septem
ber 23, 2018w
ww
.jlr.orgD
ownloaded from
0.DC1.html http://www.jlr.org/content/suppl/2009/05/18/M900047-JLR20Supplemental Material can be found at:

Visualization of PUFA-phospholipid distribution by imaging MS 1783
and PC (diacyl-16:0/16:1), especially in the cerebral cor-tex, and their levels in the adult brains were quite low (ar-rowheads). On the other hand, PC (diacyl-18:0/18:1) accumulated in the white matter with myelin formation, especially in the callous corpus and in the medulla and white matter of the cerebellum (arrows).
Characteristic PUFA-PC distribution patterns during brain development
Second, component 3 represents the accumulation of AA-PCs during the formation of the hippocampus, cere-bral cortex, corpus striatum, and granule cell layer of the cerebellum. As with the component 2 analysis, the focus was on the increase in component 3 score with develop-ment in the above-mentioned regions ( Fig. 7B inset). In this principal component, AA-PCs, namely PC (diacyl-16:0/20:4) and PC (diacyl-18:0/20:4), largely contributed to the statistical changes ( Table 3 ). Visualization con-fi rmed that the expression levels of the AA-PCs were cer-tainly increased, especially in the hippocampal cell layers and corpus striatum. As the arrowheads indicate, a faint localization observed at P1 had progressed in P12 and was clearly identifi ed in the adult brains.
Finally, component 4 represents the accumulation of DHA-PCs in the cell layers of the cerebellum. Component 4 scores clearly trended higher in the cerebellar cortex, espe-cially in the molecular and granule cell layers. In this case, DHA-PCs, namely, PC (diacyl-16:0/22:6) and PC (diacyl-18:0/22:6), were expected to be associated with the statistical difference in the component score ( Table 3 ). In particular, PC (diacyl-18:0/22:6), which was contained in the soma and dendrites of Purkinje cells, progressively became enriched and formed a dotted distribution pattern in the cerebellum, whereas at P1 it was distributed at the surface of the cerebel-lar cortex (arrows) where immature Purkinje cells can be found. Also, PC (diacyl-18:0/22:6) progressively accumulated in the granule cell layer of the cerebellum (arrowheads). In addition to PCA, other multivariate analyses were performed, namely ICA (supplementary Fig. VI and Table 4 ). Although PCA extracted the information most effi ciently, ICA also identifi ed other trends in expression changes summarized in Table 4 . As a consequence, both multivariate analyses characterized the accumulation of PUFA-PCs in specifi c regions from total expression changes.
DISCUSSION
IMS is an effective tool for lipid imaging In this report, a practical method using IMS was intro-
duced for visualizing GPL distribution in mouse brains, and the capability of IMS was demonstrated as a potential stan-dard technology for lipid imaging. Applying the technique, the distribution patterns of GPL molecular species in vari-ous regions of the mouse brain were comprehensively de-termined and an atlas of distribution maps was generated.
IMS is effective for detecting ( 21, 22, 57 ) and visualizing GPLs ( 20, 58–60 ). A large amount of GPLs in the brain (more than 50% dry weight) and an easily charged struc-
that they represented three signifi cant trends in PC ex-pression changes.
Characteristic saturated fatty acid/MUFA-PC expression patterns during brain development
As the fi rst trend, component 2 represents the reduc-tion of PCs with C14-16 fatty acids (myristic and palmitoyl acid) and the accumulation of myelin-constituting PCs with development. The inset of Fig. 7A shows that the component 2 scores for spectra in the infant brains (P1 and P12; P, postnatal day) were higher than those in the adult brains (7 and 96 weeks old). As Table 3 shows, PCs with C14-16 fatty acids, namely PC (diacyl-14:0/16:0) and PC (diacyl-16:0/16:1), along with a myelin-constituting PC, namely PC (diacyl-18:0/18:1), were suggested to be associated with the statistical difference in the component score. As expected, the visualization of each molecular species showed drastic reductions in PC (diacyl-14:0/16:0)
Fig. 5. AA-containing PCs are localized in the cell layers in the hippocampal formation. High-magnifi cation IMS at a raster size of 15 � m (C, E, and G), and successive section stained with HE (A) revealed that AA-containing PCs were enriched in the cell layer regions of the hippocampal formation, which are the pyramidal cell layer of CA1 and the granule cell layer of DG, whereas PC (16:0/16:0) was widely distributed in the dendritic region of the hippocampal formation (B). D, F, and H: merged images. The rela-tive abundance of the 2 ions is indicated in the color scale bar.
by guest, on Septem
ber 23, 2018w
ww
.jlr.orgD
ownloaded from
0.DC1.html http://www.jlr.org/content/suppl/2009/05/18/M900047-JLR20Supplemental Material can be found at:

1784 Journal of Lipid Research Volume 50, 2009
spectrum processing, including a normalization process, is effective in improving IMS-data. The present results demonstrated that, in lipid study, the normalization pro-cess eliminated spot-to-spot variances in signal intensity on the brain homogenate section ( Fig. 2A ), and improved both qualitative and the semi-quantitative ability ( Fig. 2B ) even among different sections. For the absolute quantifi -cation of micro-region GPLs, further studies, such as those using microdissection technology and LC/ES-MS/MS, are required.
Visualization of GPL distributions revealed characteristic localizations of PUFA-PCs
A properly performed IMS experiment can generate ion distribution maps that are informative for exploring GPLs in a tissue section. By employing this technique, a number of PC molecular species were visualized simultaneously in a mouse brain section and the distribution patterns of the species were found to be quite heterogeneous ( Fig. 4 ). The most impressive fi nding is that some PUFA-PCs were selec-tively obtained by specifi c cells ( Figs. 3 and 4 ).
Among the classes of GPLs, PCs are the most abun-dant structural component of neural and glial cell mem-
ture (e.g., phosphate ester) yield high-ionization effi -ciency. In particular, in the positive-ion detection mode, molecular species of choline-containing lipids (e.g., PC, lyso-PC, and sphingomyelin) are highly ionized due to their trimethylamine head group ( 61 ). Despite the prom-ising capability of IMS for GPL imaging, improvement in its quantitative ability and reproducibility are necessary due to the nature of MALDI-direct MS. For example, ex-cess endogenous salts and their tissue localizations perturb the ion images of specifi c molecules. The present study demonstrated that adding an alkali-metal salt to the ma-trix solution is an effective way to minimize molecular ion adducts ( Fig. 1 ). Also, complex analyte-extraction and crystallization processes on the tissue surface generate spot-to-spot variances in analyte ionization effi ciency. In addition, an IMS experiment with a large number of data points takes a long time (<8 h), and therefore, the subli-mation of matrix crystals occurs (especially in a high vac-uum chamber). This results in a decrease in signal intensity, as shown in Fig. 2C . The study results demonstrated that spectrum normalization using TIC is effective in correct-ing heterogeneous ionization effi ciency ( Fig. 2 ). In a pro-tein study, Norris et al. ( 62 ) previously reported that
TABLE 3. Results and interpretation of PCA of the developing mouse brain
Primary Contributing PCs Interpretation of the Component
Component 2 PC(diacyl-14:0/16:0) PC(diacyl-16:0/16:1) PC(diacyl-18:0/18:1) Reduction in PCs with short-chain fatty acids and accumulation of myelin- constituted PCs
Component 3 PC(diacyl-16:0/20:4) PC(diacyl-18:0/20:4) PC(diacyl-16:0/18:1) Accumulation of two abundant AA-PCs in the hippocampus, cerebral cortex, corpus striatum, and granule cell layer of the cerebellum
Component 4 PC(diacyl-18:0/22:6) PC(diacyl-16:0/22:6) PC(diacyl-18:1/22:6) Accumulation of DHA-PCs in the cerebellum
Fig. 6. Purkinje cells selectively contained a DHA-containing PC. High-magnifi cation IMS at a raster size of 15 � m revealed the Purkinje cell-selective distribu-tion of PC (diacyl-18:0/22:6) in the cerebellum. Both optical observation of HE-stained successive brain sec-tions (A and E) and ion images of DHA-PCs (B and F) clearly suggest that the PC was enriched in the Purkinje cell layer (arrowheads). Interestingly, a complementary distribution of another abundant DHA-PC, PC (diacyl-16:0/22:6), was enriched in the granule layer of the cerebellum (C and G). D: merged image. ML, molecu-lar layer; GL, granule layer; W, white matter. The rela-tive abundance of the two ions is indicated in the color scale bar.
by guest, on Septem
ber 23, 2018w
ww
.jlr.orgD
ownloaded from
0.DC1.html http://www.jlr.org/content/suppl/2009/05/18/M900047-JLR20Supplemental Material can be found at:

Visualization of PUFA-phospholipid distribution by imaging MS 1785
by guest, on Septem
ber 23, 2018w
ww
.jlr.orgD
ownloaded from
0.DC1.html http://www.jlr.org/content/suppl/2009/05/18/M900047-JLR20Supplemental Material can be found at:

1786 Journal of Lipid Research Volume 50, 2009
Visualization of spatio-temporal changes of GPL composition by IMS
Neural cell membranes are dynamic entities whose lipid constituents are continuously adjusted ( 55 ). The fatty acid composition of tissues is known to change throughout de-velopment and the changes differ among the classes of GPLs ( 52–55 ). The novelty of the present study is that, by visualizing these changes, functional insight was obtained into these biochemical processes. For example, a previ-ously reported developmental increase in oleic acid (18:1) was revealed by IMS to result from the accumulation of PC (diacyl-18:0/18:1) in the myelin-containing region during maturation ( Fig. 7A ). Furthermore, even alterations in microdomains could be identifi ed, which are diffi cult to separate using conventional biochemical approaches. Although previous studies have shown that increases in the levels of AA and DHA are relatively small in the total brain lysate, the present study found that enrichment oc-curred in a quite region-specifi c manner. AA and DHA were observed to accumulate primarily in the cell layers of the hippocampal formation and cerebellum, respectively ( Fig. 7B ), presumably in the nuclear membrane, during functional maturation. Such dynamic changes in GPL composition may be attributed to the temporal and het-erogeneous expression of the lysophospholipid acyltrans-ferase family, which have been recently characterized ( 69 ). Further study, focused on fl uctuations in expression of these enzymes with time and location, coupled with the presented distribution map, is needed to understand how GPL diversity is established with development.
This article focused on PCs because of the space limitations; however, analyses of other GPLs and gly-cosphingolipids, including phosphatidylethanolamine, phos phatidylinositol, phosphatidylserine, and sulfatides, are also available, as shown in supplementary Figs. VII and VIII. As a result of the technical improvement de-scribed in this article, an atlas could be provided of these GPLs over time and space. For PCs, distribution maps were generated that cover multiple molecular species at various ages and brain regions. This data set indicates the necessity of region-specifi c studies in brain lipidomics
Fig. 7. IMS-PCA analysis of the developmental mouse brains revealed dynamic changes in PC expression. IMS was performed on a devel-opmental series of four mouse brain sections, obtained postnatally on days 1 and 12 and in weeks 7 and 96, and then PCA was performed to extract general trends in PC expression fl uctuation during development. Three trends emerged. A: PC2 represents a reduction in PCs with short-chain fatty acids and an accumulation of myelin-constituted PCs with development. B: PC3 represents an accumulation of AA-PCs in the hippocampal formation, cerebral cortex, corpus striatum, and granule cell layer of the cerebellum. C: PC4 represents an accumulation of DHA-PCs in the cell layers of the cerebellum. In each panel, the upper row illustrates the principal component score for each pixel, and the lower rows show the results of individual visualizations of PCs that have large loading factors for each principal compo-nent. The brain sections were HE-stained and optical images of the sections are shown.
TABLE 4. Results and interpretation of ICA of the developing mouse brain
Primary Contributing PCs Interpretation of the Component
Component 1 PC(diacyl-16:0/18:1) PC(diacyl-16:0/16:0) PC(diacyl-16:0/18:0) Accumulation of PCs with SFA and MUFAComponent 2 PC(diacyl-18:0/18:1) PC(diacyl-14:0/16:0) PC(diacyl-16:0/16:1) Reduction in PCs with short-chain fatty acids and
accumulation of myelin-constituted PCsComponent 3 PC(diacyl-16:0/20:4) PC(diacyl-18:0/20:4) PC(diacyl-16:0/16:1) Accumulation of two abundant AA-PCs in the
hippocampus, cerebral cortex, corpus striatum, and granule cell layer of the cerebellum
branes, and the fatty acid constituents of PCs (i.e., molecular species) infl uence the membranes’ physical properties, including fl uidity and curvature ( 7, 30, 63, 64 ).
Thus, the cell-type heterogeneity of the fatty-acid con-stituent in part refl ects the cells’ heterogeneous mem-brane properties. Figure 6 shows that PC (diacyl-18:0/22:6) was contained in Purkinje cells in the cerebellum. Both ion and optical images indicate that this DHA-containing PC molecular species was highly contained not only in the soma but also in the dendrites of Purkinje cells. Be-cause of their high degree of unsaturation, DHA-GPLs increase membrane fl uidity and even regulate the func-tions of membrane-associated proteins ( 65–67 ). Purkinje cells are the largest neurons in the brain, with intricately elaborate dendritic arbors. Thus, higher membrane fl u-idity may be required for effective transport of mem-brane-associated proteins via the plasma membrane. Therefore, the high-level expression of DHA-PC may con-tribute to the transportation of membrane proteins in the cells.
Also, it is well known that GPLs, including PCs, serve as reservoirs of PUFAs, which are released and converted into bioactive lipids in response to extracellular stimuli, and which mediate various important biological processes ( 9 ). Thus, the cell-type specifi city of PUFA storage constitu-ents is worth describing. Figure 5 shows that AA-containing PCs are enriched in the cell layers of pyramidal neurons of CA1 and of granule neurons of the dentate gyrus. The prominent detection of AA-PCs in such cells suggests the storage of large amounts of AA. Judging from their local-ization pattern, they are presumably enriched in the nu-clear membranes of the cells. In fact, AA is known to be selectively incorporated and enriched in the PCs of the nuclear membrane ( 68 ). From nuclear PCs, AA is released into the cytoplasm by PLA 2 activity in response to extracel-lular stimuli, facilitating the initiation of the AA cascade ( 9 ). Thus, a high concentration of AA-PCs in the hip-pocampal cell layer indicates the necessity of producing large amounts of eicosanoids for neural activity in the hip-pocampal formation.
by guest, on Septem
ber 23, 2018w
ww
.jlr.orgD
ownloaded from
0.DC1.html http://www.jlr.org/content/suppl/2009/05/18/M900047-JLR20Supplemental Material can be found at:

Visualization of PUFA-phospholipid distribution by imaging MS 1787
and provides important information for performing such analyses.
We thank members of the Mitsubishi Kagaku Institute of Life Sciences (MITILS), particularly Dr. Maki K. Yamada, for valuable discussions.
REFERENCES
1 . Takamori , S. , M. Holt , K. Stenius , E. A. Lemke , M. Gronborg , D. Riedel , H. Urlaub , S. Schenck , B. Brugger , P. Ringler , et al . 2006 . Molecular anatomy of a traffi cking organelle. Cell . 127 : 831 – 846 .
2 . Rohrbough , J. , and K. Broadie . 2005 . Lipid regulation of the synap-tic vesicle cycle. Nat. Rev. Neurosci. 6 : 139–150.
3 . Kim , D. 2003 . Fatty acid-sensitive two-pore domain K+ channels. Trends Pharmacol. Sci. 24 : 648 – 654 .
4 . Miller , B. , M. Sarantis , S. F. Traynelis , and D. Attwell . 1992 . Potentiation of NMDA receptor currents by arachidonic acid. Nature . 355 : 722 – 725 .
5 . Jacobson , K. , O. G. Mouritsen , and R. G. Anderson . 2007 . Lipid rafts: at a crossroad between cell biology and physics. Nat. Cell Biol. 9 : 7 – 14 .
6 . Allen , J. A. , R. A. Halverson-Tamboli , and M. M. Rasenick . 2007 . Lipid raft microdomains and neurotransmitter signalling. Nat. Rev. Neurosci. 8 : 128–140.
7 . Piomelli , D. , G. Astarita , and R. Rapaka . 2007 . A neuroscientist’s guide to lipidomics. Nat. Rev. Neurosci. 8 : 743 – 754 .
8 . Yamashita , A. , T. Sugiura , and K. Waku . 1997 . Acyltransferases and transacylases involved in fatty acid remodeling of phospholipids and metabolism of bioactive lipids in mammalian cells. J. Biochem. 122 : 1 – 16 .
9 . Murakami , M. , Y. Nakatani , G. Atsumi , K. Inoue , and I. Kudo . 1997 . Regulatory functions of phospholipase A2. Crit. Rev. Immunol. 17 : 225 – 283 .
10 . Williams , J. H. , M. L. Errington , M. A. Lynch , and T. V. Bliss . 1989 . Arachidonic acid induces a long-term activity-dependent enhance-ment of synaptic transmission in the hippocampus. Nature . 341 : 739 – 742 .
11 . Dinh , T. P. , D. Carpenter , F. M. Leslie , T. F. Freund , I. Katona , S. L. Sensi , S. Kathuria , and D. Piomelli . 2002 . Brain monoglyceride lipase participating in endocannabinoid inactivation. Proc. Natl. Acad. Sci. USA . 99 : 10819 – 10824 .
12 . Han , X. , and R. W. Gross . 2003 . Global analyses of cellular lipidomes directly from crude extracts of biological samples by ESI mass spec-trometry: a bridge to lipidomics. J. Lipid Res. 44 : 1071 – 1079 .
13 . Yoshikawa , K. , Y. Kita , K. Kishimoto , and T. Shimizu . 2006 . Profi ling of eicosanoid production in the rat hippocampus during kainic acid-induced seizure: dual phase regulation and differential involve-ment of COX-1 and COX-2. J. Biol. Chem. 281 : 14663 – 14669 .
14 . Guan , X. L. , X. He , W. Y. Ong , W. K. Yeo , G. Shui , and M. R. Wenk . 2006 . Non-targeted profi ling of lipids during kainate-induced neu-ronal injury. FASEB J. 20 : 1152 – 1161 .
15 . Stoeckli , M. , P. Chaurand , D. E. Hallahan , and R. M. Caprioli . 2001 . Imaging mass spectrometry: a new technology for the analysis of protein expression in mammalian tissues. Nat. Med. 7 : 493 – 496 .
16 . Todd , P. J. , T. G. Schaaff , P. Chaurand , and R. M. Caprioli . 2001 . Organic ion imaging of biological tissue with secondary ion mass spectrometry and matrix-assisted laser desorption/ionization. J. Mass Spectrom. 36 : 355 – 369 .
17 . Shimma , S. , and M. Setou . 2007 . Mass microscopy to reveal distinct localization of heme B (m/z 616) in colon cancer liver metastasis. J. Mass Spectrom. Soc. Jpn. 55: 145–148.
18 . Burrell , M. , C. Earnshaw , and M. Clench . 2007 . Imaging matrix as-sisted laser desorption ionization mass spectrometry: a technique to map plant metabolites within tissues at high spatial resolution. J. Exp. Bot. 58 : 757 – 763 .
19 . Sugiura , Y. , S. Shimma , Y. Konishi , M. K. Yamada , and M. Setou . 2008 . Imaging mass spectrometry technology and application on ganglioside study; visualization of age-dependent accumulation of C20-ganglioside molecular species in the mouse hippocampus. PLoS One . 3 : e3232 .
20 . Garrett , T. J. , M. C. Prieto-Conaway , V. Kovtoun , H. Bui , N. Izgarian , G. Stafford , and R. A. Yost . 2006 . Imaging of small molecules in tis-
sue sections with a new intermediate-pressure MALDI linear ion trap mass spectrometer. Int. J. Mass Spectrom. 260 : 166–176 .
21 . Rujoi , M. , R. Estrada , and M. C. Yappert . 2004 . In situ MALDI-TOF MS regional analysis of neutral phospholipids in lens tissue. Anal. Chem. 76 : 1657 – 1663 .
22 . Jackson , S. N. , H. Y. Wang , and A. S. Woods . 2005 . In situ struc-tural characterization of phosphatidylcholines in brain tissue using MALDI-MS/MS. J. Am. Soc. Mass Spectrom. 16 : 2052 – 2056 .
23 . Jackson , S. N. , H. Y. Wang , and A. S. Woods . 2005 . Direct profi l-ing of lipid distribution in brain tissue using MALDI-TOFMS. Anal. Chem. 77 : 4523 – 4527 .
24 . Puolitaival , S. M. , K. E. Burnum , D. S. Cornett , and R. M. Caprioli . 2008 . Solvent-free matrix dry-coating for MALDI imaging of phos-pholipids. J. Am. Soc. Mass Spectrom. 19 : 882 – 886 .
25 . Shimma , S. , Y. Sugiura , T. Hayasaka , Y. Hoshikawa , T. Noda , and M. Setou . 2007 . MALDI-based imaging mass spectrometry revealed abnormal distribution of phospholipids in colon cancer liver metas-tasis. J. Chromatogr. B Analyt. Technol. Biomed. Life Sci . 855: 98–103.
26 . Cornett , D. S. , S. L. Frappier , and R. M. Caprioli . 2008 . MALDI-FTICR imaging mass spectrometry of drugs and metabolites in tis-sue. Anal. Chem. 80 : 5648 – 5653 .
27 . Khatib-Shahidi , S. , M. Andersson , J. L. Herman , T. A. Gillespie , and R. M. Caprioli . 2006 . Direct molecular analysis of whole-body animal tissue sections by imaging MALDI mass spectrometry. Anal. Chem. 78 : 6448 – 6456 .
28 . Stoeckli , M. , D. Staab , and A. Schweitzer . 2006 . Compound and metabolite distribution measured by MALDI mass spectrometric imaging in whole-body tissue sections . Int. J. Mass Spectrom. 260 : 195–202.
29 . Colliver , T. L. , C. L. Brummel , M. L. Pacholski , F. D. Swanek , A. G. Ewing , and N. Winograd . 1997 . Atomic and molecular imaging at the single-cell level with TOF-SIMS. Anal. Chem. 69 : 2225 – 2231 .
30 . Ostrowski , S. G. , C. T. Van Bell , N. Winograd , and A. G. Ewing . 2004 . Mass spectrometric imaging of highly curved membranes during Tetrahymena mating. Science . 305 : 71 – 73 .
31 . Monroe , E. B. , J. C. Jurchen , J. Lee , S. S. Rubakhin , and J. V. Sweedler . 2005 . Vitamin E imaging and localization in the neu-ronal membrane. J. Am. Chem. Soc. 127 : 12152 – 12153 .
32 . Touboul , D. , A. Brunelle , F. Halgand , S. De La Porte , and O. Laprevote . 2005 . Lipid imaging by gold cluster time-of-fl ight sec-ondary ion mass spectrometry: application to Duchenne muscular dystrophy. J. Lipid Res. 46 : 1388 – 1395 .
33 . Ikegami , K. , R. L. Heier , M. Taruishi , H. Takagi , M. Mukai , S. Shimma , S. Taira , K. Hatanaka , N. Morone , I. Yao , et al . 2007 . Loss of alpha-tubulin polyglutamylation in ROSA22 mice is associated with abnormal targeting of KIF1A and modulated synaptic func-tion. Proc. Natl. Acad. Sci. USA . 104 : 3213 – 3218 .
34 . Sweedler , J. V. , L. Li , S. S. Rubakhin , V. Alexeeva , N. C. Dembrow , O. Dowling , J. Jing , K. R. Weiss , and F. S. Vilim . 2002 . Identifi cation and characterization of the feeding circuit-activating peptides, a novel neuropeptide family of aplysia. J. Neurosci. 22 : 7797 – 7808 .
35 . Hosokawa , N. , Y. Sugiura , and M. Setou . 2008 . Spectrum normal-ization method using an external standard in mass spectrometric imaging. J. Mass Spectrom. Soc. Jpn. 56 : 77–81 .
36 . Yanagisawa , K. , Y. Shyr , B. J. Xu , P. P. Massion , P. H. Larsen , B. C. White , J. R. Roberts , M. Edgerton , A. Gonzalez , S. Nadaf , et al . 2003 . Proteomic patterns of tumour subsets in non-small-cell lung cancer. Lancet . 362 : 433 – 439 .
37 . Yao , I. , Y. Sugiura , M. Matsumoto , and M. Setou . 2008 . In situ proteomics with imaging mass spectrometry and principal compo-nent analyses in the Scrapper-knockout mouse brain. Proteomics . 8: 3692 – 3701 .
38 . Altelaar , A. F. , S. L. Luxembourg , L. A. McDonnell , S. R. Piersma , and R. M. Heeren . 2007 . Imaging mass spectrometry at cellular length scales. Nat. Protoc . 2 : 1185 – 1196 .
39 . Umemura , A. , H. Mabe , H. Nagai , and F. Sugino . 1992 . Action of phospholipases A2 and C on free fatty acid release during complete ischemia in rat neocortex. Effect of phospholipase C inhibitor and N-methyl-D-aspartate antagonist. J. Neurosurg. 76 : 648 – 651 .
40 . Rehncrona , S. , E. Westerberg , B. Akesson , and B. K. Siesjo . 1982 . Brain cortical fatty acids and phospholipids during and following complete and severe incomplete ischemia. J. Neurochem. 38 : 84 – 93 .
41 . Sugiura , Y. , S. Shimma , and M. Setou . 2006 . Thin sectioning im-proves the peak intensity and signal-to-noise ratio in direct tissue mass spectrometry. J. Mass Spectrom. Soc. Jpn. 54 : 45–48 .
42 . Schwartz , S. A. , M. L. Reyzer , and R. M. Caprioli . 2003 . Direct tis-sue analysis using matrix-assisted laser desorption/ionization mass
by guest, on Septem
ber 23, 2018w
ww
.jlr.orgD
ownloaded from
0.DC1.html http://www.jlr.org/content/suppl/2009/05/18/M900047-JLR20Supplemental Material can be found at:

1788 Journal of Lipid Research Volume 50, 2009
spectrometry: practical aspects of sample preparation. J. Mass Spectrom. 38 : 699 – 708 .
43 . Han , X. , and R. W. Gross . 2001 . Quantitative analysis and molecular species fi ngerprinting of triacylglyceride molecular species directly from lipid extracts of biological samples by electrospray ionization tandem mass spectrometry. Anal. Biochem. 295 : 88 – 100 .
44 . Hsu , F. F. , and J. Turk . 2001 . Structural determination of gly-cosphingolipids as lithiated adducts by electrospray ionization mass spectrometry using low-energy collisional-activated dissociation on a triple stage quadrupole instrument. J. Am. Soc. Mass Spectrom. 12 : 61 – 79 .
45 . Sugiura , Y. , S. Shimma , and M. Setou . 2006 . Two-step matrix ap-plication technique to improve ionization effi ciency for matrix-assisted laser desorption/ionization in imaging mass spectrometry. Anal. Chem. 78 : 8227 – 8235 .
46 . Mock , K. K. , C. W. Sutton , and J. S. Cottrell . 1992 . Sample immo-bilization protocols for matrix-assisted laser-desorption mass spec-trometry. Rapid Commun. Mass Spectrom. 6 : 233 – 238 .
47 . Taguchi , R. , T. Houjou , H. Nakanishi , T. Yamazaki , M. Ishida , M. Imagawa , and T. Shimizu . 2005 . Focused lipidomics by tandem mass spectrometry. J. Chromatogr. B Analyt. Technol. Biomed. Life Sci. 823 : 26 – 36 .
48 . Shimma , S. , Y. Sugiura , T. Hayasaka , N. Zaima , M. Matsumoto , and M. Setou . 2008 . Mass imaging and identifi cation of biomolecules with MALDI-QIT-TOF-based system. Anal. Chem . 80: 878–885.
49 . Stubiger , G. , E. Pittenauer , and G. Allmaier . 2008 . MALDI seamless postsource decay fragment ion analysis of sodiated and lithiated phospholipids. Anal. Chem. 80 : 1664 – 1678 .
50 . Touboul , D. , H. Piednoel , V. Voisin , S. De La Porte , A. Brunelle , F. Halgand , and O. Laprevote . 2004 . Changes of phospholipid composition within the dystrophic muscle by matrix-assisted laser desorption/ionization mass spectrometry and mass spectrometry imaging. Eur. J. Mass Spectrom. (Chichester, Eng.) . 10 : 657 – 664 .
51 . Houjou , T. , K. Yamatani , M. Imagawa , T. Shimizu , and R. Taguchi . 2005 . A shotgun tandem mass spectrometric analysis of phospho-lipids with normal-phase and/or reverse-phase liquid chromatog-raphy/electrospray ionization mass spectrometry. Rapid Commun. Mass Spectrom. 19 : 654 – 666 .
52 . Sinclair , A. J. , and M. A. Crawford . 1972 . The accumulation of arachidonate and docosahexaenoate in the developing rat brain. J. Neurochem. 19 : 1753 – 1758 .
53 . Svennerholm , L. 1968 . Distribution and fatty acid composition of phosphoglycerides in normal human brain. J. Lipid Res. 9 : 570 – 579 .
54 . Svennerholm , L. , and M. T. Vanier . 1973 . The distribution of lipids in the human nervous system. 3. Fatty acid composition of phosphoglycerides of human foetal and infant brain. Brain Res. 50 : 341 – 351 .
55 . Martinez , M. , and I. Mougan . 1998 . Fatty acid composition of hu-man brain phospholipids during normal development. J. Neurochem. 71 : 2528 – 2533 .
56 . McCombie , G. , D. Staab , M. Stoeckli , and R. Knochenmuss . 2005 . Spatial and spectral correlations in MALDI mass spectrometry im-ages by clustering and multivariate analysis. Anal. Chem. 77 : 6118 – 6124 .
57 . Jones , J. J. , S. Borgmann , C. L. Wilkins , and R. M. O’Brien . 2006 . Characterizing the phospholipid profi les in mammalian tissues by MALDI FTMS. Anal. Chem. 78 : 3062 – 3071 .
58 . McLean , J. A. , W. B. Ridenour , and R. M. Caprioli . 2007 . Profi ling and imaging of tissues by imaging ion mobility-mass spectrometry. J. Mass Spectrom. 42 : 1099 – 1105 .
59 . Jackson , S. N. , M. Ugarov , T. Egan , J. D. Post , D. Langlais , J. Albert Schultz , and A. S. Woods . 2007 . MALDI-ion mobility-TOFMS imaging of lipids in rat brain tissue. J. Mass Spectrom. 42 : 1093 – 1098 .
60 . Hayasaka , T. , N. Goto-Inoue , Y. Sugiura , N. Zaima , H. Nakanishi , K. Ohishi , S. Nakanishi , T. Naito , R. Taguchi , and M. Setou . 2008 . Matrix-assisted laser desorption/ionization quadrupole ion trap time-of-fl ight (MALDI-QIT-TOF)-based imaging mass spectrom-etry reveals a layered distribution of phospholipid molecular species in the mouse retina. Rapid Commun. Mass Spectrom. 22 : 3415 – 3426 .
61 . Pulfer , M. , and R. C. Murphy . 2003 . Electrospray mass spectrom-etry of phospholipids. Mass Spectrom. Rev. 22 : 332 – 364 .
62 . Norris , J. L. , D. S. Cornett , J. A. Mobley , M. Andersson , E. H. Seeley , P. Chaurand , and R. M. Caprioli . 2007 . Processing MALDI mass spectra to improve mass spectral direct tissue analysis . Int. J. Mass Spectrom. 260 : 212 – 221 .
63 . Hitzemann , R. J. , and D. A. Johnson . 1983 . Developmental changes in synaptic membrane lipid composition and fl uidity. Neurochem. Res. 8 : 121 – 131 .
64 . Zerouga , M. , L. J. Jenski , and W. Stillwell . 1995 . Comparison of phosphatidylcholines containing one or two docosahexaenoic acyl chains on properties of phospholipid monolayers and bilayers. Biochim. Biophys. Acta . 1236 : 266 – 272 .
65 . Salem , N. , Jr ., B. Litman , H. Y. Kim , and K. Gawrisch . 2001 . Mechanisms of action of docosahexaenoic acid in the nervous sys-tem. Lipids . 36 : 945 – 959 .
66 . Kim , H. Y. 2007 . Novel metabolism of docosahexaenoic acid in neural cells. J. Biol. Chem. 282 : 18661 – 18665 .
67 . Stubbs , C. D. , and A. D. Smith . 1984 . The modifi cation of mam-malian membrane polyunsaturated fatty acid composition in rela-tion to membrane fl uidity and function. Biochim. Biophys. Acta . 779 : 89 – 137 .
68 . Surette , M. E. , and F. H. Chilton . 1998 . The distribution and me-tabolism of arachidonate-containing phospholipids in cellular nu-clei. Biochem. J. 330 : 915 – 921 .
69 . Hishikawa , D. , H. Shindou , S. Kobayashi , H. Nakanishi , R. Taguchi , and T. Shimizu . 2008 . Discovery of a lysophospholipid acyltrans-ferase family essential for membrane asymmetry and diversity. Proc. Natl. Acad. Sci. USA . 105 : 2830 – 2835 .
by guest, on Septem
ber 23, 2018w
ww
.jlr.orgD
ownloaded from
0.DC1.html http://www.jlr.org/content/suppl/2009/05/18/M900047-JLR20Supplemental Material can be found at: