visualization of concerto data dan gutu prof. andreas wagner workshop on data status and first...
TRANSCRIPT

Visualization of CONCERTO Data
Dan GutuProf. Andreas Wagner
Workshop on data status and first CONCERTO Premium resultsBrussels, October 23rd 2012
Karlsruhe Institute of Technology (KIT)
1

Software Components Overview
TMDConcerto Data
Semantic Layer
Concerto Knowledge Base
General facts & rules
Customized facts & rules
Data Monitor
Visualization
Reasoner
Interactive sandbox

Objectives of Visualization
Provide visual support for the decision making processes regarding energy efficiency measures
Realization through a user-friendly visualization approach of data and indicators related to Buildings and Energy Supply Units
3

Visualization Workflow Concept
4
Filtered by metadata
Filtered by map1
Select ion of buildings and ESUs
Suitable to sel. indicators
selected buildings and
ESUs
selected indicators
Results
CSV-Export
table / graphics
change selection
Filtered by occasion
2 Filtered by role
Filtered by topic
Selection of indicators
suitable to sel. objects

Selection of Objects by Map
5
• Selection of buildings and Energy Supply Units (ESUs) from CONCERTO cities by map
• Simultaneous pre-checking of calculability regarding selected indicators

Selection of Objects by Filtered List
6
• Selection of buildings and ESUs from lists
• Metadata-based filtering of listed buildings and ESUs
• Simultaneous pre-checking of calculability with respect to selected indicators

Selection of Indicators
7
• Selection of indicators for buildings and ESUs from lists
• Metadata-based filtering of listed indicators
• Simultaneous pre-checking of calculability with respect to selected buildings and ESUs

Filtering
8
• Metadata-based filtering of listed buildings, ESUs and indicators
• Aggregation of filters for buildings, ESUs and indicators

Building filtering criteria
9
• Building status– new – refurbished
• Building type – industrial – municipal – residential – tertiary
• Year of construction • Area • Features and measures
– Thermal bridges – Improvement of air tightness– Special building materials – Shading– Ventilation – …
• Technology used before and after refurbishment – Boiler– Condensing boiler– District heating/cooling network – Compression/absorption/adsorption pump– Solar thermal collectors – Solar air collectors – Night storage heater– Electric heating – Stove – Continuous flow water heater – Compression refrigerator machine – Conventional HVAC machine – Reversible heat pump – Absorption/adsorbtion pump – Micro CHP – Connection to electricity grid – …

ESU filtering criteria
10
• ESU type – Boiler – Solar-thermal – Heat pump – Micro CHP – Photovoltaic– Chiller– Biomass– Geothermal – Wind power– Hydro power– District heating – Thermal storage– Biogas – …
• ESU energy carrier – Light/heavy oil – Domestic gas – grid bound/from tank – Liquefied petroleum gas – Hard coal – Lignite – Wood chips – Pellets – Bio waste– Energy crops – Biogas – District heat/cold – Solar radiation – Ambient air– Geothermal heat – Wind energy – Potential energy – Electricity/’Green’ electricity – …

Indicator filtering criteria
11
• By target group – Building owner or
developer– Utiltiy or energy service– Authority and legislation – Grants, funding, insurance – Energy consultancy – Building services– Public
• By topic– Economic – Environmental – Economic-environmental – Indicators for grant
providers
• By occasion – New construction of building– Refurbishment of building – Sale or purchase of building – Implementation of large-scale
energy supply – Sale or purchase of land – Set-up of masterplan – Set-up of legislation – Design of information
campaign – Design of grant scheme – Set-up of municipal targets

Representation of results – buildings
12
demand = consu
mption
demand = consumption/2
demand = 2*consumption

Representation of results – buildings
13

Representation of results - ESUs
14
0 20 40 60 80 100 120 140 160 1800
2
4
6
8
10
12
14
16
18
20
AustriaLinear (Austria)Czech RepublicLinear (Czech Republic)FranceLinear (France)GermanyLinear (Germany)IrelandLinear (Ireland)SwedenLinear (Sweden)
Surface [m²]
CO2-emission reduction [t/a]
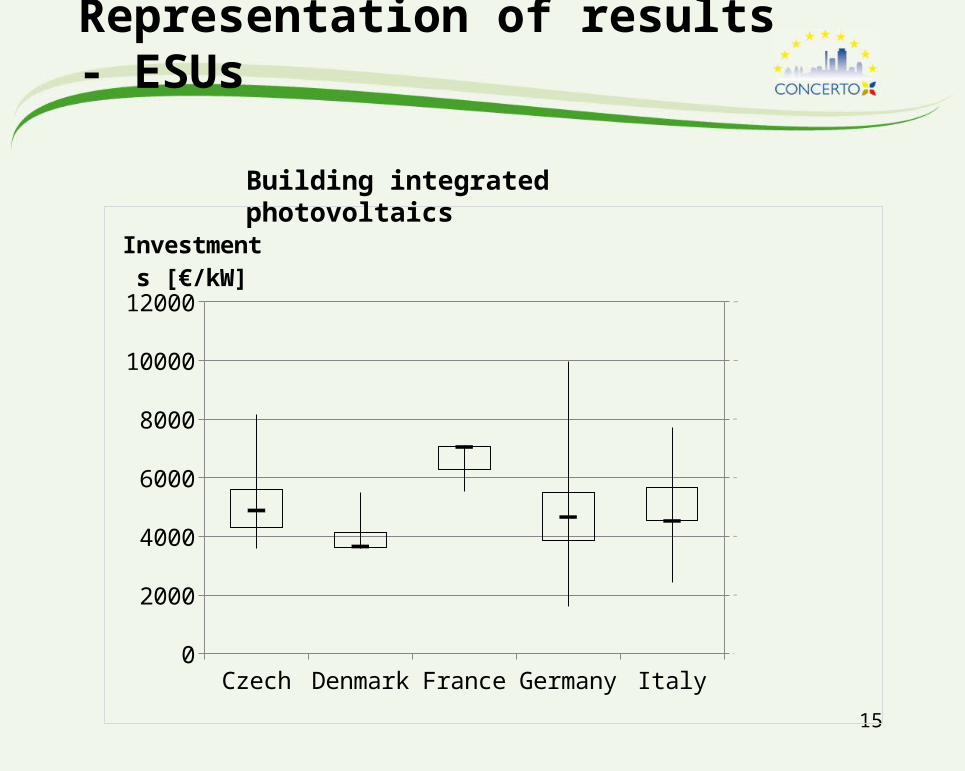
Representation of results - ESUs
15
Czech Denmark France Germany Italy0
2000
4000
6000
8000
10000
12000
0
2 0 0 0
4 0 0 0
6 0 0 0
8 0 0 0
1 0 0 0 0
1 2 0 0 0
Investments [€/kW]
Building integrated photovoltaics

Demonstration – Scenario
16