visualization and data mining daniel a. keim professor and head of data mining and information...
Post on 22-Dec-2015
216 views
TRANSCRIPT

Visualization and Data Mining
Daniel A. Keim
Professor and Head of Data Mining and Information Visualization
University of Constance
78457 Konstanz, Germany
May 2, 2005 2
Comments
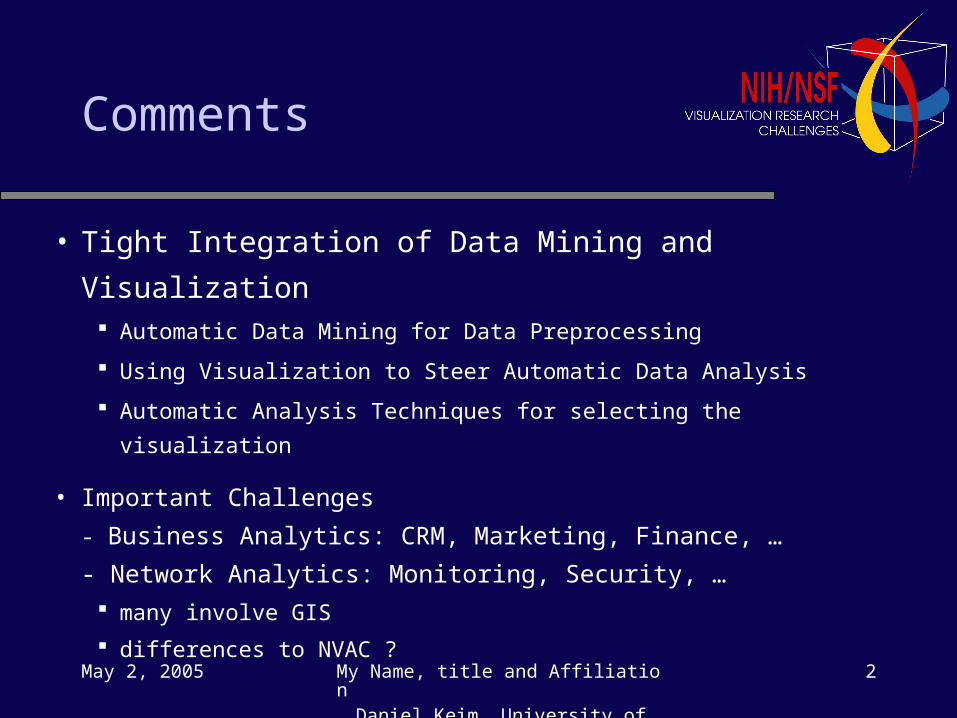
• Tight Integration of Data Mining and Visualization Automatic Data Mining for Data Preprocessing
Using Visualization to Steer Automatic Data Analysis
Automatic Analysis Techniques for selecting the visualization
• Important Challenges
- Business Analytics: CRM, Marketing, Finance, …
- Network Analytics: Monitoring, Security, … many involve GIS
differences to NVAC ?
My Name, title and AffiliationDaniel Keim, University of Constance
May 2, 2005 3
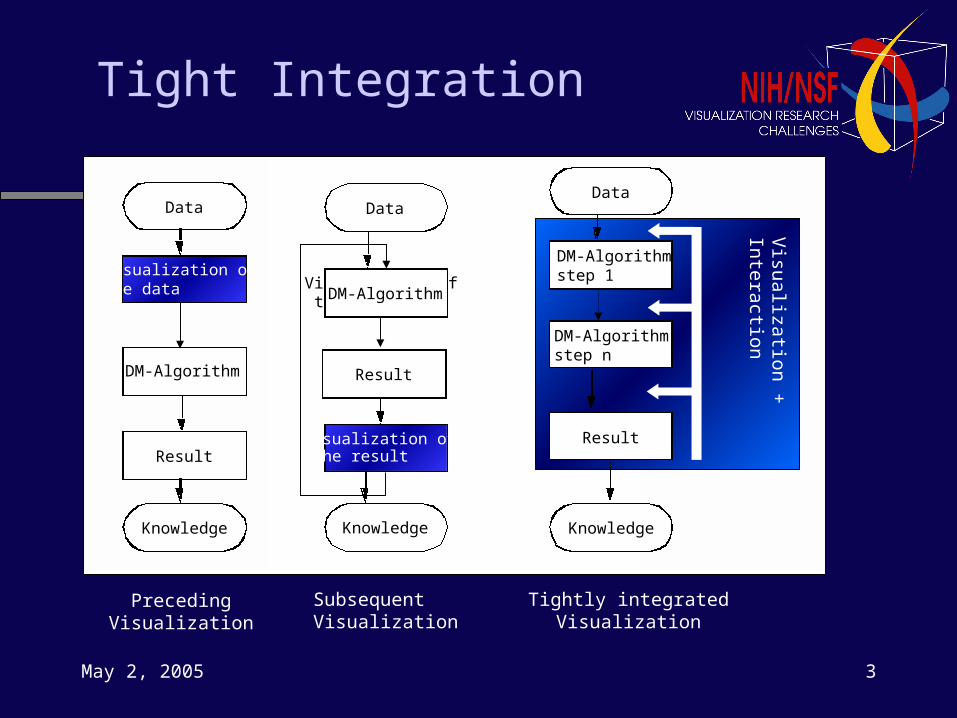
Tight Integration
Data
Knowledge
DM-Algorithm
Result
Visualization ofthe data
PrecedingVisualization
Visualization of the result
Data
DM-Algorithm
Knowledge
Visualization of the result
Result
SubsequentVisualization
Result
DM-Algorithmstep 1
Data
Knowledge
DM-Algorithmstep n
Visualization
+ Inte
raction
Tightly integratedVisualization

May 2, 2005 4
Tightly Integrated Visualization
Result
DM-Algorithmstep 1
Data
Knowledge
DM-Algorithmstep n
Visualization
+ Inte
raction
Visualization of algorithmic decisions
Data and patterns are better understood
User can make decisions based on perception
User can make decisions based on domain knowledge
Visualization of result enables user specified feedback for next algorithmic run
May 2, 2005 5
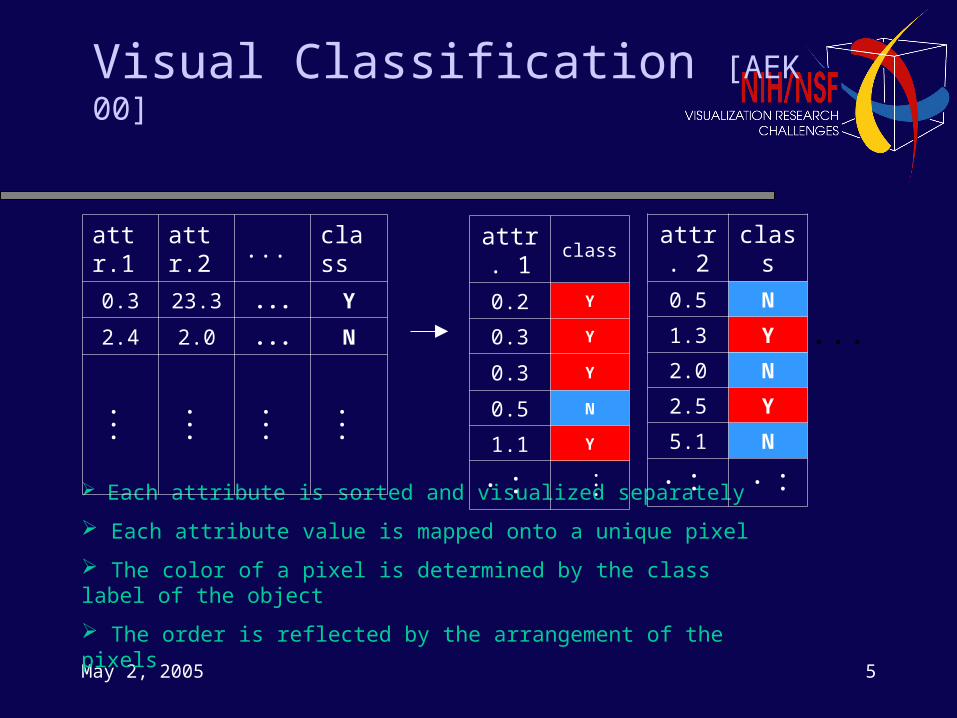
Visual Classification [AEK 00]
Each attribute is sorted and visualized separately
Each attribute value is mapped onto a unique pixel
The color of a pixel is determined by the class label of the object
The order is reflected by the arrangement of the pixels
...
attr. 1 class
0.2 Y
0.3 Y
0.3 Y
0.5 N
1.1 Y
... ...
attr. 2 class
0.5 N
1.3 Y
2.0 N
2.5 Y
5.1 N
... ...
attr.1 attr.2 ... class
0.3 23.3 ... Y
2.4 2.0 ... N
... ... ... ...

May 2, 2005 6
Visual Classification
age < 35
G PV
SalaryG
< 40 > 80[40,80]
A New Visualization of a Decision Tree
May 2, 2005 7
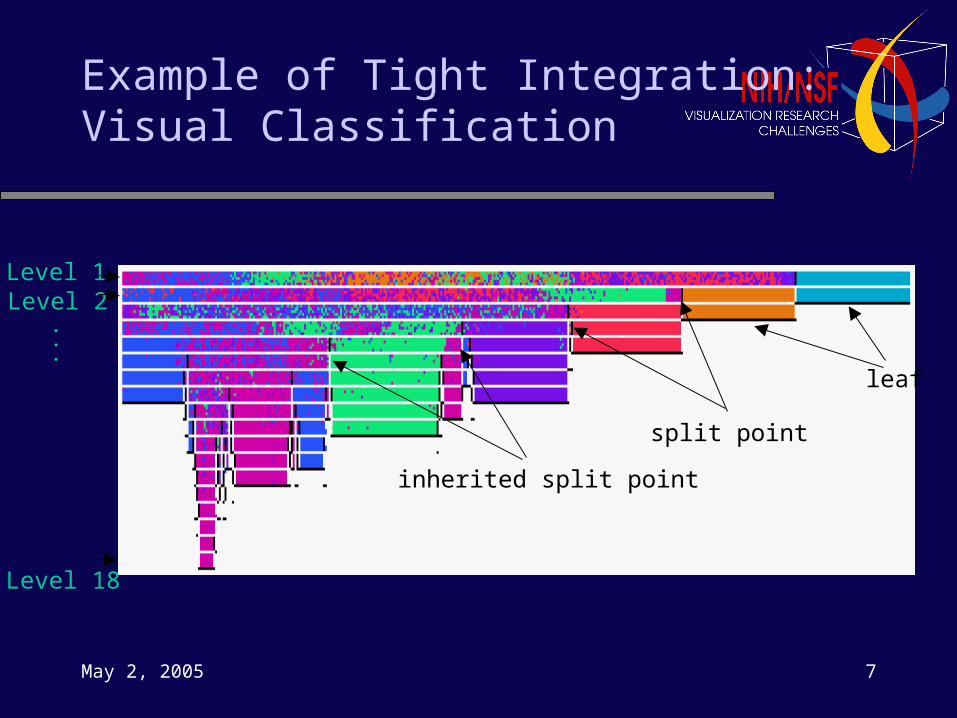
Example of Tight Integration:Visual Classification
Level 1Level 2
...
Level 18
leaf
split point
inherited split point
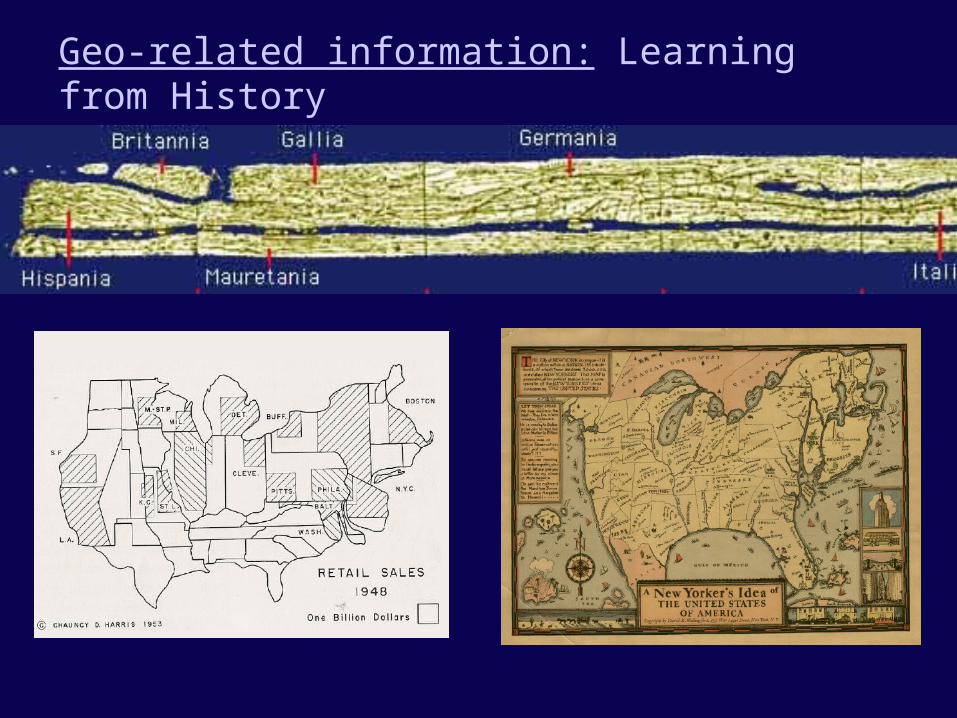
Geo-related information: Learning from History

May 2, 2005 9
Computer generated Cartograms
PresidentialElection 2000Results
Bush – Gore
May 2, 2005 10
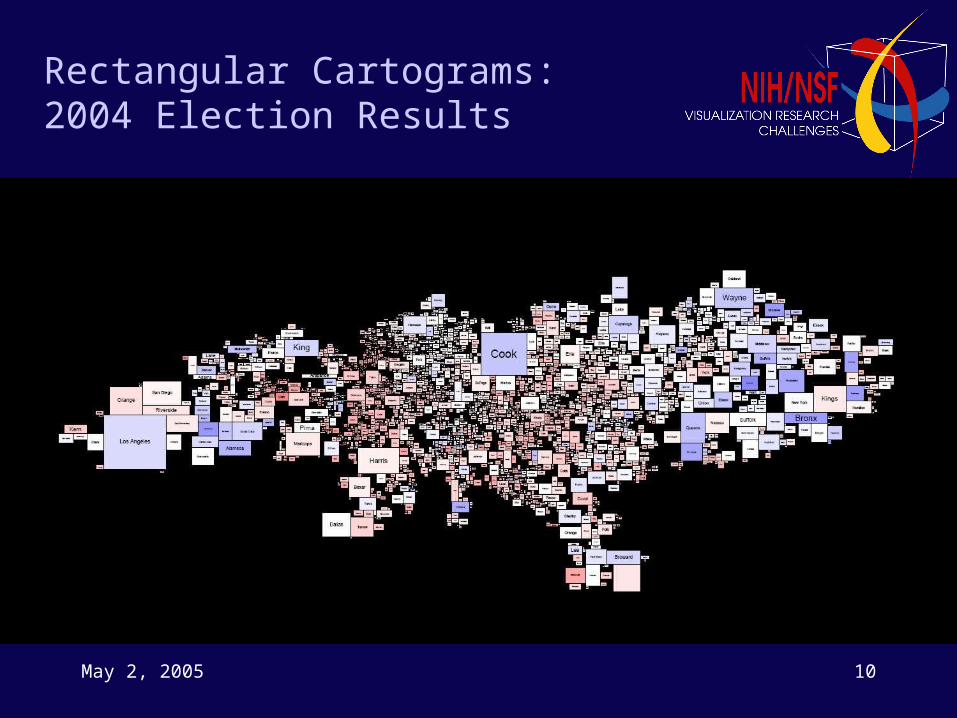
Rectangular Cartograms: 2004 Election Results